Experimental Assessment of a Centralised Controller for High-RES Active Distribution Networks

 , ,
, , 
Abstract
1. Introduction
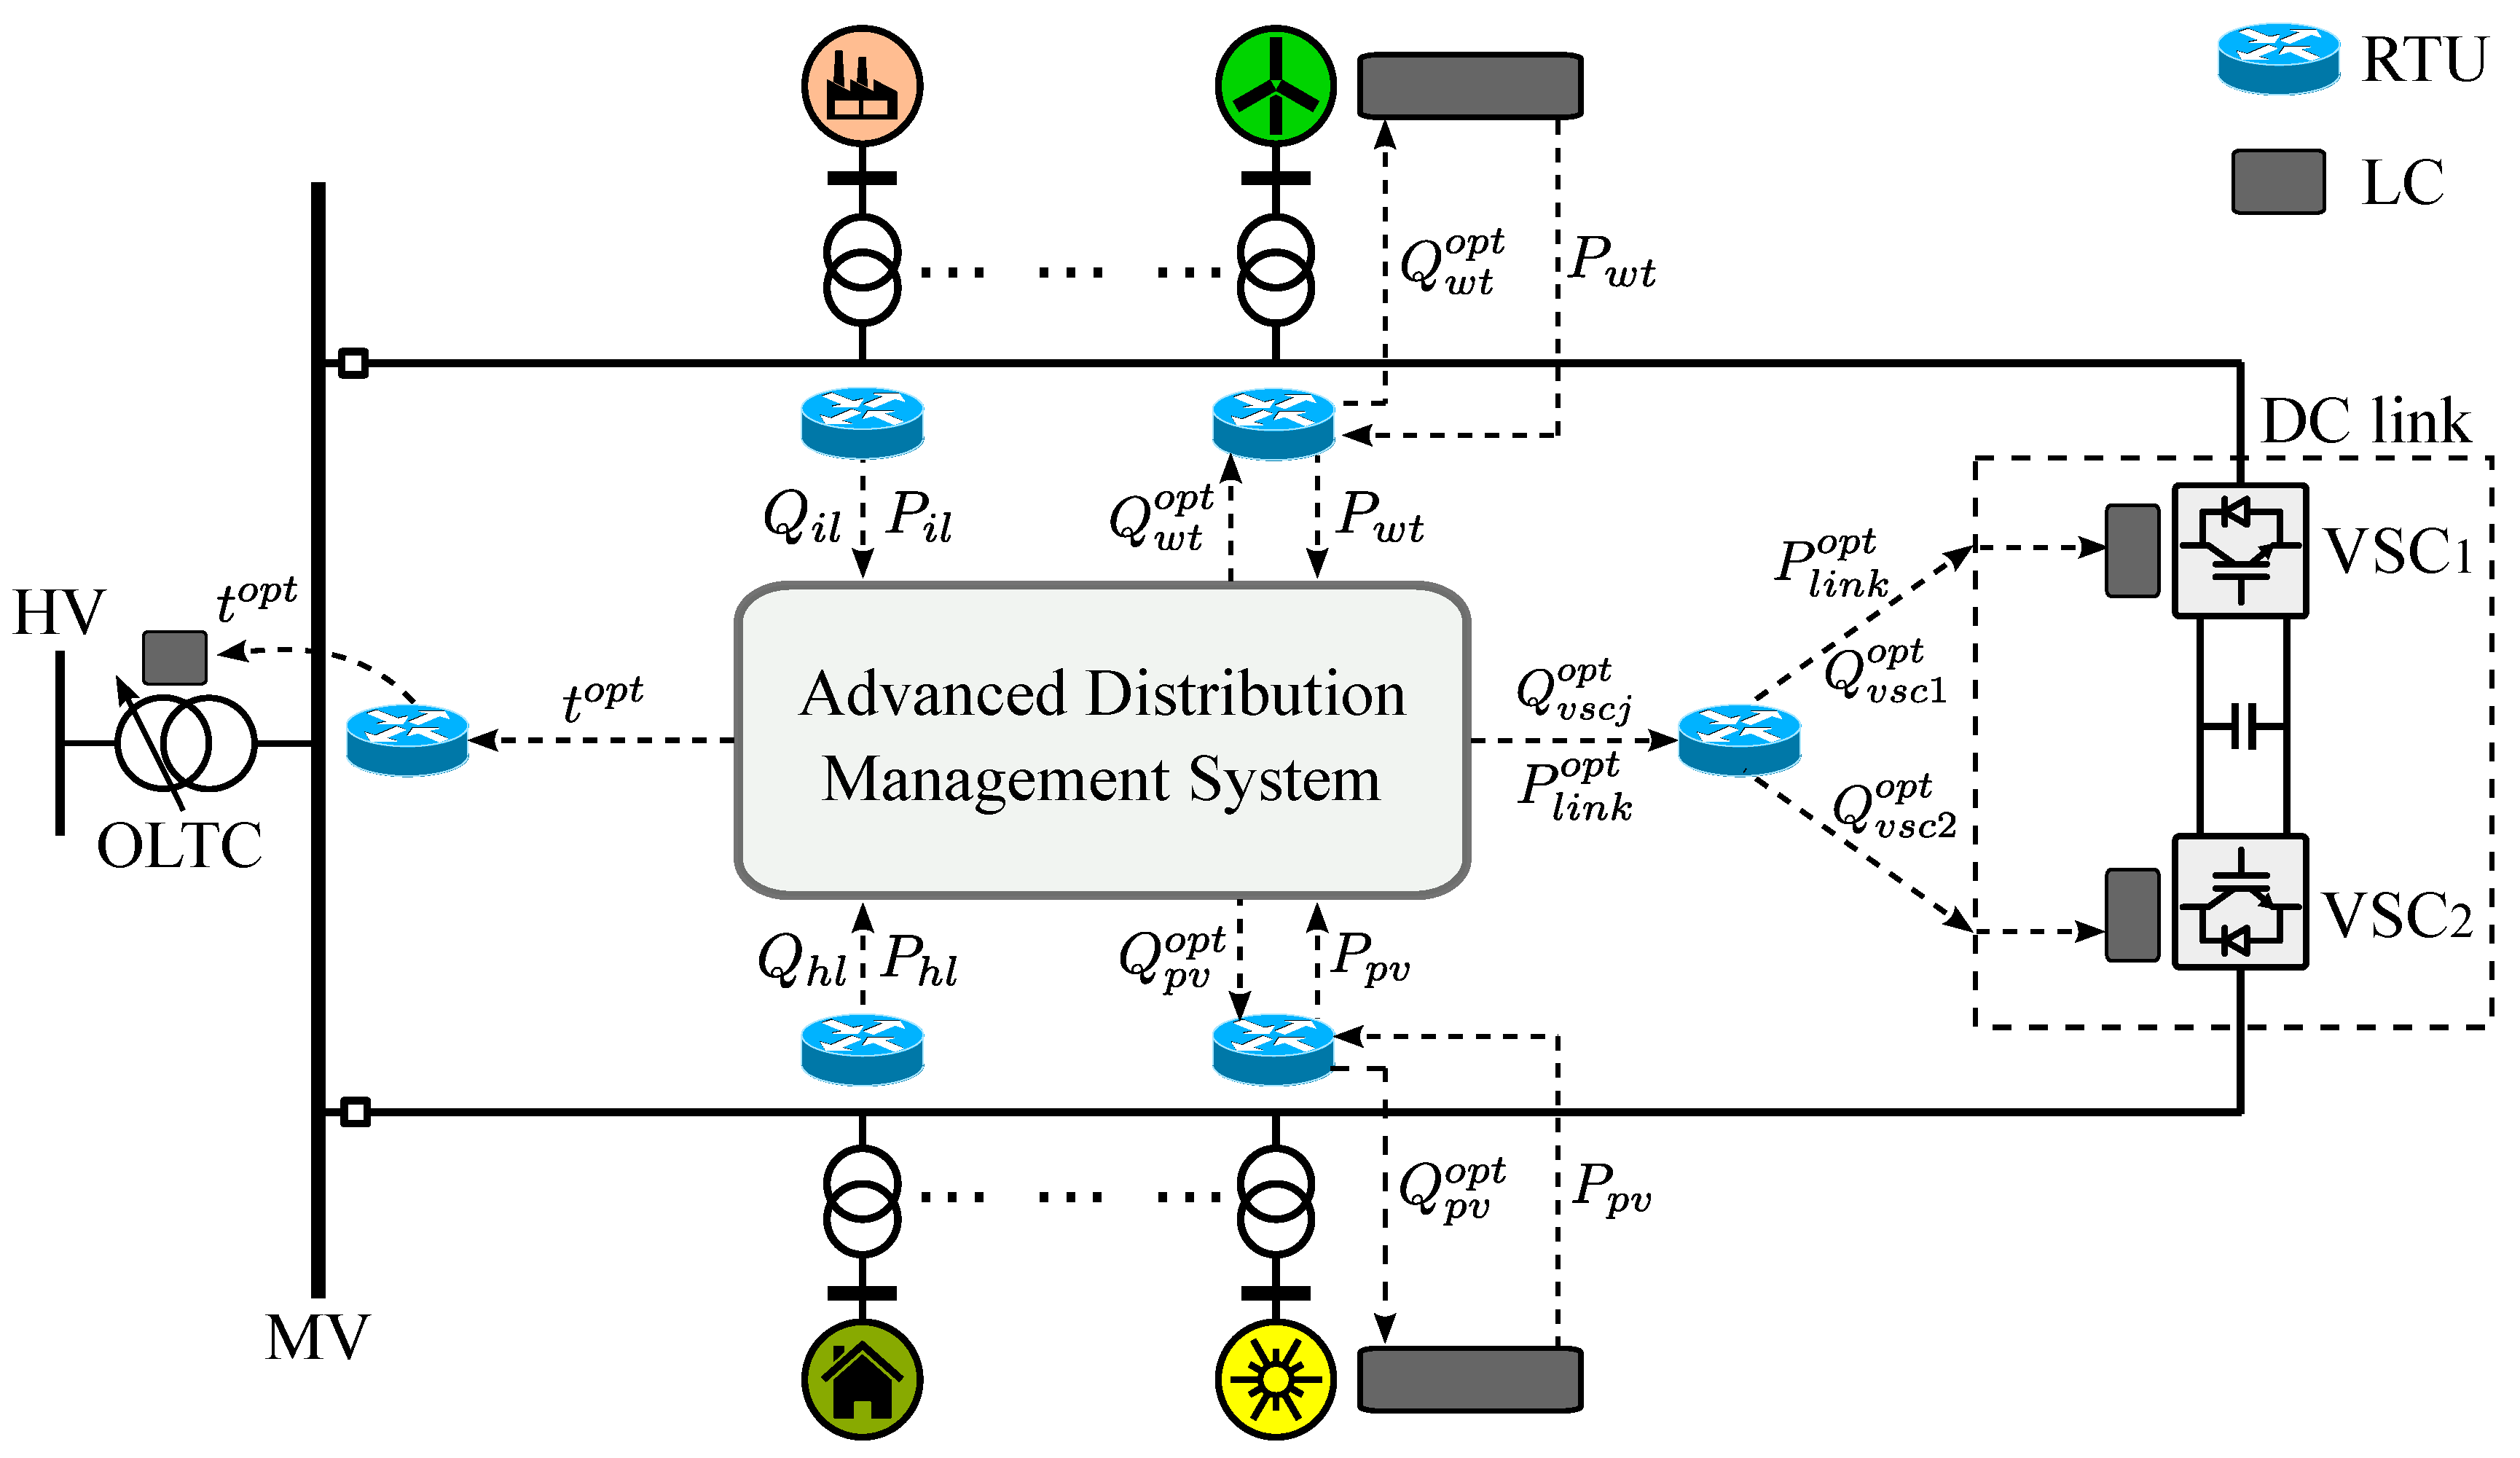
2. Proposed Centralised Control
- RES, which can regulate the reactive power injections and .
- Transformer OLTCs, which can adjust the tap position .
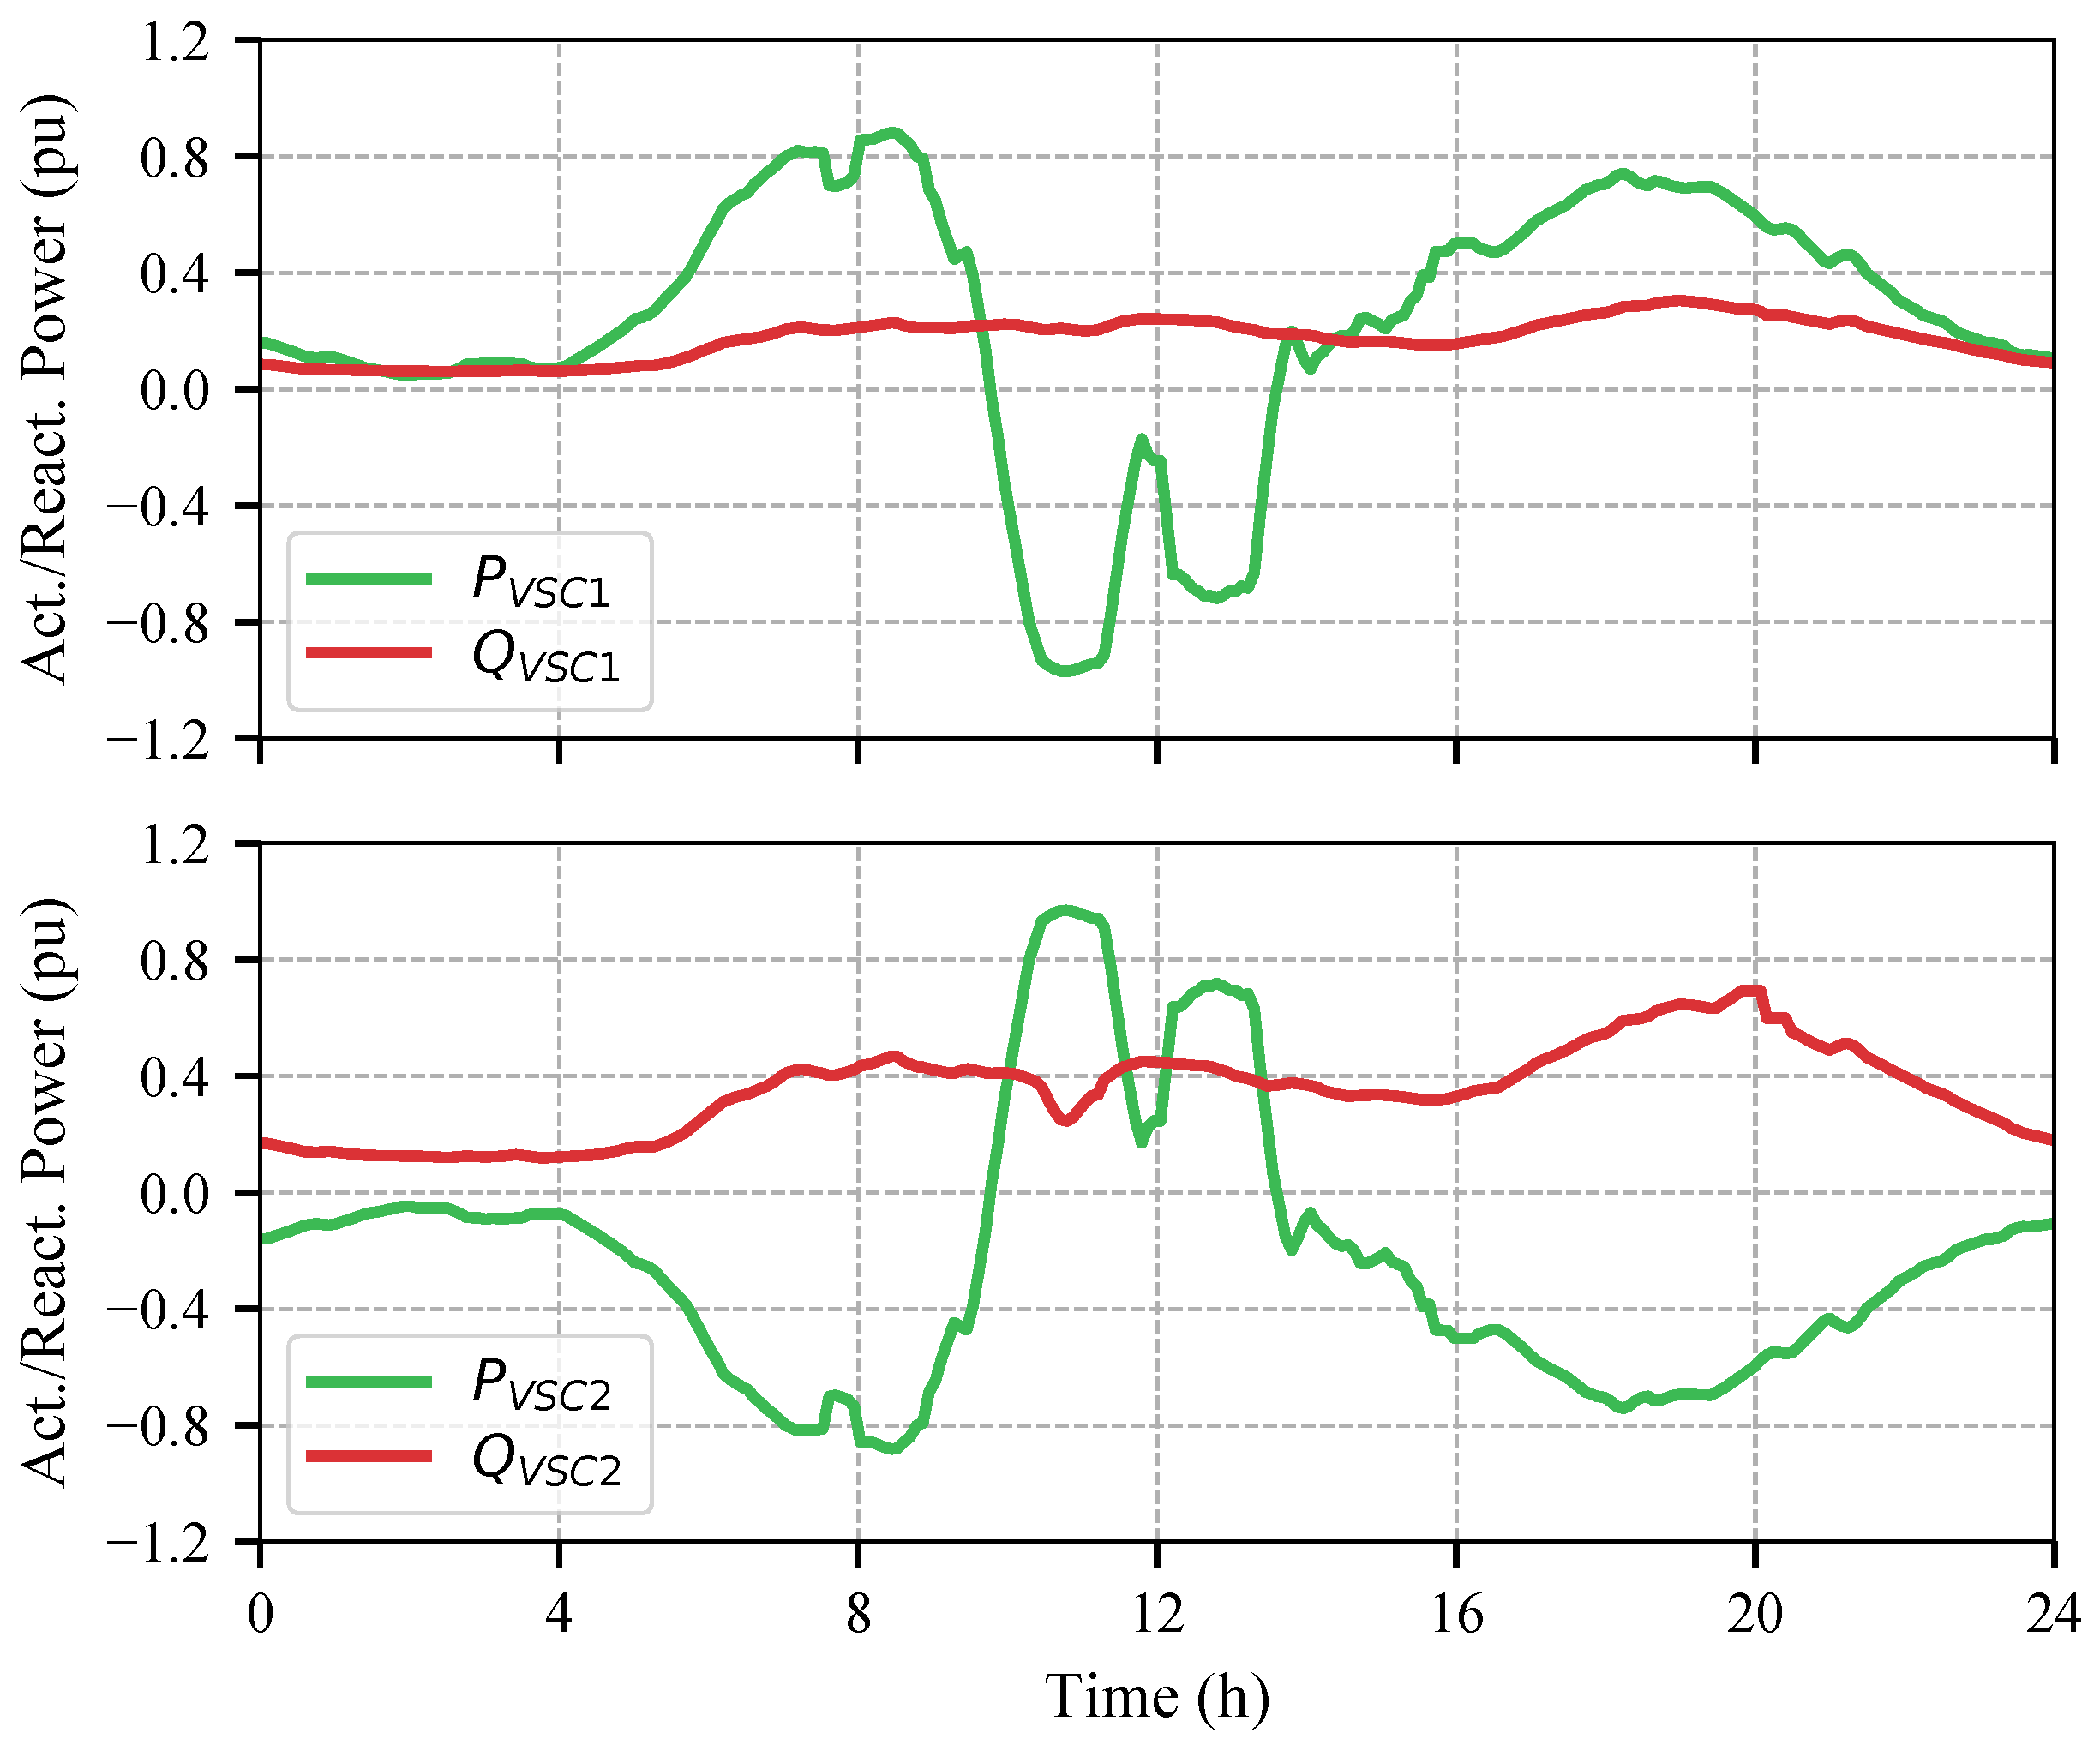
- A DC link, which is composed of two Voltage Source Converters (VSCs) in a back-to-back topology connecting two radial feeders. This device can regulate the active power flow between the feeders, , and two independent reactive power injections, . It is important to point out that the DC link is an interesting control asset with proven capability to reduce the network active power losses, maximize the penetration of RES, improve the network voltage profiles, and avoid branch saturations [20,26].
3. Laboratory Testing Platform
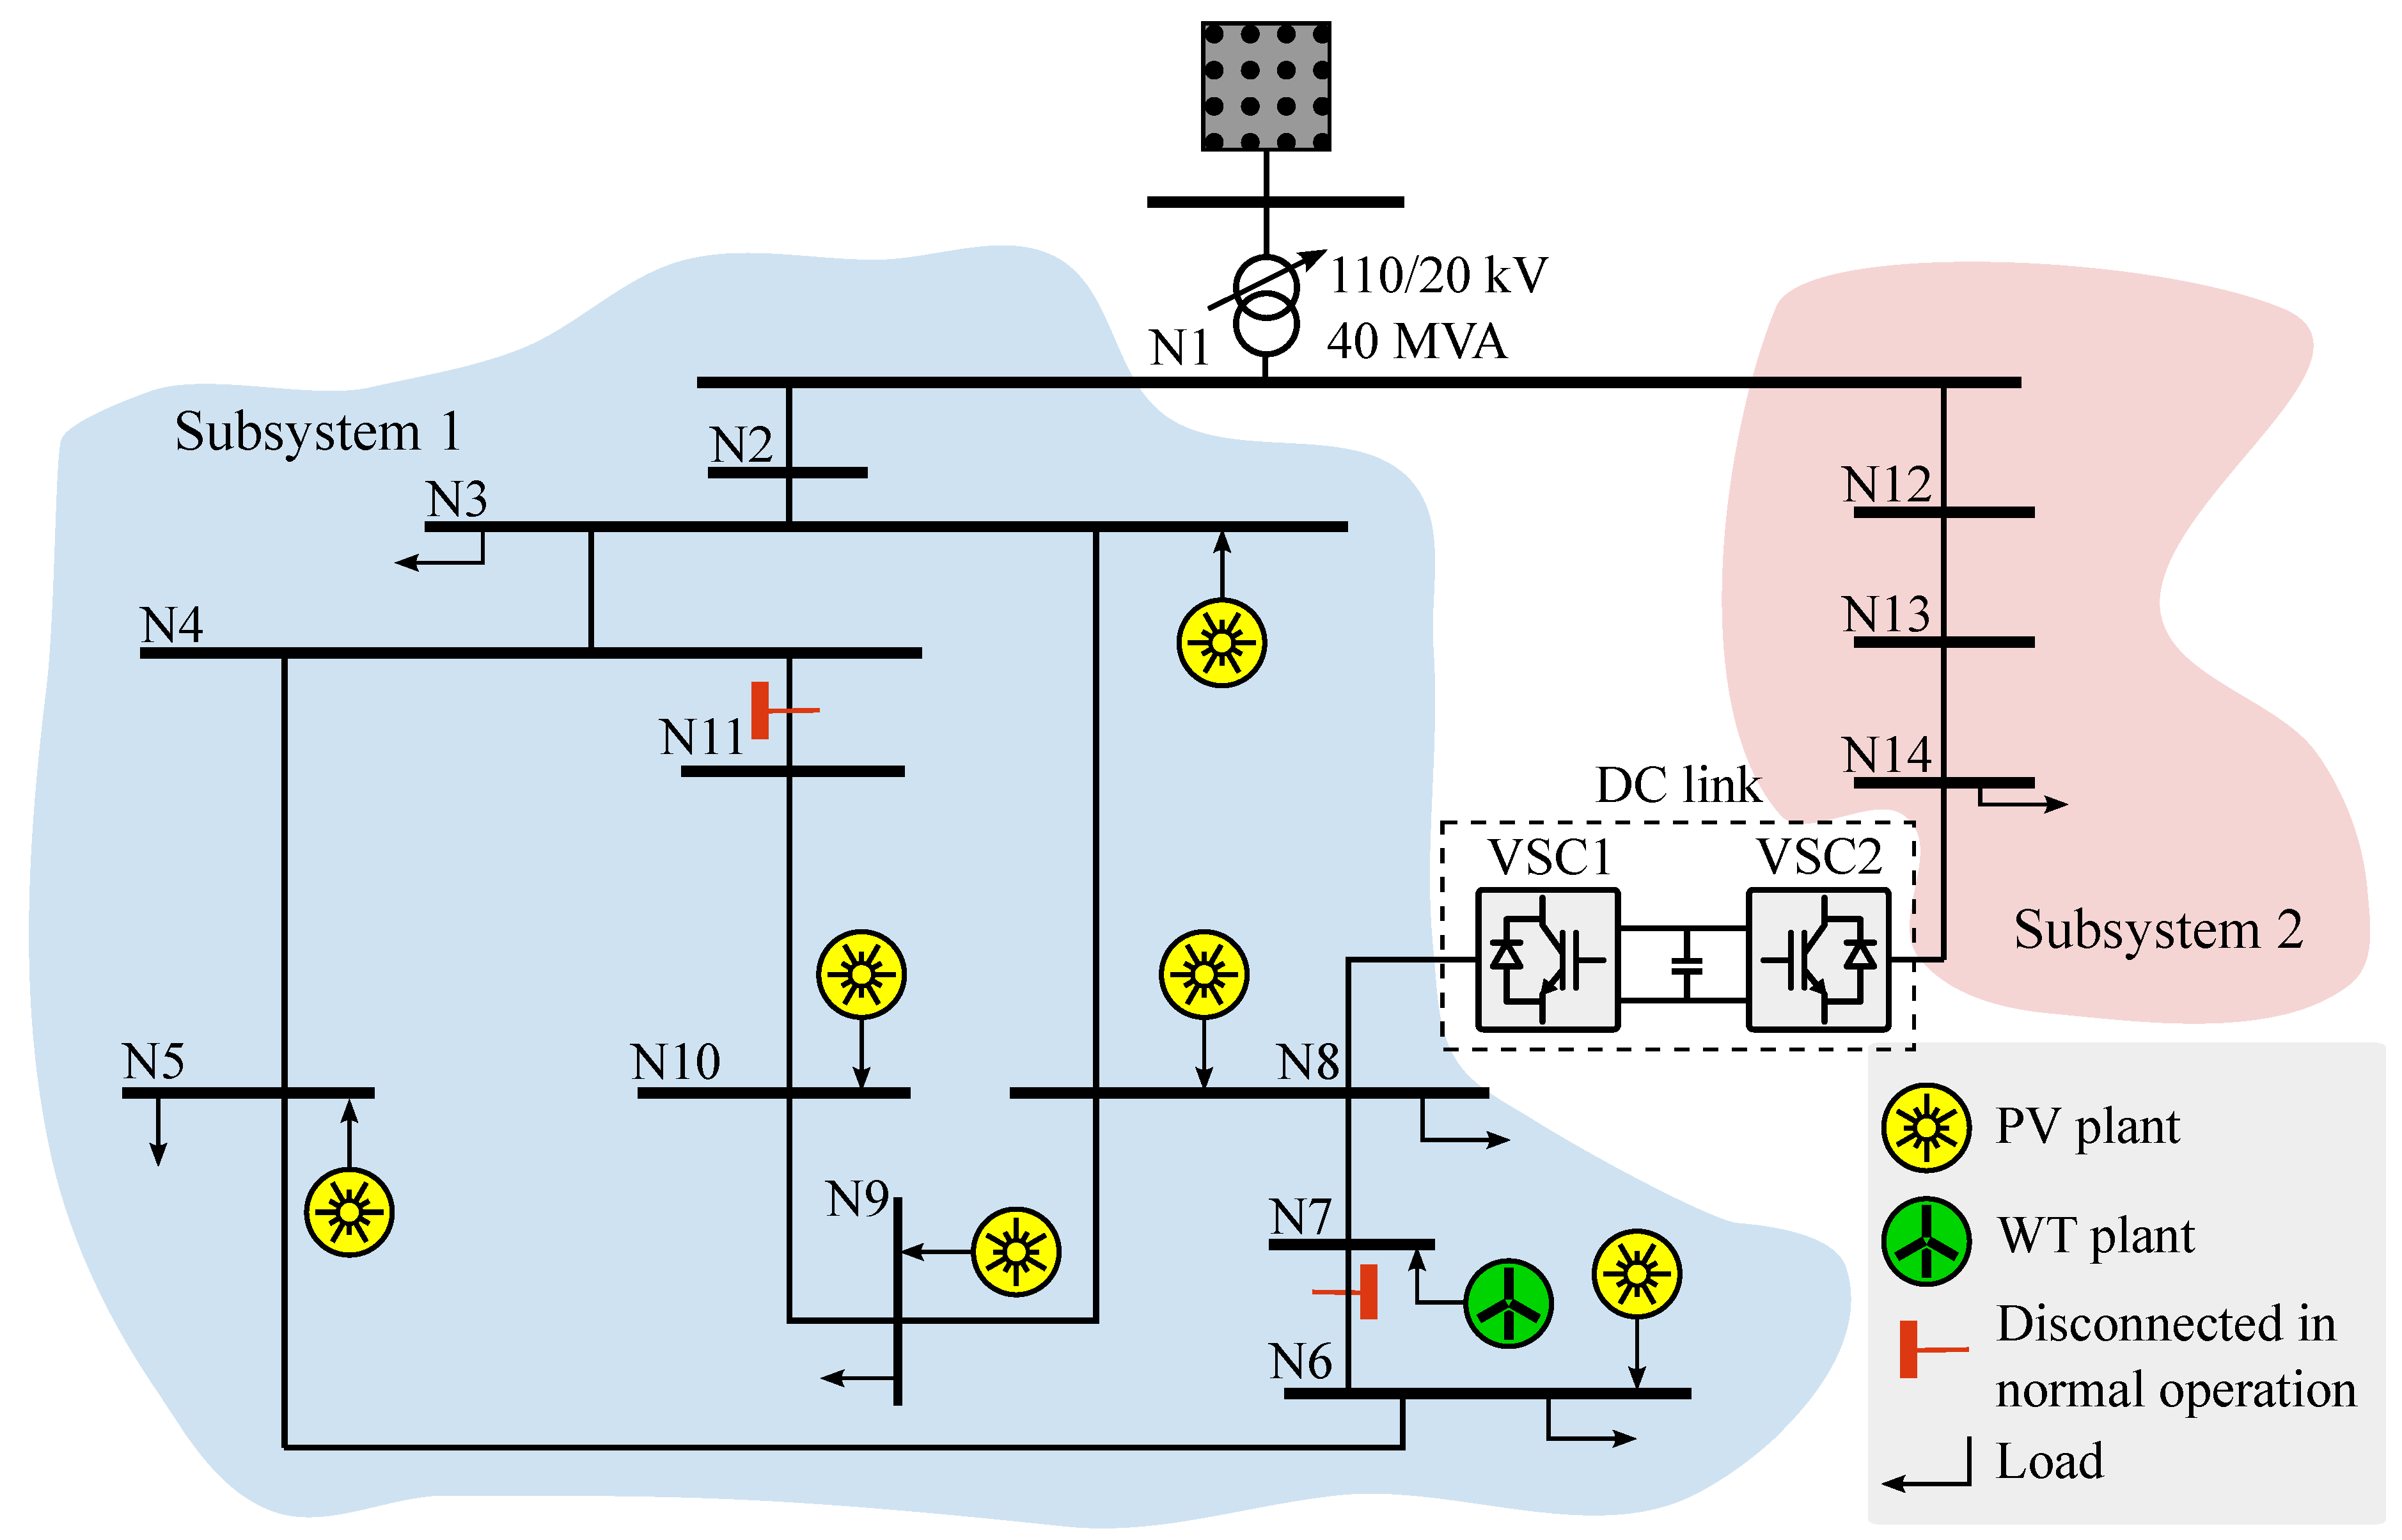
- First, this network is based on an actual MV German distribution system, fulfilling the proposed objective of the laboratory testing platform described above.
- Second, an important RES penetration is integrated into the network.
- Third, all the network data, including topology, parameters of lines and cables, loads, RES, and their corresponding daily load/generation curves are available and are well documented.
- Fourth, the benchmark network includes a DC link, a key component of the future active distribution system with high RES penetration.
3.1. MV Benchmark Distribution Network
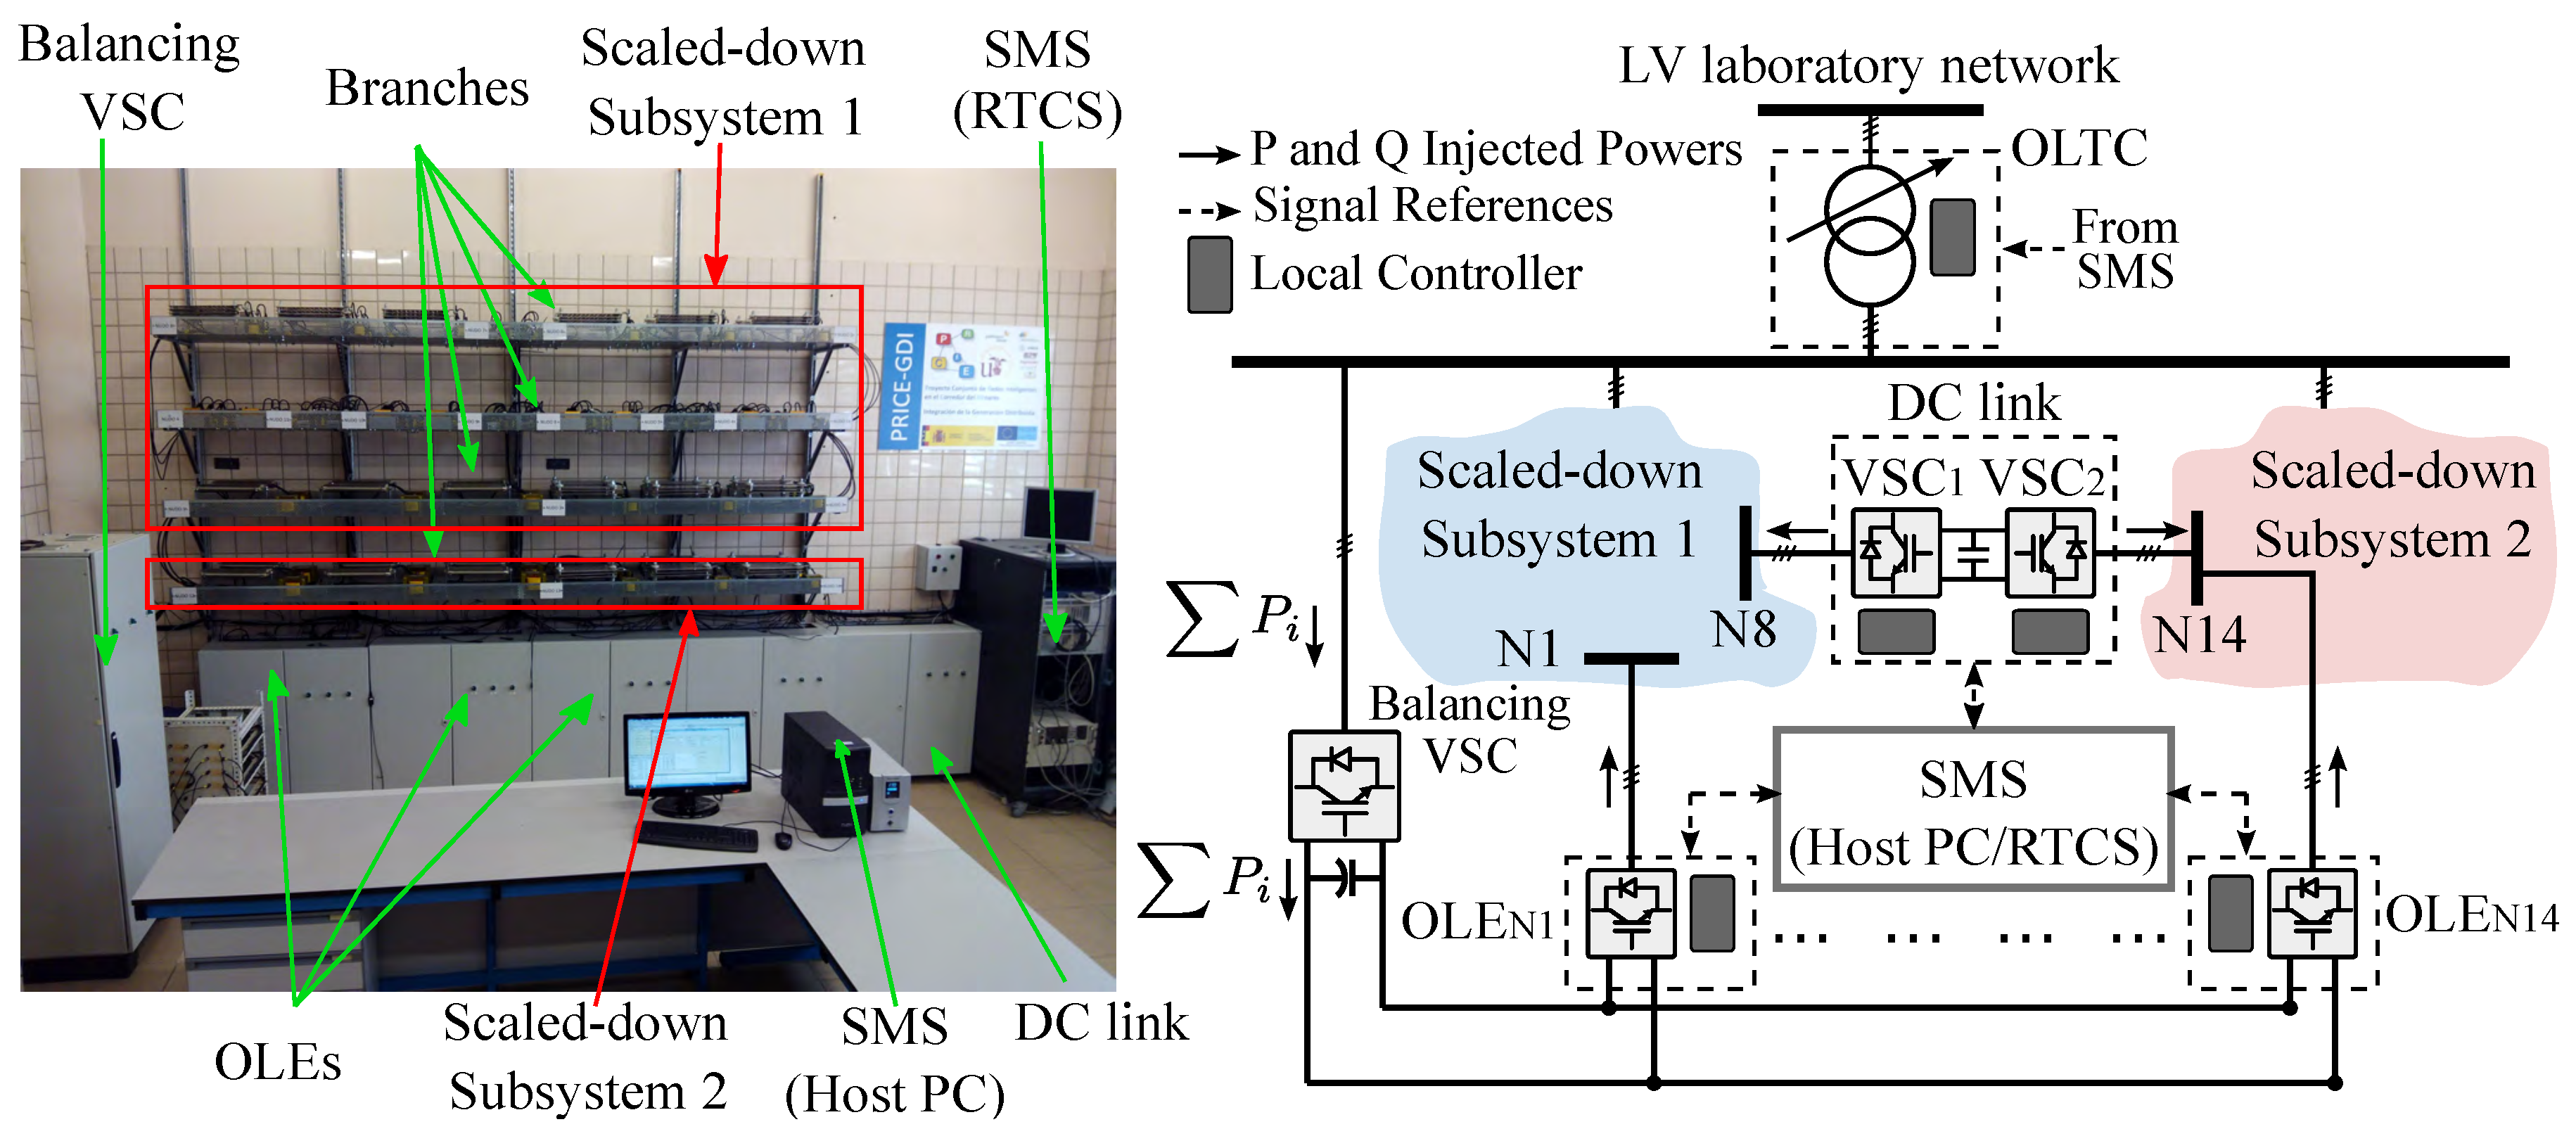
3.2. Laboratory Scaled-Down Distribution Network
- Distribution network branches: The electrical lines of both scaled-down subsystems are represented by a lumped parameter model comprising the series resistor and reactor. The per unit values of these impedances are identical to those of the actual MV system. Therefore, the original line R/X ratios and equivalent lengths are maintained, leading to similar per unit voltage drops and power losses. Table 1 collects the exact values of the resistors and reactors used in the scaled-down network.
- Omnimode Load Emulators (OLEs): These are the building blocks that are responsible for representing any load, generator, or a combination of the two connected to any network node. Basically, each OLE is a VSC with a local controller (LC) whose AC and DC sides are connected to a scaled-down network node and a common DC bus, respectively, as shown in Figure 4. The VSC is a three-phase, three-wire, two-level insulated gate bipolar transistor (IGBT) VSC, rated at 400 V, 20 kVA with a switching frequency of 10 kHz. LCL coupling filters are used to connect the AC-side of the VSC to the scaled-down network. The inductors and the capacitor have the following ratings: L1 = L2 = 2.5 mH and C = 1 F. Note that all of the OLEs share a common DC bus which is regulated by an extra balancing VSC rated to 100 kVA. This is directly connected to the LV laboratory network by its AC side, providing the net active power required by OLEs: . In this way, each OLE may absorb/inject (load/generator) any active power into the AC scaled-down distribution system within the technical constraints imposed by the VSCs. The OLEs are connected to the following nodes: N3, N5, N6, N7, N8, N9, and N10 (subsytem 1), and N14 (subsystem 2). The active and reactive power references to the OLEs are set by a Signal Management System (SMS) which is detailed in the next subsection.
- Transformer with OLTC: The underlying idea of this feature is to represent the HV/MV transformers within the primary substations which are equipped with OLTCs to regulate the MV voltage. The transformer used for this purpose is a 400 V ± 5%/400 V, 100 kVA equipped with a thyristor-based tap changer, as shown in Figure 4.
- DC link: This DC link, originally included in the benchmark distribution system [28], is incorporated between N8 and N14 as a suitable device to maximise the RES penetration, as stated previously. Although several topologies can be used to create a flexible loop between radially operated feeders [29], the DC link is based on conventional back-to-back VSCs rated at 400 V and 10 kVA. Note that the DC bus of the DC link is totally independent of the one shared by the OLEs and the balancing VSC.
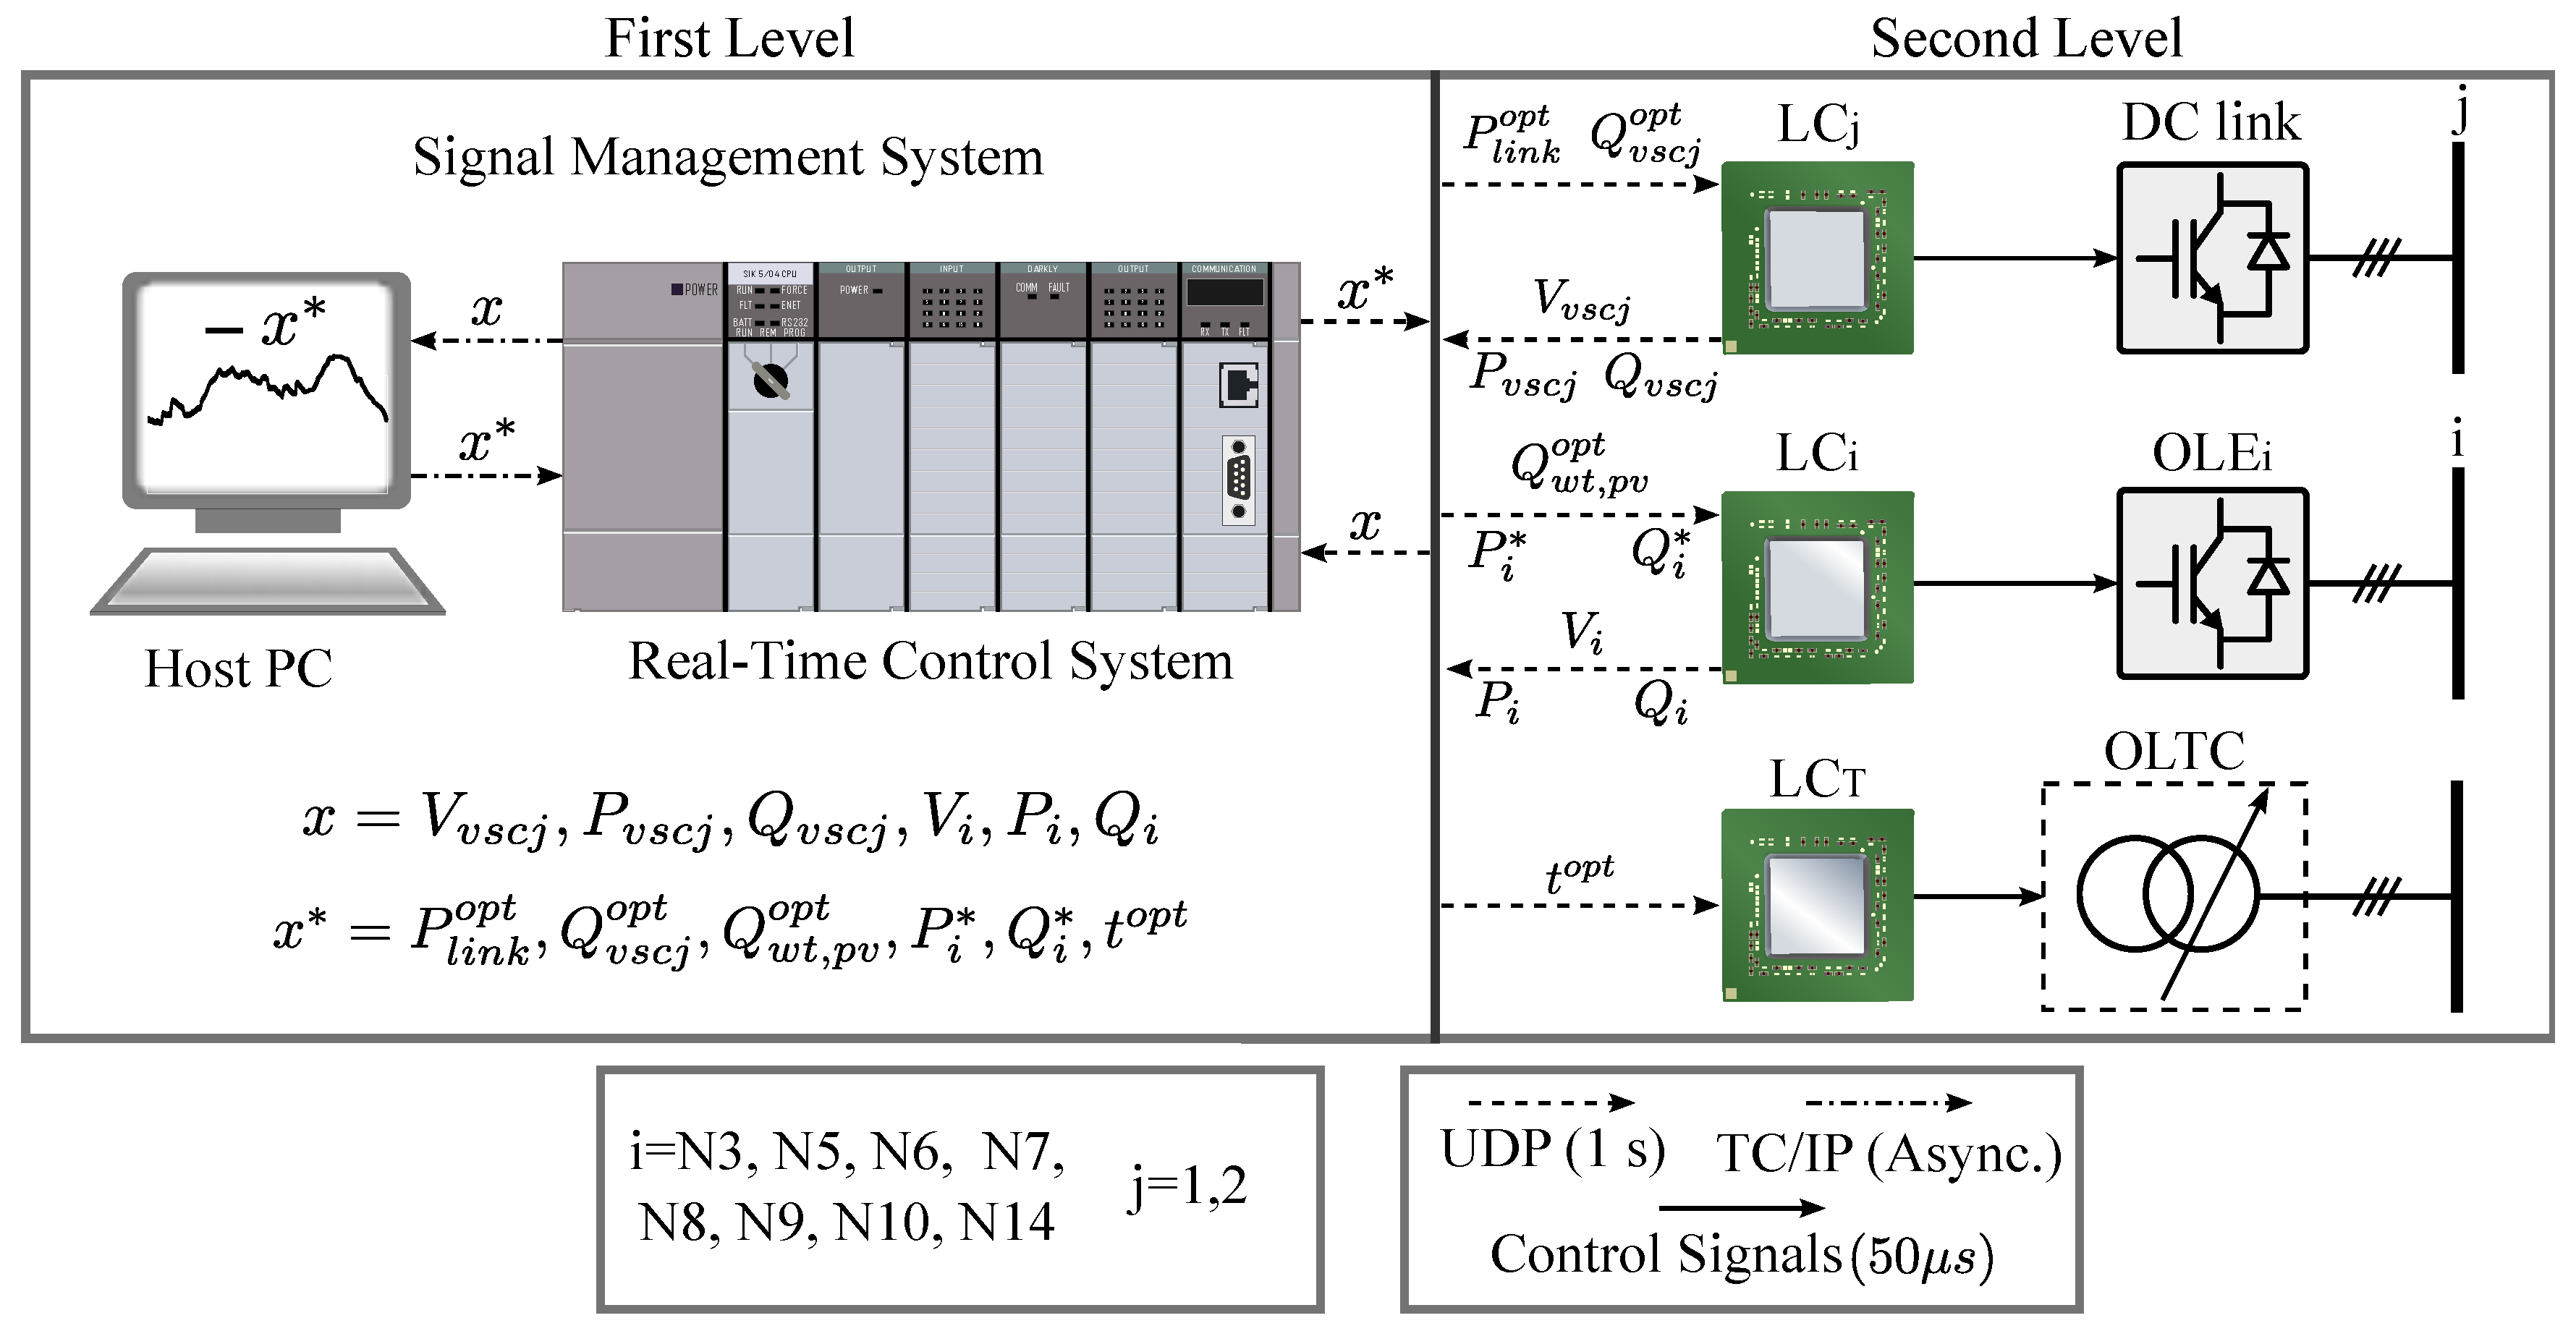
3.3. Control Scheme and Communication System
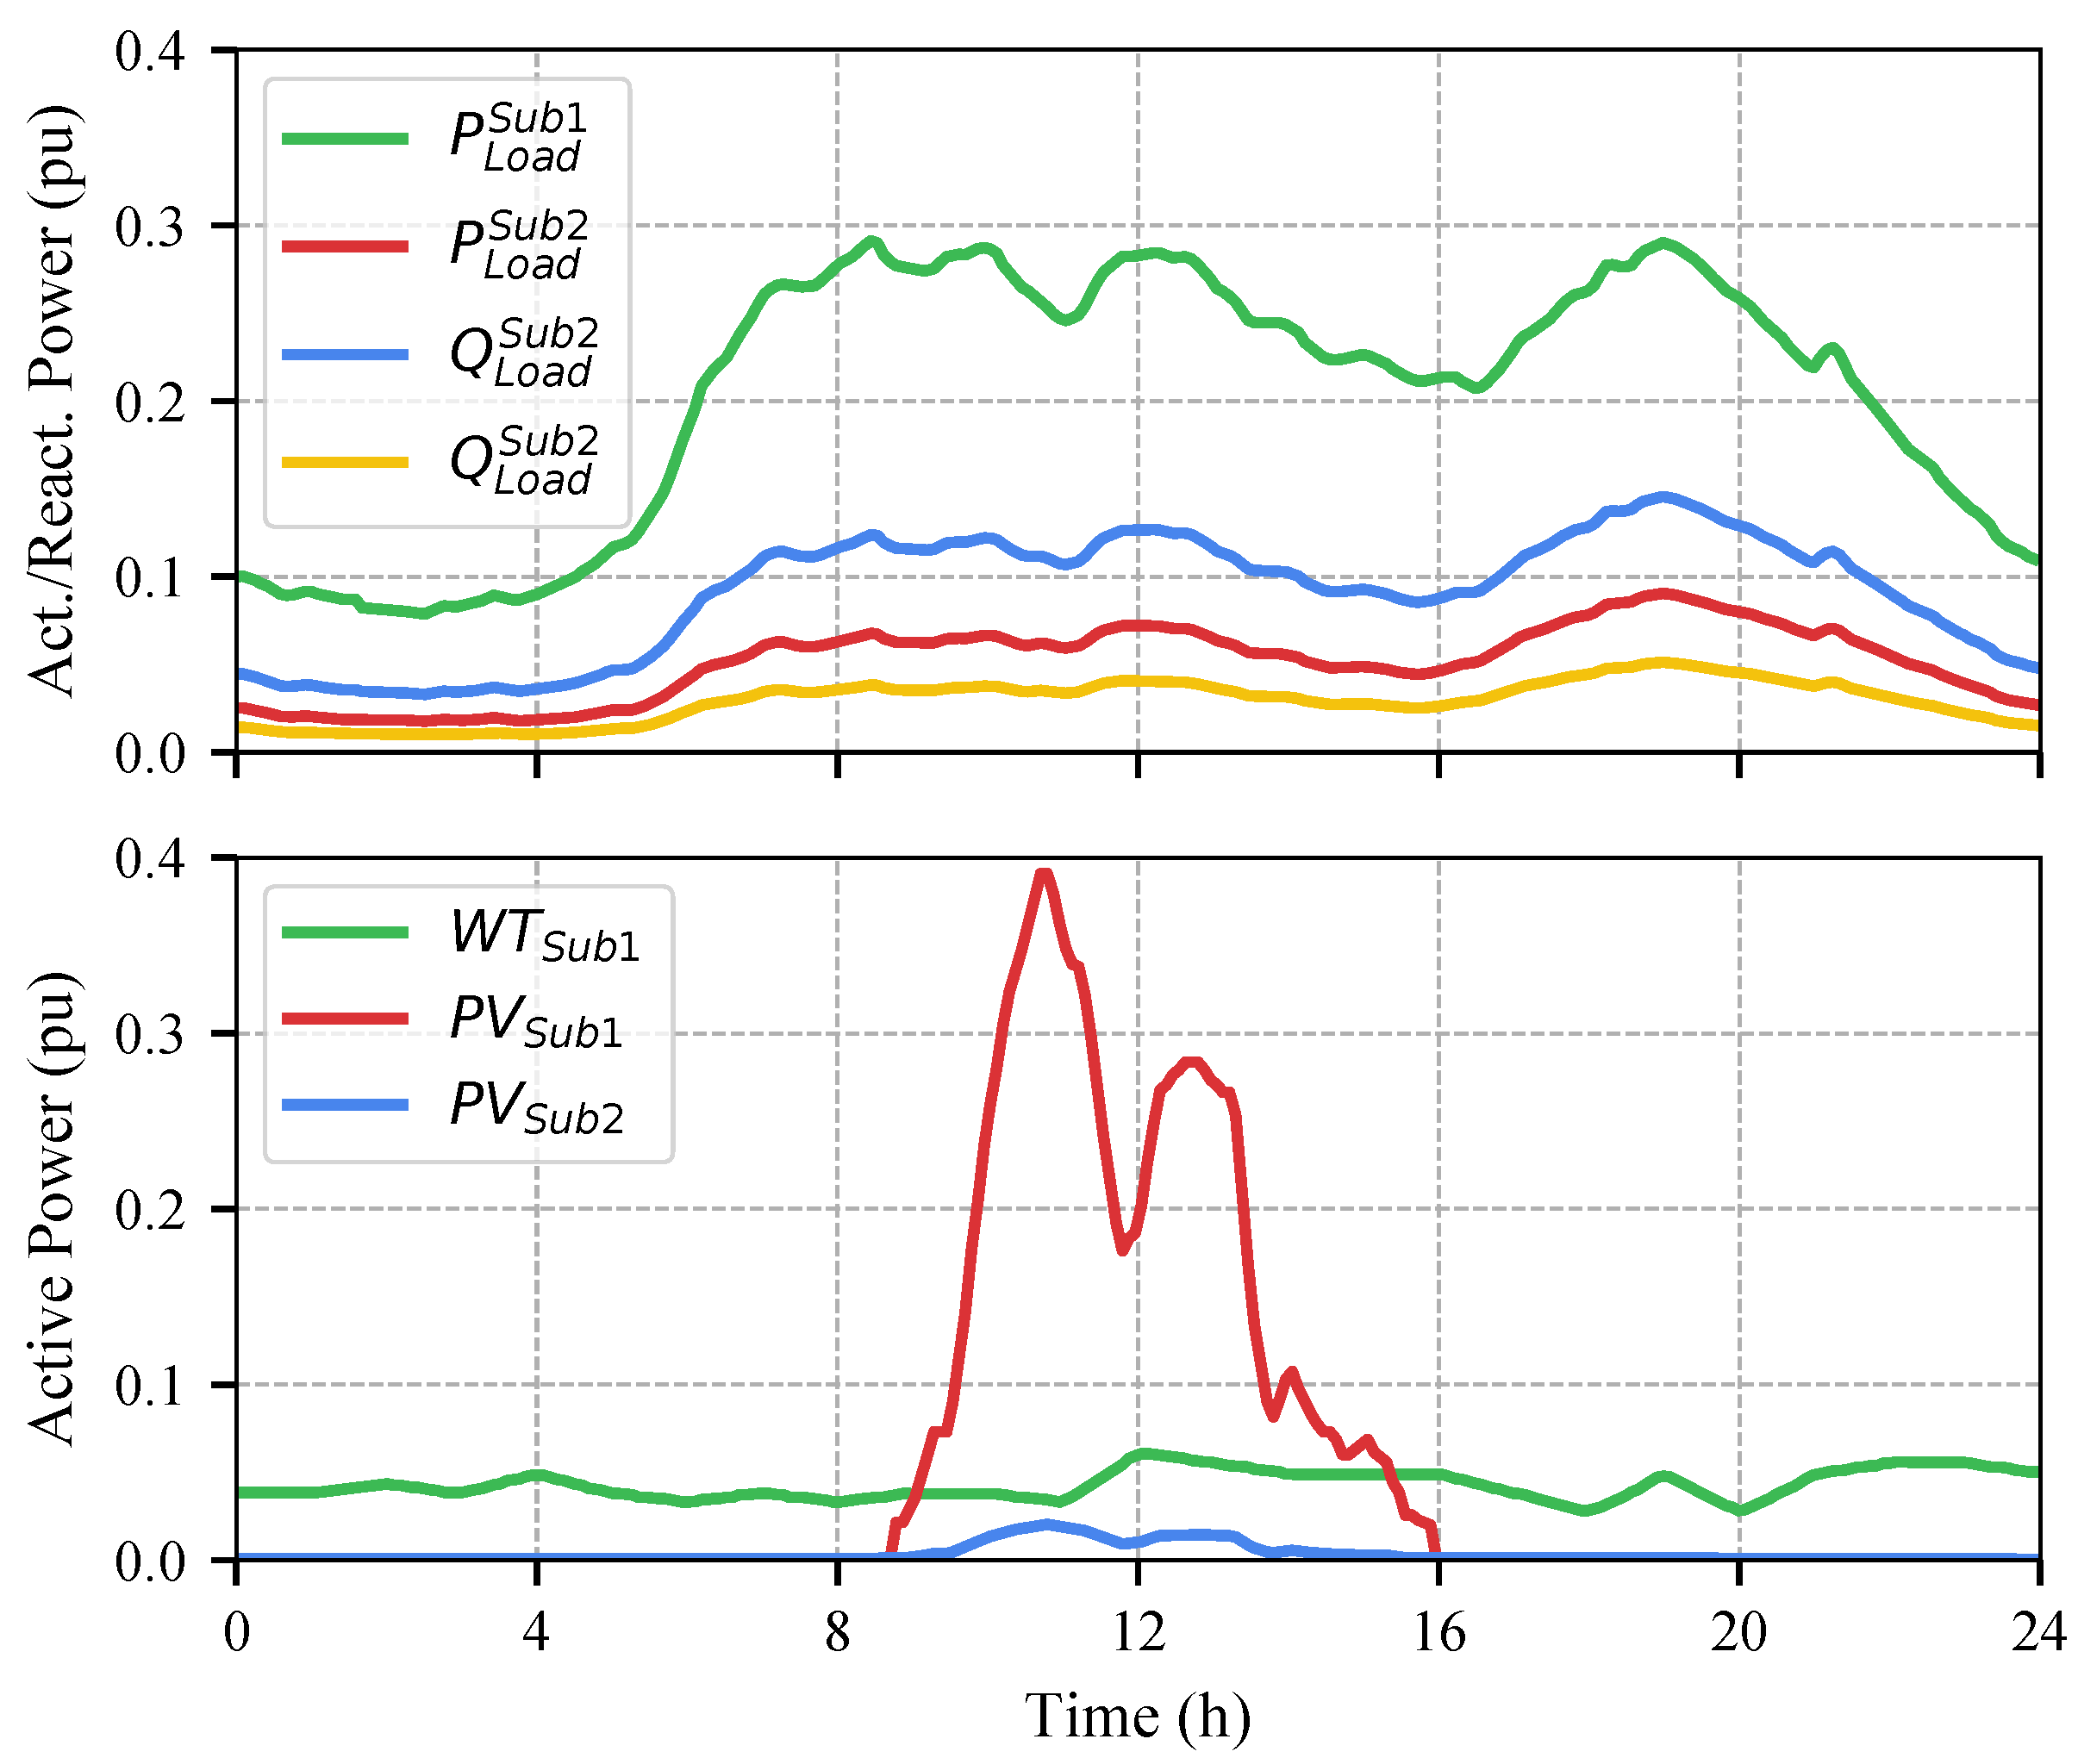
- Offline tasks: They are carried out by a host PC and mainly consist of the configuration of the setpoint profiles. The OLE active and reactive daily power curves () are defined through two tools developed in the host PC [25]. Once these profiles have been determined, the daily setpoints of the DC link, and , the reactive power injected by the RES, , and the optimal OLTC tap position, , are automatically computed by the OPF described in Section 2. These setpoints and their computations are new features that are incorporated into the host PC with respect to [25]. Finally, all these data are compiled and uploaded to the Real-Time Control System (RTCS) for real-time operation.
- Online tasks: These are executed by the RTCS which is responsible for two undertakings. On the one hand, the RTCS is in charge of sending the setpoints to the second control level composed of the LCs attached to each hardware controllable component during the online operation according to the profiles previously determined in the offline tasks. On the other hand, the RTCS receives measurements from each each LC attached to the OLEs (, and ), DC-link VSCs (, and ) and the tap position of the transformer OLTC (). After processing this information, it provides real-time monitoring of the system which is displayed in the host PC.
4. Experimental Assessment of the Proposed Centralised Control
4.1. Definitions of Test Cases
4.2. Definitions of KPIs
- Daily energy loss (/): This KPI measures the daily active energy loss in kWh/day, , and the percentage of loss reduction with respect to the base case, C1, .
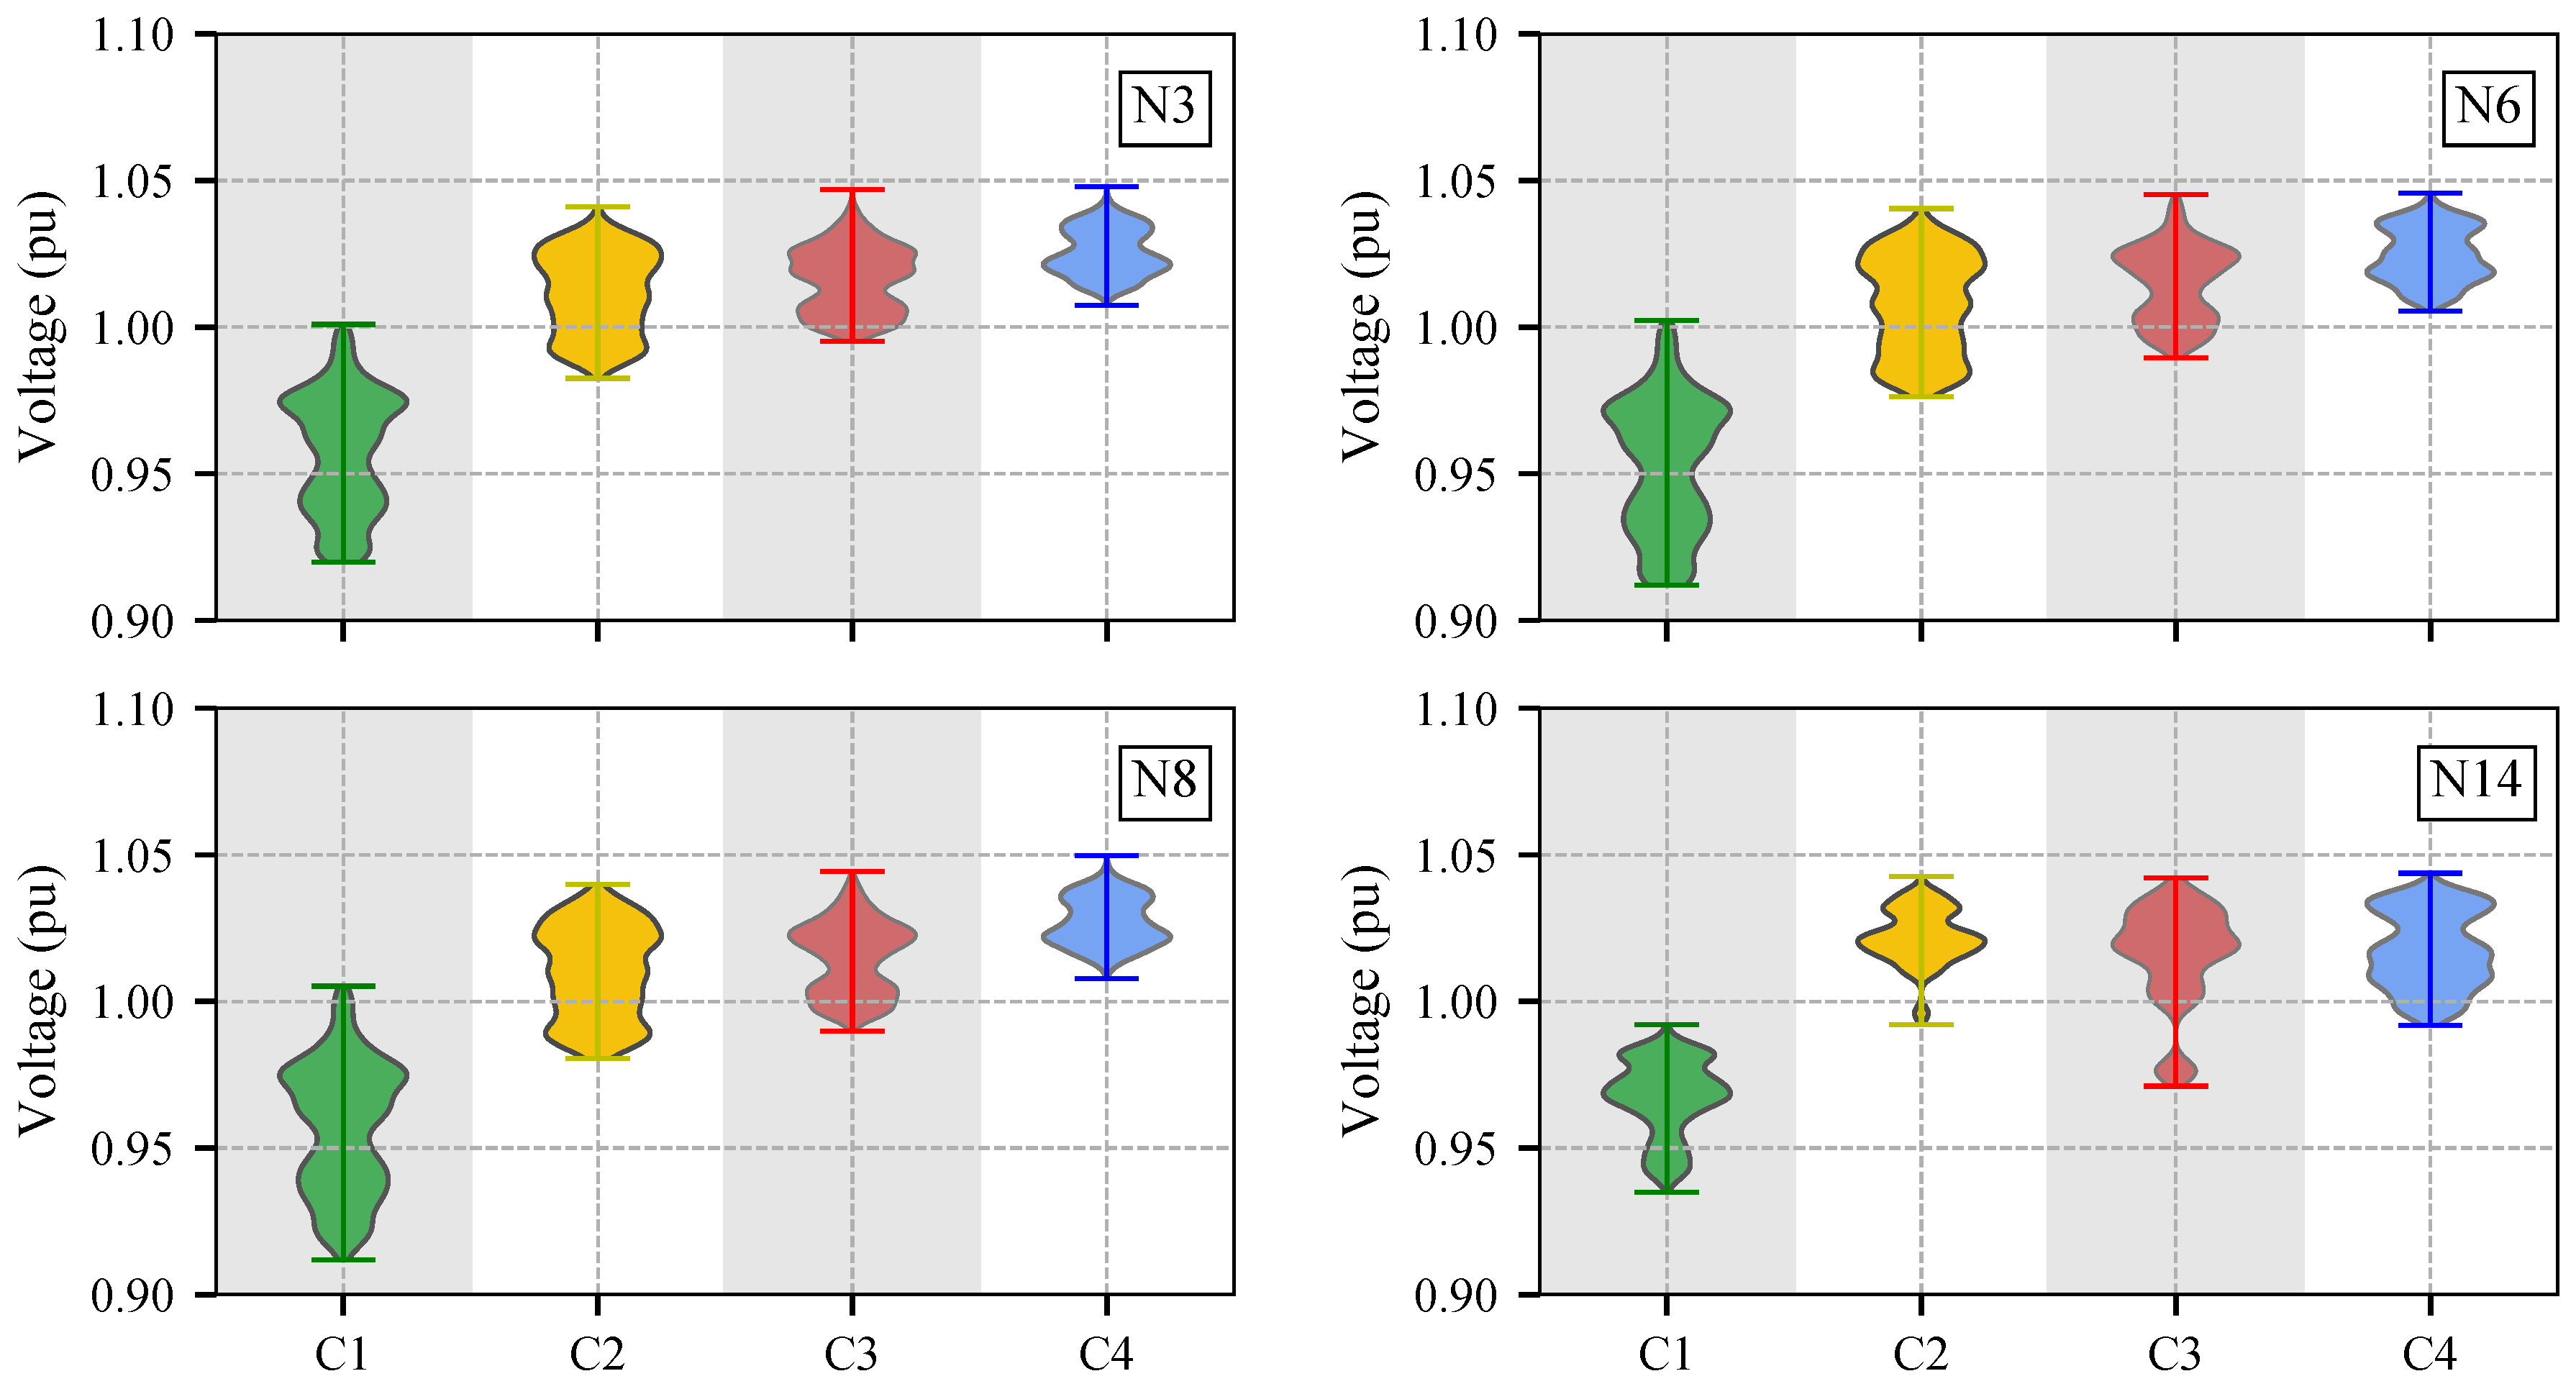
- Voltage violation (): This KPI evaluates the percentage of time during the day that which the nodal voltages are outside the technical limits [0.95–1.05 pu].
- Variation of nodal voltages (): This index provides a global measurement of the daily voltage variations at the nodes of the network. It is computed as the average value of the difference between the maximum and minimum nodal voltages, measured in pu,where is the total number of network nodes.
- OLTC operation (): This KPI shows the number of OLTC operations that occur during the 24-h testing period.
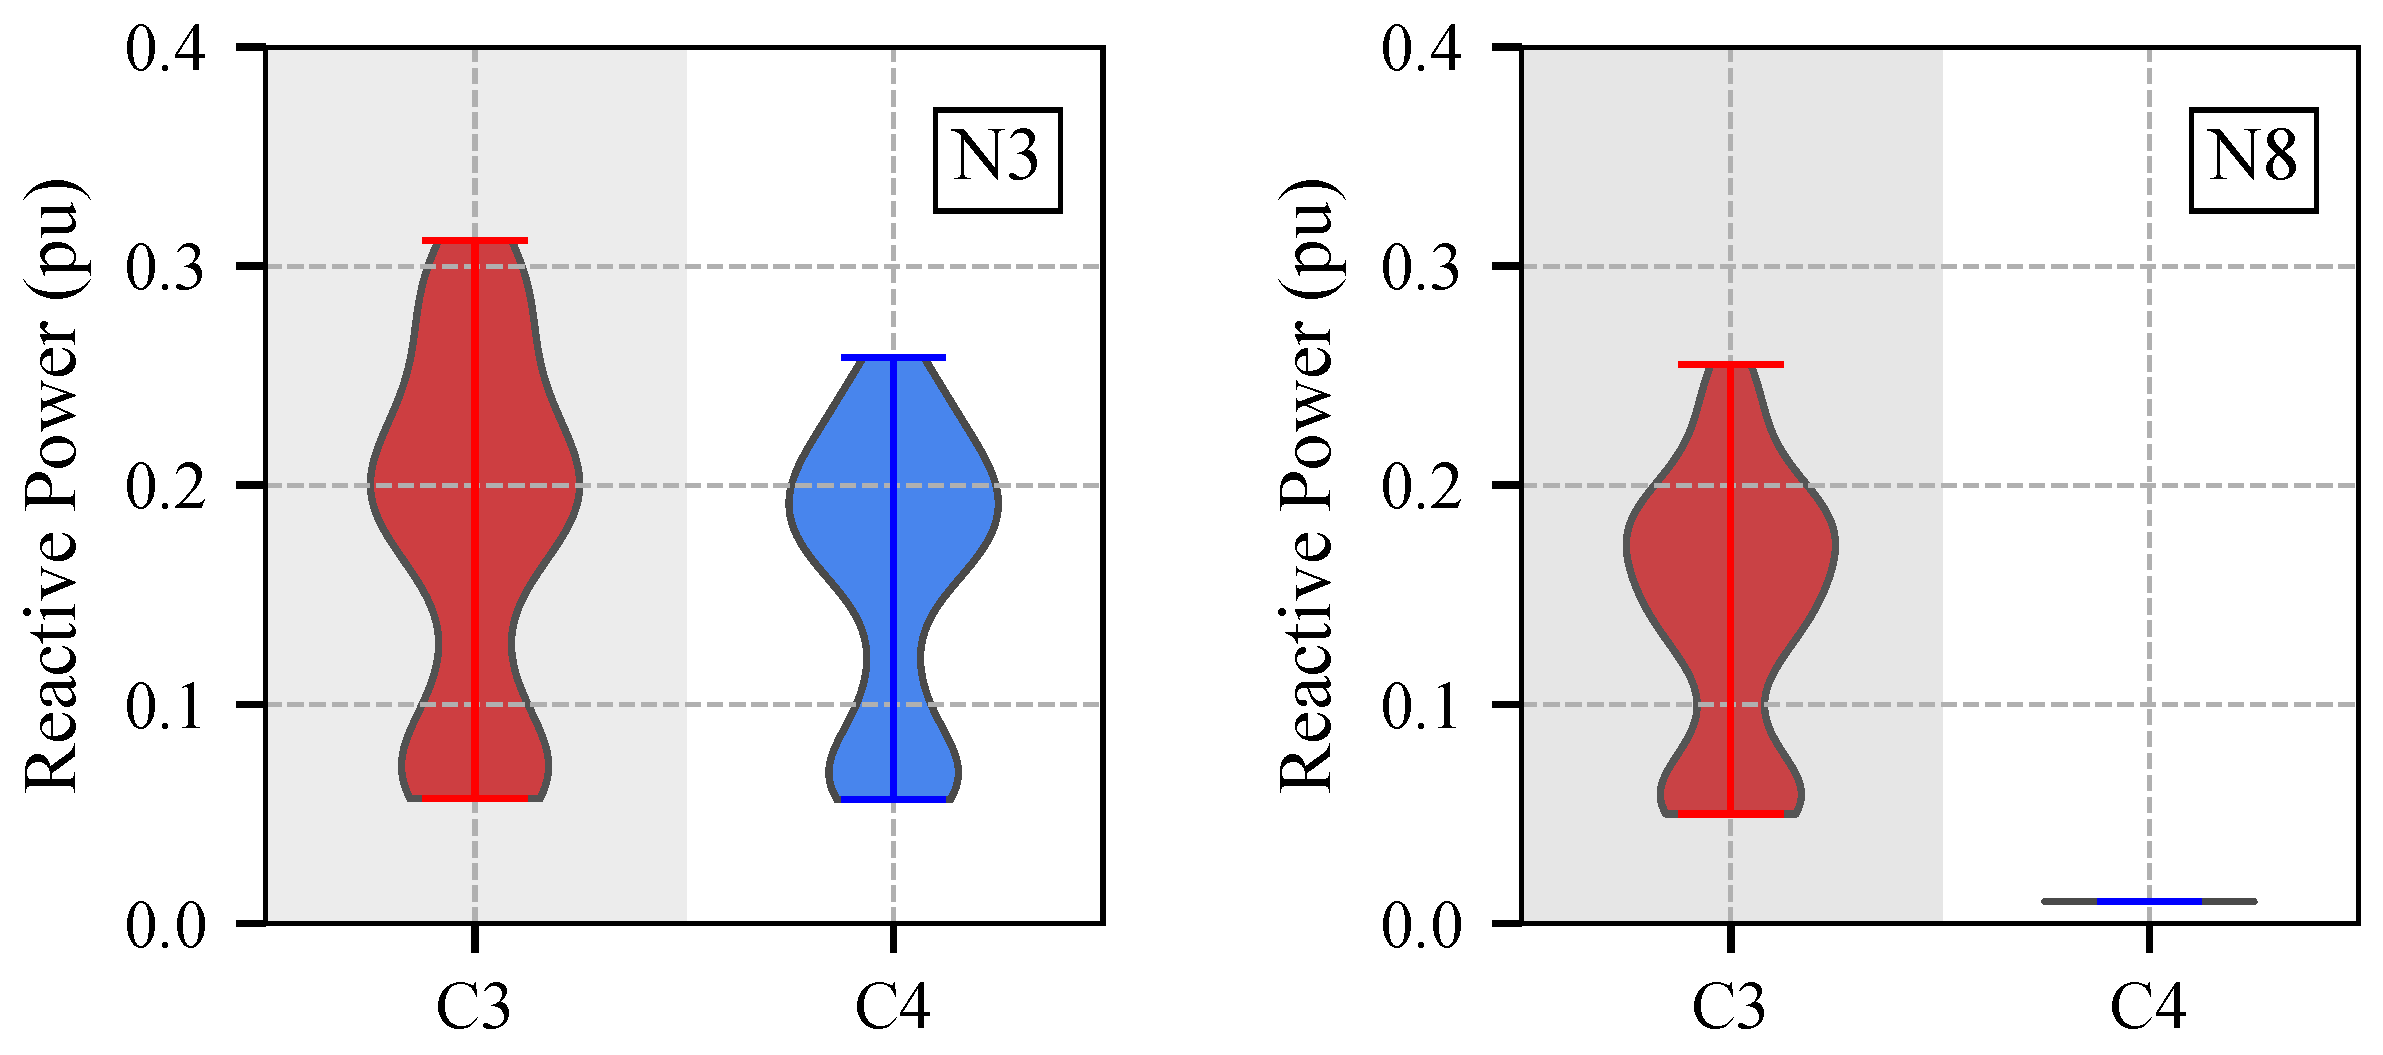
- RES reactive power injection (): This index provides a global measurement of the RES collaboration to the network reactive power support. It is computed by dividing the average value of the reactive power injected by the RES during the 24-h period by the total number of RES,where is the reactive power injected by in period t, is the number of RES in the network, and is the number of time periods considered during the 24-h period.
- DC link load (): This evaluates the daily average load of the DC link during the day, and it is computed aswhere is the apparent power of each VSC and is the rated power of the DC link.
- Transformer load (): This represents the daily average load of the transformer as a percentage of its rated power, which can be computed aswhere is the apparent power through the transformer and is the rated power of the transformer.
4.3. Experimental Results
5. Conclusions
Author Contributions
Funding
Conflicts of Interest
Abbreviations
| ADMS | Advanced Distribution Management System |
| CIGRE | International Council on Large Electric Systems |
| DC | Direct Current |
| DSO | Distribution System Operator |
| HV | High Voltage |
| IGBT | Insulated Gate Bipolar Transistor |
| KPI | Keys Performance Index |
| LC | Local Controller |
| LV | Low Voltage |
| MV | Medium Voltage |
| OLE | Omnimode Load Emulator |
| OPF | Optimal Power Flow |
| OLTC | On-Load Tap Changer |
| PV | Photovoltaic |
| RES | Renewable Energy Sources |
| RTCS: | Real-Time Control System |
| RTU | Remote Terminal Unit |
| SMS | Signal Management System |
| TSO | Transmission System Operator |
| VSC | Voltage Source Converter |
| WT | Wind Turbine |
References
- Guerrero, J.M.; Blaabjerg, F.; Zhelev, T.; Hemmes, K.; Monmasson, E.; Jemei, S.; Comech, M.P.; Granadino, R.; Frau, J.I. Distributed Generation: Toward a New Energy Paradigm. IEEE Ind. Electron. Mag. 2010, 4, 52–64. [Google Scholar] [CrossRef]
- Distributed Generation System Characteristics and Costs in the Buildings Sector; Technical Report; U.S. Energy Information Administration: Washington, DC, USA, 2013.
- Pérez-Arriaga, I.; Knittel, C. Utility of the Future. An MIT Energy Initiative Response; Technical Report; Massachusetts Institute of Technology: Cambridge, MA, USA, 2016. [Google Scholar]
- Power Distribution Planning Reference Book, 2nd ed.; CRC Press Book: Boca Raton, FL, USA, 2004.
- Barker, P.P.; Mello, R.W.D. Determining the impact of distributed generation on power systems. I. Radial distribution systems. In Proceedings of the 2000 Power Engineering Society Summer Meeting (Cat. No.00CH37134), Seattle, WA, USA, 16–20 July 2000; Volume 3, pp. 1645–1656. [Google Scholar]
- Walling, R.A.; Saint, R.; Dugan, R.C.; Burke, J.; Kojovic, L.A. Summary of Distributed Resources Impact on Power Delivery Systems. IEEE Trans. Power Deliv. 2008, 23, 1636–1644. [Google Scholar] [CrossRef]
- Assessing the Impact of Low Carbon Technologies on Great Britain’s Power Distribution Networks. 3 August 2012. Available online: https://www.ofgem.gov.uk/publications-and-updates/assessing-impact-low-carbon-technologies-great-britains-power-distribution-networks (accessed on 5 April 2018).
- Elkhatib, M.E.; El-Shatshat, R.; Salama, M.M.A. Novel Coordinated Voltage Control for Smart Distribution Networks With DG. IEEE Trans. Smart Grid 2011, 2, 598–605. [Google Scholar] [CrossRef]
- Ueda, Y.; Kurokawa, K.; Tanabe, T.; Kitamura, K.; Sugihara, H. Analysis Results of Output Power Loss Due to the Grid Voltage Rise in Grid-Connected Photovoltaic Power Generation Systems. IEEE Trans. Ind. Electron. 2008, 55, 2744–2751. [Google Scholar] [CrossRef]
- Molina-García, A.; Mastromauro, R.A.; García-Sánchez, T.; Pugliese, S.; Liserre, M.; Stasi, S. Reactive Power Flow Control for PV Inverters Voltage Support in LV Distribution Networks. IEEE Trans. Smart Grid 2017, 8, 447–456. [Google Scholar] [CrossRef]
- Calderaro, V.; Galdi, V.; Lamberti, F.; Piccolo, A. A Smart Strategy for Voltage Control Ancillary Service in Distribution Networks. IEEE Trans. Power Syst. 2015, 30, 494–502. [Google Scholar] [CrossRef]
- Karagiannopoulos, S.; Aristidou, P.; Hug, G. Hybrid approach for planning and operating active distribution grids. Transm. Distrib. IET Gener. 2017, 11, 685–695. [Google Scholar] [CrossRef]
- Puerto Rico Electric Power Authority (PREPA). Minimum Technical Requirements (MTR) for Photovoltaic Generation (PV) Projects; Technical Report; Puerto Rico Electric Power Authority (PREPA): San Juan, Puerto Rico, 2012. [Google Scholar]
- National Energy Regulator of South Africa (NERSA). Grid Connection Code for Renewable Power Plants (RPPs) Connected to the Electricity Transmission System or the Distribution System in South Africa; Technical Report; National Energy Regulator of South Africa (NERSA): Pretoria, South Africa, 2012. [Google Scholar]
- Alnaser, S.W.; Ochoa, L.F. Advanced Network Management Systems: A Risk-Based AC OPF Approach. IEEE Trans. Power Syst. 2015, 30, 409–418. [Google Scholar] [CrossRef]
- Kryonidis, G.C.; Demoulias, C.S.; Papagiannis, G.K. A Nearly Decentralized Voltage Regulation Algorithm for Loss Minimization in Radial MV Networks With High DG Penetration. IEEE Trans. Sustain. Energy 2016, 7, 1430–1439. [Google Scholar] [CrossRef]
- Kolenc, M.; Papič, I.; Blažič, B. Minimization of losses in smart grids using coordinated voltage control. Energies 2012, 5, 3768–3787. [Google Scholar] [CrossRef]
- Alnaser, S.W.; Ochoa, L.F. Hybrid controller of energy storage and renewable DG for congestion management. In Proceedings of the 2012 IEEE Power and Energy Society General Meeting, San Diego, CA, USA, 22–26 July 2012; pp. 1–8. [Google Scholar]
- Liu, X.; Aichhorn, A.; Liu, L.; Li, H. Coordinated Control of Distributed Energy Storage System with Tap Changer Transformers for Voltage Rise Mitigation Under High Photovoltaic Penetration. IEEE Trans. Smart Grid 2012, 3, 897–906. [Google Scholar] [CrossRef]
- Barragan-Villarejo, M.; Marano, A.; García-López, F.P.; Mauricio, J.M.; Maza-Ortega, J.M. Coordinated control of distributed energy resources and flexible links in active distribution networks. In Proceedings of the International Conference on Renewable Power Generation (RPG 2015), Beijing, China, 17–18 October 2015; pp. 1–6. [Google Scholar]
- Marano-Marcolini, A.; Villarejo, M.B.; Fragkioudaki, A.; Maza-Ortega, J.M.; Ramos, E.R.; de la Villa Jaén, A.; Delgado, C.C. DC Link Operation in Smart Distribution Systems With Communication Interruptions. IEEE Trans. Smart Grid 2016, 7, 2962–2970. [Google Scholar] [CrossRef]
- Fazio, A.R.D.; Fusco, G.; Russo, M. Decentralized Control of Distributed Generation for Voltage Profile Optimization in Smart Feeders. IEEE Trans. Smart Grid 2013, 4, 1586–1596. [Google Scholar] [CrossRef]
- Kulmala, A.; Alonso, M.; Repo, S.; Amaris, H.; Moreno, A.; Mehmedalic, J.; Al-Jassim, Z. Hierarchical and distributed control concept for distribution network congestion management. IET Gener. Transm. Distrib. 2017, 11, 665–675. [Google Scholar] [CrossRef]
- Almasalma, H.; Claeys, S.; Mikhaylov, K.; Haapola, J.; Pouttu, A.; Deconinck, G. Experimental Validation of Peer-to-Peer Distributed Voltage Control System. Energies 2018, 11, 1304. [Google Scholar] [CrossRef]
- Maza-Ortega, J.M.; Barragán-Villarejo, M.; García-López, F.d.P.; Jiménez, J.; Mauricio, J.M.; Alvarado-Barrios, L.; Gómez-Expósito, A. A Multi-Platform Lab for Teaching and Research in Active Distribution Networks. IEEE Trans. Power Syst. 2017, 32, 4861–4870. [Google Scholar] [CrossRef]
- Romero-Ramos, E.; Gómez-Expósito, A.; Marano-Marcolini, A.; Maza-Ortega, J.M.; Martínez-Ramos, J.L. Assessing the loadability of active distribution networks in the presence of DC controllable links. IET Gener. Transm. Distrib. 2011, 5, 1105. [Google Scholar] [CrossRef]
- Rudion, K.; Orths, A.; Styczynski, Z.A.; Strunz, K. Design of benchmark of medium voltage distribution network for investigation of DG integration. In Proceedings of the 2006 IEEE Power Engineering Society General Meeting, Montreal, QC, Canada, 18–22 June 2006; p. 6. [Google Scholar]
- Benchmark Systems for Network Integration of Renewable and Distributed Energy Resources. Available online: http://www.e-cigre.org/publication/575-benchmark-systems-for-network-integration-of-renewable-and-distributed-energy-resources (accessed on 2 November 2016).
- Maza-Ortega, J.M.; Gomez-Exposito, A.; Barragan-Villarejo, M.; Romero-Ramos, E.; Marano-Marcolini, A. Voltage source converter-based topologies to further integrate renewable energy sources in distribution systems. IET Renew. Power Gener. 2012, 6, 435–445. [Google Scholar] [CrossRef]


| Initial Node | End Node | Resistance (m) | Reactance (m) |
|---|---|---|---|
| N1 | N2 | ||
| N2 | N3 | ||
| N3 | N4 | ||
| N4 | N5 | ||
| N5 | N6 | ||
| N6 | N7 | ||
| N7 | N8 | ||
| N8 | N9 | ||
| N9 | N10 | ||
| N10 | N11 | ||
| N11 | N12 | ||
| N3 | N8 | ||
| N12 | N13 | ||
| N13 | N14 |
| Control Assets | C1 | C2 | C3 | C4 |
|---|---|---|---|---|
| OLTC | • | • | • | |
| RES reactive power | • | • | ||
| DC link | • |
| C1 | C2 | C3 | C4 | |
|---|---|---|---|---|
| / (kWh/%) | /− | / | / | / |
| (pu) | − | − | ||
| (%) | 0 | 0 | 0 | |
| 0 | 2 | 4 | 2 | |
| (pu) | ||||
| (%) |
| RES Connected to Bus | (kVA) Scaled down System | (MVA) MV System | (pu) | (pu) |
|---|---|---|---|---|
| N3 | 12 | 12 | ||
| N5 | 12 | 12 | ||
| N6 | 12 | 12 | ||
| N7 | 7 | 7 | ||
| N8 | 12 | 12 | ||
| N9 | 12 | 12 | ||
| N10 | 16 | 16 |
© 2018 by the authors. Licensee MDPI, Basel, Switzerland. This article is an open access article distributed under the terms and conditions of the Creative Commons Attribution (CC BY) license (http://creativecommons.org/licenses/by/4.0/).
Share and Cite
García-López, F.d.P.; Barragán-Villarejo, M.; Marano-Marcolini, A.; Maza-Ortega, J.M.; Martínez-Ramos, J.L. Experimental Assessment of a Centralised Controller for High-RES Active Distribution Networks. Energies 2018, 11, 3364. https://doi.org/10.3390/en11123364
García-López FdP, Barragán-Villarejo M, Marano-Marcolini A, Maza-Ortega JM, Martínez-Ramos JL. Experimental Assessment of a Centralised Controller for High-RES Active Distribution Networks. Energies. 2018; 11(12):3364. https://doi.org/10.3390/en11123364
Chicago/Turabian StyleGarcía-López, Francisco de Paula, Manuel Barragán-Villarejo, Alejandro Marano-Marcolini, José María Maza-Ortega, and José Luis Martínez-Ramos. 2018. "Experimental Assessment of a Centralised Controller for High-RES Active Distribution Networks" Energies 11, no. 12: 3364. https://doi.org/10.3390/en11123364
APA StyleGarcía-López, F. d. P., Barragán-Villarejo, M., Marano-Marcolini, A., Maza-Ortega, J. M., & Martínez-Ramos, J. L. (2018). Experimental Assessment of a Centralised Controller for High-RES Active Distribution Networks. Energies, 11(12), 3364. https://doi.org/10.3390/en11123364