Article

Exhaust Emissions and Physicochemical Properties of n-Butanol/Diesel Blends with 2-Ethylhexyl Nitrate (EHN) or Hydrotreated Used Cooking Oil (HUCO) as Cetane Improvers

by
Iraklis Zahos-Siagos
,
Vlasios Karathanassis
and
Dimitrios Karonis
*
Laboratory of Fuels Technology and Lubricants, School of Chemical Engineering, National Technical University of Athens, 15780 Athens, Greece
*
Author to whom correspondence should be addressed.
Energies 2018, 11(12), 3413; https://doi.org/10.3390/en11123413
Submission received: 16 October 2018 / Revised: 28 November 2018 / Accepted: 2 December 2018 / Published: 5 December 2018

Abstract

:
Currently, n-butanol is a promising oxygenate (potentially of renewable origin) to be used in blends with conventional diesel fuel in compression ignition engines. However, its poor ignition quality can drastically deteriorate the cetane number (CN) of the blend. In the present work, the effects of adding n-butanol to ultra-low-sulfur diesel (ULSD) were assessed, aiming at simultaneously eliminating its negative effect on the blend’s ignition quality. Concentrations of 10% and 20% (v/v) n-butanol in ULSD fuel were studied. As cetane-improving agents, a widely used cetane improver (2-ethylhexyl nitrate—EHN) and a high-CN, bio-derived paraffinic diesel (hydrotreated used cooking oil—HUCO) were used. The initial investigation of ignition quality improvement with the addition of either EHN or HUCO produced four “ignition quality response curves” that served as mixing guides in order to create four blends of identical ignition quality as the baseline ULSD fuel. These four blends (10% and 20% v/v n-butanol in ULSD fuel, with the addition of either EHN or HUCO, at the cost of ULSD volume share only) were evaluated comparatively to the baseline ULSD fuel and a 10% (v/v) n-butanol/90% ULSD blend with regards to their physicochemical properties and the effect on the operation and exhaust emissions of a stationary diesel engine.

1. Introduction

Diesel engines (also referred to as compression ignition engines) are the powertrain of choice for a wide range of applications, varying from light-duty passenger cars to enormous marine propulsion engines, and from small-home diesel generators to high-power remote electrical stations. Compared to its spark-ignited sibling, the compression ignition engine is more robust and less fuel-sensitive (meaning it can be supplied with a wide range of fuel qualities), and it can reach a higher thermal efficiency. These advantages, however, are often overshadowed by its exhaust emissions, mainly nitrogen oxides (NOx) and particulate matter (PM), for which diesel engines are notorious [1,2,3].
To overcome these drawbacks, researchers’ attention turned not only to engine evolution, but also to fuel technologies and fuel mixing strategies [4,5,6,7,8]. Research also showed that engine calibration can prove essential in order to maximize the beneficial effects of specific alternative fuels [9,10,11,12,13,14]. Moreover, since the degradation of the atmosphere renders the reduction of the dependence on fossil fuels highly important, alternative fuels deriving from biomass feedstocks drew the interest of many researchers across the globe [5,15,16,17,18,19,20].
Alcohols constitute a widely tested category of oxygenated fuel components to use in mixtures with conventional ultra-low-sulfur diesel (ULSD) [21,22,23]. As oxygenates, they introduce oxygen into the fuel and are known to help promote complete combustion and reduce PM, usually leaving NOx unaffected or slightly changed (increased or decreased) [5,8,21,24,25,26,27]. Furthermore, alcohols can be produced from biomass, thus helping increase the renewable energy share in the fuel blend.
Short-carbon-chain alcohols are arguably the most studied alcohols for use in internal combustion engines [5,21]. Ethanol, in particular, is already widely and successfully used in spark-ignition engines, while extensive research was also conducted for its potential implementation in diesel engines [5,28,29,30]. Methanol, studied and tested in the past, was recently reintroduced in various places and applications [31]. Furthermore, n-butanol is considered more compatible for use in blends with ULSD because it does not suffer from miscibility issues, and its physicochemical properties are somewhat closer to those of diesel fuel [5,24,32].
Short-carbon-chain alcohols such as ethanol and n-butanol are not yet widely used in compression ignition engines because of the detrimental effect they have on the fuel blend’s physicochemical properties [22,24,29,33,34]. The properties more significantly affected are flash point and cetane number (CN).
Flash point has more to do with safety categorization for transport, storage, and handling. Generally, it is not possible to improve the flash point of a fuel blend once it is reduced due to the presence of more volatile components with lower flash point [35].
CN is an important fuel property significantly affecting the engine operation and exhaust emissions. Methods of lessening the expected ignition quality deterioration include the use of a baseline ULSD of high CN, maintenance of low alcohol concentration, or use of a cetane-improving agent.
Biomass-to-liquid technologies constitute another potential path of creating alternative fuels for use in diesel engines [19,36]. Methods like Fischer–Tropsch and catalytic hydroprocessing are widely employed to create high-CN, clean-burning fuel (or biofuel, depending on the feedstock), often referred to as “paraffinic diesel”. The Fischer–Tropsch process has relatively limited industrial application [37,38]; however, catalytic hydroprocessing is a well-established process in the petrochemical industry, routinely used for over a century for various purposes such as heteroatom (sulfur, nitrogen, oxygen, and metal) removal, saturation of olefins and aromatics, isomerization, and cracking [19].
The products of catalytic hydroprocessing of liquid biomass (normal paraffins) can be further hydrotreated for isomerization in order to improve their cold flow properties [36]. Nevertheless, the extra cost of the isomerization step can be avoided if normal paraffins are directly mixed with conventional diesel in low-to-moderate concentrations [39].
In the present work, n-butanol was chosen as a popular, potentially renewable oxygenate in blends of 10% and 20% (v/v) with conventional ULSD fuel. As stated above, n-butanol was the oxygenate of choice in many research studies assessing oxygenated ULSD blends, but its serious impact on ignition quality of the blends usually was not taken out of the equation. In order to develop better insight into the effects of oxygen addition in diesel fuel, it was decided that the deterioration of the ignition quality of the blend (due to n-butanol addition) should be designedly counterbalanced using a cetane-improving agent. For this reason, 2-ethylhexyl nitrate (EHN) and hydrotreated used cooking oil (HUCO) were used. EHN is a standard, widely used cetane improver, while HUCO is the non-isomerized product of catalytic hydroprocessing of used cooking oil, characterized by a very high CN.
For 10% and 20% (v/v) n-butanol concentrations, four ignition quality response curves (due to the addition of EHN and HUCO) were developed, providing detailed mixing rules for creating blends with specific ignition quality characteristics. According to these response curves, four ternary blends (10% and 20% (v/v) n-butanol, with CN improved using either EHN or HUCO, hereinafter abbreviated as Bu10E, Bu20E, Bu10H, and B20H) with the same ignition quality behavior as the baseline ULSD fuel were created (a blending approach not seen in the literature, to the knowledge of the authors).
Afterward, the effects of n-butanol, EHN, and HUCO on the blends’ physicochemical properties were measured and studied. Also, the four blends along with the baseline ULSD and a 10% (v/v) butanol/90% ULSD blend (without a cetane improver of any kind, hereinafter abbreviated as Bu10) were tested in a stationary diesel engine, and their effects on engine operation and exhaust emissions were investigated.

2. Fuels

The baseline diesel fuel was supplied by Hellenic Petroleum SA (Athens, Greece). This was a standard-quality fossil-only diesel fuel coming from the hydrotreating unit of the refinery and was free of biodiesel or any additives whatsoever.
The n-butanol was supplied by Carlo Erba Reagents (Barcelona, Spain) and it was of ≥99.5% purity (w/w).
EHN was supplied by Sigma-Aldrich (St. Louis, MO, USA) and it was of 97% purity (w/w).
HUCO was supplied by the Centre for Research and Technology Hellas (CERTH). The catalytic hydrotreatment technology used for production of this fuel was developed and demonstrated in the hydrotreating pilot plants of the Chemical Processes and Energy Resources Institute of CERTH, via the financial contribution of the BIOFUELS-2G LIFE+ project [40]. A total of 2 tons of fuel was produced from used cooking oil collected from local restaurants.
Since the baseline ULSD was free of lubricity additives, it was considered necessary to add a standard lubricity agent in each of the SIX samples, in the same concentration of 0.1 mL per sample liter.
The measured properties of the fuels used and the samples tested in the diesel engine are presented in Table 1.
Table 2 shows the composition of this non-isomerized paraffinic diesel fuel [41]. The high concentration of normal paraffins in the HUCO explains the excellent ignition quality characteristics of the fuel, as well as its poor cold flow properties.

3. Experimental Set-Up and Procedures
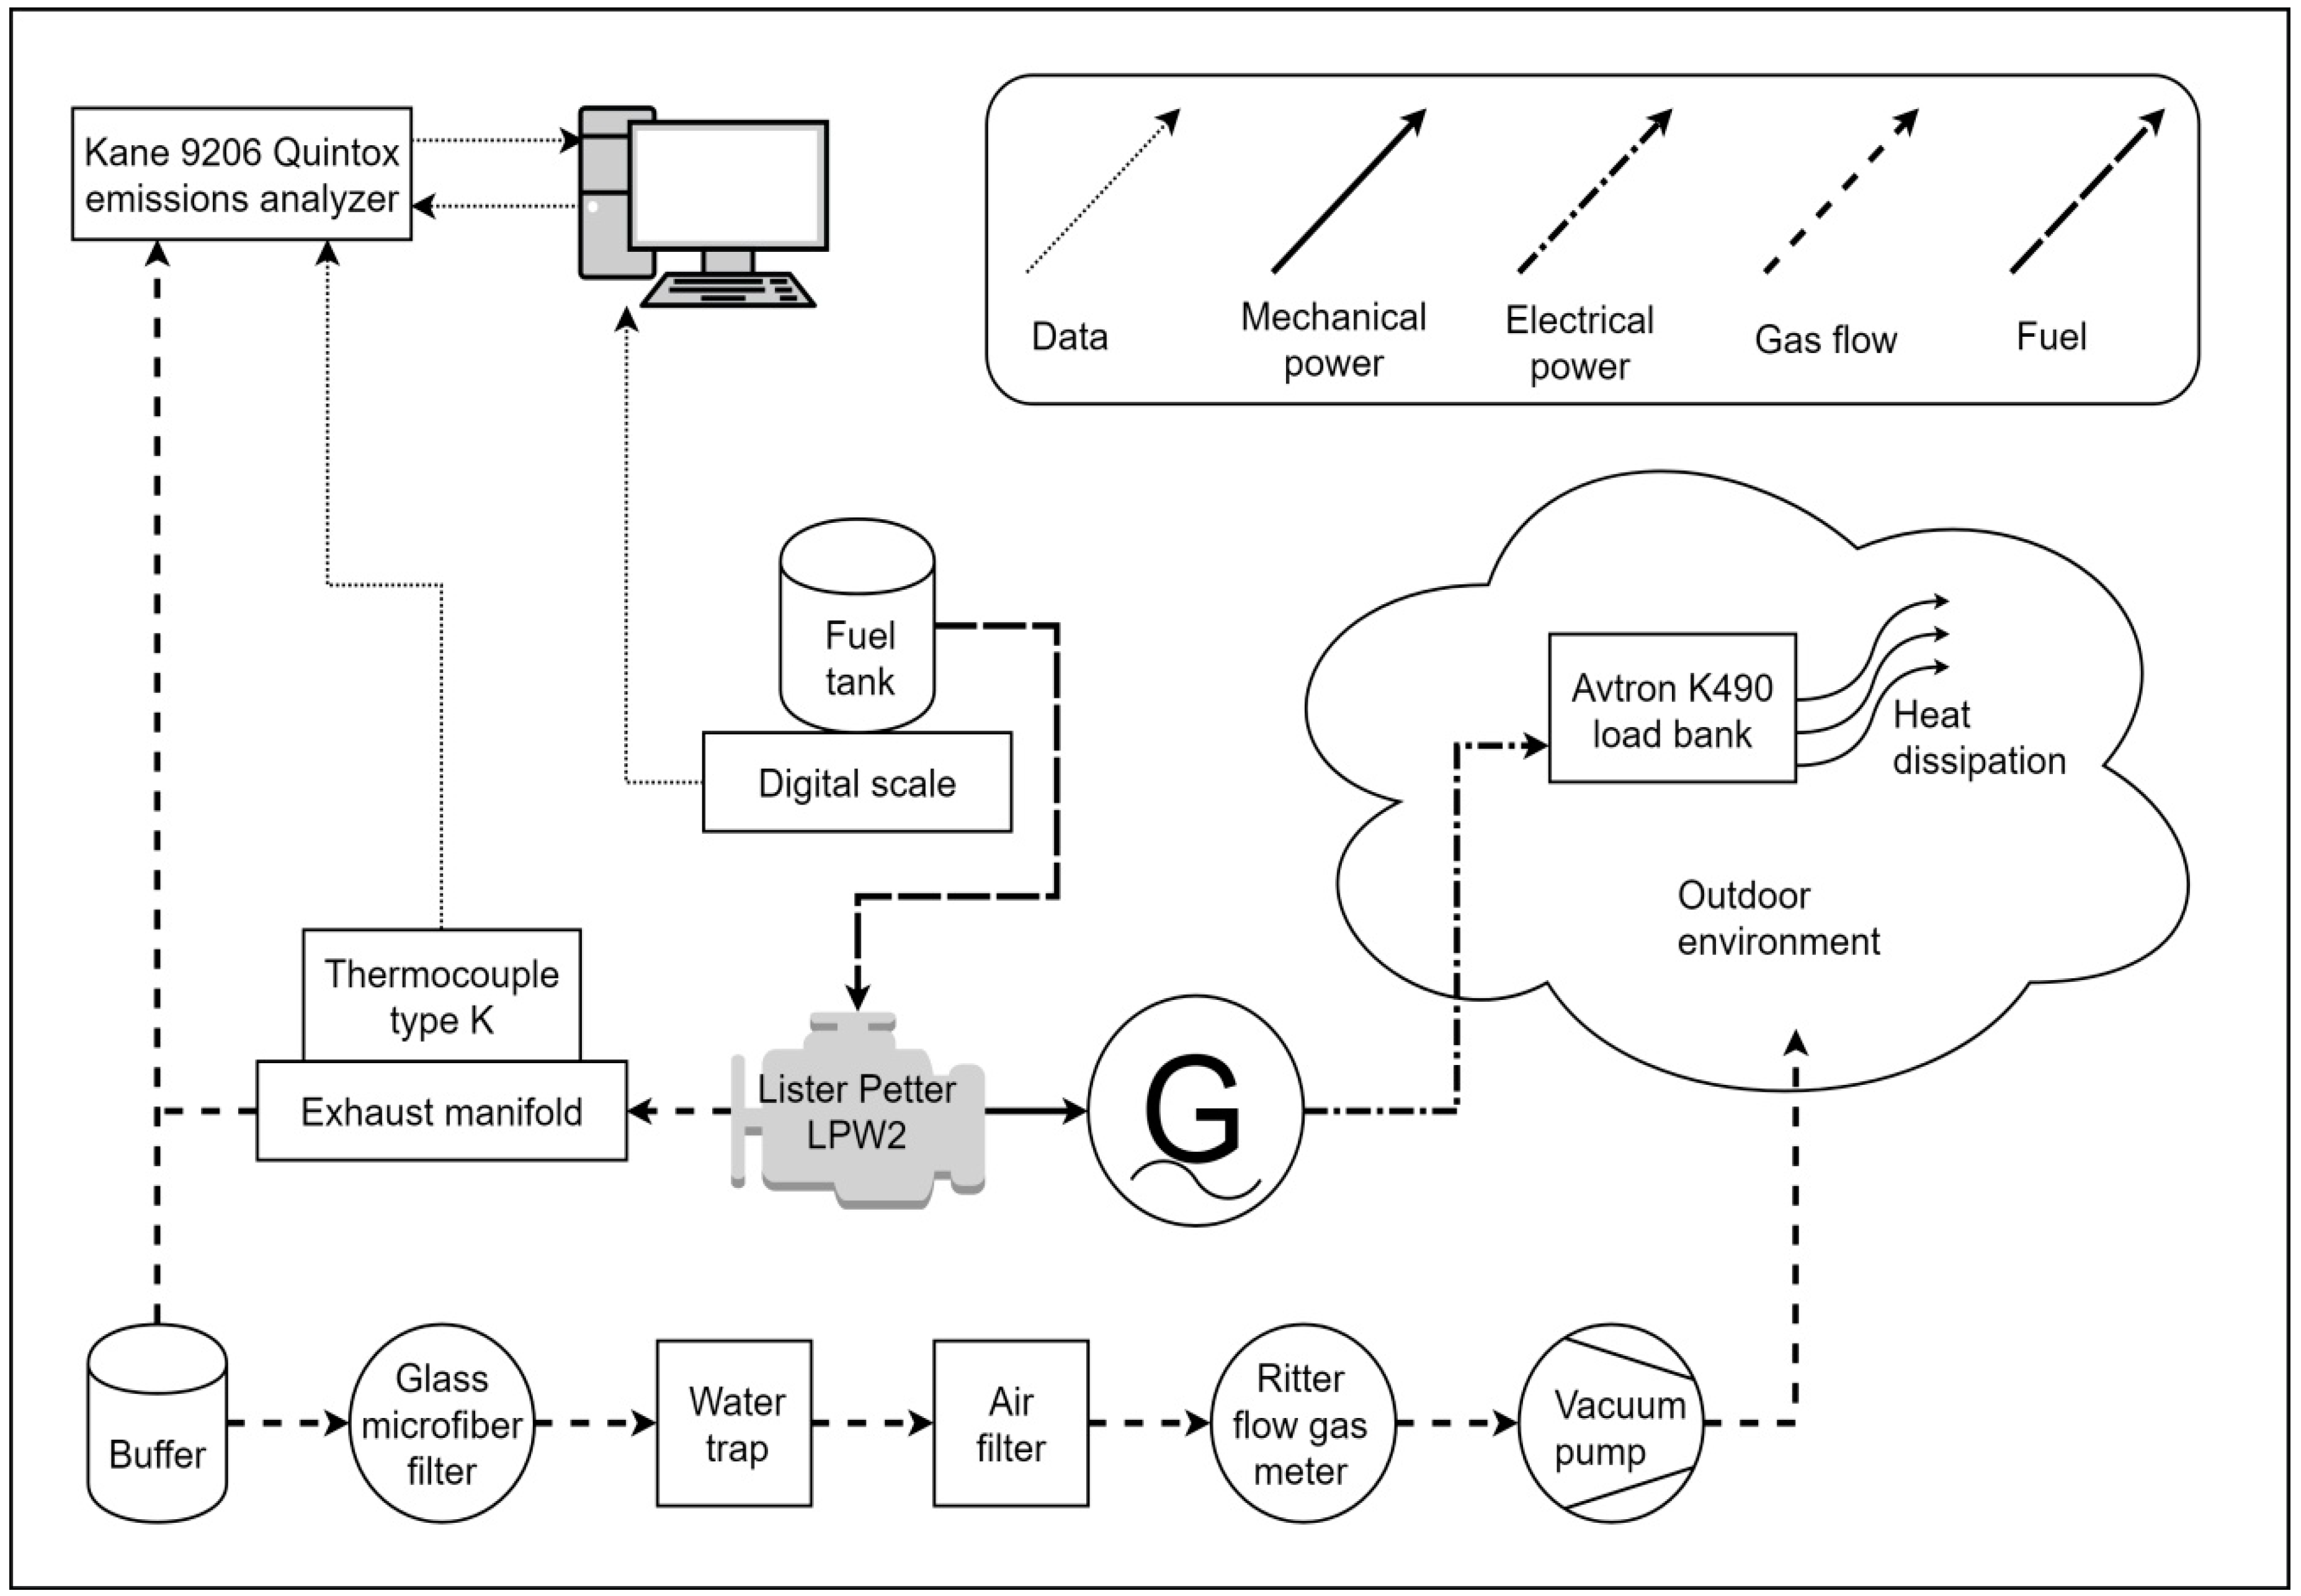
3.1. Apparatus Used

Measurements of physicochemical properties of all fuels and blends took place in the Laboratory of Fuels Technology and Lubricants of the National Technical University of Athens, Greece. Density and viscosity were measured using an SVM 3000 Stabinger Viscometer, made by Anton-Paar GmbH (Graz, Austria). Distillation curves were obtained using an ADU 5 automatic distillation unit made also by Anton-Paar GmbH. All derived cetane number (DCN) measurements were carried out using the fuel ignition testing (FIT) instrument made by Waukesha, (Waukesha, WI, USA). Lower heating value (LHV) was determined via elemental analysis (hydrogen content for the calculation of lower heating value from higher heating value) with a Euro EA analyzer made by Eurovector SrI (Pavia, Italy), and higher heating value was measured with a Calorimeter 6200 made by Parr Instruments (Moline, IL, USA). Cold filter plugging point (CFPP) was measured with an FPP 5Gs instrument made by ISL (Verson, France). Flash point was measured with an Automatic Flash Point Tester (Pensky Partens method) made by Scavini (Baveno, Italy).
The experimental work on exhaust emissions was carried out using a typical stationary diesel generator by Lister Petter (Teignmouth, UK). Technical specifications of the engine–generator set are provided in Table 3. No after-treatment of exhaust emissions was applied whatsoever. The engine load was controlled by Avtron’s K490 AC (Cleveland, OH, USA) resistive load bank.
Carbon monoxide (CO), carbon dioxide (CO2), nitrogen oxides (NOx), and unburned hydrocarbons (HC) were measured with a Kane 9206 Quintox gas analyzer (Welwyn Garden City, UK). The sampling probe was positioned just after the exhaust manifold, and the exhaust gas was led to the analyzer through a heated line to avoid water condensation. Table 4 presents details regarding the resolution, measurement range, and accuracy of the gas analyzer.
Particulate matter was measured with units of mass per exhaust gas volume. Exhaust gas was driven through Whatman glass microfiber filters (Little Chalfont, UK) that were thoroughly dried and weighed prior to the sampling procedure. The exhaust gas volume passing through the filter was measured with a Ritter (Bochum, Germany) bellows-type gas meter. To measure filter mass, a high-accuracy analytical balance with a resolution of 0.1 mg was used.
Fuel consumption was measured by mass using a digital scale.
The experimental set-up (shown in Figure 1) was located in the Laboratory of Fuels Technology and Lubricants of the National Technical University of Athens, Greece, and was also employed in previous work [24,39].

3.2. Experimental Procedure

3.2.1. Ignition Quality Investigation Procedure

The main goal of this work was to create oxygenated fuel blends while keeping the ignition quality of the blend the same as baseline ULSD fuel. For this reason, a detailed investigation was carried out in order to assess the effect of either cetane-improving component (EHN or HUCO) on the CN of the final blend.
The volumetric ratios of n-butanol studied were 10 and 20%. These ratios were kept the same, and the third component (either EHN or HUCO) was introduced by small steps improving ignition quality characteristics. Equation (1) describes the general rule for creating multiple samples with increasing concentration of either EHN or HUCO as cetane improvers. The values inside the brackets (where X takes a value equal to either 10 or 20) indicate the volumetric percentage ratio of each component.
n B u t a n o l ( X ) ,   C e t a n e I m p r o v e r ( Y ) ,   U L S D ( 100 X Y ) .
The ignition quality of each sample was measured according to the American Society for Testing and Materials (ASTM) D7170 method. This method is based on a fixed range injection period system. The apparatus consists of a constant volume combustion chamber and all necessary instrumentation to measure the duration between the start of fuel injection and start of combustion (i.e., the ignition delay (ID)), which is then used as a unique variable in an equation provided by the method to calculate the derived cetane number (DCN).

3.2.2. Exhaust Gas Investigation Procedure

The exhaust gas measurements were taken under steady-state conditions at 1500 rpm. The engine was kept running at a specific load until it reached steady-state operating conditions before any sampling took place. A K-type thermocouple was fitted in the exhaust manifold to provide exhaust gas temperature readings. This way, energy equilibrium of the engine system (indicative of steady-state operation) was identified.
After steady-state conditions were reached, the gas analyzer started sampling. The final values at each applied load resulted from the average of ten consequent readings during a period of 10 min.
To measure PM, a fresh, dried, and weighed glass microfiber filter was put in a custom-made sampling probe. A custom-made buffer was positioned between the exhaust manifold and the sampling probe to help decrease gas temperature, facilitate particulate nucleosis, and ensure that too large pieces of soot, accidentally torn away from the internal walls of the sample tubing, would not get drawn onto the filter. The temperature drop was necessary to protect filter from high temperatures, while nucleosis was needed to eliminate the existence of particulates of small diameter that would otherwise pass through freely. The PM sampling took place for different durations, depending on the engine load. This was considered necessary because, at high loads, too many PM emissions accumulate on the filter, forming a thick crust that alters the filtration characteristics, while, at low loads, the PM emissions are so low that the filter net weight gets too close to the accuracy limits of the scale. After the sampling duration, the PM-loaded filter was removed, dried, and weighed again. The final PM value results from the PM net weight divided by the sampling exhaust gas volume measured by the Ritter gas meter.
After gas, PM, and gravimetric fuel consumption measurements were taken, the next load was imposed through the load bank, and the exhaust gas temperature was monitored until steady-state conditions were reached again.
The engine loads used for the measurement of exhaust emissions and fuel consumption were 1.5 kW (low), 3.5 kW (medium), 4.5 kW (medium–high), and 5.5 kW (full), as presented in Table 5.
The experimental procedure was developed and optimized for the specific apparatus in hand over the last few years and, as a result, the basic aspects of the methodology are the same as those described in previous work [24,39]. However, some parameters (such as the duration of sampling for the PM measurement, or the imposed loads on the engine) were carefully chosen after trial and error runs with each sample set, according to the scope and the particularities of each separate work.

4. Results and Discussion

4.1. Ignition Quality Investigation

4.1.1. Effect of EHN on Ignition Quality

Figure 2 shows the effect of EHN addition on the measured DCN of 10% and 20% n-butanol (v/v) samples. The results indicate that the effect of EHN on DCN is not linear across the EHN concentration range. The introduction of EHN even at an amount as low as 0.02% (v/v) gives a significant boost of DCN. However as EHN concentration increases (even by small steps of 0.02% (v/v)), its beneficial effect gradually diminishes, and the correlation of DCN to EHN concentration acquires a linear behavior with lower slope. As indicated by the R2 values on Figure 2, the data points of the first six EHN concentrations (from 0 to 1% (v/v)) were found to be described well by a second-degree polynomial trend line, whereas, for data points with concentrations from 1% (v/v) and up, a linear trend line was found to work best.
As demonstrated by Figure 2, with a lower initial DCN, the effect of EHN as a cetane improver was lower. This is clearly indicated by the trend lines, where the slope of EHN effect on DCN of blends containing 10% (v/v) n-butanol is a lot steeper than that of blends containing 20% (v/v) n-butanol. It is important to note that one would require less than 0.15% (v/v) EHN to match the DCN of the Bu10E sample to that of ULSD (i.e., 52.3 units), but more than three times that quantity (i.e., 0.5% (v/v) of EHN) to match the DCN of the Bu20E sample to that of ULSD fuel, even if the DCN decrease caused by 20% (v/v) n-butanol (11 units DCN drop) is slightly less than twice of that caused by 10% (v/v) n-butanol (6 units DCN drop).

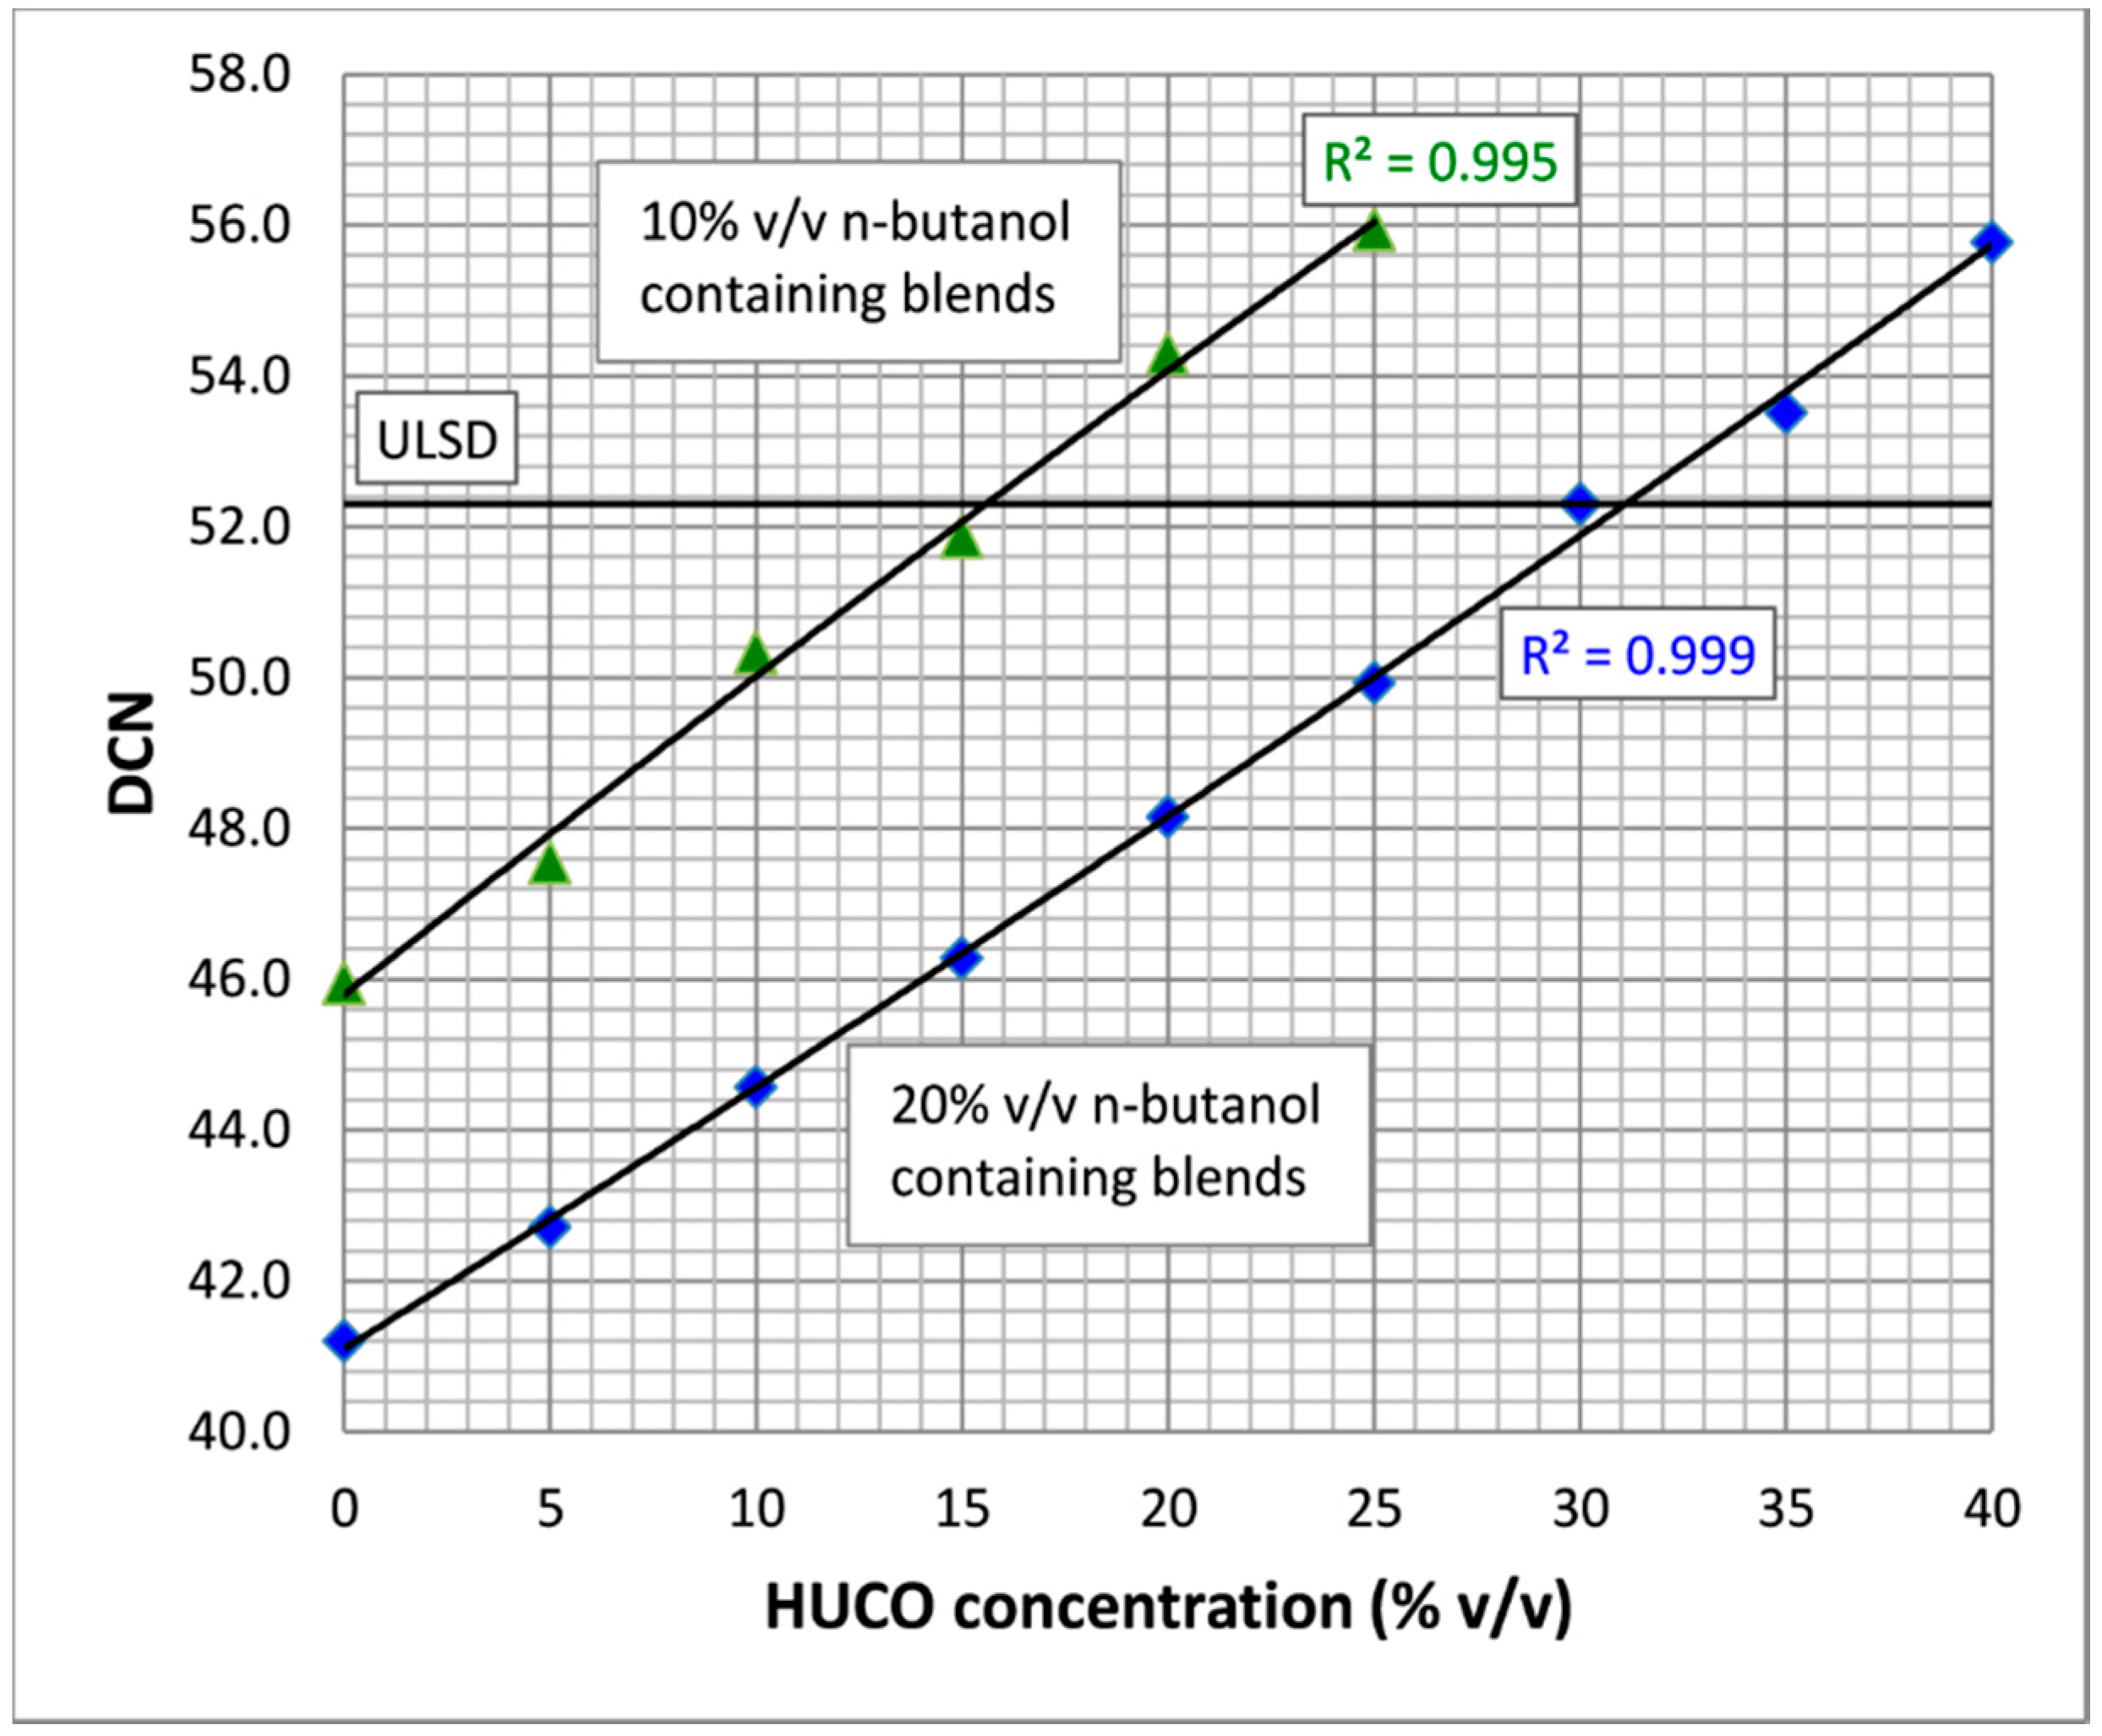
4.1.2. Effect of HUCO on Ignition Quality

Figure 3 shows the effect HUCO concentration on n-butanol–HUCO–ULSD blends. As seen, the linear behavior is much more obvious here. The better R2 values can be explained, at first, by the inconsistent nature of DCN boost that EHN provides (as shown in Figure 2) and, secondarily, by the fact that HUCO concentrations used are two orders of magnitude higher than those of EHN, in order to achieve the same DCN boost. This could have a considerable effect on the accuracy during the preparation of the sample, since the error of the amount of EHN added is more significant than that of the amount of HUCO added.
The trend lines that describe the effect on DCN as ULSD concentration decreases and HUCO concentration increases in both blends of 10% and 20% (v/v) n-butanol appear to have very similar slopes. Again, HUCO performs slightly more effectively in blends with 10% (v/v) n-butanol, but the difference is not as significant as in EHN blends.
As Figure 3 shows, the 10% (v/v) n-butanol ternary blend would require a little over 15% (v/v) HUCO to reach the DCN of baseline ULSD fuel, leading to 25% potential renewable content by volume. For the 20% (v/v) n-butanol blend, the HUCO required to reach DCN equal to that of baseline ULSD fuel would be more than 30% (v/v), leading to a total potential renewable content of more than 50% by volume.

4.2. Physicochemical Properties

4.2.1. Samples Studied

Using the data presented in Figure 2 and Figure 3, and according to Equation (1), four ternary blends (Bu10E, Bu10H, Bu20E, and Bu20H) of the same DCN value with the baseline ULSD were created. In order for these samples to exhibit as similar an ignition quality as possible, the equations of the linear correlations shown in Figure 2 and Figure 3 were used to calculate the amount of either EHN of HUCO needed to reach the desired DCN value. Detailed blend compositions are shown in Table 6.
In order to evaluate the effect of the DCN increase, one more sample (Bu10) containing only 10% (v/v) n-butanol and 90% (v/v) ULSD was tested as well. The possibility to also test a sample of 20% (v/v) n-butanol and 80% (v/v) ULSD was discarded as being of little interest and potentially harmful for the engine, since the DCN of that blend would be too low (DCN of less than 42 units, as shown in Figure 2 and Figure 3).
The physicochemical properties of the six final blends (Bu10E, Bu10H, Bu20E, Bu20H, Bu10, and ULSD) were measured and evaluated before these samples were tested in the stationary diesel engine.

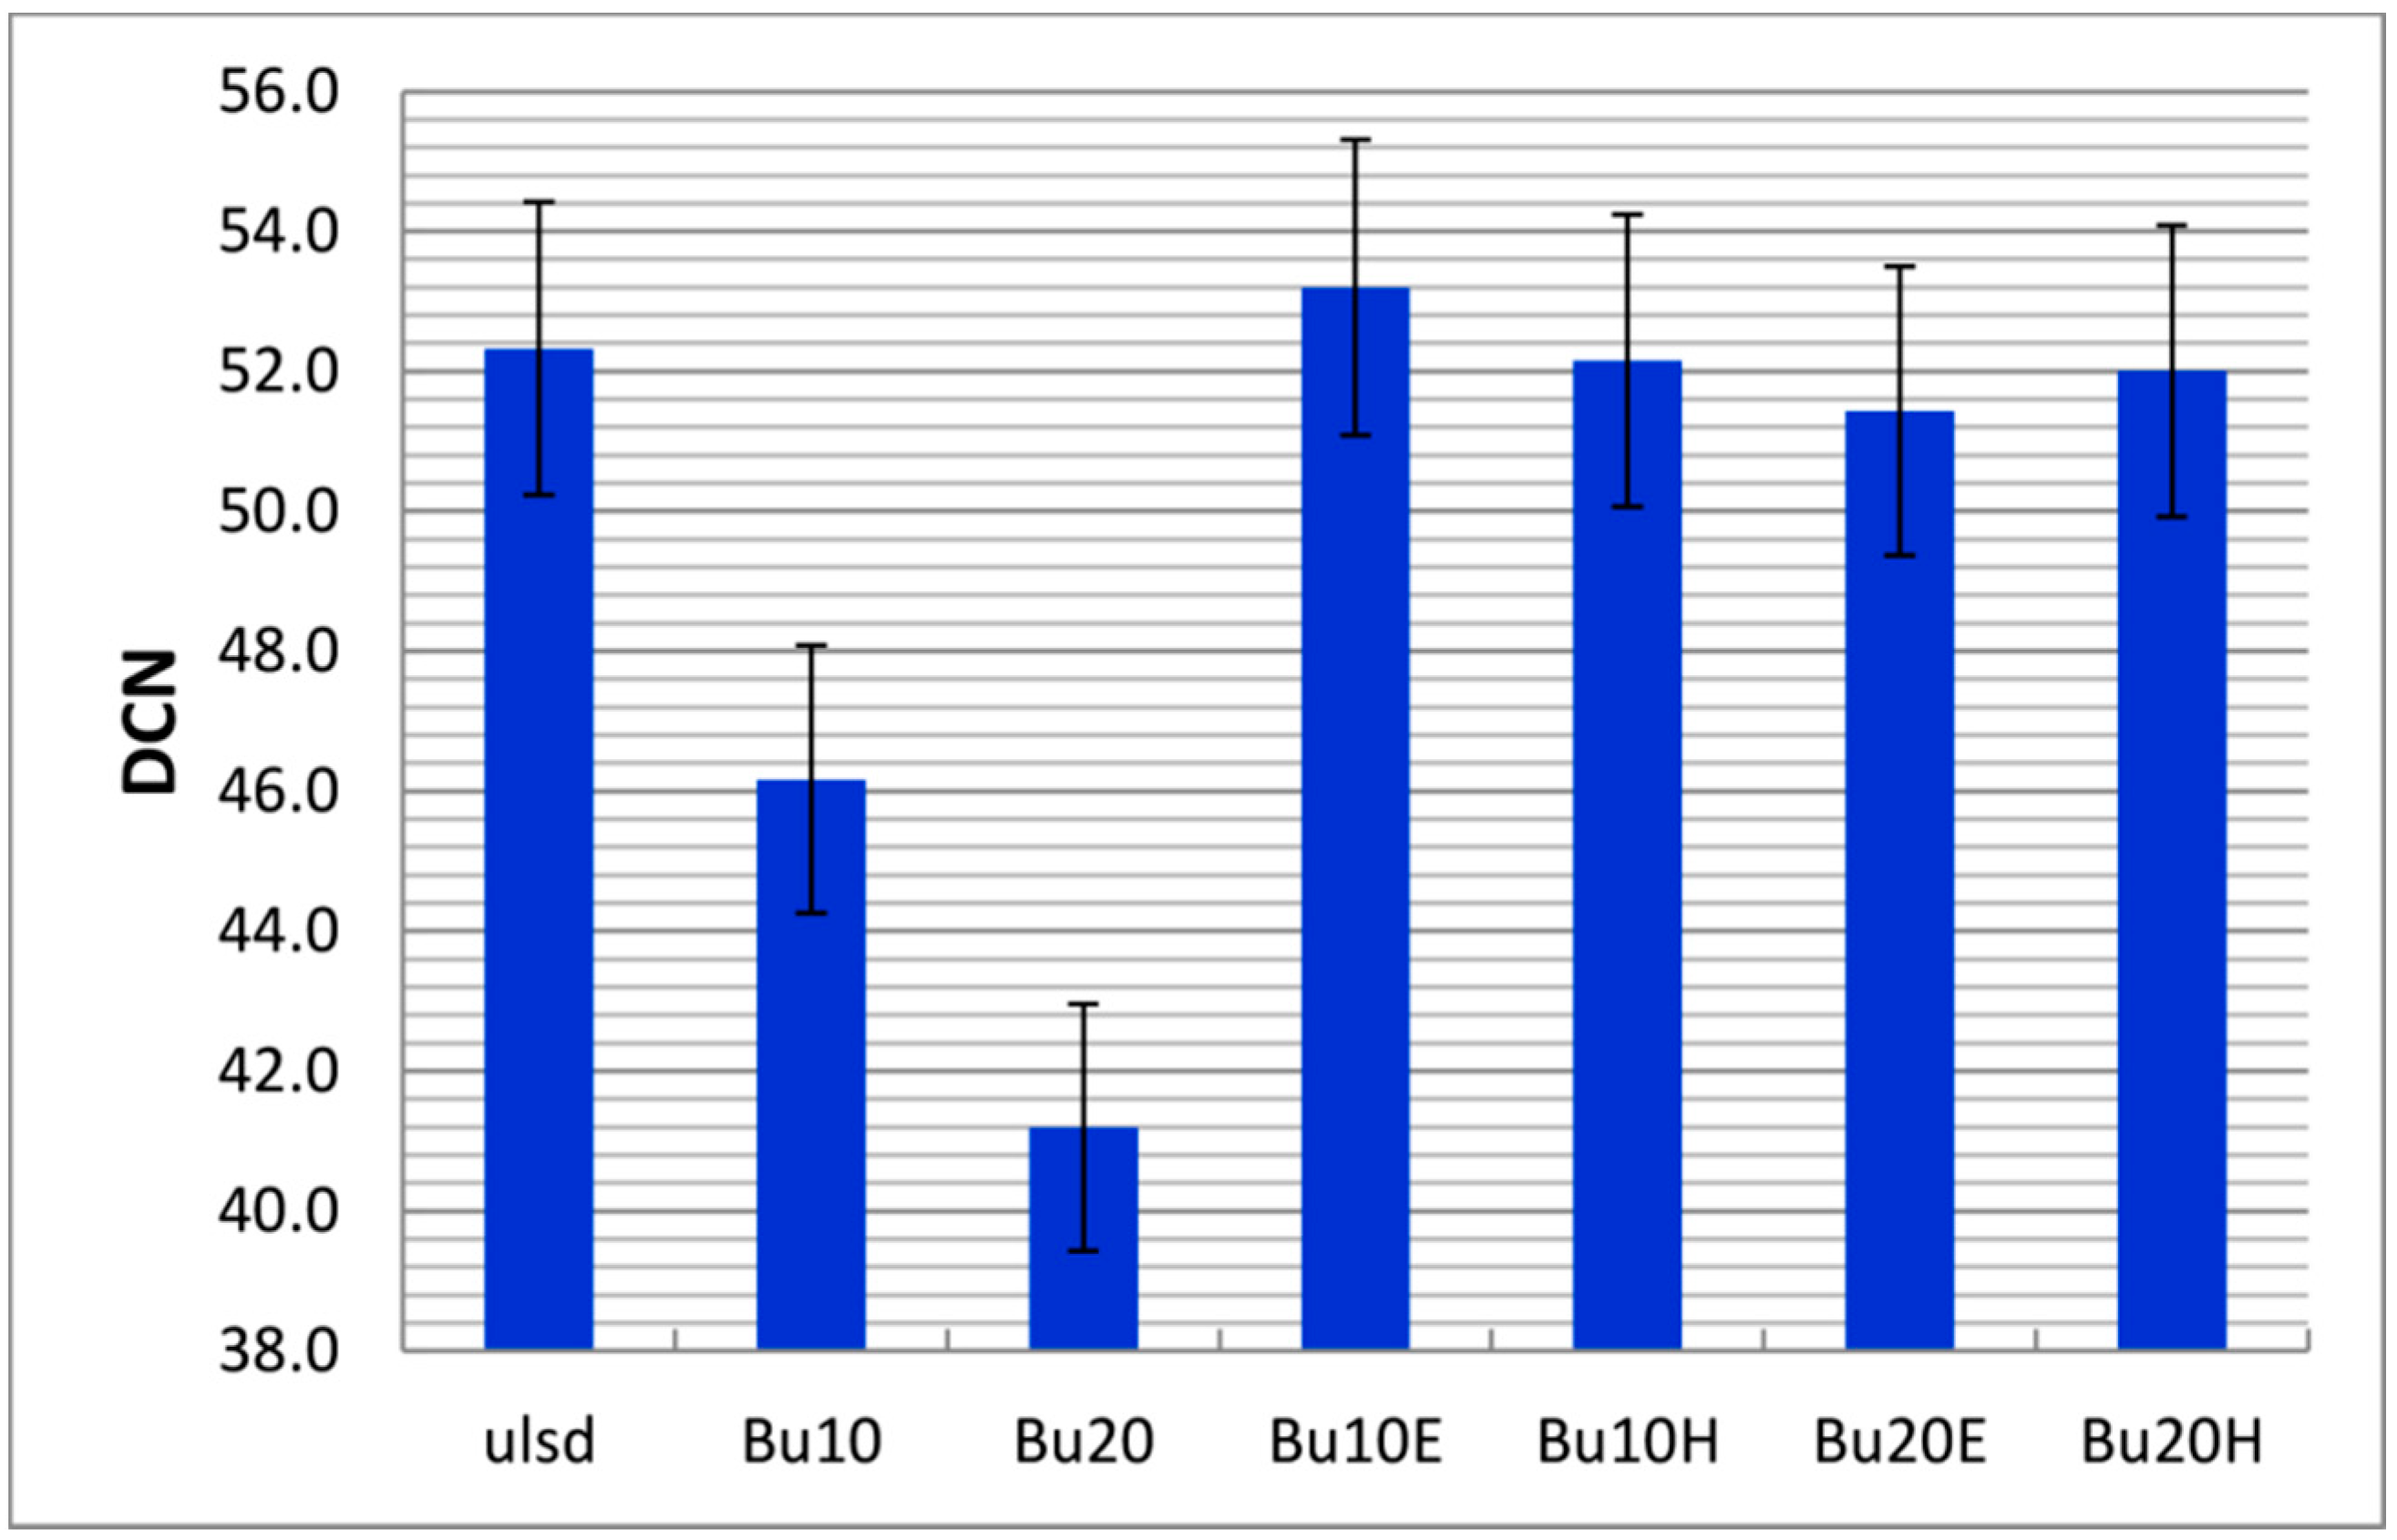
4.2.2. Ignition Quality

The DCN of the four blends containing either EHN or HUCO was measured again for verification of the linear correlations shown in Figure 2 and Figure 3. The results were found to be close to the DCN of the baseline ULSD, lying within the reproducibility limits of the method (expressed with error bars), as depicted in Figure 4.
As expected, n-butanol addition in such concentrations has a serious detrimental effect on the ignition quality of the blend, as 10% (v/v) is enough to cause a 6-unit DCN drop, and 20% (v/v) a massive 11-unit DCN drop. This comes in agreement with previous work were 10% (v/v) n-butanol caused an almost 7-unit DCN drop when blended with ULSD of slightly higher DCN [24].
As also seen earlier, it is possible to restore even massive DCN drops by adding either a classic cetane improver such as EHN in low, additive-like concentrations, or a paraffinic diesel of high cetane number, such as HUCO, as a bio-derived blending component that greatly increases the renewable content of the blend.

4.2.3. Density and Viscosity

Density and viscosity of the DCN-boosted samples are shown in Figure 5. The density of the samples was generally reduced with the addition of HUCO and n-butanol, as they both are of lower density compared to the baseline ULSD fuel. The density of the samples containing EHN as a cetane improver was slightly affected due to the n-butanol only, but those containing HUCO exhibited a much more significant density decrease. Compared to European standard EN 590, only the EHN samples were within the limits. Interestingly, the HUCO-containing samples complied with neither EN 590 nor EN 15940 limits, as they were of too low density for the first and of too high density for the latter (see Table 1). If the density of the samples was to be in compliance with either standard, maybe a ULSD of higher density should be considered, or a mixing strategy simultaneously employing EHN and HUCO as cetane improvers in order to reduce the necessary concentration of HUCO and its impact on the blend’s density.
Viscosity changed only slightly for all samples, since all three components (ULSD, n-butanol, and HUCO) were of very close viscosity values and EHN concentrations were negligible. As shown in Figure 5, the necessary concentration of HUCO to counter the effect of n-butanol on DCN also countered n-butanol’s effect on viscosity, such that ULSD, Bu10H, and Bu20H were of very close viscosities.

4.2.4. Distillation Properties

The distillation curves of the five samples with the same DCN (ULSD, Bu10E, Bu10H, Bu20E, and Bu20H) and HUCO are presented in Figure 6. The boiling point of n-butanol is represented by a horizontal line as well.
As seen, the initial boiling point of the oxygenated samples was the same as the boiling point of pure n-butanol, and the distillation continued at that temperature until all the alcohol was recovered. Then, as the heavier components (contained in ULSD) start boiling at 173 °C, the temperature rose rapidly.
Although the front-end volatility of alcohol-containing samples was significantly changed, this was not the case for mid and tail volatility, which even managed to fall within EN 590’s limits (≤60% (v/v) recovered at 250 °C, ≥85% (v/v) recovered at 350 °C, and 95% (v/v) recovered at ≤360 °C) [42].
HUCO exhibits an almost flat distillation curve from 10% to 90% (v/v) recovery range, which is to be expected taking into account that it contains mostly C17 (boiling point of 302 °C) and C18 (boiling point of 317 °C) normal paraffins (see Table 2). This had a clear effect on the middle recovery range of the HUCO-containing Bu10H and B20H (see Figure 6).

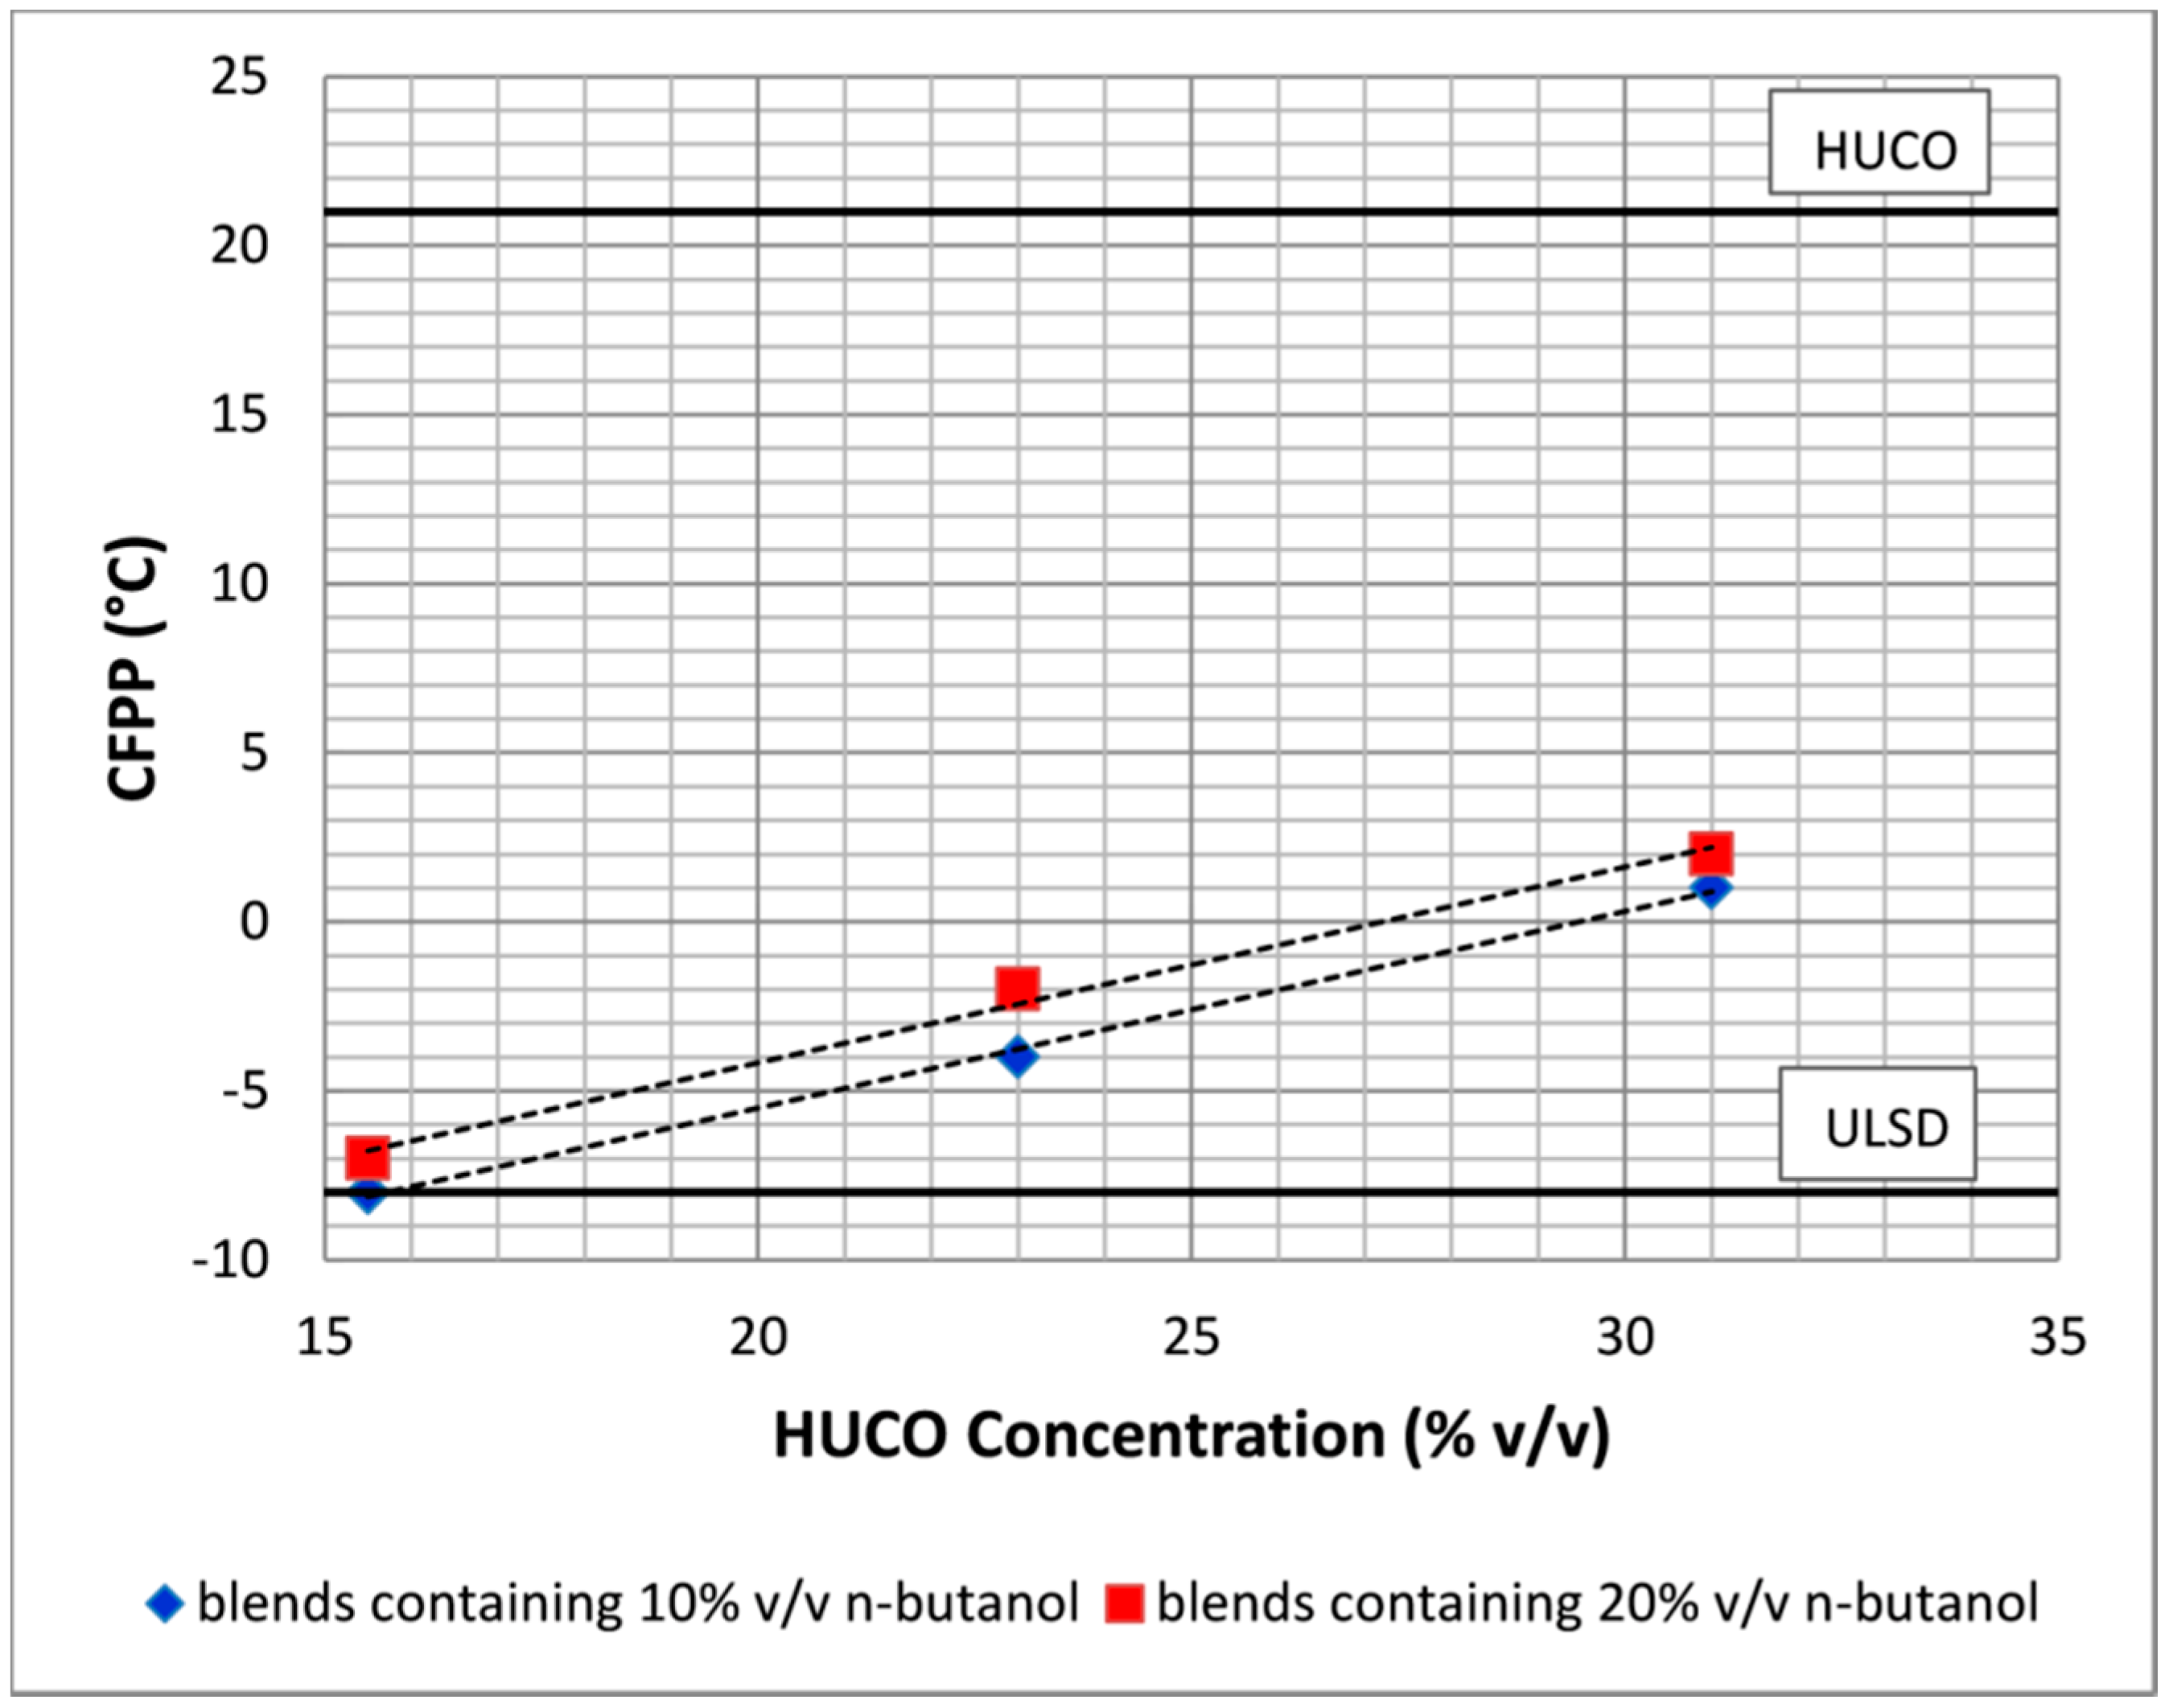
4.2.5. Cold Filter Plugging Point

The cold filter plugging point (CFPP) is a measure of how usable a fuel can be in cold weather. The CFPP of all fuels and blends is presented in Table 1. As the results demonstrated, the n-butanol concentration of 10% (v/v) in ULSD (sample Bu10) only slightly affected the CFPP (by 1 °C). In previous work, the same n-butanol concentration in ULSD of a 3 °C higher CFPP caused a 2 °C drop [24].
EHN addition did not seem to play a significant role in CFPP either, causing only slight changes (at least at these concentrations used in Bu10E and Bu20E samples).
Blends containing HUCO demonstrated a strange behavior, as Bu10H exhibited dramatically lower CFPP than that of Bu20H. For a better understanding of the phenomenon, more samples were created and their CFPP was measured. The extra samples were created according to Equation (1) and they contained n-butanol at 10% or 20% (v/v), HUCO, and ULSD. The results, shown in Figure 7, indicate that all 10% (v/v) n-butanol-containing samples exhibited a lower CFPP than all 20% (v/v) n-butanol-containing samples with the same HUCO concentrations. Judging by the CFPP of the respective blending components (n-butanol, HUCO, and ULSD; see Table 1), one would expect that, when alcohol concentration increases and ULSD decreases, the CFPP would decrease; however, the exact opposite happened instead. This can be attributed to the high polarity of the hydroxyl group of n-butanol, which could possibly promote paraffin separation in the blend at lower temperatures [43]. These blends contain a significant amount of long-chain normal paraffins due to HUCO concentration (see Table 2); thus, increasing n-butanol from 10% to 20% (v/v) could facilitate normal paraffin separation, resulting in higher CFPP.
As seen in Figure 7, the CFPP of the ternary blend seems to depend more on HUCO concentration than n-butanol concentration.
Apart from the somewhat negative effect of n-butanol in the ternary blends with HUCO and ULSD, sample Bu10H had a CFPP of less than −5 °C (which complies with EN 590’s limit for winter grade C fuel), while B20H had a CFPP of less than +5 °C (which complies with EN 590’s limit for summer grade A fuel).

4.2.6. Flash Point

Flash point was found to change dramatically with the addition of concentrations of n-butanol. As presented in Table 1, the flash point of all oxygenated samples was very close to the flash point of neat n-butanol (35 °C). This was to be expected, as the presence of more volatile components with low flash point results in a significant reduction of the flash point of ULSD [34]. This also comes in agreement with previous work, where even a slight concentration of n-butanol (specifically 2.5% (v/v)) in ULSD could result in a significant flash point drop of 20 °C [24].
Flash point is a property that classifies fuels according to safety standards during transport, storage, and handling. As also proposed in previous work, it is of absolute importance that diesel fuel blends containing n-butanol even in slight concentrations should be treated with strict safety regulations, such as those applied in the case of gasoline [24].

4.3. Engine Results

The experimental investigation concluded with testing the baseline ULSD and the five oxygenated blends on a typical stationary diesel engine operating at 1500 rpm. All fuels were tested at four engine loads of 1.5 kW (low), 3.5 kW (medium), 4.5 kW (medium–high), and 5.5 kW (high). Emissions (CO ppm, HC ppm, NOx ppm, and PM μg/L) and fuel consumption were measured as previously described in detail.
The engine ran smoothly at all loads, without obvious alteration in noise radiation during operation with ULSD and the four DCN-boosted blends.
However, since the baseline ULSD was only mediocre in terms of ignition quality (DCN of 52.3), the addition of 10% (v/v) n-butanol without a cetane improver of any kind reduced the DCN of the Bu10 blend to 46.2 and the DCN of the Bu20 blend to 41.2, as shown in Figure 4. As a result, Bu10 exhibited higher noise radiation and caused minor engine speed inconsistency, especially in medium–high and high loads. For that reason, it was considered best not to test the Bu20 sample of such a low DCN, since that would be of little research interest and could potentially cause damage to the equipment.

4.3.1. Fuel Consumption

Fuel consumption is presented in Figure 8 (error bars indicate the standard deviation of two measurements). As can been seen, the measured gravimetric fuel consumptions of the six samples for each load were very close to each other. However, the samples that had their DCN boosted with HUCO exhibited a slightly lower fuel consumption compared to their equally oxygenated counterparts containing EHN as a DCN booster. This was to be expected, since HUCO has a higher LHV than ULSD and n-butanol (see Table 1). As a result, HUCO could counterbalance the LHV drop caused by n-butanol, producing blends with LHV close to that of the baseline ULSD, thereby also keeping the gravimetric fuel consumption at the same levels.

4.3.2. Carbon Monoxide

Figure 9 presents CO emissions (error bars indicate the standard deviation of ten consequent measurements taken during 10 min). Clearly, the extra oxygen provided by n-butanol could help promote complete combustion, thus lowering CO emissions. This effect increased at higher loads, where the fuel–air ratio was higher, making the in-fuel provided oxygen more valuable.
The DCN drop caused by n-butanol when a cetane improver was not used (sample Bu10) could cause a slight increase at CO emissions at low loads (when there was enough oxygen provided by air). This CO increase faded away as the engine load increased, and the beneficial effect of the in-fuel oxygen overcame the adverse effects of the DCN drop.
Comparing the two ignition quality improving agents, it seems that they performed equally well at all loads except at 5.5 kW, where EHN managed to reduce CO emissions more than HUCO. Furthermore, at full load, the HUCO increase in the blend seemed to cause a slight increase of CO emissions. This behavior was reported on a larger scale in a previous work, where HUCO samples did not contain any oxygenate to compensate for the CO increase [39].
When the engine operated at full load, the increase of n-butanol concentration from 10% to 20% (v/v) seemed to cause no further significant reduction of CO emissions, possibly indicating a “limit” of the benefits due to fuel oxygen content.

4.3.3. Hydrocarbons

HC emissions are presented in Figure 10 (error bars indicate the standard deviation of ten consequent measurements taken during 10 min). As can been seen, the engine tended to emit less unburned HC at medium–high load which was expected as HC formation is favored in regions inside the cylinder with either insufficient temperature to support combustion (e.g., when the engine operates at low loads or during cold starts) or very high fuel–air ratios (which exist during full-load operation) [1,2].
As can be seen in Figure 10, n-butanol alone (Bu10 sample) could reduce the HC emissions. The in-fuel oxygen provided by the n-butanol could probably help promote complete combustion, but this could also be the effect of DCN drop, which caused higher peak temperatures inside the cylinder, and could reduce HC at low loads. This effect was reversed at full load when a high fuel–air ratio combined with a low DCN.
The restoration of DCN using EHN could be a reason for the HC increase with EHN concentration, at least at low load. The progressive increase of HC emissions produced by Bu10E and Bu20E samples at all other loads indicated a negative effect of EHN. On the other hand, HUCO blends showed excellent performance reducing HC emissions compared to their EHN counterparts, Bu10, and baseline ULSD fuel.

4.3.4. Nitrogen Oxides

Nitrogen oxide measurements are presented in Figure 11 (error bars indicate the standard deviation of ten consequent measurements taken during 10 min). The addition of n-butanol caused a significant increase in NOx emissions when used without a cetane improver. Previous work where a higher DCN baseline ULSD was used showed a negligible effect of 10% (v/v) n-butanol concentration [24]. However, it seems that, when using a lower DCN baseline ULSD (such as the one used in the present work), the DCN of a 10% (v/v) n-butanol concentration sample (Bu10) could be low enough to start significantly increasing the NOx emissions.
However, once DCN was restored using a cetane improver, it seems that the NOx emissions of all oxygenated samples were lower than those of baseline ULSD fuel. Comparing the two cetane-improving agents, HUCO seemed to slightly outperform EHN especially at higher loads. This beneficial behavior of HUCO was also observed in non-oxygenated, binary ULSD/HUCO blends [39].

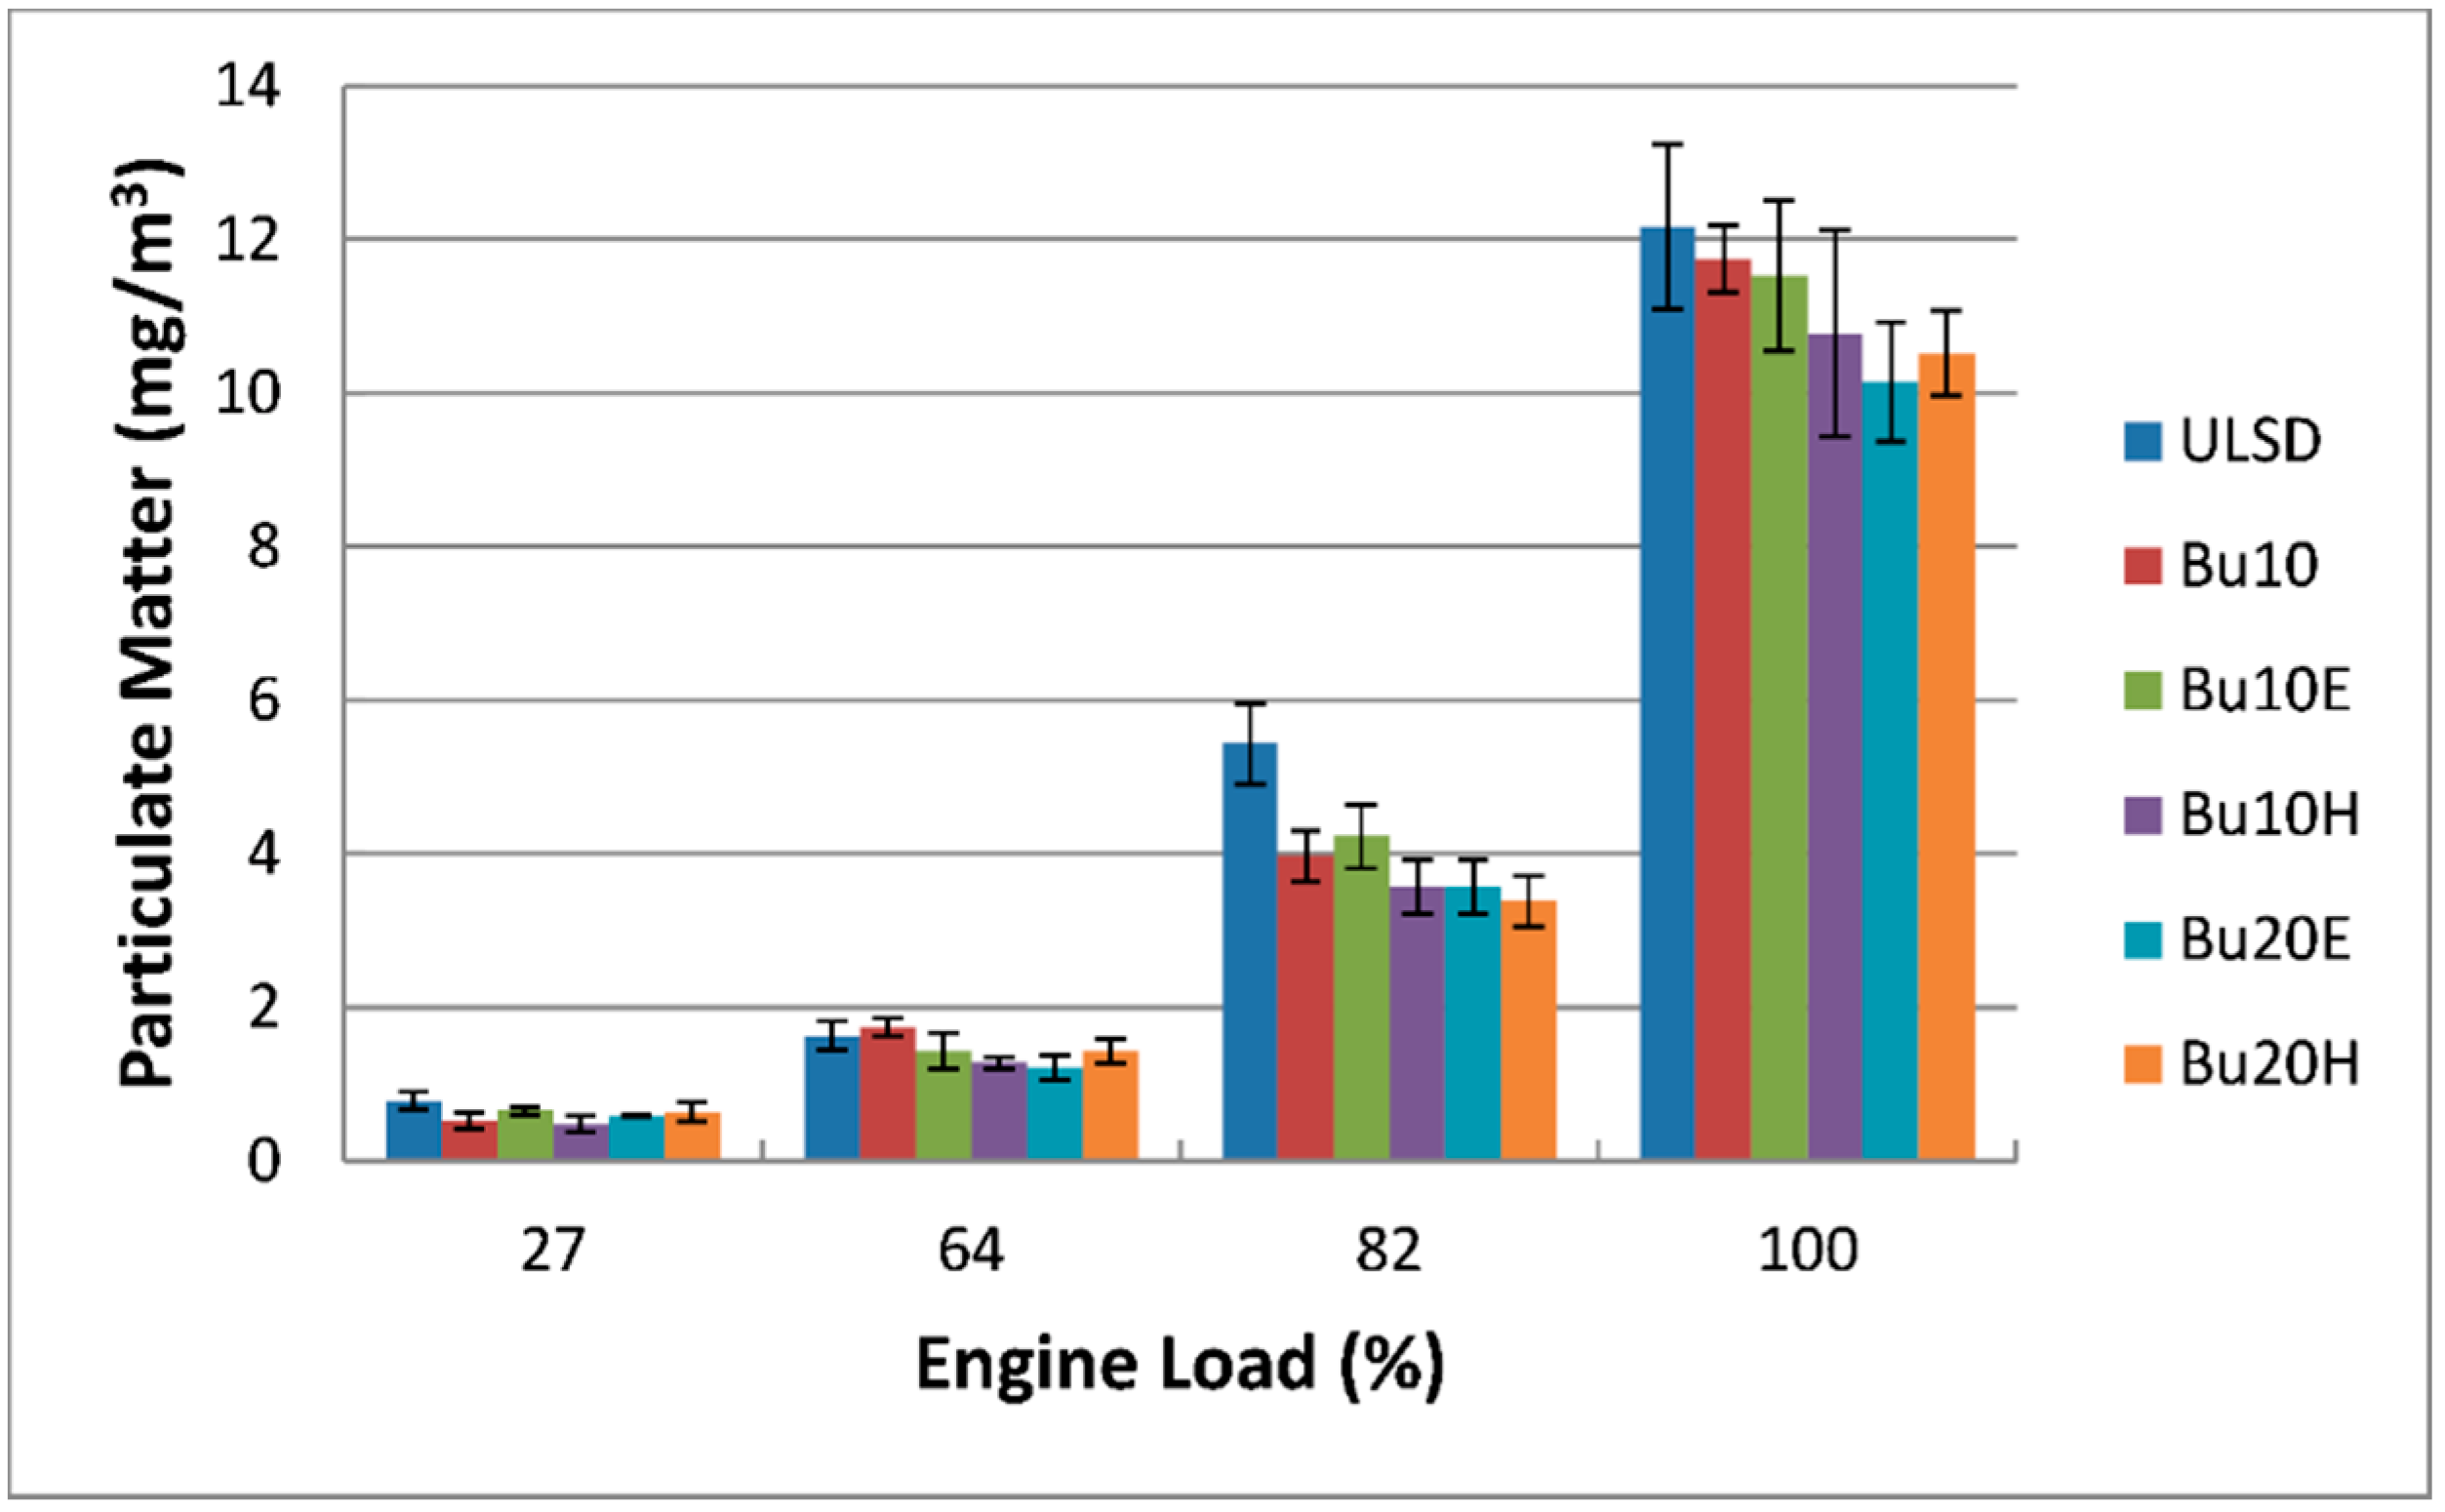
4.3.5. Particulate Matter

As shown in Figure 12 (error bars indicate the standard deviation of two measurements), oxygenated fuel had a beneficial effect on particulate matter (PM) emissions. This was to be expected since many researchers also found similar results [8,21,24,28]. A slightly positive effect of DCN improvement on the oxygenated blends was also apparent, but mostly in higher loads. Bu10, compared to Bu10E and Bu10H, produced slightly more PM in mid-to-full loads. This beneficial effect could be amplified if the engine was not of fixed speed and could run at higher rpm. As the engine speed increases, the available time for combustion inside the cylinder decreases, making the fuel’s ignition quality characteristics more valuable [44].
Comparing the two cetane improvers, HUCO seemed to perform a little better than EHN. However, a high concentration of HUCO (sample Bu20H) performed worse than Bu20E at full load. This negative effect was also observed in previous work, where HUCO was blended with ULSD only [39]. In the present work, however, it seems that the presence of n-butanol helped mitigate this negative effect to a great extent.

5. Conclusions

In the present work, an effort was made to overcome ignition quality issues of blends with n-butanol and ULSD using either a routinely employed cetane improver (EHN) or a high-CN paraffinic biofuel (HUCO). Blends containing 10% and 20% n-butanol were created, and their cetane numbers were boosted to match that of the neat baseline ULSD by adding either cetane improver, simultaneously keeping the alcohol volume concentration constant (cetane boosters replaced the ULSD volume share only). Two binary blends with 10% and 20% (v/v) n-butanol and ULSD were prepared as well for comparative reasons.
The investigation on the DCN boost achieved by either cetane-improving agent showed that HUCO addition increased DCN in a steady, linear manner, while EHN was more effective up to 0.8% (v/v) concentration before the DCN boost it provided diminished and also switched to a linear behavior. It was also found that HUCO was most effective as a cetane improver for both 10% and 20% (v/v) n-butanol concentrations. EHN, on the other hand, performed more effectively for the first 0.8% (v/v) boosting the lower DCN blend (with 20% (v/v) n-butanol), while, for greater concentrations (more than 1% (v/v) EHN), it was slightly more effective boosting the higher DCN blend (with 10% (v/v) n-butanol).
The investigation of physicochemical properties showed that minor changes compared to ULSD are to be expected when using EHN as a cetane improver for both 10% and 20% (v/v) n-butanol-containing samples (Bu10E and Bu20E). HUCO, however, as a fuel containing almost exclusively long-chain normal paraffins, could significantly change the density and CFPP properties. This is because EHN was needed in additive range concentrations (less than 1% (v/v)), while HUCO needed to be blended in higher concentrations (about 15% (v/v) for 10% (v/v) n-butanol-containing samples, and about 31% for 20% (v/v) n-butanol-containing samples). Flash point was also greatly reduced due to n-butanol addition in all samples.
The engine performance assessment showed that all four oxygenated blends with the same DCN as the baseline ULSD caused no problems during engine operation whatsoever. However, the non-boosted 10% (v/v) n-butanol-containing sample caused minor engine speed inconsistency and higher noise radiation. An investigation of the exhaust emissions showed that n-butanol addition in ULSD of moderate ignition quality could increase NOx and also reduce the potential positive effects of oxygenated fuel. The employment of a cetane booster to restore the ignition quality of n-butanol/ULSD blends is, therefore, of significant importance.
Comparing the two cetane-improving agents used, the results showed that EHN could be “transparent” with respect to physicochemical properties of the final oxygenated blend. On the other hand, HUCO could drastically change some properties, such as density and CFPP, but it also greatly increased the renewable energy content of the blend. Blends boosted with HUCO also exhibited slightly lower HC, NOx, and PM emissions.

Author Contributions

I.Z.-S. was responsible for conceptualization, methodology, investigation, experiments, and writing—original draft preparation. V.K. was responsible for investigation and experiments. D.K. was responsible for conceptualization, writing—review and editing, and supervision.

Funding

This research received no external funding.

Conflicts of Interest

The authors declare no conflicts of interest.

References

  1. Mollenhauer, K.; Tschoeke, H. Handbook of Diesel Engines; Springer: Berlin/Heidelberg, Germany, 2010. [Google Scholar]
  2. Rakopoulos, C.D.; Giakoumis, E.G. Diesel Engine Transient Operation; Springer: London, UK, 2009. [Google Scholar]
  3. Knothe, G.; Krahl, J.; Gerpen, J. The Biodiesel Handbook, 2nd ed.; Academic Press: Cambridge, MA, USA; AOCS Press: Urbana, IL, USA, 2010; ISBN 9780983507260. [Google Scholar]
  4. Fayyazbakhsh, A.; Pirouzfar, V. Comprehensive overview on diesel additives to reduce emissions, enhance fuel properties and improve engine performance. Renew. Sustain. Energy Rev. 2017, 74, 891–901. [Google Scholar] [CrossRef]
  5. Bergthorson, J.M.; Thomson, M.J. A review of the combustion and emissions properties of advanced transportation biofuels and their impact on existing and future engines. Renew. Sustain. Energy Rev. 2015, 42, 1393–1417. [Google Scholar] [CrossRef]
  6. Lapuerta, M.; Villajos, M.; Agudelo, J.R.; Boehman, A.L. Key properties and blending strategies of hydrotreated vegetable oil as biofuel for diesel engines. Fuel Process. Technol. 2011, 92, 2406–2411. [Google Scholar] [CrossRef]
  7. Demirbas, A. Progress and recent trends in bio-fuels. Prog. Energy Combust. Sci. 2007, 33, 1–18. [Google Scholar] [CrossRef]
  8. Rakopoulos, C.D.; Hountalas, D.T.; Zannis, T.C.; Levendis, Y.A. Operational and Environmental Evaluation of Diesel Engines Burning Oxygen-Enriched Intake Air or Oxygen-Enriched Fuels: A Review; SAE Technical Paper 2004-01-2924; SAE International: Warrendale, PA, USA, 2004. [Google Scholar]
  9. Bhardwaj, O.; Omari, A.; Nuottimäki, J.; Hervé, R. Optimizing Engine Calibration for Renewable Diesel Fuels. MTZ Worldw. 2018, 79, 26–33. [Google Scholar] [CrossRef]
  10. Ozgur, C.; Kadir, A. Effects of SCR System on NOx Reduction in Heavy Duty Diesel Engine Fuelled with Diesel and Alcohol Blends. Adv. Automob. Eng. 2016, 5, 139. [Google Scholar] [CrossRef]
  11. Li, G.; Zhang, C.; Li, Y. Effects of diesel injection parameters on the rapid combustion and emissions of an HD common-rail diesel engine fueled with diesel-methanol dual-fuel. Appl. Therm. Eng. 2016, 108, 1214–1225. [Google Scholar] [CrossRef]
  12. Shi, Y.; Reitz, R.D. Optimization of a heavy-duty compression–ignition engine fueled with diesel and gasoline-like fuels. Fuel 2010, 89, 3416–3430. [Google Scholar] [CrossRef]
  13. Abu-Jrai, A.; Rodríguez-Fernández, J.; Tsolakis, A.; Megaritis, A.; Theinnoi, K.; Cracknell, R.F.; Clark, R.H. Performance, combustion and emissions of a diesel engine operated with reformed EGR. Comparison of diesel and GTL fuelling. Fuel 2009, 88, 1031–1041. [Google Scholar] [CrossRef] [Green Version]
  14. Aatola, H.; Larmi, M.; Sarjovaara, T.; Mikkonen, S. Hydrotreated Vegetable Oil (HVO) as a Renewable Diesel Fuel: Trade-off between NOx, Particulate Emission, and Fuel Consumption of a Heavy Duty Engine. SAE Int. J. Engines 2009, 1, 1251–1262. [Google Scholar] [CrossRef]
  15. Carmona, H.P.; Horáček, J.; Alayón, A.B.; Hernández, J.J.M. Suitability of used frying oil for co-processing with atmospheric gas oil. Fuel 2018, 214, 165–173. [Google Scholar] [CrossRef]
  16. Tyrovola, T.; Dodos, G.; Kalligeros, S.; Zannikos, F. The Introduction of Biofuels in Marine Sector. J. Environ. Sci. Eng. A 2017, 6, 415–421. [Google Scholar] [CrossRef]
  17. Peter Baladincz, P.; Hancsók, J. Fuel from waste animal fats. Chem. Eng. J. 2015, 282, 152–160. [Google Scholar] [CrossRef]
  18. Chiaramonti, D.; Buffi, M.; Rizzo, A.M.; Prussi, M.; Martelli, F. Bio-Hydrocarbons through Catalytic Pyrolysis of Used Cooking Oils: Towards sustainable jet and road fuels. Energy Procedia 2015, 82, 343–349. [Google Scholar] [CrossRef]
  19. Bezergianni, S. Catalytic Hydroprocessing of Liquid Biomass for Biofuels Production. Liquid, Gaseous and Solid Biofuels—Conversion Techniques; INTECH: London, UK, 2013; Chapter 9; pp. 299–326. ISBN 978-953-51-1050-7. [Google Scholar]
  20. Naik, S.N.; Goud, V.V.; Rout, O.J.; Dalai, A.K. Production of first and second generation biofuels: A comprehensive review. Renew. Sustain. Energy Rev. 2010, 14, 578–597. [Google Scholar] [CrossRef]
  21. Yusri, I.M.; Mamat, R.; Najafi, G.; Razman, A.; Awad, O.I.; Azmi, W.H.; Ishak, W.F.W.; Shaiful, A.I.M. Alcohol based automotive fuels from first four alcohol family in compression and spark ignition engine: A review on engine performance and exhaust emissions. Renew. Sustain. Energy Rev. 2017, 77, 169–181. [Google Scholar] [CrossRef]
  22. Lapuerta, M.; Contreras, R.G.; Fernández, J.C.; Dorado, M.P.D. Stability, Lubricity, Viscosity, and Cold-Flow Properties of Alcohol-Diesel Blends. Energy Fuels 2010, 24, 4497–4502. [Google Scholar] [CrossRef]
  23. Ecklund, E.E.; Bechtold, R.L.; Timbario, T.J.; McCallum, P.W. State-of-the-Art Report on the Use of Alcohols in Diesel Engines; SAE Technical Paper 840118; SAE International: Warrendale, PA, USA, 1984. [Google Scholar]
  24. Zahos-Siagos, I.; Antonerias, A.; Karonis, D. Impact of Ethanol and N-Butanol Addition on Fuel Properties and Exhaust Emissions of a Stationary Diesel Engine. J. Energy Eng. 2018, 144. [Google Scholar] [CrossRef]
  25. Iannuzzi, S.E.; Barro, C.; Boulouchos, K.; Burger, J. Combustion behavior and soot formation/oxidation of oxygenated fuels in a cylindrical constant volume chamber. Fuel 2016, 167, 49–59. [Google Scholar] [CrossRef]
  26. Delfort, B.; Durand, I.; Jaecker-Voirol, A.; Lacôme, T.; Paillé, F.; Montagne, X. Oxygenated Compounds and Diesel Engine Pollutant Emissions Performances of New Generation of Products; SAE Technical Paper 2002-01-2582; SAE International: Warrendale, PA, USA, 2002. [Google Scholar]
  27. Naegeli, D.W.; Moulton, S.; Owens, E.C.; Frame, E.A. Oxygenates for Advanced Petroleum-Based Diesel Fuels; InterimReport, TFLRF No.357; U.S. Army TARDEC Fuels and Lubricants Research Facility, Southwest Research Institute: San Antonio, TX, USA, 2001.
  28. Giakoumis, E.G.; Rakopoulos, C.D. Exhaust emissions with ethanol or n-butanol diesel fuel blends during transient operation: A review. Renew. Sustain. Energy Rev. 2013, 17, 170–190. [Google Scholar] [CrossRef]
  29. Hansen, A.C.; Zhang, Q.; Lyne, P.Q.L. Ethanol-diesel fuel blends: A review. Bioresour. Technol. 2005, 96, 277–285. [Google Scholar] [CrossRef] [PubMed]
  30. Corkwell, K.C.; Jackson, M.; Daly, D.T. Review of Exhaust Emissions of Compression Ignition Engines Operating on E Diesel Fuel Blends; SAE Technical Paper 2003-01-3283; SAE International: Warrendale, PA, USA, 2003. [Google Scholar]
  31. Verhelst, S.; Turner, J.; Sileghem, L.; Vancoillie, J. Methanol as a fuel for internal combustion engines. Prog. Energy Combust. Sci. 2019, 70, 43–88. [Google Scholar] [CrossRef]
  32. Chao, J.; Mingfa, Y.; Haifeng, L.; Chia-fon, L.; Jing, J. Progress in the production and application of n-butanol as a biofuel. Renew. Sustain. Energy Rev. 2011, 15, 4080–4106. [Google Scholar] [CrossRef]
  33. Dodos, G.; Tsesmeli, C.; Zahos-Siagos, I.; Tyrovola, T.; Karonis, D.; Zannikos, F. Evaluation of the Stability and Ignition Quality of Diesel-Biodiesel-Butanol Blends; SAE Technical Paper 2017-01-2320; SAE International: Warrendale, PA, USA, 2017. [Google Scholar] [CrossRef]
  34. Torres-Jimenez, E.; Jerman, M.S.; Gregorc, A.; Lisec, I.; Dorado, M.P.; Kegl, B. Physical and chemical properties of ethanol–diesel fuel blends. Fuel 2011, 90, 795–802. [Google Scholar] [CrossRef]
  35. Horng-Jang, L.; Yi-Huah, L.; Chia-Ling, T.; Hua-Hsuan, H.; Jia-Huey, L. A mathematical model for predicting the flash point of binary solutions. J. Loss Prev. Process Ind. 2002, 15, 429–438. [Google Scholar] [CrossRef]
  36. Nylund, N.O.; Erkkilä, K.; Ahtiainen, M.; Murtonen, T.; Saikkonen, P.; Amberla, A.; Aatola, H. Optimized Usage of NExBTL Renewable Diesel Fuel; VTT Tiedotteita—Research Notes 2604; OPTIBIO: Espoo, Finland, 2011; ISBN 978-951-38-7794-1. [Google Scholar]
  37. Shivananda, S.A.; Dasappa, S. Biomass to liquid transportation fuel via Fischer Tropsch synthesis—Technology review and current scenario. Renew. Sustain. Energy Rev. 2016, 58, 267–286. [Google Scholar] [CrossRef]
  38. Dry, M.E. The Fischer–Tropsch process: 1950–2000. Catal. Today 2002, 71, 227–241. [Google Scholar] [CrossRef]
  39. Zahos-Siagos, I.; Karonis, D. Exhaust Emissions and Physicochemical Properties of Hydrotreated Used Cooking Oils in Blends with Diesel Fuel. Int. J. Chem. Eng. 2018, 2018, 4308178. [Google Scholar] [CrossRef]
  40. BIOFUELS-2G—Demonstration of a Sustainable & Effective 2nd Generation Biofuels Application in an Urban Environment. Available online: http://biofuels2g.gr/index.php?lang=en (accessed on 20 September 2018).
  41. Bezergianni, S.; Dimitriadis, A.; Sfetsas, T.; Kalogianni, A. Hydrotreating of waste cooking oil for biodiesel production. Part II: Effect of temperature on hydrocarbon composition. Bioresour. Technol. 2010, 101, 7658–7660. [Google Scholar] [CrossRef] [PubMed]
  42. European Committee for Standardization (CEN). Automotive Fuels—Diesel—Requirements and Test Methods; EN 590:2013; NSAI: Dublin, Ireland, 2017. [Google Scholar]
  43. Claudy, P.; Létoffé, J.M.; Bonardi, B.; Vassilakis, D.; Damin, B. Interactions between N-Alkanes and Cloud Point-Cold Filter Plugging Point Depressants in a Diesel Fuel. A Thermodynamic Study. Fuel 1993, 72, 821–827. [Google Scholar] [CrossRef]
  44. Yanowitz, J.; Murphy, M.J.; Taylor, J.D.; Mccormick, R.L. Compendium of Experimental Cetane Number Data; Technical Report NREL/TP-5400-61693; NREL: Golden, CO, USA, 2014. [Google Scholar]
Figure 1. Experimental set-up diagram [39].
Energies 11 03413 g001
Figure 2. The 2-ethylhexyl nitrate (EHN) effect on derived cetane number (DCN) of 10% and 20% (v/v) n-butanol blends.
Energies 11 03413 g002
Figure 3. Hydrotreated used cooking oil (HUCO) effect on DCN of 10% and 20% (v/v) n-butanol blends.
Energies 11 03413 g003
Figure 4. Measured DCN values of blends studied.
Energies 11 03413 g004
Figure 5. Density and viscosity of the studied fuels with the same DCN (Bu10E, Bu10H, Bu20E, and Bu20H, where the number refers to the percentage (v/v) n-butanol, E refers to EHN, and H refers to HUCO.
Energies 11 03413 g005
Figure 6. Distillation properties of fuels and blends used.
Energies 11 03413 g006
Figure 7. Cold filter plugging point (CFPP) of ternary blends containing n-butanol, ULSD, and HUCO according to Equation (1).
Energies 11 03413 g007
Figure 8. Gravimetric fuel consumption of the six fuels with the same DCN.
Energies 11 03413 g008
Figure 9. Carbon monoxide emissions of the six fuels with the same DCN.
Energies 11 03413 g009
Figure 10. Hydrocarbon emissions of the six fuels with the same DCN.
Energies 11 03413 g010
Figure 11. Nitrogen oxide emissions of the six fuels with the same DCN.
Energies 11 03413 g011
Figure 12. Particulate matter emissions of the six fuels with the same DCN.
Energies 11 03413 g012
Table 1. Measured properties of fuels and samples.
PropertyULSDHUCOn-ButanolBu10Bu10EBu10HBu20EBu20HUnitEN 590 LimitsEN 15940 Limits (Class A)Method
MinMaxMinMax
Oxygen content00222.22.22.24.34.3% (w/w)
Density824.7 ± 0.10790.8 ± 0.08813.6 ± 0.11823.1 ± 0.09823.0 ± 0.12816.3 ± 0.10822.3 ± 0.08808.8 ± 0.11kg/m3, 15 °C820.0845.0765.0800.0EN ISO 12185
Viscosity2.567 ± 0.0023.704 ± 0.0032.267 ± 0.0012.305 ± 0.0022.299 ± 0.0022.474 ± 0.0022.213 ± 0.0022.499 ± 0.002mm2/s, 40 °C2.0004.5002.0004.500ASTM D7042
IBP a173.4 ± 1.4254.8 ± 1.0 116.7 ± 0.8116.7 ± 0.9117.5 ± 1.0116.7 ± 1.0115.7 ± 1.2°C EN ISO 3405
T10 b199.9 ± 1.3292.0 ± 0.8 171.3 ± 1.3172.4 ± 1.2127.2 ± 1.2130.0 ± 1.0118.6 ± 1.1°C EN ISO 3405
T50 b269.8 ± 0.8298.1 ± 0.7 260.8 ± 0.8260.9 ± 0.8274.1 ± 0.7251.6 ± 0.7279.7 ± 0.7°C EN ISO 3405
T90 b336.3 ± 1.0310.9 ± 0.9 333.2 ± 1.0332.9 ± 0.9326.1 ± 0.9332.9 ± 1.0317.8 ± 1.1°C EN ISO 3405
T95 b354.9 ± 1.2322.2 ± 1.1 350.8 ± 1.1350.5 ± 1.2345.4 ± 1.1350.5 ± 1.1340.0 ± 1.0°C 360 360EN ISO 3405
FBP c362.0 ± 1.8349.1 ± 1.3 359.1 ± 1.4359.3 ± 1.4354.4 ± 1.5359.3 ± 1.5347.6 ± 1.6°C EN ISO 3405
Boiling point 118 °C
DCN d52.3 ± 0.3102.7 ± 0.5~2546.2 ± 0.353.2 ± 0.552.2 ± 0.351.4 ± 0.052.0 ± 0.2 51.0 70.0 ASTM D7170
LHV e43.3 ± 0.1043.7 ± 0.0933.1 ± 0.1042.1 ± 0.1142.1 ± 0.1242.3 ± 0.1141.1 ± 0.1241.4 ± 0.12MJ/kg ASTM D240
CFPP f−8 ± 0.521 ± 0.5<−50−9 ± 0.8−8 ± 0.8−8 ± 1.0−8 ± 0.82 ± 0.5°C −5 −5EN 116
Flash point67 ± 0.6>10035 ± 0.537 ± 0.537 ± 0.537 ± 0.536 ± 0.636 ± 1.0°C55.0 55.0 EN ISO 2719
a Initial boiling point; b recovery temperatures of specified volumetric percentage ratio; c final boiling point; d derived cetane number; e lower heating value; f cold filter plugging point. ULSD—ultra-low-sulfur diesel; HUCO—hydrotreated used cooking oil; Bu10—10% n-butanol (v/v) mix; Bu10E—10% n-butanol (v/v) mix with 2-ethylhexyl nitrate (EHN); Bu10H—10% n-butanol (v/v) mix with HUCO; Bu20E—20% n-butanol (v/v) mix with EHN; Bu20H—20% n-butanol (v/v) mix with HUCO; EN—European standards; ISO—International Organization for Standardization; ASTM—American Society for Testing and Materials.
Table 2. Composition of HUCO used (%, w/w) [41].
Carbon NumberNormal ParaffinsIso-Paraffins
C157.80.0
C167.05.9
C1741.85.0
C1830.61.0
Table 3. Technical specifications of engine–generator [24,39].
DescriptionTypes, Value and Unit
Fuel injectionDirect
Number of cylinders2, inline
AspirationNatural
Displacement0.93 liters
Compression ratio18.5:1
Speed1500 rpm
CoolingLiquid-cooled
AlternatorBrushless
Electrical output power5.6 kW, 50 Hz
Table 4. Gas analyzer specifications [24,39]. HC—hydrocarbons.
Measured VariableResolutionMeasurement RangeAccuracy
Exhaust gas temperature0.1 °C0–1100 °C1.0 °C ± 0.3%
CO1 ppm0–2000 ppm±5 ppm when <100 ppm
±5% when >100 ppm and <2000 ppm
±10% when >2000 ppm
CO20.1%0–10%±5%
HC1 ppm0–5000 ppm±5%
NO1 ppm0–1000 ppm±5 ppm when <100 ppm
±5% when >100 ppm and <1000 ppm
±10% when >1000 ppm
NO21 ppm0–100 ppm±5 ppm when <100 ppm
±10% when >100 ppm
Table 5. Engine loads used.
LoadTorque (N·m)Speed (rpm)Power (kW)
Low9.615001.5
Medium22.315003.5
Medium–high28.715004.5
Full35.015005.5
Table 6. Detailed composition of created blends.
PropertyBu10Bu10EBu10HBu20EBu20HUnit
n-Butanol content1010102020% (v/v)
EHN content00.1300.520% (v/v)
HUCO content0016031% (v/v)
ULSD content90~9074~8049% (v/v)

