The PurdueTracer: An Energy-Efficient Human-Powered Hydraulic Bicycle with Flexible Operation and Software Aids
by
 , ,
, ,
Gianluca Marinaro
1,* ,
,
Zhuangying Xu
2,
Zhengpu Chen
3,
Chenxi Li
3,
Yizhou Mao
2 and
Andrea Vacca
2,3,4 1
Department of Industrial Engineering, University Federico II, 80100 Naples, Italy
2
School of Mechanical Engineering, Purdue University, West Lafayette, IN 47906, USA
3
Department of Agricultural and Biological Engineering, Purdue University, West Lafayette, IN 47906, USA
4
Maha Fluid Power Research Center, Purdue University, West Lafayette, IN 47906, USA
*
Author to whom correspondence should be addressed.
Energies 2018, 11(2), 305; https://doi.org/10.3390/en11020305
Submission received: 8 January 2018
/
Revised: 24 January 2018
/
Accepted: 26 January 2018
/
Published: 31 January 2018
Abstract
:Hydrostatic transmissions (HT) are widely applied to heavy-duty mobile applications because of the advantages of layout flexibility, power to weight ratio, and ease of control. Though applications of fluid power in light-duty vehicles face challenges, including the unavailability of off-the-shelf components suitable to the power scale, there are potential advantages for HTs in human-powered vehicles, such as bicycles, the most important one being the energy-saving advantage achievable through regenerative braking in a hybrid HT. This paper describes an innovative design for a hydraulic hybrid bicycle, i.e., the PurdueTracer. The PurdueTracer is an energy-efficient human-powered hydraulic bicycle with flexible operation and software aids. An open-circuit hydraulic hybrid transmission allows PurdueTracer to operate in four modes: Pedaling, Charging, Boost, and Regeneration, to satisfy users’ need for different riding occasions. An aluminum chassis that also functions as a system reservoir was customized for the PurdueTracer to optimize the durability, riding comfort, and space for components. The selection of the hydraulic components was performed by creating a model of the bicycle in AMESim simulation software and conducting a numerical optimization based on the model. The electronic system equipped users with informative feedback showing the bicycle performance, intuitive execution of functions, and comprehensive guidance for operation. This paper describes the design approach and the main results of the PurdueTracer, which also won the 2017 National Fluid Power Association Fluid Power Vehicle Challenge. This championship serves to prove the excellence of this vehicle in terms of effectiveness, efficiency, durability, and novelty.
1. Introduction
Fluid power technology has advantages of layout flexibility, a good power to weight ratio, and ease of control that are well reflected in hydrostatic transmissions and have been successfully applied in many heavy-duty applications including construction, agricultural, forestry and military machines, etc. However, the integration of fluid power technology into light-duty applications still presents significant challenges, especially for human-powered vehicles, such as bicycles. Most of the challenges relate to the unavailability of hydraulic pumps and motors suitable to the power scale and range of operating conditions typical of such applications.
Notwithstanding, there are potential advantages to fluid power in human-powered vehicles. In particular, with respect to traditional “pure mechanical” bicycles based on the chain sprocket transmission system, the use of a hybrid hydrostatic transmission allows for energy recovery during braking phases and enables power management strategies, which decouple the human power input from the instantaneous power request given by the vehicle resistance. In particular, the energy stored within the transmission system during phases of braking or of excessive input energy could be utilized in subsequent phases, such as vehicle starts or uphill pedaling conditions, to assist the cyclist. Moreover, a properly designed fluid power system can avoid the typical disadvantages of chain drives, which are:
- The safety risk to the rider in the form of entangling clothing in the chain and the sprocket due to the fact that the chain drive is typically exposed;
- The undesirable occurrence in variable-speed bicycles of shifting to the wrong gear and positioning the chain in an intermediate position between sprockets, which leads to surprising and dangerous slipping of the chain and the consequent unbalancing of the cyclist;
- The lubrication requirement of the chain, which attracts dust and dirt, causing aging and decay of the efficiency of the system and unpleasant effects due to possible contact with clothing.
The energy efficiency of the transmission system as well as the overall weight, particularly due to the abovementioned unavailability of properly designed fluid power components, represent the main design challenges of a hydrostatic transmission for a human-powered vehicle, with respect to a pure mechanical transmission system.
Fluid power technology, in comparison with the electric power technology widely adopted in bicycles nowadays, might appear inferior from the point of view of commercialization and technical pros and cons. A deep technical comparison is outside the scope of this paper. However, it is clear that electric power technology takes advantage of the more intensive effort made by the industry in developing components suitable for the size of the application. Another fact to take into consideration is that essentially all electric bicycles do not truly have zero emissions associated with their use, since they require energy charging from the network. Most of the electric bicycles available on the market do not implement braking energy recovery features, which require more expensive electric gearless hub motors. Disposal of electric batteries, which have a finite life span, and use of rare materials in electric components are additional factors that mean the electric vehicle is not a completely environmentally friendly solution for human-powered vehicles.
Instead, a hydraulic bicycle can use components that are for the most part made with non-noble materials (iron, steel, or aluminum), and a working fluid that does not require frequent replacement and can be environmentally friendly (such as the bio-oil used in the present study). Moreover, hydraulic hybrid systems can be more efficient than electric hybrid systems [1], and they offer more opportunities for integrating regenerative braking [2].
The potential advantages of hydraulic bicycles have motivated a certain amount of research effort over the last decades. Basic closed-loop hydrostatic transmission systems, essentially using a hydraulic pump connected to the pedals and a hydraulic motor connected to the rear wheel, were proposed in some patents, even recently. Significant is the patent [3] that describes a solution with variable vane units used as pumps and motor. The solution includes a manual mechanism that varies the displacements of the units to maintain constant system pressure (approximately proportional to the rider torque effort). Many other solutions are conceptually similar, but are based on different design architectures of the positive displacement units used as pumps and as motors: for example, Smith [4] uses a different solution with vane type units; instead, the patent [5] proposes a radial piston pump and a gear motor; Chattin [6] uses external gear units as its pump and motor. Piston units are used in the patents [5,7]. Another significant example of specially designed positive displacement machines was designed by Brackett [8], who proposed a fixed displacement pump and a variable displacement motor. None of these systems includes brake energy recovery features; they are intended to operate as traditional bicycles. In addition, though a functional transmission is created, no electronic device or software aid is integrated to monitor the performance and efficiency.
All of the abovementioned patents describe possible technology solutions, but do not report basic sizing considerations or expected/measured performance. Some technical publications address the problem of sizing a basic of hydrostatic transmission for light duty, bicycle-like applications: Chang and Yao [9] describe the case of an open-circuit electro-hydrostatic transmission, although the results reported in the work show a top speed of only 7 km/h for an overall vehicle weight of 135 kg! In Yang and Zhong [10], another design method is reported, although no experimental results are discussed.
Some more recent efforts have aimed at exploring energy recuperation in human-powered vehicles. Interesting patents on compact regenerative systems for bicycles were taken out by Amarantos [11] and Swain et al. [12]. More extensive work on regenerative bicycles is presented in the papers written by Lagwankar [13] and Truong et al. [14]. They both describe the sizing of an open-circuit hybrid transmission, in which different modes of operations, including normal pedaling and regenerative braking, are realized by solenoid valves. Unfortunately, both works show only simulation results, but velocities above 32 km/h are predicted. A similar work was also performed at the University of Minnesota [15]: in this work bent axis piston units are used in an open hydrostatic transmission, with an accumulator used for regenerative, manual charge, and boost mode through manual switches. A prototype was also realized, and the performance was good (maximum pedaling speed of about 17.7 km/h), although the weight amount and distribution, as well as the mechanical linkages of the hydraulic units (two chains/sprockets were used) were not optimized. Another study recently completed at the authors’ institution was documented by Foa et al. [16]: in this case, a four-wheel vehicle was realized with an open-circuit hybrid transmission based on external gear pumps. The vehicle demonstrated excellent capabilities for electronic control of the hydraulic system, but the vehicle performance was quite poor.
The present paper aims at further contributing to the field of innovative human-powered vehicles, and shows a design procedure for a bicycle that:
- (1)
- Maximizes velocity while pedaling;
- (2)
- Minimizes overall weight;
- (3)
- Recovers energy while braking;
- (4)
- Allows for a power boost (use of energy from the accumulator);
- (5)
- Maximizes human comfort and implements all necessary safety features.
Similarly, to the previously mentioned works by Foa et al. [16] and Wang et al. [15], prototypes were realized to participate in a U.S. national competition for human-powered fluid power vehicles open to engineering schools. The vehicle realized within this work, named the “PurdueTracer,” participated in the 2017 Fluid Power Vehicle Challenge (FPVC) organized by the National Fluid Power Association (NFPA), held in Ames, Iowa in April 2017, and won the overall championship. The FPVC fully assesses the main criteria (1)–(5) specified above, through specific evaluation criteria on the vehicle design as well as purposely designed races. In particular, one race is dedicated to endurance (about 2 m); one race to sprint capabilities; and one to the boost capabilities of the vehicles (utilization of the energy stored in the accumulator). More details on the competition can be found online [17].
The following sections describe the methods utilized to design PurdueTracer. It is important to point out that this research put significant focus on the maximization of the performance parameters of the hydraulic system, namely weight, energy efficiency, and amount of energy recovery. However, other important aspects related to the designing of a hydrostatic transmission where the prime mover is a human being were also considered.
Over a wide range of pedaling speeds (up to 100 rev/min, depending on the individual), the torque generated by a human is almost constant [4,5,10,18]. Other factors also affect the torque and the resistance of the cyclist. Primarily, the geometrical configuration of the bicycle has significant implications on the torque level: the angles and the distances between seat, handlebar, and crankshaft, as well as the crankshaft pedal radius, have effects on the human performance. The proportions typically used in commercial bicycles reflect accurate studies performed in this field [18].
Another level of human–machine interaction that affects the performance of the cyclist is related to the visual aids and monitoring devices available during the physical exercise. It is proven for almost all intensive sport activities (gym cardio equipment, jogging, cycling) that the ability to monitor the human status, e.g., the heart rate, the instantaneous power consumed, etc. as well as vehicle performance data (pedaling speed, vehicle velocity) can improve the human ability to achieve certain performance goals. All these human factors related to the structural design of the chassis as well as the ease of monitoring and control of the vehicle were addressed in the proposed design. In particular, a smartphone app was developed for PurdueTracer to enable all the desirable features of a modern and intelligent vehicle, which could potentially encourage potential users to use smart hydraulic bikes like the one proposed in the research done by Navarro et al. [19].
2. System Overview
This section provides a general overview of the system on the basis of the PurdueTracer vehicle developed within this study. PurdueTracer reproduces the configuration of a traditional bicycle (Figure 1); however, it integrates an electro-hydraulic and a hybrid system used for the motion transmission. The solenoid valves determine the configuration of the hydraulic system, and they are controlled using an Arduino controller that communicates via Bluetooth with a smartphone application. The overall electronic control system applies the concept of the Internet of Things (IoT), providing the cyclist with a smartphone application to control PurdueTracer, with functional aids in promoting the user experience.
The whole system circuit is represented in Figure 2, which integrates the ISO schematic of the hydraulic system, the mechanical connections through gearboxes to the pedals and the wheels, and the electronic controller. All these subsections of the system will be detailed in the following sections of the paper.
3. Hydraulic System Design
3.1. Hydraulic Hybrid Circuits
The hydraulic schematic of PurdueTracer is shown in Figure 3. The circuit is essentially designed based on an open-circuit configuration, where a fixed displacement pump is connected to the pedal and provides flow to a fixed displacement motor connected to the rear wheel through a variable shift gear hub. The system also includes an accumulator, which can store energy from the supply (either the pump connected to the pedal or an auxiliary manual pump), or while braking.
The configuration of the hydraulic circuit is determined by two solenoid switching valves, so that four different modes of operation can be realized: Pedaling, Charging, Boost, and Regeneration. These modes are illustrated in Figure 3.
For this light-duty application, the choice of an open-circuit HT, instead of a closed-circuit configuration, which is more common for heavy-duty HTs, has the following merits:
- It reduces the number of components (i.e., charge pump circuit). Closed-circuit HTs generally reduce the size of the reservoir. However, for this application, the reservoir size requirement given by the accumulator charge and discharge processes turned out to be more stringent than that related to the flow of the small pump used in the circuit.
- It allows easy implementation of different modes of operation through switching valves, without significant layout complications.
Fixed displacement hydrostatic units for both the pump and the motor were preferred to variable displacement units for the following reasons:
- Limited availability of lightweight material (i.e., aluminum) pumps and motors in the displacement range of interest for this application (<10 cm3/rev, as will be detailed in the Section 3.2).
- The use of an electrically controlled multiple-speed gear hub connected to the rear wheel can permit regulation similar to a secondary controlled HT, but avoids the use of a variable unit at partial displacement, where the energy efficiency can be low.
- An electro-hydraulic system for adjusting the instantaneous displacement of the units would add increased weight and complexity to the system.
Each operating mode of PurdueTracer illustrated in Figure 3 deserves a more detailed description, as follows:
Pedaling (Figure 3a). When neither of the solenoid valves V1 and V2 is energized, the vehicle operates in this mode, replicating the functioning of a traditional bicycle. This implies that the vehicle can also be operated in this mode in case of insufficient battery, or in the case of a failure of the electronic control system. In Pedaling Mode, the rider spins the pump shaft through the pedals, and the pump flow is sent directly to the motor connected to the rear wheel.
Charging (Figure 3b). This mode is realized by switching both V1 and V2. In this case, two options are available for charging. Hand pump charging: in this case, the vehicle is at rest and the cyclist uses his/her legs to balance the bicycle and hands to charge the accumulator. A check valve prevents the fluid under pressure to flow through the pump and spin the crankshaft pedals. The hand pump charging mode is used in this project, mainly because it was used during the FPVC. However, another charging mode is available with the same configuration for V1 and V2, i.e., Pedaling charge: in this case, the cyclist pedals to pump flow to the accumulator. This mode can be useful for storing energy in passive riding phases, such as riding downhill.
Boost (Figure 3c). The boost mode is realized when only V2 is energized. This is the mode used to release the energy stored in the accumulator. The boost mode can be used when the cyclist wants to move the bike without pedaling.
Regeneration (Figure 3d). An additional pump driven by the rear wheel can be engaged by the rider through a dog gear mechanism that will be detailed in Section 4. The pump generates flow to the accumulator, and the shaft torque, which corresponds to the braking torque at the wheel, is defined by the pressure level in the accumulator. A pressure relief valve, with adjustable pressure setting through a proportional solenoid, is used to limit the maximum braking torque at the level selected by the cyclist. As will be detailed in Section 4, in this work the regeneration system was sized in such a way that the whole energy of a specific braking event can be stored in the accumulator. However, in case of more demanding braking events, or prolonged braking (downhill phases), the regeneration circuit becomes purely dissipative, since the pump flow is relieved through the pressure relief valve.
The use of an additional pump for the regeneration circuit could be avoided by using a single pump/motor unit connected to the rear wheel. However, the solution based on the additional pump was preferred because:
- It permitted calculating the motor size independently from the needs of the regeneration circuit. In fact, the size of the hydraulic motor was determined based on the requirements of the Pedaling and Boost modes. A less advantageous size would have resulted if the needs of the Regeneration mode’s function were also considered.
- It permitted us to use a “free wheel” gear hub, like in a traditional bike. A free wheel hub allows for unidirectional transmission of the torque transmitted to the wheels, and allows for vehicle coasting (wheel spinning without involving angular velocity at the gear hub). A single pump/motor solution would have required a bidirectional hub, with the undesired consequence of eliminating the coasting function. In other words, the cyclist would feel the parasitic loss of the hydraulic motor while coasting.
While the proportional RV has a functional role in Regeneration mode, it also has a safety role in the remaining modes (Pedaling, Charge, and Boost). For this reason, the input signal to the RV solenoid is chosen in such a way that it reduces the RV setting pressure. An additional safety element is given by the valve 3W, which is used to manually relieve the accumulator pressure. 3W is always closed during the normal operation of the vehicle.
3.2. Simulation and Sizing of the System
The hydraulic layout described in the previous section offers all the functions suitable for a human-powered vehicle. However, good operation in all four modes can only be realized through proper sizing of the key components of the hydraulic circuit. In particular, the size of the positive displacement units, as well as the gearboxes at both the pedals and at the rear wheel, needs to be found to guarantee not only maximum vehicle velocity while pedaling, but also an effective boost and regeneration function. The optimal sizing of PurdueTracer was obtained through a numerical optimization. The following sub-sections first detail the approach utilized for the numerical modeling of the vehicle, and then describe the formulation of the optimization problem, considering the typical performance of a cyclist.
3.2.1. Numerical Model of the PurdueTracer
The numerical model of the PurdueTracer was realized through the multidisciplinary software AMESim by Siemens. The model utilizes a quasi-steady state approach, and uses these well-known relations for the hydrostatic units:
For the accumulator, the polytrophic relation for nitrogen gas is used:
The value of the polytrophic constant n was assumed to be (n = 1.2), representative of a process with a certain amount of heat transfer for the gas. The volume of the accumulator is related to the pre-charge pressure:
As is shown in the AMESim model schematic provided in Figure 4, the main pump is connected to the pedals with a gearbox of variable transmission ratio, while the motor is connected to the wheel with a gearbox of variable gear ratio. Both gearboxes are assumed to be ideal (unit efficiency). The hydraulic valves are assumed ideal (no pressure losses), as well as the connecting lines. Realistic volumes for the connecting lines are assumed to consider their capacitance effects.
To make the model suitable to perform design considerations and assist in the selection of the size for both the hydraulic pump and motor, realistic efficiency maps were used as shown in Figure 5. These maps came from experiments performed on a small gear unit (of about 4 cm3/rev).
The model permits us to reproduce all modes of operation displayed in Figure 3. For the Pedaling mode, the crankshaft speed serves as the input parameter, and the simulation returns the vehicle velocity through a road friction model.
The acceleration of the vehicle is calculated by the following equation:
The propelling force applied on the rear wheel with the external radius and the moment of inertia IW is:
The aerodynamic force is given by the equation:
The slope force follows Equation (10):
Finally, the friction force is given by the following equation:
3.2.2. Numerical Optimization
The model described in the previous section was used to perform the sizing of the main components of the system, by means of a numerical optimization method. The inputs of the optimization problem are: the unit displacements of the pump and motor, , the gearboxes ratios of the pump and motor, , , and the pre-charge pressure of the accumulator, p0.
Assumptions used for the simulation are: the human speed of pedaling (70 rpm [20]), the mass of the vehicle ( = 140 kg; this value considers the estimated mass of the hydraulic system, the frame, and the cyclist), the slope (α = 1°, assumed to meet the maximum slope of the track used during the final FPVC competition), the accumulator size ( = 2 L, which is the size of a low-weight carbon-fiber accumulator that was made available to the authors for the final implementation), the maximum accumulator pressure, , resulting from the charging model ( = 180 bar, from the hand pump charging process), the wheel radius and moment of inertia, ( = 0.334 m, = 0.15 kg·m2), the initial velocity of the vehicle in the Regeneration mode ( = 12.8 km/h), and the initial accumulator pressure ( = 25 bar). Optimization constraints were represented by the maximum torque at the pedals, limited to 25 N·m (a reasonable maximum torque that can be input by a human [20]), so that all the designs that exceed this maximum torque value will be rejected by the optimization algorithm.
The objective functions (OF) of the optimization problem are defined as follows:
The parameter boost is defined as:
The objective function for the regeneration is defined as follows:
OF1 has a straightforward interpretation: it simply tends to maximize the bike velocity during the pedaling mode. Instead with OF2, the optimization seeks for a solution that gives the maximum effectiveness of the accumulator during boost mode. The definition of OF2 is also in accordance with the rules defined by the FPVC competition [21]. OF3 was instead used to reach the maximum energy storage during regeneration mode.
To perform this optimization, the AMESim model of the vehicle in Figure 4 was run to reproduce the pedaling model and the boost mode (discharging the accumulator from the level) for every design, given by a combination of input parameters. The non-linear programming by quadratic Lagrangian (NLPQL) optimization algorithm, present in the AMESim software (version 15), was utilized for this purpose. In particular, a first genetic algorithm optimization is performed to explore a wide range of input parameters. Afterwards, local NLPQL sub-optimizations were performed to better explore the local minima, properly refining the range of the input parameters, to get more accurate results.
3.2.3. Optimization Results and Predicted Performance
The best design resulting from the optimization process is shown in Table 1. The same table reports the actual values chosen for the PurdueTracer, which are the closest values of practical components available to the authors.
Good performance in terms of maximum velocity during pedaling and boost effectiveness was reached. As pertains to the increase of accumulator pressure during regeneration (OF3), the value is limited due to the low momentum of the vehicle during a single full-stop braking event. Higher potentials for energy recovery could be achieved considering a longer braking phase (such as controlling speed while traveling downhill).
The predicted performance of the vehicle with the selected components is summarized in Table 2.
Table 2 reports the values with the highest gear ratio of the Shimano gear hub at the rear gear, which actually provides a torque request that exceeds the 25 N·m limit by 5 N·m. Therefore, the variable gear hub at the rear wheel (this will be further explained in Section 4) permits a certain flexibility in the strength of the cyclist. If the cyclist can input a lower torque, the parameters such as power and speed (Table 2) will be reduced accordingly.
The simulation model is suitable to perform transient analyses of the vehicle operation. For example, Figure 6 reports the case of a simulation where the accumulator is first charged to 200 bars for 100 s in Charging Mode. After this initial phase, a Boost Mode is simulated to replicate the vehicle acceleration. Then, the cyclist starts to pedal the vehicle at 220 s and reaches a constant speed at 280 s. Finally, the regeneration system is activated at 320 s, stopping the vehicle within 10 s.
4. Mechanical System Design
4.1. Frame
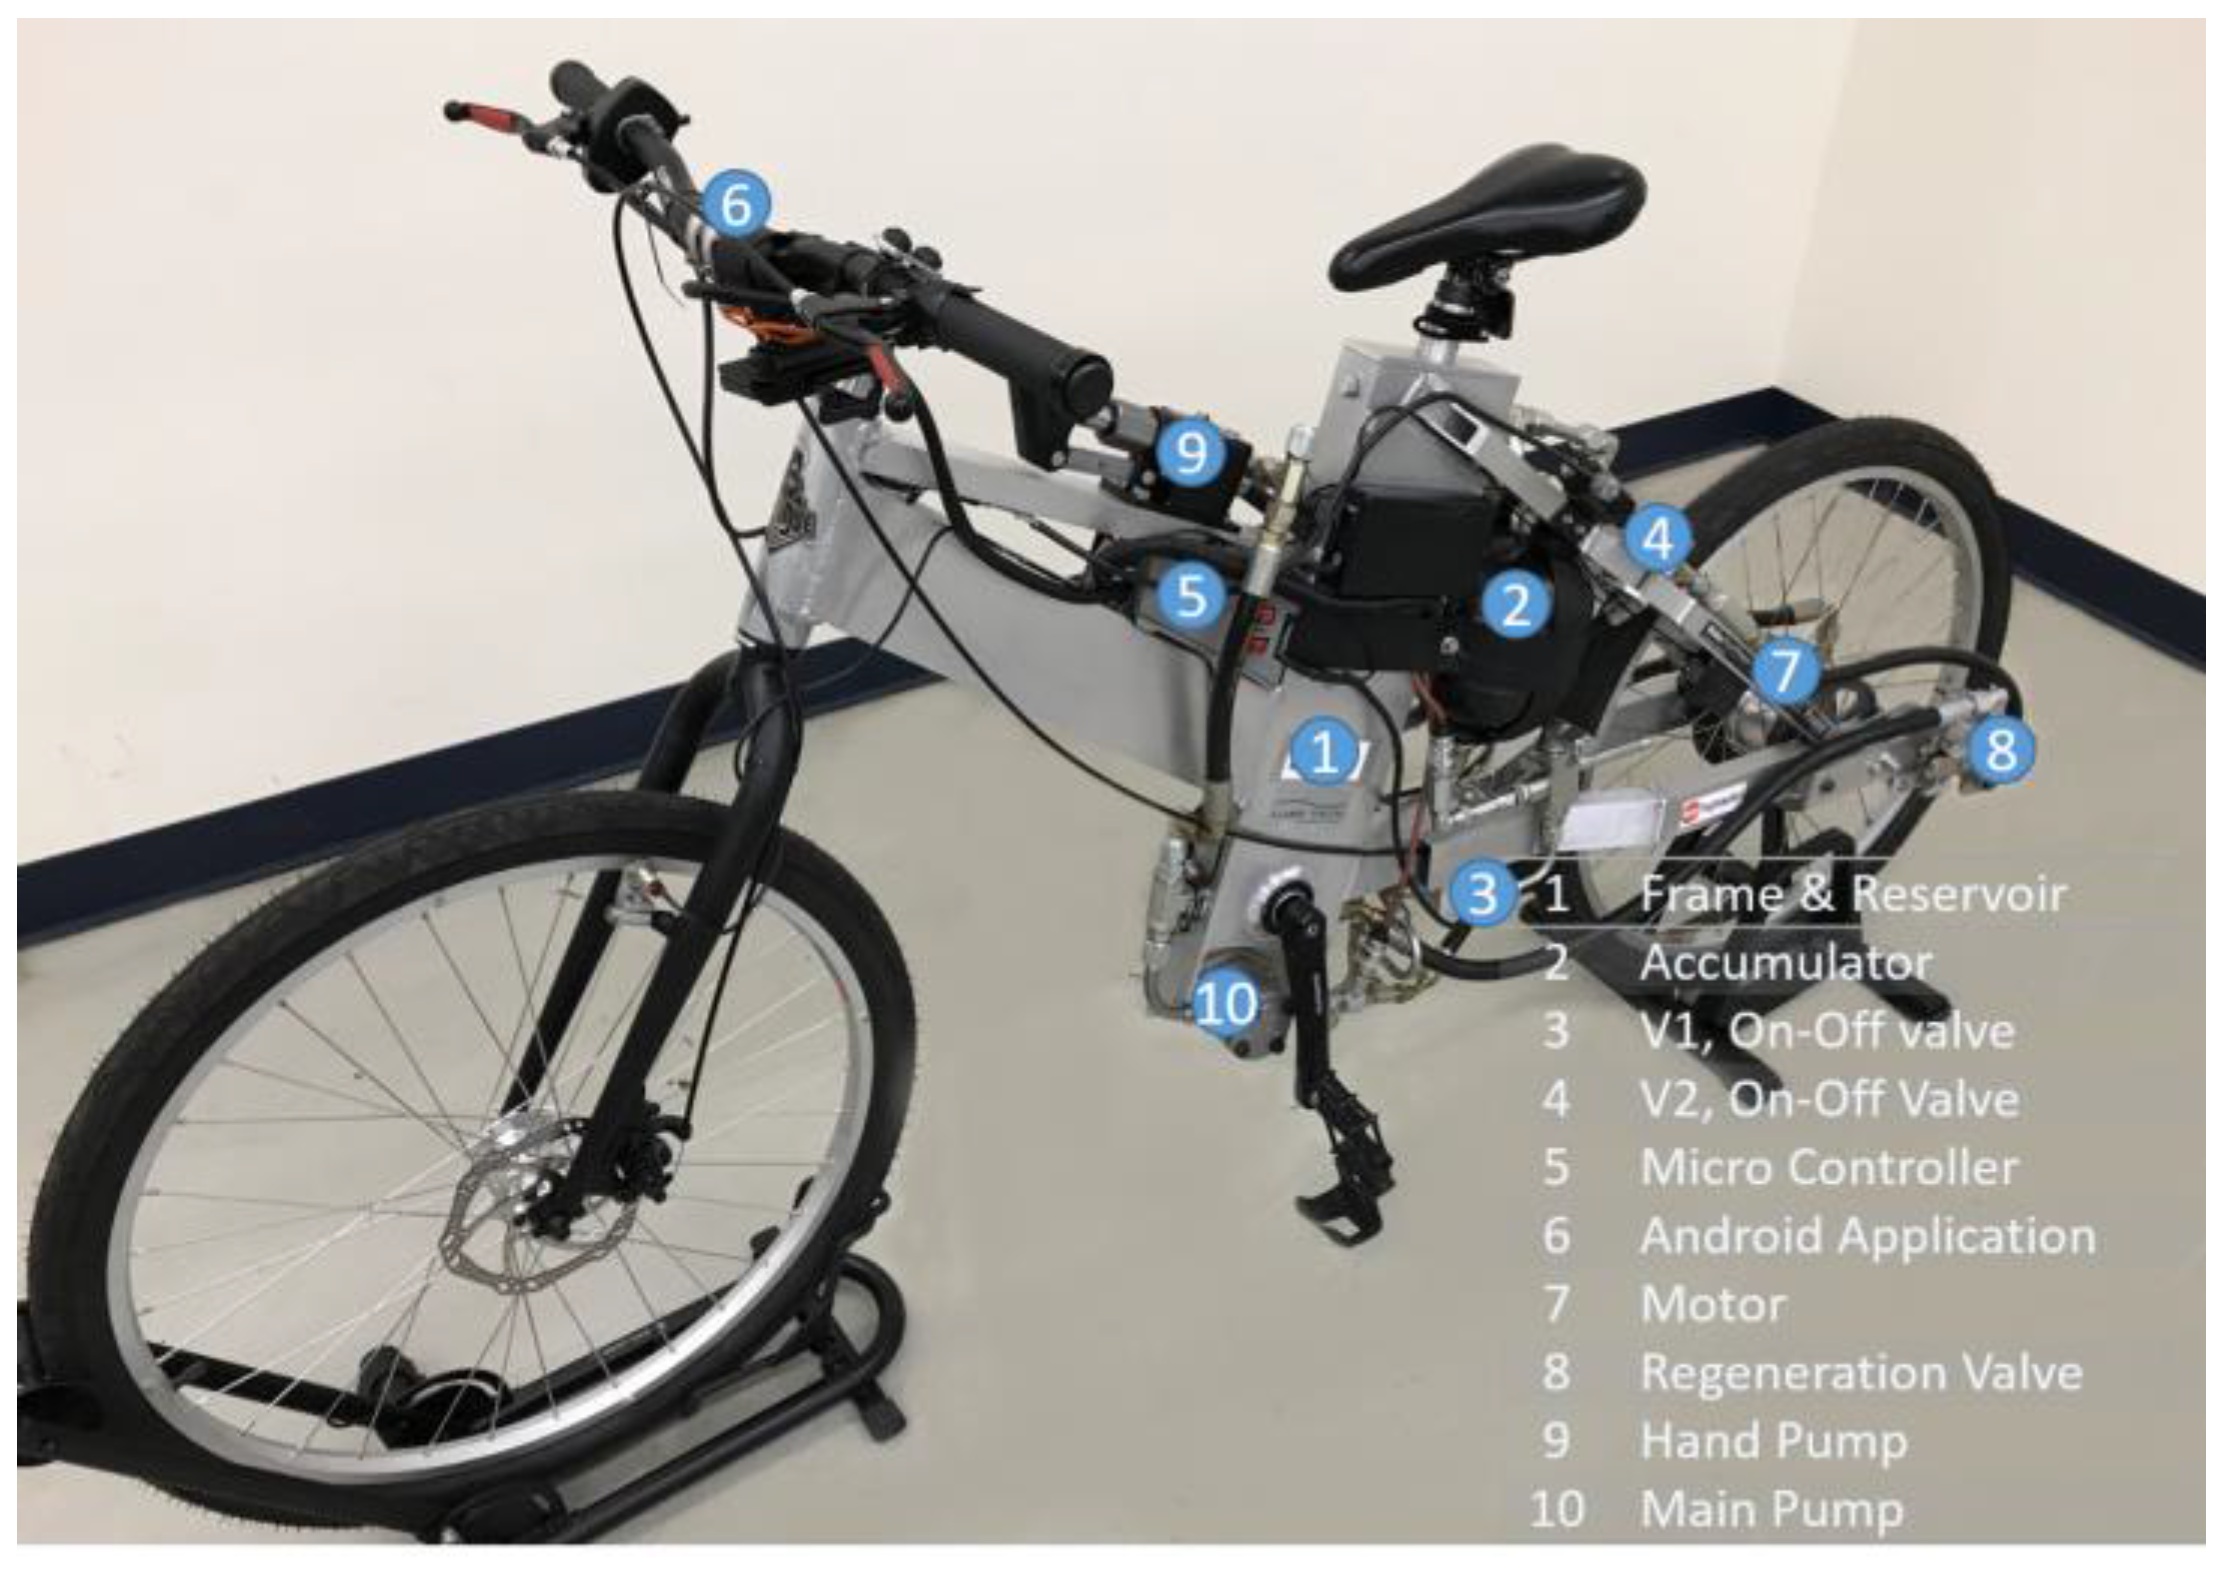
The mechanical configuration of the PurdueTracer (Figure 1) was designed to achieve safety, durability, comfortable riding, and optimal weight. The frame accommodates all the hydraulic components listed in Figure 3 and the elements necessary for the electronic control and DAQ system.
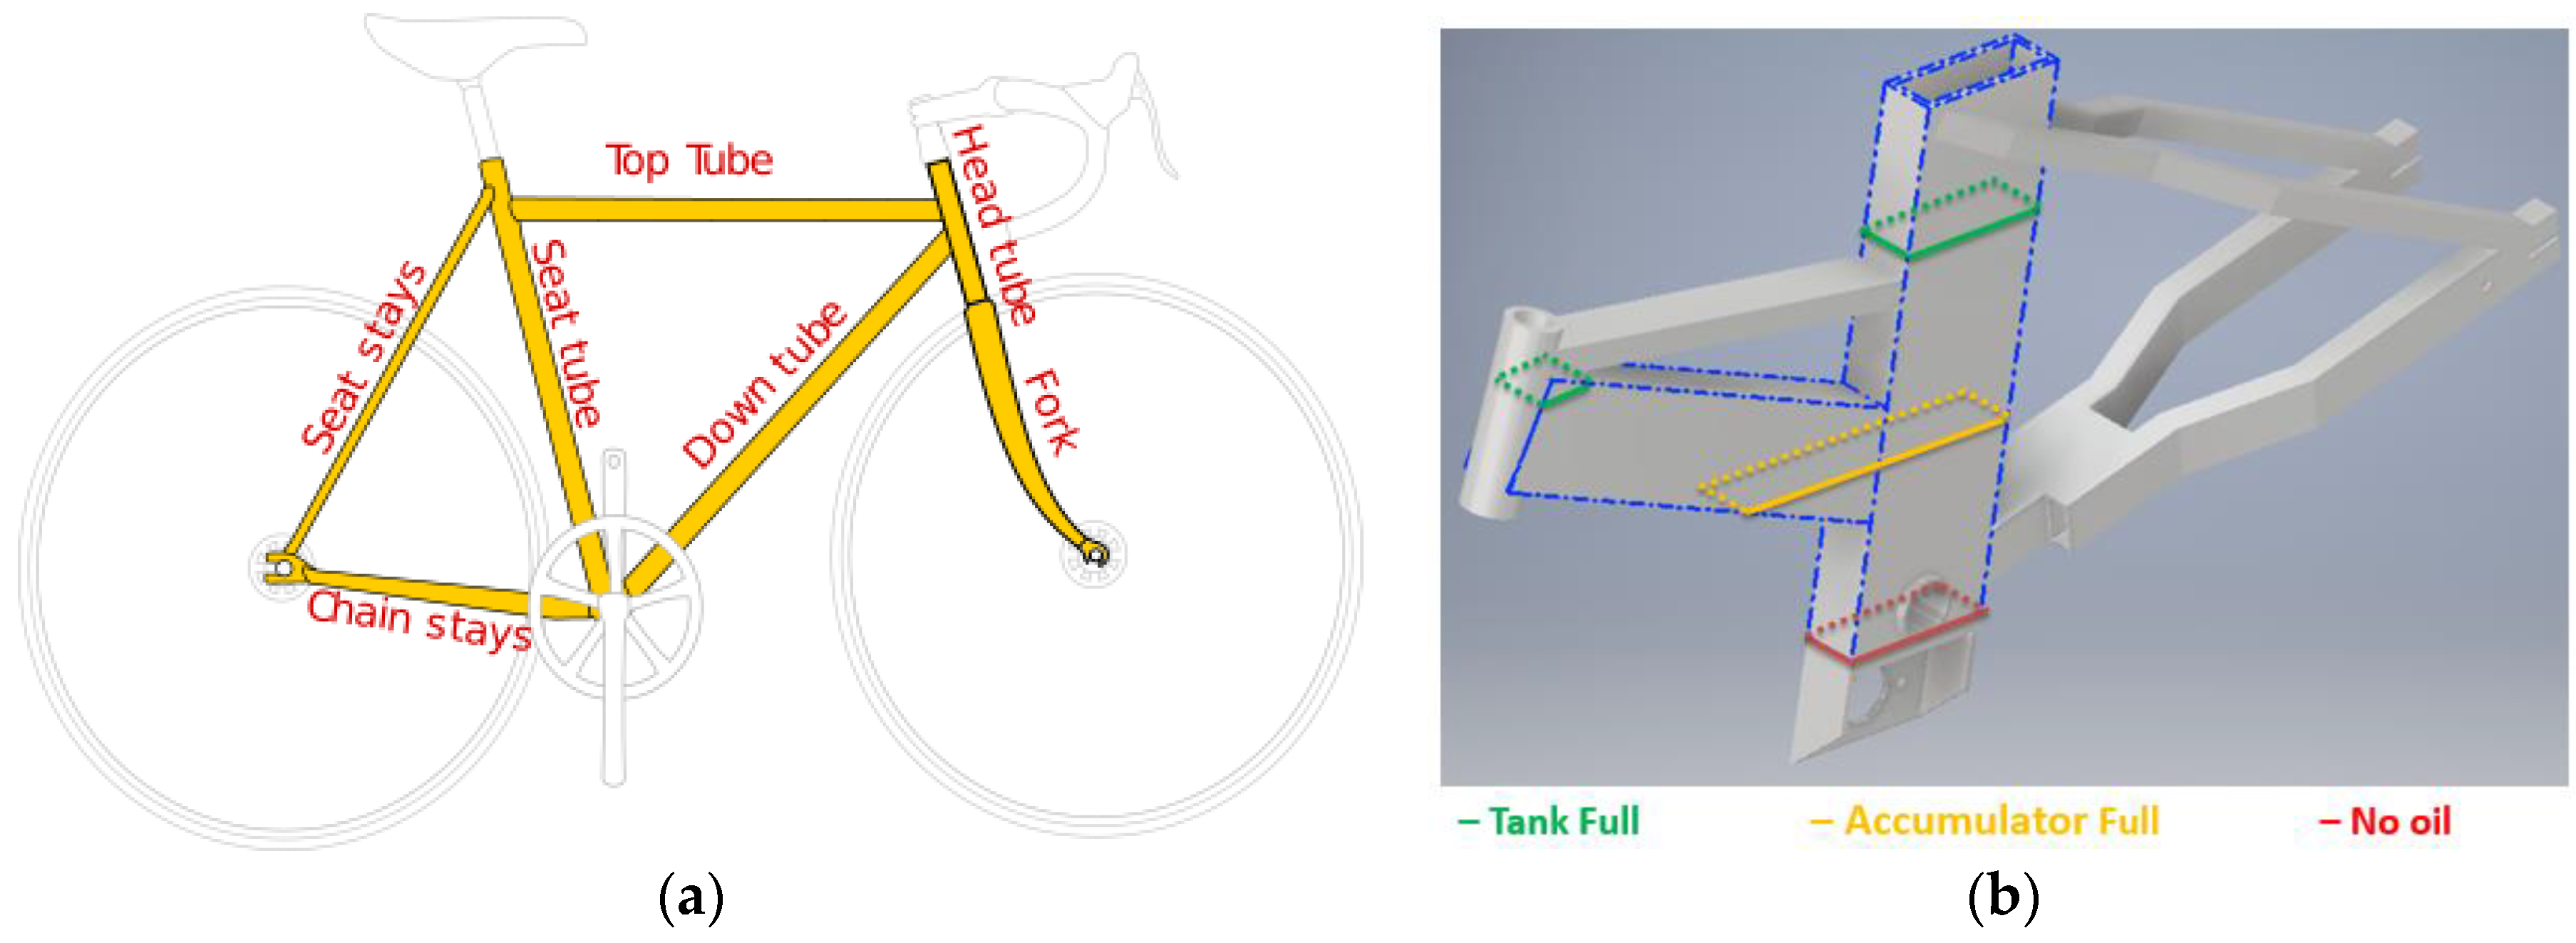
The lengths and the angular proportion of the bike were chosen with respect to those of the traditional bike shown in Figure 7a. In particular, the seat angle measured as the angle between the seat tube and the horizontal ground was 74°. According to Burke [20], this increases pedaling comfort for the cyclist, who can achieve optimal posture and control of the bike, and maximizes the torque output by the pedals.
As is visible in Figure 1, all hydraulic components are located close to the central frame bar, near the lowest region of the structure. This allows us to lower the center of gravity of the bicycle. An important element of any hydraulic transmission system is the reservoir. In this case the reservoir is integrated within the frame of the bicycle. In particular, the central frame (seat tube) and the down tube of the bike are hollow beans that function as a system reservoir (Figure 7b). The overall volume of the reservoir is Vres = 3.7 L. Such volume allows the working fluid to remain within the reservoir for a sufficient time during pedaling (t > 1 min). This is achieved by a proper configuration of the return lines (at the top of the frame) and the pump intake line (at the bottom of the frame). In this way, incondensable gases that accumulate in the working fluid can be released within the tank, through a vent installed at the top of the down tube. The size of the reservoir also allows for complete charging/discharging phases of the accumulator during charging and boost modes. This design of the reservoir not only eliminates the use of an external reservoir, but also allows for optimal weight distribution, limiting oscillations of the center of gravity due to fluid flushing.
The material used for the frame is aluminum, and the overall weight of the frame is 9.2 kg. The structural resistance of the frame was verified through FEM analysis, as shown in Figure 8. The constraints applied to the model are the central node of the front fork, allowing only displacements in the direction of motion, and the central node wheel fork, allowing no displacement. Based on the maximum strength (11.67 MPa) employed on the frame, the material of the frame was selected as aluminum 6061, which has a yield strength of 55 MPa.
Maestrelli and Falsini studied the load applied to a bike [21], using it to evaluate different behaviors of the frame during the pedaling. Static analyses have been performed, applying four types of loads.
The load cases analyzed are the following:
- Sitting pedaling, pushing on the right/left pedal: in which the rider is sitting on the saddle and pushing on the right/left pedal in an analysis (depending on the case analyzed);
- Braking: in which the rider is braking with both brakes;
- Road irregularity: in which the loads simulate the road deformity.
From the analysis results it appears that most of the structures are under small stress (about 0–3 MPa), indicating the whole frame is stable. Looking at places with relatively high stress, a factor of safety is calculated. The maximum stress (16.64 MPa) is present during the road instability condition. This condition gives a factor of safety of 3.31, which is considered to be enough for the considered prototype to function under all possible operating conditions.
The layout of the components in the frame is visible from Figure 1: the main pump is mounted next to the pedals, while the hand pump is installed at the top tube of the frame. The accumulator is placed behind the seat tube. The regeneration pump and hydraulic motor are located next to the rear wheel hub.
4.2. Gearboxes
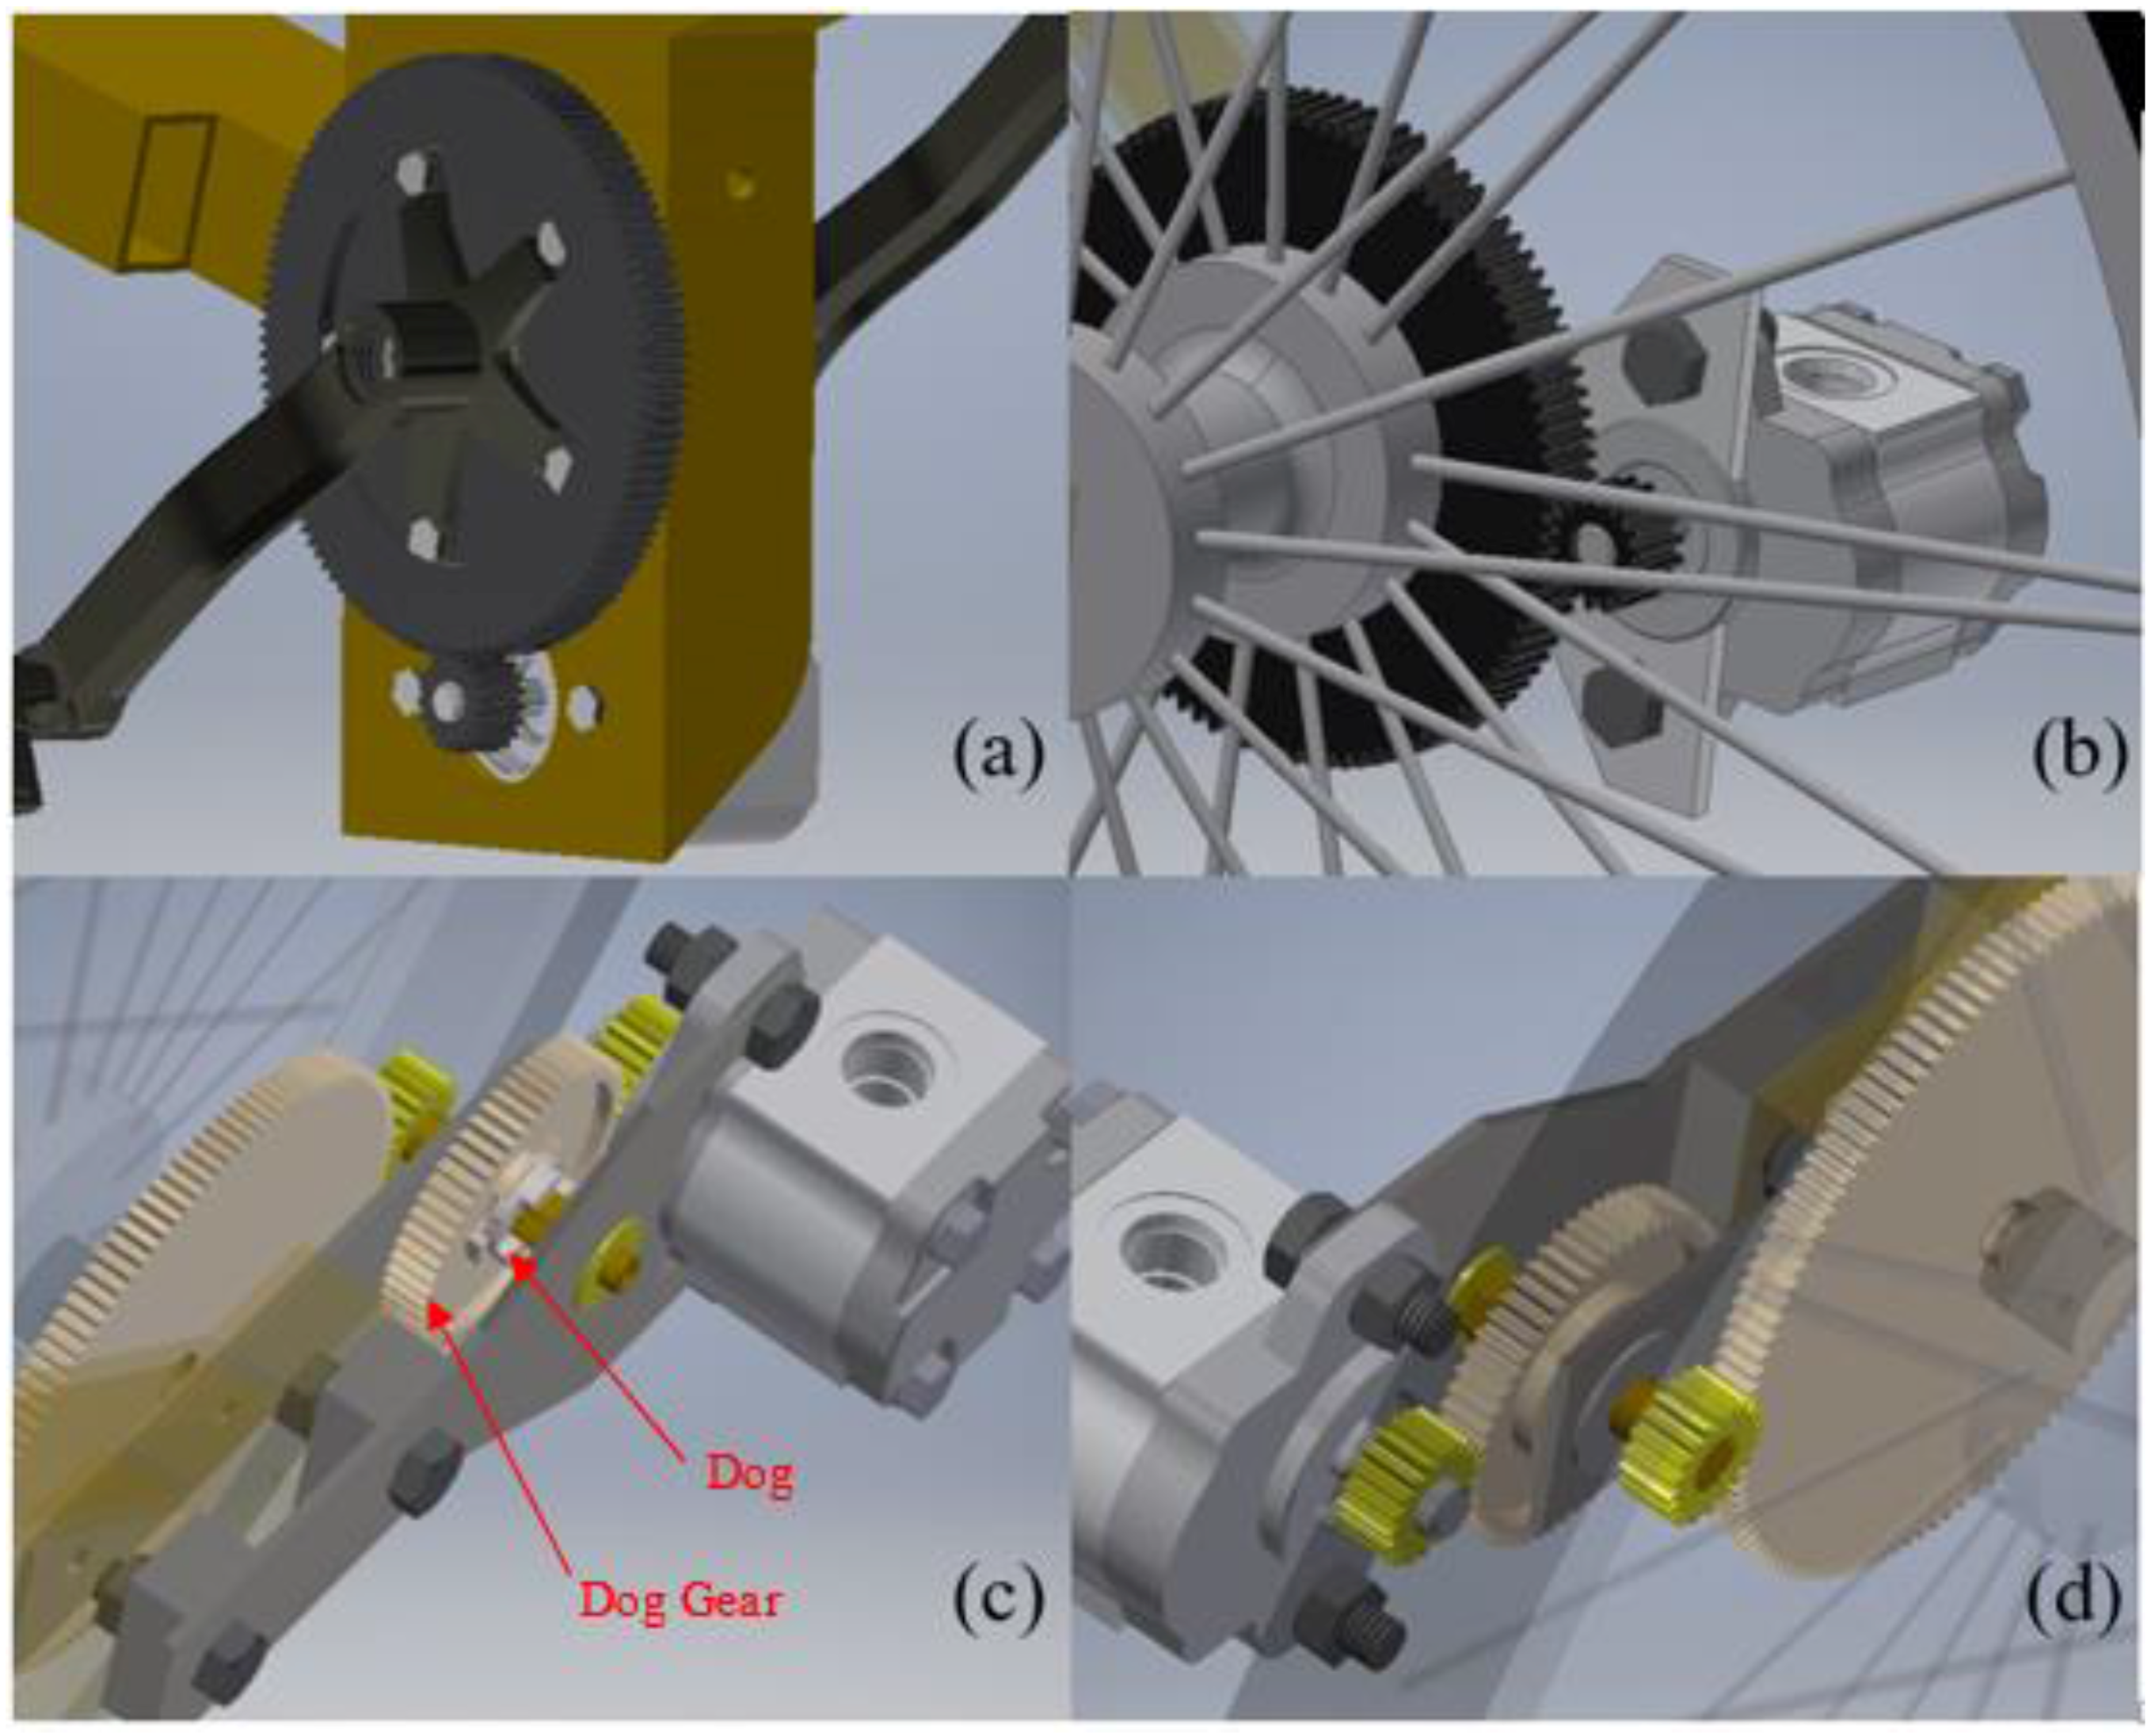
The gearboxes of PurdueTracer implement the gear ratios found by the numerical optimization (Table 1). All the gear boxes were implemented using external gears, in assemblies that ensure compactness and no axial loads at the gear shafts. Figure 9 illustrates the mechanical designs of the gearbox.
The front gear box ratio is supported by the lower part of the seat tube and approximates the numerical results with a 19/120 gear—integrals gear teeth—thus realizing a ratio of 1:6.3 (Figure 9a). The rear gearbox connected to the hydraulic motor is located at on side of the rear wheel, and it is implemented by a 100/17 gear pair, thus implementing a 5.9:1 ratio, close to the numerical optimization. An aluminum plate is used to rigidly constrain the axis of the hydraulic motor with the hub of the rear wheel (Figure 9b).
Besides the motor-to-wheel transmission, an electronic 8-Speed gear hub (Shimano Alfine) was installed to permit a variable gear ratio. This internal gear hub provides eight different gear ratios from a minimum of 0.5:1 to a maximum of 1.6:1. The variable gear ratio was chosen to permit a wider range of utilization of the vehicle, around the optimal point found by the optimization. This feature allows us to adapt the hydraulic transmission system to different cyclists or different road slopes.
The gearbox for the regeneration pump (Figure 9c,d) implements the optimal ratio of 16.8:1, found numerically by means of a two-stage transmission (Table 3). Figure 9c shows the engagement of the dog gear and dog. In this case, the regeneration system is functioning. In normal operation, the dog gear and dog are separate from each other. The dog is controlled by a hand level that pushes the dog back and forth along the shaft. This simple system allows us to avoid parasitic losses of the regeneration pump, since this component is turned on only when required by the cyclist.
5. Electronic System Design
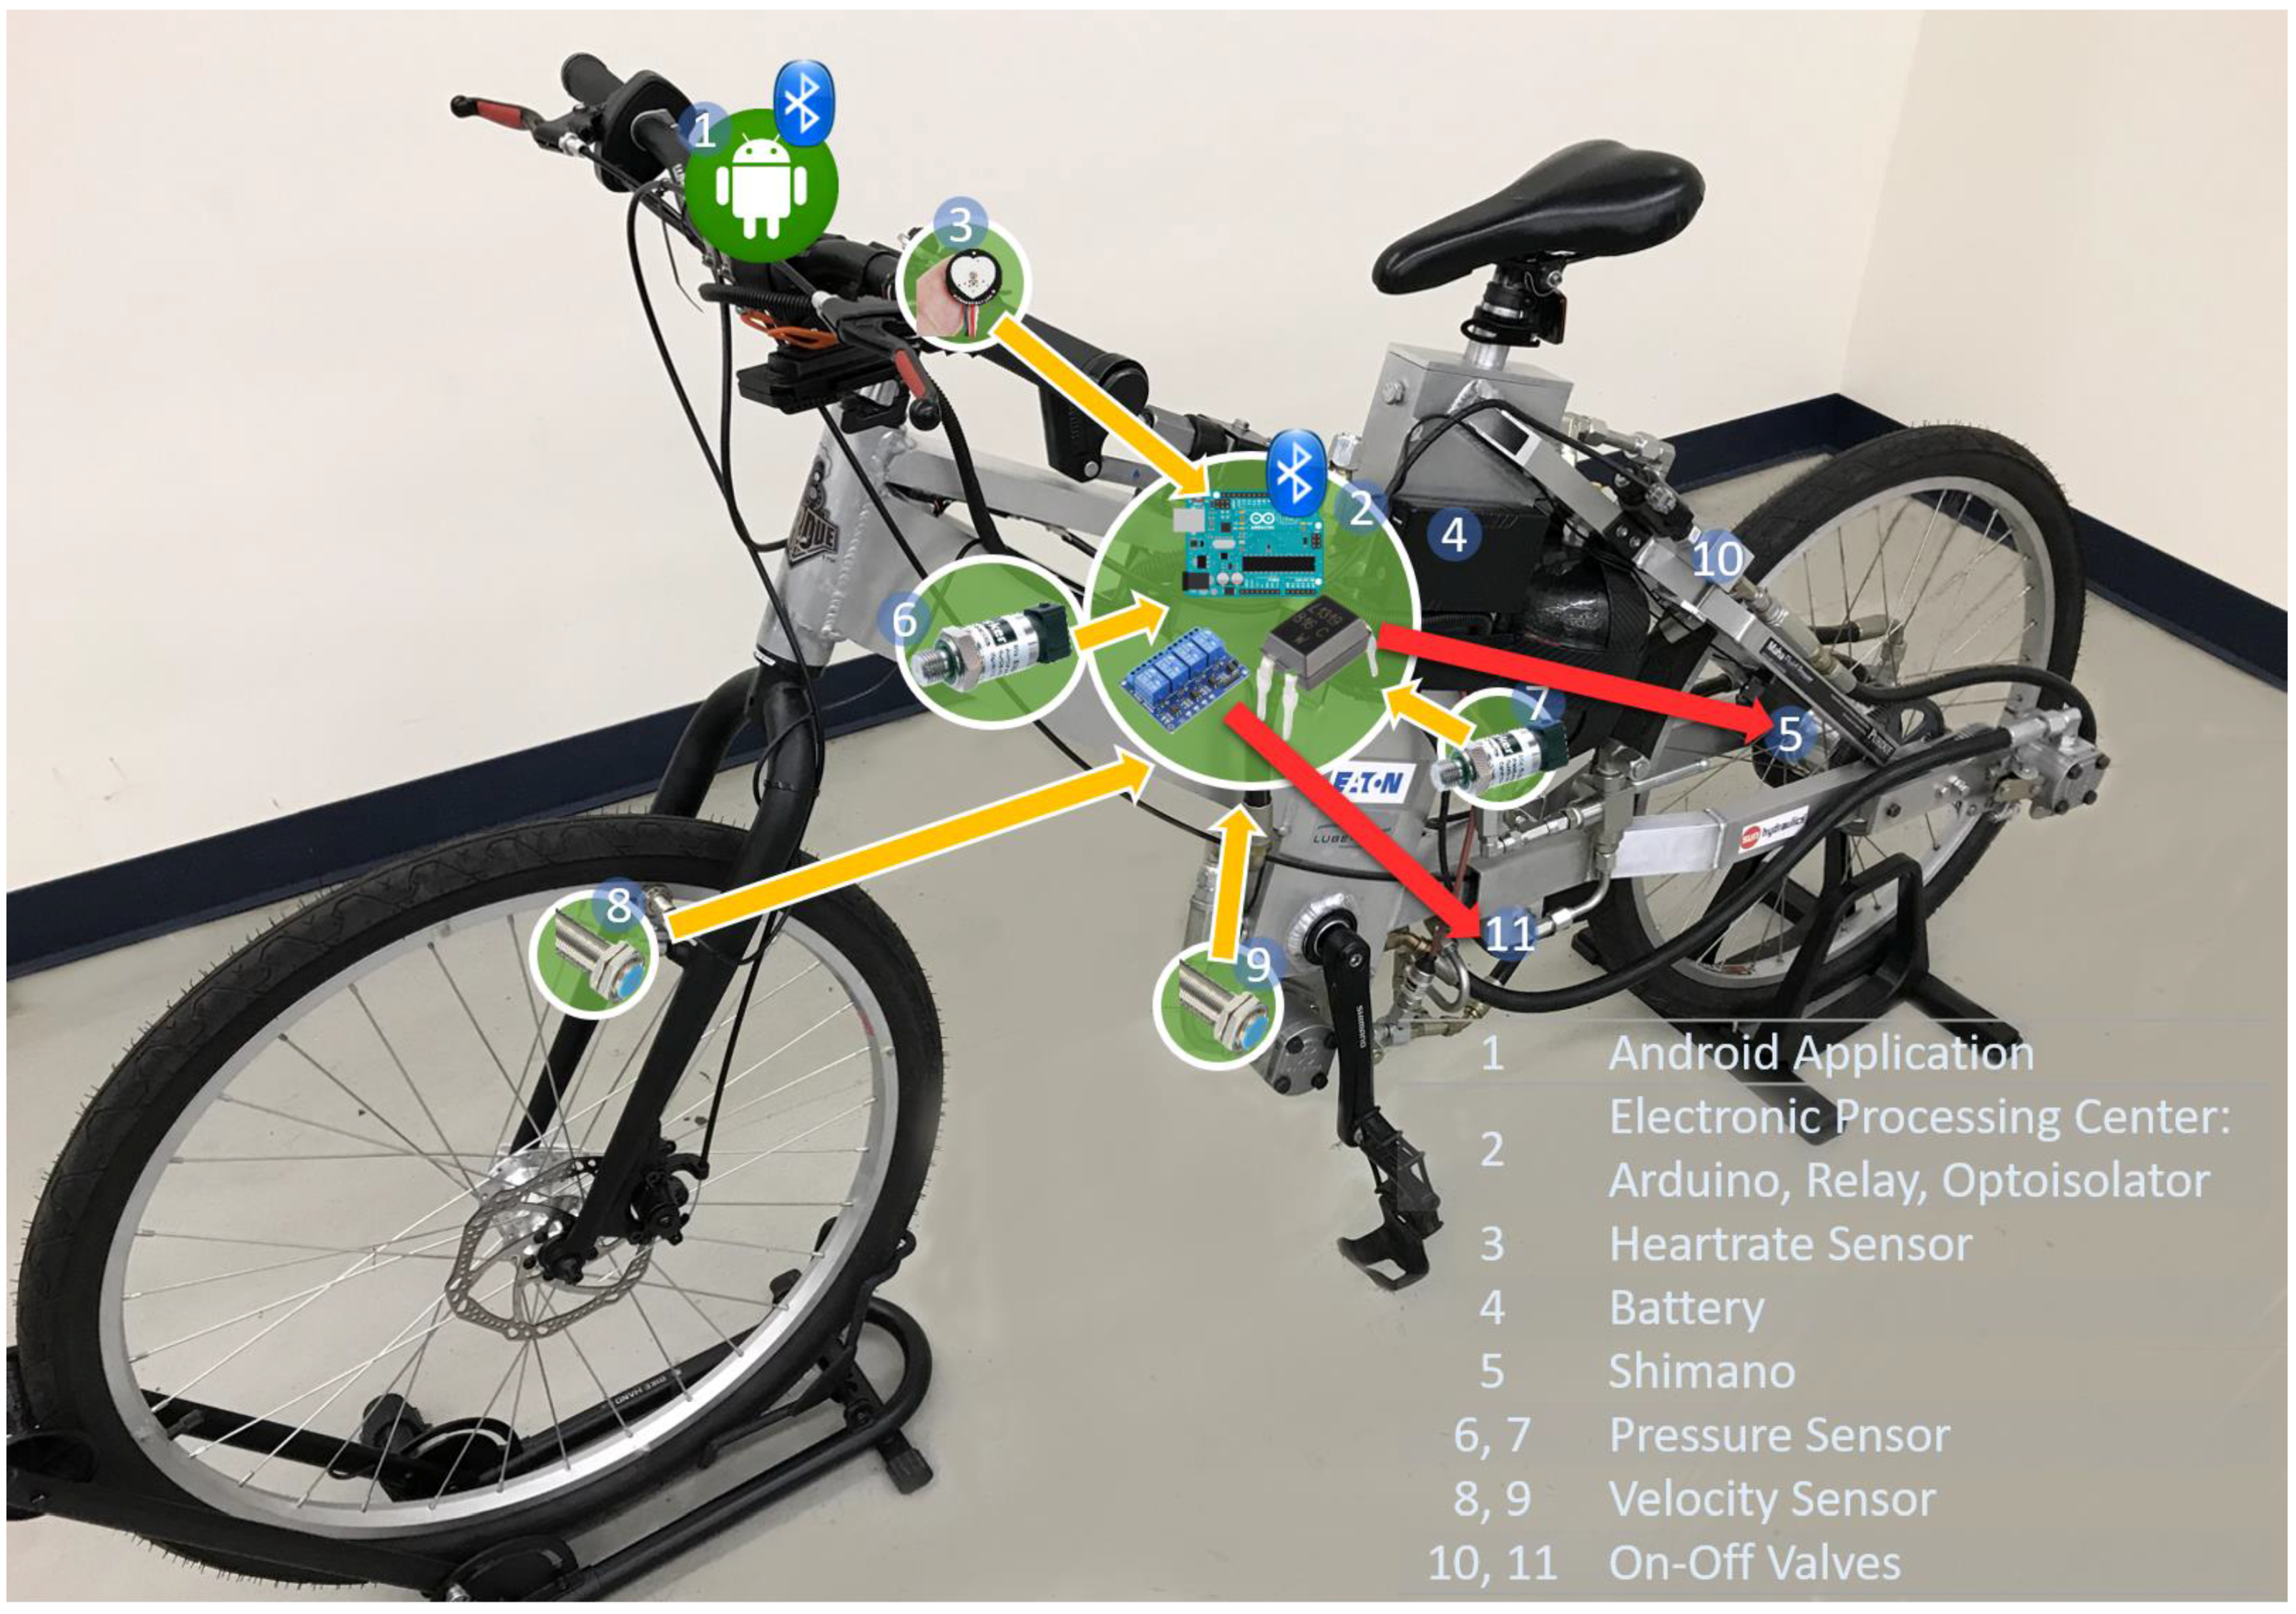
PurdueTracer provides users with an electronic system for comprehensive control, guidance, and recommendations, aiming to achieve seamless interaction between users and hydraulic systems, and to improve the safety and intelligence of the vehicle. The connection of the electronic system is illustrated in Figure 10. An android application is utilized for user interaction. It sends out command output to Arduino via Bluetooth Low Energy (BLE), analyzes and displays real-time bicycle information, and generates personalized recommendations. The microcontroller Arduino is connected with the sensors and executive components on the bicycle. It reads the measurements and performs functions to instruct the mode and gear ratio change.
5.1. Software
The software is developed based on the android application programming interface (API) and can be accessible to users via smartphone. As shown in Figure 11, the three major subsystems of the application include:
- The control subsystem for gear and mode change;
- The display subsystem to show directed measured data from sensors, the analysis of bicycle and human performance, and recommendations for healthy riding;
- The user-oriented design to enable comprehensive guidance.
The control subsystem is designed to facilitate hydraulic and mechanical system condition changes of PurdueTracer. The setup of the system includes the android application, Bluetooth Low Energy, microcontroller Arduino, and sub circuits for mode and gear radio change. The cellphone receives the touch input, matches it into command output, and sends it to BLE, with data 0–2 representing three types of mode change (Pedaling, Charge, and Boost modes) and 3–4 representing gear ratio adjustment. The Regeneration Mode is automatically executed when users brake PurdueTracer and its electronic control will be explained in the next section. Arduino maps the received command to corresponding functions and changes analog values or sends out impulse signals at the pins for relays or optoisolators. Figure 12 illustrates the sub-circuits for controls. Both sub-circuits include a 12 V lithium battery, executive components (on–off valves for mode change and Shimano series), and a relay or optoisolator that can listen to the Arduino pin analog input to open or close the sub-circuit. The Shimano series is a commercialized product for gear ratio adjustment. To integrate the Shimano series into the electronic circuits, the shift switch is rebuilt. The cover and the mechanical button of the switch are abandoned, with the inner connection exposed for wire connection. Take one control option as an example: when users touch the “Gear Increase” button, an impulse signal will be generated from Arduino and sensed by the optoisolator, and the sub-circuit for gear change will close for a while, to generate the proper the input signal for Shimano Series and executes its function to mechanically adjust the gear ratio. For the touchscreen input for execution, there are three buttons for mode controls and two for gear adjustment (Figure 13b).
The display subsystem shows real-time measurement and analysis of bicycle performance, and gives recommendations to maintain healthy riding. Upon the activation of the application, the BLE automatically begins the scanning procedure and establishes the connection with the major Arduino (identified by ID) placed on PurdueTracer. The direct measurements include velocity of the bicycle and human pedaling, pressures for main line and accumulator, and the heartrate of rider. The measured data are stored in order in a buffer to ensure the continuity and stability of data transmission. PurdueTracer performs real-time monitoring of system performance, which enables users to know their system operation condition and promotes safety by reducing the chance of unpredicted accidents (Figure 13b). After acquiring system pressure and bicycle velocity, real-time calculations are performed in the application to display real-time flow rate and torque. Simultaneously, PurdueTracer can provide riders with the instantaneous system efficiency by matching the operation conditions in the efficiency plots (Figure 5).
In addition, PurdueTracer is equipped with a recommendation function to avoid excessive exercise. The maximal heart rate one should have is illustrated in Equation (13) for men and Equation (14) for women [22]:
As a user-oriented design, PurdueTracer provides personalized recommendations (Figure 13b). Users can provide personal information at the time of sign-up on the log-in page (Figure 13e). The application automatically adjusts the maximal heart rate criteria. During the pedaling, PurdueTracer constantly monitors the rider’s heartrate and compares it to the maximum number. When the rider’s heartrate exceeds 90% of the maximal value, PurdueTracer will recommend that users ride slowly or release stored energy to aid with the riding process if the accumulator has enough pressure.
To further add to the user-oriented features, PurdueTracer includes design features that facilitate the usage and promote the comprehensiveness of the system, as listed on the main page of the application (Figure 13a). Users can use the geolocation function (Figure 13d) to choose theor preferred riding location, record favorite places, and get weather predictions (Figure 13c) and navigation information to reach the location. Frequently asked questions (FAQ) and contact information are implemented to help users.
5.2. Data Measurement
Proper sensors are installed in the PurdueTracer as shown in Figure 10, to enable the functionalities of the application described in the previous section, but also to collect the data necessary to perform the model validation. Three different kinds of sensors (a total of five sensors) are installed to collect data regarding speed, hydraulic pressure, and user heartbeat.
• Velocity Sensor: Hall Proximity Switch Sensor
Two hall sensors were used. As shown in Figure 10, Sensor 8 was installed at the wheel to measure the translational speed of the vehicle; sensor 9 was used to determine the pedaling speed of the rider, which was installed on the gear. For this purpose, a small magnet was installed on the wheel. With the gear rotation, pulses are generated by the hall sensors and properly processed by the Arduino microcontroller to calculate the real RPM of the wheel and the gear. Specifically, both sensor 8 and sensor 9 have pins to receive and transmit the signals: a power pin (connected to a 5 V source), a ground pin, and a signal pin (connected to the analog pins on the Arduino microcontroller). The Arduino microcontroller was programmed to read the status of Analog pin 2 and Analog pin 3 continuously to catch the pulses generated by these hall sensors, which switch the signal from a low- to a high-level voltage signal every time the sensors approach the magnet. So the time interval between the two generated pulses represents the time spent on going forward the distance of one wheel circumference. The current speed can be calculated I as illustrated in Equation (15):
• Pressure Sensor: Parker’s IQAN-SP 0–500 bar Pressure Sensor
Pressure sensors 6 and 7 in Figure 10 are placed in the hydraulic circuit to measure the pressure in the mainline connecting the pump and the motor, and to measure the accumulator pressure, respectively. Also, the pressure sensors have three pins to receive and transmit the signal (voltage). The signals generated by these pressure sensors were connected to proper analog pins of the Arduino microcontroller. The Arduino microcontroller would map voltages between 0 V and 5 V into integer values between 0 and 1023. To obtain the actual pressure, this integer value is first converted into a voltage value:
Then, according to the empirical relationship between hydraulic pressure and output voltage provided by sensor manufacturer (Parker), the value of the voltage signal has a linear relationship with the actual hydraulic pressure, as illustrated in Equation (13):
• Heart Rate Sensor: Pulse Sensor Amped
A heart rate sensor (Figure 10) was installed on the handle bar for monitoring the health of the rider. It combines a simple optical heart rate sensor with amplification and noise cancellation circuitry, which make it fast and easy to get reliable pulse readings. The sensor consists of a bright green LED and light detector. Generally, the light is bright enough to pass through the finger and be detected by a light detector. When the heart pumps a pulse of blood through the blood vessels, the finger becomes more opaque to make less light reach the detector, which generates a different voltage signal to be received by the Arduino microcontroller. The Arduino would record the time interval between two different signals, which represents the time spent pumping one pulse of blood. So the BPM (beats per minute) could be calculated in real time. The pulse sensor also has three pins and the signal pin was connected to a corresponding analog pin 1 of the Arduino microcontroller.
5.3. Regeneration Mode Implementation
The regeneration mode is set by the cyclist when he/she actuates the braking lever. As shown in Figure 14, the regeneration controls the setting of the proportional relief valve through a proportional lever. The system requires a micro-controller and a separate 9 V rechargeable battery. The relationship between the input voltage and relief valve pressure given by the manufacturer (Sun Hydraulics corp, Sarasota, FL, USA) is used to set the voltage level to the control valve. The pressure setting of the relief valve can be lowered by increasing the input voltage signal, which is determined by the proportional lever installed in the bike. The lever signal is used as input by the Arduino microcontroller. The microcontroller has to consider that a higher voltage input signal from the lever (corresponding to an increased braking command by the cyclist) corresponds to a lower voltage signal to be sent to the relief valve.
6. Results and Model Validation
6.1. Performance Experiment
Once the PurdueTracer was built, experiments were performed to verify the proper functioning and the accuracy of the numerical modeling procedure described in the previous sections of this paper.
Table 4 shows the measured performance, which can be compared with the numerical results in Table 2.
Improvements in the measured performances in boost mode were expected due to the gear shifting (not present in the numerical model).
Significant is the comparison between the simulated model and the real test of the Boost Mode. In the test shown in Figure 14, the accumulator was set with a pre-charge of 55 bar. The accumulator was charged to 150 bars with the hand pump, and then the stored energy was released to drive the bicycle.
As illustrated in Figure 15, the accumulator pressure of experimental results show consistency with the prediction of the model. Some inaccuracies are related to the estimated resistance terms of Equation (7), but the results are satisfactory.
Figure 16 shows the results of the OF2 function related to the boost mode. The authors paid particular attention to studying the effect of the accumulator pre-charge pressure p0 on the achievable OF2, which was also required for the final NFPA event [17]. The model was particularly useful for this study: as shown in Figure 16, the bicycle reaches the maximum OF2 when p0 = 25 bar.
6.2. Competition Performance
The PurdueTracer excelled at the NFPA final competition event held in April 2017 at Ames, Iowa. Three sub-competitions reflected the performance of the vehicle:
- Sprint race: demonstrated the ability of the vehicle to move a short distance (about 200 m) quickly.
- Efficiency challenge: demonstrated the ability of the vehicle to effectively store energy and efficiently use the stored energy to propel the unassisted vehicle.
- Endurance challenge: demonstrated the reliability, safety, replicability, and durability of the fluid power system design and assembly.
A more detailed document on the rules of the competition can be found on the FPVC website [17]. Table 5 shows a summary of the scores and judges’ evaluation of the Purdue team.
Overall, the vehicle received quite a few positive comments from competition judges. The workmanship, innovative design of integrating a fluid reservoir in the frame, and electronic control by smartphone app were the aspects highly favored by the judges.
7. Conclusions
This paper presents the design methodology used to create the PurdueTracer: a light-duty hydraulic hybrid vehicle. PurdueTracer eliminates the classic chain-sprocket mechanical transmission, and implements a fluid power transmission system with electronic controls. The vehicle is capable of storing energy during charging phases or through regenerative braking.
The hydraulic layout was developed to permit the vehicle to work in four modes selected by the user: normal pedaling, charging, boost, and regenerative braking. The selection of the hydraulic components and of the gearbox ratios was made through a numerical optimization on a lumped parameter model of the vehicle implemented in AMESim. Objective functions were defined to quantify the performance of the vehicle in pedaling and in accumulator boost operation. A lightweight aluminum chassis was designed to integrate the system reservoir and accommodate all the hydraulic components. An electronic control and data acquisition system was implemented to enable the different working modes and monitor the status of the vehicle and of the cyclist. The system is equipped with wireless controls, with an Arduino microcontroller collecting and analyzing sensor measurement, and an Android application performing advanced calculations and user-oriented functions for intuitive interactions.
Measurements were performed to verify the initial model predictions. It was shown that the vehicle is capable of travelling 393 m using the 2 L accumulator, and can achieve a maximum velocity of 36 km/h during pedaling. This performance was achieved on the occasion of the 2017 National Fluid Power Association’s Vehicle Challenge. The PurdueTracer scored first in the following sections: Efficiency Challenge, Best Design, and Reliability and Safety, receiving the title of overall champion.
Acknowledgments
This work was partially founded by the National Fluid Power Association (NFPA), through the companies supporting the Pascal Society of the NFPA Education and Technology Foundation.
The authors would also like to acknowledge the companies who contributed to this project with component donations: Casappa (gear pumps and motors); Sun Hydraulics, SunSource, and Eaton Corporation (hydraulic control valves); Steelhead Composites (accumulator); and Lube-Tech (hydraulic oil); Misumi (gears and bearings). Finally, the authors would like to thank Siemens PLM, for the in-kind use of the AMESim simulation software.
Author Contributions
The paper is a joint effort of all the authors listed in the first page. All the authors, working as a team, contributed to the formulation, the design, the numerical analysis and the fabrication of the vehicle. In particular, Gianluca Marinaro is the leading author; he contributed to the hydraulic system designs and mechanical fabrications, with assistance from Zhengpu Chen and Yizhou Mao. Zhuangying Xu and Chenxi Li formulated and implemented the electronic data acquisition and control system; they also designed the smartphone app for the PurdueTracer. The whole project was supervised by Andrea Vacca, who also conceived the main ideas behind the hydraulic circuit design. All the authors participated to the NFPA Vehicle Challenge 2017 national competition (April 2017), representing the team of Purdue University.
Conflicts of Interest
The authors declare no conflict of interest. The founding sponsors had no role in the design of the study; in the collection, analyses, or interpretation of data; in the writing of the manuscript, and in the decision to publish the results.
Nomenclature
| A | user age, year |
| acceleration of the vehicle, | |
| drag coefficient in longitudinal direction | |
| coefficient of viscous friction, N/(m/s) | |
| aerodynamic force, N | |
| friction force, N | |
| slop force, N | |
| propelling force, N | |
| maximal user heart rate, bpm | |
| wheels inertia, kg·m2 | |
| distance traveled by the vehicle, inch | |
| cyclist and vehicle mass, lbs | |
| cyclist mass, kg | |
| vehicle mass, kg | |
| polytrophic exponent (ideal gas) | |
| motor shaft rotational speed, rpm | |
| pump shaft rotational speed, rpm | |
| objective function of the optimization problem | |
| wheel circumference, m | |
| accumulator pre-charge pressure, bar | |
| accumulator pre-charge pressure during the competition, psi | |
| initial accumulator pressure in regeneration mode, bar | |
| nitrogen gas pressure in the accumulator, bar | |
| accumulator max working pressure, bar | |
| measured pressure, bar | |
| accumulator min working pressure, bar | |
| flow needed for fluid motor speed, L/min | |
| pump flow, L/min | |
| gearbox ratio of the motor | |
| gearbox ratio of the motor | |
| wheel radius, m | |
| vehicle active area for air resistance, m2 | |
| torque on the rear wheel, N·m | |
| effective torque on the motor shaft, N·m | |
| effective torque on the pump shaft, N·m | |
| starting velocity in regeneration mode, m/s | |
| accumulator volume, in3 | |
| motor volumetric displacement, cm3/rev | |
| pump volumetric displacement, cm3/rev | |
| nitrogen gas volume in the accumulator, m3 | |
| vehicle velocity measured by electronic system, m/s | |
| voltage signal output of pressure sensors, V | |
| vehicle velocity in pedaling mode, m/s | |
| vehicle velocity, m/s | |
| wind velocity, m/s | |
| pressure difference between motor inlet and outlet, bar | |
| pressure difference between pump inlet and outlet, bar | |
| time interval for velocity measurement, s | |
| road slope, ° | |
| motor hydro-mechanic efficiency | |
| pump hydro-mechanic efficiency | |
| motor volumetric efficiency | |
| pump volumetric efficiency | |
| rolling friction coefficients, | |
| air density, kg/m3 | |
| air density, kg/m3 |
References
- Chen, J.S. Energy efficiency comparison between hydraulic hybrid and hybrid electric vehicles. Energies 2015, 8, 4697–4723. [Google Scholar] [CrossRef]
- Midgley, W.J.; Cebon, D. Comparison of regenerative braking technologies for heavy goods vehicles in urban environments. Proc. Inst. Mech. Eng. Part D J. Autom. Eng. 2012, 226, 957–970. [Google Scholar] [CrossRef]
- Harriger, G.A. Hydraulic Drive System for Bicycles and the Like. U.S. Patent 4,546,990, 15 October 1985. [Google Scholar]
- Schmidt, T.; Wilson, D.G. Human Power: Technical Journal of the IHPVA; IHPVA: San Luis Obispo, CA, USA, 2004; Volume 10, ISSN 0898-6908. [Google Scholar]
- Neptune, R.R.; Kautz, S.A.; Hull, M.L. The effect of pedaling rate on coordination in cycling. J. Biomech. 1997, 30, 1051–1058. [Google Scholar] [CrossRef]
- Chattin, J. Hydraulic Transmission for Bicycles. U.S. Patent 6,032,968, 7 March 2000. [Google Scholar]
- Davey, J.A. Bicycles. U.S. Patent 4,290,621, 22 September 1981. [Google Scholar]
- Brackett, D.C. Hydraulic Bicycle with Conjugate Drive Motors and Variable Stroke Crankshaft. U.S. Patent 5,938,224, 17 August 1999. [Google Scholar]
- Chang, L.; Yao, J.F. The development of the electro-hydraulic driving bicycle. Appl. Mech. Mater. 2013, 373, 2132–2135. [Google Scholar] [CrossRef]
- Yang, Y.H.; Zhong, X.Q. Design of Hydraulic Transmission Bicycle based on Top-down Method. Adv. Mater. Res. 2012, 468, 867–870. [Google Scholar] [CrossRef]
- Amarantos, J.G. Hydraulic Powered Bicycle. U.S. Patent 4,087,105, 2 May 1978. [Google Scholar]
- Swain, D.M.; Moore, J.Z.; Maurer, F.C.; Shih, A. Hydraulic Regenerative Braking for a Vehicle. U.S. Patent 7,992,948, 2 May 1978. [Google Scholar]
- Lagwankar, K.D. Hydraulic regenerative system for bicycle. Int. J. Eng. Res. Appl. 2013, 3, 869–875. [Google Scholar]
- Truong, D.Q.; Ahn, K.K.; Khoa, L.D.; Thinh, D.H. Development of a Smart Bicycle Based on a Hydrostatic Automatic Transmission. J. Adv. Mech. Des. Syst. Manuf. 2012, 6, 236–251. [Google Scholar] [CrossRef]
- Wang, F.; Bissen, M.; Ward, W.; Stelson, K. Modeling and design of a hybrid bicycle with hydraulic transmission. Int. J. Fluid Power Syst. 2014, 8, 99–106. [Google Scholar] [CrossRef]
- Foa, M.; Vacca, A.; Senatore, A. HYDROKART: A Human Powered Vehicle a Trasmissione Idrostatica; Oleodinamica e Pneumatica: Milan, Italy, 2017; ISSN 2421-4388. (In Italian) [Google Scholar]
- National Fluid Power Association. Fluid Power Vehicle Challenge, Rules and Awards. Available online: http://nfpahub.com/fpc/vehicle-challenge/rules-and-awards-fpvc/ (accessed on 14 October 2017).
- Wilson, D.G.; Papadopoulos, J. Bicycling Science, 3rd ed.; MIT Press: Cambridge, MA, USA, 2004; ISBN 9780262232371. [Google Scholar]
- Navarro, K.F.; Gay, V.; Golliard, L.; Johnston, B.; Leijdekkers, P.; Vaughan, E.; Wang, X.; Williams, M.A. Social Cycle: What can a mobile app do to encourage cycling. In Proceedings of the 38th Annual IEEE Conference on Local Computer Networks—Workshops, Sydney, Australia, 21–24 October 2013; pp. 24–30. [Google Scholar]
- Burke, E.R. High-Tech Cycling, 2nd ed.; Human Kinetics: Champion, IL, USA, 2002; ISBN 0-7360-4507-4. [Google Scholar]
- Maestrelli, L.; Falsini, A. Bicycle optimization by means of an advanced gradient method algorithm. In Proceedings of the 2nd European HyperWorks Technology Conference, Strasbourg, France, 30 September–1 October 2008. [Google Scholar]
- Tanaka, H.; Monahan, K.D.; Seals, D.R. Age-predicted maxima heart rate revisited. J. Am. Coll. Cariol. 2001, 37, 153–156. [Google Scholar] [CrossRef]
Figure 1.
Physical design for PurdueTracer.

Figure 2.
Circuit design of PurdueTracer.
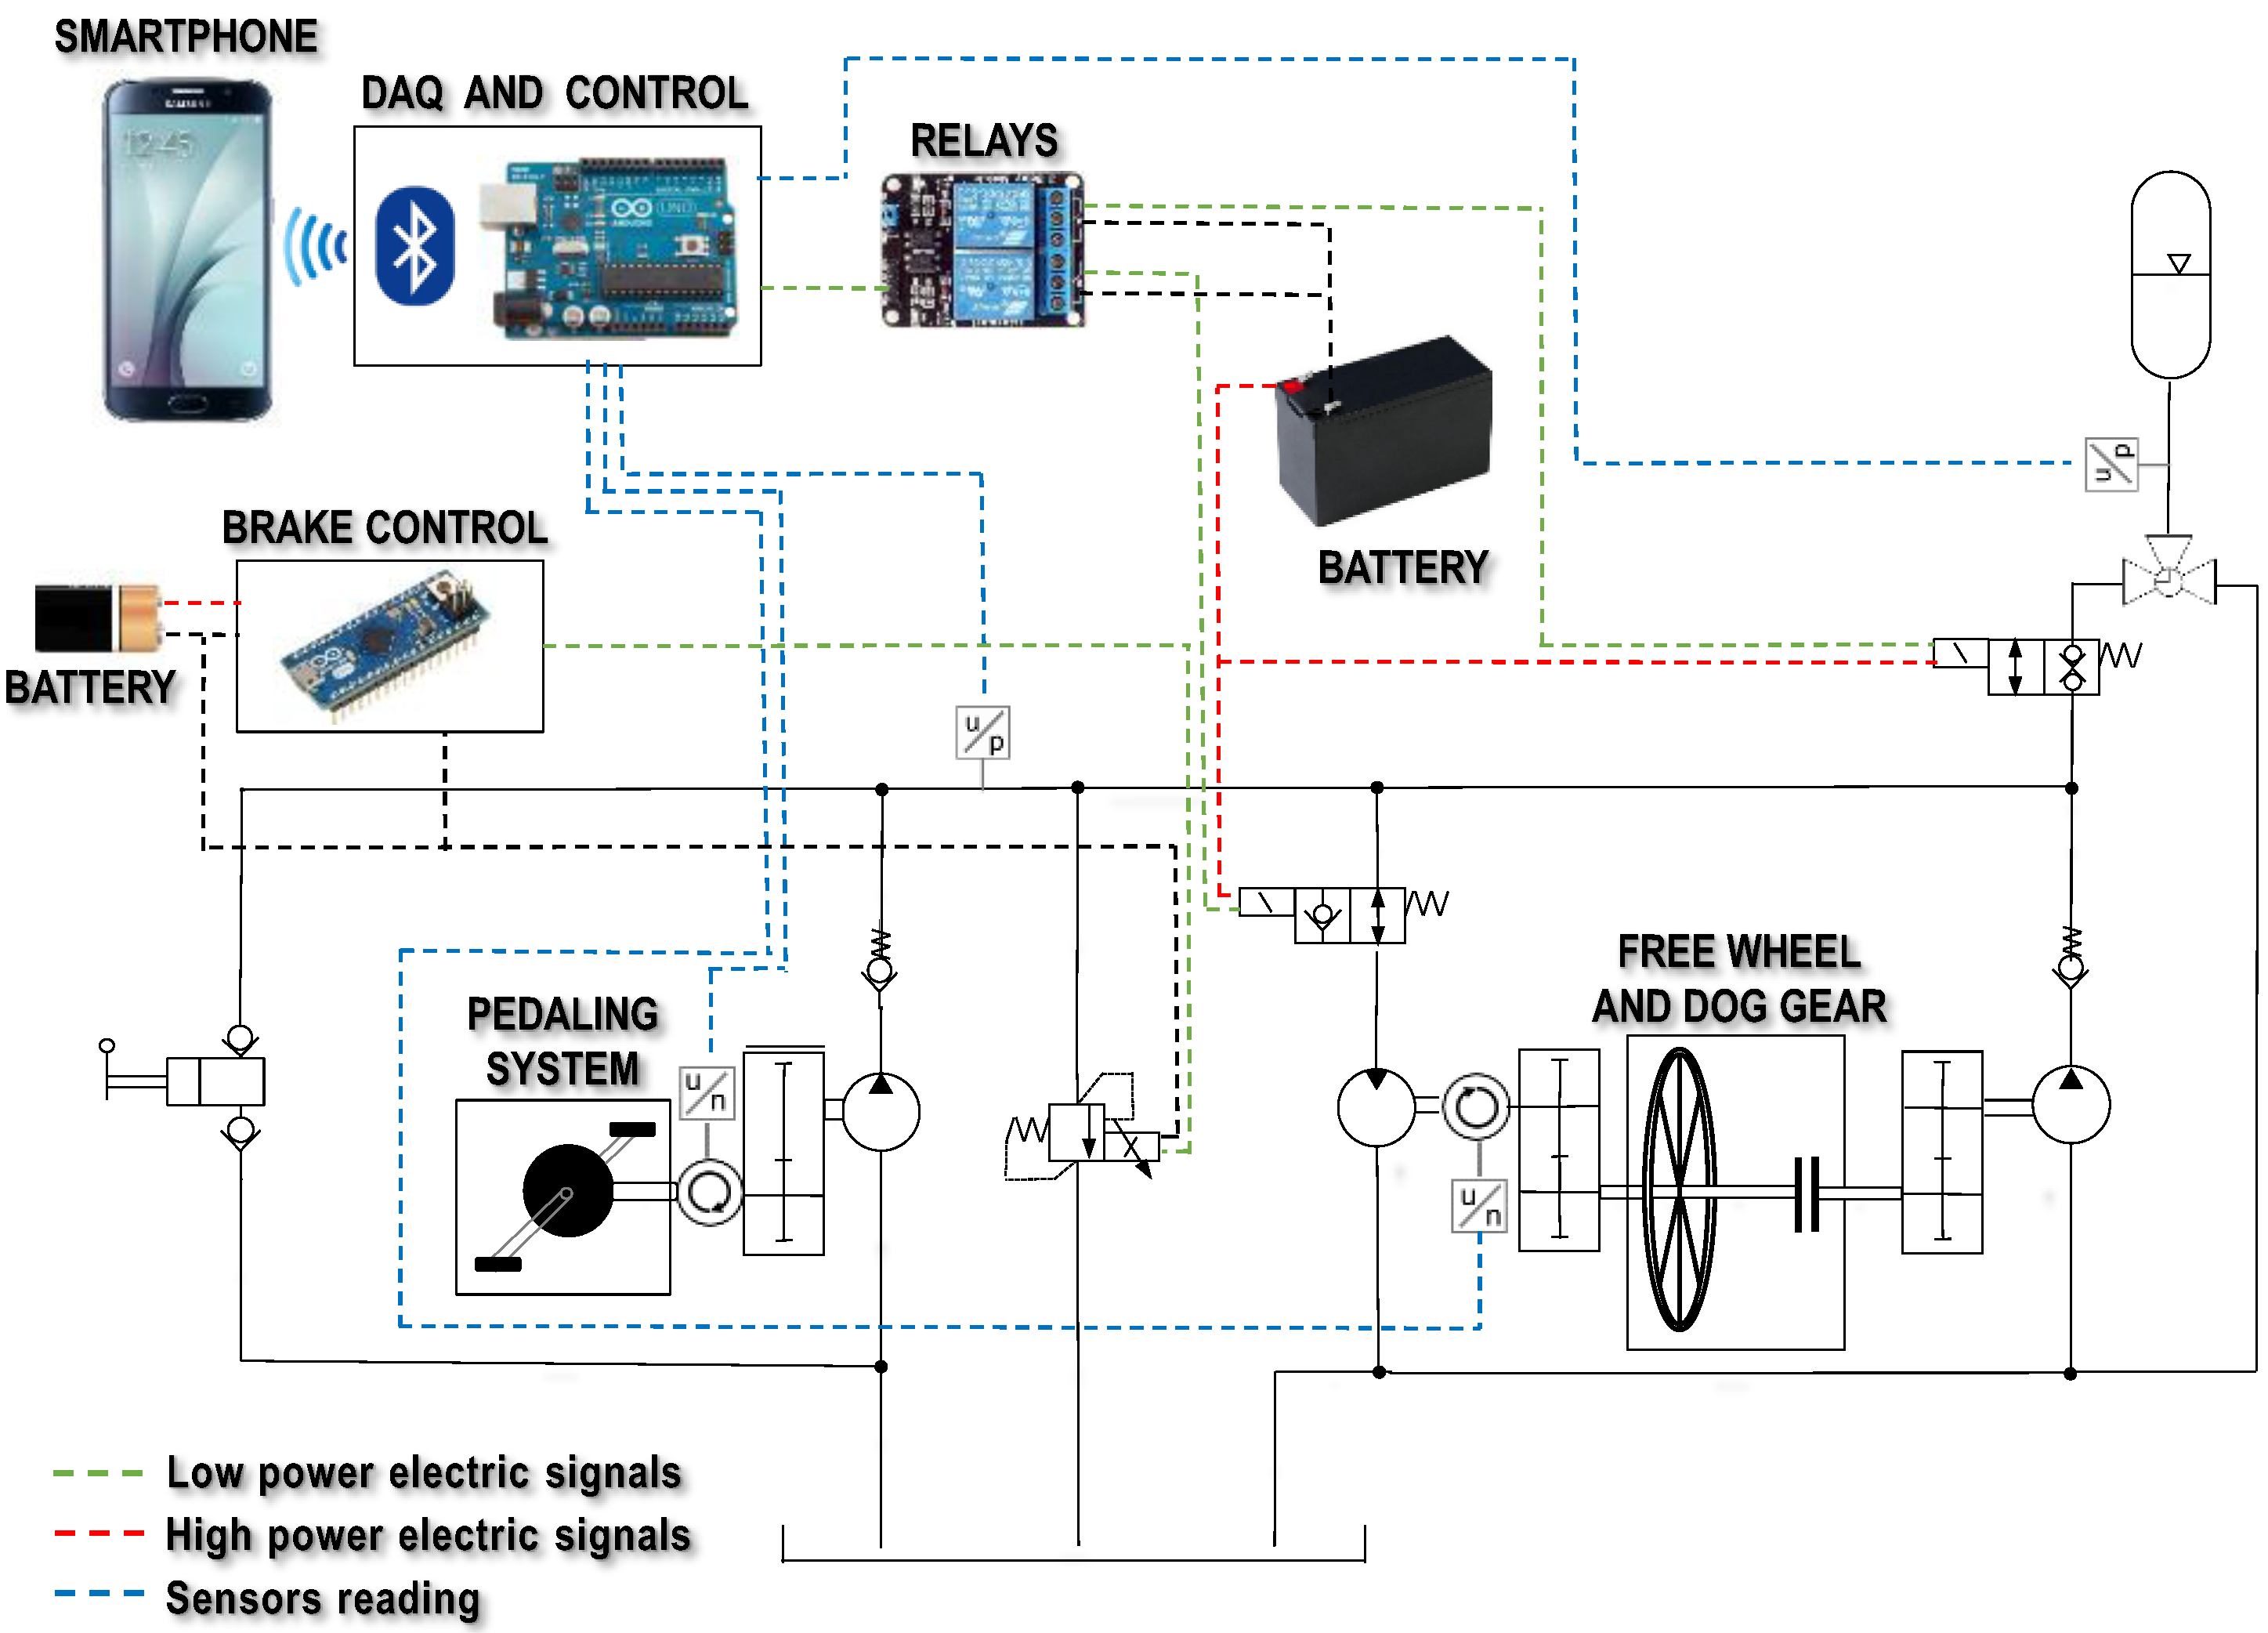
Figure 3.
Hydraulic circuit and valve conditions for (a) Pedaling Mode; (b) Charging Mode; (c) Boost Mode; and (d) Regeneration Mode. Note: Check Valve 1 (CV1); Check Valve 2 (CV2); Relieve Valve (RV); 3-Way L Type Valve (3W); Solenoid Valve 1 (V1), normally open; Solenoid Valve 2 (V2), normally closed; Accumulator (A); Dog Gear (DG); Hand Pump (HP); Pump (P); Motor (M); Regeneration Pump (RP).
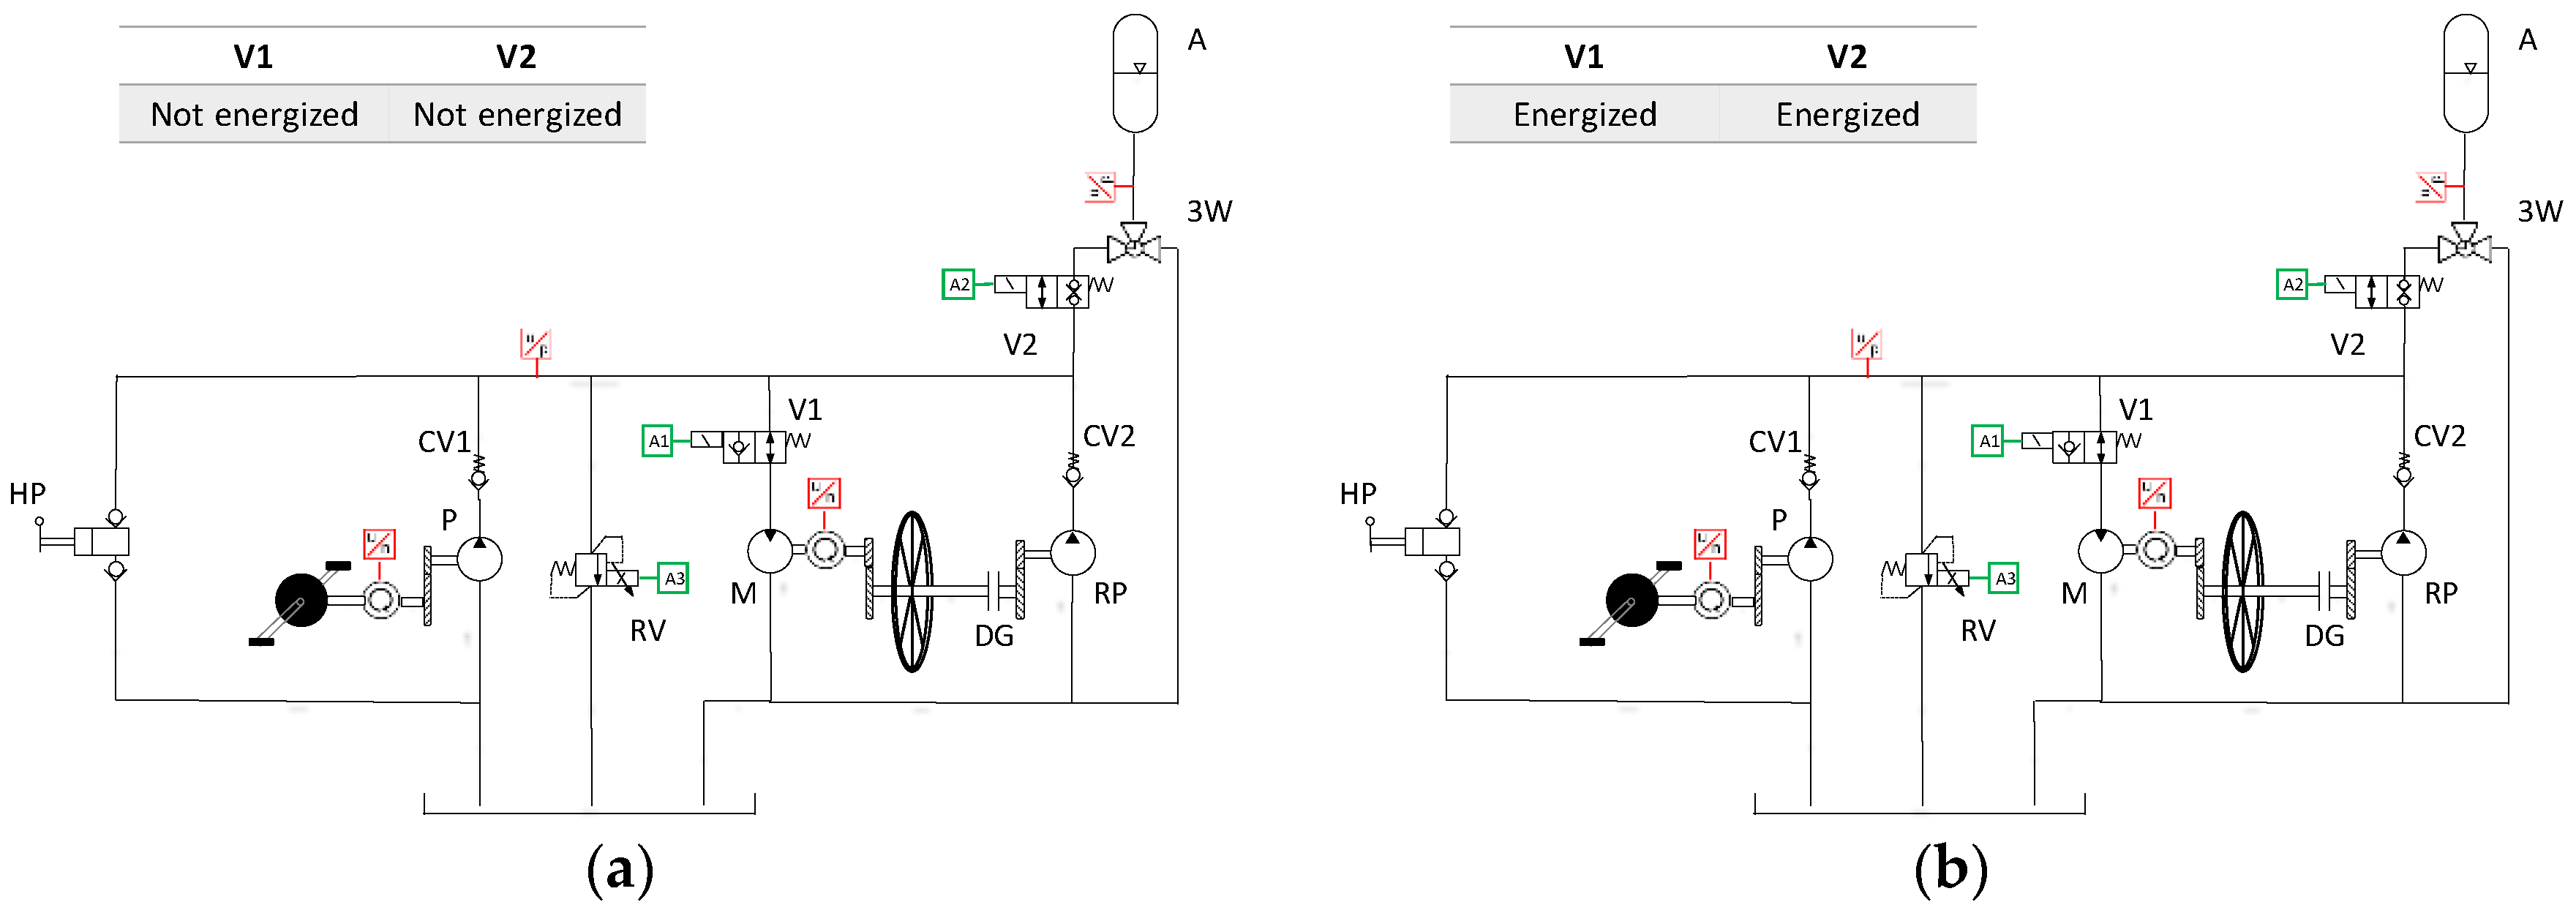
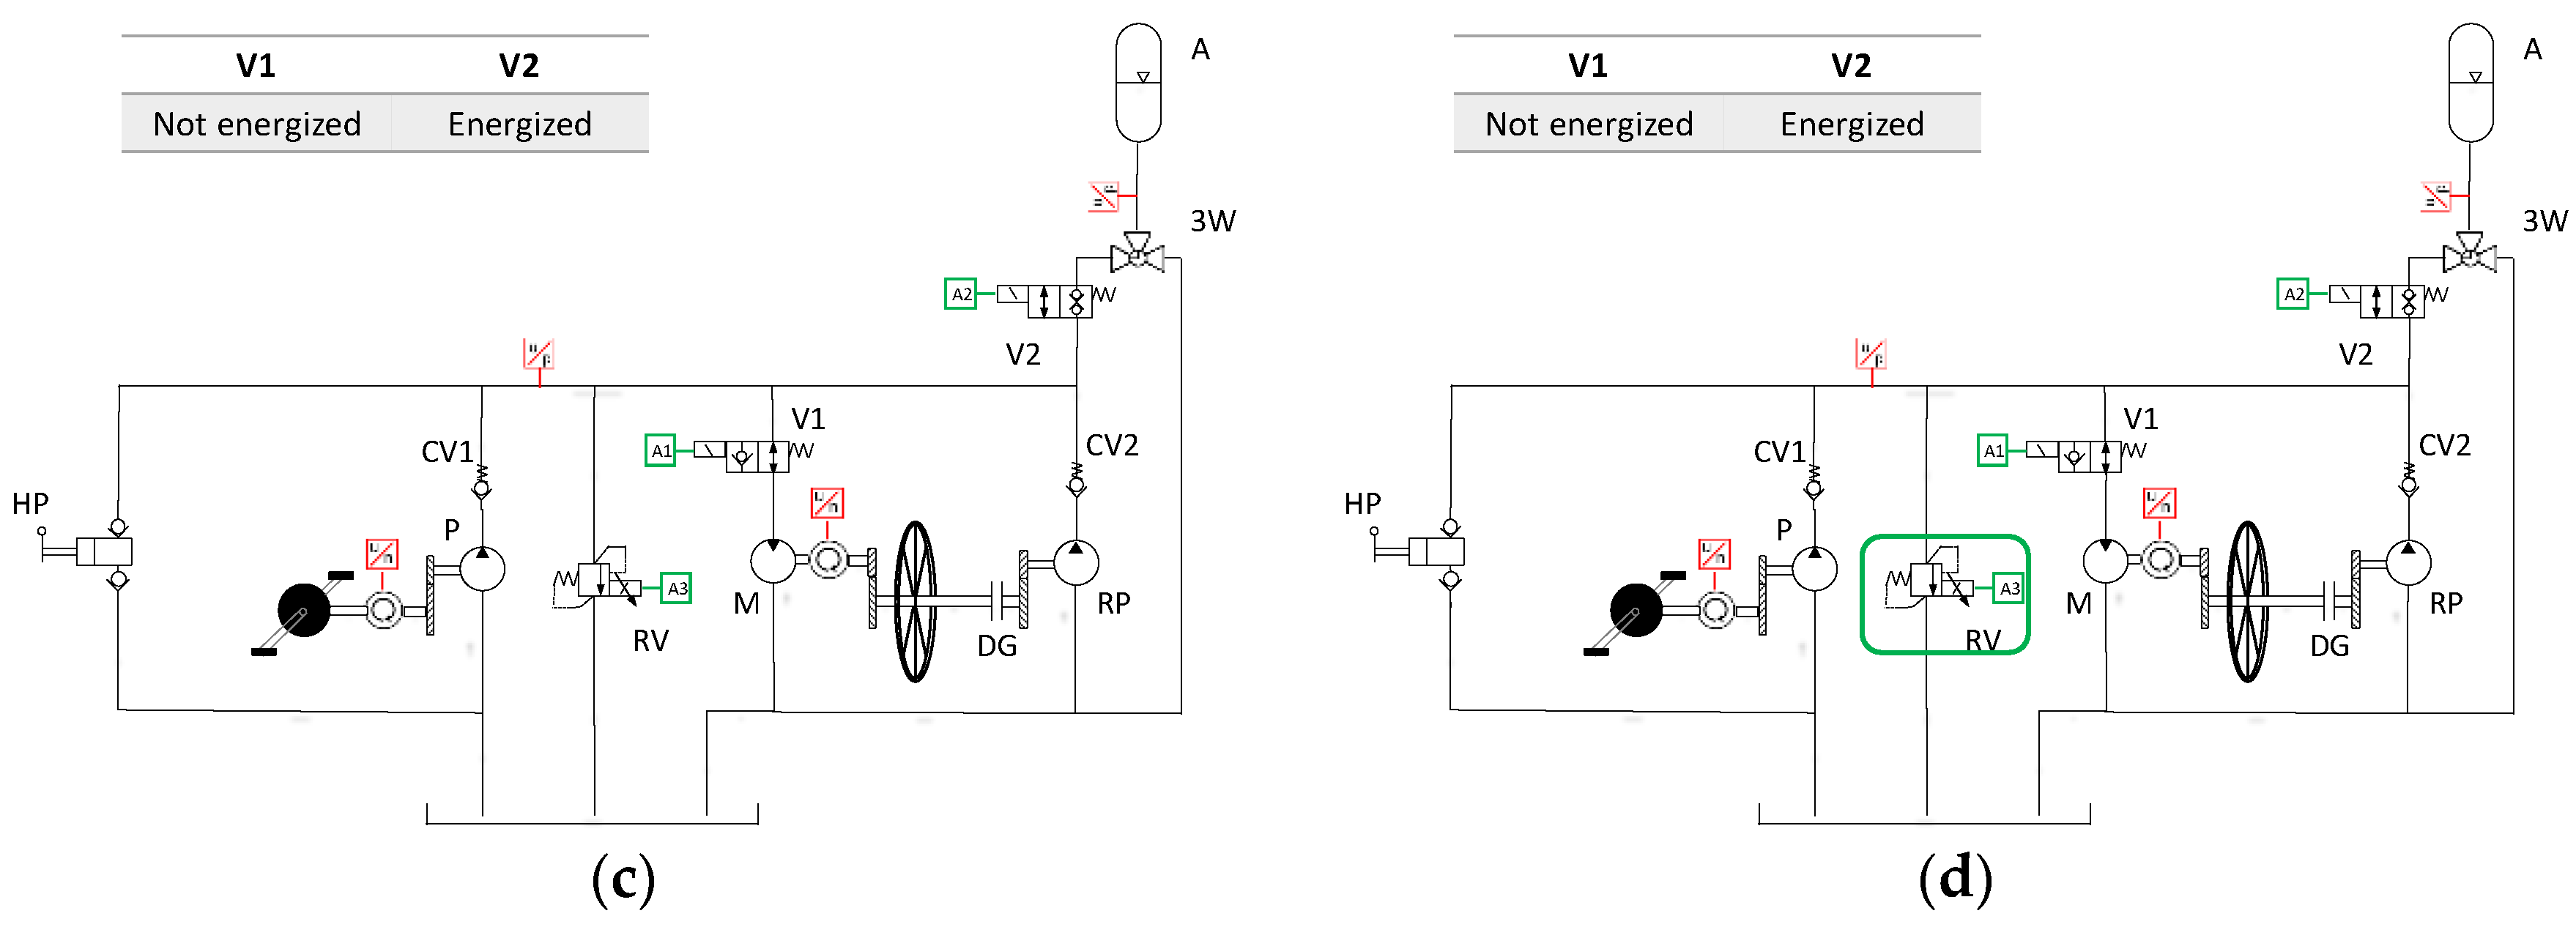
Figure 4.
AMESim model schematic for the entire bicycle.
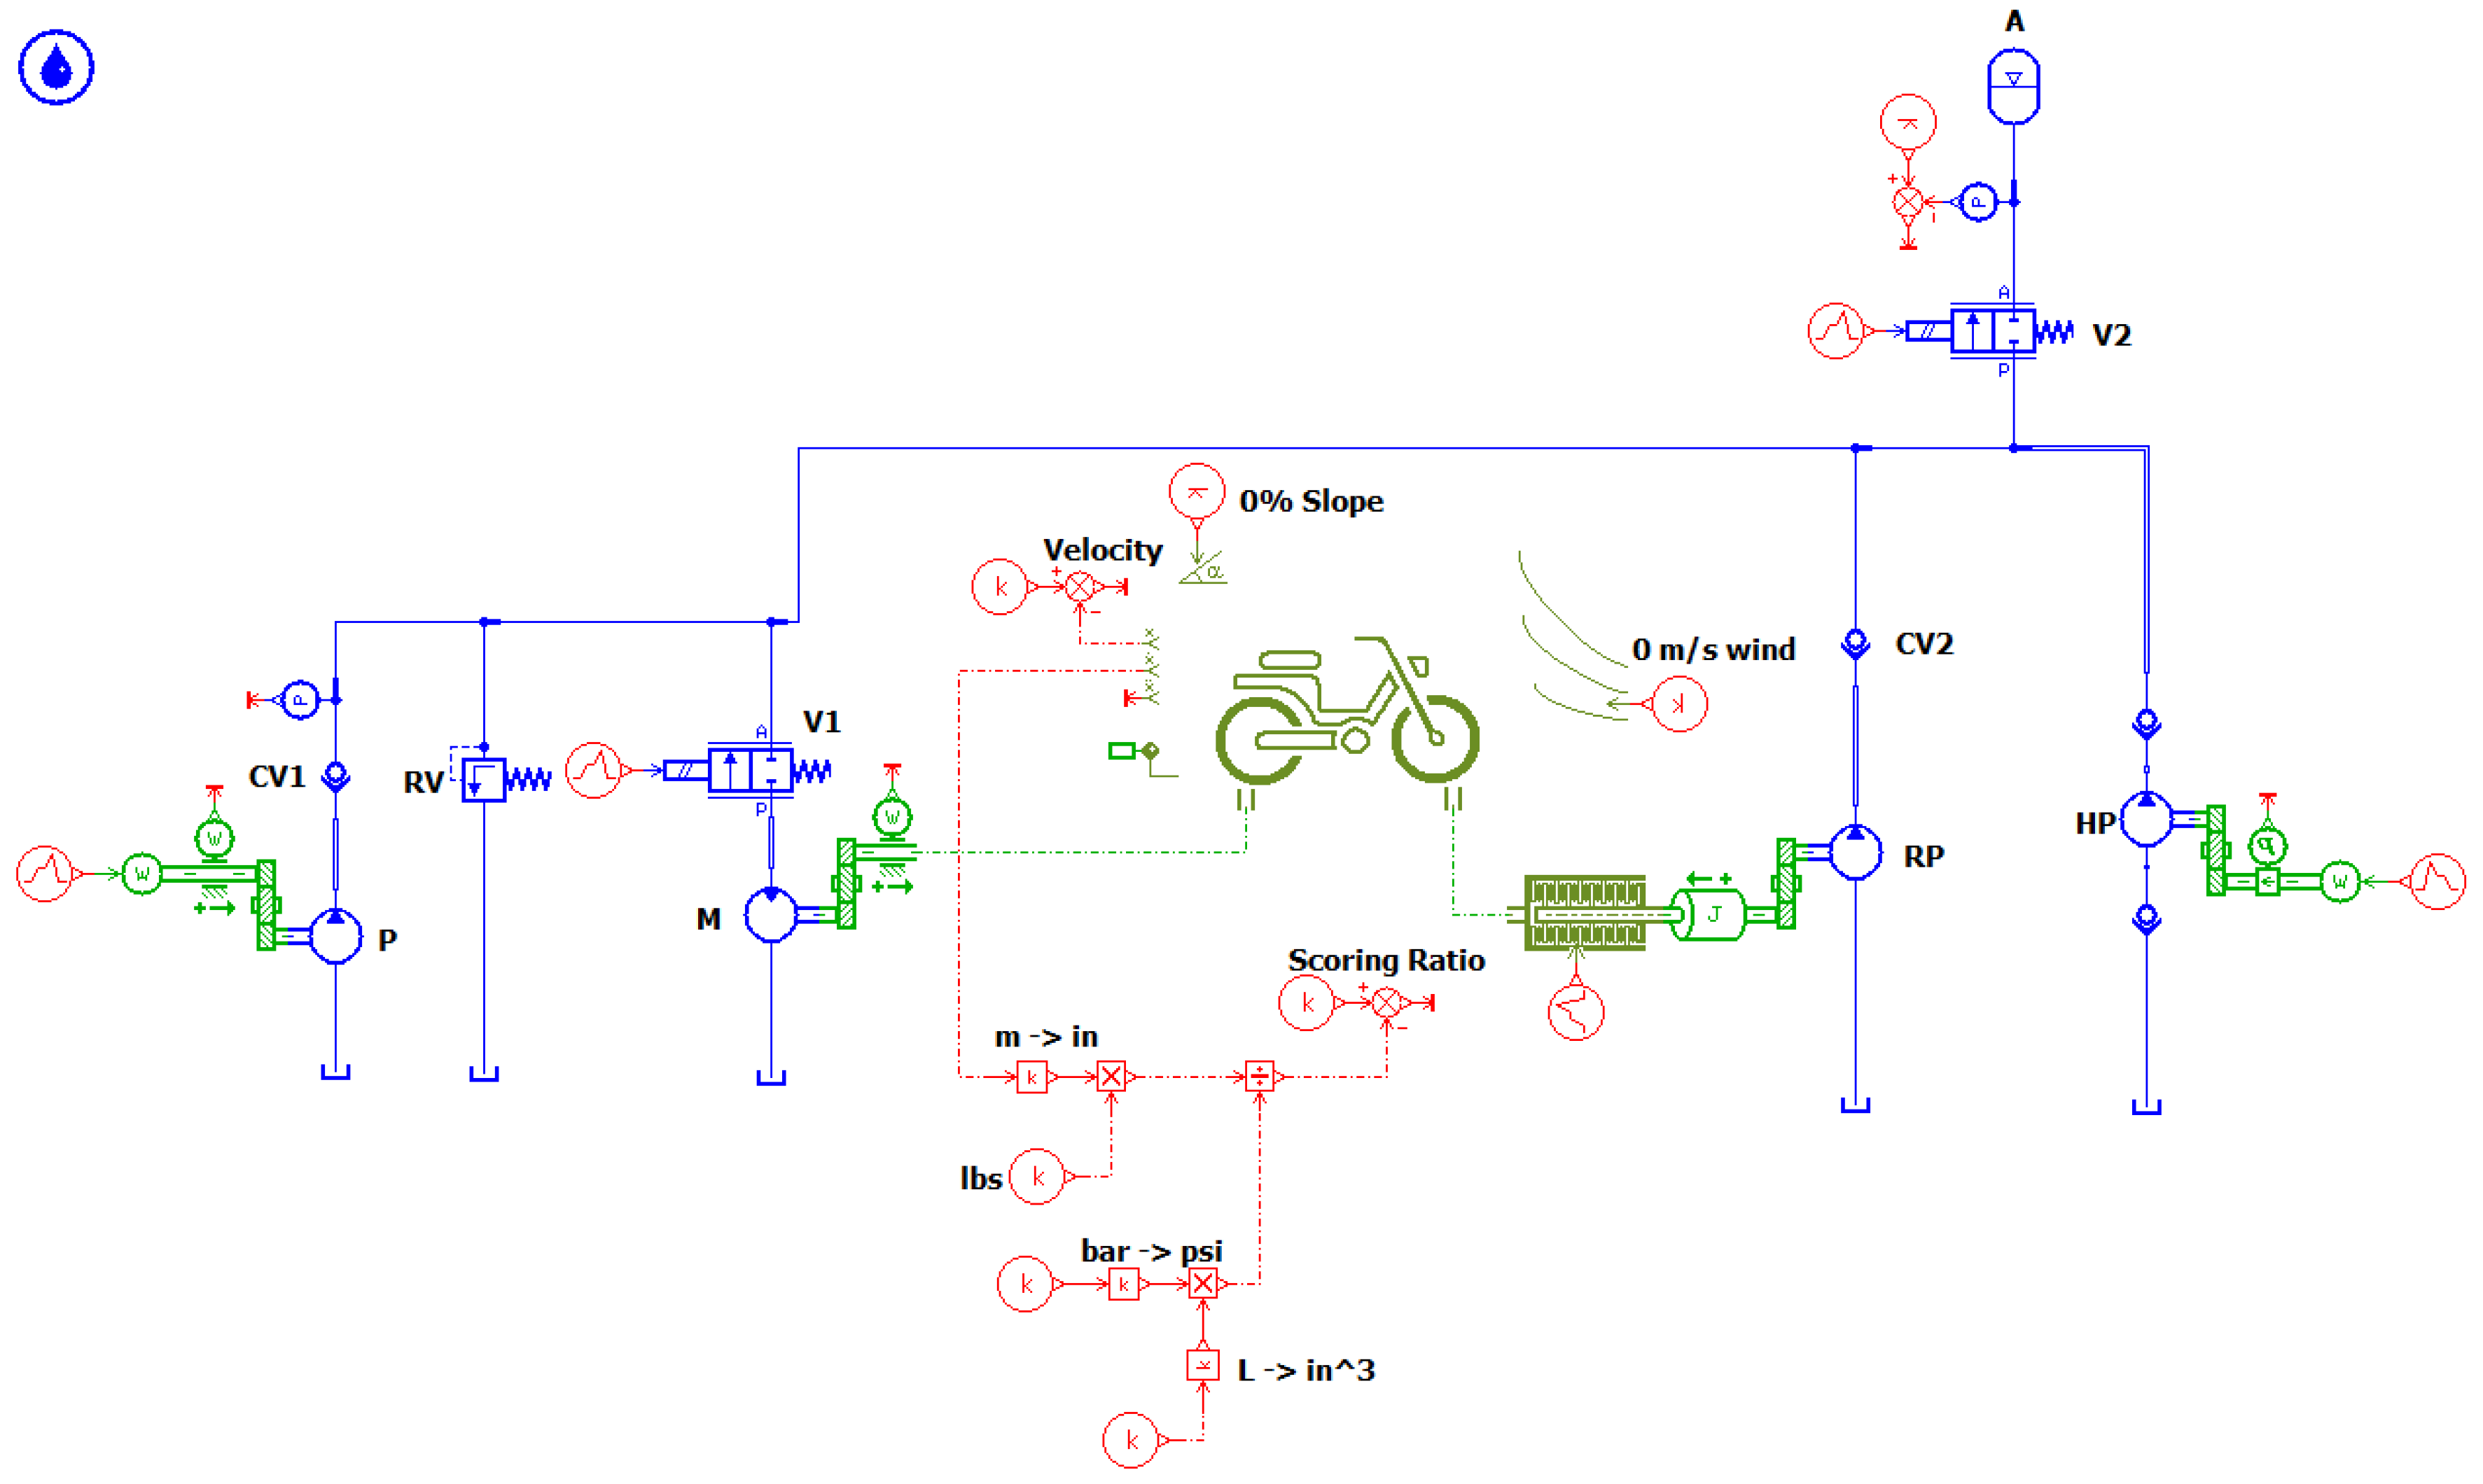
Figure 5.
Efficiency plots for hydraulic pump and motor: (a) hydro-mechanical efficiency; (b) volumetric efficiency.
Figure 5.
Efficiency plots for hydraulic pump and motor: (a) hydro-mechanical efficiency; (b) volumetric efficiency.
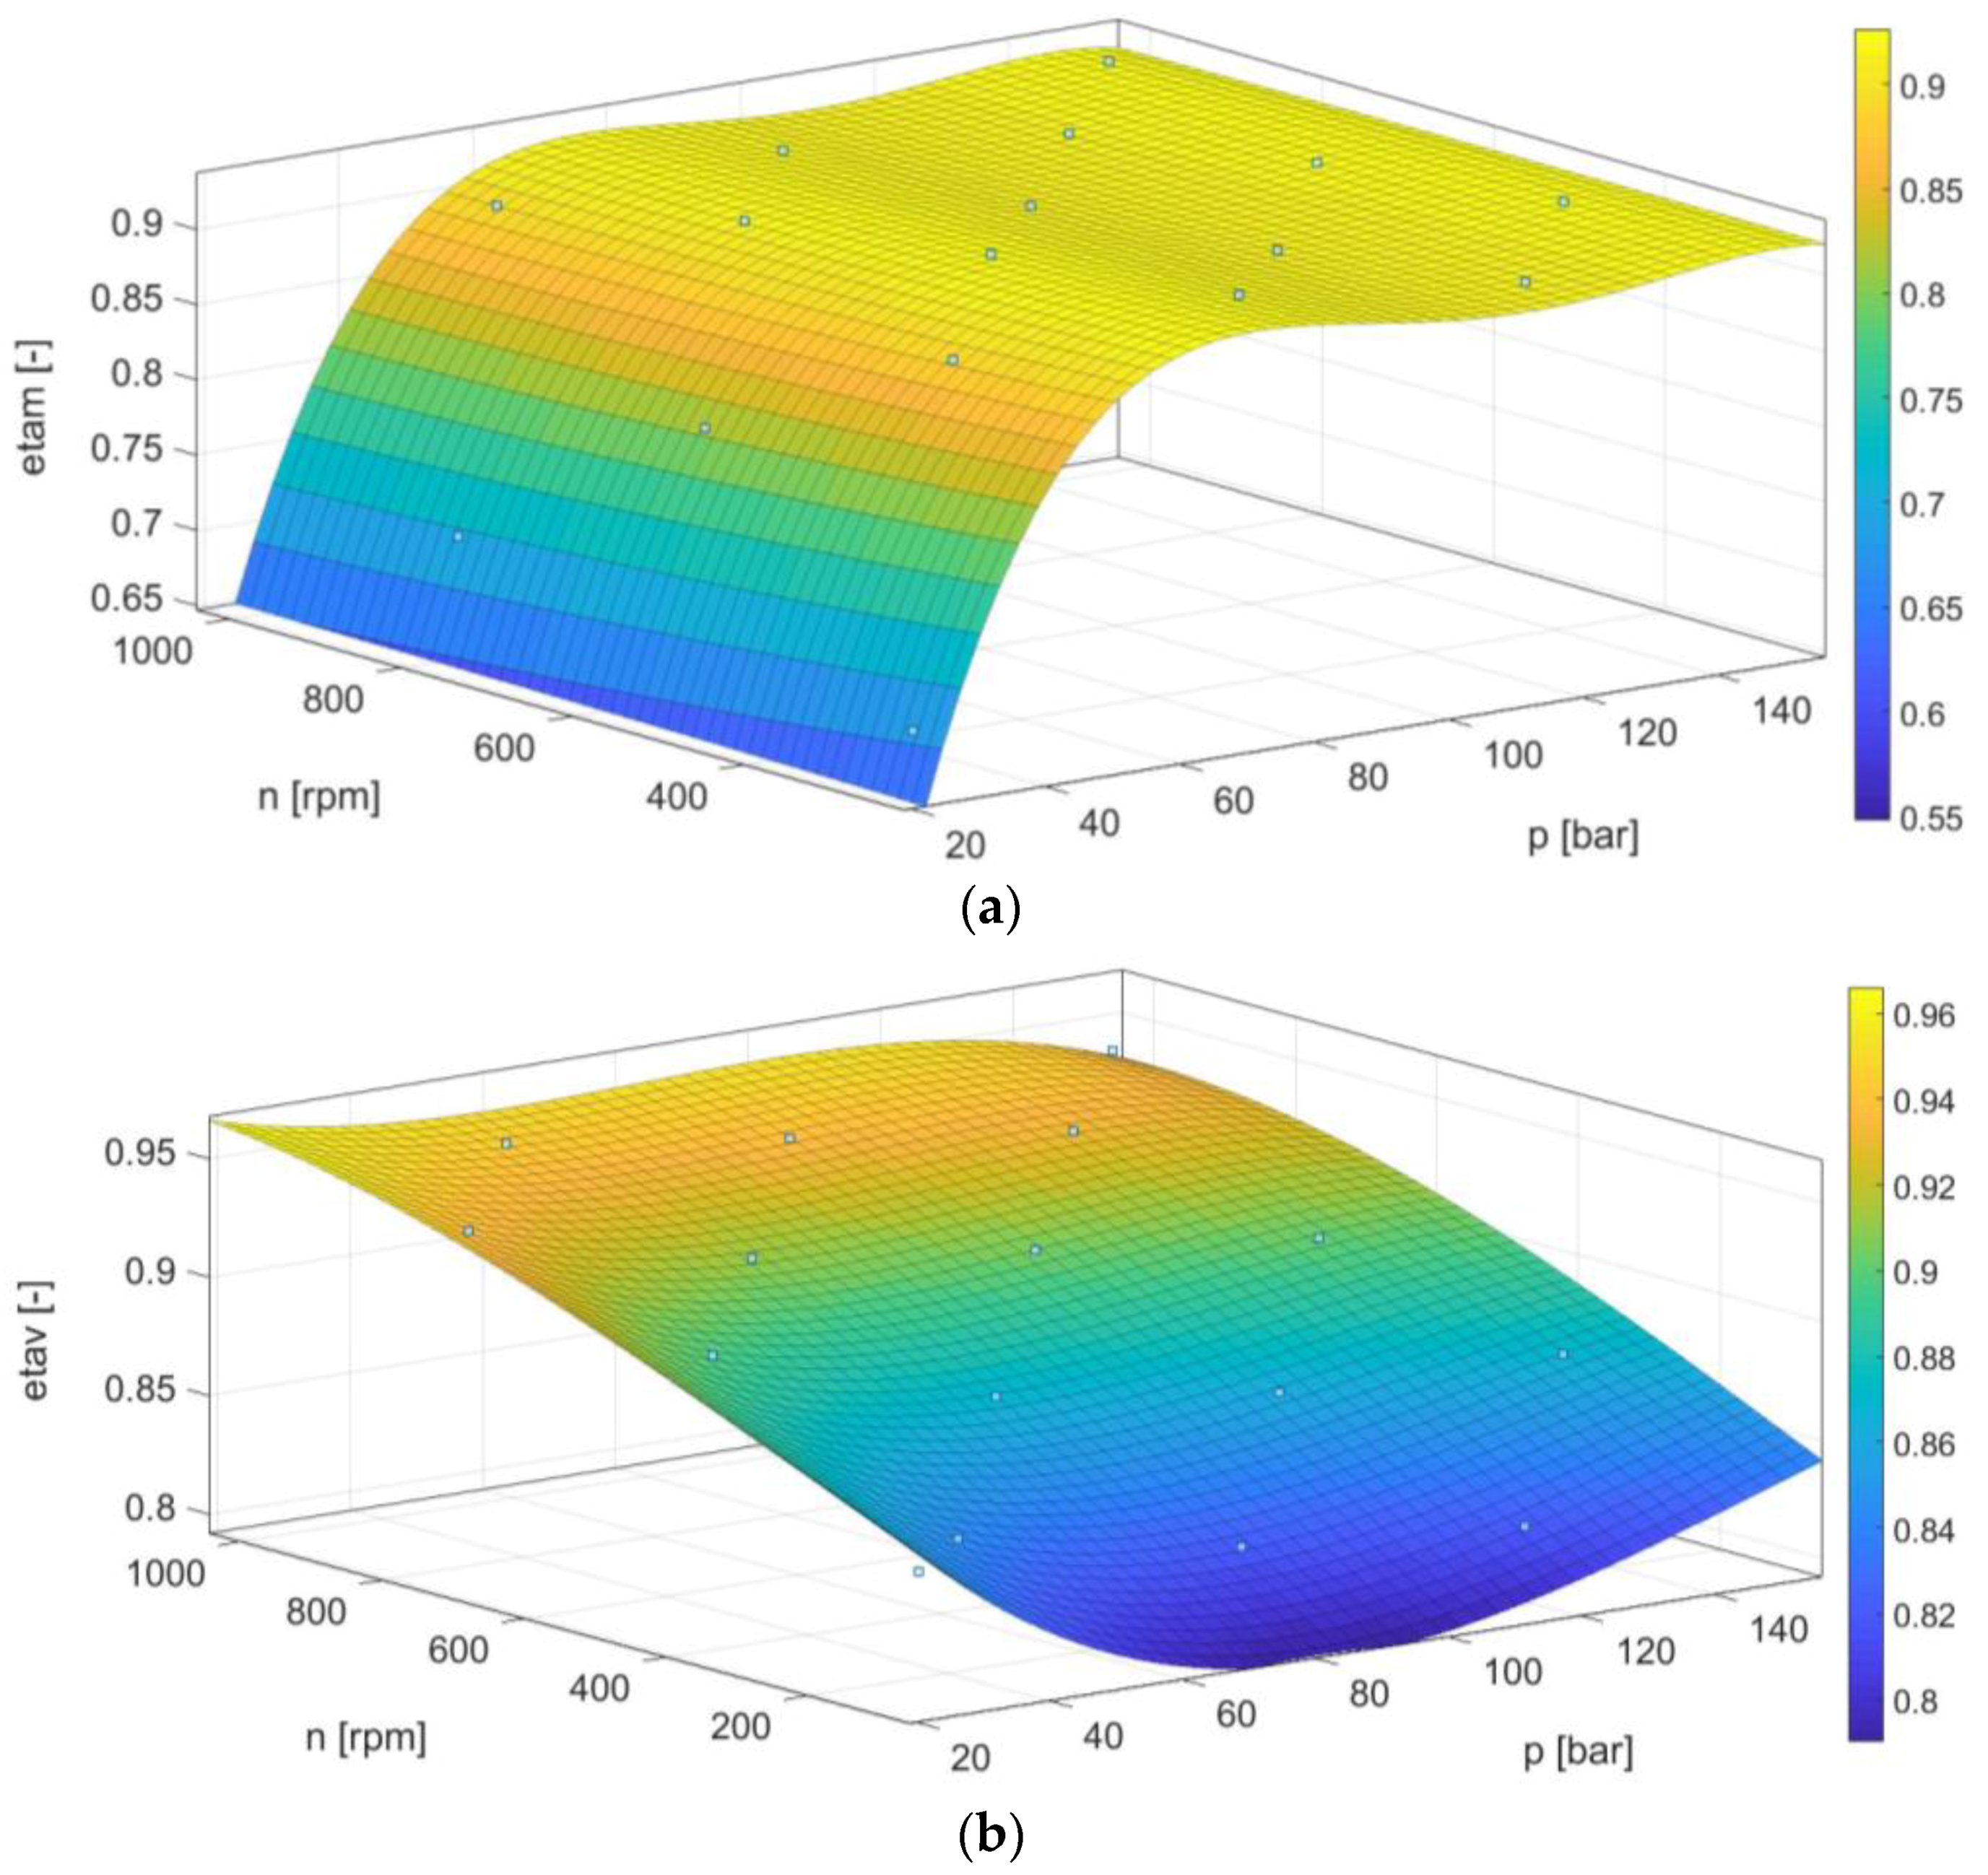
Figure 6.
Results of optimization and simulation models.
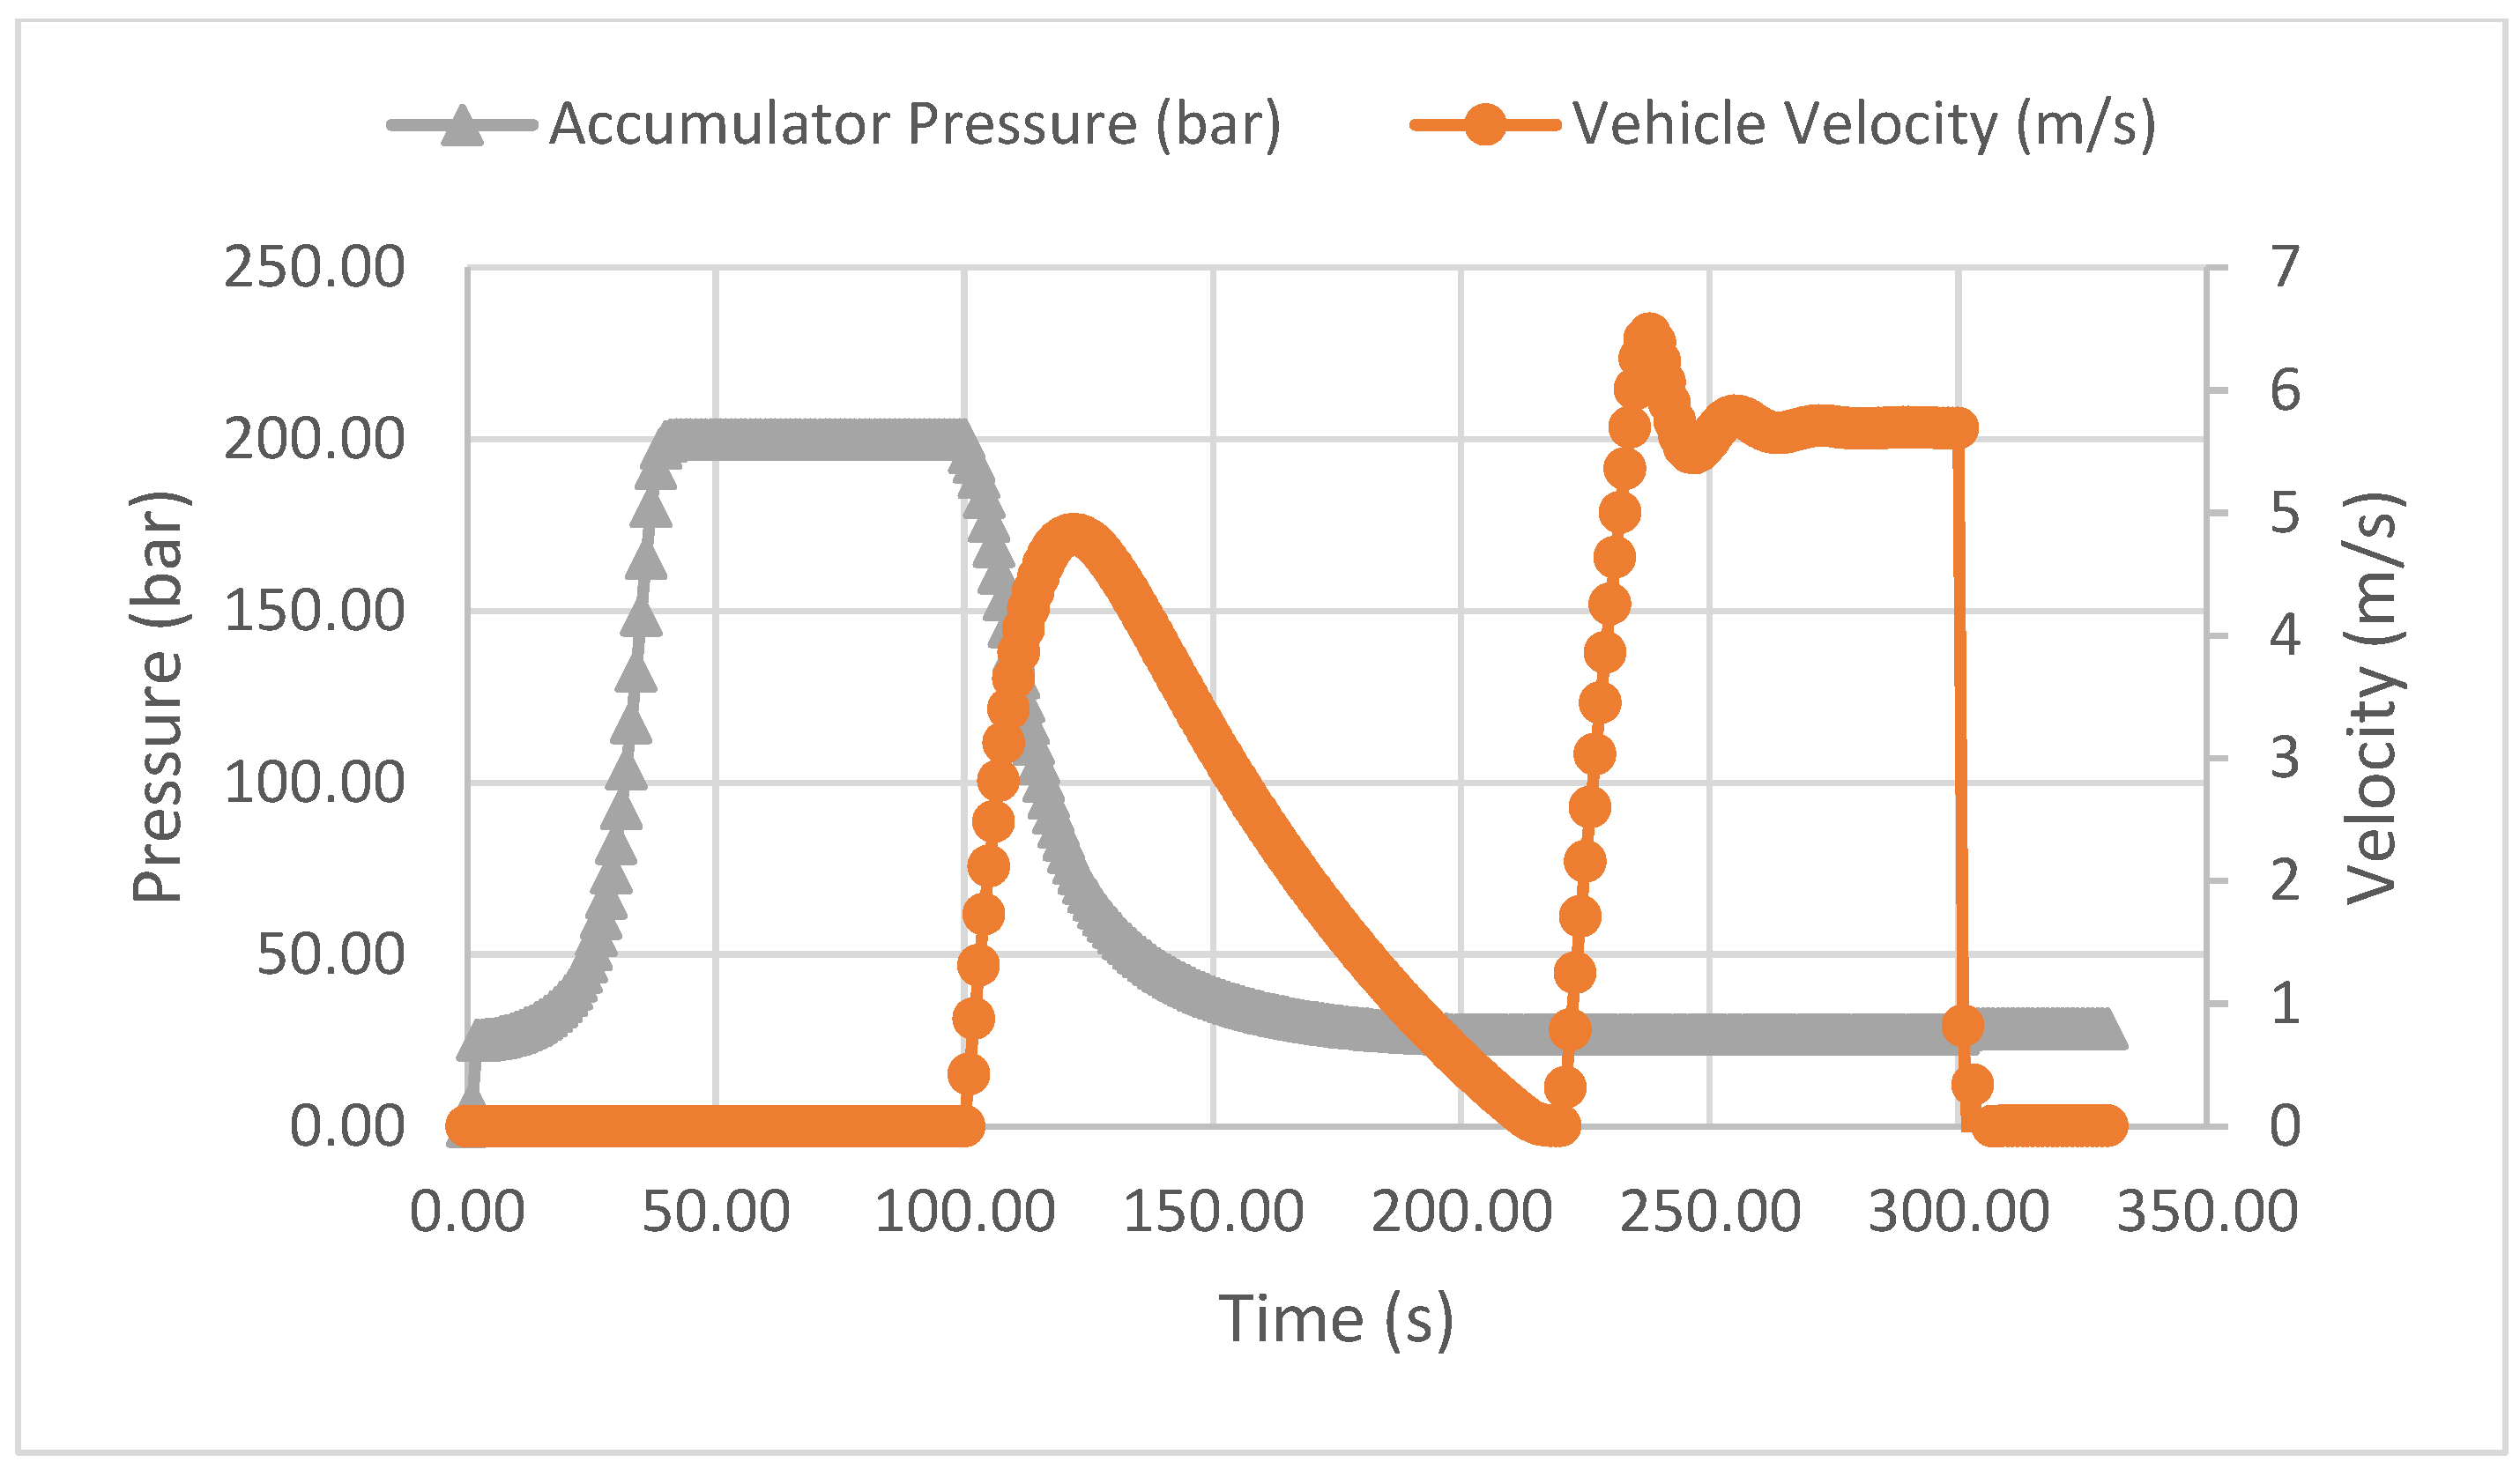
Figure 7.
Bike frame diagram: (a) Traditional bike frame; (b) bike frame of PurdueTracer.

Figure 8.
Sample of 0FEA Analysis for the Frame of PurdueTracer, in case of sitting, pedaling, and pushing on the right pedal loads.
Figure 8.
Sample of 0FEA Analysis for the Frame of PurdueTracer, in case of sitting, pedaling, and pushing on the right pedal loads.

Figure 9.
Gearbox designs: (a) Front gearbox; (b) Motor gearbox and (c,d) Regeneration system gearbox.
Figure 9.
Gearbox designs: (a) Front gearbox; (b) Motor gearbox and (c,d) Regeneration system gearbox.

Figure 10.
Overall connection of electronic system.

Figure 11.
Hierarchy of software implementation for Android application.

Figure 12.
Electronic circuits for controls.
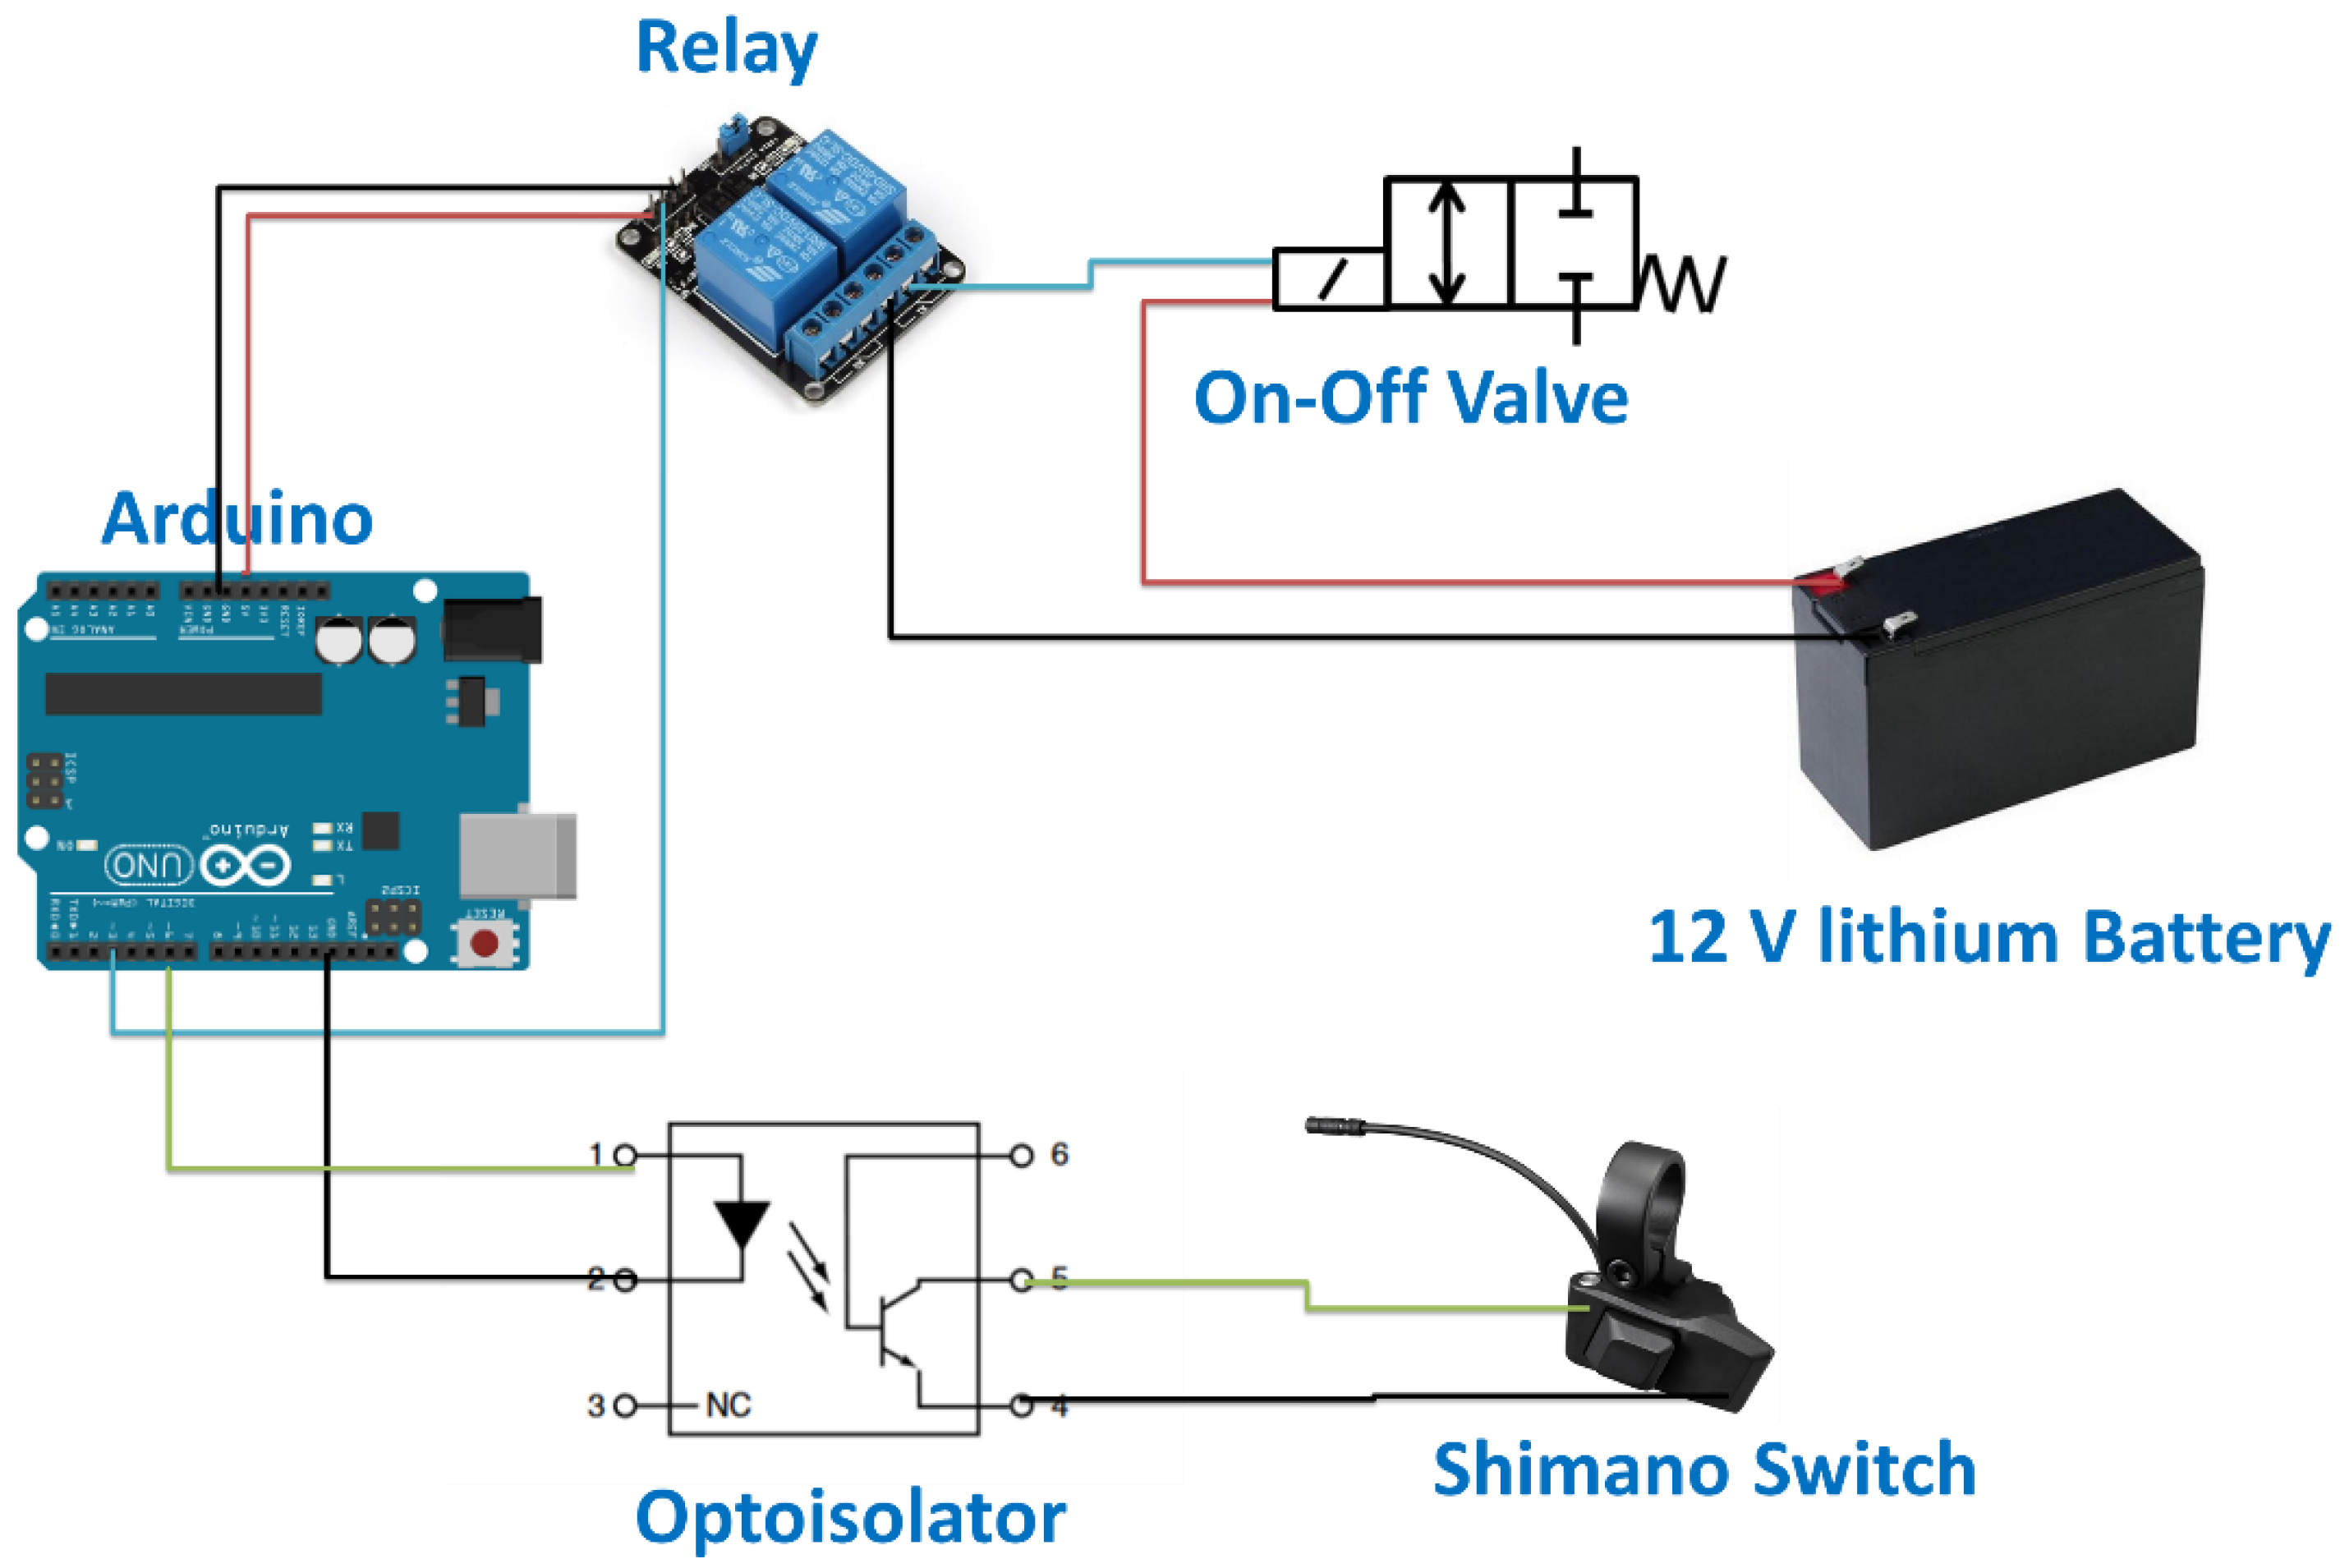
Figure 13.
Android application design: (a) main page; (b) system monitoring, controls, and recommendation; (c) weather prediction; (d) geolocation and navigation; (e) user log-in.
Figure 13.
Android application design: (a) main page; (b) system monitoring, controls, and recommendation; (c) weather prediction; (d) geolocation and navigation; (e) user log-in.

Figure 14.
Circuit for regeneration subsystem.

Figure 15.
The comparison of experimental results and model prediction for the change of accumulator pressure and vehicle linear velocity with respect to time.
Figure 15.
The comparison of experimental results and model prediction for the change of accumulator pressure and vehicle linear velocity with respect to time.
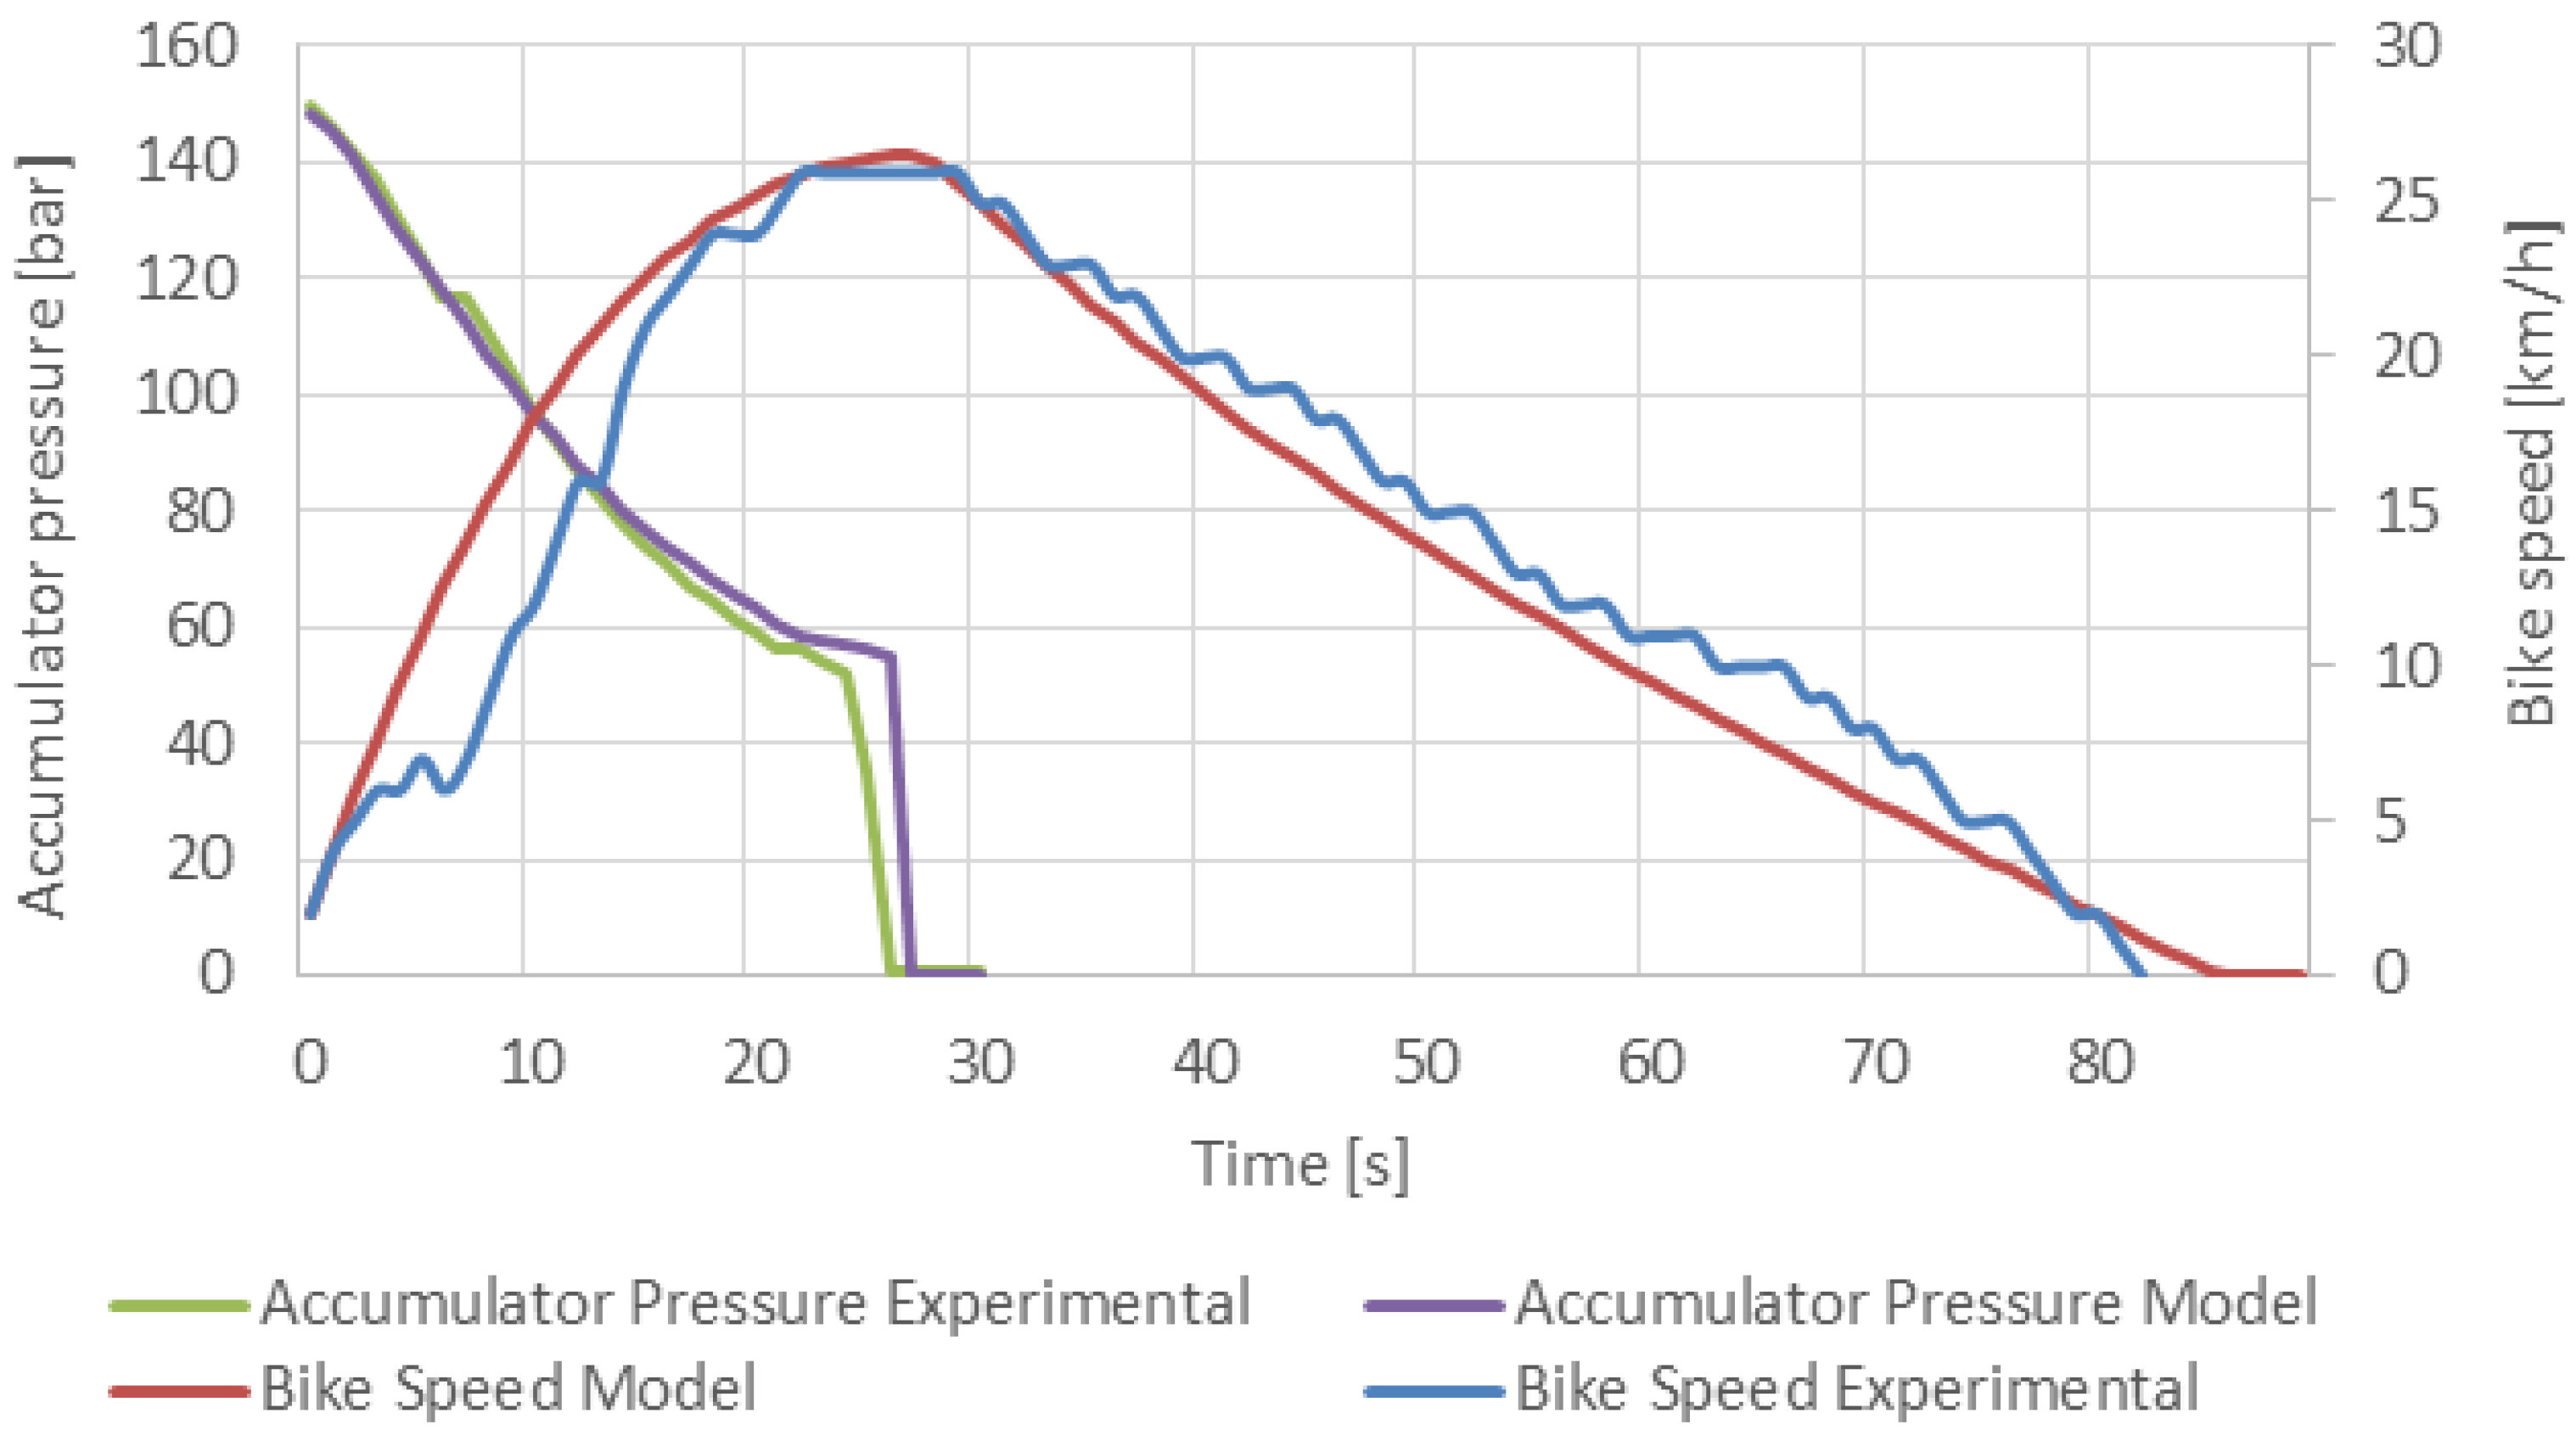
Figure 16.
Test to investigate the accumulator’s optimal pre-charge pressure.


Table 1.
Optimization results and component selection.
| Best Design | Selected Components | ||
|---|---|---|---|
| Component | Size | Company | Size |
| Pump displacement | 4.52 cc/rev | CASAPPA | 4.27 cc/rev |
| Motor displacement | 2.13 cc/rev | CASAPPA | 2.13 cc/rev |
| Accumulator volume | 2.00 L | STEELHEAD COMPOSITES | 2.00 L |
| Front gear ratio | 1/5.68 | MISUMI | 1/6.32 |
| Rear gear ratio | 4.00 | MISUMI | 4.00 |
| Regeneration gear ratio | 17.82 | ANDYMARK | 16.80 |
| Regeneration pump displacement | 4.23 cc/rev | CASAPPA | 4.27 cc/rev |
| Accumulator pre-charge gas pressure | 25 bar | - | 25 bar |
Table 2.
Results of best design acquired from optimization and selected components.
| Performances Performances in Pedaling Mode | ||
| Best Design from Optimization | Selected Components | |
| Power | 183 W | 223 W |
| Torque IN (Human) | 25 N·m | 30 N·m |
| Pump shaft | 435 rpm | 442 rpm |
| Bike speed | 5.10 m/s | 5.87 m/s |
| Main line pressure | 45.93 bar | 64.59 bar |
| Mainline flow rate | 1.81 L/min | 1.64 L/min |
| Pump volumetric efficiency | 88.91% | 86.36% |
| Pump mechanical efficiency | 86.76% | 90.85% |
| Motor volumetric efficiency | 94.62% | 90.81% |
| Motor mechanical efficiency | 85.55% | 90.43% |
| Hydraulic transmission efficiency | 62.44% | 64.44% |
| Performances in Boost Mode | ||
| Best Design from Optimization | Selected Components | |
| Max speed | 5.21 m/s | 4.86 m/s |
| Efficiency function (OF2) | 51.1232 | 50.5471 |
| Distance covered | 221 m | 214 m |
Table 3.
Regeneration pump gearbox stages.
| First Stage | Second Stage | Total Ratio |
|---|---|---|
| 6:1 (120/20) | 2.8:1 (56/20) | 16.8: 1 |
Table 4.
Measured performances.
| Measured Performance in Pedaling Mode * | |
| Bike speed | 10.0 m/s |
| Main line pressure | 101 bar |
| Measured Performance in Boost Mode | |
| Max speed | 7.22 m/s |
| Efficiency function (OF2) | 59.74 |
| Distance covered | 240 m |
* Speed around 100–110 rpm.
Table 5.
Summary of the scores at the NFPA final competition (2017).
| Podium Placement | |
|---|---|
| Overall Champion | 1st Place |
| Efficiency Challenge | 1st Place |
| Best Design | 1st Place |
| Reliability and Safety | 1st Place |
| Best Paper/Presentation | 2nd Place |
| Reliability/Durability Challenge | 2nd Place |
| Sprint Race | 3rd Place |
| Workmanship | 3rd Place |
© 2018 by the authors. Licensee MDPI, Basel, Switzerland. This article is an open access article distributed under the terms and conditions of the Creative Commons Attribution (CC BY) license (http://creativecommons.org/licenses/by/4.0/).
Share and Cite
MDPI and ACS Style
Marinaro, G.; Xu, Z.; Chen, Z.; Li, C.; Mao, Y.; Vacca, A. The PurdueTracer: An Energy-Efficient Human-Powered Hydraulic Bicycle with Flexible Operation and Software Aids. Energies 2018, 11, 305. https://doi.org/10.3390/en11020305
AMA Style
Marinaro G, Xu Z, Chen Z, Li C, Mao Y, Vacca A. The PurdueTracer: An Energy-Efficient Human-Powered Hydraulic Bicycle with Flexible Operation and Software Aids. Energies. 2018; 11(2):305. https://doi.org/10.3390/en11020305
Chicago/Turabian StyleMarinaro, Gianluca, Zhuangying Xu, Zhengpu Chen, Chenxi Li, Yizhou Mao, and Andrea Vacca. 2018. "The PurdueTracer: An Energy-Efficient Human-Powered Hydraulic Bicycle with Flexible Operation and Software Aids" Energies 11, no. 2: 305. https://doi.org/10.3390/en11020305
Note that from the first issue of 2016, this journal uses article numbers instead of page numbers. See further details here.