Thermodynamic Performance Assessment of a Novel Micro-CCHP System Based on a Low Temperature PEMFC Power Unit and a Half-Effect Li/Br Absorption Chiller


Department of Engineering, Niccolò Cusano University, via Don Carlo Gnocchi 3, 00166 Rome, Italy
Energies 2018, 11(2), 315; https://doi.org/10.3390/en11020315
Submission received: 31 December 2017
/
Revised: 23 January 2018
/
Accepted: 29 January 2018
/
Published: 1 February 2018
Abstract
:The aim of this work has been to evaluate the energetic feasibility and the performances of a novel residential micro-Combined Cooling, Heating and Power (CCHP) system, based on low temperature proton exchange membrane fuel cell (PEMFC) power unit and half effect lithium bromide absorption chiller. This integrated system has been designed to produce both electric, thermal and cooling power by recovering heat from the fuel cell power unit cooling system. The analysis has been conducted by using numerical simulations: the PEMFC power unit and the absorption chiller have been modeled by means of one-dimensional and thermochemical models, respectively, and by means of available experimental and literature reference data, has been performed the validation. The performance parameters such as: the energy utilization factor (EUF), the exergy utilization factor (ExUF) and the trigeneration primary energy saving (TPES), have been used to analyzed the performances of the system. The numerical results showed a good performance in terms of energy and ExUF, in the whole operating field of the trigeneration system. Furthermore, the highest ExUF values are obtained for the minimum evaporator temperature (4 °C) and minimum condenser temperature (27 °C) of the absorption chiller. The calculated values of TPES for the CCHP mode, ranges from −0.07 to 0.19, thus, the system has good performance in a wide operating range, but the better performance can be achieved at lower loads.
1. Introduction
In recent years, Combined Cooling, Heating and Power (CCHP) systems have received more attention, particularly in the field of small-scale power systems for residential applications [1,2,3]. Trigeneration technologies have significant benefits for the residential sector [4,5], which is a great energy consumer representing about 40% of global energy consumption [6]. In fact, instead of satisfying separately the demands on electricity, heat, and cooling, a combined production could provide significant energy savings and a major emission reduction, as well.
Small scale CCHP systems are very attractive, due both to the energy savings obtained through the waste heat recovery and to the ability to meet the energy demands of different types of stand-alone utilities. It is highly active the research in the designing, development and optimization of these technologies [7,8,9] and in operational planning according to energy and economic issues [10,11].
A typical trigeneration system includes a prime mover, a heat recovery system, and thermally activated technologies. As a prime mover, fuel cells produce waste heat when work [12,13,14], thus are very suitable for combined heat and power (CHP) and CCHP applications, and helpful to improve energy utilization efficiency and living condition [15].
Proton exchange membrane fuel cell (PEMFC) and solid oxide fuel cell (SOFC) based micro-CHP systems have been widely studied [16,17]. In particular, the researches are carried out by using both experimental and numerical approaches. Radulescu et al. [18] conducted an experimental investigation on five identical CHP units based on 4.5 kW PEMFC fed with hydrogen produced locally from natural gas. The current influences on fuel cell, steam reformer and system electric efficiency have been analyzed. The fuel cell performances were fully satisfying varying between 47% and 63%, the system gross electric efficiency was low, ranging between 26% and 35%, due mostly to the reforming process and to electric losses, while the global mean value of thermal efficiency was 29%, meaning that heat recovery must be improved drastically.
An energetic and exergetic analysis on 1.2 kW Nexa proton exchange membrane (PEM) fuel cell unit in a solar-based hydrogen production system, have been carried out by Yilanci et al. [19]. A parametric study on the system and its operating parameters was conducted, in order to evaluate the efficiencies variations due to temperature, pressure and anodic stoichiometry. The results showed that the energy and exergy efficiencies increase with pressure by 23% and 15%, respectively.
Jannelli et al. [20] compared a cogeneration power systems based on the integration between natural gas steam reforming unit and a power unit based on the PEM fuel cell technology, by using a numerical model. The analysis has been carried out considering a low temperature PEMFC, and two high temperature PEMFCs. The results showed that the integrated systems based on the high temperature fuel cells are characterized by high electric efficiency (40%) and cogeneration efficiency (79%).
Campanari et al. [21] presented an experimental analysis on a 20 kW PEM CHP system integrated with a natural gas processor. The system, with non-optimized layout, studied and tested showed that the electrical, thermal and total efficiency were 21%, 55%, and 76% respectively, with a primary energy saving index of 6%.
A PEMFC-based CHP system model has been developed by Hwang et al. [22], in which the influence of operating parameters on the system efficiency was investigated. Furthermore, Hwang [23] studied the performance of improved CHP system with steam reformer, the simulation results showed that the CHP system has a thermal efficiency of 35%, an electrical efficiency of 45.6%, and a combined heat and power efficiency of 80.6%.
However, in the summer, when the demand for heating decreases and cooling increases, unfortunately CHP systems are not able to satisfy all requests, so the CCHP system which is able to provide electricity, heating and cooling simultaneously, is introduced.
Currently, all work aimed to the study of the CCHP systems, focus on the integration of cogeneration systems with chillers of different nature, such as electric chiller, absorption chiller and adsorption chiller.
Chen et al. [24] developed a residential micro-CCHP system model, based on a PEMFC stack and a single-effect absorption chiller. The influence of operating parameters on the system performance, and the relationship between stack and absorption chiller performance, have been studied. The simulation results showed that the maximum efficiency of CCHP system can reaches 70% in summer, while 82% in winter.
Chang et al. [25] proposed a CCHP system consisting of a PEMFC, an organic Rankine cycle (ORC) and a vapor compression cycle (VCC). The integrated system based on the high temperature fuel cells is characterized by an average coefficient of performance (COP) of 1.19, and an exergy efficiency of 46% in summer, while an average COP and exergy efficiency values of 1.42% and 47% in winter under normal working conditions, respectively.
Chahartaghi et al. [26] performed a thermodynamic analysis for a CCHP system based on PEM and single effect absorption chiller. This system is investigated from viewpoints of energy, exergy and fuel energy saving ratio (FESR). The results illustrated that, the energy efficiency, exergy efficiencies and FESR of the CCHP system are 81.55%, 54.5% and 45% respectively.
Chen et al. [27] presented a hybrid residential CCHP system consisting of a PEMFC stack, a solar collector and double-effect absorption chiller. The influence of operating parameters for fuel cell and solar collector systems, on the overall system performance are analyzed. The results showed that the operating temperature of PEM fuel cell has a significant influence on the parabolic trough solar collector (PTSC) performance and that the solar collector the collector is fundamental as it connects the PEM fuel cell with the chiller. The maximum efficiency of system can reach 80.5%, which is higher than conventional CCHP systems presented in literature, due to the high efficiency of all the subsystems.
Currently, most of research studies are focused on PEMFC-based CHP systems, while less analysis on residential PEMFC-based CCHP systems integrated with an absorption chiller are conducted. In particular, nothing that studies the integration of a low temperature PEMFCs with an advanced half-effect adsorption chiller has been proposed. The half-effect absorption chiller is considered for use when the temperature of heat source is less than the minimum temperature necessary to activate single-effect chiller [28], so can be coupled with PEMFCs operating at very low temperatures and that in other ways could not be integrated with a single-effect chiller.
In this paper, a numerical analysis of a novel residential micro-CCHP, including low temperature PEMFC power unit and half effect lithium bromide absorption chiller, has been carried out by one-dimensional and thermochemical models. The main purpose has been to investigate the energetic feasibility and performances of whole system under steady-state condition, varying the operating conditions of the half-effect absorption chiller. In this paper, the actual loads of cooling, heating and power of a typical residential user are not considered, just focus on the system energy utilization efficiency.
2. System Description
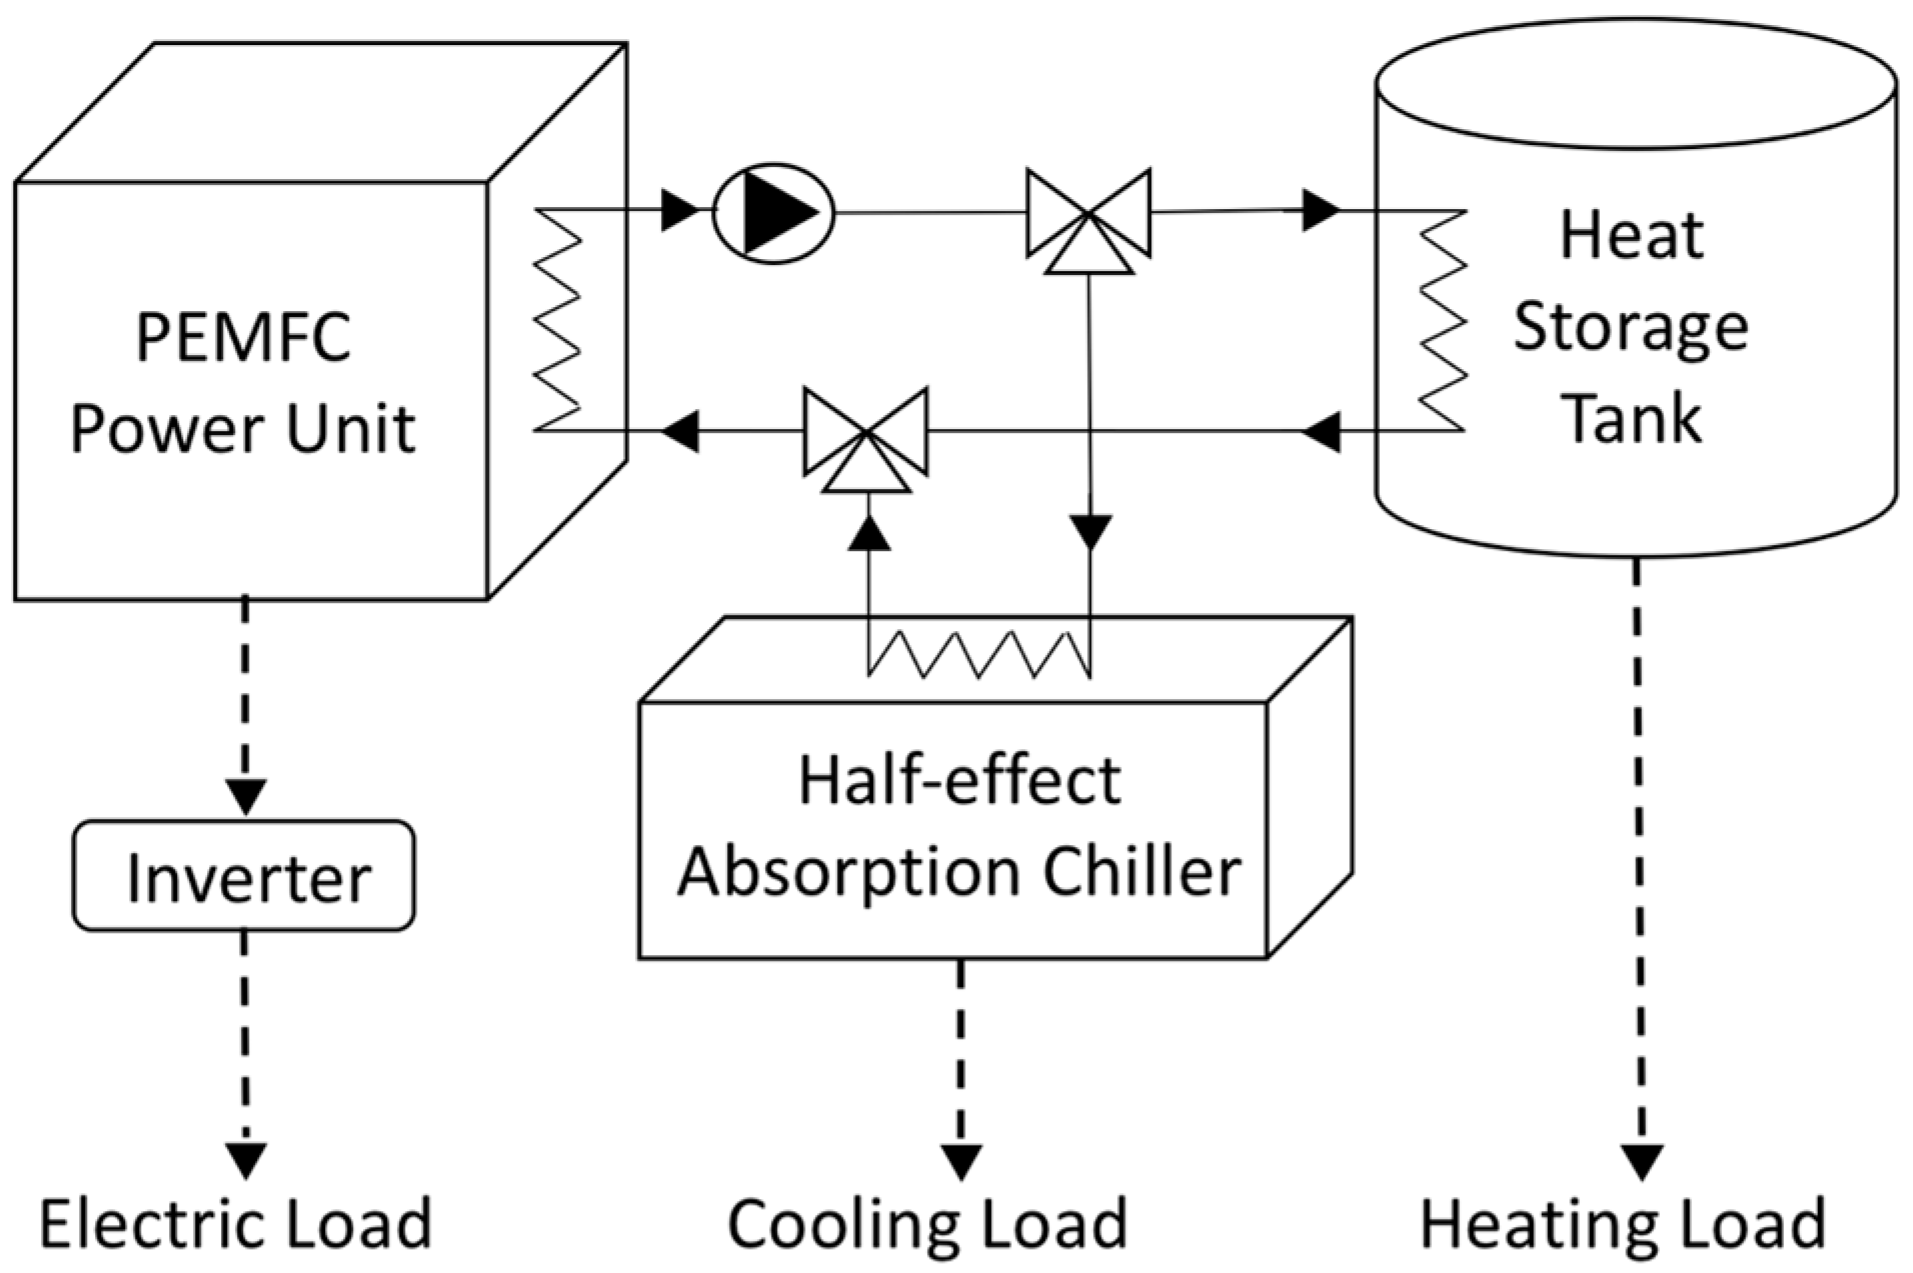
The CCHP system investigated in this paper is shown in Figure 1. It consists of a power unit, a half-effect water/LiBr absorption chiller and a heat storage tank. The power unit is equipped with five linked Mark 1030 V3 PEMFC stack series (Ballard, Burnaby, BC, Canada). The electric power generated is inverted to alternate current (AC) and supplied to the user. The waste heat of PEMFC unit is recovered by a cooling system producing hot water that is stored in a storage tank or used directly as thermal input in the absorption chiller. Waste heat recovered can be used entirely to cover the heating request only (CHP mode) or through the absorption chiller to meet the cooling request only (combined cooling and power (CCP) mode). Otherwise, a portion of waste heat is used to satisfy the heating demand, and the rest is supplied to absorption chiller for cooling (CCHP mode).
3. System Modeling
The CCHP system has been studied by using numerical models developed by the author. In particular, the fuel cell stack and the absorption chiller have been modeled by means of one-dimensional and thermochemical models, respectively, and by means of available experimental and literature reference data, the validation procedure has been performed.
3.1. PEM Fuel Cell
The PEM fuel cell model provide the electric and thermal power of the PEMFC stack fed by synthetic gas. In particular, it consists of an electrochemical model based on a mechanistic and semi-empirical approach proposed by Minutillo et al. [29] and a thermal model based on a first law approach proposed by Cozzolino et al. [30].
The numerical model is developed on the following assumptions:
- steady-state conditions;
- pressure and temperature constant into the fuel cell;
- reactants and products treated as perfect gases;
- product water at the cathode side is assumed to be liquid;
- fully hydration is assumed at the cathode/membrane interface;
- equilibrium between the water vapor and liquid is always assumed;
- humidifying water temperature is the same of the cooling water temperature;
- convective effects are negligible because of small Reynolds numbers.
The chemical reactions can be given as follows:
- Anode reaction:
- Cathode reaction:
- Overall reaction:
The hydrogen and oxygen consumption of the fuel cell can be determined by:
where i is current density (A/cm2), A the cell active area (cm2), F is the Faraday constant (C mol−1), UF and UAir are the utilization factors of fuel and air respectively and Ncell the number of cells.
The effective cell voltage, Vcell (V), is basically defined as follows:
ENernst is the Nernst potential, calculated as proposed by Amphlett et al. [31]:
where and are the partial pressures of hydrogen and oxygen at the anode and cathode catalyst-gas interface (atm), respectively, while T is the cell temperature (K).
is the ohmic overpotential loss, related to the electrical resistance losses. Because the resistance to the flow of electrons can be neglected compared to the resistance to the flow of protons, the ohmic overpotential loss, can be calculated as Ohm’s law:
where Rm is the membrane specific resistivity (Ωcm, I the current (A), A the cell active area (cm2) and l the membrane thickness (cm). The membrane specific resistivity has been calculated as proposed in [32,33]:
The parameter λ, is an empirical parameter that describes the membrane conditions [34], and it has been assumed equal to 23 as proposed by Jannelli et al. [34].
is the activation overpotential loss. The activation loss can be divided into two different contributions, the first taking place at the anode side , while the second one at the cathode side . In particular, for anode overpotential losses, a chemical model based on Arrhenius equation is used, while for the cathode activation overpotential a semi-empiric relationship is implemented.
As proposed in ref. [29], the reactions which occur at anode side are considered, Table 1, where M is the platinum catalyst site where the reaction occur and the factors Kr represent the reaction rate of the generic reaction r, with r (1,7).
The fraction of the catalytic surface area covered by hydrogen (H2) or carbon monoxide (CO) may be thus written as:
where and are the fractions of hydrogen and carbon monoxide coverage on the catalyst surface, while bh and bc represent the backward-to-forward absorption ratios for H and CO, respectively. For sake of simplicity they may be considered equal one to the other, so that:
where R is the universal gas constant (J·mol−1·K−1) and F is the Faraday constant (C·mol−1). The total circulating current density is obtained by summing the current densities for hydrogen—iH—and carbon monoxide—iCO—electro-oxidations, given by means of Tafel and Bulter-Volmer equations:
All the reaction rates may be evaluated by means of the Arrhenius equation, where the pre-exponential factor and the activation energy have been retrieved in literature [35]. As one can observe, the problem results in a non-linear system of equations which may be solved through an iterative procedure.
For the cathode activation loss, a semi-empirical relationship has been used:
where βi are empirical coefficients calculated as proposed in Reference [36], is the oxygen concentration at the cathode membrane/gas interface (mol/cm3), and i is the current density (A/cm2).
The output voltage of stack can be given as:
After calculating the output voltage, the stack output power is expressed as:
During operation, the stack generates power and heat, in order to ensure a stable average cell temperature, it is necessary to cool the stack by removing the heat that is generated.
In order to evaluate the large amount of energy waste as heat recovery through the stack cooling, an energy balance has been done as proposed in Reference [30]:
is the thermal power recovered by the water coolant in the stack cooling circuit, are the sensible heat of the single species s at the inlet and outlet of the anode and cathode side respectively, is the electrical power generated, and are the chemical power consumed by stack and the heat loss from the stack surface, calculated respectively as:
where are the mole flow rate of hydrogen at the inlet and outlet of the stack:
where h is the convective heat transfer coefficient evaluated according to ref. [37], Astack is the external surface of the stack (cm2), Text is the external stack temperature (°C), Troom (°C) is the ambient temperature, is the Stefan-Boltzmann constant and ε is the emissivity of material (W/m2·K4) [37].
The cooling water mass flow rate needed to assure the operating temperature in the stack, can be given as:
where is the specific heat of water (kJ/kg °C), and (°C) are the water temperatures at the inlet and outlet of the cooling circuit.
In this study, simulations are carried out using a user-defined model implemented using the Matlab® software package r2014a (The Mathworks Inc., Natick, MA, USA).
3.2. Half-Effect Absorption Chiller
The scheme of the half effect absorption cycle is shown in Figure 2. It consists of three pressure levels, the high and low pressure levels work in a similar way of single effect cycle, while the medium pressure level is the advanced feature. The cycle works with two solution circuits, one operates between medium and high pressure level and the other one operates from low to medium pressure level.
The main components are two generators, high generator (HG) and low generator (LG), two absorbers, high absorber (HA) and low absorber (LA), two heat exchangers (HX1, HX2), one condenser (CD) and one evaporator (EV). In this cycle, low absorber and evaporator work at low pressure level, high absorber and low generator work at medium pressure level, on the other hand high generator and condenser operate at high pressure level.
The refrigerant-rich water/LiBr solution (1) is pumped up to the medium pressure of cycle (2), then is pre-heated in HX1 by recovering heat from the LiBr rich solution (4) that is throttled back to the LA. The LG has been simulated by using two components: a heat exchange which through an amount of heat supplied allows the heating of the solution, and a flash separator in which the refrigerant vapor (7) is separated from the solution and sent to the HA, where it is absorbed by the solution (13) coming from HG. The LiBr/water solution formed (8) is pumped up to the high pressure of cycle (9), then is pre-heated in HX2 by subtracting heat to stream (11) that is the LiBr rich solution throttled back to the HA. The HG, similarly to LG, has been simulated by using a heat exchanger and a further flash separator. The refrigerant vapor produced (14) is sent to the CD where it is condensed (15), after is throttled in the expansion valve (16) and sent to EV where the cooling effect is obtained. Finally, the refrigerant liquid (17), that is in the vapor phase, in the LA is absorbed by the LiBr rich solution (6) coming from LG.
The numerical model is developed on the following assumptions:
- steady-state conditions
- the refrigerant at outlet state of the condenser is saturated liquid
- the refrigerant at outlet state of the evaporator is saturated vapor
- the temperature of high and low absorber is equal
- the temperature of high and low generator is equal
- the pressure losses in pipelines and all heat exchanger are negligible
- the expanding process in the throttling valves is isenthalpic
- the reference environmental state is water at T0 of 25 °C and P0 of 1 atm
In order to the thermodynamic analysis of half effect absorption cycle, the principles of mass conservation and first law of the thermodynamic are applied to each component.
The mass balance in each elemental component can be expressed:
where is the mass flow rate of refrigerant or solution respectively (kg/s), x is concentration of LiBr and the subscripts in and out denote the inlet and outlet for each component. The energy balance can be given as:
where h is the mass specific enthalpy (kJ/kg), is the heat entering or leaving the component (kW), is the work (kW).
The COP of the absorption chiller defined as the evaporator cooling rate to heat input rate (heat which is transferred from hot working fluid to generator) can be calculated as in [28]:
The relevant mass and energy balance and governing equations for the components of the system are given in Table 2.
In this study, simulations are carried out using a thermochemical model developed by the author using the Aspen Plus™ software (v11.1, Aspen Technology Inc., Bedford, MA, USA). The model is based on the numerical approach proposed by Somers et al. [38], based on the electrolyte-non-random two-liquid model (ELECNRTL) property method in which the electrolyte wizard option has been used to generate a series of reactions (the relevant reaction is the association/dissociation of lithium bromide).
The thermochemical model implements a control function in which the generators operate at a constant temperature (56 °C), in order to guarantee a ΔT between the solution to be heated and the hot water coming from the storage (67 °C), and it adapts the mass flow rate of circulating solution according to the heat exchanged in the heat exchangers of the generators that work with a varying effectiveness calculated as reported in Table 2. By means of this control, it is ensured to operate at a defined design temperature, and when the thermal power supplied to the generator varies, the flow rate of circulating solution varies, and consequently the chiller load varies. Furthermore, the model also takes into account the influence of temperature variation on the evaporator and condenser side, respectively.
3.3. Models Validation
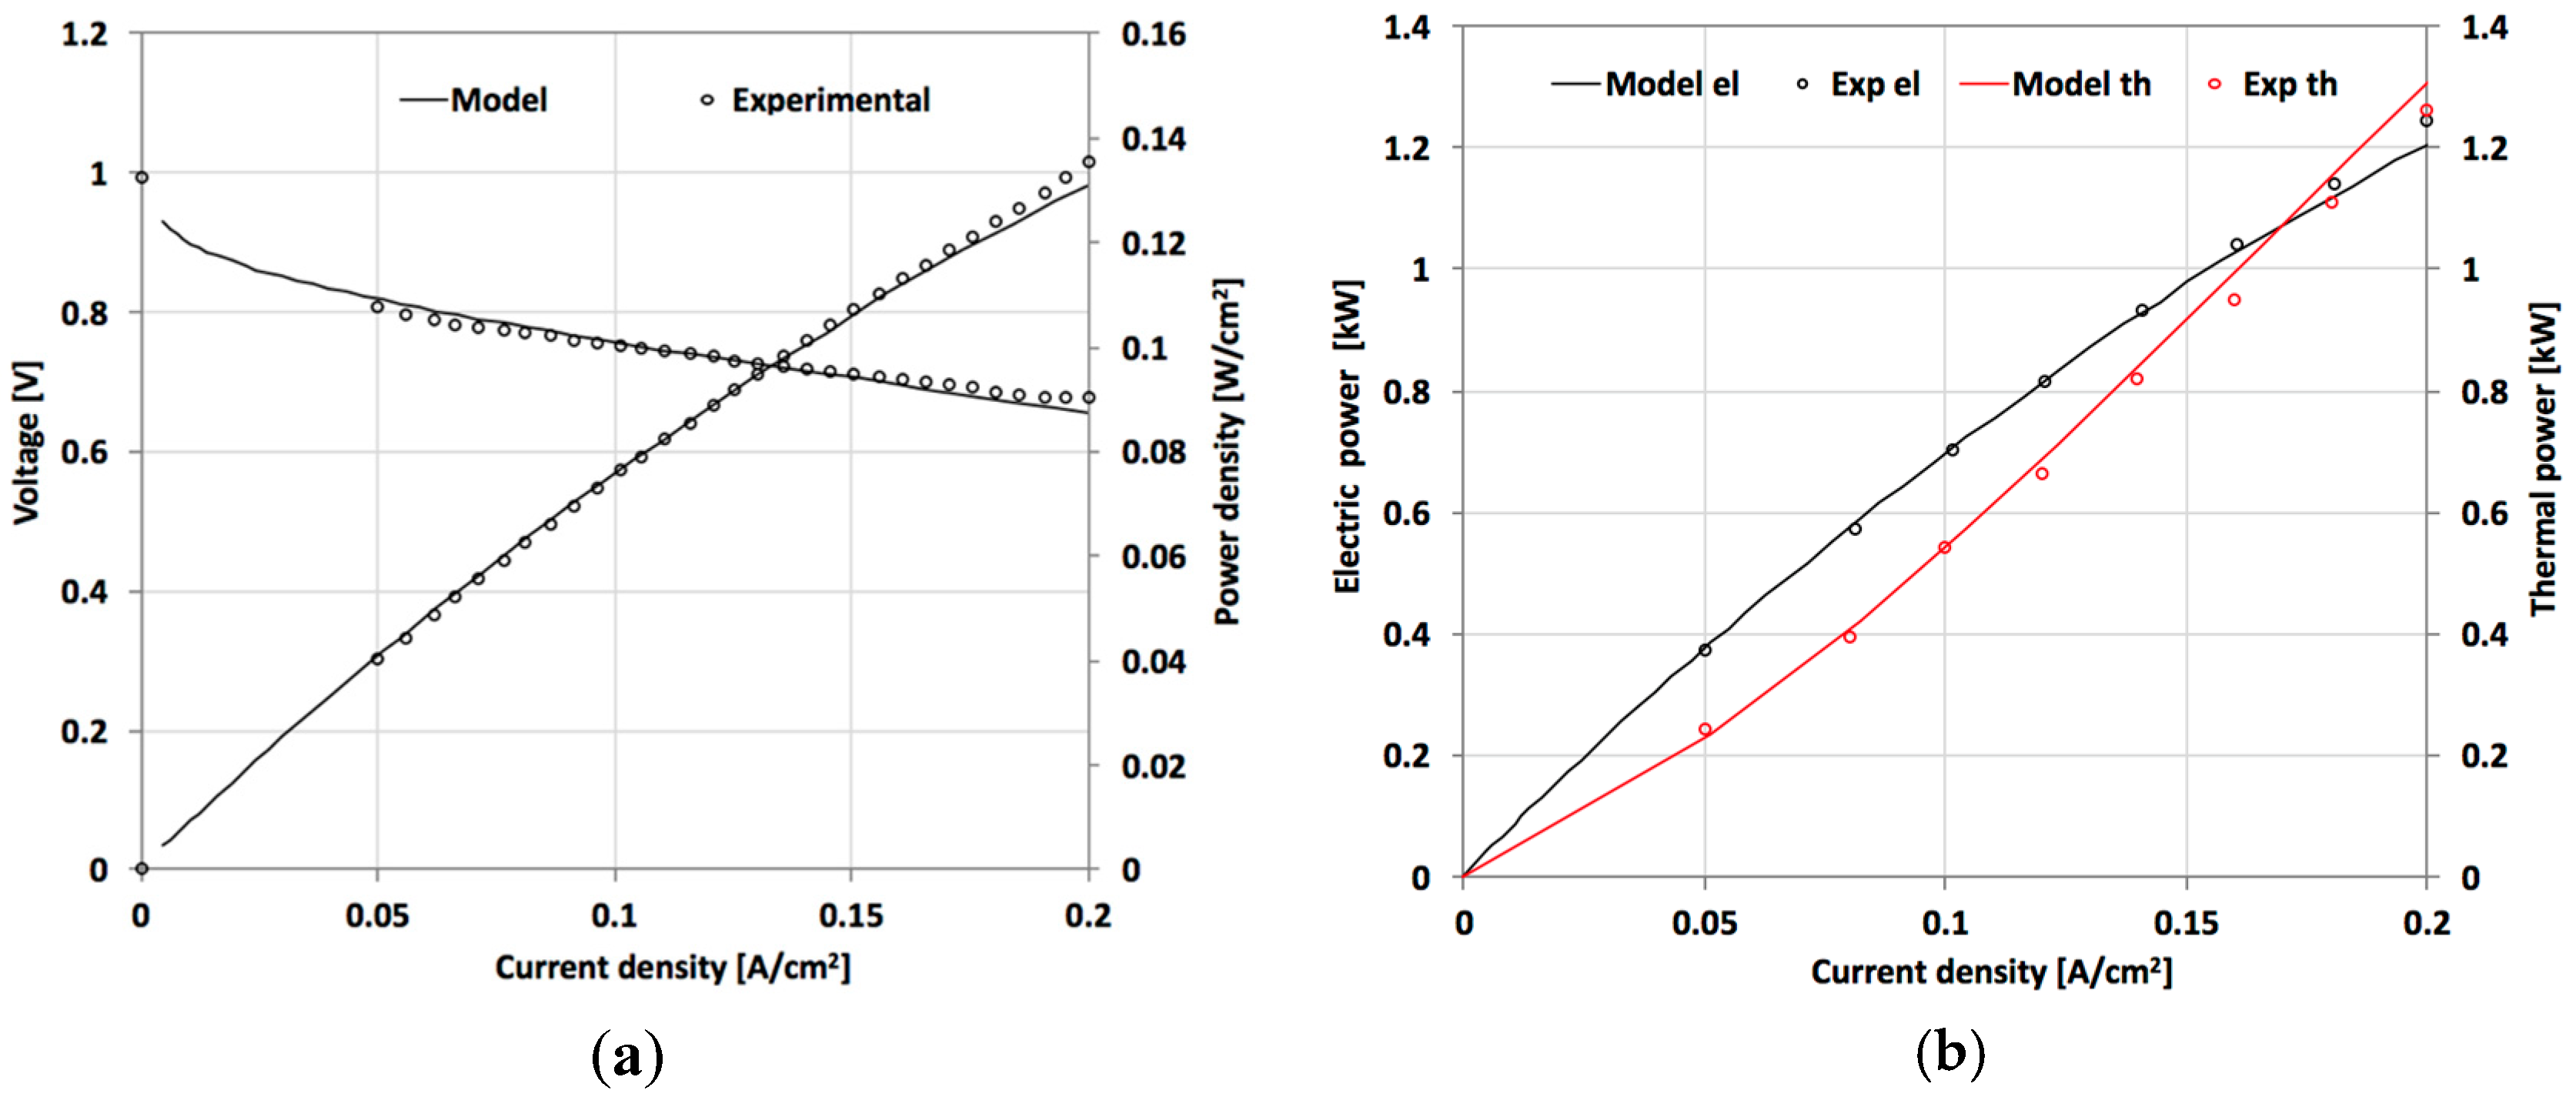
Simulations have been performed with the aim of reproducing the voltage, electrical and thermal power curves derived from the experimental activity carried out in a test station [30]. The PEMFC investigated is a pre-commercial stack, Ballard Mark 1030 V3, fed by reformate gas (75 vol % H2, 20 vol % CO2, 3 vol % N2 and 2 vol % CH4) that provides up to 1.24 kW at a nominal output voltage of 31 V. Inputs and outputs (at nominal conditions of 40 A) to/from the model are summarized in Table 3.
Figure 3 shows the comparison between the calculated and measured curves. It can be noted that the results of the model match the experimental data with a good agreement. The calculated stack power and the heat recovered by the water cooling circuit are very close to the measured one, even if a slight overestimating of heat at high current density values can be observed.
The power unit of the CCHP system proposed is equipped with five series stack, which works each in the same operating range (10–40 A). At nominal operating condition (I 40 A) of each stack, the total electric and thermal power achieved are equal to 6.03 kW and 6.55 kW, respectively. The developed model for analyzing the behavior of half effect absorption chiller system has been validated by comparing the results with the literature available data obtained by Maryami et al. [39], in which a half effect water/LiBr absorption chiller was modeled by using EES software. Inputs and outputs to/from the model are summarized in Table 4. The primary inputs include low, medium and high level pressure, operating temperatures of each component, LiBr concentration for two solution circuits, heat exchange effectiveness and refrigeration capacity, while the main model outputs, are the heat entering the generators, heat from the condenser, heat from the absorbers and COP.
As reported by Somers [38], the predictions by Aspen model respect to EES model, are within 3% discrepancy for a single effect cycle. For this study, the verification with reference data reveals a range 0.84–2.82% of discrepancy, Table 4, this indicates that the model provides sufficiently accurate results.
Figure 4 depicts the comparison of numerical COP respect the reference case by varying the generator temperature. It can be noted that the trend and the values are very close, thus the model can be considered reliable for analyzing the behavior of half-effect absorption chiller.
4. Results and Discussion
4.1. Trigeneration System Operating Field
The developed models have been used both to define the operating range of the CCHP system in terms of electric, thermal and cooling power and to forecast its performance varying the operating parameters of the absorption chiller. Some output data of the fuel cell model are used as input data for the chiller model. In particular, the cooling water mass flow rate needed to assure the operating temperature in the stack and its temperature are used as input for the chiller model.
In order to define the ratio of heat rate which enters the half absorption chiller to rate of waste heat recovered by fuel cell, the trigeneration ratio r has been defined as:
where is the amount of heat which enters the half absorption chiller, is the waste heat recovered by PEMFC power unit. When r = 1, all of the waste heat of fuel cells is used for cooling (CCP mode), when r = 0 all of the waste heat of fuel cells is used for heating (CHP mode), otherwise if 0 < r < 1 a portion of waste heat is used to satisfy the heating demand, and the rest is supplied to the absorption chiller for cooling (CCHP mode). In this study, in order to obtain the same quantity of thermal and cooling power, the trigeneration ratio r for the CCHP mode has been fixed equal to 0.7.
In Table 5 and Table 6, the state point results at nominal operating conditions of two half-effect absorption systems of different size, that operate in CCP mode (r = 1) and in CCHP mode (r = 0.7), are summarized.
Figure 5, depicts the trigeneration system operating field in terms of electrical, thermal and cooling power, when the chiller works under the above mentioned operating conditions (THG = 56 °C, TCD = 33 °C, TEV = 10 °C). In Figure 5, it is possible to identify 3 operating areas:
- −
- “area ABC” (CCHP mode) in which a portion of waste heat recovered is used to satisfy the heating demand and the rest is supplied to absorption chiller for cooling. The electric, thermal and cooling power range are 1.92–6.03 kWe, 0.33–1.97 kWt and 0.33–1.97 kWc, respectively.
- −
- “area DEF” (CCP mode) in which all the waste heat recovered is used entirely as thermal input in the absorption chiller to meet the cooling request only. The electric and cooling power range are 1.92–6.03 kWe and 0.48–2.82 kWc, respectively.
- −
- “area GHI” (CHP mode) in which all the waste heat recovered is used entirely to cover the heating request only. The electric and thermal power range are 1.92–6.03 kWe and 1.13–6.55 kWt, respectively.
Obviously varying the operating conditions of the absorption chiller (in particular the evaporator and condenser temperature), consequently changes the trigeneration system operating field.
In Figure 5, it can be noted that the system operating in CHP mode has a maximum electric and thermal power with very close values, which give hope for a good operation in residential applications in hot climate zones, when electrical and thermal load peaks are comparable due to the low winter temperatures. Differently, in CCP and CCHP operating mode, a significant imbalance between the electric, thermal and cooling power, is highlighted. On these operating modes, the system does not reflect a typical residential loads, but considering the possibility to couple the CCHP system with an auxiliary system (e.g., thermodynamic solar panel) surely the gap between the cooling/heating production and user’s demand will be filled.
In this study, the actual loads of cooling, heating and power of a typical residential user are not considered, just focus on the system energy utilization efficiency. Obviously, an analysis that investigate the feasibility of the system for a real case study, going to consider two predominant usage scenarios, summer and winter, with or without the integration of auxiliary systems, provides an outlined and complete behavior of the system.
4.2. Trigeneration System Performance
The analysis of the trigeneration system behavior has been carried out by using some operating and performance parameters.
The electric and thermal efficiency of PEMFC power unit and absorption chiller efficiency, referred to the HHV of hydrogen, have been calculated according to the following equations:
Figure 6a shows the dependence of thermal, electrical, and cooling (or chiller) efficiencies on current intensity, for the CHP and CCP mode. As expected when the current rises, the FC electrical efficiency decreases, due to the higher ohmic losses, whereas the FC thermal efficiency is always increasing from partial to full loads. At nominal operating condition (40 A), the electrical efficiency achieves its minimum value 35.8%, and the thermal efficiency its maximum value, equal to 39.4%. In order to evaluate the influence of the ambient and chilled water temperatures on the efficiency of the chiller, the evaporator and condenser temperatures in the range 4–16 °C and 27–39 °C have been varied. In Figure 6a, it can be noted that for all the operating conditions of the chiller, the calculated efficiency increase as the current intensity rises.
The reason is due to the fact that the thermal power increases with the raising of the current, consequently the greater recovered waste heat, involves a greater cooling capacity of chiller.
Furthermore, as expected if the evaporator temperature increases (chilled water temperature increases) or the condenser temperature decreases (ambient temperature decreases), then the chiller efficiency shows an improvement. In fact, at nominal operating condition (40 A), the chiller efficiency reaches its minimum value (15.2%), and its maximum (17.1%), for an evaporator and condenser temperature pair of values equal to 4°C/39 °C and 16°C/27°C, respectively.
Figure 6b shows the dependence of thermal, electrical, and cooling efficiency on current intensity, for the CCHP mode. The electrical, thermal and cooling efficiency show the same trend from partial to full loads, as in the CHP and CCP mode. Nevertheless, both thermal efficiency that cooling efficiency suffers a reduction due to the fact that the thermal power is used partly for heating and the remainder for the cooling. At nominal operating condition the thermal efficiency is equal to 11.8%, while the cooling efficiency reaches its minimum value (10.6%), and its maximum (11.9%), for an evaporator and condenser temperature pair of values equal to 4 °C/39 °C and 16 °C/27 °C, respectively.
The parameters introduced for evaluating the performance of trigeneration system are the Energy Utilization Factor (EUF) and the Exergy Utilization Factor (ExUF) [8]. The first one takes into account the efficiency in the conversion of the primary energy into work, heat and cool. However, this performance coefficient does not discriminate between the electric power and the thermal and/or cooling power, while ExUF considers the quality difference between work and heat and/or cool at different temperatures (heat at low temperature from water tank storage and cool at different water chilled temperatures). These parameters are defined as follows:
where is the electric power (the auxiliaries power consumption has not been considered), is the thermal power recovered by the fuel cell (FC) power unit, is the evaporator cooling rate, is the trigeneration ratio, . and are parameters whose value changes between 0 and 1. These parameters are calculated by applying the following equations:
where is the ambient temperature (reference temperature), and are the temperatures at which the heat and cooling are available, respectively. These temperatures are calculated as the logarithmic mean temperature difference between the inlet and outlet temperatures of the heating source and water chilled. The calculated values of and are summarized in Table 7.
In Figure 7 the EUF and ExUF are shown as function of electric power for the CHP mode. As expected, when the electric power increases, EUF increases and ExUF decreases; at nominal operating conditions, the highest EUF value (75.0%) is obtained, while the lowest ExUF (40.0%) is achieved. Furthermore, it can be noted that the trend of EUF is in accordance with the trend of thermal efficiency. Differently the trend of ExUF is similar to the trend of electric efficiency, because the exergy destruction increases due to the ohmic irreversibilities rise that occurs when the current density increases.
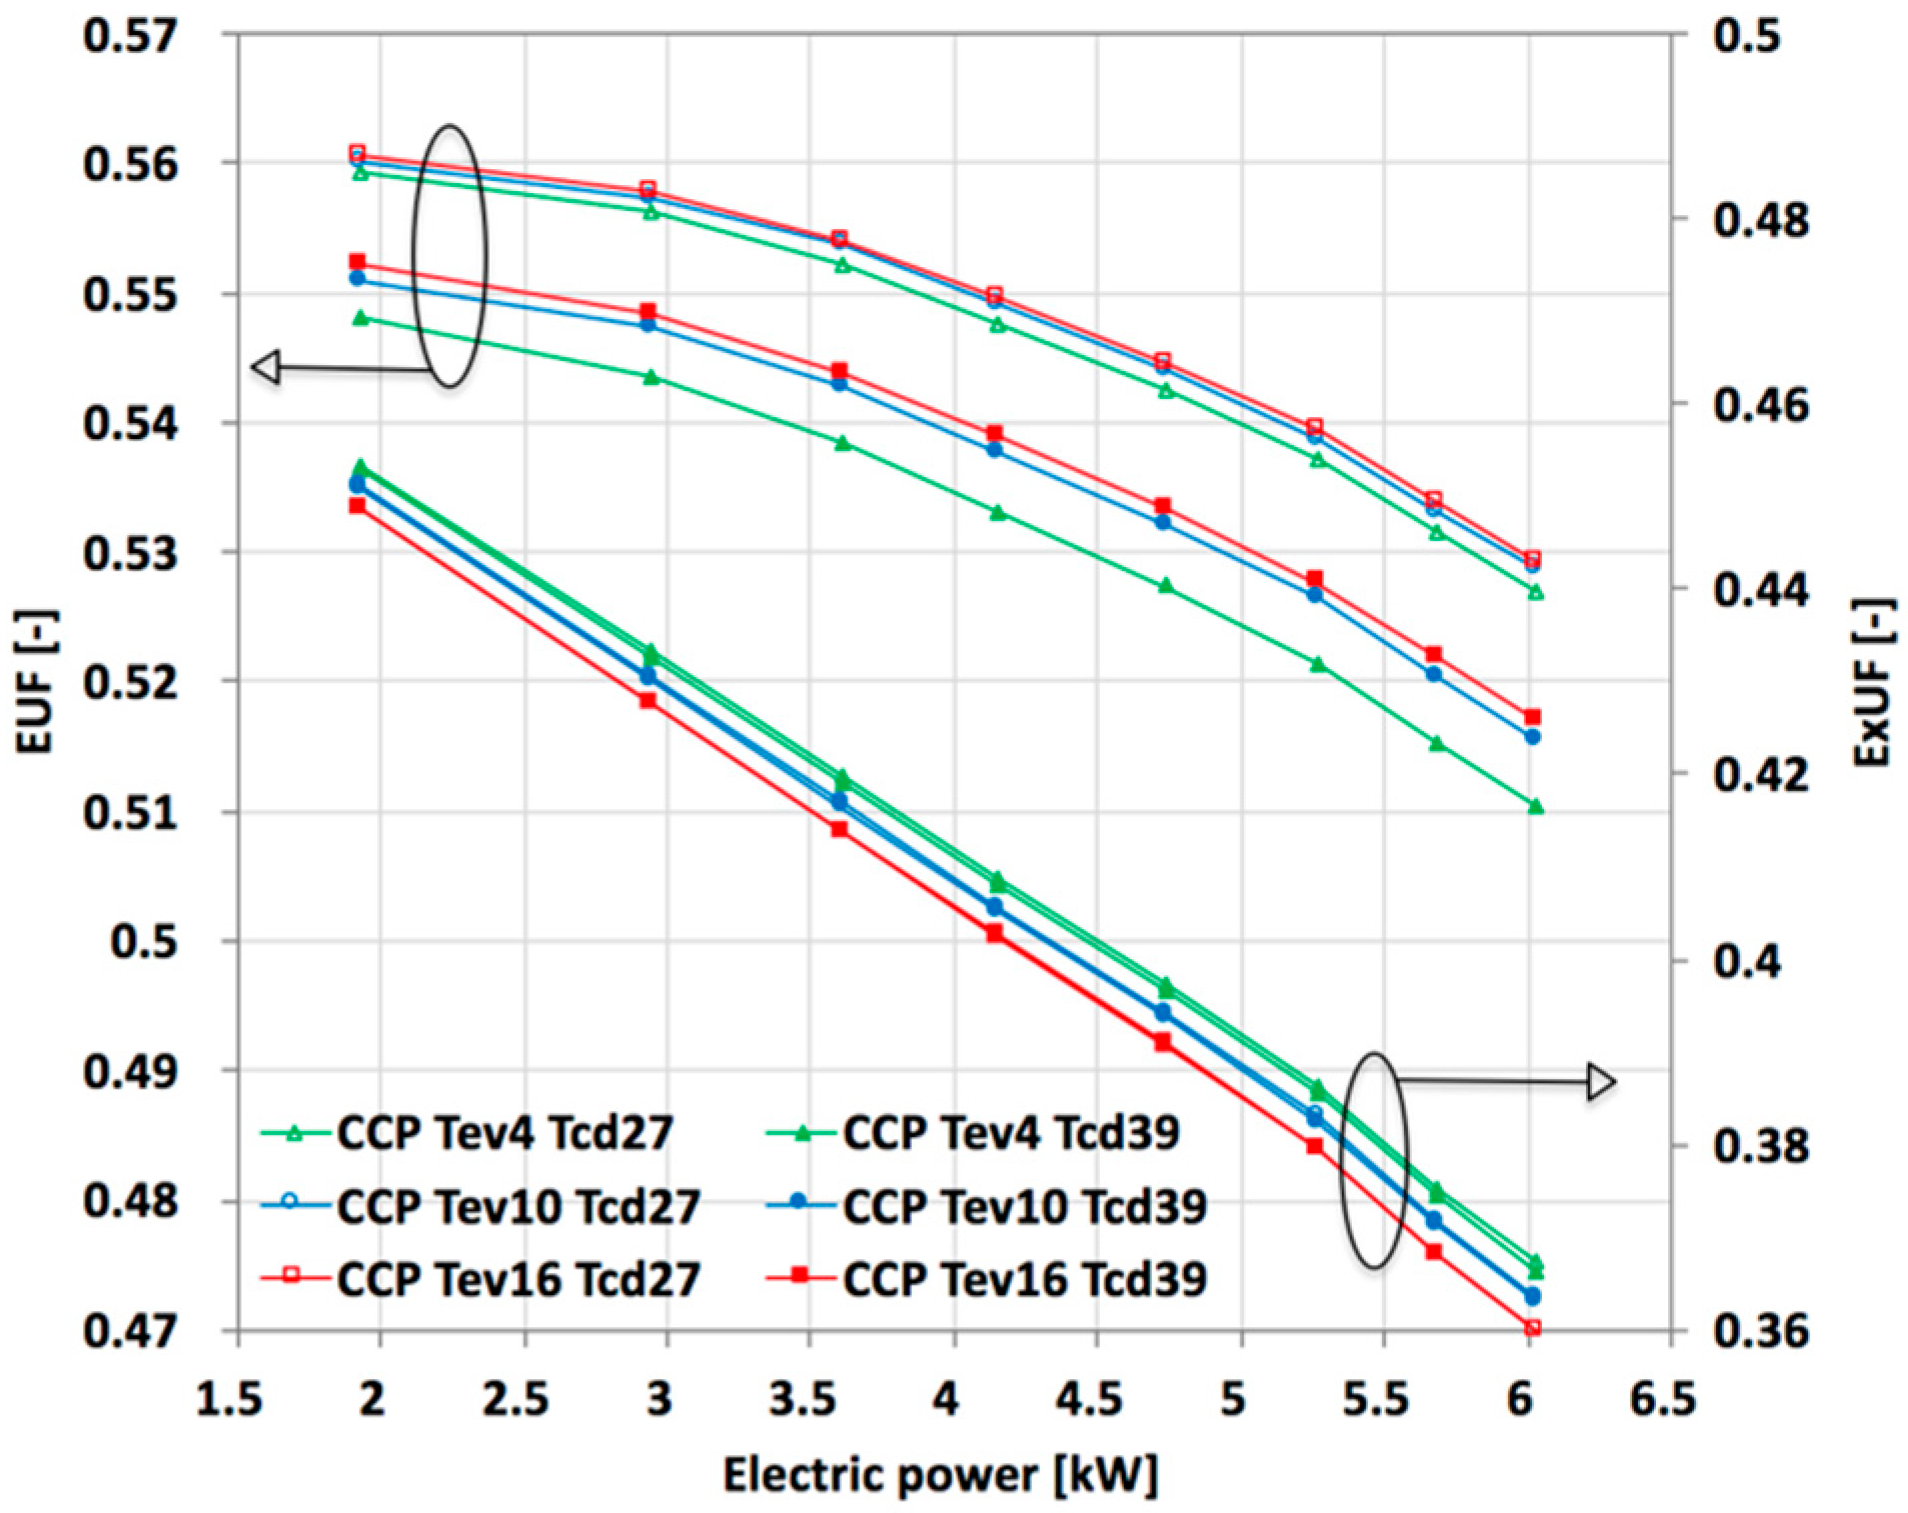
EUF and ExUF for CCP mode are depicted in Figure 8. When the electric power increases from 1.92 kW to 6.03 kW, the EUF decreases from 56% to 53%, due to the fact that electrical efficiency decreases rapidly while the chiller efficiency grows slowly as the current density increases. At nominal operating conditions, the highest EUF value (53%) is obtained for the maximum evaporator temperature (16 °C) and minimum condenser temperature (27 °C). The ExUF shows a rapid decrease when the electric power increases, because the exergy destruction increases due to the exergy losses of chiller generator.
Unlike the EUF, it can be seen that better ExUF of the system is achieved at lower evaporator and condenser temperatures. In particular, ExUF increases by decreasing evaporator temperature for a given generator temperature, while showing an overlap when condenser temperature decreases. At nominal operating conditions, the highest ExUF value (37%) is obtained for the minimum evaporator temperature (4 °C) and minimum condenser temperature (27 °C).
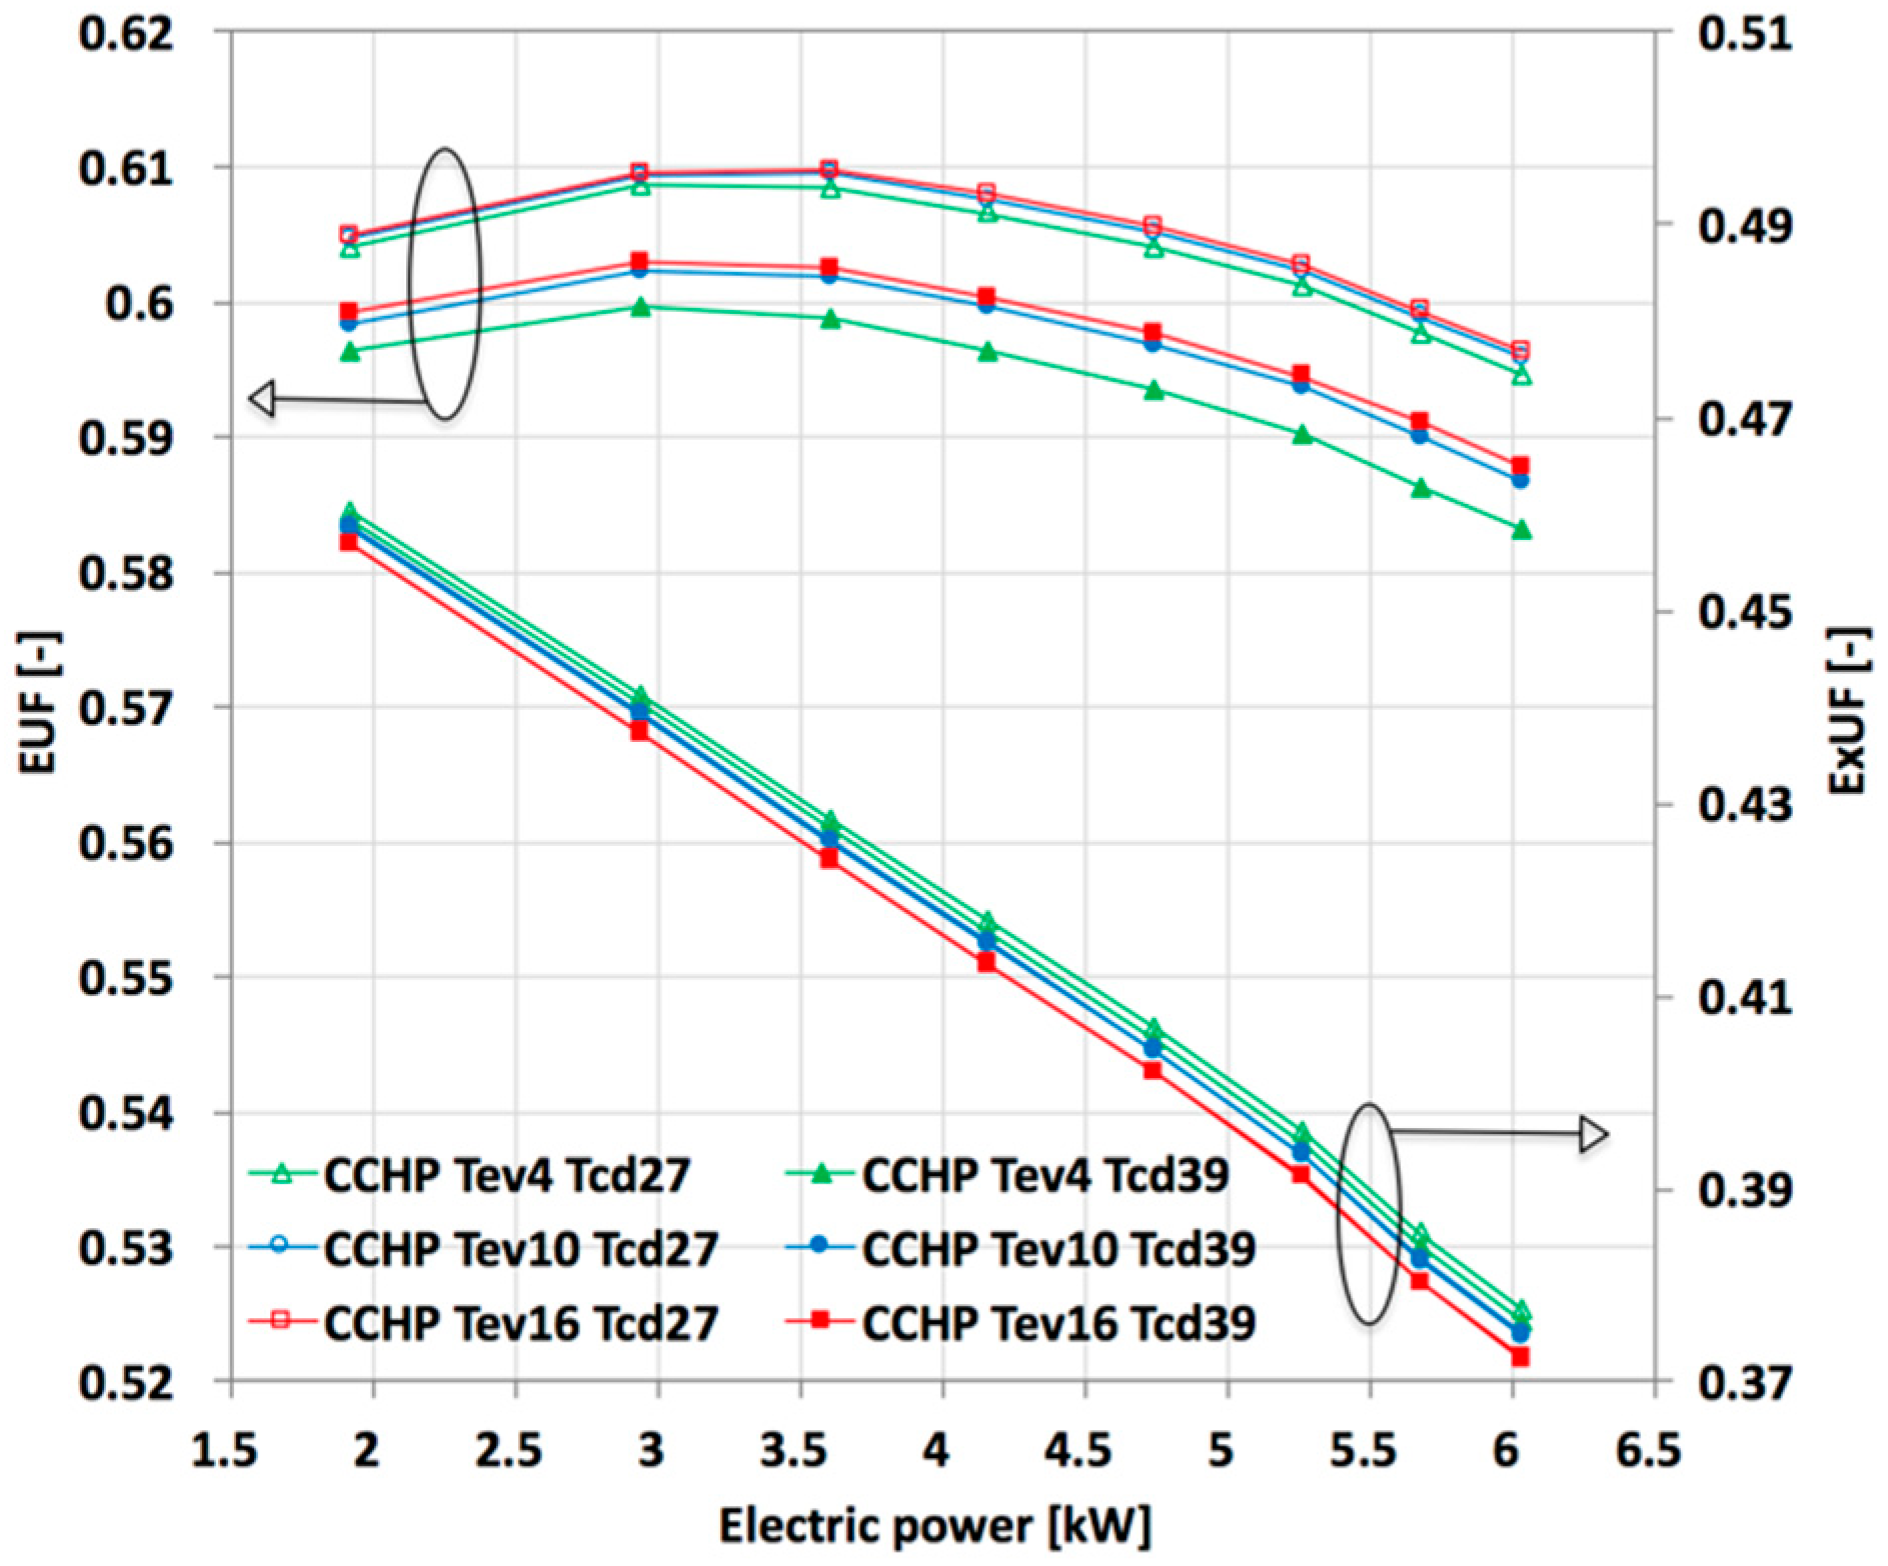
In Figure 9, the EUF and ExUF are shown as function of electric power for the CCHP mode. It can be noted that the EUF increases and decreases sweetly, as the electric power increases. In particular, at the evaporator and condenser temperature of 16 °C and 27 °C, respectively, when the electric power increases from 1.92 kW to 3.61 kW, the EUF grows slightly from 60.5% to 61.0%, then drops until to 59.6% at 6.03 kW. As in the case of the CCP mode, the ExUF shows a rapid decrease from 46% to 37.7%, when the electric power increases until full load, because the exergy destruction increases due to the exergy losses of chiller generator. Furthermore, the ExUF increases by decreasing evaporator temperature for a given generator temperature, while showing an overlap when condenser temperature decreases. At nominal operating conditions, the highest ExUF value is obtained for the minimum evaporator temperature (4 °C) and minimum condenser temperature (27 °C).
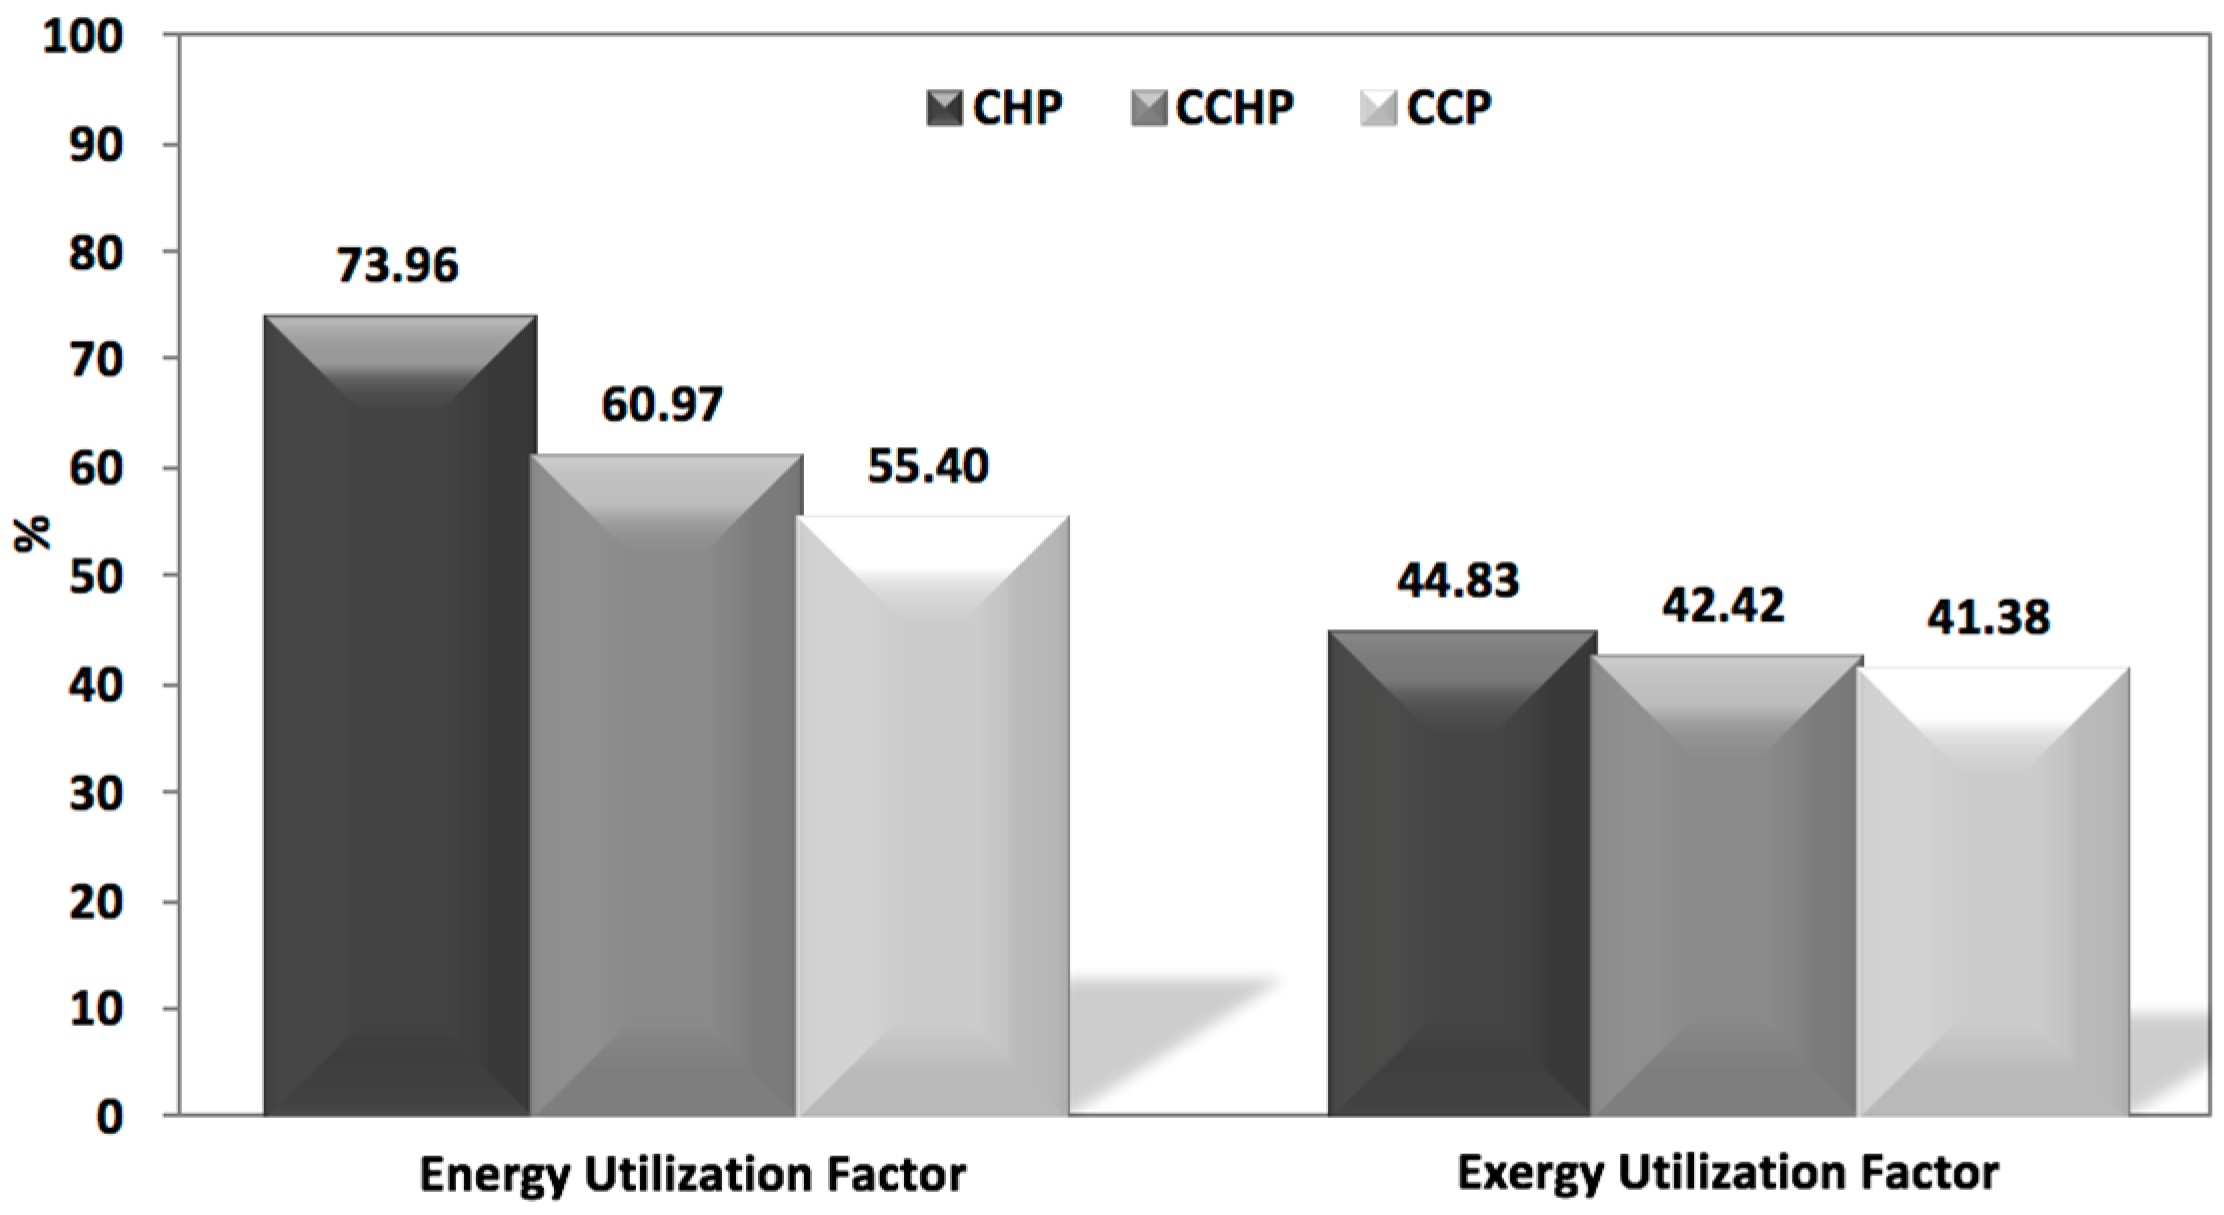
Figure 10 shows the CHP, CCHP and CCP energy and ExUF comparison, at fixed operating conditions of each fuel cell stack (I 20 A) and absorption chiller (Tev16; Tcd27). The system in CHP and CCP mode is similar to the CCHP mode, with the difference that the trigeneration ratio r is equal to 0 and 1, for the first and the second one operating mode, respectively.
As it can be seen, the best operational mode from EUF viewpoint is the CHP one. This is due because the waste heat recovered is totally used as thermal power in the CHP mode, differently in CCHP the waste heat is partly used as thermal power and partly is converted to cooling power with low conversion efficiency. The CCP mode presents the lower EUF because all the waste heat is converted into cooling power by means the absorption chiller. By analyzing the ExUF, the same behavior is observed for the three operating modes, even if the margins between the calculated values are greatly reduced. However, comparing the performances obtained with those presented in literature for systems based on PEM fuel cell stack and single-effect absorption chiller, it is possible to appreciate how these values do not differ greatly [24,26].
Furthermore, in order to evaluate the fuel saving that can be achieved with the co-production of electric, thermal and cooling powers, a performance indicator called trigeneration primary energy saving (TPES), has been calculated, as proposed in ref. [40]. Unlike the PES (Primary Energy Saving), the TPES which takes into account the cooling power also, as well as the reference efficiencies for comparison with the separate energy production, is defined as:
where and are the total fuel energy input to the trigeneration system and the total fuel energy input required for the separate production of the same energy vectors (work, heat and cool), respectively. Furthermore, the coefficients and are the separate production reference efficiencies that have been assumed equal to 0.4, 0.9 and 4 (COP of an equivalent compression electric refrigerator group) respectively, as suggested in ref. [40]. It has been chosen to estimate the TPES in the extreme working points of the CCHP operating mode (“area ABC”), Figure 5. Thus, the analysis has been carried out considering the power values and not the annual energy values.
In Table 8, the calculated values of TPES ranges from −0.07 to 0.19, are summarized. The negative value is obtained at low thermal and cooling powers (0.33 kW) and when the fuel consumption in the CCHP system is high due to maximum electric load (6.03 kW). In fact, it happens that at maximum electric load the hydrogen consumption of fuel cell stacks is high, but for reasons of needs related to the user, not all the waste heat of the stacks is recovered and converted in heating and cooling power, but only a part, this involves a non-saving in primary energy if compared with a separate production systems calibrated on the user’s demands. Obviously, this extreme condition rarely occurs, so it can be stated that the CCHP system has good performance in a wide operating range, but the better performance in terms of primary energy saving can be achieved at lower loads.
5. Conclusions
In this paper the energetic feasibility and the performances of a novel residential micro-CCHP, including low temperature PEMFC power unit and half effect lithium bromide absorption chiller, have been evaluated by means numerical simulations.
The power unit and the absorption chiller have been modeled by using one-dimensional and thermochemical codes respectively. The models, validated by experimental data for PEMFC and literature reference data for half effect absorption chiller, have been integrated in order to evaluate the operating field in terms of electric, thermal and cooling powers and the performances of the trigeneration system.
The trigeneration ratio r defined for the analysis, has highlighted that the trigeneration system can operates under three different modes, CHP mode (r = 0) in which all of waste heat recovered by FC power unit is used for heating, CCP mode (r = 1) in which all of waste heat is used for cooling purpose and CCHP mode (0 < r < 1) in which a portion of waste heat is used to satisfy the heating demand, and the rest is supplied to absorption chiller for cooling.
The performance analysis has been carried out by introducing some performance parameters such as: EUF, ExUF and TPES. The numerical results showed a good performance and a different behavior for the three operating mode. In particular, at nominal operating conditions the CHP mode achieved the highest EUF value (75.0%) but the lowest ExUF (40.0%). The CCP and CCHP modes showed a quasi-similar behavior, highlighting the highest EUF (56% and 61%) and ExUF (45% and 46%) values at lower loads. Furthermore, both for CCP than CCHP modes, the highest ExUF values are obtained for the minimum evaporator temperature (4 °C) and minimum condenser temperature (27 °C) of the absorption chiller.
The calculated values of TPES for the CCHP mode, ranges from −0.07 to 0.19, thus, the CCHP system has good performance in a wide operating range, but the better performance can be achieved at lower loads. Obviously, a future analysis that will investigate the feasibility of the system for a residential real case study, going to consider two predominant usage scenarios, summer and winter, with or without the integration of auxiliary systems, will provide an outlined and complete behavior of the system.
The paper has highlighted that the numerical models can be useful tools in designing and optimization of energy conversion systems allowing to investigate on their behavior in different operating points and thus to assist to the experimental activities.
Conflicts of Interest
The author declares no conflicts of interest.
References
- Wu, D.W.; Wang, R.Z. Combined cooling, heating and power: A review. Prog. Energy Combust. Sci. 2006, 32, 459–495. [Google Scholar] [CrossRef]
- Mingxi, L.; Yang, S.; Fang, F. Combined cooling, heating and power systems: A survey. Renew. Sustain. Energy Rev. 2014, 35, 1–22. [Google Scholar]
- Cho, H.; Smith, A.D.; Mago, P. Combined cooling, heating and power: A review of performance improvement and optimization. Appl. Energy 2014, 136, 168–185. [Google Scholar] [CrossRef]
- Jradi, M.; Riffat, S. Tri-generation systems: Energy policies, prime movers, cooling technologies, configurations and operation strategies. Renew. Sustain. Energy Rev. 2014, 32, 396–415. [Google Scholar] [CrossRef]
- Rong, A.; Su, Y. Polygeneration systems in buildings: A survey on optimization approaches. Energy Build. 2017, 151, 439–454. [Google Scholar] [CrossRef]
- Sibilio, S.; Rosato, A.; Ciampi, G.; Scorpio, M.; Akisawa, A. Building-integrated trigeneration system: Energy, environmental and economic dynamic performance assessment for Italian residential applications. Renew. Sustain. Energy Rev. 2017, 62, 920–933. [Google Scholar] [CrossRef]
- Abdollahi, G.; Sayyaadi, H. Application of the multi-objective optimization and risk analysis for the sizing of a residential small-scale CCHP system. Energy Build. 2013, 60, 330–344. [Google Scholar] [CrossRef]
- Jannelli, E.; Minutillo, M.; Cozzolino, R.; Falcucci, G. Thermodynamic performance assessment of a small size CCHP (combined cooling heating and power) system with numerical models. Energy 2014, 65, 240–249. [Google Scholar] [CrossRef]
- Li, M.; Mu, H.; Li, N.; Ma, B. Optimal design and operation strategy for integrated evaluation of CCHP (combined cooling heating and power) system. Energy 2016, 99, 202–220. [Google Scholar] [CrossRef]
- Gu, W.; Lu, S.; Wu, Z.; Zhang, X.; Wang, J. Residential CCHP microgrid with load aggregator: Operation mode, pricing strategy, and optimal dispatch. Appl. Energy 2017, 205, 173–186. [Google Scholar] [CrossRef]
- Lozano, M.A.; Carvalho, M.; Serra, L.M. Operational strategy and marginal costs in simple trigeneration systems. Energy 2009, 34, 2001–2008. [Google Scholar] [CrossRef]
- Pei, H.; Liu, Z.; Zhang, H.; Yu, Y.; Tu, Z.; Wan, Z.; Liu, W. In situ measurement of temperature distribution in proton exchange membrane fuel cell I a hydrogen-air stack. J. Power Sources 2013, 227, 72–79. [Google Scholar] [CrossRef]
- Chen, X.; Li, W.; Gong, G.; Wan, Z.; Tu, Z. Parametric analysis and optimization of PEMFC system for maximum power and efficiency using MOEA/D. Appl. Therm. Eng. 2017, 121, 400–409. [Google Scholar] [CrossRef]
- Tu, Z.; Zhang, H.; Luo, Z.; Liu, J.; Wan, Z.; Pan, M. Evaluation of 5 kW proton exchange membrane fuel cell stack operated at 95 °C under ambient pressure. J. Power Sources 2013, 222, 277–281. [Google Scholar] [CrossRef]
- Schicktanz, M.D.; Wapler, J.; Henning, H.M. Primary energy and economic analysis of combined heating, cooling and power systems. Energy 2011, 36, 575–585. [Google Scholar] [CrossRef]
- Elmer, T.; Worall, M.; Wu, S.; Riffat, S.B. Fuel cell technology for domestic built environment applications: State of-the-art review. Renew. Sustain. Energy Rev. 2015, 42, 913–931. [Google Scholar] [CrossRef]
- Barelli, L.; Bidini, G.; Gallorini, F.; Ottaviano, A. An energetic exergetic comparison between PEMFC and SOFC-based micro-CHP systems. Int. J. Hydrogen Energy 2011, 36, 3206–3214. [Google Scholar] [CrossRef]
- Radulescu, M.; Lottin, O.; Feidt, M.; Lombard, C.; Le Noc, D.; Le Doze, S. Experimental results with a natural gas cogeneration system using a polymer exchange membrane fuel cell. J. Power Source 2006, 159, 1142–1146. [Google Scholar] [CrossRef]
- Yilanci, A.; Dincer, I.; Ozturk, H. Performance analysis of a PEM fuel cell unit in a solar–hydrogen system. Int. J. Hydrogen Energy 2008, 33, 7538–7552. [Google Scholar] [CrossRef]
- Jannelli, E.; Minutillo, M.; Perna, A. Analyzing microcogeneration systems based on LT-PEMFC and HT-PEMFC by energy balances. Appl. Energy 2013, 108, 82–91. [Google Scholar] [CrossRef]
- Campanari, S.; Valenti, G.; Macchi, E.; Lozza, G.; Ravidà, N. Development of a micro cogeneration laboratory and testing of a natural gas CHP unit based on PEM fuel cells. Appl. Therm. Eng. 2014, 71, 714–720. [Google Scholar] [CrossRef]
- Hwang, J.; Wang, P.; Kuo, J. Simulation and experiment of a cogeneration system based on proton exchange membrane fuel cell. Fuel Cells 2012, 12, 326–334. [Google Scholar] [CrossRef]
- Hwang, J.; Lin, C.; Kuo, J. Performance analysis of fuel cell thermoelectric cogeneration system with methanol steam reformer. Int. J. Hydrogen Energy 2014, 39, 14448–14459. [Google Scholar] [CrossRef]
- Chen, X.; Gong, G.; Wan, Z.; Luo, L.; Wan, J. Performance analysis of 5 kW PEMFC-based residential micro-CCHP with absorption chiller. Int. J. Hydrogen Energy 2015, 40, 10647–10657. [Google Scholar] [CrossRef]
- Chang, H.; Wan, Z.; Zheng, Y.; Chen, X.; Shu, S.; Tu, Z.; Chan, S.H.; Chen, R.; Wang, X. Energy- and exergy-based working fluid selection and performance analysis of a high-temperature PEMFC-based micro combined cooling heating and power system. Appl. Energy 2017, 204, 446–458. [Google Scholar] [CrossRef]
- Chahartaghi, M.; Kharkeshi, B.A. Performance analysis of a combined cooling, heating and power system with PEM fuel cell as a prime mover. Appl. Therm. Eng. 2018, 128, 805–817. [Google Scholar] [CrossRef]
- Chen, X.; Gong, G.; Wanb, Z.; Zhang, C.; Tu, Z. Performance study of a dual power source residential CCHP system based on PEMFC and PTSC. Energy Convers. Manag. 2016, 119, 163–176. [Google Scholar] [CrossRef]
- Herold, K.E.; Radermacher, R.; Klein, S.A. Absorption Chillers and Heat Pumps; CRC Press: Boca Raton, FL, USA, 2016. [Google Scholar]
- Minutillo, M.; Perna, A. Behaviour modelling of a PEMFC operating on diluted hydrogen feed. Int. J. Energy Res. 2008, 32, 1297–1308. [Google Scholar] [CrossRef]
- Cozzolino, R.; Cicconardi, S.P.; Galloni, E.; Minutillo, M.; Perna, A. Theoretical and experimental investigations on thermal management of a PEMFC stack. Int. J. Hydrogen Energy 2011, 36, 8030–8037. [Google Scholar] [CrossRef]
- Amphlett, J.C.; Baumert, R.M.; Mann, R.F.; Peppley, B.A.; Roberge, P.R.; Harris, T.J. Performance Modelling of Ballard Mark IV Solid Polymer Electrolyte Fuel Cell. J. Electrochem. Soc. 1995, 142, 1–8. [Google Scholar] [CrossRef]
- Mann, R.F.; Amphlett, J.C.; Hooper, M.A.I.; Jensen, H.M.; Peppley, B.A.; Roberge, P.R. Development and application of a generalised steady-state electrochemical model for a PEM fuel cell. J. Power Sources 2000, 86, 173–180. [Google Scholar] [CrossRef]
- Fowler, M.W.; Mann, R.F.; Amphlett, J.C.; Peppley, B.A.; Roberge, P.R. Incorporation of voltage degradation into a generalised steady-state electrochemical model for a PEM fuel cell. J. Power Sources 2002, 106, 274–283. [Google Scholar] [CrossRef]
- Jannelli, E.; Minutillo, M.; Galloni, E. Performance of a PEM fuel cell system fuelled with hydrogen generated by a fuel processor. J. Fuel Cell Sci. Technol. 2007, 4, 435–440. [Google Scholar] [CrossRef]
- Ferguson, A.; Ugursal, V.I. Fuel cell modelling for building cogeneration applications. J. Power Sources 2004, 137, 30–42. [Google Scholar] [CrossRef]
- Tribioli, L.; Cozzolino, R.; Chiappini, D.; Iora, P. Energy management of a plug-in fuel cell/battery hybrid vehicle with on-board fuel processing. Appl. Energy 2016, 184, 140–154. [Google Scholar] [CrossRef]
- Kreith, F. Principles of Heat Transfer; Brooks/Cole: Boston, MA, USA, 2001. [Google Scholar]
- Somers, C.; Mortazavi, A.; Hwang, Y.; Radermacher, R.; Rodgers, P.; Al-Hashimi, S. Modeling water/lithium bromide absorption chillers in ASPEN Plus. Appl. Energy 2011, 88, 4197–4205. [Google Scholar] [CrossRef]
- Maryami, R.; Dehghan, A.A. An exergy based comparative study between LiBr/water absorption refrigeration systems from half effect to triple effect. Appl. Therm. Eng. 2017, 124, 103–123. [Google Scholar] [CrossRef]
- Chicco, G.; Mancarella, P. Trigeneration primary energy saving evaluation for energy planning and policy development. Energy Policy 2007, 35, 6132–6144. [Google Scholar] [CrossRef]
Figure 1.
Schematic of the Combined Cooling, Heating and Power (CCHP) system. PEMFC: Proton exchange membrane fuel cell.
Figure 1.
Schematic of the Combined Cooling, Heating and Power (CCHP) system. PEMFC: Proton exchange membrane fuel cell.

Figure 2.
Scheme of the half absorption chiller. HG: high generator; LG: low generator; HA: high absorber; LA: low absorber; HX: heat exchanger; CD: condenser; EV: evaporator.
Figure 2.
Scheme of the half absorption chiller. HG: high generator; LG: low generator; HA: high absorber; LA: low absorber; HX: heat exchanger; CD: condenser; EV: evaporator.
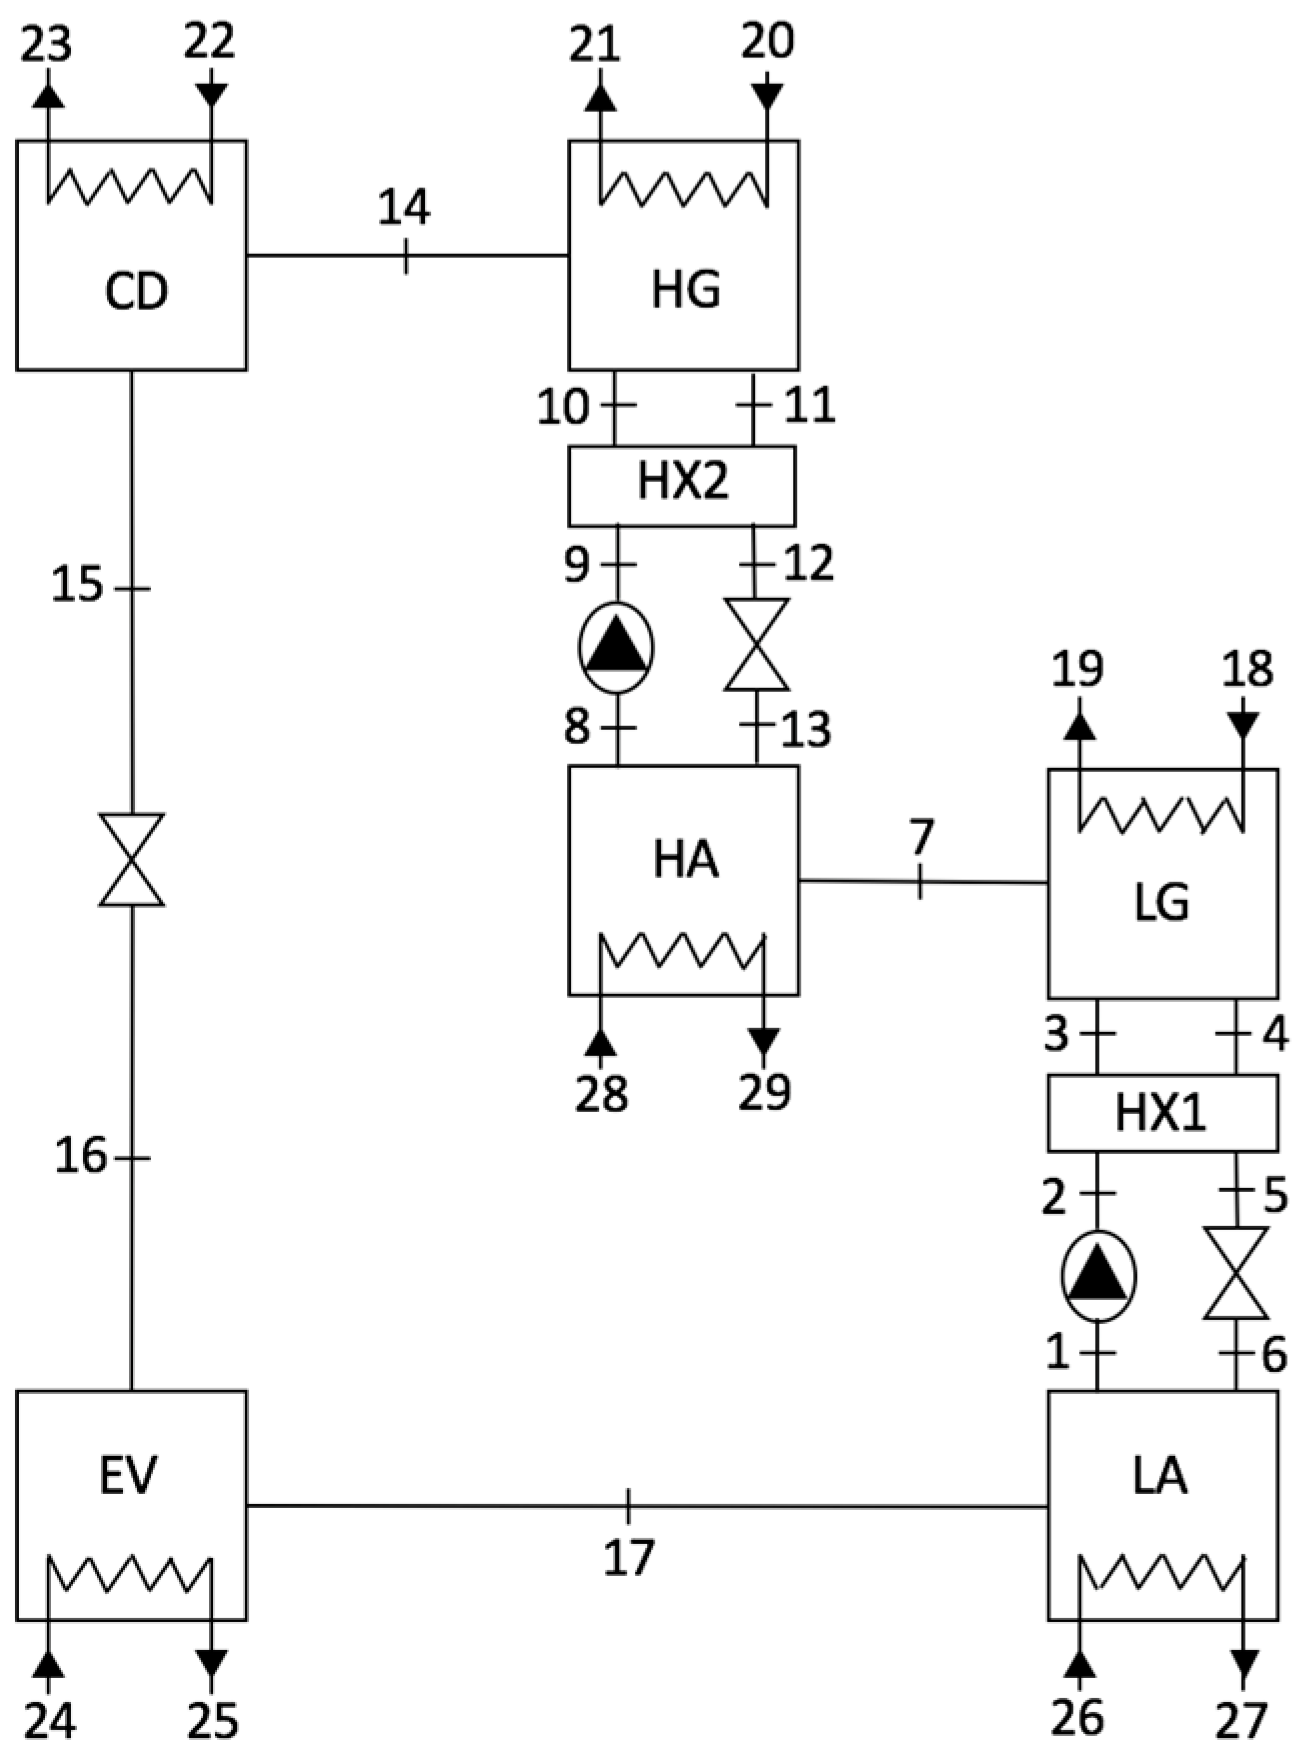
Figure 3.
Comparison between numerical results and reference data in [30]: (a) Voltage and power density curves; (b) Electric and thermal power curves.
Figure 3.
Comparison between numerical results and reference data in [30]: (a) Voltage and power density curves; (b) Electric and thermal power curves.

Figure 4.
Chiller performance (COP) under various generator temperature: the comparison between the numerical results and the reference data in [39].
Figure 4.
Chiller performance (COP) under various generator temperature: the comparison between the numerical results and the reference data in [39].
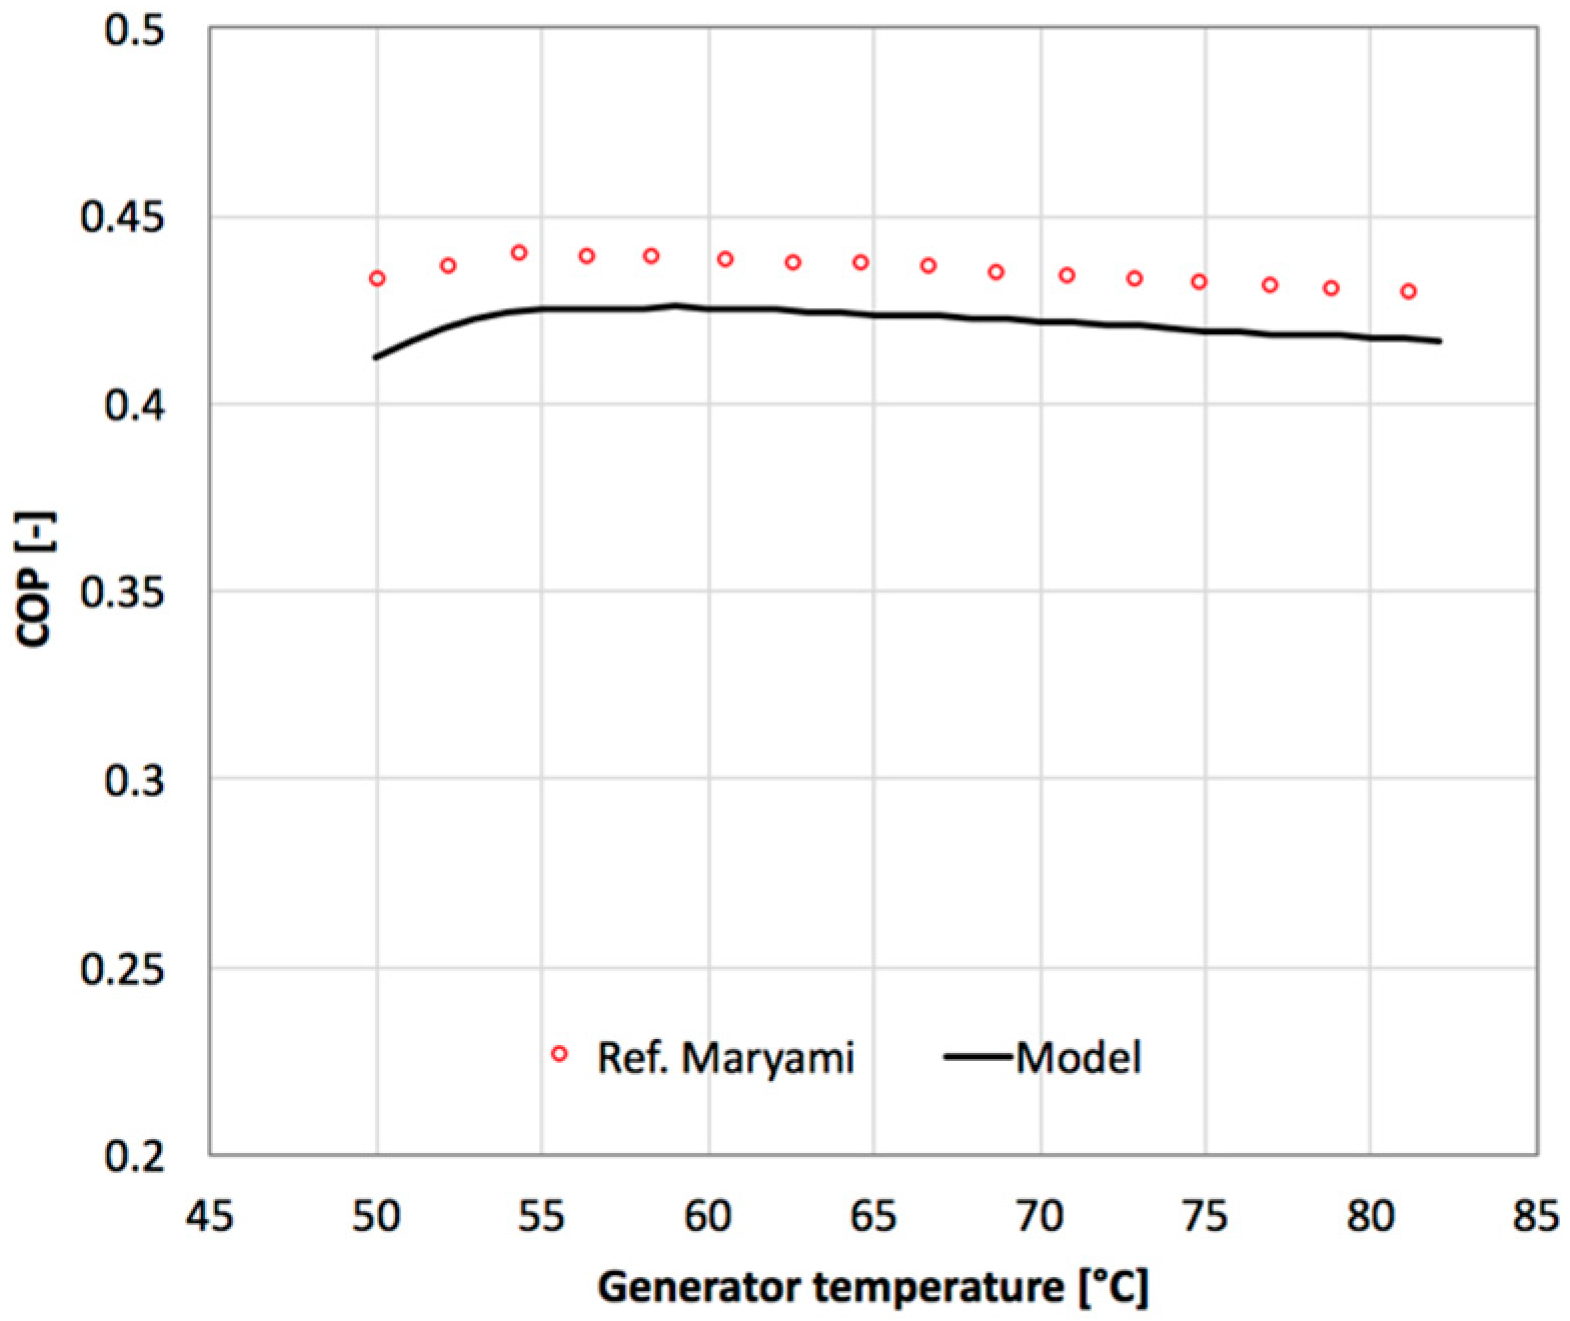
Figure 5.
Trigeneration system operating field in terms of electric, thermal and cooling power, at fixed operating conditions for the chiller (THG = 56 °C, TCD = 33 °C, TEV = 10 °C). CHP: combined heat and power; CCP: combined cooling and power; CCHP: combined Cooling, Heating and Power.
Figure 5.
Trigeneration system operating field in terms of electric, thermal and cooling power, at fixed operating conditions for the chiller (THG = 56 °C, TCD = 33 °C, TEV = 10 °C). CHP: combined heat and power; CCP: combined cooling and power; CCHP: combined Cooling, Heating and Power.
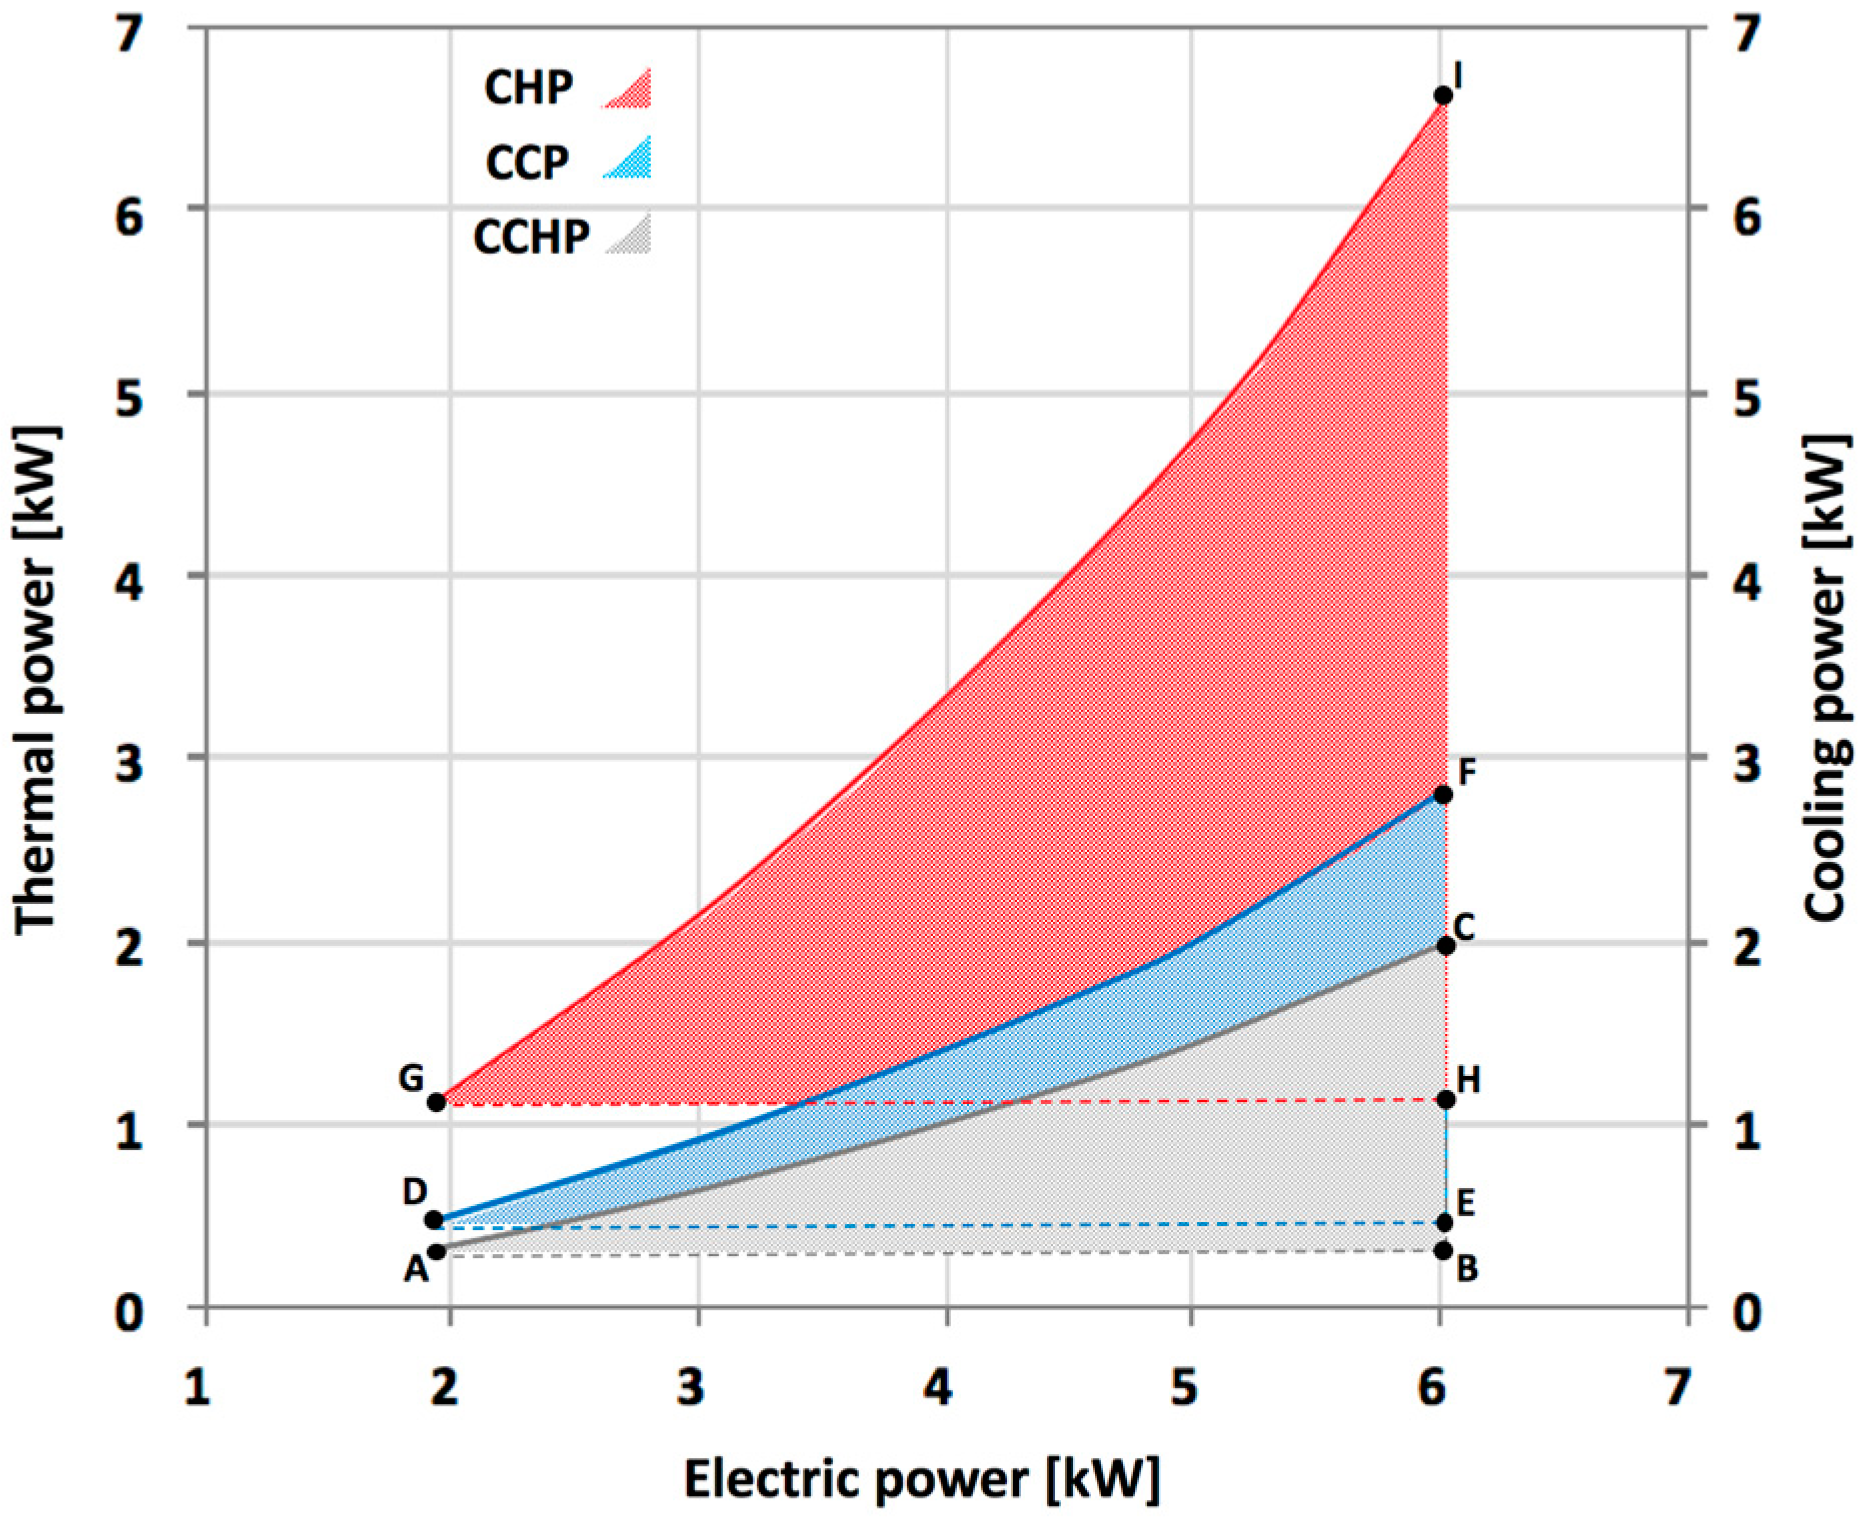
Figure 6.
The dependence of thermal, electrical, and cooling efficiencies on current intensity. (a) The CHP and CCP mode; (b) The CCHP mode.
Figure 6.
The dependence of thermal, electrical, and cooling efficiencies on current intensity. (a) The CHP and CCP mode; (b) The CCHP mode.
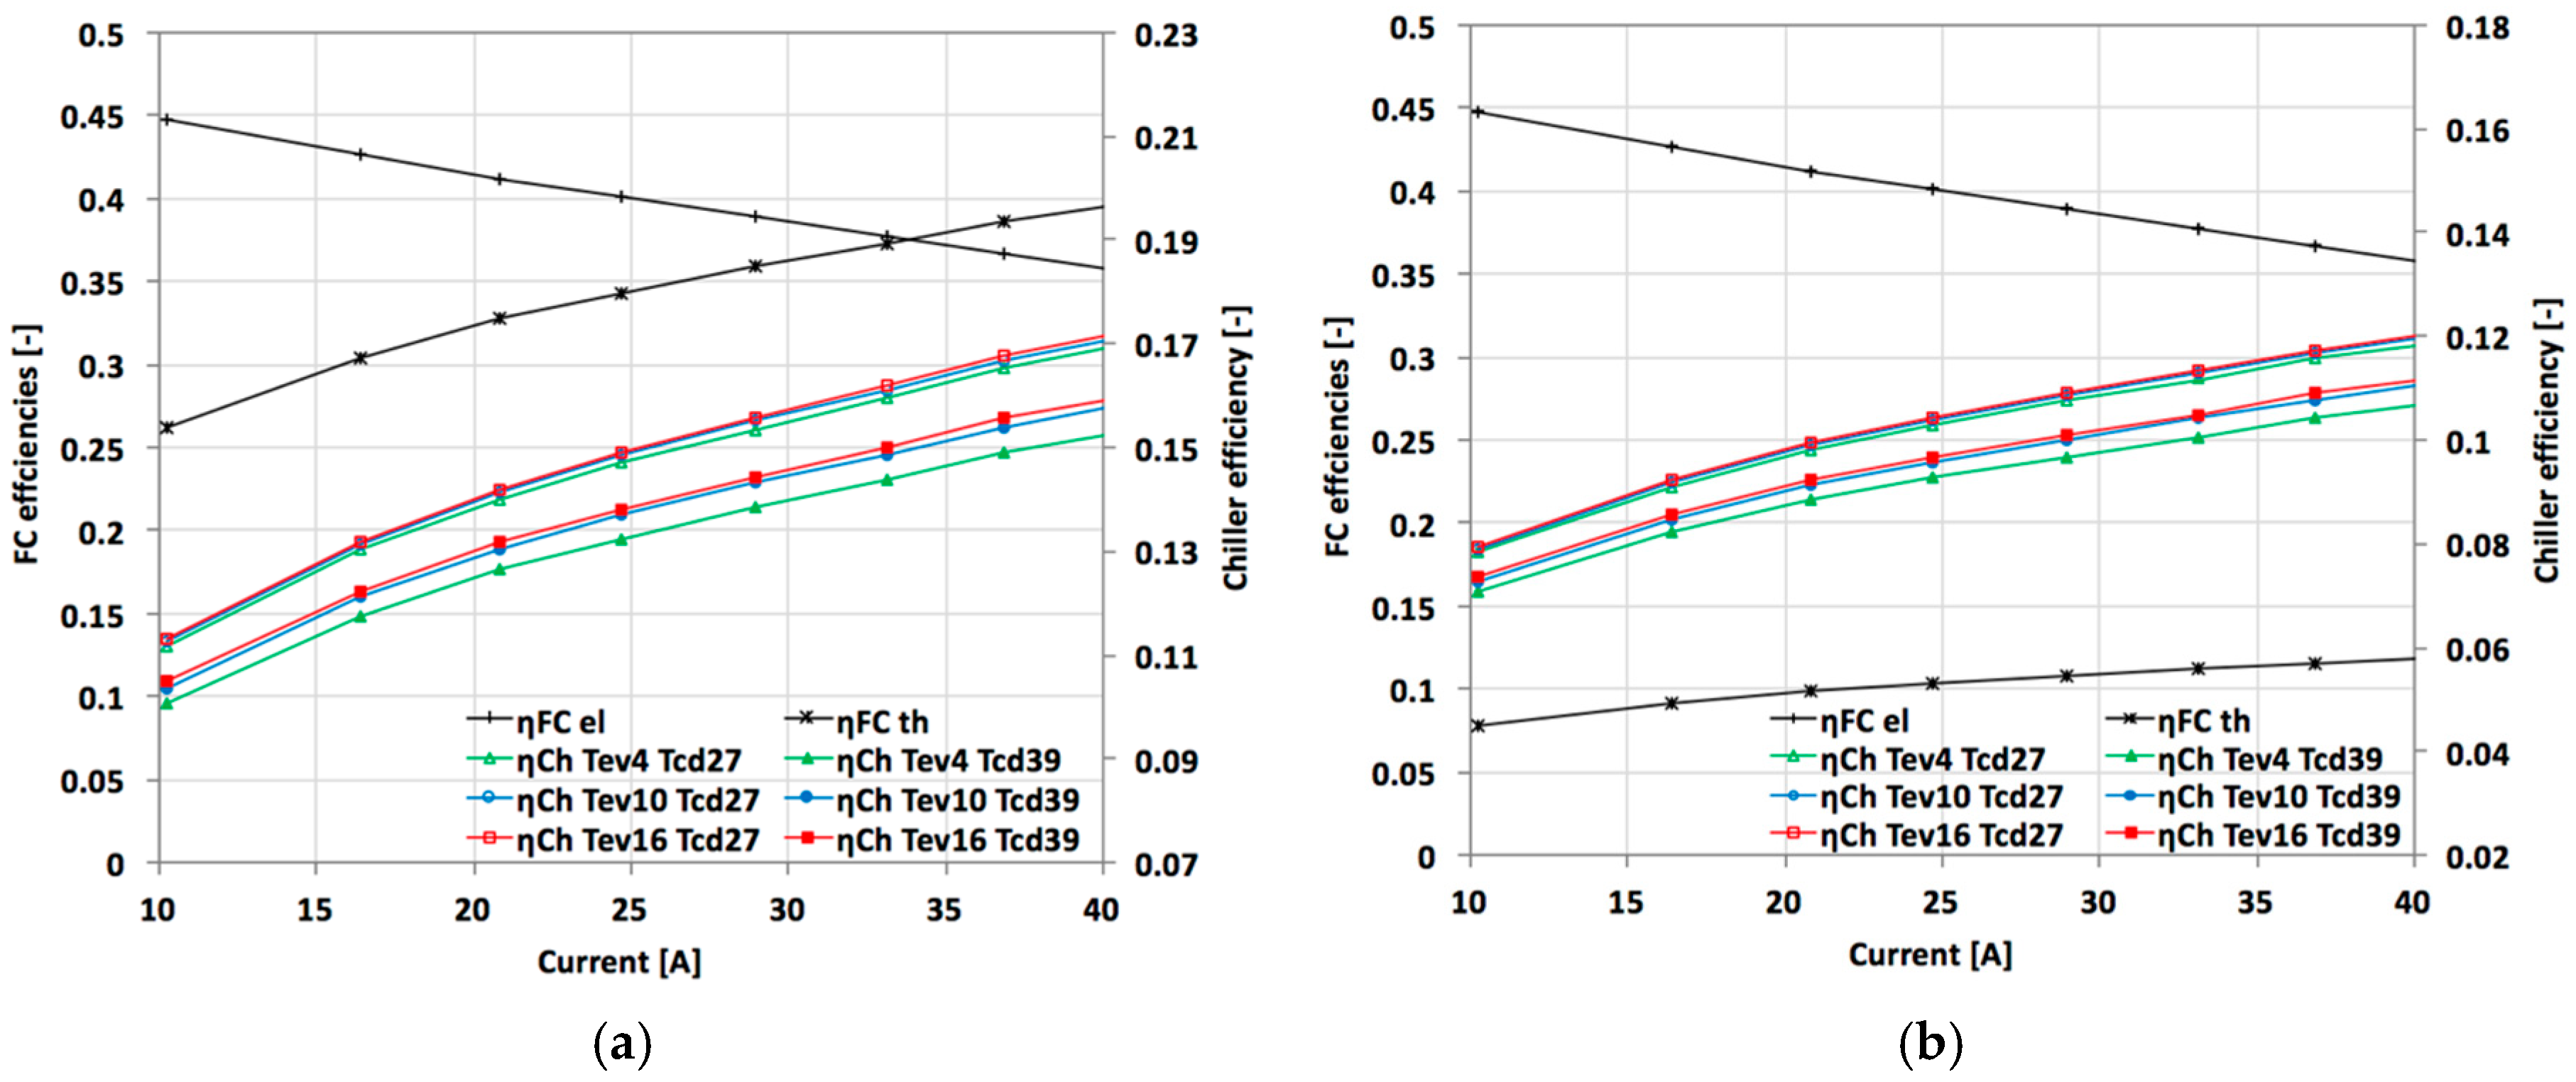
Figure 7.
Energy Utilization Factor (EUF) and Exergy Utilization Factor (ExUF) vs. electric power for CHP mode.
Figure 7.
Energy Utilization Factor (EUF) and Exergy Utilization Factor (ExUF) vs. electric power for CHP mode.

Figure 8.
EUF and ExUF vs. electric power for CCP mode.

Figure 9.
EUF and ExUF vs. electric power for CCHP mode.

Figure 10.
EUF & ExUF comparison for the proposed system operating modes.


Table 1.
Forward and backward reaction rates.
| Reaction | Forward | Backward |
|---|---|---|
| H2 + 2M ↔ 2(M − H) | K1 | K2 |
| 2(M − H) → 2H+ + 2e− + 2M | K3 | - |
| CO + M ↔ (M − CO) | K4 | K5 |
| (M − CO) + H2O → CO2 + 2H+ + 2e− + M | K6 | - |
| CO2 + 2M − H → M − CO + H2O + M | K7 | - |
Table 2.
Mass and energy balance and governing equations for each component.
| Component | Mass and Energy Balance and Governing Equations. |
|---|---|
| Low Generator (LG) | |
| High Generator (HG) | |
| Low Absorber (LA) | |
| High absorber (HA) | |
| Condenser (CD) | |
| Evaporator (EV) | |
| Heat exchanger (HX1) | ; |
| Heat exchanger (HX2) | ; |
| Coefficient of performance (COP) |
Table 3.
Input and output to/from the model [30].
Table 3.
Input and output to/from the model [30].
| Model input [30] | Characteristic and Operating Parameter | Unit | Value |
| A | cm2 | 200 | |
| λ | - | 23 | |
| l | cm | 0.178 | |
| T | °C | 67 | |
| Pa | atm | 1 | |
| Pc | atm | 1 | |
| RHa | % | 100 | |
| RHc | % | 100 | |
| UF | - | 0.8 | |
| UAir | - | 0.5 | |
| Fuel | mol % | 75% H2 20% CO2 3% N2 2% CH4 | |
| h | kW/m2 K | 6 × 10⁻³ | |
| σ | kW/m2 | 5.67 × 10⁻¹¹ | |
| ε | - | 0.97 | |
| AStack | m2 | 0.15 | |
| Troom | °C | 25 | |
| Tw,in | °C | 57 | |
| Tw,out | °C | 67 | |
| Electrochemical model output (40 A) | Output | Unit | Value |
| Vcell | V | 0.655 | |
| Vohmic | V | 0.0189 | |
| Vact,a | V | 0.0181 | |
| Vact,c | V | 0.468 | |
| VStack | V | 30.13 | |
| Pel | kW | 1.206 | |
| Pch,in | kW | 3.412 | |
| Pch,out | kW | 0.672 | |
| Thermal model output (40 A) | kW | 1.31 | |
| kW | −0.085 | ||
| kW | 0.216 | ||
| kW | 0.091 | ||
| kg/s | 0.031 |
Table 4.
Input and output to/from the model. COP: coefficient of performance.
| Model input | Operating Parameter | Unit | Value | ||
| Low pressure | kPa kPa kPa °C °C °C °C | 1.228 2.255 5.033 58.2 33 33 10 | |||
| Medium pressure | |||||
| High pressure | |||||
| THG = TLG | |||||
| THA = TLA | |||||
| TCD | |||||
| TEV | |||||
| LiBr conc. (state 1) | % | 51.4 | |||
| LiBr conc. (state 8) | % | 43.1 | |||
| % | 70 | ||||
| kW | 300 | ||||
| Model output | Output | Unit | Model Value | Reference Value [39] | Discrepancy % |
| kW | 300 | 300 | - | ||
| kW | 705.04 | 685.1 | 2.82 | ||
| kW | 311.42 | 308.8 | 0.84 | ||
| kW | 693.55 | 676.3 | 2.48 | ||
| COP | - | 0.425 | 0.437 | 2.74 | |
Table 5.
The state point results calculated for the half-effect absorption chiller system that operates at nominal conditions in combined cooling and power (CCP) mode (THG = 56 °C, TCD = 33 °C, TEV = 10 °C).
Table 5.
The state point results calculated for the half-effect absorption chiller system that operates at nominal conditions in combined cooling and power (CCP) mode (THG = 56 °C, TCD = 33 °C, TEV = 10 °C).
| State Point | Mass Flow (kg/s) | T (°C) | P (kPa) | LiBr (%) | H2O (%) | Vapor Frac. (–) |
|---|---|---|---|---|---|---|
| 1 | 0.009813 | 33.48 | 1.228 | 51.39 | - | 0 |
| 2 | 0.009813 | 33.48 | 2.255 | 51.39 | - | 0 |
| 3 | 0.009813 | 42.02 | 2.255 | 51.39 | - | 0 |
| 4 | 0.008626 | 56.0 | 2.255 | 58.47 | - | 0 |
| 5 | 0.008626 | 45.55 | 2.255 | 58.47 | - | 0 |
| 6 | 0.008626 | 44.89 | 1.228 | 58.47 | - | 0.00066 |
| 7 | 0.001878 | 56 | 2.255 | - | 100 | 1 |
| 8 | 0.009668 | 33.72 | 2.255 | 42.9 | - | 0 |
| 9 | 0.009668 | 33.72 | 5.083 | 42.9 | - | 0 |
| 10 | 0.009668 | 42.05 | 5.083 | 42.9 | - | 0 |
| 11 | 0.008480 | 56 | 5.083 | 49.02 | - | 0 |
| 12 | 0.008480 | 45.76 | 5.083 | 49.02 | - | 0 |
| 13 | 0.008480 | 41.01 | 2.255 | 49.02 | - | 0 |
| 14 | 0.001187 | 56 | 5.083 | - | 100 | 1 |
| 15 | 0.001187 | 33.09 | 5.083 | - | 100 | 0 |
| 16 | 0.001187 | 9.91 | 1.228 | - | 100 | 0.039 |
| 17 | 0.001187 | 9.91 | 1.228 | - | 100 | 1 |
| 18 | 0.080260 | 67 | 101.325 | - | 100 | 0 |
| 19 | 0.080260 | 57 | 101.325 | - | 100 | 0 |
| 20 | 0.078602 | 67 | 101.325 | - | 100 | 0 |
| 21 | 0.078602 | 57 | 101.325 | - | 100 | 0 |
| 22 | 0.139957 | 25 | 101.325 | - | 100 | 0 |
| 23 | 0.139957 | 30 | 101.325 | - | 100 | 0 |
| 24 | 0.135069 | 18 | 101.325 | - | 100 | 0 |
| 25 | 0.135069 | 13 | 101.325 | - | 100 | 0 |
| 26 | 0.155518 | 25 | 101.325 | - | 100 | 0 |
| 27 | 0.155518 | 30 | 101.325 | - | 100 | 0 |
| 28 | 0.157056 | 25 | 101.325 | - | 100 | 0 |
| 29 | 0.157056 | 30 | 101.325 | - | 100 | 0 |
Table 6.
The state point results calculated for the half-effect absorption chiller system that operates at nominal conditions in CCHP mode (THG = 56 °C, TCD = 33 °C, TEV = 10 °C).
Table 6.
The state point results calculated for the half-effect absorption chiller system that operates at nominal conditions in CCHP mode (THG = 56 °C, TCD = 33 °C, TEV = 10 °C).
| State Point | Mass Flow (kg/s) | T (°C) | P (kPa) | LiBr (%) | H2O (%) | Vapor Frac. (–) |
|---|---|---|---|---|---|---|
| 1 | 0.006853 | 33.48 | 1.228 | 51.39 | - | 0 |
| 2 | 0.006853 | 33.48 | 2.255 | 51.39 | - | 0 |
| 3 | 0.006853 | 42.02 | 2.255 | 51.39 | - | 0 |
| 4 | 0.006024 | 56.0 | 2.255 | 58.47 | - | 0 |
| 5 | 0.006024 | 45.55 | 2.255 | 58.47 | - | 0 |
| 6 | 0.006024 | 44.89 | 1.228 | 58.47 | - | 0.00066 |
| 7 | 0.000829 | 56 | 2.255 | - | 100 | 1 |
| 8 | 0.006758 | 33.72 | 2.255 | 42.9 | - | 0 |
| 9 | 0.006758 | 33.72 | 5.083 | 42.9 | - | 0 |
| 10 | 0.006758 | 42.05 | 5.083 | 42.9 | - | 0 |
| 11 | 0.005928 | 56 | 5.083 | 49.02 | - | 0 |
| 12 | 0.005928 | 45.76 | 5.083 | 49.02 | - | 0 |
| 13 | 0.005928 | 41.01 | 2.255 | 49.02 | - | 0 |
| 14 | 0.000830 | 56 | 5.083 | - | 100 | 1 |
| 15 | 0.000830 | 33.09 | 5.083 | - | 100 | 0 |
| 16 | 0.000830 | 9.91 | 1.228 | - | 100 | 0.039 |
| 17 | 0.000830 | 9.91 | 1.228 | - | 100 | 1 |
| 18 | 0.056053 | 67 | 101.325 | - | 100 | 0 |
| 19 | 0.056053 | 57 | 101.325 | - | 100 | 0 |
| 20 | 0.054907 | 67 | 101.325 | - | 100 | 0 |
| 21 | 0.054907 | 57 | 101.325 | - | 100 | 0 |
| 22 | 0.097834 | 25 | 101.325 | - | 100 | 0 |
| 23 | 0.097834 | 30 | 101.325 | - | 100 | 0 |
| 24 | 0.094420 | 18 | 101.325 | - | 100 | 0 |
| 25 | 0.094420 | 13 | 101.325 | - | 100 | 0 |
| 26 | 0.108710 | 25 | 101.325 | - | 100 | 0 |
| 27 | 0.108710 | 30 | 101.325 | - | 100 | 0 |
| 28 | 0.109749 | 25 | 101.325 | - | 100 | 0 |
| 29 | 0.109749 | 30 | 101.325 | - | 100 | 0 |
Table 7.
and parameter related to heating and cooling production temperatures.
| (°C) | 61.97 | - | - |
| CHP | 0.11 | - | - |
| CCP | - | - | - |
| CCHP | 0.11 | - | - |
| (°C) | 9.49 | 15.49 | 21.49 |
| CHP | - | - | - |
| CCP | 0.064 | 0.042 | 0.020 |
| CCHP | 0.064 | 0.042 | 0.020 |
Table 8.
The trigeneration primary energy saving (TPES) values calculated for the operating points of the CCHP mode.
Table 8.
The trigeneration primary energy saving (TPES) values calculated for the operating points of the CCHP mode.
| Points | A | B | C |
|---|---|---|---|
| (kW) | 4.30 | 16.84 | 16.84 |
| (kW) | 1.92 | 6.03 | 6.03 |
| (kW) | 0.33 | 0.33 | 1.97 |
| (kW) | 0.33 | 0.33 | 1.97 |
| TPES | 0.19 | −0.07 | 0.09 |
© 2018 by the author. Licensee MDPI, Basel, Switzerland. This article is an open access article distributed under the terms and conditions of the Creative Commons Attribution (CC BY) license (http://creativecommons.org/licenses/by/4.0/).
Share and Cite
MDPI and ACS Style
Cozzolino, R. Thermodynamic Performance Assessment of a Novel Micro-CCHP System Based on a Low Temperature PEMFC Power Unit and a Half-Effect Li/Br Absorption Chiller. Energies 2018, 11, 315. https://doi.org/10.3390/en11020315
AMA Style
Cozzolino R. Thermodynamic Performance Assessment of a Novel Micro-CCHP System Based on a Low Temperature PEMFC Power Unit and a Half-Effect Li/Br Absorption Chiller. Energies. 2018; 11(2):315. https://doi.org/10.3390/en11020315
Chicago/Turabian StyleCozzolino, Raffaello. 2018. "Thermodynamic Performance Assessment of a Novel Micro-CCHP System Based on a Low Temperature PEMFC Power Unit and a Half-Effect Li/Br Absorption Chiller" Energies 11, no. 2: 315. https://doi.org/10.3390/en11020315
Note that from the first issue of 2016, this journal uses article numbers instead of page numbers. See further details here.