Article

Robust Condition Assessment of Electrical Equipment with One Class Support Vector Machines Based on the Measurement of Partial Discharges

by
Emilio Parrado-Hernández
1,
Guillermo Robles
2,*,
Jorge Alfredo Ardila-Rey
3 and
Juan Manuel Martínez-Tarifa
2
1
Department of Signal Processing and Communications, Universidad Carlos III de Madrid, Avda. Universidad, 30, Leganés, Madrid 28911, Spain
2
Department of Electrical Engineering, Universidad Carlos III de Madrid, Avda. Universidad, 30, Leganés, Madrid 28911, Spain; Emails: [email protected]
3
Department of Electrical Engineering, Federico Santa María Technical University, 8940000 Santiago de Chile, Chile
*
Author to whom correspondence should be addressed.
Energies 2018, 11(3), 486; https://doi.org/10.3390/en11030486
Submission received: 23 January 2018 / Revised: 14 February 2018 / Accepted: 23 February 2018 / Published: 25 February 2018
(This article belongs to the Section F: Electrical Engineering)

Abstract

:
This paper presents a system for the detection of partial discharges (PD) in industrial applications based on One Class Support Vector Machines (OCSVM). The study stresses the detection of Partial Discharges (PD) as they represent a major source of information related to degradation in the equipment. PD measurement is a widely extended technique for condition monitoring of electrical machines and power cables to avoid catastrophic failures and the consequent blackouts. One of the most important keystones in the interpretation of partial discharges is their separation from other signals considered as not-PD especially in low SNR measurements. In this sense, the OCSVM is an interesting alternative to binary SVMs since it does not need a training set with examples of all the output classes correctly labelled. On the contrary, the OCSVM learns a model of the signals acquired when the equipment is in PD-free mode, defined as a state where no degradation mechanism is active, so one only needs to make sure that the training signals were recorded under this setting. These default mode signals are easier to characterize and acquire in industrial environments than PD and lead to more robust detectors that practically do not need domain adaptation to perform in scenarios prone to different types of PD. In fact, the experimental results show that the performance of the OCSVM is comparable to that achieved by a binary SVM trained using both noise and PD pulses. Finally, the method is successfully applied to a more realistic scenario involving the detection of PD in a damaged distribution power cable.

1. Introduction

While the safety of equipment in power systems (motors, generators, transformers and power cables) has always been a great need for the majority of electric companies, maintenance was usually performed on a scheduled basis without further information about the condition of the asset. Nowadays, the exigencies of new grids, including the improvement of power reliability and quality, the enhancement of the capacity and efficiency of existing electric power networks, the optimization of facility utilization and the improvement of the resilience to disruption, makes condition-based maintenance a key task [1]. Under these assumptions, monitoring systems have become fundamental tools that allow achieving really smart management of any electrical asset [2]. These systems must integrate multiple and distributed sensors for on-line diagnosis of the different components associated with the power grid and the knowledge of their operating conditions. However, in some cases the monitoring of a grid to make predictive maintenance is a very challenging task due to the complexity of gathering and understanding all the different types of signals delivered by sensors, systems and devices associated with the size of the grid and the different nature of the signals [3,4].
It is widely accepted that there are several testing techniques that can detect many aging mechanisms before an unexpected failure of electrical assets takes place [5,6]. Among them, the measurement of partial discharge (PD) activity is the only one that can make diagnosis on-line in any kind of high-voltage apparatus [7,8,9]. However, since PD pulses are a consequence of low energy phenomena, in real industrial environments the signal to noise ratio (SNR) can be low, so the classical classification techniques, such as phase resolved partial discharge (PRPD) patterns, may not provide a clear discrimination by themselves, being necessary the application of new techniques to complement the results. In order to face this issue, high bandwidth detectors, capable of capturing as much information as possible from each signal for further processing are widely used [7,10,11]. Thus, the parametrization of pulses has been carried out in order to filter noise and classify the discharge source [7,11,12,13]. Following this research trend, several techniques, such as, time-frequency (T-F) maps [14], wavelet filtering [15] and power ratios (PR) maps [11] have succeeded in grouping the detected pulses in clusters based on information that is extracted from each signal.
For all the aforementioned, machine learning (ML) techniques can also support PD discrimination. ML is a discipline that studies algorithms that build data models from examples with the purpose of making inferences about separate data not available during the training of the model. In a classification setting the ML algorithm is trained with a set of labelled examples, that is, for these examples the correct class is known. The so-called training set has to be large and rich enough to include a sufficient representation of the input domain of the problem. The recent technological advances in computing sciences, leading to a dramatic increase in the capabilities of storing and processing massive amounts of data have resulted in ML techniques becoming a core tool in signal processing applications. Within all the recent machine classification techniques, Support Vector Machines (SVMs) [16,17] arguably represent the state of the art in PD discrimination. SVMs have been applied for this purpose in previous works; some of them did not recognize PD in real high-voltage environments and most of them employed sets of features that obscure the process of gaining insights about the underlying relation between the decisions output by the machine and the physical processes originating the different PD. In [18], the authors prepared a test object to measure PD in transformers and inject pulses with a calibrator. The signals are preprocessed with a wavelet decomposition and use the coefficients of the levels as one of the features to train a binary SVM. In [19] the rejection of noise is not taken into account when testing the effectiveness of the algorithms. In a previous work [20], the authors of this paper systematically addressed the classification of PD with SVM. This work also introduced a kernel that works with the shape of the power spectrum of the signals, leading to excellent results in terms of discrimination capability and also interpretability of the classification. One of the main difficulties to be faced in the development of an SVM PD system for industrial applications is the need of a correctly labeled dataset (including a representative number of samples of each of the classes involved) and the on-site training of the SVM. The training of an automatic classifier needs a significant amount of samples of each one of the classes involved in the problem definition. In the PD classification problem this means that a training set formed by a representative number of corona, surface and internal discharges produced in the object under study, should be available beforehand. Moreover, the correct class of each of these training samples must be assessed by an expert in order to guarantee that the information provided to the training algorithm is coherent. In industrial applications this compilation of training information can turn out to be prohibitive, therefore this paper proposes to start with the characterization of the noise in the object under study and use this characterization to identify the emergence of PD and as a base to classify the source of those PD.
For their application, SVMs need a correctly labeled training set that accurately represents the data distribution of all the classes involved. This fact limits their immediate application in scenarios where data labeling is hard or expensive. The semisupervised learning paradigm boosts the SVM performance in such scenarios by enabling to complement the labeled dataset with the use of massive amounts of unlabeled data [21,22]. Some other applications present an asymmetry in the nature of the classes; one of the classes (called target class) is well defined or easy to sample and label, while the rest of the classes are poorly defined or scarce or difficult to sample. Such applications brought in the One Class SVM (OCSVM) [23,24,25]. OCSVM aims at learning the distribution support of the target class in order to decide whether test samples belong or not to the target class.
In this paper, we study the capabilities of the OCSVM as a core technology for the implementation of detectors of signals related to degradation, mainly related to PD. To the authors’ knowledge, there are no published works focused on PD identification through one-class SVM comparing its effectiveness to the binary approach. Particularly, the presented approach focuses on the modeling as target class the pulses recorded in the electrical asset under study during a state without active degradation or ageing. To align this work with the PD detection literature, we consider those pulses recorded during the default mode functioning to be background noise since a PD detector would be sensing noise pulses in absence of PD. The advantages of our approach in an industrial application are the following:
  • Each type of PD is caused by a different physical process, while the nature of the signals of the default mode across different PD scenarios is more homogeneous. This results in a straightforward domain adaptation of the detectors for different PD environments. Moreover, the domain adaptation would just involve signals acquired during default mode, skipping the need of labelled data of a standard classification method. The detectors could implement an already trained OCSVM, saving computational burden and time.
  • The size of the training sets used is rather small, achieving detection accuracies comparable to those obtained with a full SVM that is trained with examples of both noise and PD pulses, as it will be shown later in the experimental section.
  • The OCSVM produces sparse models (the detector is expressed in terms of a very reduced set of training examples). This property, together with the aforementioned kernel based on the shape of the power density spectra of the signals, enables an interpretation of the outcome of the detector by human operators, which increases the usability of the method in industrial environments.
  • In the most favorable cases, the process to acquire default mode signals in a recently setup electrical facility is immediate, since the apparition of PD involves imperfections in the materials that are supposed to appear in the medium to long term. Therefore, in case that some fine tuning of the detector is needed, this can be made during the setup of the electrical facility. Otherwise, the target class should be acquired in the same facility but in other equipment ensuring that it is free of PD with a previous test.
Considering that the accurate assessment of the operating state of insulation through reliable diagnostic measurements is crucial to achieve a smart maintenance [26], this paper also presents examples of the application of the proposed technique. In this sense, the experimental section includes several laboratory situations that illustrate the advantages of exploiting the discrimination between noise and the different types of partial discharges, as well as a study carried out for a real 12/20 kV XLPE insulated power cable commonly used in the power distribution and transport networks.

2. One Class SVM with a Kullback-Leibler Based Kernel for Densities

This section reviews the One Class SVM (OCSVM) [23], the core algorithm for the detectors implemented in this study. The OCSVMs are endowed with a kernel based on the Kullback-Leibler divergence that is very handy for processing data vectors that behave as discrete probabilities (we regard vectors of non-negative components that add up to one as discrete probabilities).

2.1. Review of One Class SVM

The OCSVM was proposed to solve these extreme situations in which some of the classes in a classification problem are not present at all. The goal of a one-class classification algorithm is to learn the support of the data distribution of a single class called target class. In other words, the OCSVM scoring function f(x) will output a highly positive value if x is a clear example of the target class, and a highly negative value when it is very unlikely that x belongs to the target class. This way, the classification boundary defined by the scoring function in the input space becomes the contour of the data support (examples within the boundary are said to belong to the target class).
In the case of electrical asset monitoring, the target class should be signals acquired in the asset in a” PD-free” regime and the signals caused by partial discharges the outliers that the OCSVM detector should find. Since PD discrimination is a major topic in the electrical asset maintenance literature, this paper specifically analyzes the performance of the OCSVM detector under different PD conditions. Moreover, to align this study with the broad literature on PD discrimination we use the term background noise to refer to pulses recorded when no stress is applied to the asset since they would be considered noise from the point of view of the PD detector. This background noise is always present in PD discrimination problems. Furthermore, unlike the PD pulses, background noise pulses are easy to measure from the setup of the measuring system, since they do not need a specific physical phenomenon going on in the electrical insulation. Therefore, a model of the background noise pulses learned for a particular PD scenario could be transferred onto a new, different PD scenario and still be expected to yield a good performance if the industrial environment responsible for the background noise sources has not changed. This situation is quite common in PD monitoring in fixed electrical assets.
The OCSVM can be regarded as an adaptation of the kernel version of the SVM for classification to a situation in which there is just one class available. For this purpose, the input data are mapped into a feature space using a mapping induced by a kernel function [27,28]. According to the kernel trick [27], this kernel function can be regarded as a scalar product in input space:
k ( x i , x j ) = ϕ ( x i ) , ϕ ( x j )
where · , · denotes the inner product in a Reproducing Kernel Hilbert Space, k ( · , · ) is a Mercer kernel [27,28] and ϕ ( · ) is the mapping from the input space onto feature space. Notice that in general one does not have access to the mapped points in the feature space since mapping ϕ ( · ) is unknown; the feature space is only accessible through evaluations of kernels. Different choices of the kernel function lead to different nonlinearities [27], i.e., each kernel will draw a different nonlinear boundary in the input space. Moreover, a high value of the kernel function for two instances in the input space means a high dot product for their corresponding mapped vectors in feature space. The key of the OCSVM is to consider that points outside the support of the data in input space would map to the zero vector in feature space (this way the scalar product between a mapped sample inside the support and a mapped outlier is 0) [23]. Then, the OCSVM draws a hyperplane in feature space that separates the zero from the mapped input vectors with maximum margin. This linear boundary in feature space would map back into input space as a non-linear curve that delimits the support of the distribution: The input samples that belong to the target class will end up inside the contour drawn by the projection of the linear boundary in feature space, while the outliers will end up outside this contour.
Figure 1 displays an example of a model problem in a two-dimensional input space. The plot (a) shows 20 input data points that are mapped into a feature space induced by a certain kernel function. The plot (b) shows the mapped input data plus the zero vector in feature space. The linear classifier that separates mapped data from the zero vector in feature space (plot (a)) is mapped back as a nonlinear contour englobing the input data (plot (b)).
The procedure to learn the OCSVM is the following: let us consider a target class represented by an available training set with N independent and identically distributed samples X = { x 1 , , x N } . Those samples are in our case the normalized power spectrum densities of the training pulses. Consider in addition a Mercer kernel k ( x i , x i ) that induces a mapping ϕ ( x ) into a feature space F. The mapped training set in F is now Φ(X) = { ϕ ( x 1 ) , , ϕ ( x N ) } . The OCSVM determines the hyperplane that separates Φ(X) from the null vector of F with maximum margin. This hyperplane becomes a nonlinear scoring function in input space:
f ( x ) = w ,   ϕ ( x ) ρ
where w F and ρ R are the weight vector and the bias term defining the hyperplane, respectively. The samples in Φ(X) and the 0 vector in the feature space lie in different sides of the hyperplane defined by w and ρ . The optimization problem that determines the values for these parameters is [23]:
min w , ρ , ξ i { 1 2 w 2 + 1 v N i = 1 N ( ξ i ρ ) }
w , ϕ ( x ) ρ ξ i , i = 1 , , N
ξ i 0 , i = 1 , , N
where the slacks variables ξ i allow for some samples to lie on the other side of the hyperplane. The consideration of these samples as outliers permits smoother scoring functions. In general, the use of smooth scoring functions in machine learning improves the generalization capability (a machine generalizes well when its performance in the test set does not decay significantly with respect to its performance when making inference on the training set) of the resulting machine. The smoothness of the scoring function is enforced by the regularization term [17,27] 1 2 w 2 included in the optimization (2). Finally, user defined parameter v establishes a trade-off between regularizing and reducing the number of outliers.
The problem defined by (2) subject to (3) and (4) is a standard quadratic programming optimization that can be solved using off-the-shelf methods. In this paper we have used the LibSVM [29] implementation.
Constraints (3) are introduced with Lagrange multipliers α i (please refer to [23] for the details of the complete solution of the optimization problem). The evaluation of the Karush-Kuhn-Tucker optimality conditions yields that the weight vector turns out to be a linear combination of the training examples, with the Lagrange multipliers acting as coefficients of the combination:
w = i = 1 N α i ϕ ( x i )
Usually a large number of the α i become zero. Those xi with a multiplier α i different from zero are called support vectors (SVs) since they support the definition of the boundary that englobes the samples of the target class.

2.2. Kullback-Leibler Based Kernel

The OCSVM implemented in this work are endowed with a kernel function based on the Kullback-Leibler divergence [30]. This kernel can be computed for any two pulses x1 and x2 exponentiating a symmetrization of the discrete Kullback-Leibler (KL) divergence between x1 and x2:
k ( x 1 ,   x 2 ) = e x p { 0.5 ( KL ( x 1 x 2 ) + KL ( x 2 x 1 ) ) / σ }
K L ( x i x j ) = d = 1 D x i d l o g x i d x j d
providing that x j d = 0 implies x i d = 0 (we observe this constraint forcing a zero d-th term if either x j d = 0 or x i d = 0 ). Scalars x i d and x j d are d-th components of vectors xi and xj, respectively.
The reason to use this kernel is the following: the actual input data to the OCSVM are the normalized power spectrum densities (PSD) of the pulses. Each PSD is normalized to unit area, i.e., the samples of the PSD add up to one (see the following section). These input vectors can therefore be considered to behave as discrete probabilities, since all their components are positive and add up to one. A natural measure of divergence among discrete probabilities is the KL divergence. Notice that the interpretation of Equation (7) when each input vector is a normalized power spectrum is that each term of the sum compares the proportion of energy each pulse presents at the d-th frequency (log x i d x j d ) and weights this comparison by the energy in this frequency. This way the KL divergence focuses the similarity of the pulses on their most relevant parts of the spectrum. Other commonly used kernels, like the RBF, fail to capture these features as they equally weight all the frequencies or introduce spurious symmetries in the similarity. However, the KL divergence is not symmetric, and therefore cannot be considered a proper distance. That is the reason for including the symmetrization of the KL divergence by averaging KL ( x 1 x 2 ) and KL ( x 2 x 1 ) . Finally, the exponentiation of a distance becomes a kernel. The parameter σ determines the width of the kernel [31]. This parameter serves to tune the resolution of the analysis. Remember that the scoring function is a linear combination of kernels centered on the SVs. Each SV contributes strongly to the prediction of those test samples that are more similar to it. Thus the parameter σ determines the area of influence of each SV. The larger the value of σ , the larger the areas of influence will be. Intuitively, the kernel measures how similar are the PSDs of the SVs with those of the test signals and then the OCSVM classifies as belonging to the target class those signals whose PSDs are sufficiently similar to the SVs.

3. Experiments

3.1. Experimental Setup

Partial discharges are low-energy ionizations that occur inside the electrical insulation due to high electric field divergences within small volumes. The charge movement results in small current pulses with rise times as short as a few nanoseconds or even hundreds of picoseconds. The most common measuring techniques are designed to conduct these pulses through known paths where they can be acquired with high frequency current transformers or voltage dividers [
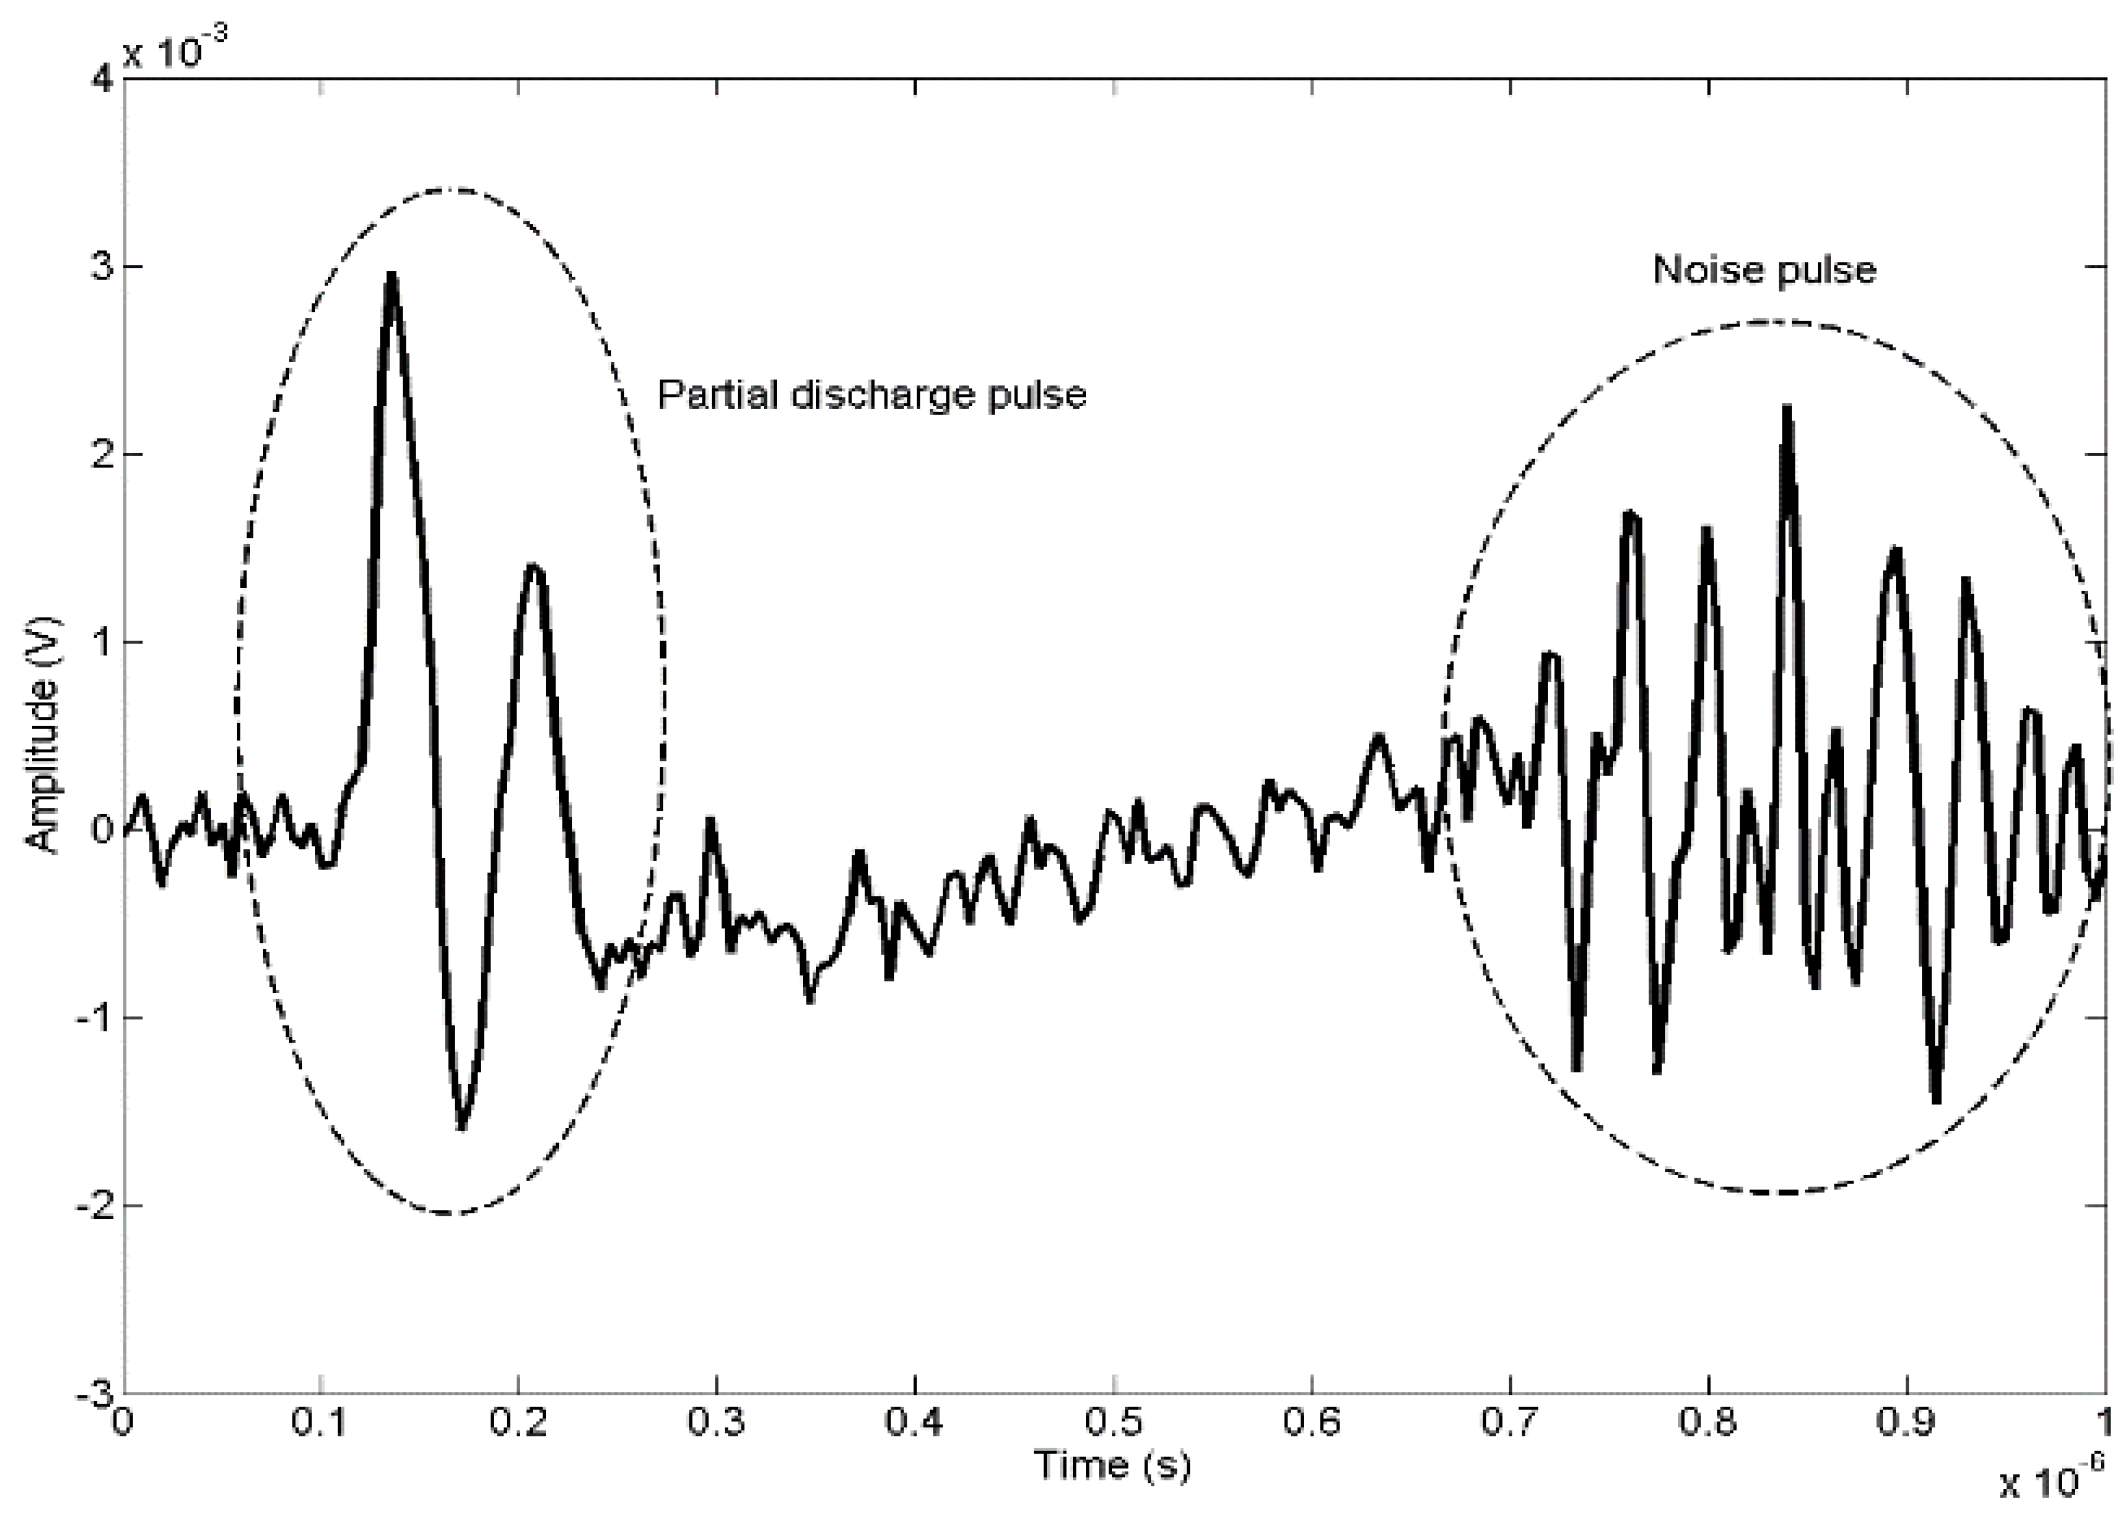
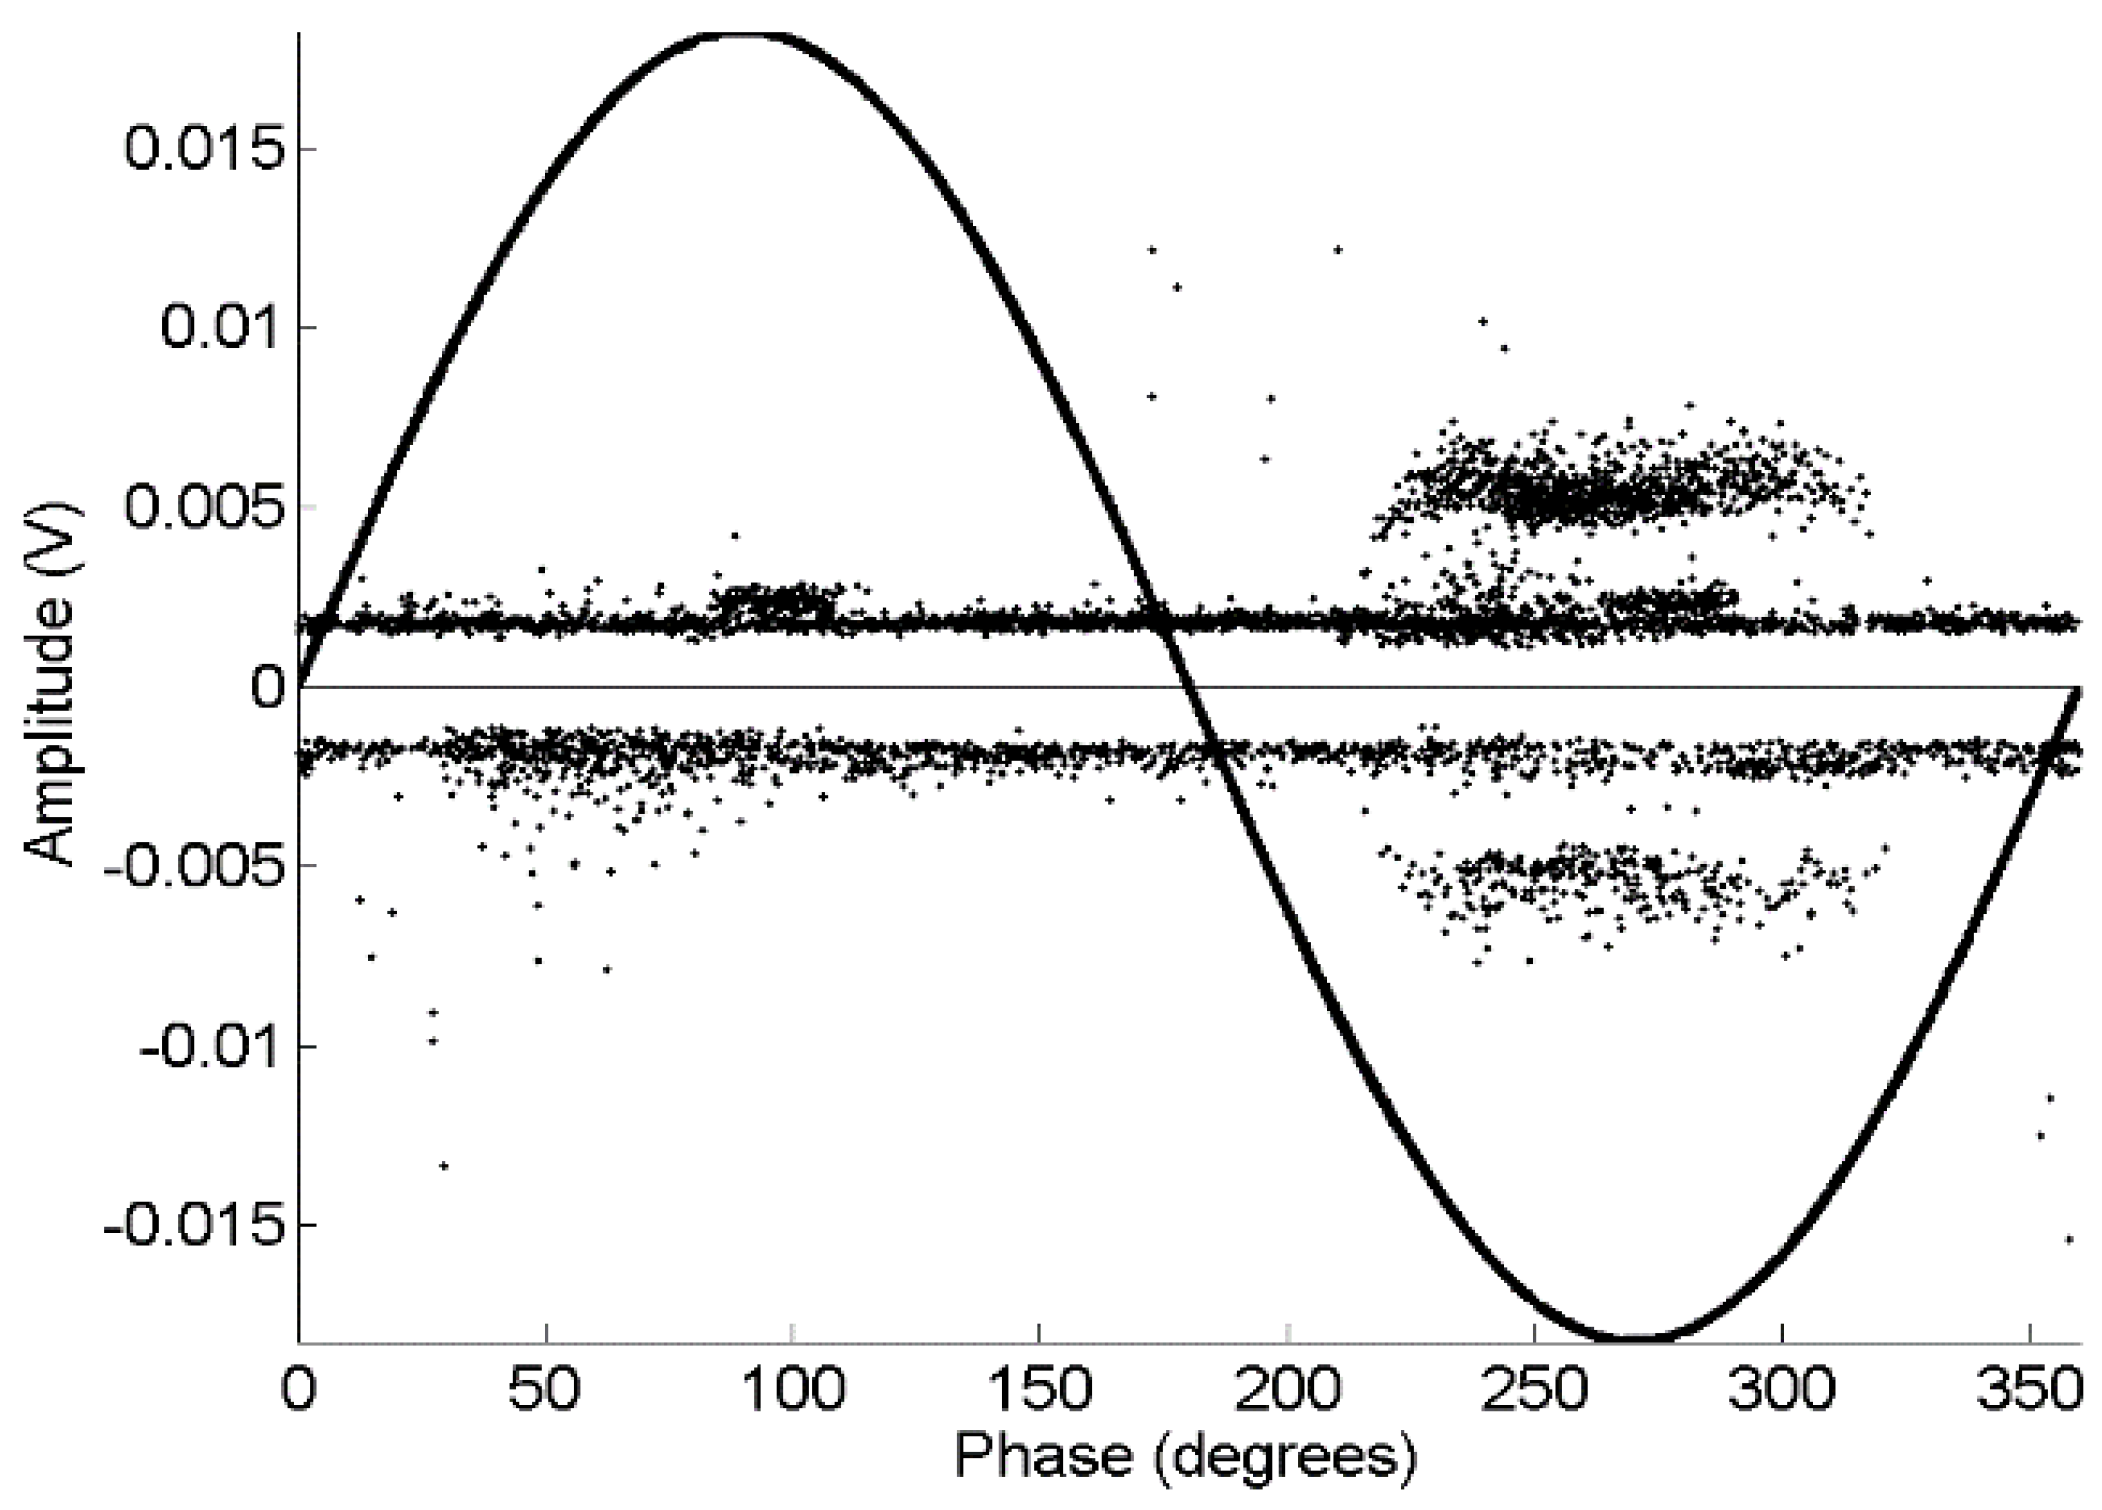
10]. The wires in the setup commonly filter higher frequencies limiting the band to some tens of megahertz resulting in signals such as that shown in Figure 2. This figure shows a typical partial discharge pulse plus noise induced by the environment with similar energy as the PD.
Being partial discharges a stochastic process and the power spectral density strongly dependent on the layout of the measuring circuit [8,10,27,32], it is preferable and more realistic to create real events instead of using synthesized signals. Then, all data analyzed with the OCSVM, including partial discharges and noise have been collected experimentally with a detection circuit based on the standard IEC 60270 [
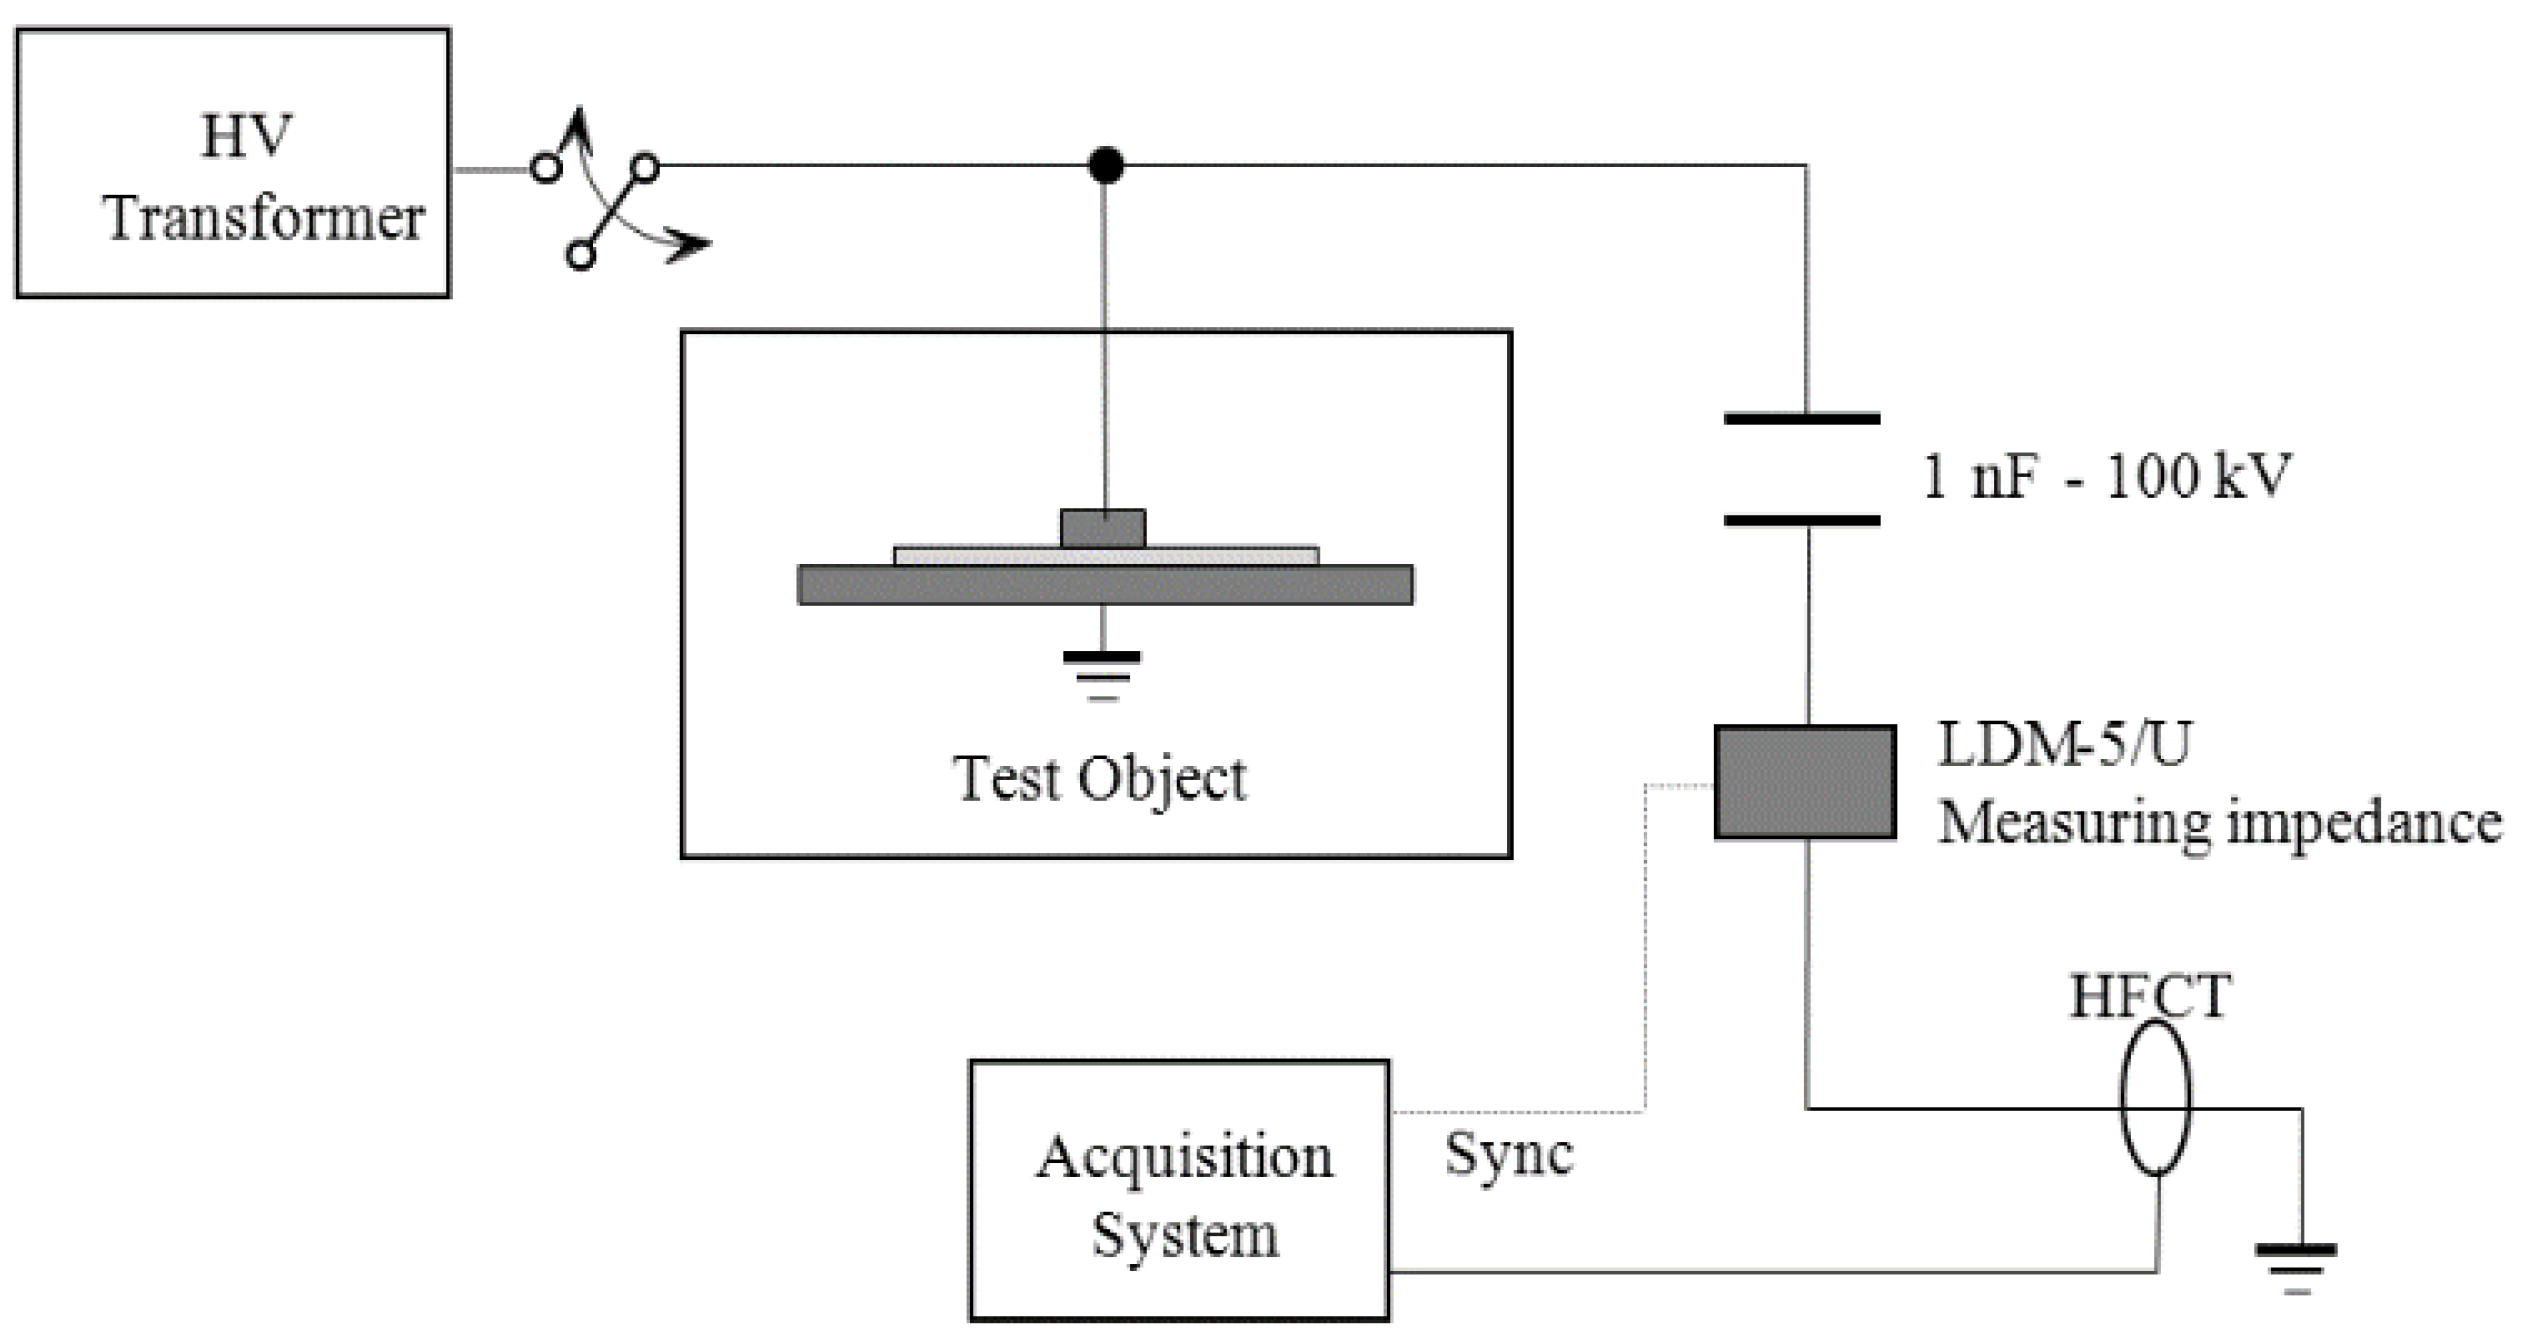
10]. This setup consists of a 750 VA transformer that applies high voltage to several test objects where partial discharges are created. A capacitive divider with a high-voltage capacitor connected in series with a measuring impedance provides a path for the high frequency currents generated by the PD pulses, see Figure 3.
These transients are measured through a high frequency current transformer (HFCT) with a bandwidth up to 80 MHz. The measuring impedance gives synchronization to the grid frequency (50/60 Hz) so PD pulses can be plotted in conventional PRPD patterns. A NI-PXI-5124 digitizer (National Instrument, Madrid, Spain), with a sampling frequency of 200 MS/s, a resolution of 12-bit and a bandwidth of 150 MHz was programmed with Labview to automatize the acquisition of the pulses. The 50 Hz synchronizing voltage was connected to one of the channels and the other gets the waveforms of the high-frequency pulses. Every network cycle (20 ms), 4 × 10
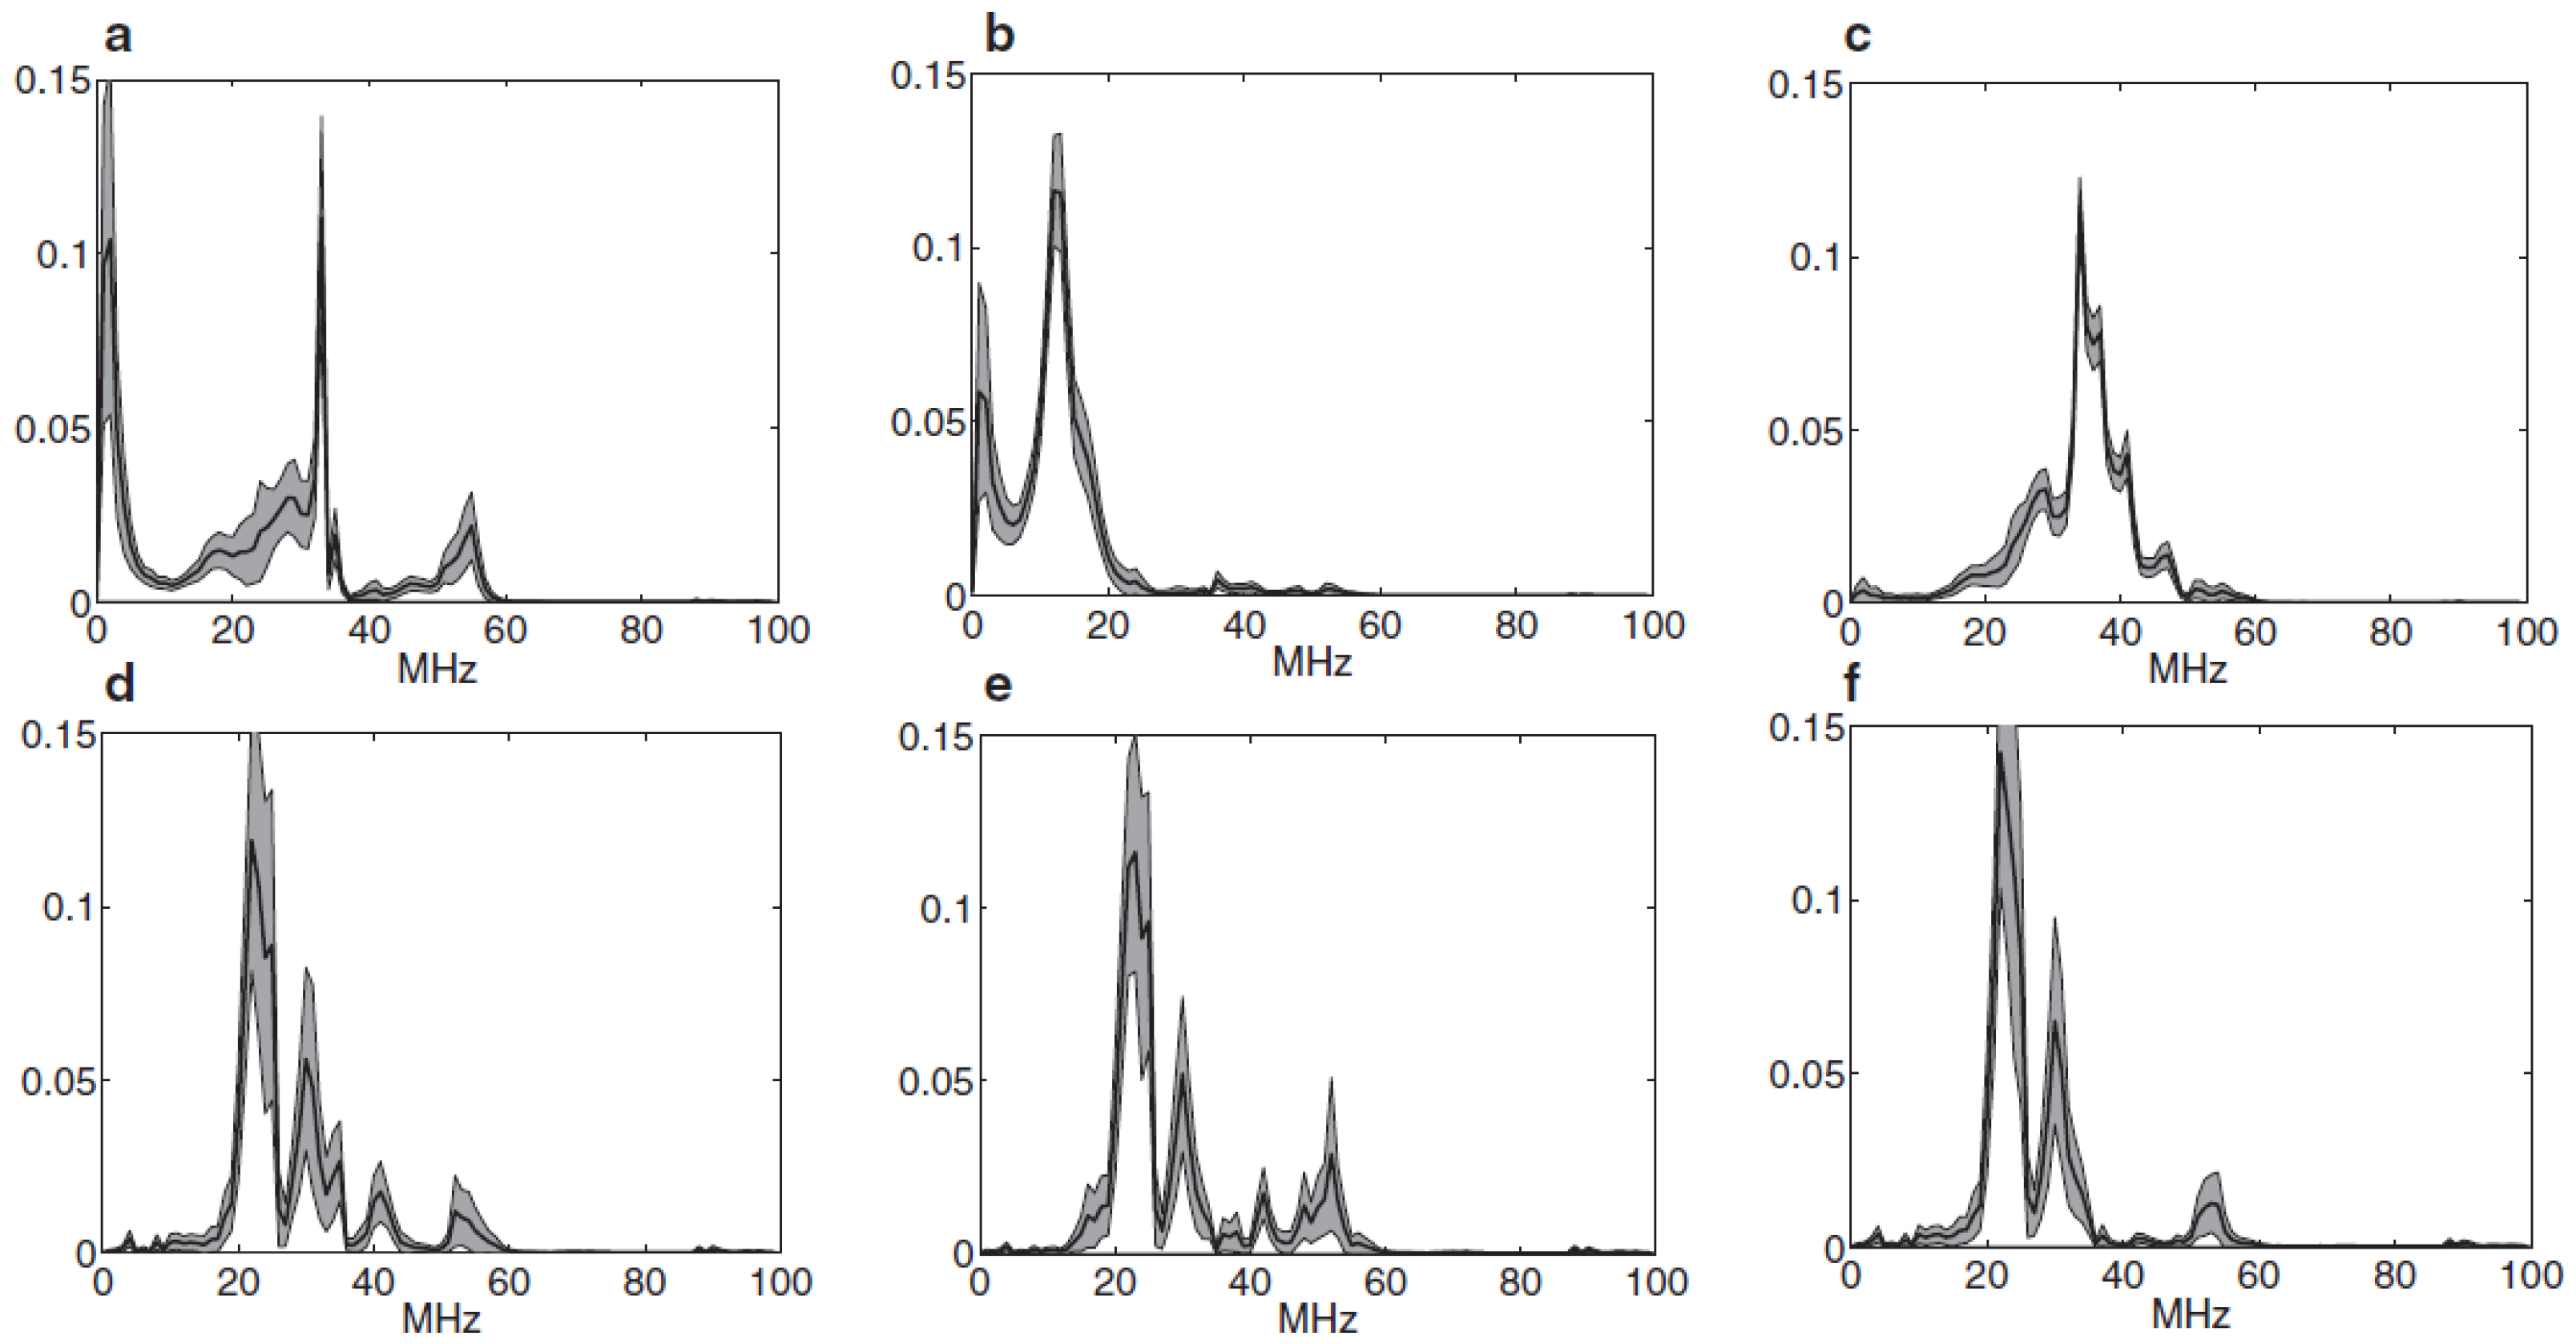
⁶ samples are acquired and split in time windows of 1 μs (sets of 200 samples) because it is not expected to have more than one PD pulse in this period. The maximum value of the signal and the time referred to the synchronizing signal are stored to plot the PRPD. Finally, the power spectral density of each signal is calculated and normalized to unit area before the analysis with the OCSVM (Figure 4).
More details regarding the acquisition system can be found in [11,20,33]. Five different test objects were used to generate the training and test sets for the OCSVM:
  • Point-plane experimental specimen: A 0.5 mm thick needle was placed above a metallic ground plane. The distance between the needle and the plane is set to 1 cm. In this test object, typical corona PD patterns are obtained once the ionization close to the needle tip is reached at 3 kV.
  • Insulating sheets immersed in mineral oil: This setup is designed to generate internal discharges and consists of three insulating sheets of NOMEX paper (polyimide 0.35 mm thick film). The central paper was pierced with a needle (1.05 mm in diameter) to create an air void inside this dielectric. The dielectric stack was inserted in a polyethylene envelope to create vacuum inside and the entire system was immersed in mineral oil to avoid surface discharges at low voltages [11]. In this test object a stable internal discharges activity was found at 4.7 kV.
  • A joint test object: with the first two to create corona and internal discharges simultaneously at 4.7 kV. Notice, that placing two test objects in parallel gives a total capacitance which is the sum of the single capacitances; moreover, in this setup, three capacitive branches will be present for each high-frequency pulse, compared to the two of the previous experimental setups (measurement path and capacitance of the test object). All this makes the shape of the pulses different from the signals obtained with the test objects alone.
  • Contaminated ceramic bushing: A 15 kV ceramic bushing has been contaminated by spraying a solution of salt in water to create ionization paths along the surface. Clear surface partial discharges were detected above 14 kV.
  • A 12/20kV XLPE insulated power cable 12 m long: The cable was cut to have access to the main conductor and its insulation and shield was damaged to obtain a stable activity of partial discharges at its rated voltage.
The first four test objects are controlled insulation systems created specifically to obtain a certain type of PD and the corresponding background noise (or signals recorded in the default mode when the PD has not appeared yet). However, the fifth test object represents a faulted cable in which we expect to have partial discharges that will be classified accordingly to the results from the previous training sets.
Three measurement sets were done for every test object. One set at low applied voltages and low trigger levels to record noise only. Another set, increasing the voltage to a value above the partial discharge inception voltage, where PD activity was found to be stable; the trigger is set high so the data only contains partial discharges. Finally, another set at high-voltage and low trigger as in the first set to have PD and background noise simultaneously (an example of their PRPD is presented in Figure 5, where it is shown the difficulty of making diagnosis from this classical representation).
After all the process there are three files: the first contains background noise pulses only, the second, partial discharges only, and the third, PD blended with noise 4). The first two are used to train the classifiers and the last one is used to test the separation capability of the system. The experimental setup is carefully maintained invariant so its equivalent capacitance does not change during all the process and all signals are acquired in the same conditions so we can do a reliable parametrization. Table 1 summarizes the sizes of the datasets recorded from these experiments.
As explained before, plotting the pulses in a PRPD graph helps to know by simple visual inspection if the decisions made by the OCSVM are correct.
With respect to the training of the OCSVMs, we have followed a very standard approach. The OCSVMs are endowed with the KL-based kernel of Section 2.2, whose width parameter σ is selected in a logarithmic scale between 0.5 and 50. The regularization parameter v is also selected in a logarithmic scale between 0.005 and 0.2 (anyway we checked that the optimum never occurred in the extremes of the ranges). The tuning of these two parameters is carried out by tenfold cross validation in a grid search. The bias term of each OCSVM, ρ , was fixed so that all the samples of the target class in the training set scored a positive number.

3.2. Results

The first set of results illustrates how in fact noise models can be shared across different PD scenarios. Table 2 displays the efficiency when detecting default mode when the OCSVM is trained using background noise signals (without PD) recorded in a particular experiment of PD (each row corresponds to a training set scenario) and tested using default mode signals recorded in a different PD experiment (diagonal terms are trivial since the training and testing sets are indeed the same set).
Nine out of the twelve non-diagonal accuracies in Table 2 are above 90%, one is above 86% and only the cases involving test background noise signals of the experiment with simultaneous PD present really poor detection rates. 
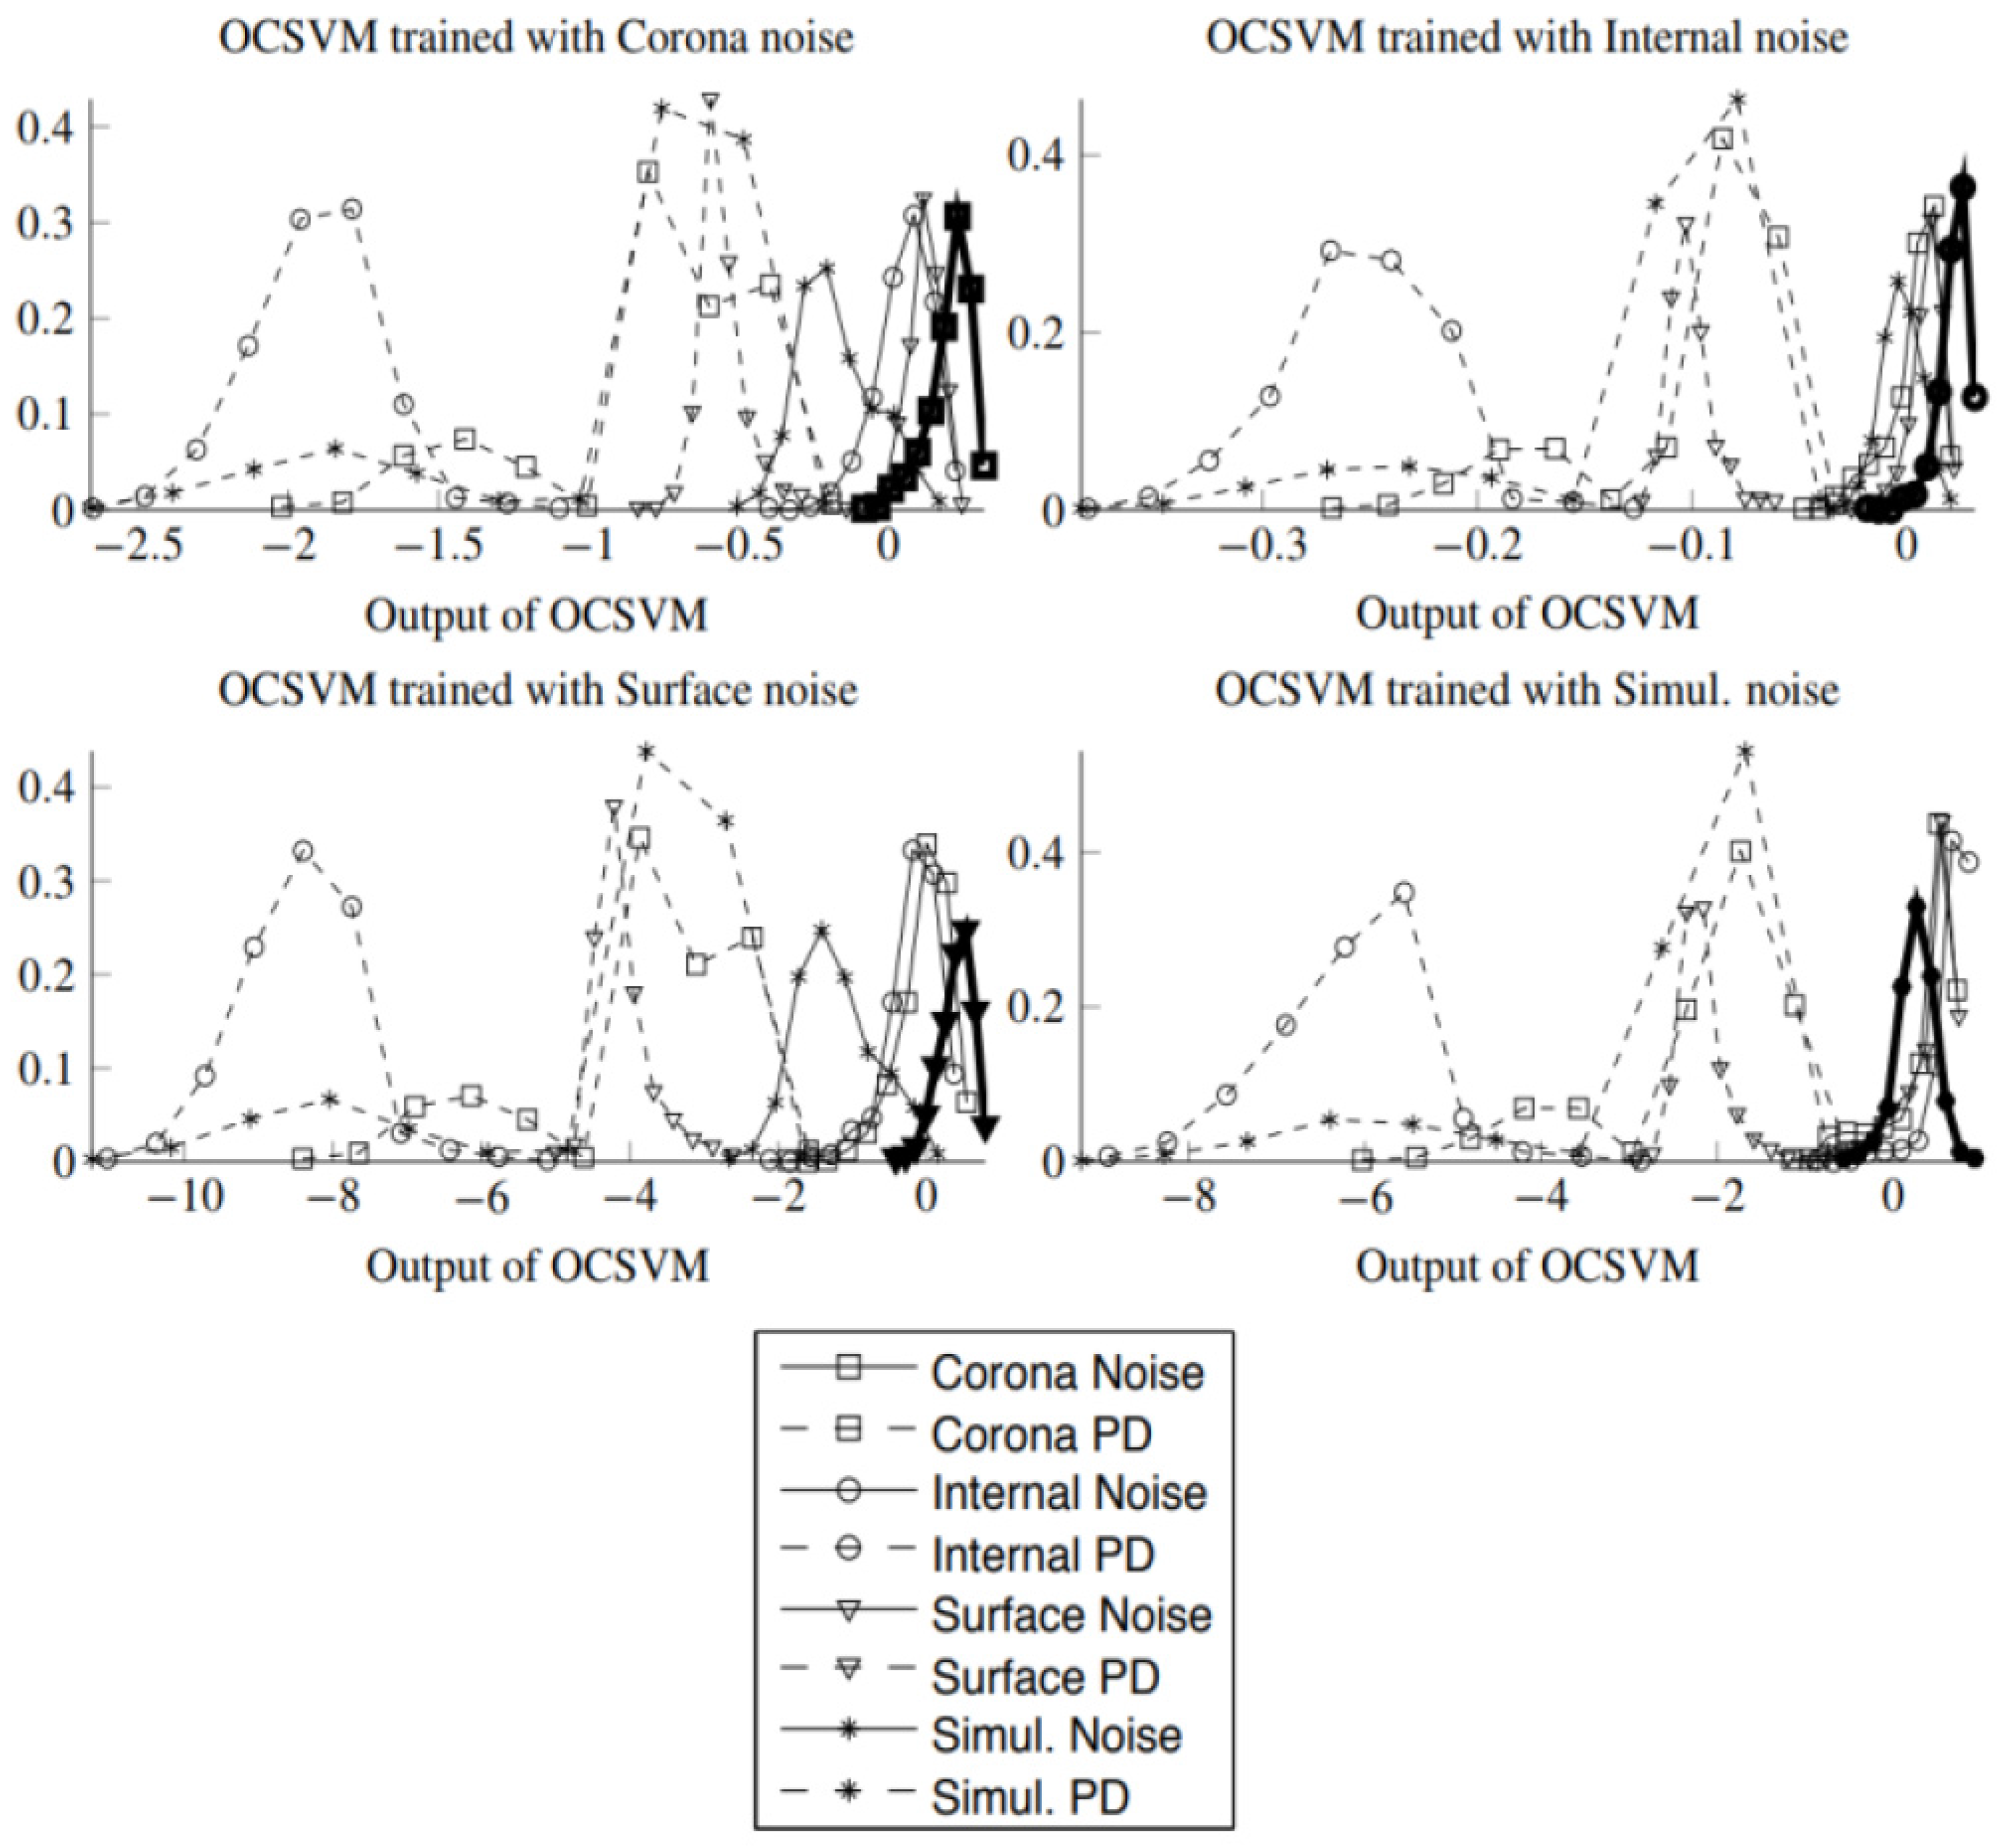
Figure 6 shows the normalized histograms (the normalized histogram is an approximation to the probability density of the output of the OCSVM. The range of values of the output of the OCSVM is divided into equally sized bins and the histogram value in each bin is the count of the number of test samples for which the output of the OCVSM falls in that bin. The values of the bins are then divided by the number of test samples so that they add up to one and thus this normalized histogram can be used as proxy for the probability density) of the scores of the OCSVM trained with the different background noise records and tested using files coming from different experiments that contained either pure background noise (solid lines) or pulses of a single type of PD (dashed lines). The OCSVM outputs for background noise appear highly overlapped independently of the particular noise used to train the model and the outputs for PD pulses appear well separated from the outputs corresponding to noise. In two cases (using the training data from corona and surface setups) the background noise from simultaneous PD (Simul.Noise in the plots) appears slightly shifted towards the negative part of the histogram, although clearly separated from the PD pulses. Notice that being noise, the plots should have entirely been in the positive range of the histogram. Nevertheless, these lines are clearly separated from the dashed plots corresponding to PD which supports the suitability of the OCSVM as core algorithm for a detector that is capable of being adapted to another PD scenario.
In order to justify the election of the default mode model for domain adaptation we have repeated the modeling in Table 2, but now using only PD pulses without noise to train the OCSVM. The aim in this new set of results is to say if a certain pulse is a PD or not. Table 3 presents these results. The structure of Table 3 is very close to an identity matrix (excepting the tests results for corona and internal PD when training is made with the simultaneous source), pointing out the fact that each type of PD is consequence of a different physical process and therefore the shape of the PD pulses is different for each experiment, which significantly reduces the usability of a one class modeling when the target class is a particular type of PD source. A good illustration of this fact is the results of internal and corona when the OCSVM is trained with the Simul. training set: the OCSVM treats both types of PD as members of a same class. These results from Table 3 are in agreement with previous works [11], where it is proven that, for the same experimental setup, each PD source has a characteristic frequency response; Figure 4 shows this situation too.
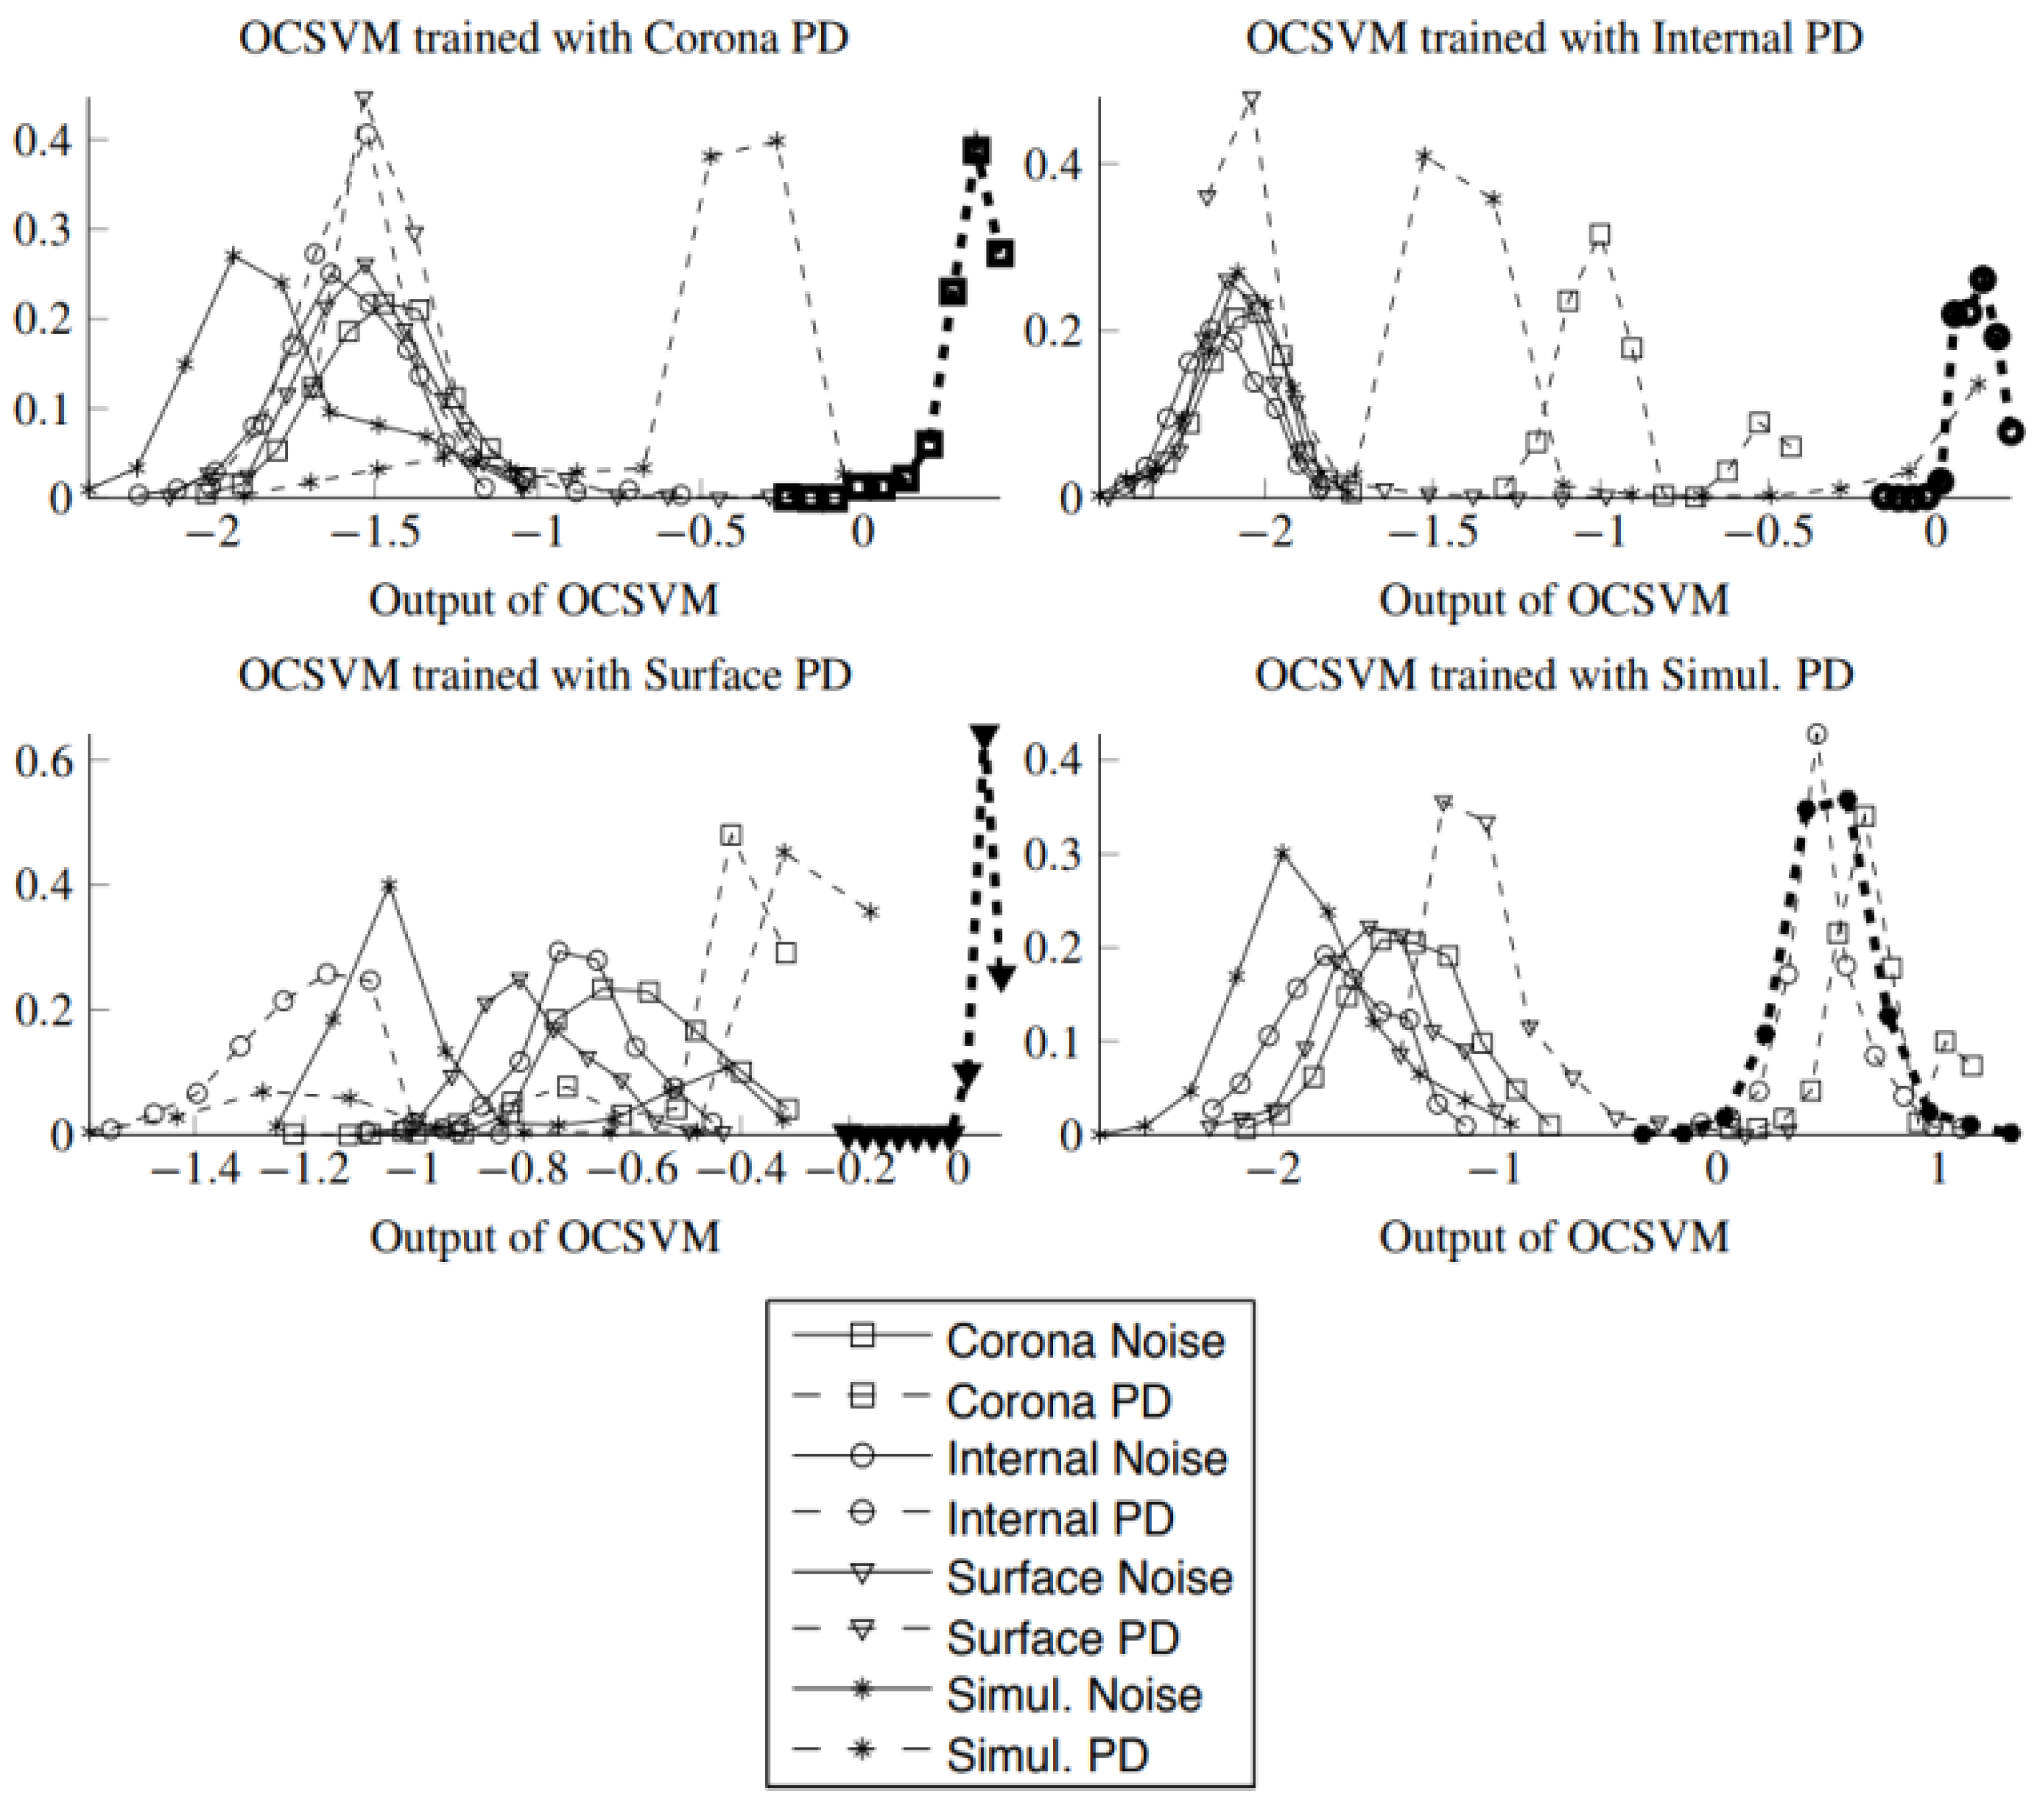
Figure 7 displays the histograms of the OCSVM trained with the different types of PD. In a few of these cases, the histograms of the outputs corresponding to PD test pulses (dashed lines) show that the f(x) score could potentially be used to discriminate PD, but in general the OCSVM based on learning the distributions of PD pulses are more difficult to adapt to other scenario than the models based on learning the background noise distribution. Moreover, the noise histograms (solid lines) appear again highly overlapped in the four cases, illustrating the fact that the noise is more homogeneous across experiments and that a model trained with default mode pulses from a given scenario could be easily adapted and achieve a good performance in a different scenario.
The next set of results, displayed in Table 4, illustrate the detection capabilities of the OCSVM trained with a single type of background noise and tested with a set that includes both PD and noise pulses recorded simultaneously in different PD generation scenarios. The label assigned by the OCSVM to each pulse is compared with the label that would assign a binary Support Vector Machine (SVM) trained with a set of pure PD and pure background noise pulses recorded in the same scenario as the test set. The SVMs are endowed with the same kernel as the OCSVM. According to our past experience [20] this binary classifier is able to almost perfectly discriminate between PD and noise, so its label assignments can be perfectly considered as ground truth. Figure 8 shows the identification of pulses made with binary support vector machines.
Table 4 displays indeed two sets of results. For each training set, we have used two strategies to fix ρ in Equation (1):
  • Without domain adaptation (top row for each training set, labeled no d.a.): The value of ρ is determined after the optimization of (2) subject to (3) and (4). This way all the noise samples in the training set produce a positive value in the output of OCSVM.
  • With domain adaptation (bottom row for each training set, labeled d.a.): The value of ρ obtained from the optimization of (2) subject to (3) and (4) is refined using a second training set composed of noise pulses recorded from the same scenario in which the testing set was recorded. The value of ρ is modified so that all the instances in this second training set produce a positive output in the OCSVM.
The domain adaptation is the simplest re-calibration that one could introduce in a realistic scenario in which the initial training set is not rich enough to represent the target class. The OCSVM score relies on the kernel functions centered on the support vectors and on the bias term ρ . This re-calibration involves the use a second training set of background noise pulses to fine tune the value of ρ . Notice that, like the initial set, this training set is not labelled at all, one just need to ensure that it was recorded under PD-free conditions, and this requirement is easy to fulfill in an industrial application. This way, the learning still falls into the one class paradigm as the recalibration does not demand a labelled data set.
Table 4 shows that the OCSVM with the first strategy makes good predictions in almost all the experimental setups, excepting some cases with simultaneous discharges (the same with lower identification capabilities shown in Table 2), while the strategy with domain adaptation achieves a very good classification in all scenarios.
The final set of results involves the analysis of signals recorded in a very different experiment, closer to a real-world scenario. This is the case of a portion of an XLPE cable connected to high-voltage and inducing a source of PD by deteriorating the insulation in one site. The equivalent capacitance of this setup is remarkably higher than those of the other test objects because the length is 12 m so high-frequencies of the PD pulses are strongly attenuated.
Table 5 shows the agreement between the labels assigned by the OCSVM models learned in the previous experiments (using the noise signals termed as Corona, Internal, Surface and Simultaneous) and the labels assigned by an OCSVM trained using background noise pulses recorded at the cable experiment. As before, the top row in Table 5 displays results without domain adaptation (the value of ρ is fixed using the same noise that was used to train the OCSVM), whilst the bottom row displays results with domain adaptation. This domain adaptation consists in using the same model but refining ρ for each OCSVM with the set of noise pulses recorded in the cable experiment.
The results in Table 5 show again that the domain adaptation involving the tuning of ρ works really well independently of the default mode signals used to construct the OCSVM model. In this particular case, as the change in equivalent capacitance of the test object has been more pronounced than in the other cases, the tuning of the parameter ρ 
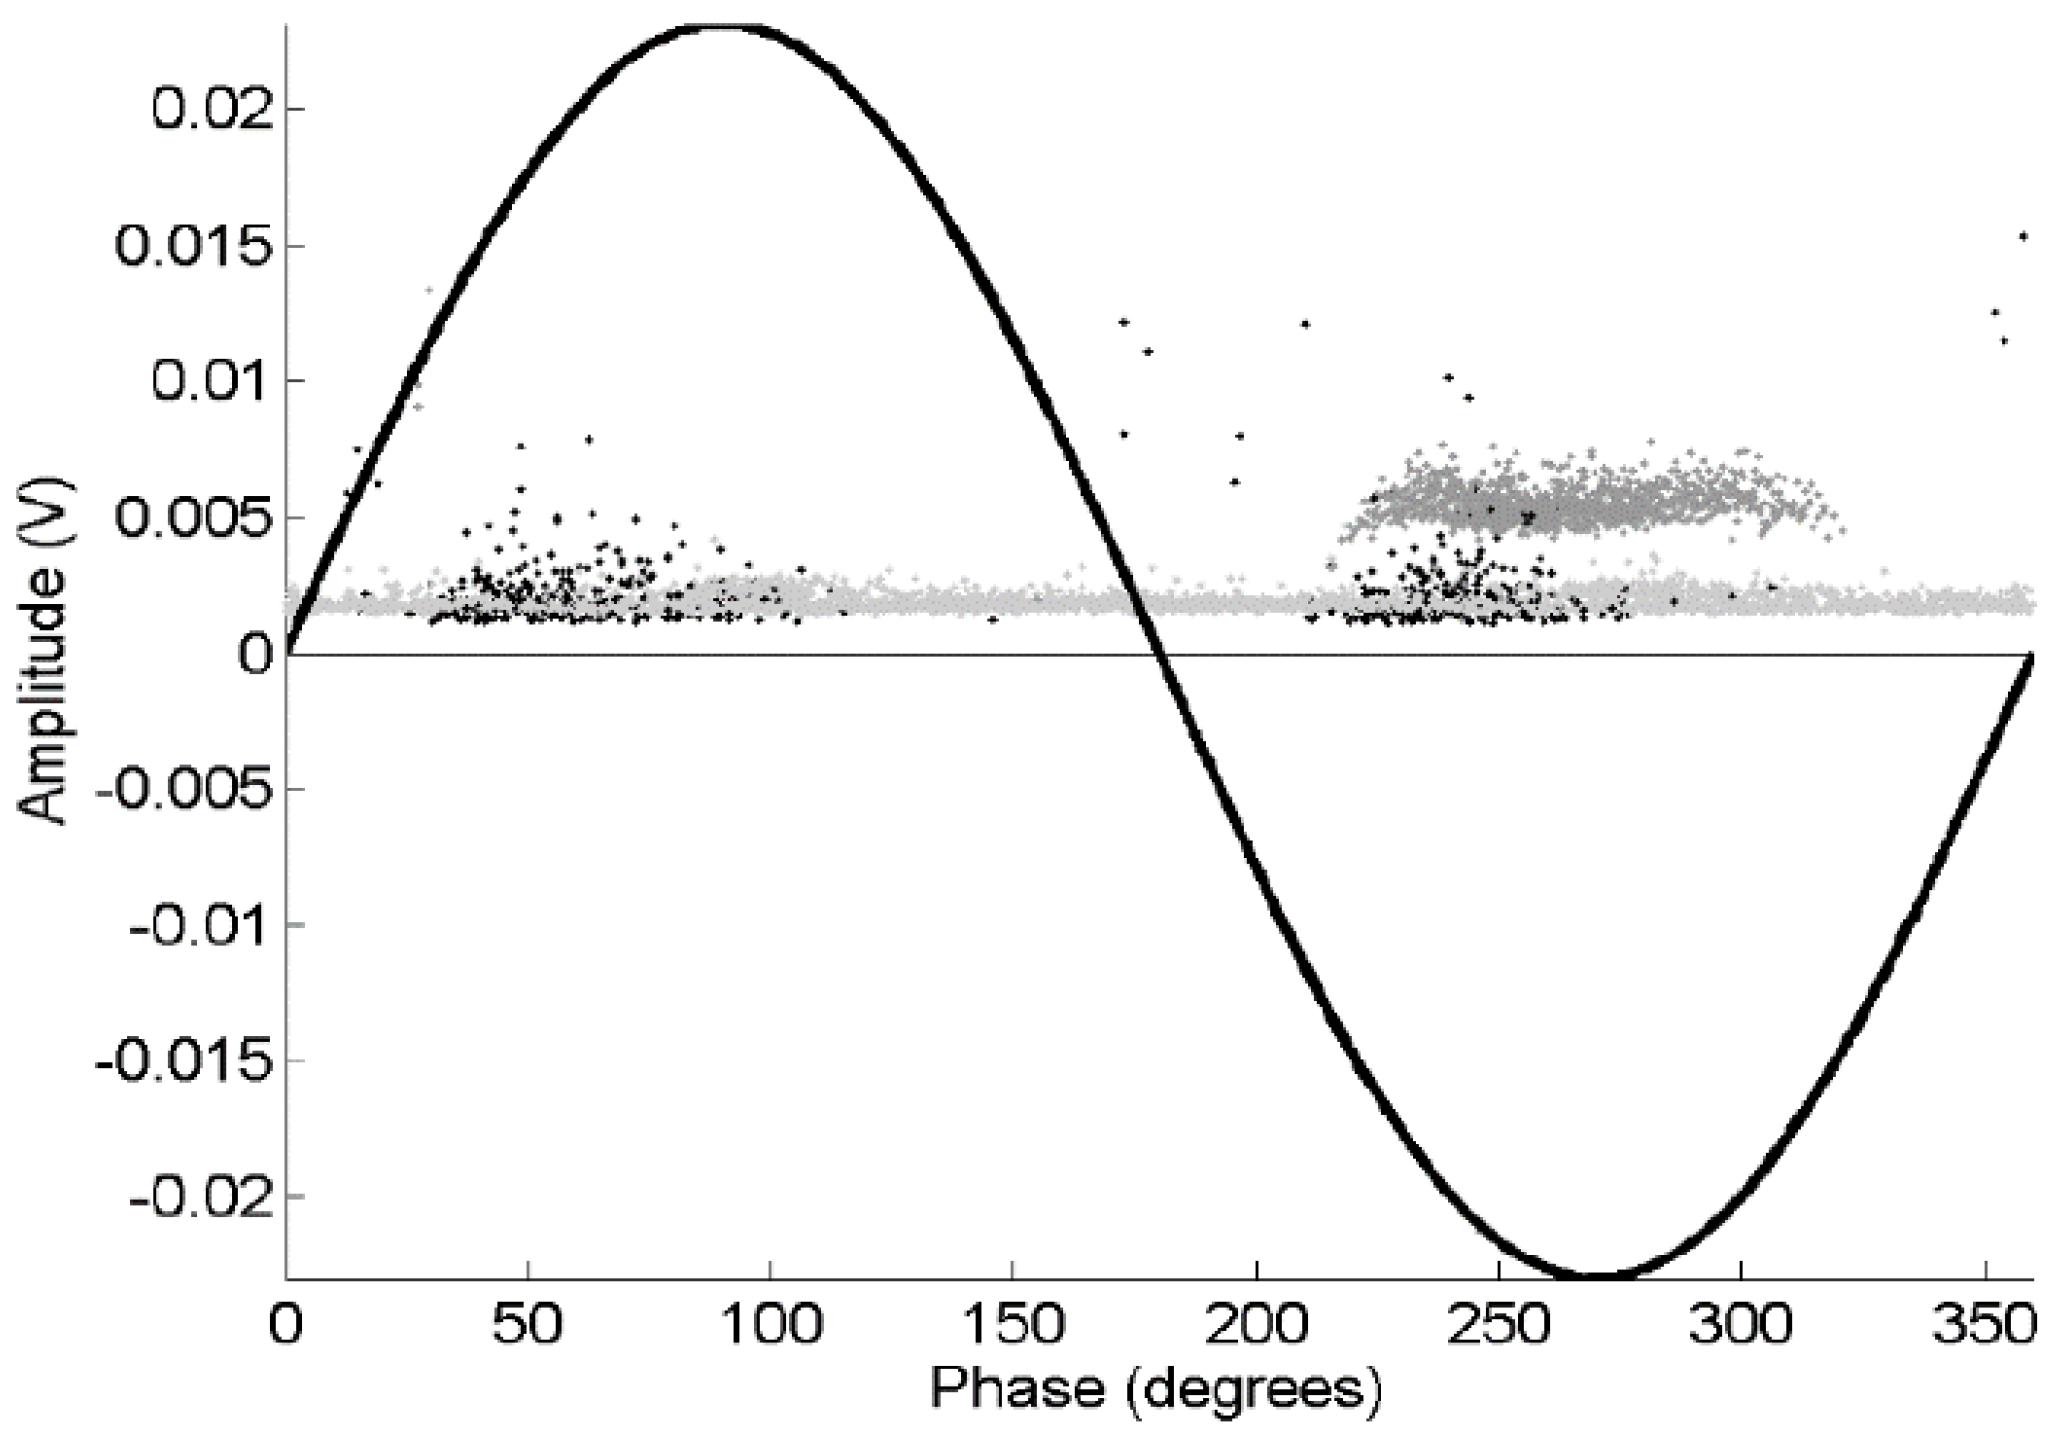
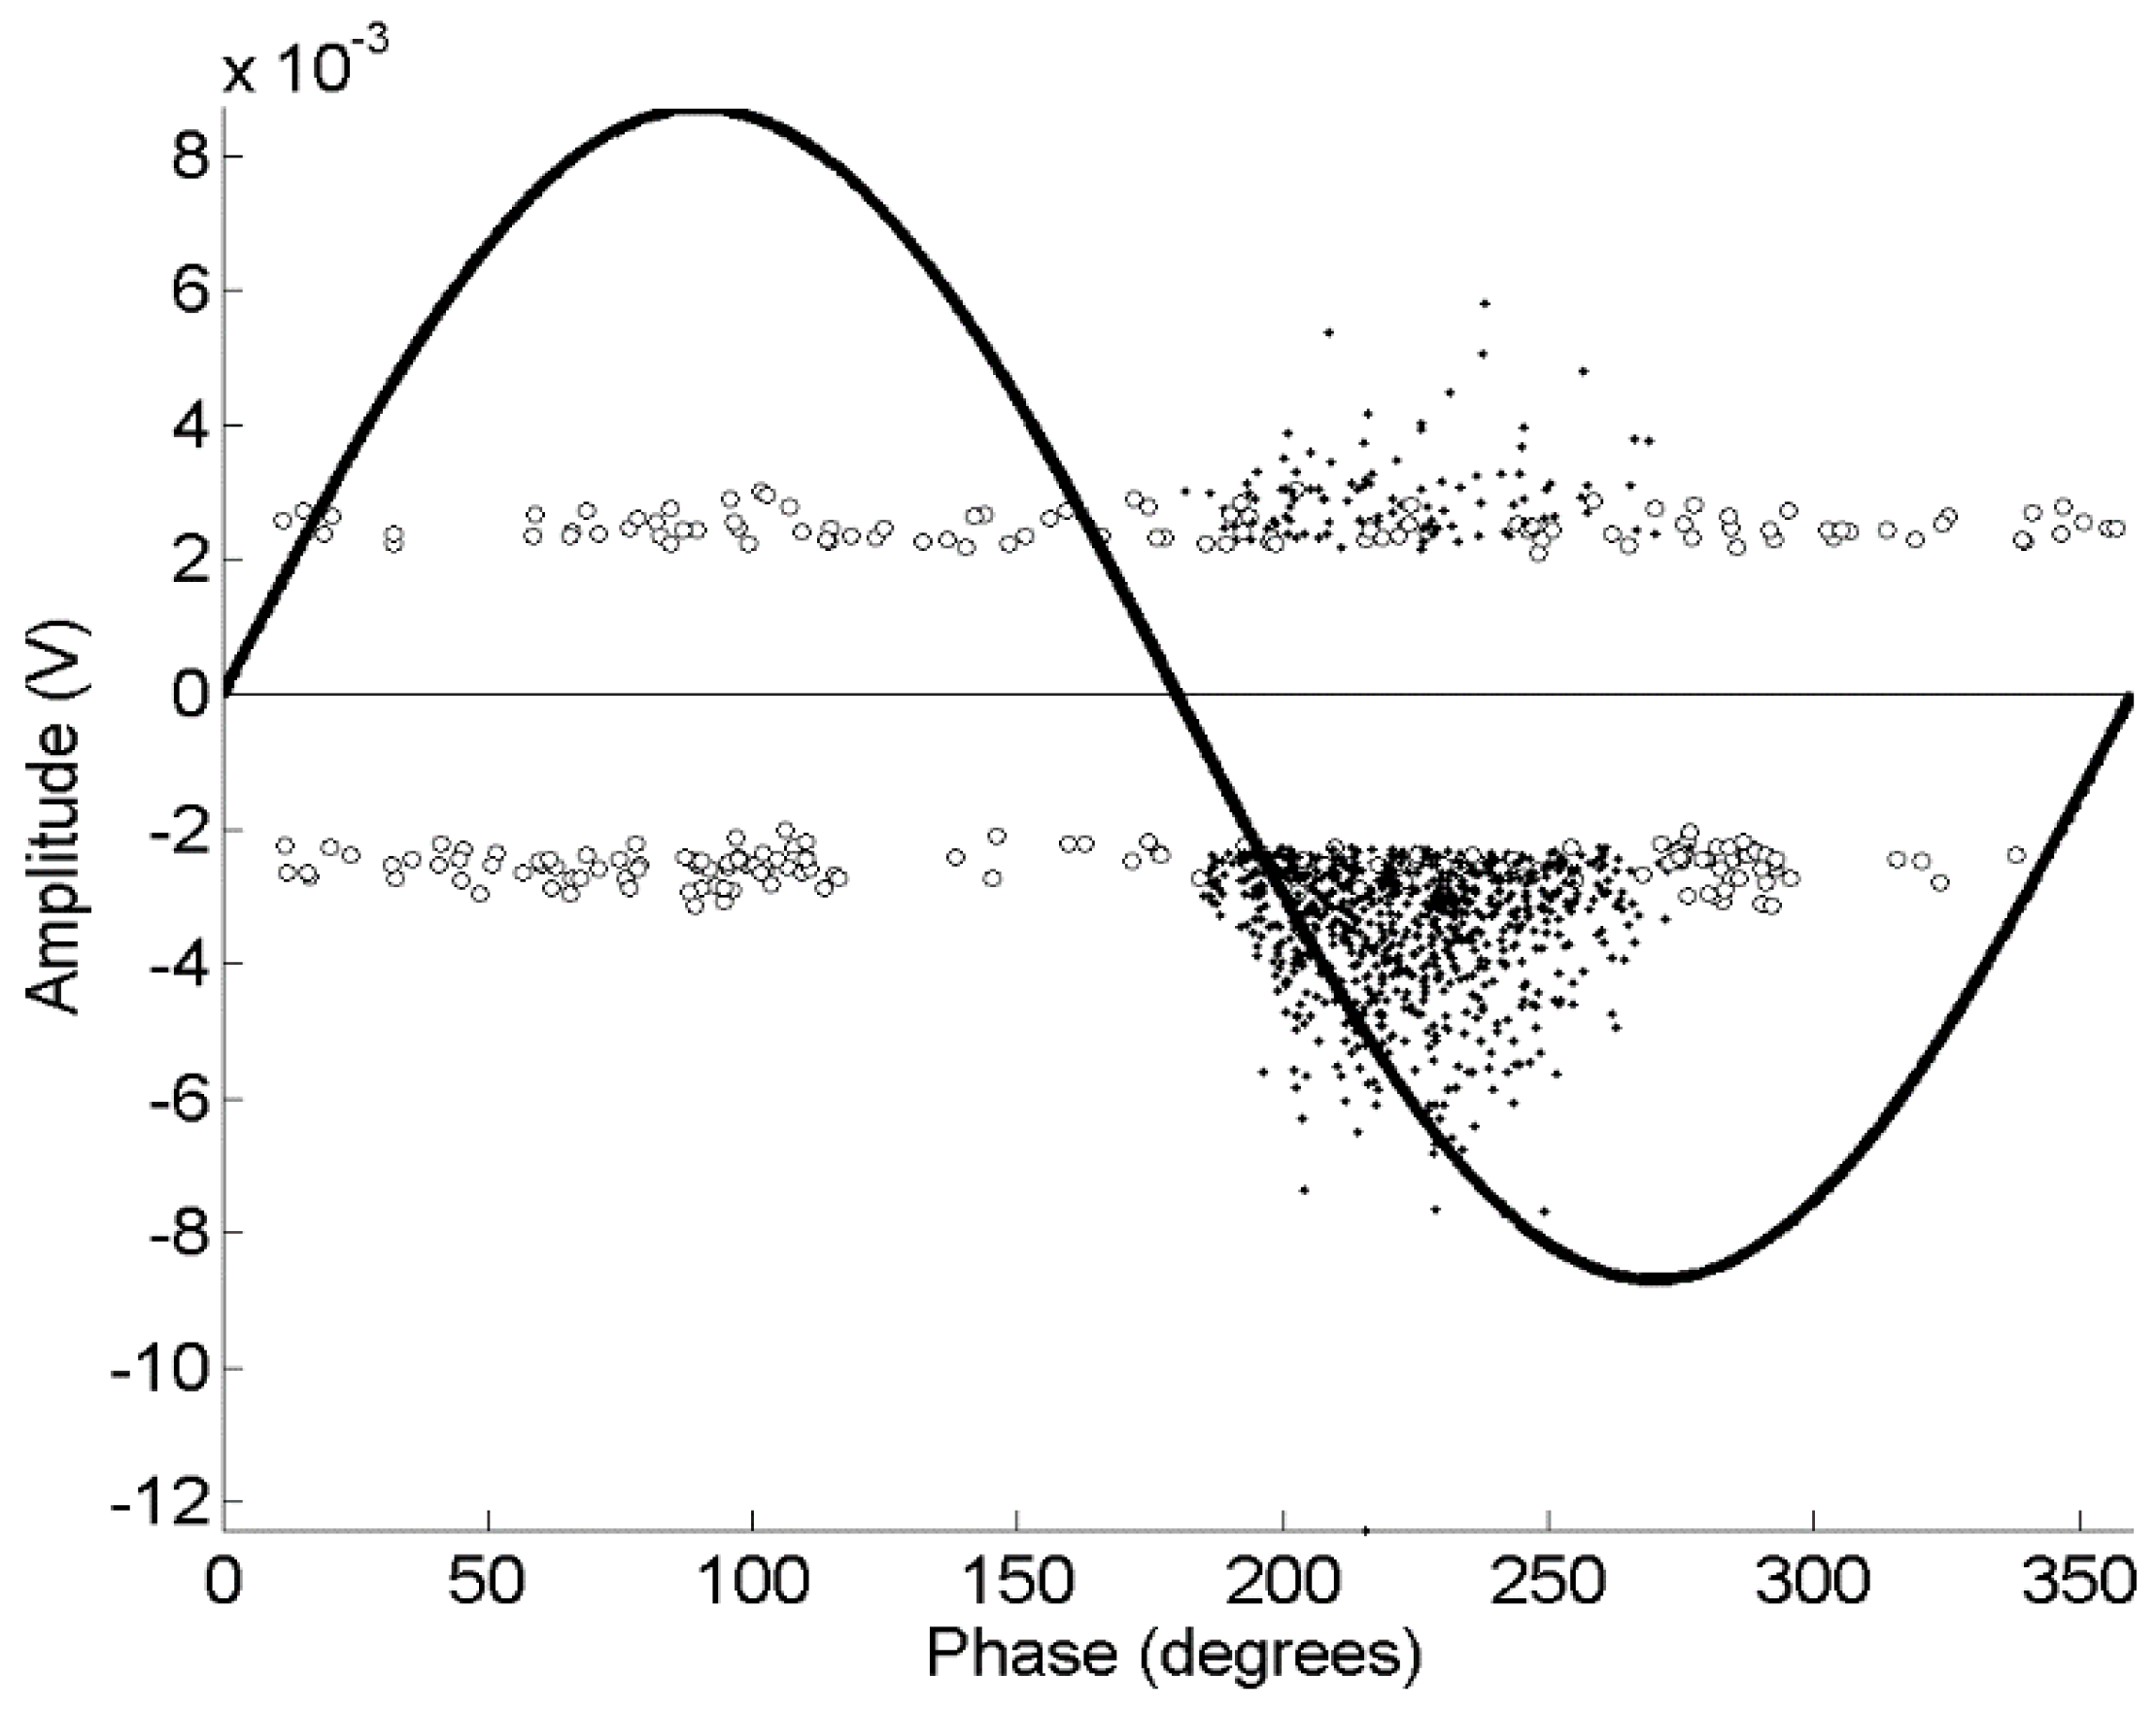
is more convenient than in the previous experiments to obtain a convenient identification. Moreover, the PRPD in Figure 9 shows that the events classified as noise (with circles) do not have correlation with the phase of the 50 Hz sinusoid whereas black points, that are not-noise pulses, have a clear correlation appearing only on the negative semi-cycle, which means that they are PD. This means that the discrimination has been done correctly. It is interesting to note that some PD (not-noise) pulses have magnitudes similar to noise pulses, which means that this technique can be quite useful to detect PD signals in testing setups with low signal to noise ratio. This is very important, since these low-magnitude PDs (events whose probability of occurrence is higher than high magnitude PDs) could have been discarded if the trigger level had been raised to reject noise, leading to possible mistakes in the assessment of the status of the power cable.
Finally, it is worth discussing the capabilities of the OCSVM to deliver data models that are not difficult to interpret by human operators. The lack of interpretability is one of the main handicaps that face the introduction of machine learning techniques in industrial applications. In the problem under study, the OCSVM models are a linear combination of kernel functions centered on some of the training instances (the SVs). It turns out that the obtained models are very sparse in terms of the number of training examples that end up taking part in the OCSVM. Table 6 displays the size of the models in terms of data examples. In most of the cases the size of the detector is quite small. Therefore, the analysis of the classification of a test signal xt in terms of the linear combination in f (xt) would first bring out which SVs are more similar to xt under the metric defined by the kernel. Then the human operator could approximate the outcome of the OCSVM as a combination of the expected output for each of these more similar SVs. Moreover, since the kernel captures similarities in the shapes of the PSDs, those frequency bands in which the shapes of the test signal and of the SVs PSDs are closer would become the key to the interpretation of the classifications.

4. Conclusions

This paper has presented a method to detect the presence of partial discharges in an electrical asset using an OCSVM that learns a model for the background noise. The PD-noise separation using default mode signals as target class is more reliable than the one based on learning the distribution of the PD pulses. This is due to the fact that background noise is more homogeneous across different PD generation scenarios.
The characterization of the background noise in a given PD scenario by means of OCSVM is possible, arriving at classification accuracies in the detection of the PD comparable to those obtained with a binary SVM. Moreover, the OCSVM learned with background noise registered in a given PD generation scenario can be successfully adapted to achieve performances close to those of a binary SVM by just adjusting the value of the bias parameter ρ with a small set of default mode pulses registered in the new PD scenario.
The use of OCSVM in discriminating noise from PD could be applied in the condition-based monitoring of electrical assets. The existence of signals that were classified as not-noise (even with amplitudes below noise) would activate a flag so the piece of equipment could be monitored more closely and, eventually, put out of service to check the insulation status. This would dramatically increase the reliability of the system and reduce costs of maintenance. Since signal recognition is made through its power spectral density, it is clear that changes in the measurement setups would require new training data for PD detection. However, once the instrumentation system is completely installed, noise characterization in many real high voltage facilities could be easily characterized before connection to the power grid. Afterwards, pulses not classified as background noise could be analyzed in the corresponding PRPD patterns to study if any aging mechanisms may be active in the electrical machine or power cable.
Ongoing research includes the development of new kernels that focus on specific parts of the spectrum. The kernel used in this work treats equally all the frequencies and our intuition is that there are frequencies more relevant for the characterization of the PD and the noise. The interest of these kernels lies in the facilitation of the interpretation of the results in industrial applications by pointing out these most discriminative parts of the spectrum, and in a reduction of the computational complexity of the system since it does not need to deal with the complete spectrum.
Another line studies the characterization of the different classes of PD building on this work. Notice that an OCSVM trained with background noise as target class is not able to determine which type of PD is occurring in the monitored electrical asset. However, the good results achieved in the domain adaptation (refining ρ ) encourage to extend the domain adaptation setting to situations in which a large set of non-labeled noise signals acquired in the monitored asset could be combined with a reduced set of labeled PD signals recorded outside the asset to come up with a system able to not only detect the presence of PD, but to identify its type.

Acknowledgments

Tests were conducted at the High Voltage Research and Testing Laboratory (LINEALT) of Universidad Carlos III de Madrid. This work has been funded by the Spanish Government through project SI-DP (DPI2015-66478-C2-1 MINECO/FEDER, UE) and the Chilean Research Council (CONICYT), under the project Fondecyt 11160115.

Author Contributions

Guillermo Robles and Juan Manuel Martínez-tarifa Conceived and designed the experiments; Jorge Alfredo Ardila-Rey performed the experiments; Emilio Parrado-Hernández analyzed the data; All the authors contributed in the interpretation of the results and the wrote the paper.

Conflicts of Interest

The authors declare no conflict of interest.

References

  1. NIST Framework and roadmap for smart grid interoperability standard. Available online: https://www.nist.gov/publications/nist-framework-and-roadmap-smart-grid-interoperability-standards-release-10 (accessed on 22 January 2018).
  2. Yuri, M.; Luis, H.; Oscar, D. State of the Art and Trends in the Monitoring, Detection and Diagnosis of Failures in Electric Induction Motors. Energies 2017, 10, 1056. [Google Scholar]
  3. Ren, M.; Dong, M.; Liu, J. Statistical Analysis of Partial Discharges in SF6 Gas via Optical Detection in Various Spectral Ranges. Energies 2016, 9, 152. [Google Scholar] [CrossRef]
  4. Fornasari, L.; Cavallini, A.; Montanari, G.C. Advanced condition monitoring of insulation systems: A building block for smarter grids. In Proceedings of the 2012 International Conference Condition Monitoring and Diagnosis (CMD), Bali, Indonesia, 23–27 September 2012; pp. 533–537. [Google Scholar]
  5. Gill, P. Electrical Power Equipment Maintenance and Testing; CRC Press: Boca Raton, FL, USA, 1998. [Google Scholar]
  6. James, R.E.; Su, Q. Condition assessment of High Voltage Insulation in Power System Equipment; IET Press: Herts, UK, 2008. [Google Scholar]
  7. Montanari, G.C.; Cavallini, A. Partial discharge diagnostics: from apparatus monitoring to smart grid assessment. IEEE Electr. Insul. Mag. 2013, 29, 8–17. [Google Scholar] [CrossRef]
  8. Stone, G.C.; Sedding, H.G.; Chan, C. Experience with Online Partial-Discharge Measurement in High-Voltage Inverter-Fed Motors. In Proceedings of the IEEE Petroleum and Chemical Industry Technical Conference (PCIC), Philadelphia, PA, USA, 19–22 September 2016; pp. 866–872. [Google Scholar]
  9. Okabe, S.; Ueta, G.; Wada, H.; Okubo, H. Partial discharge-induced degradation characteristics of insulating structure constituting oil-immersed power transformers. IEEE Trans. Dielectr. Electr. Insul. 2010, 17, 1649–1656. [Google Scholar] [CrossRef]
  10. International Electrotechnical Commission (IEC). Rotating Electrical Machines- Part 27-2: On-Line Partial Discharge Measurements on the Stator Winding Insulation of Rotating Electrical Machines; Technical Specification IEC/TS 60034-27-2: Geneva, Switzerland, 22 March 2012. [Google Scholar]
  11. Ardila-Rey, J.A.; Martínez-Tarifa, J.M.; Robles, G.; Rojas-Moreno, M.V. Partial discharge and noise separation by means of spectral-power clustering techniques. IEEE Trans. Dielectr. Electr. Insul. 2013, 20, 1436–1443. [Google Scholar] [CrossRef]
  12. Su, M.-S.; Chia, C.-C.; Chen, C.-Y.; Chen, J.-F. Classification of partial discharge events in gilbs using probabilistic neural networks and the fuzzy c-means clustering approach. Int. J. Electr. Power Energy Syst. 2014, 61, 173–179. [Google Scholar] [CrossRef]
  13. Rodrigo Mor, A.; Castro Heredia, L.C.; Harmsen, D.A.; Muñoz, F.A. A new design of a test platform for testing multiple partial discharge sources. Int. J. Electr. Power Energy Syst. 2018, 94, 374–384. [Google Scholar] [CrossRef]
  14. Montanari, G.; Cavallini, A. Partial discharge diagnostics: From apparatus monitoring to smart grid assessment. IEEE Electr. Insul. Mag. 2013, 29, 8–17. [Google Scholar] [CrossRef]
  15. Hao, L.; Lewin, P.L.; Hunter, J.A.; Swaffield, D.J.; Contin, A.; Walton, C.; Michel, M. Discrimination of multiple PD sources using wavelet decomposition and principal component analysis. IEEE Trans. Dielectr. Electr. Insul. 2011, 18, 1702–1711. [Google Scholar] [CrossRef]
  16. Boser, B.E.; Guyon, I.M.; Vapnik, V.N. A Training Algorithm for Optimal Margin Classifiers. In Proceedings of the COLT’92 Fifth Annual Workshop on Computational Learning Theory, Pittsburgh, PA, USA, 27–29 July 1992; pp. 144–152. [Google Scholar]
  17. Cristianini, N.; Shawe-Taylor, J. An Introduction to Support Vector Machines and Other Kernel-based Learning Methods. Cambridge University Press: Cambridge, UK, 2000. [Google Scholar]
  18. Hao, L.; Lewin, P.L.; Swingler, S.G. Improving detection sensitivity for partial discharge monitoring of high voltage equipment. Meas. Sci. Technol. 2008, 19, 15. [Google Scholar] [CrossRef]
  19. Umamaheswari, R.; Sarathi, R. Identification of partial discharges in gas-insulated switchgear by ultra-high-frequency technique and classification by adopting multi-class support vector machines. Electr. Power Compon. Syst. 2011, 39, 1577–1595. [Google Scholar] [CrossRef]
  20. Robles, G.; Parrado-Hernandez, E.; Ardila-Rey, J.; Martínez-Tarifa, J.M. Multiple partial discharge source dis-crimination with multiclass support vector machines. Expert Syst. Appl. 2016, 55, 417–428. [Google Scholar] [CrossRef]
  21. Bennett, K.P.; Demiriz, A. Semi-Supervised Support Vector Machines. In Proceedings of the 1998 Conference on Advances in Neural Information Processing Systems II, Cambridge, MA, USA, 1999; pp. 368–374. [Google Scholar]
  22. Chapelle, O.; Sindhwani, V.; Keerthi, S.S. Optimization techniques for semi-supervised support vector machines. J. Mach. Learn. Res. 2008, 9, 203–233. [Google Scholar]
  23. Scholkopf, B.; Platt, J.C.; Shawe-Taylor, J.C.; Smola, A.J.; Williamson, R.C. Estimating the support of a high-dimensional distribution. Neural Comput. 2001, 13, 1443–1471. [Google Scholar] [CrossRef] [PubMed]
  24. Tax, D.M.J.; Duin, R.P.W. Support vector domain description. Pattern Recognit. Lett. 1999, 20, 1191–1199. [Google Scholar] [CrossRef]
  25. Muñoz-Marí, J.; Bovolo, F.; Gomez-Chova, L.; Bruzzone, L.; Camps-Valls, G. Semisupervised one-class support vector machines for classification of remote sensing data. IEEE Trans. Geosci. Remote Sens. 2010, 48, 3188–3197. [Google Scholar] [CrossRef]
  26. Abou-Dakka, M.; Bulinski, A.; Bamji, S.S. 2011. On-site diagnostic technique for smart maintenance of power cables. In Proceedings of the IEEE Power and Energy Society General Meeting, Detroit, MI, USA, 24–29 July 2011; pp. 1–5. [Google Scholar]
  27. Scholkopf, B.; Smola, A.J. Learning with Kernels; MIT Press: Cambridge, MA, USA, 2002. [Google Scholar]
  28. Shawe-Taylor, J.; Cristianini, N. Kernel Methods for Pattern Analysis; Cambridge University Press: New York, NY, USA, 2004. [Google Scholar]
  29. Chang, C.-C.; Lin, C.-J. LIBSVM: A library for support vector machines. ACM Trans. Intell. Syst. Technol. 2011, 2, 1–27. [Google Scholar] [CrossRef]
  30. García-García, D.; Parrado-Hernandez, E.; Díaz-de María, F. A new distance measure for model-based sequence clustering. IEEE Trans. Pattern Anal. Mach. Intell. 2008, 31, 1325–1331. [Google Scholar] [CrossRef] [PubMed] [Green Version]
  31. Lazaro-Gredilla, M.; Gomez-Verdejo, V.; Parrado-Hernandez, E. Low-cost model selection for SVMs using local features. Eng. Appl. Artif. Intell. 2012, 25, 1203–1211. [Google Scholar] [CrossRef]
  32. Lapp, A.; Kranz, H.G. The use of the CIGRE data format for PD diagnosis applications. IEEE Trans. Dielectr. Electr. Insul. 2000, 7, 102–112. [Google Scholar] [CrossRef]
  33. Ardila-Rey, J.A.; Martínez-Tarifa, J.M.; Robles, G.; Rojas-Moreno, M.; Albarracin, R. A partial discharges acquisition and statistical analysis software. In Proceedings of the 2012 IEEE International Instrumentation and Measurement Technology Conference (I2MTC), Graz, Austria, 13–16 May 2012; pp. 1670–1675. [Google Scholar]
Figure 1. Toy example to illustrate OCSVM. The left plot shows the input data points and the nonlinear learned support of the data. The right plot shows the points mapped in a certain feature space induced by a kernel function and the linear classifier that separates the mapped points from the zero vector in feature space.
Energies 11 00486 g001
Figure 2. Example of a partial discharge plus noise.
Energies 11 00486 g002
Figure 3. Experimental setup for the measurement of PD according IEC 60270.
Energies 11 00486 g003
Figure 4. Average power spectral densities represented by a thick line. The shade corresponds to the area at one standard deviation of the mean. Left to right: (a), (d) measurements for corona, (b), (e) internal and (c), (f) surface discharges setups. The top row plots represent the normalized spectra of the partial discharges and the bottom plots are the normalized default modes in the three setups.
Energies 11 00486 g004
Figure 5. Typical PRPD pattern with several types of partial discharges and noise (taken from [20]).
Energies 11 00486 g005
Figure 6. Normalized histograms of the output of the OCSVM trained with the background noise examples when the test signals are either default mode signals or PD from the different experiments. The histogram corresponding to the class of the training set is plotted with double line width.
Energies 11 00486 g006
Figure 7. Normalized histograms of the output of the OCSVM trained with PD examples when the test signals are either background noise (solid lines) or PD (dashed lines) from the different experiments. The histogram corresponding to the class of the training set is plotted with double line width.
Energies 11 00486 g007
Figure 8. PRPD for predicted pulses with binary SVM (from [20]).
Energies 11 00486 g008
Figure 9. PRPD plot of the events in the cable classified as noise with white circles and not-noise (or partial discharges) with black points.
Energies 11 00486 g009
Table 1. Sizes of the pulses sets used in the experimental work.
Pulse SetExperiment
CoronaInternalSurfaceSimultaneousCable
Noise Pulses5815114401312521
PD Pulses8645543712897-
Test Set2405352179549631211
Table 2. Classification efficiency (%) of the OCSVM detecting background noise of different PD scenarios.
Training NoiseTest Set PD
CoronaInternalSurfaceSimultaneous
Corona10093.9399.7726.83
Internal95.3510099.7797.79
Surface90.3686.5010010.75
Simultaneous96.5699.8099.55100
Table 3. Classification efficiency (%) of the OCSVM detecting different types of PD.
Training NoiseTest Set PD
CoronaInternalSurfaceSimultaneous
Corona10000.2717.29
Internal0100016.78
Surface0010022.37
Simultaneous1001003.23100
Table 4. Agreement (percentage of times in which both classifications coincide) between the OCSVM and a binary SVM trained with data collected in the scenario corresponding to the test set. In order to align the classifications of both methods, we compute as one agreement when either both OCSVM and SVM classify the same test pulse as noise or when the SVM classifies it as PD and the OCSVM as not-noise. Any other situation counts as a disagreement. The top number in each cell indicates the agreement when the bias term of the OCSVM ρ is the output of the optimization of (2) subject to (3) and (4). The bottom number is the agreement when ρ is further refined using an extra training set of noise recorded from the same scenario of the test data but not included in the test set. The test data includes pulses of noise and PD.
Noise to train the OCSVMScenario for the Binary SVM
CoronaInternalSurfaceSimultaneous
Coronano d.a.99.9696.9997.3653.56
d.a.99.9698.8198.4993.29
Internalno d.a.98.9698.7299.3797.58
d.a.98.0998.7299.7599.36
Surfaceno d.a.97.0996.2592.8345.28
d.a.99.2998.8492.8396.01
Simultaneousno d.a.99.2199.0999.7599.15
d.a.92.4798.7699.3799.15
Table 5. Agreement in percentages between OCSVMs trained using default mode signals recorded at the cable experiment (rows) and OCSVMs trained using background noise recorded at other experiments (columns). The top row shows results without domain adaptation, while the bottom row incorporates a domain adaptation consisting in tuning the value of ρ in the OCSVMs learned with noises of other experiments with the noise pulses recorded at the Cable. The test set includes both PD and noise recorded at the cable.
Source of Training Noise, Not Cable
CoronaInternalSurfaceSimultaneous
Without domain adaptation79.2782.3379.2790.17
With domain adaptation99.6799.6799.6799.67
Table 6. Size of the OCSVM detectors in terms of the number of training instances that define f(x). The top row shows the size of the models trained with background noise signals. The bottom row shows the size of the models trained with PD signals.
Training PulsesPD scenario
CoronaInternalSurfaceSimult.Cable
Noise108251335
PD128616-

