Modeling the Insulation Paper Drying Process from Thermogravimetric Analyses


1
Research Chair on the Aging of Power Network Infrastructure (ViAHT), Université du Québec à Chicoutimi, Chicoutimi, QC G7H 2B1, Canada
2
Département Génie Électrique et Électronique, Institut National Polytechnique Houphouët Boigny, BP 1093 Yamoussoukro, Côte d’Ivoire
*
Author to whom correspondence should be addressed.
Energies 2018, 11(3), 517; https://doi.org/10.3390/en11030517
Submission received: 23 January 2018
/
Revised: 20 February 2018
/
Accepted: 22 February 2018
/
Published: 28 February 2018
(This article belongs to the Special Issue Engineering Dielectric Liquid Applications)
Abstract
:It is now well-established that moisture in the oil paper insulation used in power and instrument transformers significantly reduces the transformers’ lifetimes, and can eventually lead to premature failure. This moisture should, therefore, always be removed, not only during production but also after repairs. At the final stage of manufacturing, the drying process should be carried out to remove water and air vacuoles contained in the cellulose-based paper before impregnation. Successful drying helps increase the residual life of transformers, because the presence of moisture and air vacuoles accelerates the aging/degradation process of the oil paper insulation. Proper estimation of residual moisture before impregnation and the determination of the time required for drying play key roles in the time-consuming process of drying. In this paper, the disadvantages of inadequate drying are addressed, followed by a mathematical approach to model the paper drying process. A mathematical model describing the kinetics of drying according to temperature, initial moisture, paper weight, final moisture, and extraction rate is proposed. This model also estimated the amount of moisture removed at the end of the drying process.
1. Introduction
Power transformers are vital for the production, transmission, and distribution of electrical energy [1,2]. They are used to adapt the voltage level to the needs of users. In addition to playing this role, they are also the most expensive equipment found in transformation stations. Indeed, a transformer represents about 60% of the total cost of a power station, so the costs associated with repair or replacement, when a failure occurs, can often reach millions of dollars [3]. The proper operation and lifetime of power transformers are strongly linked to the state of the oil paper insulation used for their windings.
The presence of moisture in the transformer leads to the degradation of the insulation system, and accelerates the aging process of the paper and the oil. This degradation increases the probability of unexpected failures. Indeed, due to the highly hygroscopic nature of cellulose, paper insulation can contain up to 8% moisture at the end of the transformer manufacturing process [4]. Elimination or reduction of moisture has become a challenge for power transformer manufacturers, who want to offer their customers high quality products with acceptable residual moisture. To attain this result, transformer manufacturers dry their paper under a vacuum (<1 mbar) at temperatures between 85 °C to 130 °C, for a period ranging from several days to two or three weeks before impregnation, depending upon the size of the transformers [5,6,7,8]. This operation aims to remove water vapor and air in the paper interstices before the impregnation process [9]. Drying allows for the reduction of the water content in the solid insulation to a level of 0.25% or less.
The drying of the active parts before placing them in the tank is a key step in the construction of transformers because its success affects the useful life of the transformer. Indeed, if the drying process is done properly, transformer failures are greatly reduced. However, improper drying may present the following hazards:
- -
- -
- increased dielectric dissipation factor (tan δ) and decreased breakdown voltage (Ud), which would place the voltage outside acceptable limits [12].
Improper drying can also lead to the degradation and accelerated aging of the insulation system (oil paper). The presence of water leads to an increase in the de-polymerization speed of the paper [12], thus reducing the transformer’s lifetime [4,13,14]. The new transformer paper has the degree of polymerization (DP) of 1200 and end-of-life DP is found to be around 200. The relative de-polymerization speed is computed from the actual measured DP, using the following formula:
To avoid failure during the dielectric testing certification after manufacture, the factors of duration, drying temperature, and estimation of residual moisture are all important, and their control ensures acceptable residual moisture. At present, the length of the drying process is still too often based on manufacturer experiences and empirical procedures.
During the drying process, the water contained in the paper is released by heating the windings. This water is collected and, depending to the extraction rate, it may be decided to stop the drying process. The major drawback of this practice is that the heating may be stopped while there is still a significant amount of water in the paper. The determination of the required drying time plays a very important role in this process. Moreover, successful drying contributes to an increase in the residual life of the cellulose insulation.
Since the drying process—for example, in a vacuum oven–is extremely time-consuming, anything which can reduce the drying time offers a major benefit. For example, a device allowing for the monitoring the drying process of oil paper insulation in real time using a dielectric response (a tan δ measurement over a wide frequency range) has recently been introduced on the market [15].
It is in this context that the cost-effective analytical approach presented in this paper is proposed. A mathematical model describing the kinetics of drying according to temperature, initial moisture, paper weight, final moisture, and extraction rate is proposed. This model will allow the following:
- -
- estimating the moisture removed at the end of drying, depending on initial moisture and drying temperature
- -
- determining the time needed to obtain a better drying result for the paper.
In further research the authors are going to consider in the mathematical model other parameters which plays an important role in drying process in the mathematical model, like the pressure, mass, thickness, and density of cellulose materials.
2. Background
Drying can be considered to be a mass transfer, because it consists of extracting an amount of water contained in the paper [9,16]. For example, a 150 MVA–400 kV transformer containing about 80,000 L of oil and 7 tons of paper can also contain 490 L of water, if the moisture content of the paper is 7% [5,17]. Insulation paper drying will consist, therefore, of extracting the water present in the paper by heating.
The first mathematical model of the drying process was proposed by Lewis in 1920, to be followed by those of Sherwood (1929) and Newman (1931) [18].
The work of these previous studies showed that in the case of moisture removal (drying) in one dimension, the diffusion equation can be written using Fick’s second law (Equation (2)). The validity of this equation implies that the moisture transfer direction is normal for a sheet of paper of thickness equal to 2a.
where M is the moisture content (in %), D is diffusion coefficient (in m2/s), x is the humidity transfer direction, and t is the time (in s).
The solution of the diffusion Equation (2) was given by Sherwood (1929) and followed by Crank (1975) [19,20], for a thin layer of paper and an assumed constant diffusion coefficient, as follows:
where MR is the humidity ratio, Me is the equilibrium moisture content (in %), M0 is the initial moisture (in %), M is the moisture at time t (in %), D is the diffusion coefficient (m2/s), L is the half thickness of the layer (m), t is the drying time (s), and n represents the number of terms considered.
According to Ibrahim et al., the values of Me are relatively low compared to M or M0, so the error involved in the simplification is negligible. Hence, the moisture ratio can be expressed as follows [16]:
In addition, for longer drying periods and moisture less than 0.6%, Equation (3) can be simplified by limiting it to the first term in the series only, without unduly affecting the prediction accuracy. Thus, it can be written that [20]:
or that:
From investigations mainly focused on the determination of the diffusion coefficient of the impregnated and non-impregnated paper and pressboard used in power transformers, Garcia et al. proposed the following equation for determining the diffusion coefficient [21,22]:
where D is the diffusion coefficient (in m2/s), Cm represents the moisture content (in %), l is the insulation thickness (mm), and Tk is the drying temperature (in °C).
Empirical relationships have been established and are used as alternative solutions to Equation (7). These equations also facilitate the study of thin layer drying systems. The most commonly used of these equations are presented in Table 1. In order to select the best-suited empirical equation to the system under study, it is necessary to determine which one provides the best correlation with the experimental curve.
3. Experimental Setup
The drying experiments were performed on 6 mm × 6 mm paper samples of 0.05 mm thickness, with high density (1.02 g/cm3) and thermally upgraded, electrical grade creped 12 HCC, manufactured by Weidmann Electrical Technology Inc. (St. Johnsbury, VT, USA).
Prior to the drying process, the initial moisture content and degree of polymerization of the paper samples were determined. The drying was carried out in an oven. Different drying environments were simulated by varying vacuum pressure and temperature. The impact of the air/oxygen inlet on the quality of the paper was also assessed. The investigations were performed at different temperatures: 115, 130, and 150 °C. At specific time intervals (60, 120, 180, 240, 300, and 360 hours), some paper samples were removed to determine their degree of polymerization.
In order to measure and draw the drying curves of paper samples as a function of temperature, weight, and initial moisture, the thermogravimetric analysis technique (TGA), which consists of measuring the weight change of a sample as a function of time for a given temperature or temperature profile, was used [24]. As the moisture contained in the paper is progressively removed by heating, the weight begins to decrease, until it reaches an equilibrium position, which generally corresponds to the state when almost the entire amount of water in the paper is removed by evaporation. The moisture at each time step is obtained by the following formula [24]:
where W is the initial weight (weight of wet paper), and D represents the paper weight measured at each instant (dried paper weight).
The measurement is stopped, and the value of the moisture recorded, when the variation of moisture according to time is less than or equal to the drift value (% per min) set on the device.
The measurement was carried out with the MF-50 Moisture Analyzer [24].
This thermogravimetric analysis technique (TGA) device allows for drawing distinct curves representing the moisture extracted, according to the variation of the drying temperature, as well as the weight and thickness of the paper to be dried.
The analysis of the resulting curves allows us to establish a mathematical model characterizing the drying process. However, it is important first to select among the empirical equation models in Table 1, the one which is best suited to the system under study.
This equation is to be used to model the drying time of the paper depending on various parameters, such as paper weight, drying temperature, extraction rate, initial moisture, etc.
4. Experimental Procedures
Various tests were conducted in order to determine the impact of different parameters on the drying process.
4.1. Weight Impact on the Drying Process
To assess the impact of the amount of water extracted from the paper samples with different weights were considered for a given temperature. This test makes it possible to predetermine the drying time necessary, depending on the paper’s weight, and therefore transformer size, initial moisture, and drying temperature, allowing us to determine a mathematical model of the drying process.
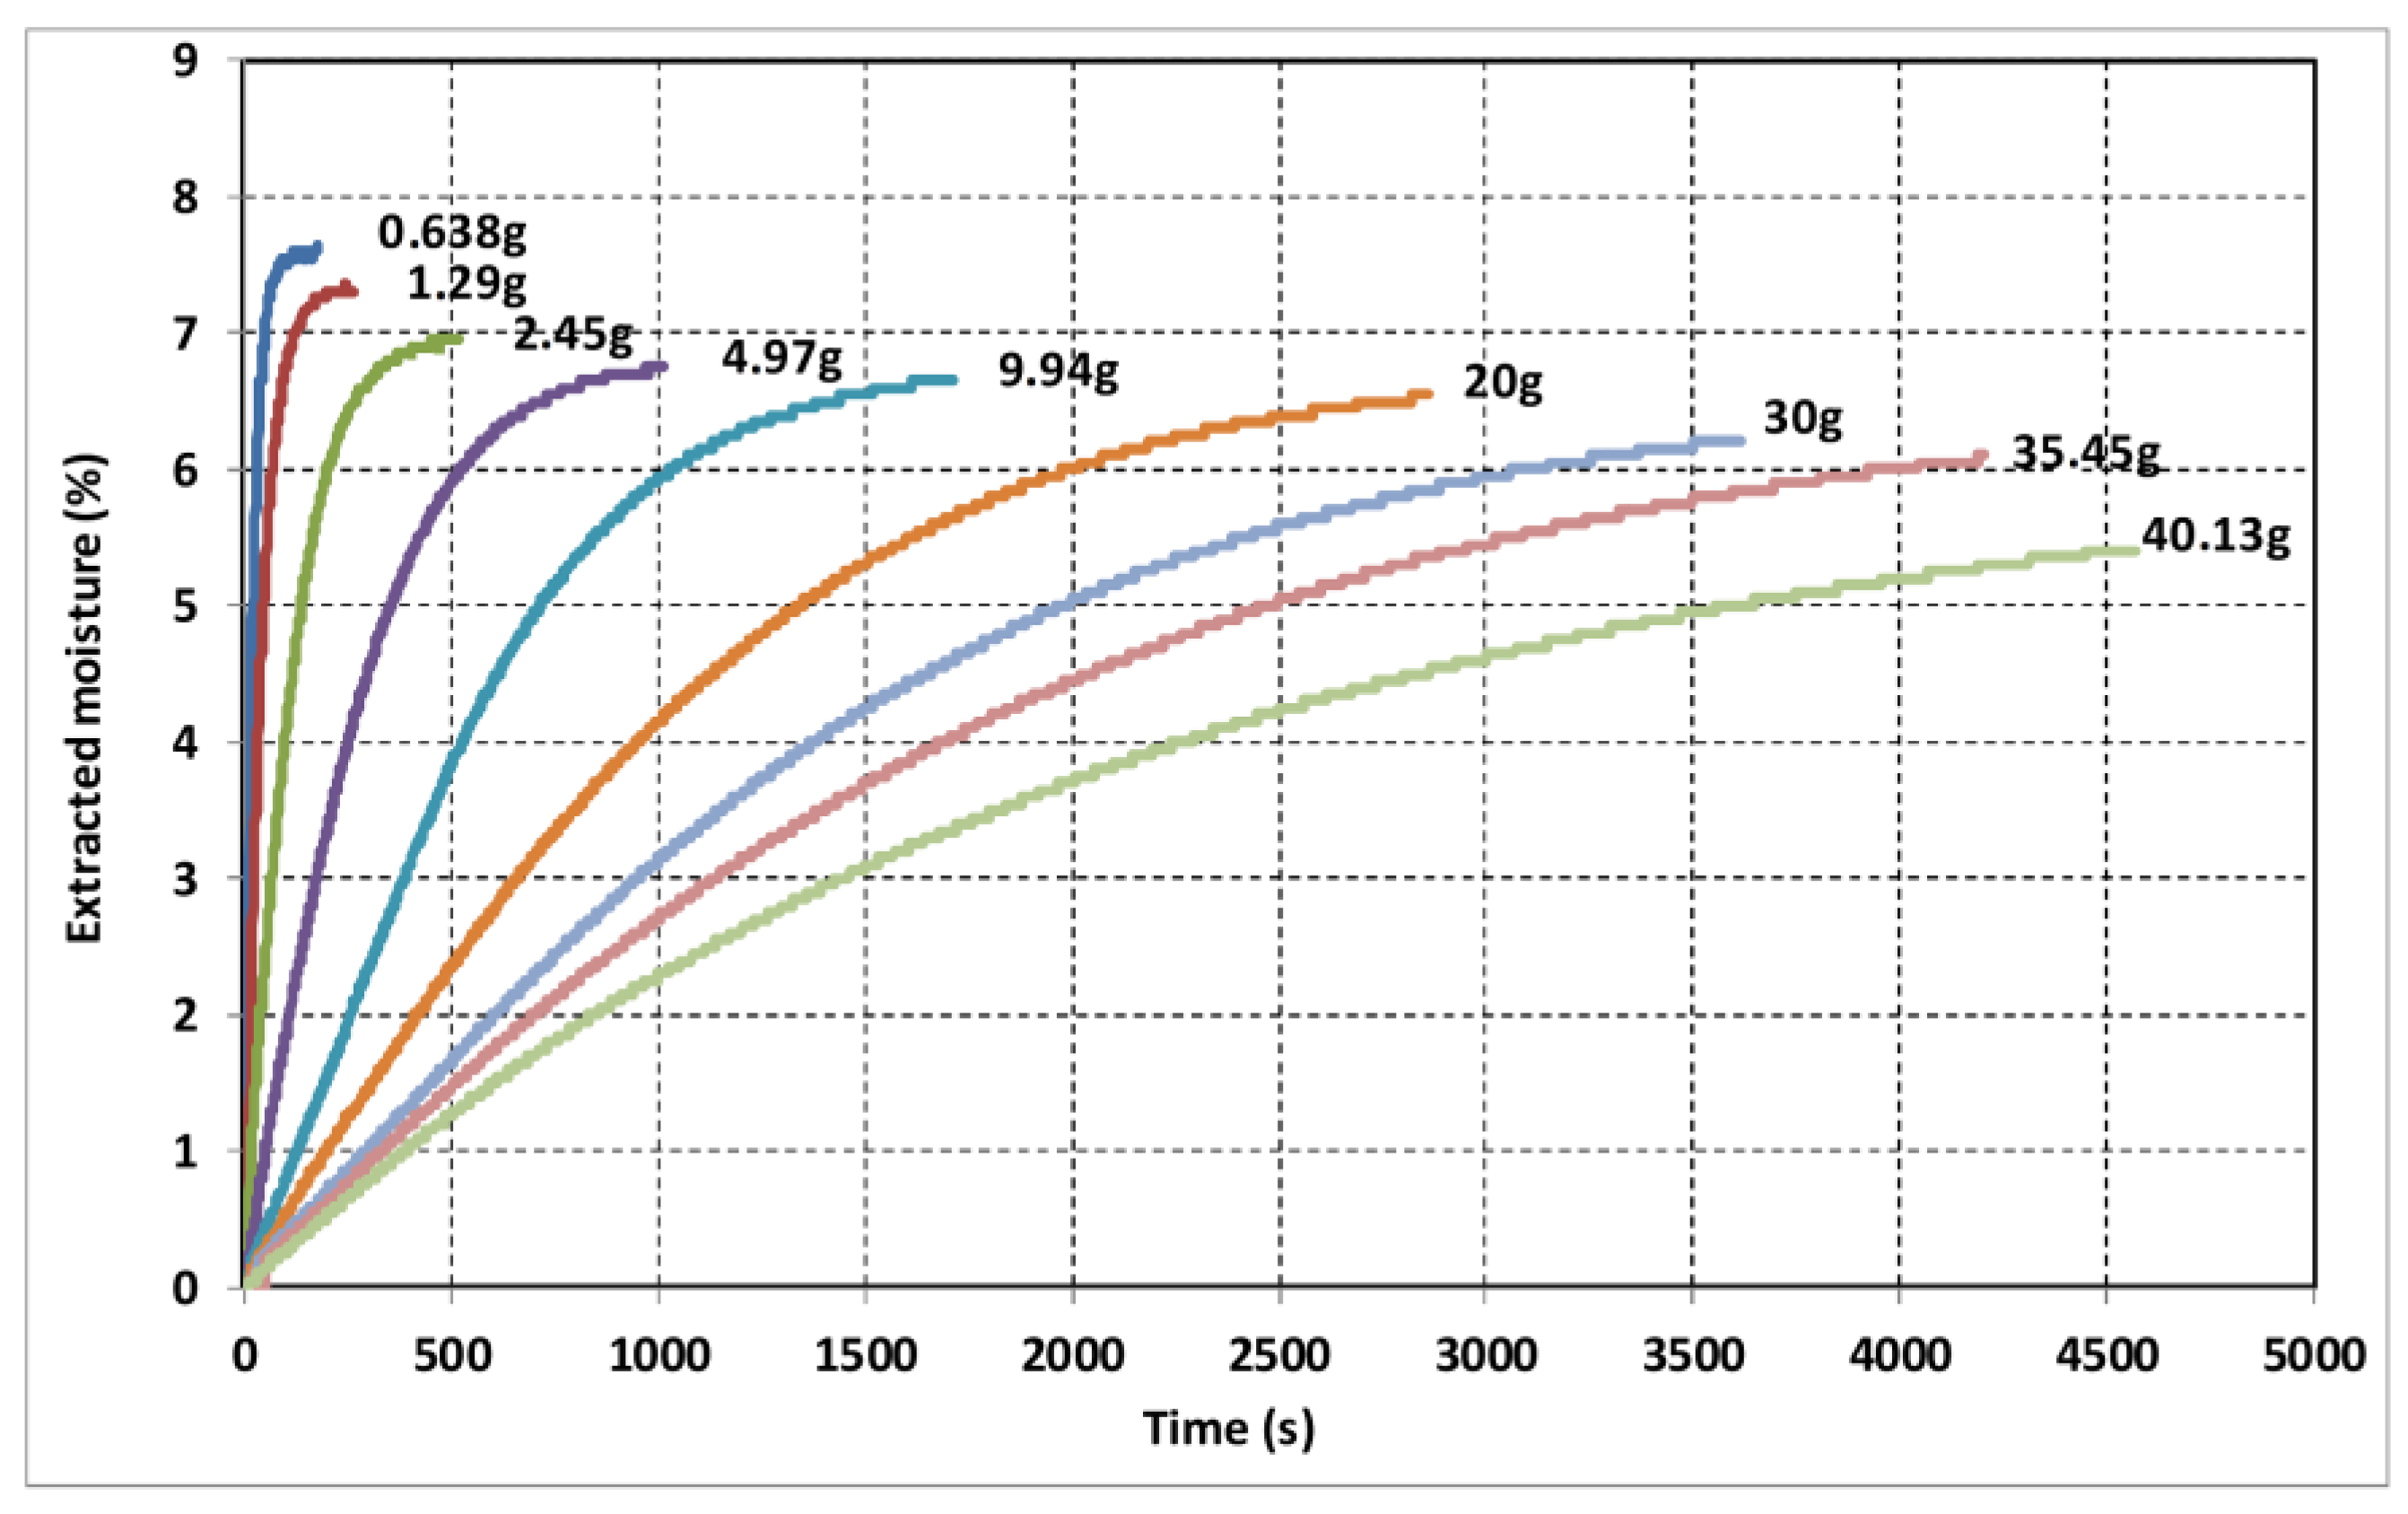
The measurement results displayed in Figure 1 indicate the progression of moisture percentage extracted over time, depending on the weight of the paper to dry. The drying apparatus stops the measuring process and displays the final moisture when the extraction rate reaches a threshold of 0.02% per min.
The measurement results show that the drying time increases according to the weight of the paper to be dried. Indeed, moisture refers to the water (liquid or vapor) content in the air or another substance, and is defined as the ratio between the water weight and the weight of the substance, as follows:
so that:
This relationship indicates that for given moisture level, the weight of water in a substance is proportional to the weight of this substance. In this case, the relationship reflects the increase in extracted water that explains the increase in the drying time.
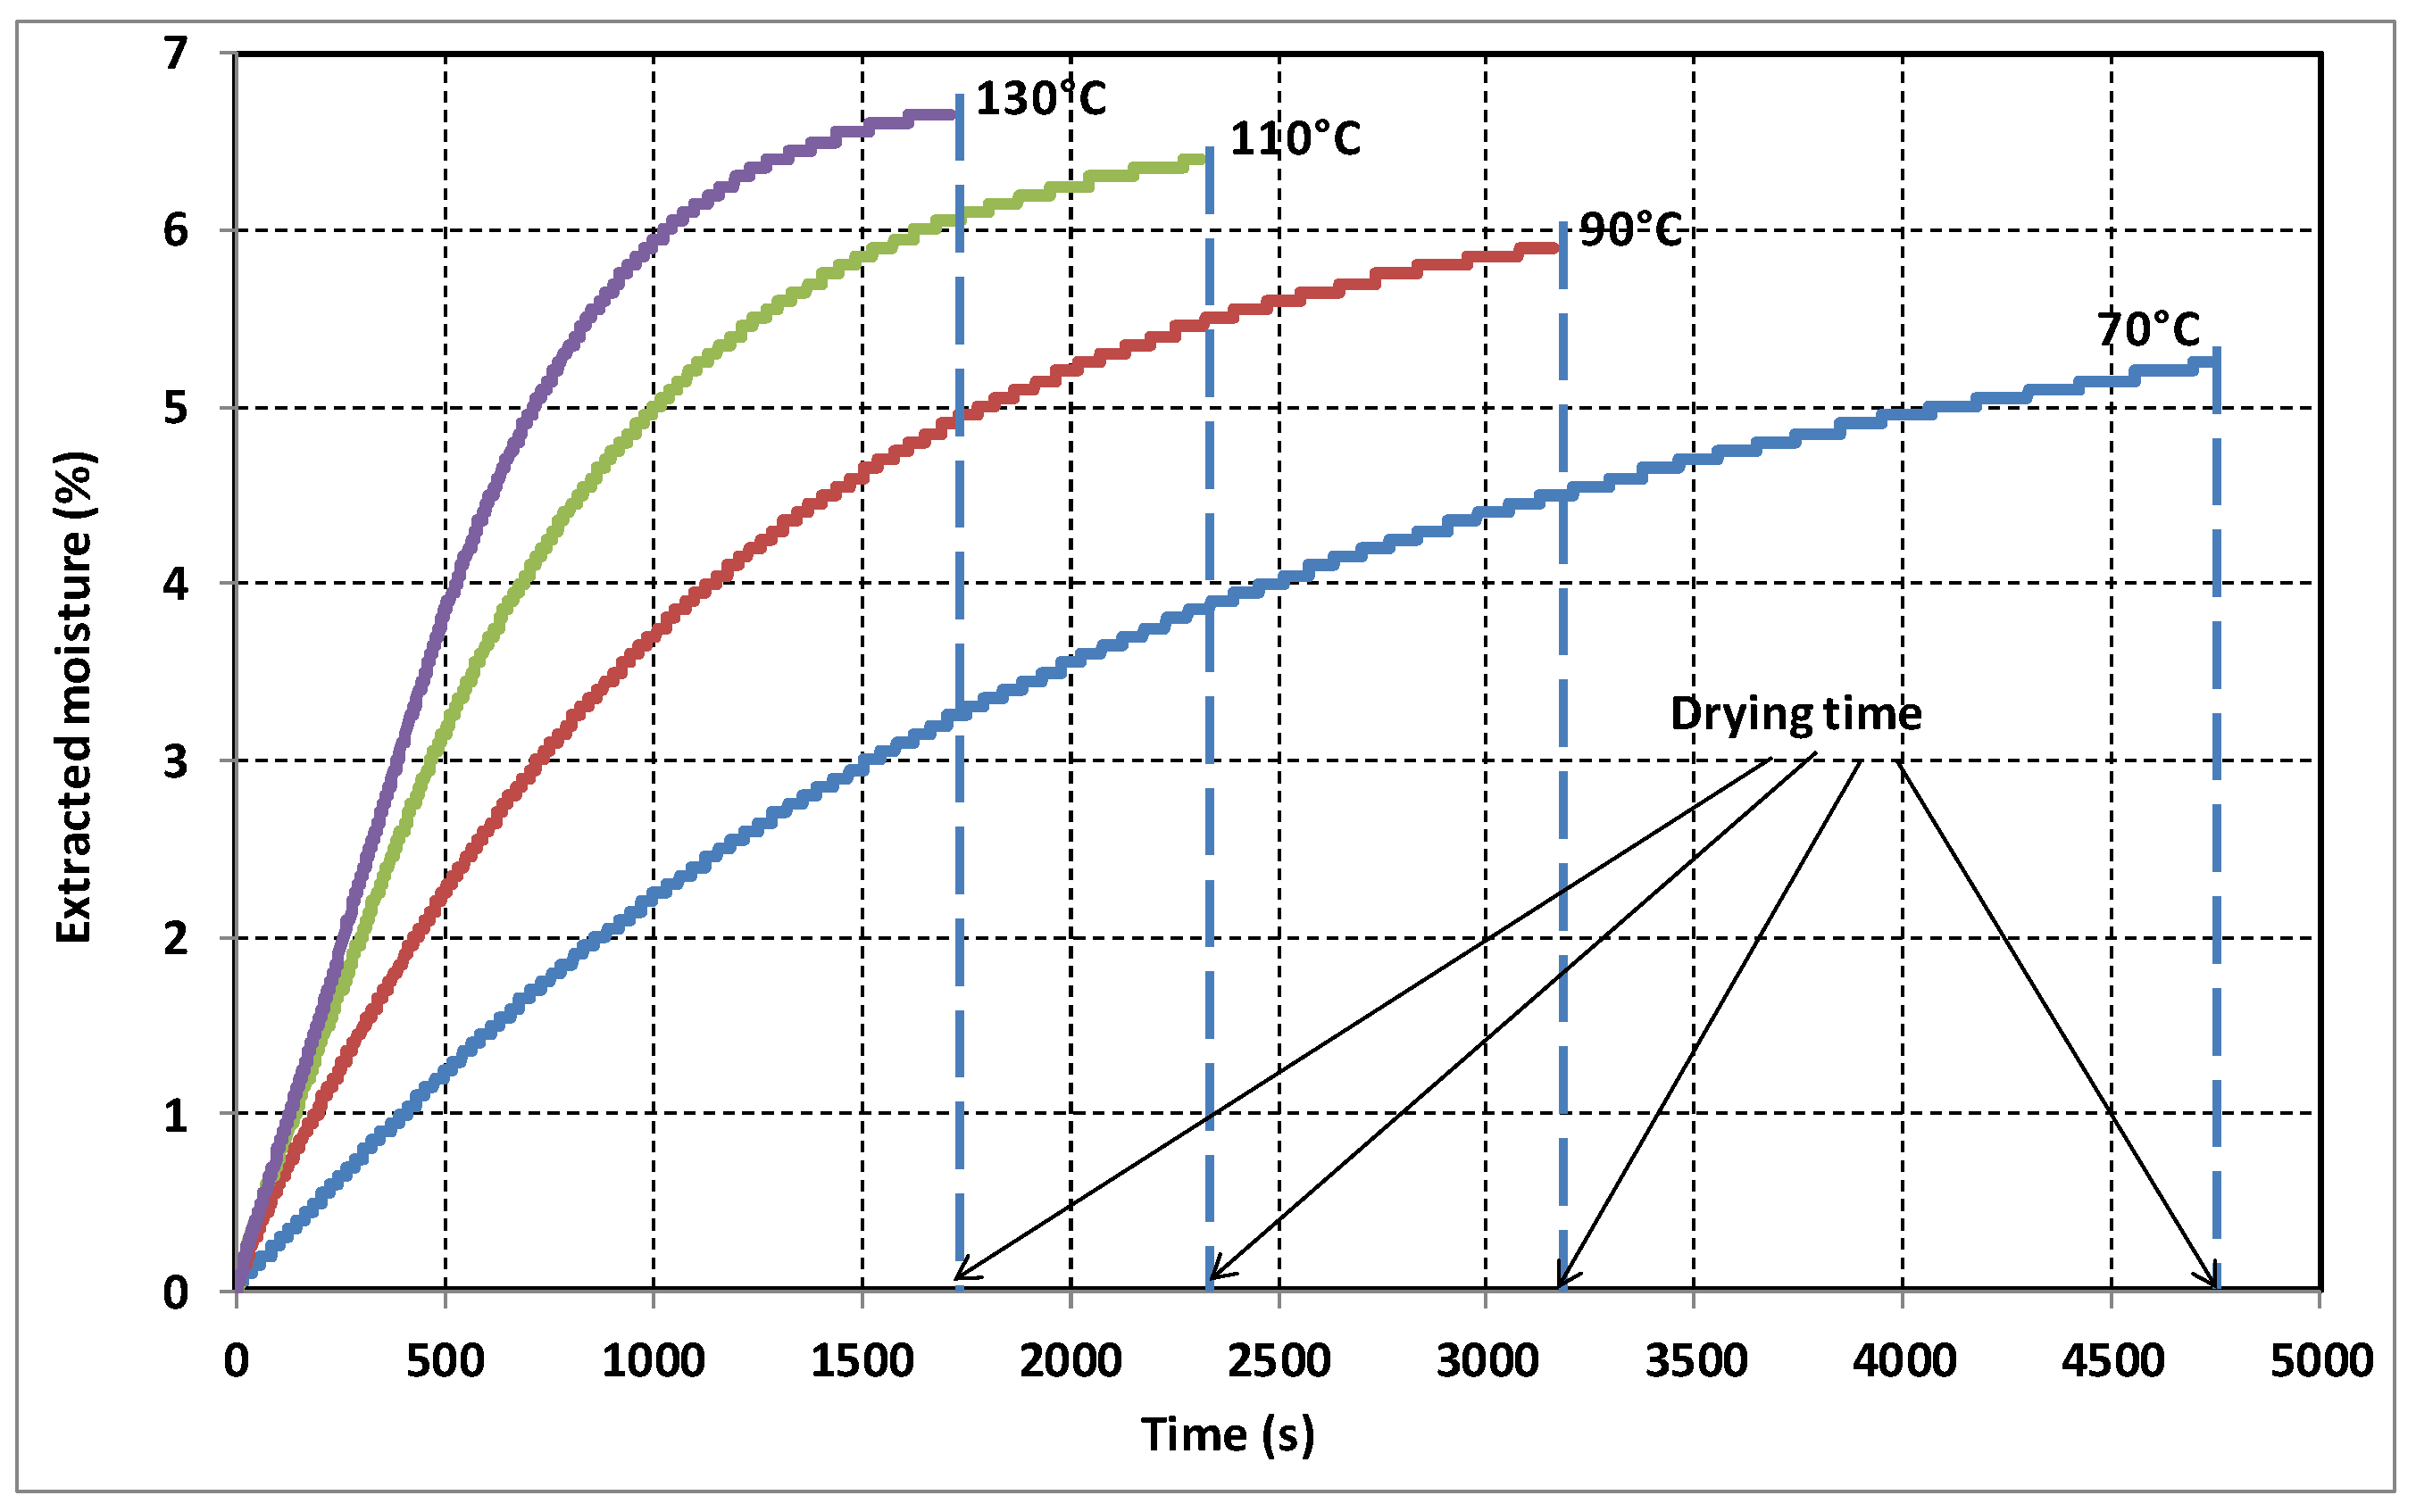
4.2. Temperature Impact on the Drying Process
Given the large size of power transformers, some of which may contain several tons of paper, drying requires high temperatures (up to 125 °C and more). The objective of this experiment is to estimate how drying time varies with temperature. The results are shown in Figure 2.
Analysis of the results indicates that drying time decreases as temperature rises. According to Equation (7), the variation of moisture depends on diffusion coefficient D in (m2/s); this coefficient increases with temperature, causing a reduction in the drying time.
5. Results and Discussion
5.1. Mathematical Model of the Drying-Out Process of Insulation Paper
Manufacturers monitor insulation dryness during processing, usually by measuring some parameter (such as insulation resistance or power factor) that is directly dependent on moisture content. Since there are no absolute values for these parameters applicable to all transformers, readings are usually plotted graphically, and the drying out process is considered completed when a levelling-out of the power factor and a sharp rise in insulation resistance is observed [5].
The first step in modeling the drying process is to determine the mathematical equation model that best fits the drying curves obtained. Since the percentage of extracted moisture is monitored, and not the percentage of residual moisture, as expressed by the equations shown in Table 1, it is therefore necessary to adapt these equations.
To do this, the Newton model (first equation in Table 1) seems most appropriate to fit the growth curves (extracted moisture), rather than the decreasing curves (residual moisture). The model used in this case is as follows:
with Hext as the extracted moisture (in %), H0 as the final moisture (in %), τ as the time constant (in s), and t as the drying duration.
This equation determines the remaining residual moisture in the paper at the end of drying.
5.2. Residual Moisture Estimation
The approximation of the drying curves by Equation (10) is performed by optimizing the quadratic error between the measured drying curves and the curves calculated by Equation (9). The results of this optimization will allow calculation of the final moisture H0 and time constant τ. The drying phenomenon can be modeled as a transient evolution, as the time constant of Equation (10) characterizes the time at the end of which equilibrium is reached—this is to say, when the extraction rate reaches a threshold of 0.02% per min. This optimization is achieved by using the MATLAB (R2013b) function algorithm “fminsearch”, which allows one to find the minimum of an unconstrained multivariable function using a derivative-free method. The multi-variables to be determined are the time constant and the final moisture percentage, and the function is Equation (9). The extraction rate (% per min) is determined by the derivative of Equation (10). The estimated moisture is calculated when the extraction rate is equal to 0.02% per min (the threshold for which the drying apparatus has been set to stop drying and display the result of moisture).
Table 2 shows time constant τ and moisture H0, calculated from the drying curves shown in Figure 1. The extraction rate (% per min) is determined by the derivative of Equation (10). The estimated moisture is calculated when the extraction rate is equal to 0.02% per min (the threshold for which the drying apparatus has been set to stop drying and display the result of moisture).
The approximation of the drying curves by Equation (10) not only allowed us to determine different time constants, but also to estimate the remaining residual moisture in the paper after the drying cycle.
Figure 3 shows an example of a calculated drying curve using Equation (10). For 0.658 g of paper, the moisture analyzer indicates 6.45 %, while the calculated moisture is 6.51%. It can be seen from the estimated curve that the real moisture contained in the paper can be calculated and that the remaining residual moisture in the paper can be estimated after the drying cycle.
Indeed, the apparatus used stops the drying when the moisture extraction rate, expressed in percentage per minute (% per min), reaches a previously set threshold. Thus, as can be seen from the various curves at the beginning of drying, the extracted moisture amount per time unit is very large, which explains its extreme slope. At the end of drying, the extracted moisture per time unit (the drying curve slope) becomes increasingly weak, eventually reaching the adjusted threshold value when drying is stopped. In this case, and according to the adjusted threshold of the moisture extraction rate, the heating may be stopped, even though there is still a certain amount of residual water in the paper.
The estimation process of the drying state of the transformers at the factory follows the same principle. In fact, during the drying process, the amount of removed water per hour is measured in grams. Then, depending on the transformer paper weight to dry, the extraction rate, expressed in grams of water per ton of paper per hour (g/T/h), is calculated. When this extraction rate reaches a specific value, the drying operation is stopped.
Table 2 shows that in terms of the mass of paper to be dried and the drying temperature used, a significant quantity of water can still remain in the paper. This fact explains the difference between the extracted moisture value measured by the device and the value of estimated real moisture.
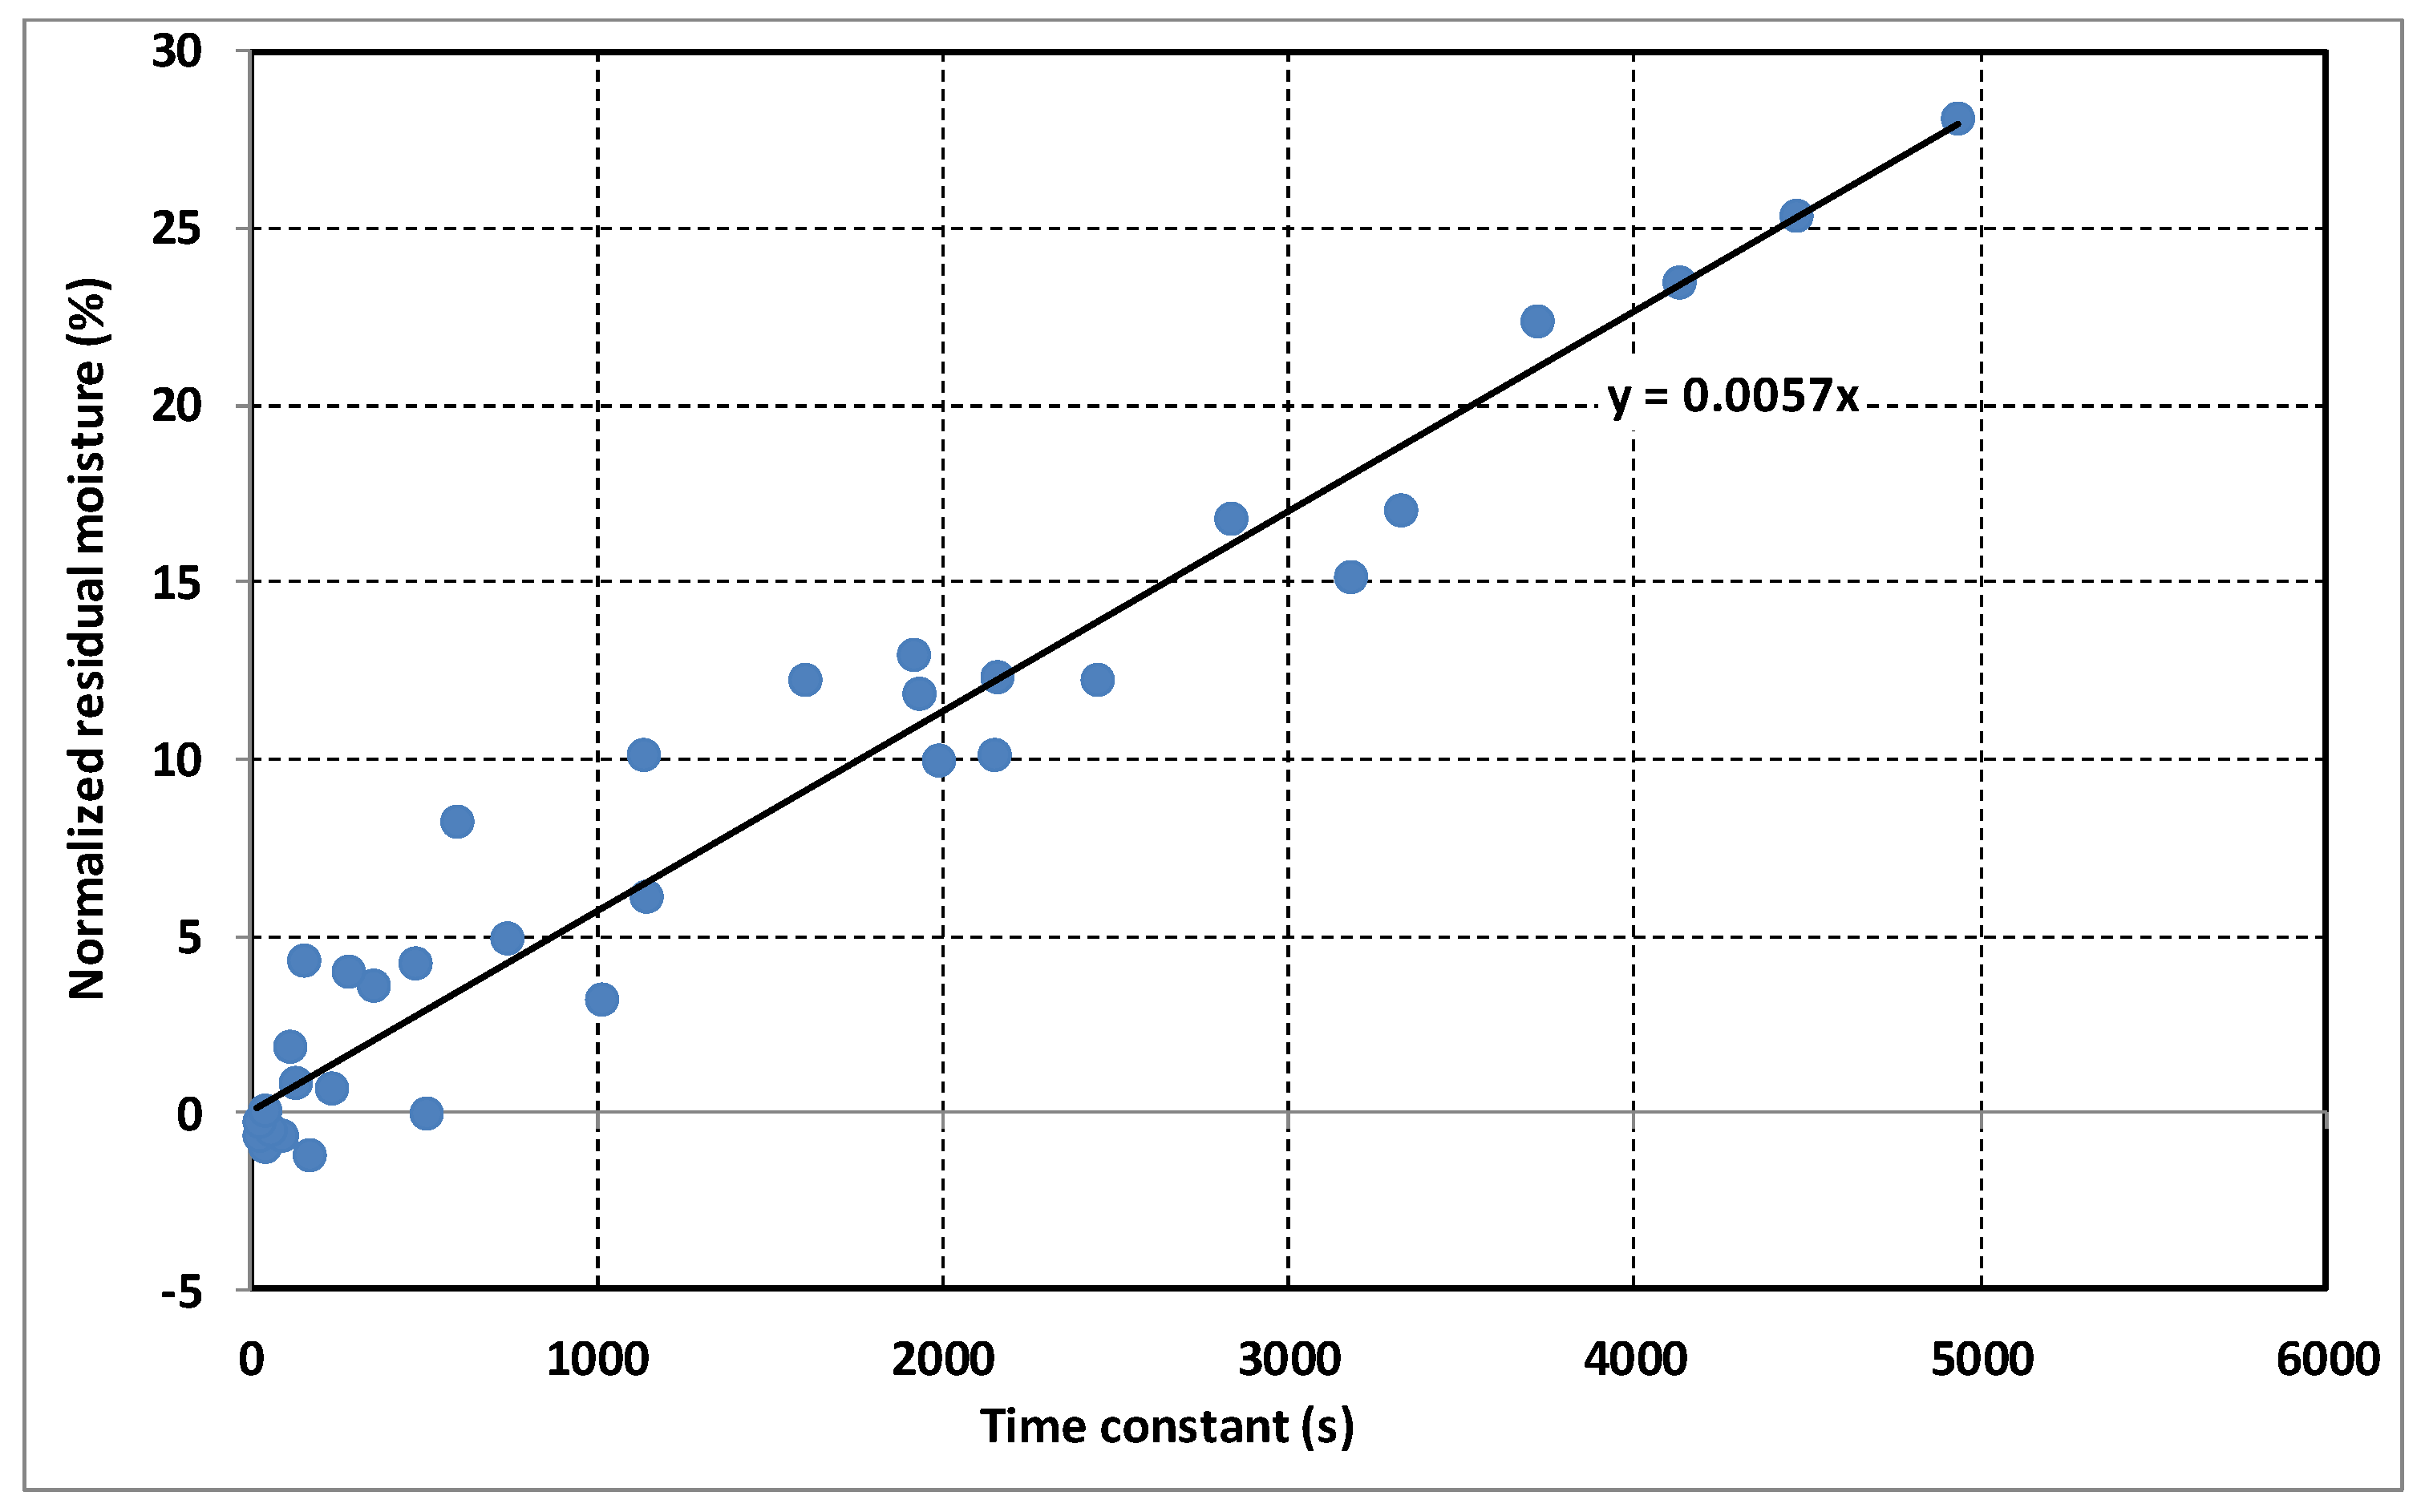
In addition, from the results of this analysis, it can be seen that the residual moisture in the paper after the drying process is higher if the drying time constant is large, as shown in Figure 4, where residual moisture is normalized to the initial moisture. It may be noted that in this case, at the end of a drying process, more than 25% of the initial moisture can remain, if the drying is done with a close time constant of 5000 s.
This increase in residual moisture, in accordance with the increase of the time constant, is due mainly to the use of a fixed extraction rate threshold to stop the drying process, no matter the weight of the paper transformer or the drying temperature. These last two parameters directly influence the time constant, as already emphasized in this analysis. However, the use of an extraction rate threshold that takes into consideration the time constant (which depends on the paper weight and the temperature) can reduce the residual moisture in the paper. Therefore, the drying time in this case will increase, thereby contributing to the exposure of the paper to the drying temperature for longer periods.
In practice, it would be highly desirable in the industry to model the drying curves, in order to estimate the moisture removed at the end of drying, based upon initial moisture, weight of the paper, and drying temperature. In addition to the estimated moisture value, it would be possible to determine the time needed for the best method of drying paper.
5.3. Modeling the Drying Process Depending on Temperature and Weight
The study of the parameters influencing paper-drying kinetics in the transformers has resulted in the mathematical model represented by Equation (10). This model, which is perfectly adapted to the drying process, can estimate the final moisture H0 and time constant τ.
From this equation, it is possible to calculate the duration of drying time, depending on paper weight and drying temperature.
In this case, the results obtained by estimating the extracted moisture depending on temperature and paper weight to be dried (Table 2) will be used.
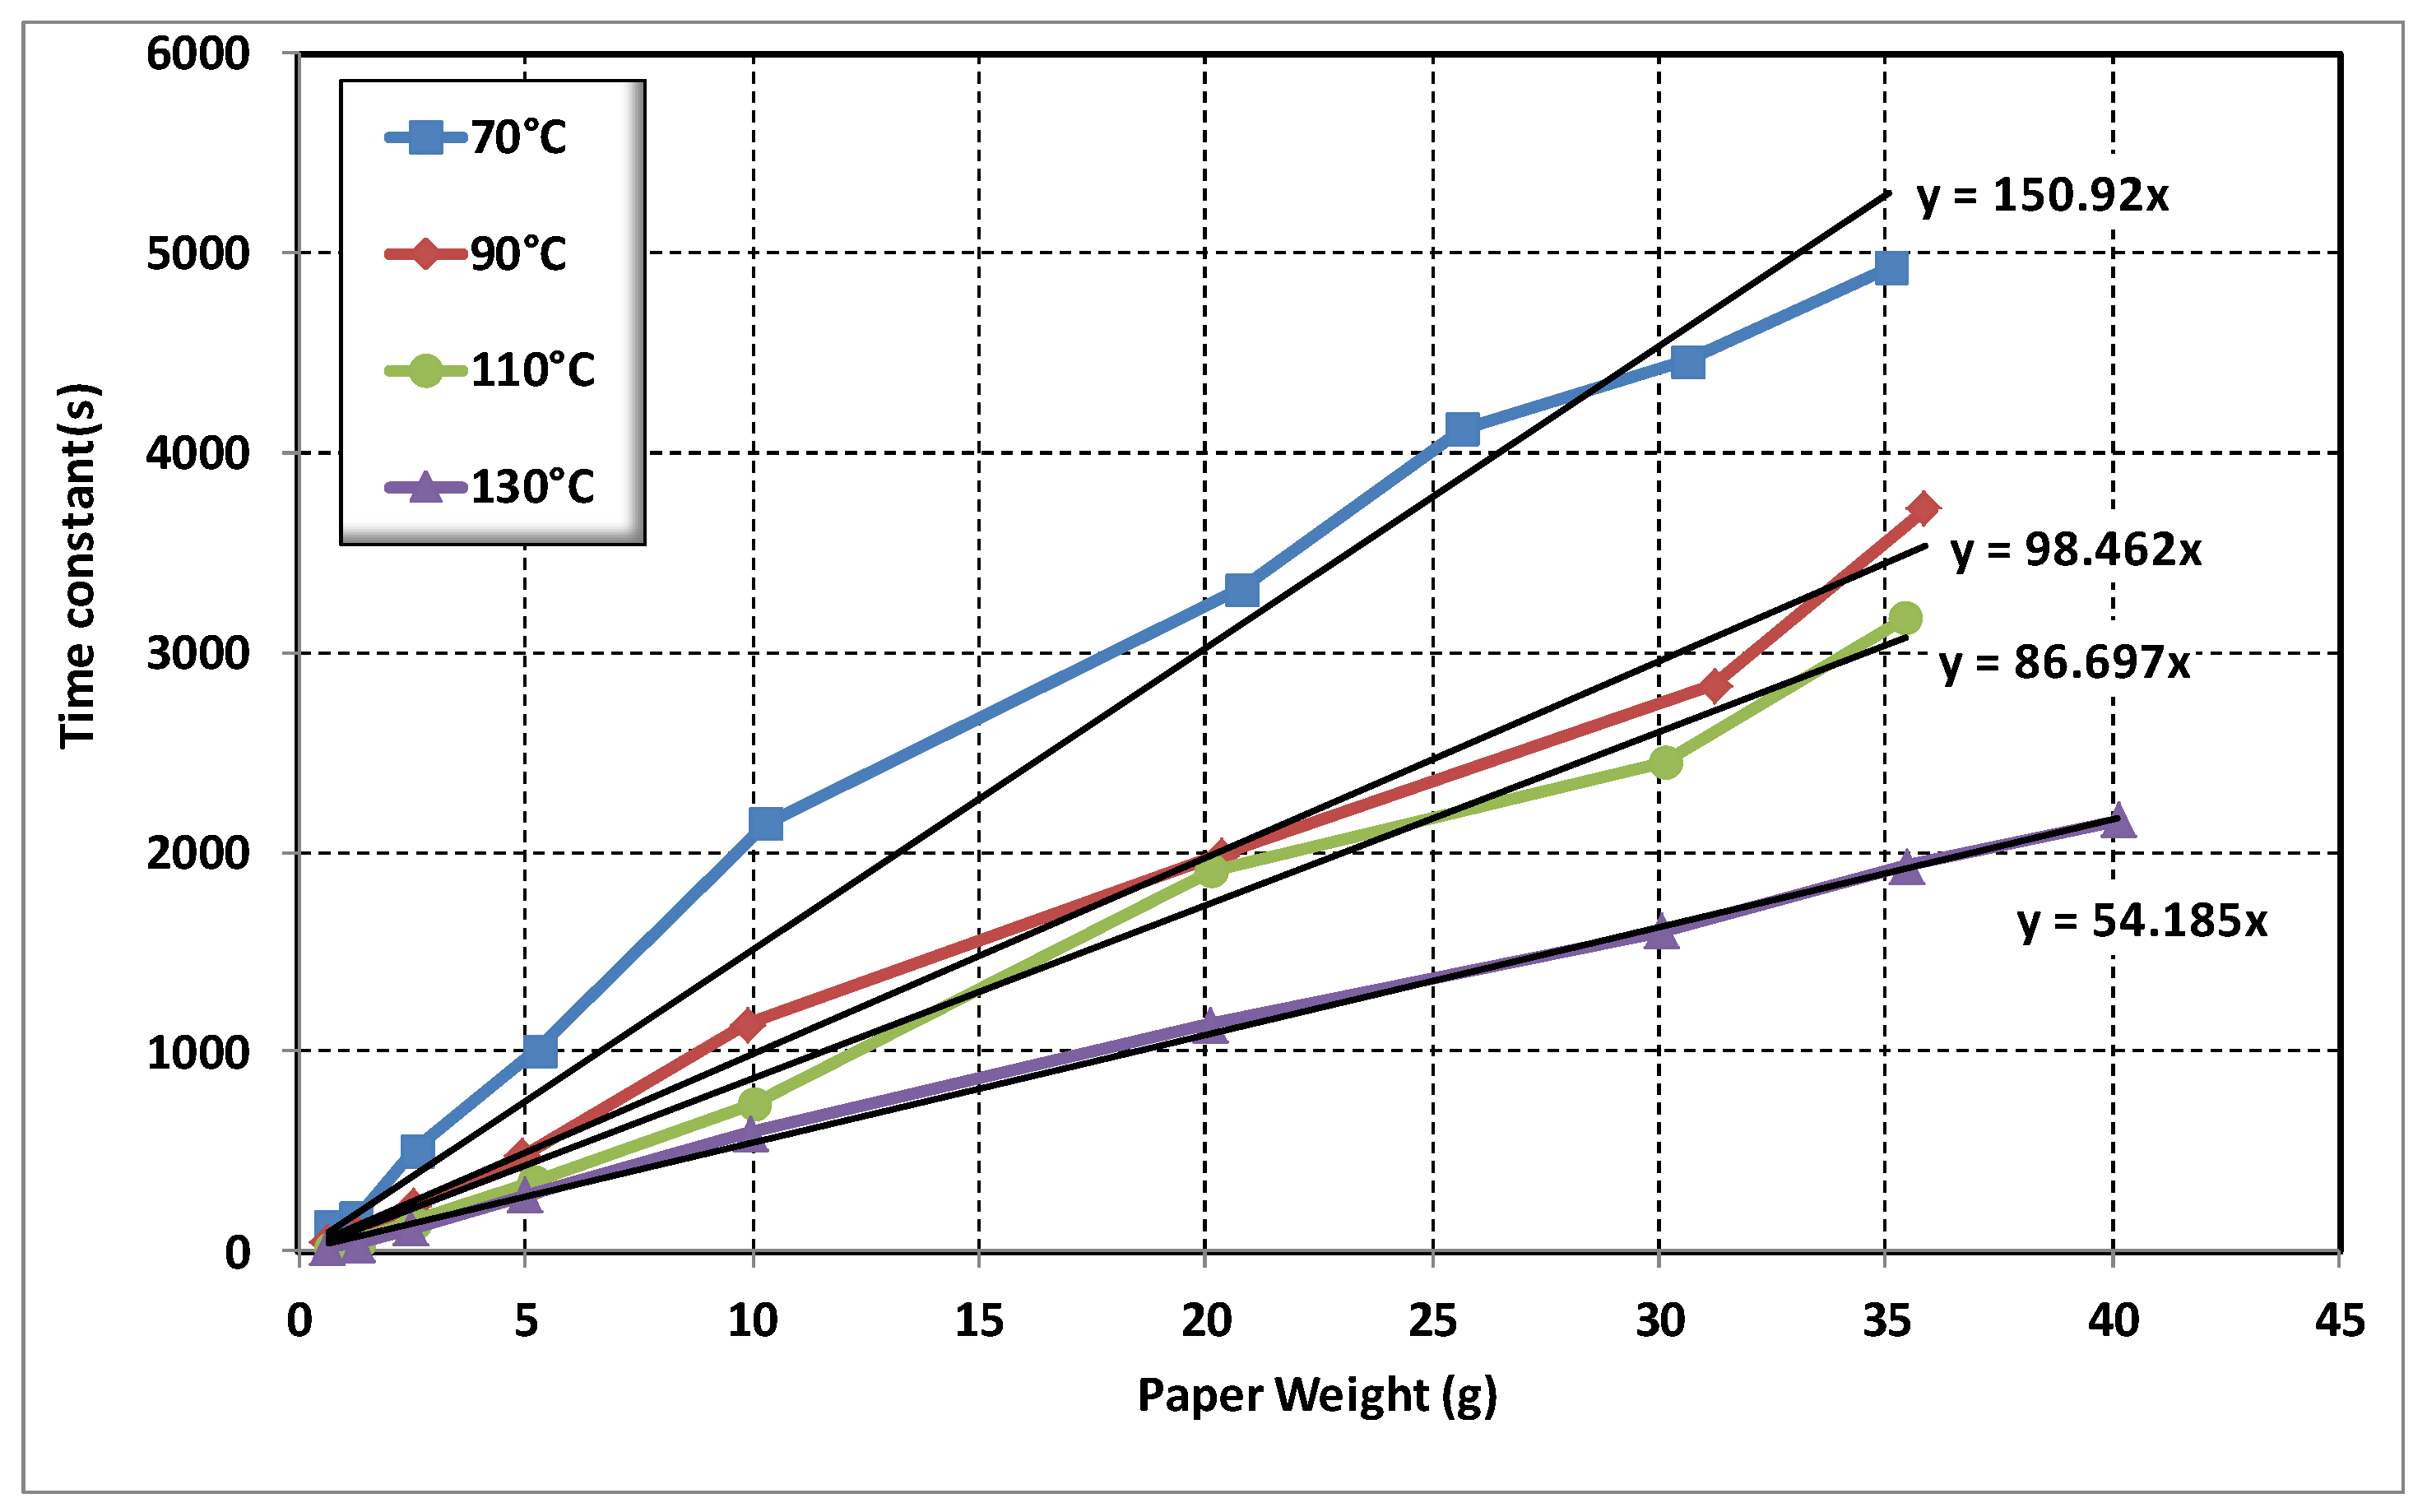
Figure 5, obtained from the data in Table 2, shows the estimated time constant, depending on the temperature and the paper weight.
The analysis of the curves shows that time constant τ is directly proportional to the weight of the paper to be dried, as well as the drying temperature. The evolution of time constant τ can be estimated by linear curves. Therefore, the equation that relates the drying time constant τ and the paper weight M can be written as follows:
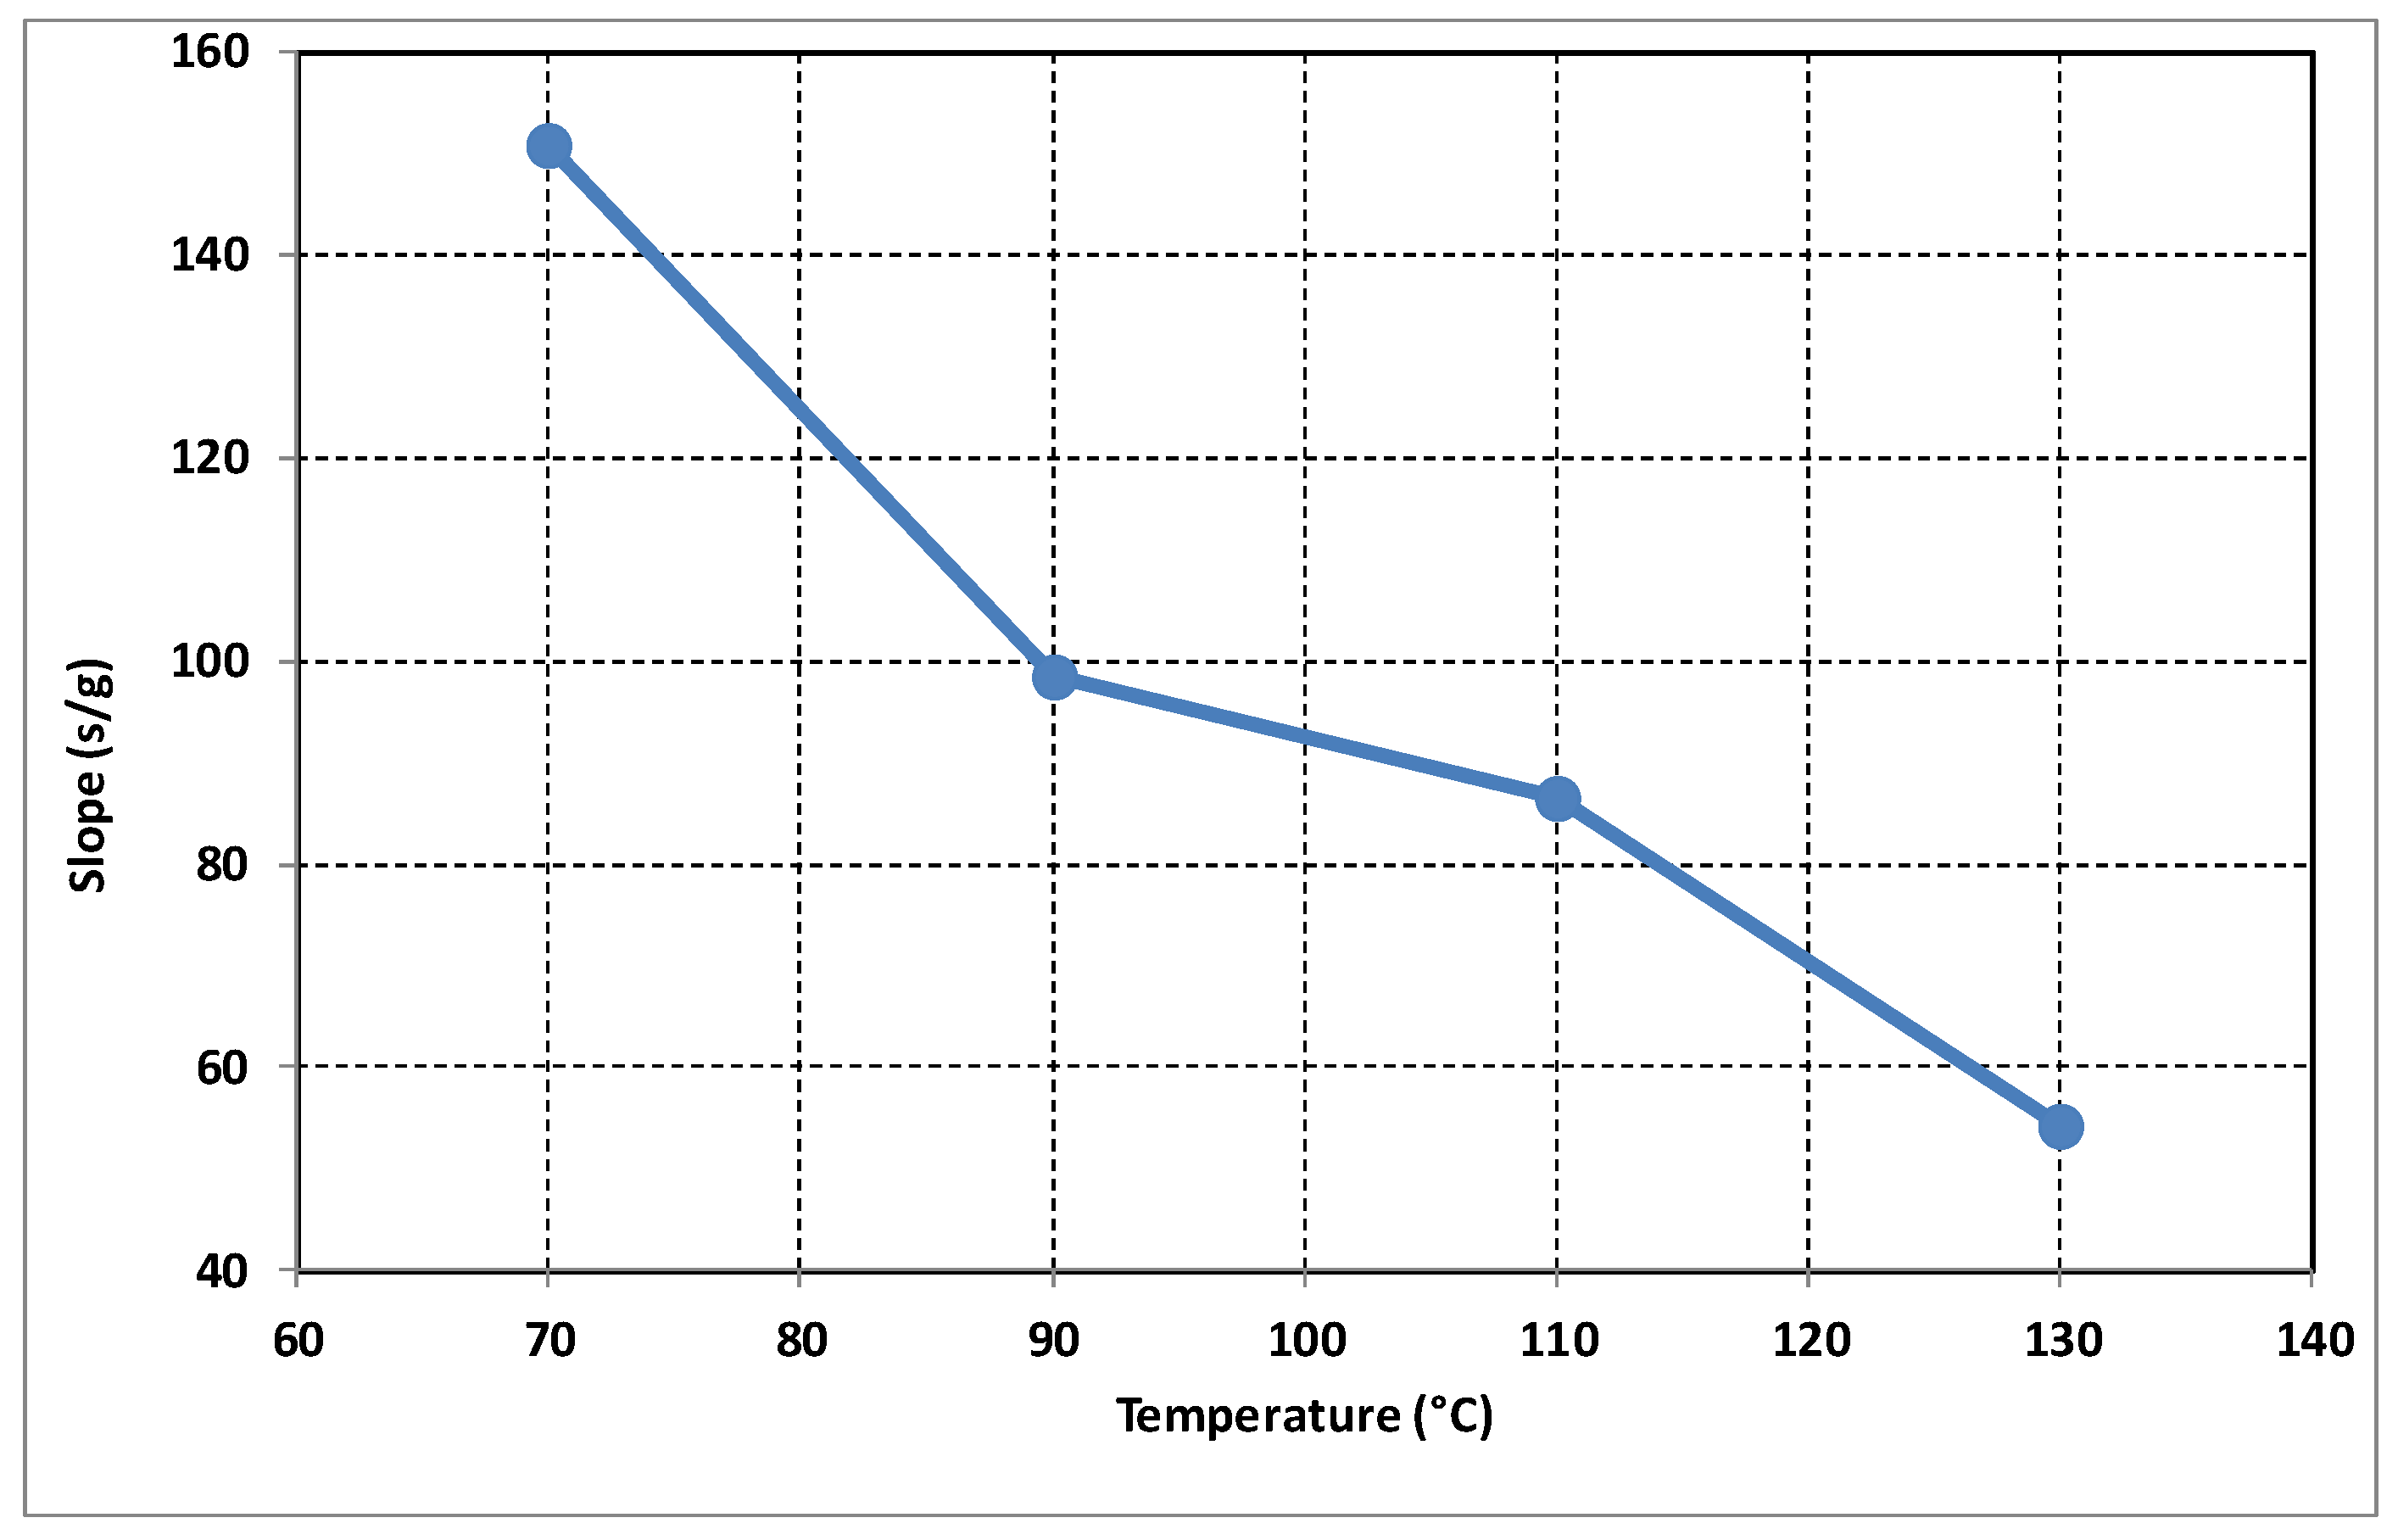
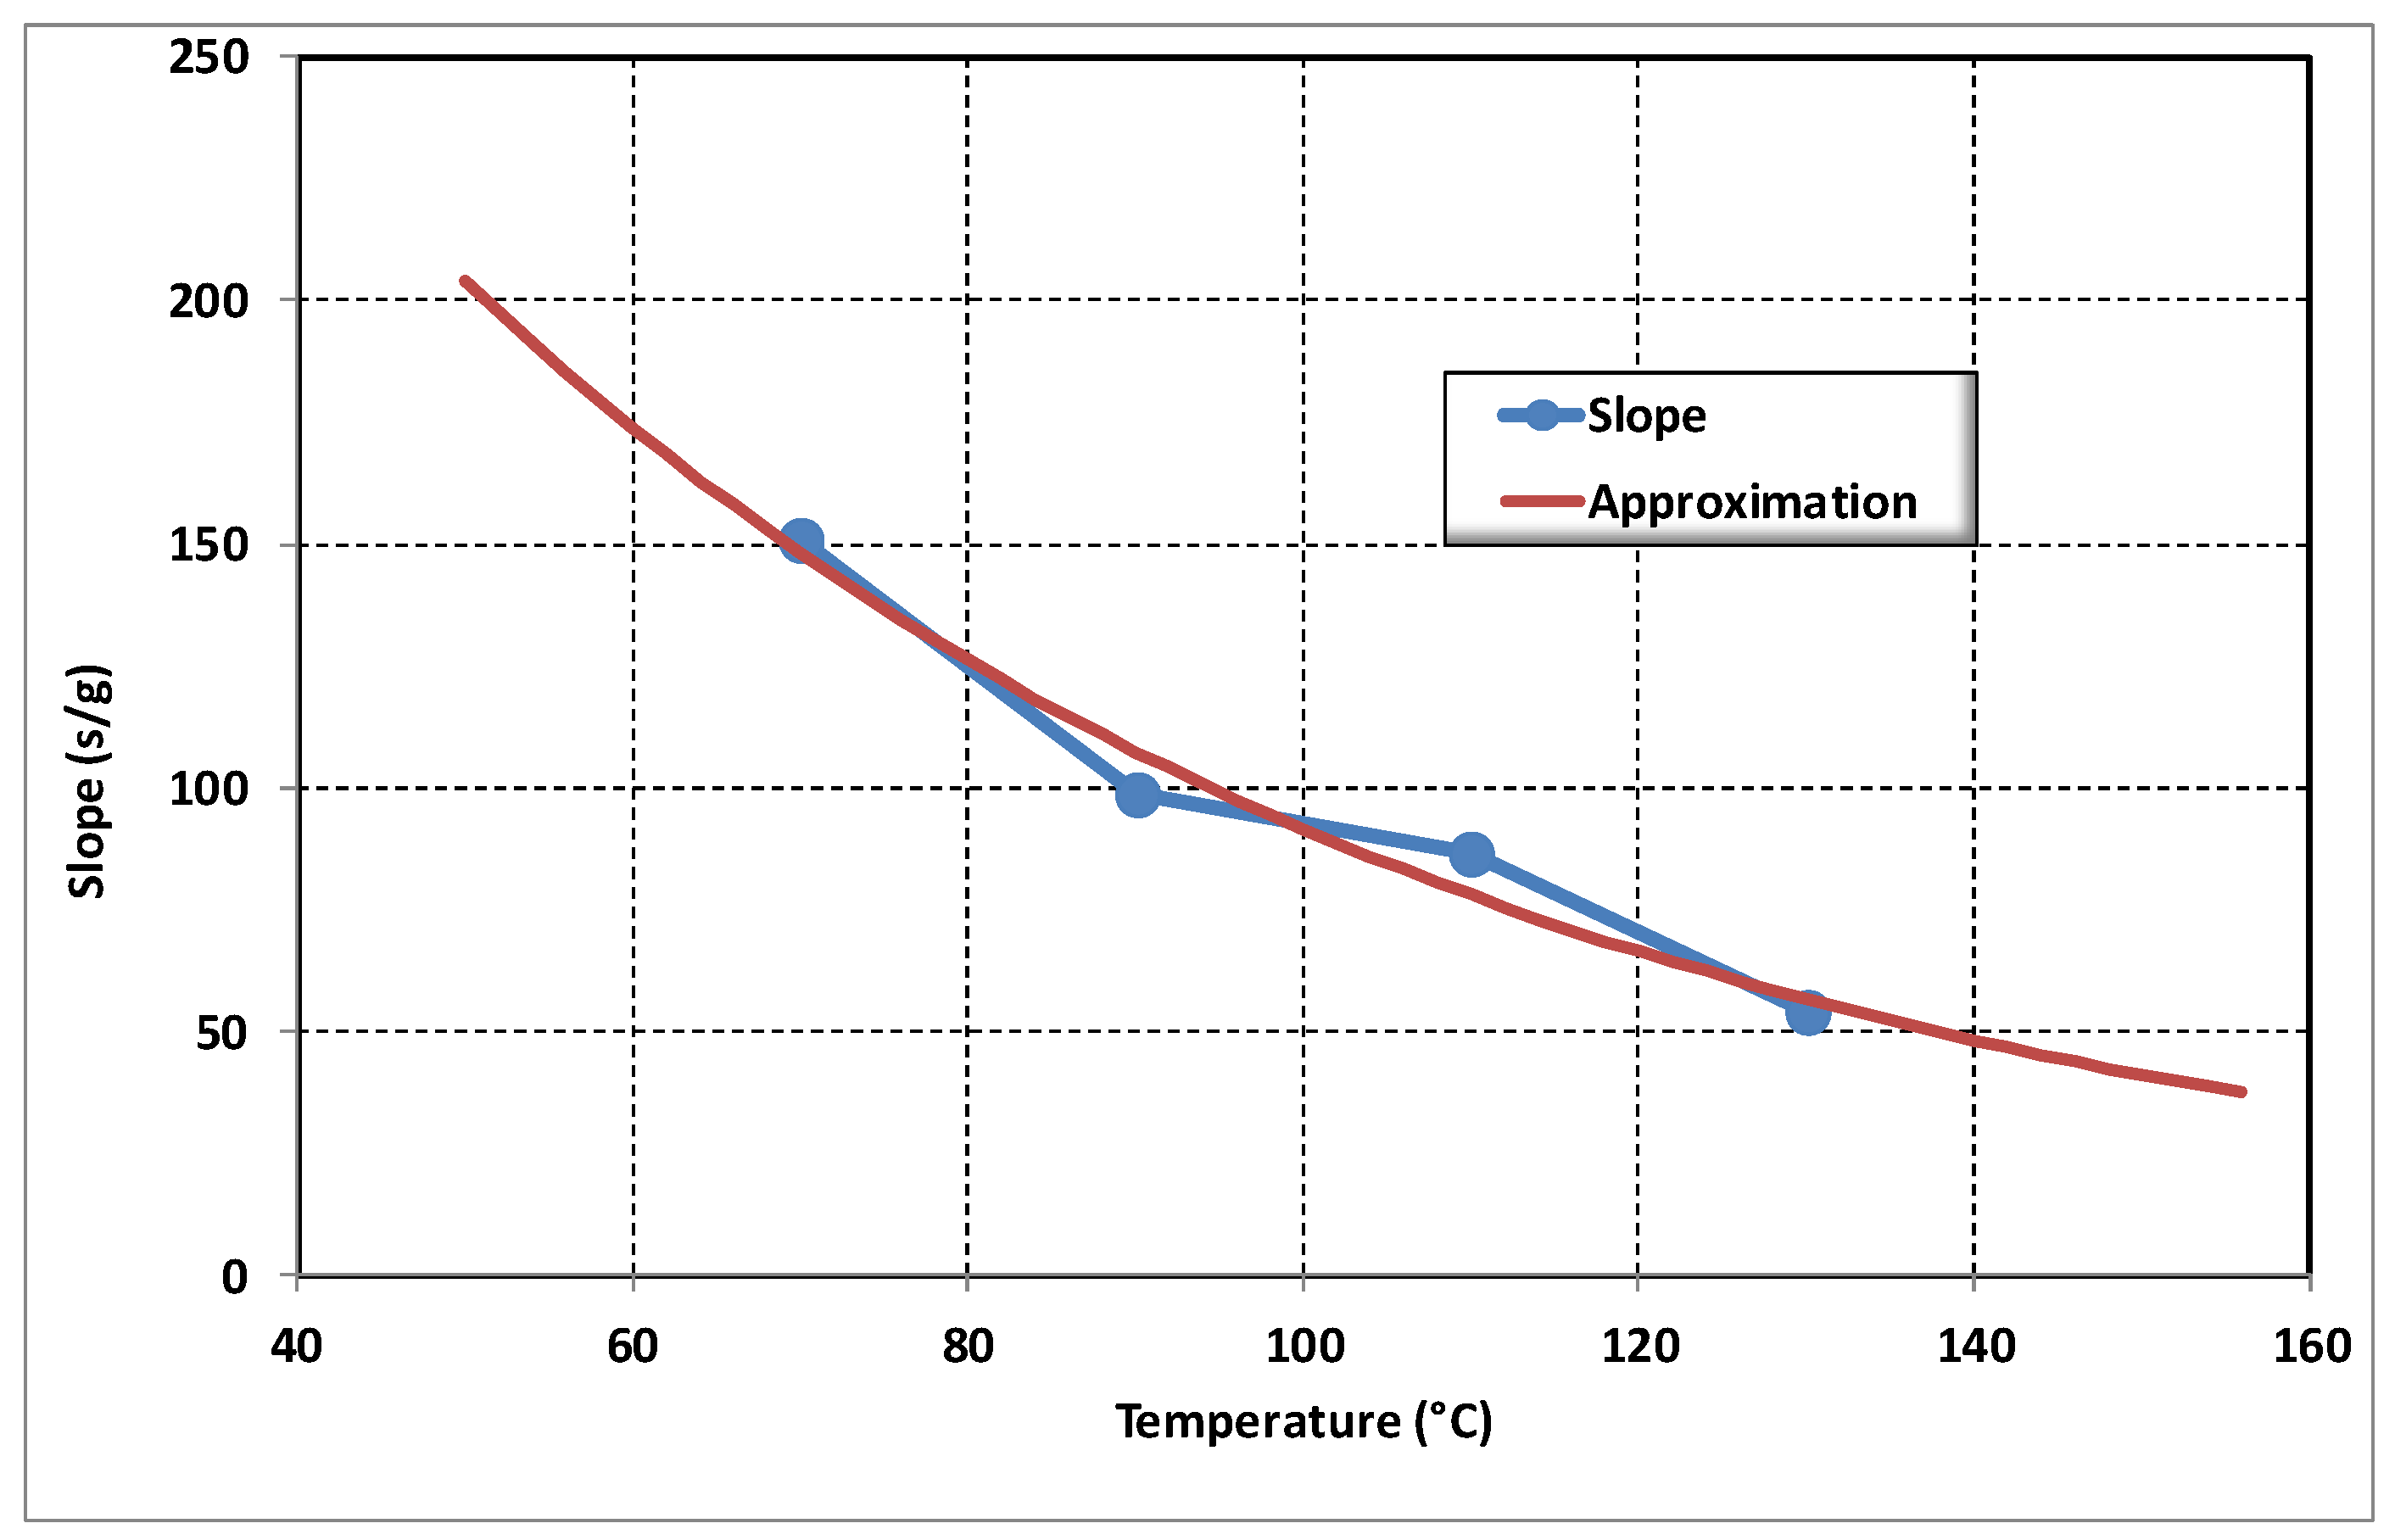
where P is the slope of the linear approximation curves of the time constant, depending on the weight of the paper (M). The P slope depends on the drying temperature, and its evolution is presented in Figure 6.
The approximation function of the slope P as a function of temperature can be expressed as:
where K1 and K2 are two coefficients, to be determined by minimizing the square root error between the slopes of Figure 8 and those calculated by Equation (10). Figure 7 displays the approximation function of the slopes.
The values of the calculated coefficients K1 and K2 are:
As a result, Equation (9) can be written as:
By substituting Equation (13) into (10) we get the following relationship, where drying time constant τ is expressed as a function of the drying temperature T and the mass of paper to be dried M:
From Equations (10) and (14), the following formula is obtained, allowing us to model the drying curves:
This mathematical model allows us to express extracted moisture (Hext) as depending on paper weight to be dried (M), drying temperature (T), and initial moisture (H0).
Whether the drying process is performed by the equipment used in this study, or by the transformer manufacturer, the drying process in both cases is stopped when the extraction rate (expressed by quantity of extracted water per paper amount per unit time) reaches a predefined threshold. When this happens, using the mathematical model proposed for the drying process (Equation (10) or (14)) the extraction rate (Rateext) can be expressed by the derivative of the function of the extracted moisture (Hext):
In this case, from the established model, considering that the initial moisture H0 was previously estimated and that the extraction rate threshold (in our case it is fixed at 0.02% per min) is known, the drying time necessary to achieve this threshold can be calculated using the following equation:
Now, replacing the time constant by its expression (Equation (14)), the following equation is obtained:
5.4. Validity of the Established Drying Model
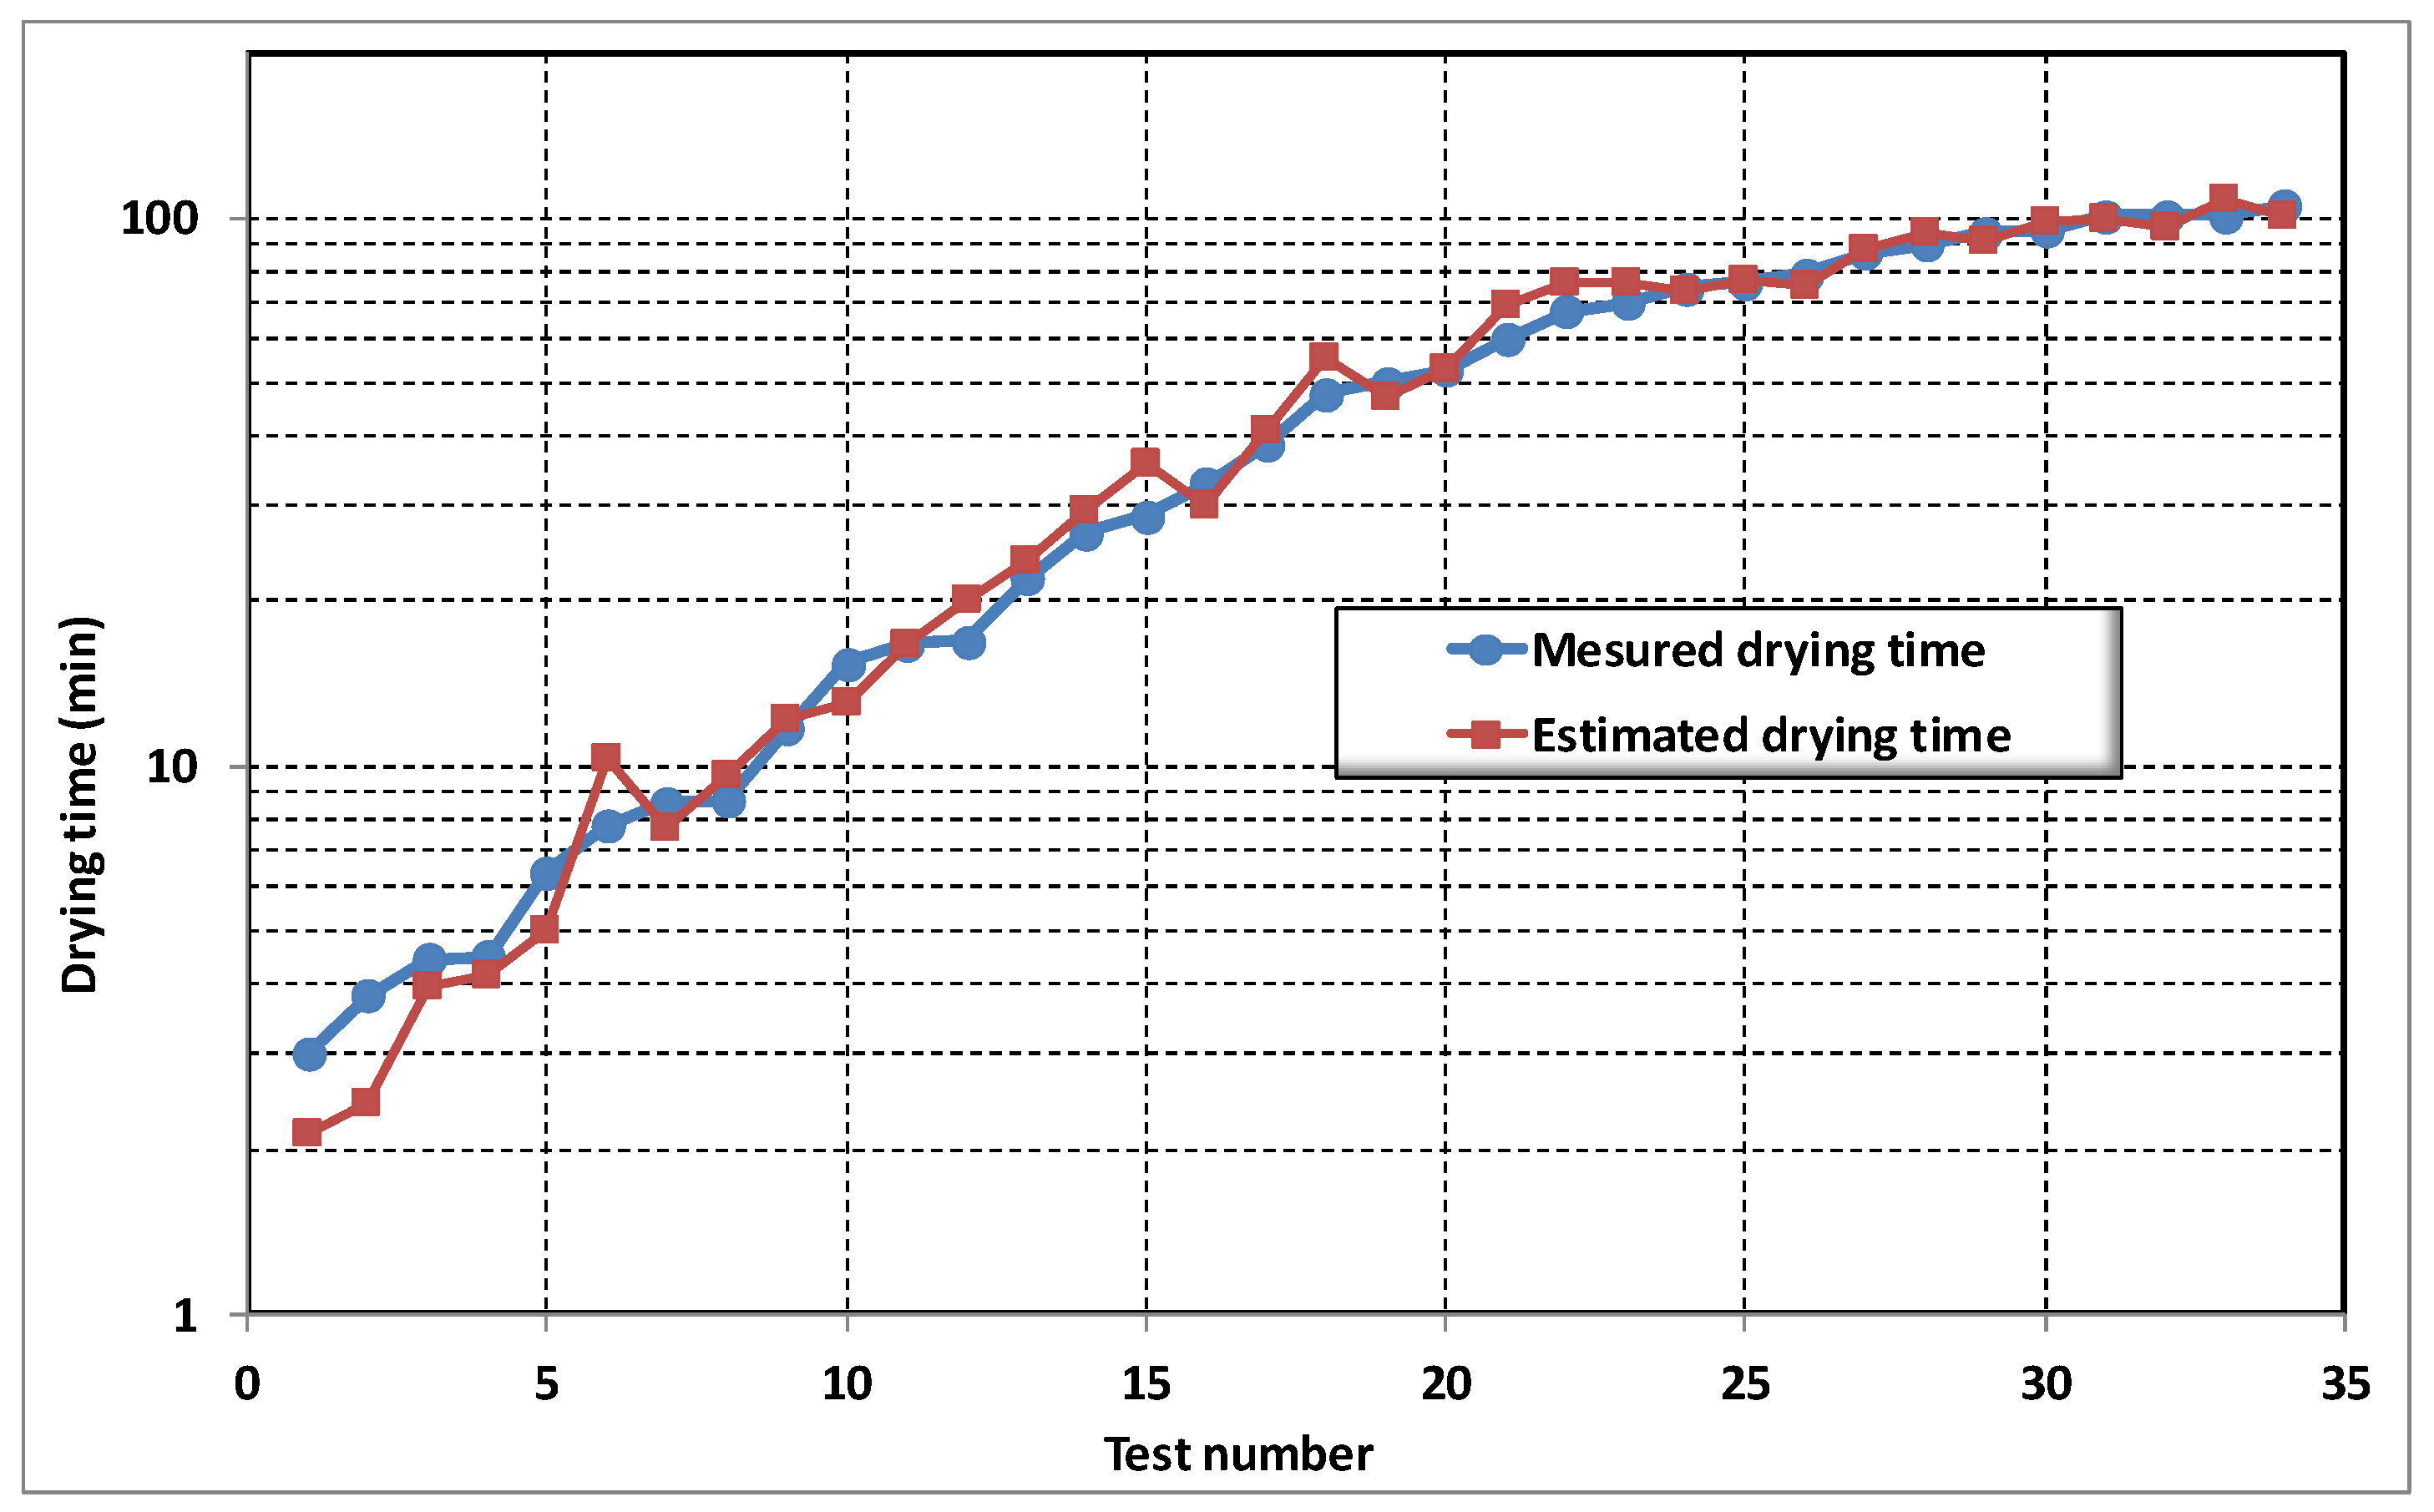
The drying times calculated by the model, based on the paper weight, drying temperature, and drying time determined by the drying apparatus, are shown in Table 3 and Figure 8:
The curves displayed in Figure 8 shows a strong correlation between the calculated and measured durations, which confirms the validity of the proposed drying model. This model can confidently be used for calculating the drying time of the paper used in transformers.
6. Conclusions
Estimating residual moisture is an important factor to ensure acceptable residual water content and avoid failure during dielectric testing certification after manufacture. The success of this estimation depends strongly on the mass of the paper to be dried, the duration of drying, and the drying temperature.
To the best of our knowledge, this estimation is currently made by making an indirect measurement of the extracted moisture. It is thus necessary to use, instead, an equation adapted to the process of drying the paper.
Based on the measurements made on paper samples using the thermogravimetric method, it was possible to set up a model of equations adapted to the paper drying process specific to the transformer. In this model, the drying process of the paper is a function of the temperature, mass of the paper to be dried, initial moisture, and final moisture to be reached, which is the key point of our contribution to the process of drying transformers.
The results obtained in this research show that it is possible to model the phenomenon of drying the paper used for the isolation of power transformers. From this model, it was possible to calculate, for a given threshold of extraction rate and initial moisture, the drying time required as a function of the mass of the paper to be dried, the drying temperature, and the final moisture to be reached. It was also shown that it would be possible to estimate the residual moisture remaining in the paper at the end of the drying process. The proposed model of paper drying, which is validated against thermogravimetric experimental analyses, has limited applications, because it does not take into account the real conditions of cellulose insulation drying.
This work is the first part of a general model of paper drying for power transformers. Indeed, since the present work was carried out on an equipment with a maximum drying capacity of 50 g, a coefficient must be introduced in the formula in order to adapt the results obtained in this study to the case of large ovens capable of drying large transformers (for example, a 150 MVA transformer may contain as much as 7 tonnes of paper). Moreover, as the drying of transformers is realised under a vacuum, this must also be considered. In the second part of our work, we will take into account these two parameters.
Acknowledgments
This work was carried out within the framework of the Research Chair, ViAHT and the CENGIVRE International Research Center, at Université du Québec à Chicoutimi (UQAC). The authors would like to thank all the sponsors and collaborators.
Author Contributions
This work was done under the supervision of Issouf Fofana, responsible Research Chair on the Aging of Power Network Infrastructure (ViAHT), and Zie Yeo at INP-HB (Institut National Polytechnique Houphouët Boigny Département Génie Électrique et Électronique), who designed this research and gave the whole guidance. Amidou Betie and Fethi Meghnefi collected all the data, carried out calculations, displayed the results and analysis, and wrote the manuscript. The final draft of paper was thoroughly reviewed by Issouf Fofana and Zie Yeo. All authors read and approved the final manuscript.
Conflicts of Interest
The authors declare no conflicts of interest.
References
- N’cho, J.S.; Fofana, I.; Hadjadj, Y.; Beroual, A. Review of Physicochemical-Based Diagnostic Techniques for Assessing Insulation Condition in Aged Transformers. Energies 2016, 9, 367. [Google Scholar] [CrossRef]
- Fofana, I.; Hadjadj, Y. Electrical-Based Diagnostic Techniques for Assessing Insulation Condition in Aged Transformers. Energies 2016, 9, 679. [Google Scholar] [CrossRef]
- William, H.; Bartley, P.E. Analysis of Transformer Failures. In Proceedings of the International Association of Engineering Insurers 36th Annual Conference, Stockholm, Sweden, 15–17 September 2003. [Google Scholar]
- Oommen, T.V.; Prevost, T.A. Cellulose insulation in oil-filled power transformers: Part II maintaining insulation integrity and life. IEEE Electr. Insul. Mag. 2006, 22, 5–14. [Google Scholar] [CrossRef]
- Heathcote, M.J. A Practical Technology of the Power Transformer, 13th ed.; Elsevier Ltd.: Oxford, UK, 2007. [Google Scholar]
- Su, Q.; James, R.E. Condition Assessment of High Voltage Insulation in Power System Equipment; IET Power and Energy Series; Institution of Engineering and Technology (IET): London, UK, 2008; Volume 53. [Google Scholar]
- Pahlavanpour, B.; Eklund, M. Thermal ageing of mineral insulating oil and krafts paper. In Proceedings of the TechCon® 2003 Asia-Pacific Conference, Sidney, Australia, 7–9 May 2003. [Google Scholar]
- Fournié, R. Les Isolants en Électrotechnique: Essais, Mécanismes de Dégradation, Applications Industrielles; Eyrolles: Paris, France, 1990. [Google Scholar]
- Garcia, D.F.; Garcia, B.; Burgos, J.C. A review of moisture diffusion coefficients in transformer solid insulation-part 1: Coefficients for paper and pressboard. IEEE Electr. Insul. Mag. 2013, 29, 46–54. [Google Scholar] [CrossRef]
- Sparling, B.; Aubin, J. Assessing Water Content in Insulating Paper of Power Transformers. Available online: http://www.electricenergyonline.com/show_article.php?mag=44&article=333 (accessed on 21 July 2015).
- Nikjoo, R. Diagnostics of Oil-Impregnated Paper Insulation Systems by Utilizing Lightning and Switching Transients; KTH School of Electrical Engineering: Stockholm, Sweden, 2014. [Google Scholar]
- Zabeschek, S.; Strzala, H. Drying of High Voltage Power Transformers in the Field with a Mobile Vapour Phase Drying Equipment. Available online: http://www.weidmann-solutions.cn/huiyi/Seminar%202007%20Florida/2007zabeschek.pdf (accessed on 26 February 2018).
- Tariq, M. Estimating moisture in Power Transformers. In Proceedings of the Transformer Life Management Conference, Dubai, UAE, 22–23 October 2013. [Google Scholar]
- Lundgaard, L.E.; Hansen, W.; Linhjell, D.; Painter, T.J. Aging of oil-impregnated paper in power transformers. IEEE Trans. Power Deliv. 2004, 19, 230–239. [Google Scholar] [CrossRef]
- Bartels, M. We have the answer—Precise monitoring of the drying process for power transformers. Omicron Mag. 2012, 3, 40. [Google Scholar]
- Gavrilovs, G.; Sandra, V. Solid insulation drying of 110 kV paper-oil instrument transformers. Sci. J. Riga Tech. Univ. Power Electr. Eng. 2009, 25, 35–38. [Google Scholar] [CrossRef]
- Du, Y.; Zahn, M.; Lesieutre, B.C.; Mamishev, A.V.; Lindgren, S.R. Moisture equilibrium in transformer paper-oil systems. IEEE Electr. Insul. Mag. 1999, 15, 11–20. [Google Scholar] [CrossRef]
- Hall, C.W. The evolution and utilization of mathematical models for drying. Math. Model. 1987, 8, 1–6. [Google Scholar] [CrossRef]
- Doymaz, I.; Pala, M. The effects of dipping pretreatments on air-drying rates of the seedless grapes. J. Food Eng. 2002, 52, 413–417. [Google Scholar] [CrossRef]
- Chayjan, R.A.; Salari, K.; Abedi, Q.; Sabziparvar, A.A. Modeling moisture diffusivity, activation energy and specific energy consumption of squash seeds in a semi fluidized and fluidized bed drying. J. Food Sci. Technol. 2013, 50, 667–677. [Google Scholar] [CrossRef] [PubMed]
- García, D.F.; García, B.; Burgos, J.C.; García-Hernando, N. Determination of moisture diffusion coefficient in transformer paper using thermogravimetric analysis. Int. J. Heat Mass Transf. 2012, 55, 1066–1075. [Google Scholar] [CrossRef]
- Garcia, D.F.; Garcia, B.; Burgos, J.C.; Hernando, N.G. Experimental determination of the diffusion coefficient of water in transformer solid insulation. IEEE Trans. Dielectr. Electr. Insul. 2012, 19, 427–433. [Google Scholar] [CrossRef]
- Midilli, A.; Kucuk, H.; Yapar, Z. A New Model forsingle-layer drying. Dry. Technol. 2002, 20, 1503–1513. [Google Scholar] [CrossRef]
- A&D Company Limited. A&D’s Moisture Analyzers Instruction Manual; A&D Company Limited: Tokyo, Japan, 2004. [Google Scholar]
Figure 1.
Influence of weight on drying time (130 °C).

Figure 2.
Influence of temperature on the drying time of a weight of 10 g.

Figure 3.
Principle of the estimation of the real and residual moisture.
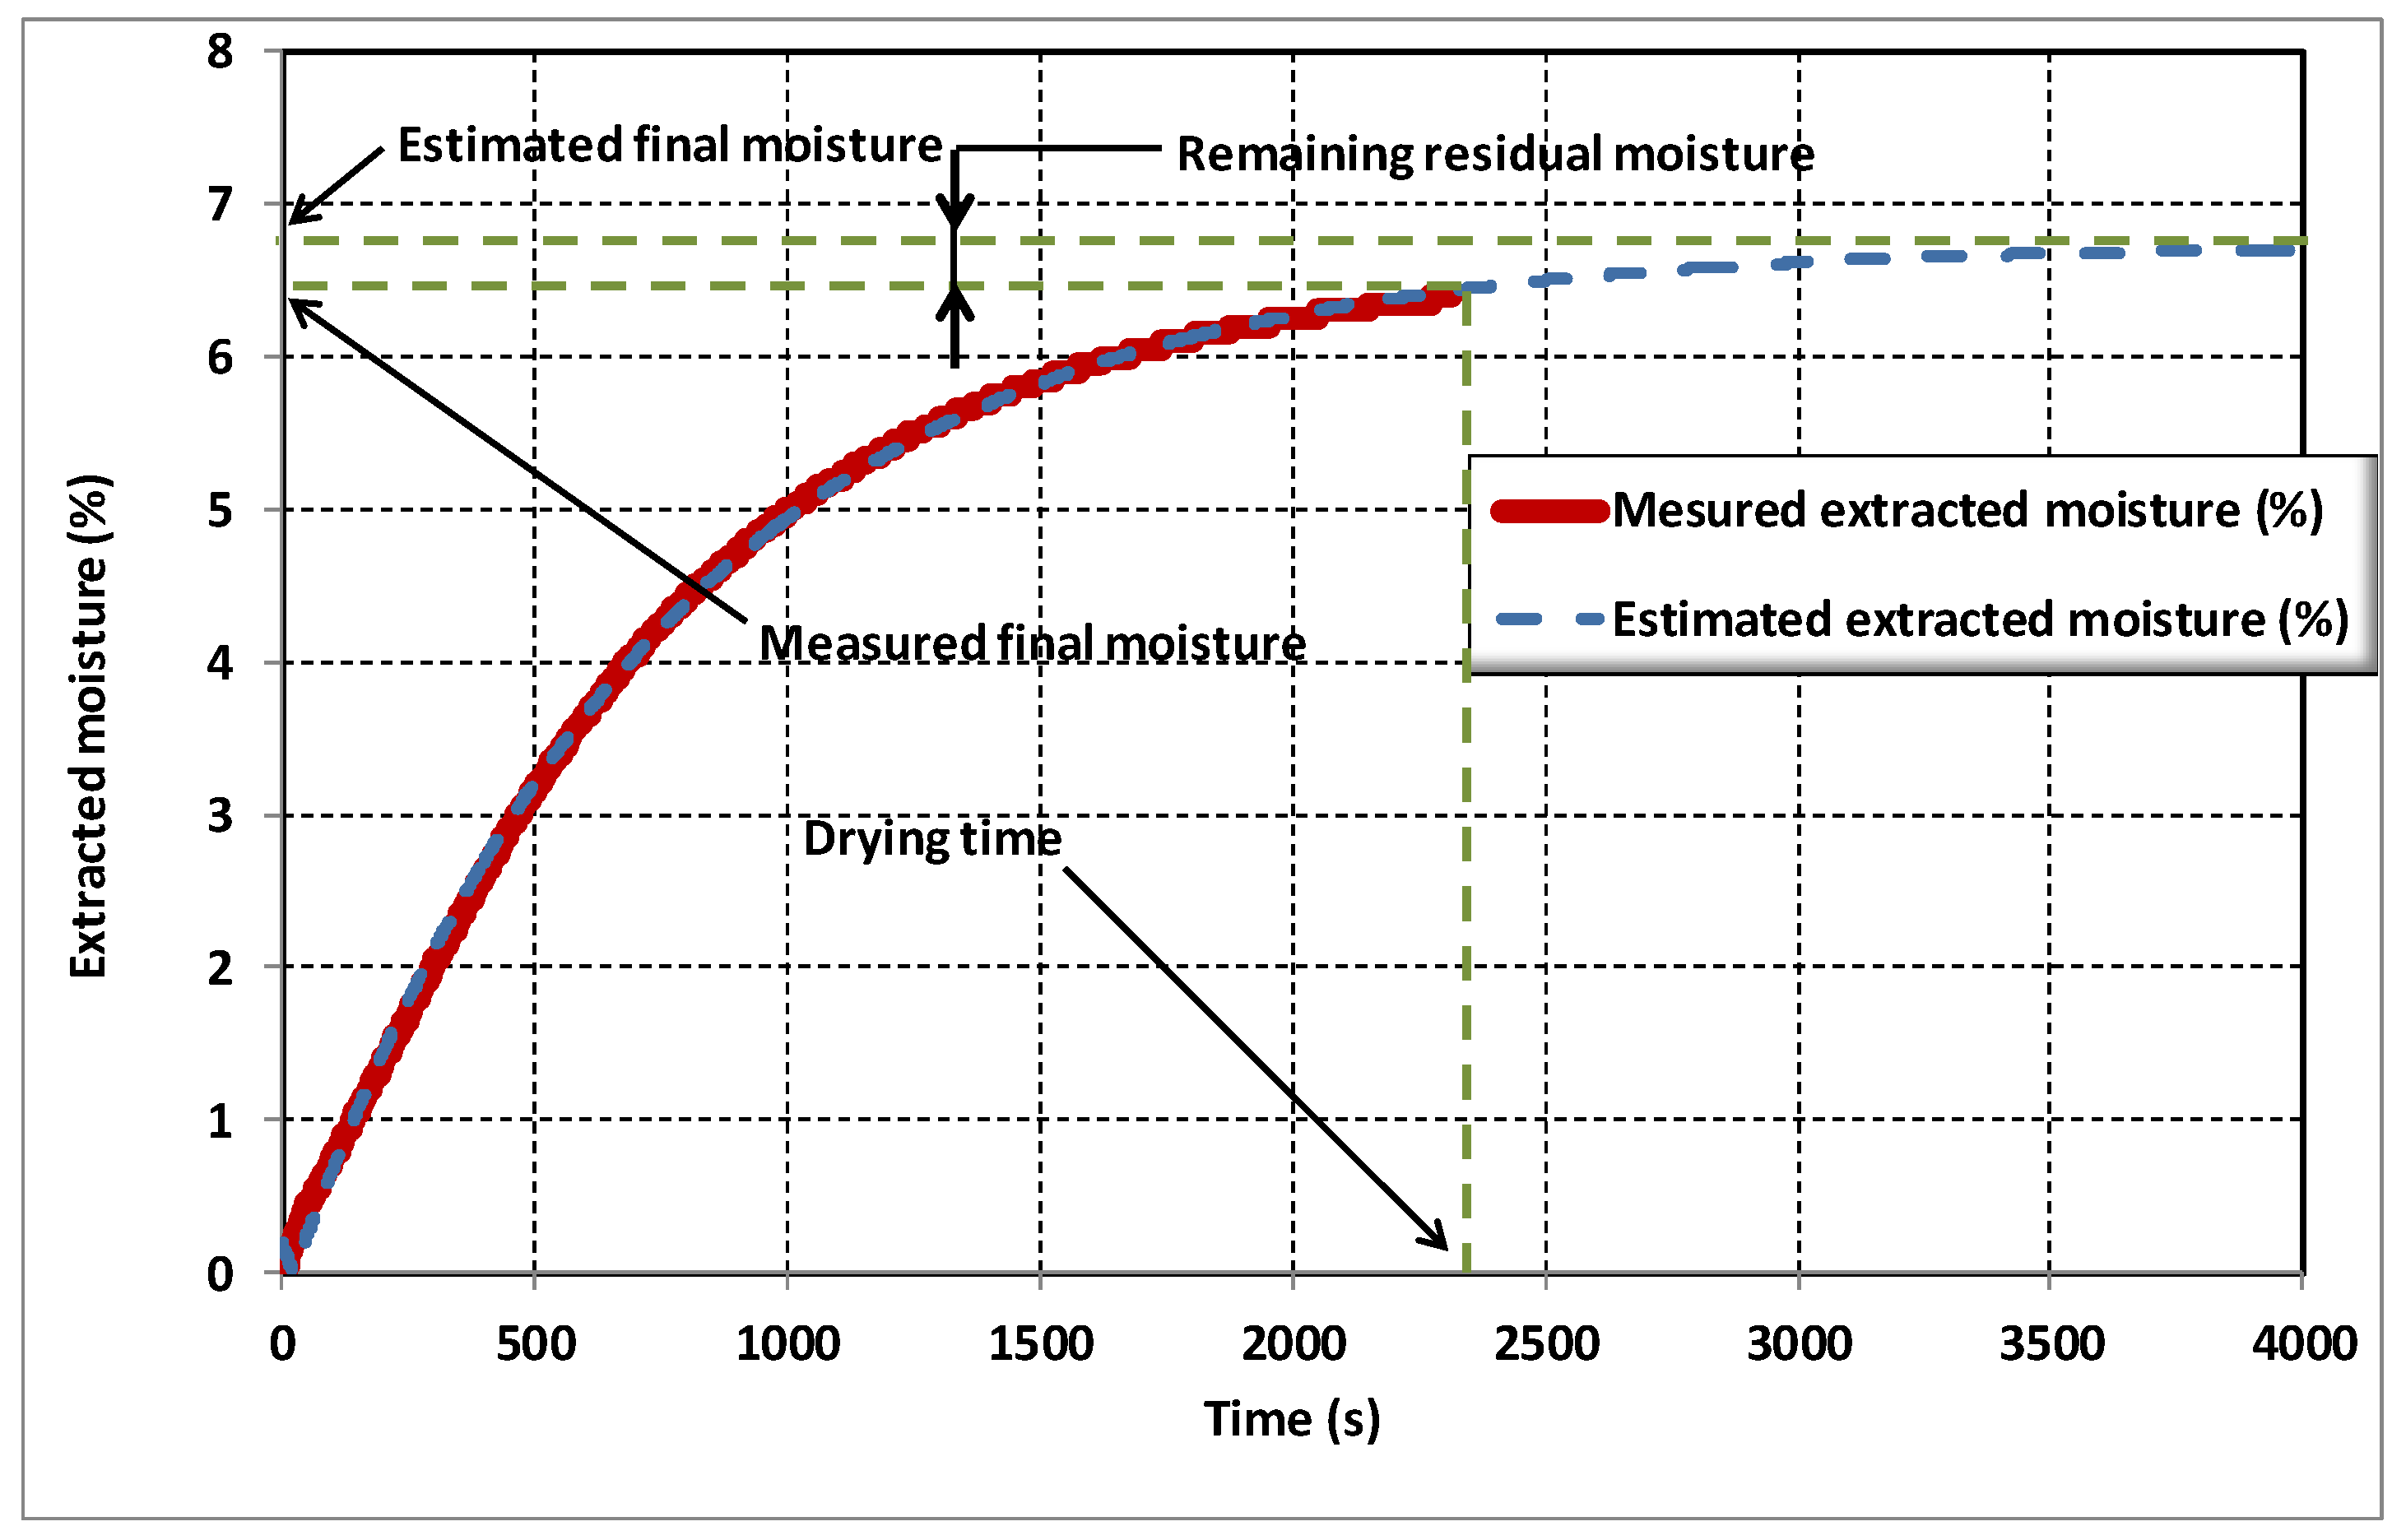
Figure 4.
Impact of drying time constant on residual moisture.

Figure 5.
The time constant evolution, depending on the paper weight and drying temperature.

Figure 6.
The slope of the linear approximation curves as a function of temperature.

Figure 7.
The approximation function of the slopes of Figure 6 and Figure 8 as a function of temperature.
Figure 8.
Drying time measured and those determined by the established mathematical model for different drying tests.
Figure 8.
Drying time measured and those determined by the established mathematical model for different drying tests.

Table 1.
Mathematical models applied to drying curves [23].
Table 1.
Mathematical models applied to drying curves [23].
| Model Name | Model Expression |
|---|---|
| Newton | |
| Page | |
| Modified Page 1 | |
| Modified Page 2 | |
| Henderson and Pabis | |
| Logarithmic | |
| Two-term | |
| Two-term exponential | |
| Wang and Singh | |
| Diffusion approach | |
| Modified Henderson and Pabis | |
| Verma et al. | |
| Midilli-Kucuk |
Table 2.
Calculated results of the drying time constant and calculated moisture.
| Weight (g) | Measured Moisture (%) | Calculated Moisture (%) | Time Constant (s) |
|---|---|---|---|
| Drying Temperature: 70 °C | |||
| 0.658 | 6.45 | 6.51 | 121.97 |
| 1.258 | 6.10 | 6.03 | 166.97 |
| 2.558 | 5.75 | 5.75 | 506.91 |
| 5.288 | 5.40 | 5.58 | 1009.31 |
| 10.286 | 5.25 | 5.84 | 2142.34 |
| 20.808 | 4.70 | 5.67 | 3323.47 |
| 25.642 | 4.45 | 5.82 | 4123.22 |
| 30.634 | 4.05 | 5.43 | 4461.33 |
| 35.096 | 4.05 | 5.63 | 4931.61 |
| Drying Temperature: 90 °C | |||
| 0.63 | 6.55 | 6.49 | 40.29 |
| 1.282 | 6.20 | 6.16 | 86.63 |
| 2.53 | 6.15 | 6.20 | 228.24 |
| 4.912 | 6.10 | 6.37 | 472.79 |
| 9.892 | 5.90 | 6.29 | 1136.10 |
| 20.348 | 5.45 | 6.05 | 1981.50 |
| 31.22 | 5.05 | 6.07 | 2832.05 |
| 35.856 | 4.70 | 6.06 | 3713.64 |
| Drying Temperature: 110 °C | |||
| 0.658 | 7.15 | 7.11 | 20.98 |
| 1.268 | 7.00 | 6.97 | 49.64 |
| 2.514 | 6.50 | 6.79 | 148.23 |
| 5.168 | 6.60 | 6.85 | 347.95 |
| 10 | 6.40 | 6.74 | 739.33 |
| 20.11 | 6.00 | 6.90 | 1908.63 |
| 30.11 | 7.10 | 8.09 | 2446.64 |
| 35.432 | 6.95 | 8.19 | 3175.70 |
| Drying Temperature: 130 °C | |||
| 0.638 | 7.60 | 7.58 | 17.96 |
| 1.29 | 7.30 | 7.31 | 37.22 |
| 2.454 | 6.95 | 7.09 | 110.06 |
| 4.978 | 6.75 | 7.03 | 277.48 |
| 9.942 | 6.65 | 7.25 | 589.34 |
| 20.094 | 6.50 | 7.24 | 1131.06 |
| 30.042 | 6.20 | 7.07 | 1601.35 |
| 35.45 | 6.10 | 6.92 | 1927.77 |
| 40.13 | 5.40 | 6.16 | 2156.22 |
Table 3.
Drying times measured and those determined by the mathematical model established for different drying tests.
Table 3.
Drying times measured and those determined by the mathematical model established for different drying tests.
| Weight (g) | Measured Duration (min) | Calculated Duration (min) |
|---|---|---|
| Drying Temperature: 70 °C | ||
| 0.658 | 7.80 | 10.32 |
| 1.258 | 15.40 | 13.04 |
| 2.558 | 32.80 | 29.80 |
| 5.288 | 50.00 | 47.24 |
| 10.286 | 78.90 | 75.06 |
| 20.808 | 94.20 | 90.42 |
| 25.642 | 101.00 | 99.16 |
| 30.634 | 101.00 | 96.24 |
| 35.096 | 105.00 | 101.23 |
| Drying Temperature: 90 °C | ||
| 0.63 | 4.50 | 4.15 |
| 1.282 | 8.60 | 7.74 |
| 2.53 | 16.70 | 16.74 |
| 4.912 | 26.60 | 29.15 |
| 9.892 | 52.70 | 53.20 |
| 20.348 | 74.50 | 73.17 |
| 31.22 | 86.40 | 87.85 |
| 35.856 | 94.80 | 98.30 |
| Drying Temperature: 110 °C | ||
| 0.658 | 3.82 | 2.42 |
| 1.268 | 6.40 | 5.00 |
| 2.514 | 11.73 | 12.16 |
| 5.168 | 22.00 | 23.65 |
| 10 | 38.53 | 40.76 |
| 20.11 | 67.62 | 75.81 |
| 30.11 | 89.50 | 93.56 |
| 35.432 | 101.00 | 108.31 |
| Drying Temperature: 130 °C | ||
| 0.638 | 2.98 | 2.14 |
| 1.29 | 4.43 | 3.96 |
| 2.454 | 8.65 | 9.65 |
| 4.978 | 16.90 | 20.03 |
| 9.942 | 28.58 | 35.44 |
| 20.094 | 47.70 | 55.69 |
| 30.042 | 60.20 | 68.94 |
| 35.45 | 70.00 | 76.37 |
| 40.13 | 76.20 | 77.20 |
© 2018 by the authors. Licensee MDPI, Basel, Switzerland. This article is an open access article distributed under the terms and conditions of the Creative Commons Attribution (CC BY) license (http://creativecommons.org/licenses/by/4.0/).
Share and Cite
MDPI and ACS Style
Betie, A.; Meghnefi, F.; Fofana, I.; Yeo, Z. Modeling the Insulation Paper Drying Process from Thermogravimetric Analyses. Energies 2018, 11, 517. https://doi.org/10.3390/en11030517
AMA Style
Betie A, Meghnefi F, Fofana I, Yeo Z. Modeling the Insulation Paper Drying Process from Thermogravimetric Analyses. Energies. 2018; 11(3):517. https://doi.org/10.3390/en11030517
Chicago/Turabian StyleBetie, Amidou, Fethi Meghnefi, Issouf Fofana, and Zie Yeo. 2018. "Modeling the Insulation Paper Drying Process from Thermogravimetric Analyses" Energies 11, no. 3: 517. https://doi.org/10.3390/en11030517
Note that from the first issue of 2016, this journal uses article numbers instead of page numbers. See further details here.