A Two-Zone Combustion Model for Knocking Prediction of Marine Natural Gas SI Engines

College of Power and Energy Engineering, Harbin Engineering University, Harbin 150001, China
*
Author to whom correspondence should be addressed.
Energies 2018, 11(3), 561; https://doi.org/10.3390/en11030561
Submission received: 19 January 2018
/
Revised: 1 March 2018
/
Accepted: 2 March 2018
/
Published: 6 March 2018
(This article belongs to the Special Issue Recent Advances in Internal Combustion Engines Operation and Emissions)
Abstract
:The further thermal efficiency improvement of marine natural gas engine is constrained by a knocking phenomenon that commonly occurs in gas-fueled spark-ignited engines. It plays an important role to investigate how the knocking occurs and how to predict it based on the engine simulation model. In this paper, a two-zone model is developed to provide the prediction of knocking performance and NO emission, which is verified by engine test bed data from a transformed marine natural gas spark ignition (SI) engine. Cylindrical division theory is used to describe the shape of the two zones to decrease the computational cost, as well as a basic mechanism for NO concentration calculation. In order to solve the volume balance, three boundary parameters are introduced to determine the initial condition and mass flow between the two zones. Furthermore, boundary parameters’ variation and knocking factor (compression ratio and advanced ignition angle) will be discussed under different working conditions. Result shows that the two-zone model has sufficient accuracy in predicting engine performance, NO emission and knocking performance. Both the increasing compression ratio and advanced ignition angle have a promoting effect on knocking probability, knocking timing and knocking intensity. The knocking phenomenon can be avoided in the targeted natural gas SI engine by constraining the compression ratio smaller than 14 and advanced ignition angle later than 30° before top dead center (BTDC).
1. Introduction
Natural Gas (NG) is considered as an appropriate alternative for internal combustion engines due to its cleaner combustion, relative lower cost and rich reserves [1,2]. It is generally applied in the form of mono- or dual-fuel engines, such as spark ignition natural gas engines, natural gas/diesel engines and CNG-H2 engines [3,4,5]. For spark ignition (SI) natural gas engines, the further thermal efficiency improvement is constrained by a knocking phenomenon that commonly occurs in gas-fueled SI engines [6]. Knocking is the noise transmitted through the engine structure when a portion of the end-gas (the mixture of fuel, air and residual gas) ignites spontaneously before the propagating flame arrival. When this abnormal combustion process takes place, there will be an extremely rapid chemical energy release in the end-gas, resulting in high local pressure and the propagation of pressure waves of substantial amplitude across the combustion chamber, which may cause the chamber to resonate at its natural frequency [7]. Knocking primarily occurs under wild-open-throttle operating conditions, which leads to a direct constraint on engine performance. In addition, since knocking probability increases with higher temperature and pressure of the end-gas, it also constrains the engine efficiency by limiting the maximum compression ratio. Therefore, it is important for an engine designer to achieve the desired normal combustion behavior while holding the engine propensity to knock at a minimum.
Two broad categories of experimental based methods are used to detect the knocking phenomenon in a certain natural gas engine: the former one is based on direct measurement, like an intensified charge coupled detector (ICCD) camera and Laser-induced Fluorescence (LIF) imaging [8,9]; other methods [10,11] are based on indirect measurement such as in-cylinder pressure analysis, cylinder block vibration, exhaust gas temperature, etc. On the other hand, simulation models enable engineers to explore the details comprehensively during the design period in order to determine the best case, saving research time and development cost. In general, numerical simulation of the natural gas engine working process is classified as follows: the mean value model, zero-dimensional model, quasi-dimensional model and multi-dimensional model [12]. The mean value model is not primarily intended for engine development, but it is efficient for integrated system research, thus it is usually based on a large amount of engine test data and has scarcely no ability to predict [13,14]. For knocking prediction simulation models, the main objective is to characterize the end-gas temperature, which has a direct effect on knocking occurring. It is difficult for the zero-dimensional model to achieve this goal since the in-cylinder temperature and species concentrations are assumed to be uniform throughout the cylinder [15]. The multi-dimensional simulation model (or Computational Fluid Dynamics model, CFD) provides most details of in-cylinder parameters, while it is usually time-consuming and hard to implement [16]. The quasi-dimensional model is a kind of simplified phenomenological model that divides the combustion chamber into several zero-dimensional zones according to the distribution pattern of the flame position or injection space. In each zone, certain physical and chemical processes are considered, like fuel-air mixing, flame propagation and species concentration changes, which determine the temperature and pressure in each zone. Thus, the quasi-dimensional model does better work in balancing low computational cost and high prediction accuracy [17,18].
The two-zone model is considered to be the simplest quasi-dimensional model and usually consists of a burnt zone and an unburnt zone. For diesel engines, Hohlbaum [19] separates the in-cylinder space into two cylindrical zones by a flat flame front, in which the primary oxidation is assumed to take place until equilibrium, i.e., the components O, H, O2, H2O, CO, CO2 and OH are in chemical equilibrium. Heider [20] adopted another way to divide the combustion chamber, a drop-shaped reaction zone surrounded by the fuel spray boundary and an unburnt gas zone occupying the remaining volume. The air–fuel ratio in reaction zone is assumed to be constant throughout the working cycle, thus the mass change in reaction zone is completely determined by the heat release rate. Rakopoulos [21] built a two-zone combustion model of a diesel engine with an upgraded jet mixing sub-model, in which the burnt zone is further divided into several sub-zones depending on the number of injector nozzle holes. Gonca [22,23] used a zero-dimensional two-zone combustion model, which is divided into two zones as burnt and unburnt gas regions, to calculate nitric oxide (NO) emission, torque, brake power, brake efficiency and specific fuel consumption of a Miller cycled diesel engine. For gas engines, Fiveland and Assanis developed a two-zone model for homogeneous charge compression ignition (HCCI)combustion engines, which couples an adiabatic core zone and a boundary layer heat transfer zone [24]. Their research integrates complex chemical kinetics with models of turbulence-based heat transfer and gas exchange processes for a four-stroke cycle. It provides boundary layer thickness and mass fraction for better hydrocarbon quenching prediction. Ibrahim and Bari [25] compared exhaust gas recirculation (EGR) and lean-burn strategies employed in a natural gas SI engine using a two-zone model, in which the burnt zone was shaped by the spherical flame. A turbulent flame propagation model [26] was applied to obtain the explicit relations for the flame development angle and rapid burning angle as function of engine design and operating variables. Galindo [27] characterized a two-zone sub-model for the gas phase in a three-zone diesel engine model, in which the mass and energy balance between burnt zone and unburnt zone can also be theoretically applied to gas engine. Zhang [28] described a two-zone homogeneous charge compression ignition (HCCI) combustion sub-model in the hardware-in-the-loop (HIL) simulation environment, where the in-cylinder charge is divided into the well-mixed and unmixed zones as the result of charge mixing. Simplified fluid dynamics are used to predict the residual gas fraction before the combustion phase starts, which defines the mass of the unmixed zone, during real-time simulations. Reyes [29] developed a two-zone thermodynamic combustion diagnosis model to analyze the combustion process and cycle-to-cycle variations in a spark ignition engine fueled with natural gas/hydrogen mixtures. The two-zone model considers a spherical flame front centered at the spark plug, and solves the intersection of the flame front with the piston, cylinder head and cylinder wall, in order to provide the values of the flame radius corresponding to the burned mass volume and the surfaces for heat to the piston and walls. In conclusion, two-zone models work better in natural gas SI engines than in diesel engines since the basic space division theory is what happens exactly in SI engine combustion chambers as the flame propagates throughout the cylinder and separates the combustion chamber. However, most researchers put emphasis on the spherical flame propagation process and rely on complicated reaction mechanisms to obtain the emission concentration, which would increase the model complexity and computational cost to some extent.
In this paper, an in-cylinder process model of natural gas SI engine is built into the MATLAB/SIMULINK (R2012a, MathWorks, Natick, MA, USA) environment [30], which provides the prediction of engine performance, NO emission and knocking performance. The model consists of a single-zone compression sub-model, a two-zone combustion sub-model and a single-zone expansion sub-model. The overall computational cost is decreased by using cylindrical division theory and a basic reaction mechanism when developing the two-zone combustion sub-model. The heat release rate is firstly calculated from the measured in-cylinder pressure and the obtained Vibe parameters will be used to simulate the energy release of natural gas. After model validation with engine test data, the effect of boundary parameters variation and knocking factors on engine performance will be discussed under different engine working conditions.
2. Description of the Simulation Model
2.1. Two-Zone Simulation Model
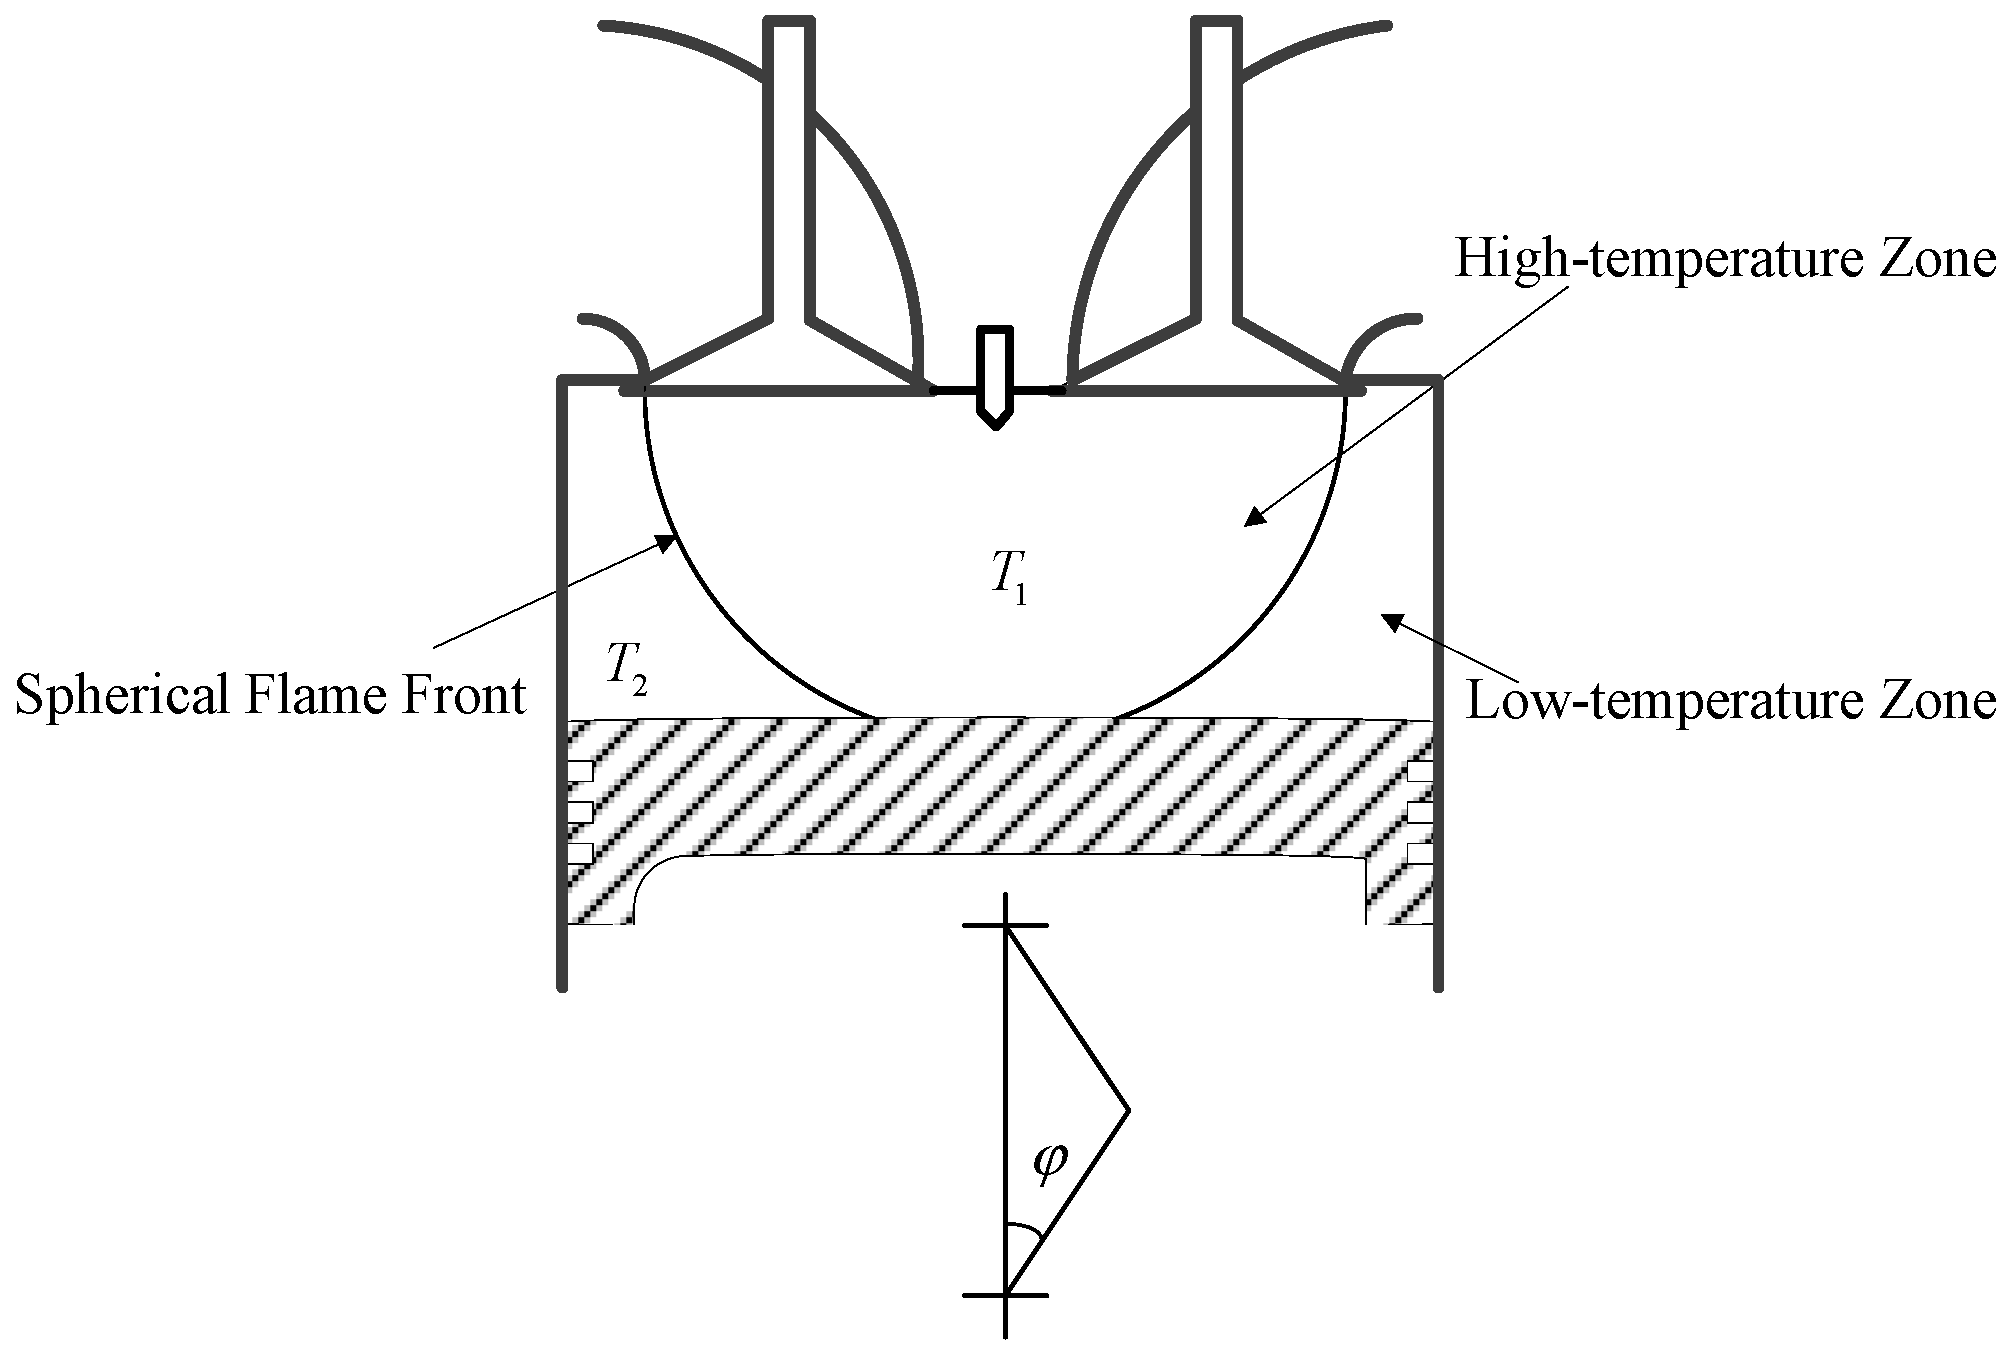
For physical combustion process of spark-ignited engines, the in-cylinder space is separated as a high-temperature zone and a low-temperature zone by the spherical flame front, as shown in Figure 1.
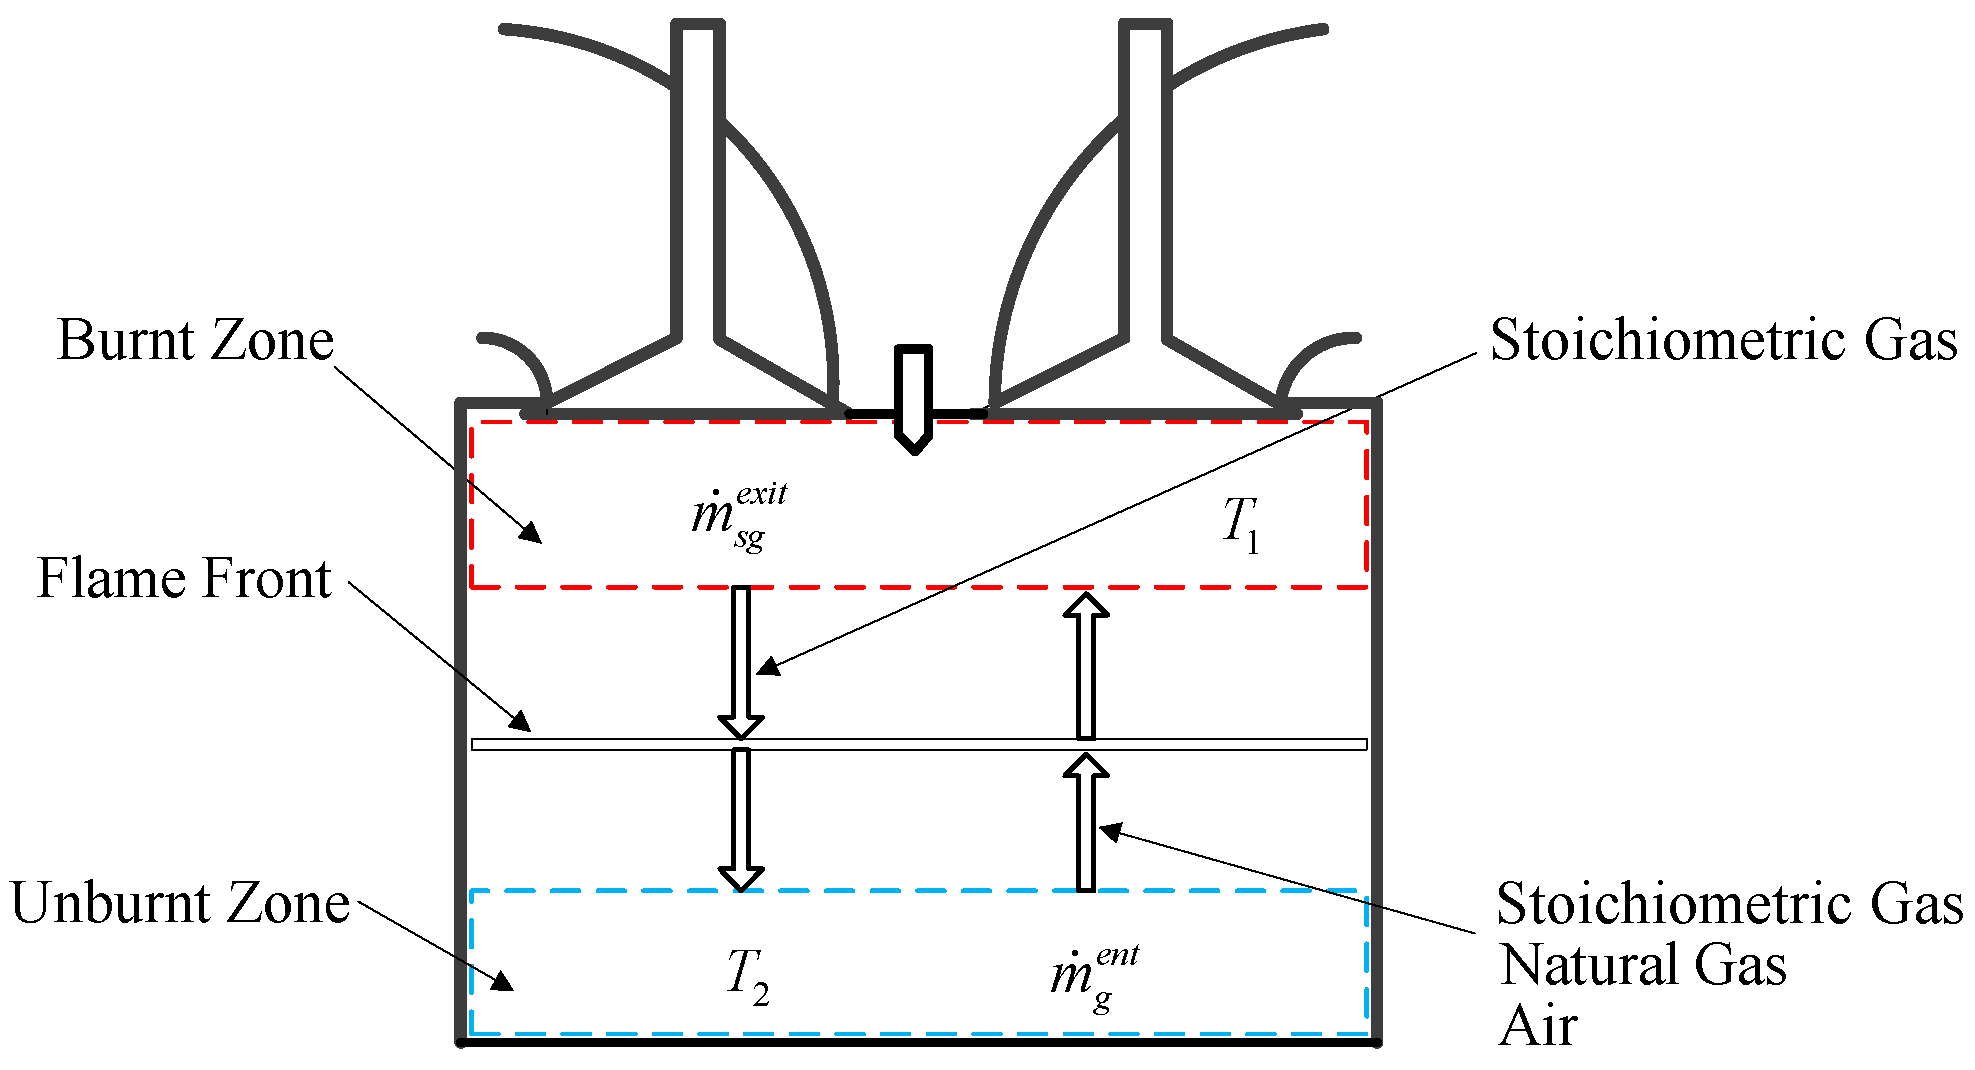
Since heat release rate is calculated from measured in-cylinder pressure, and characterizing spherical zone is not necessary when heat release acquisition does not rely on flame propagation speed. To reduce the computational cost, the in-cylinder space is considered to consist of two cylindrical zones, namely the burnt zone and unburnt zone, as depicted in Figure 2. Each zone is characterized as a closed system from inlet valve close to exhaust valve open, during which the pressure and temperature are uniform as well as the species concentrations. represents the stoichiometric gas flow leaving the burnt zone. is the mixed gas flow entering the burnt zone including natural gas, air and stoichiometric gas.
The two-zone thermodynamic model is built on certain assumptions, as outlined as follows:
- The space inside the cylinder is discretized in two cylindrical zones—burnt zone and unburnt zone;
- The pressure at any time is uniform throughout the cylinder;
- The in-cylinder temperature is separated as burnt temperature and unburnt temperature, which is uniform in their own zone. There is no heat transfer between the two zones;
- The unburnt zone is composed of natural gas, air and stoichiometric gas, while the burnt zone is entirely composed of stoichiometric gas. Combustion occurs in the flame front, which is negligible in volume;
- Gas in each zone is assumed to be homogenous and the basic species are considered as ideal but non-perfect gases. Thus, the thermal properties of the basic in-cylinder gases are functions of in-cylinder temperature.
According to these assumptions, sub-models for each zone are zero-dimensional. The subscripts 1 and 2 will be used to describe parameters related to burnt zone and unburnt zone, respectively. Equation (1) is the basic equation of the simulation model for burnt zone, which is derived from the First Law of Thermodynamics by separating temperature terms:
Energy conservation in unburnt zone is presented as Equation (2), in which the terms are similar to Equation (1) excluding the combustion heat flow:
where m1 and m2 are separately the gas mass in burnt zone and unburnt zone; cv is the specific heat in constant volume; T is the gas temperature; is the mass flow from unburnt zone to burnt zone; is enthalpy of the gas that leaves unburnt zone; ug is thermodynamic energy of gas; is the mass flow from burnt zone to unburnt zone; is the enthalpy of the gas that leaves burnt zone; ucomb is combustion heat flow; ξ is the combustion rate; Q1->wall is heat loss flow to cylinder wall in burnt zone; Q2->wall is heat loss flow to cylinder wall in unburnt zone; p is in-cylinder gas pressure; and V is in-cylinder volume.
2.2. Volume Balance
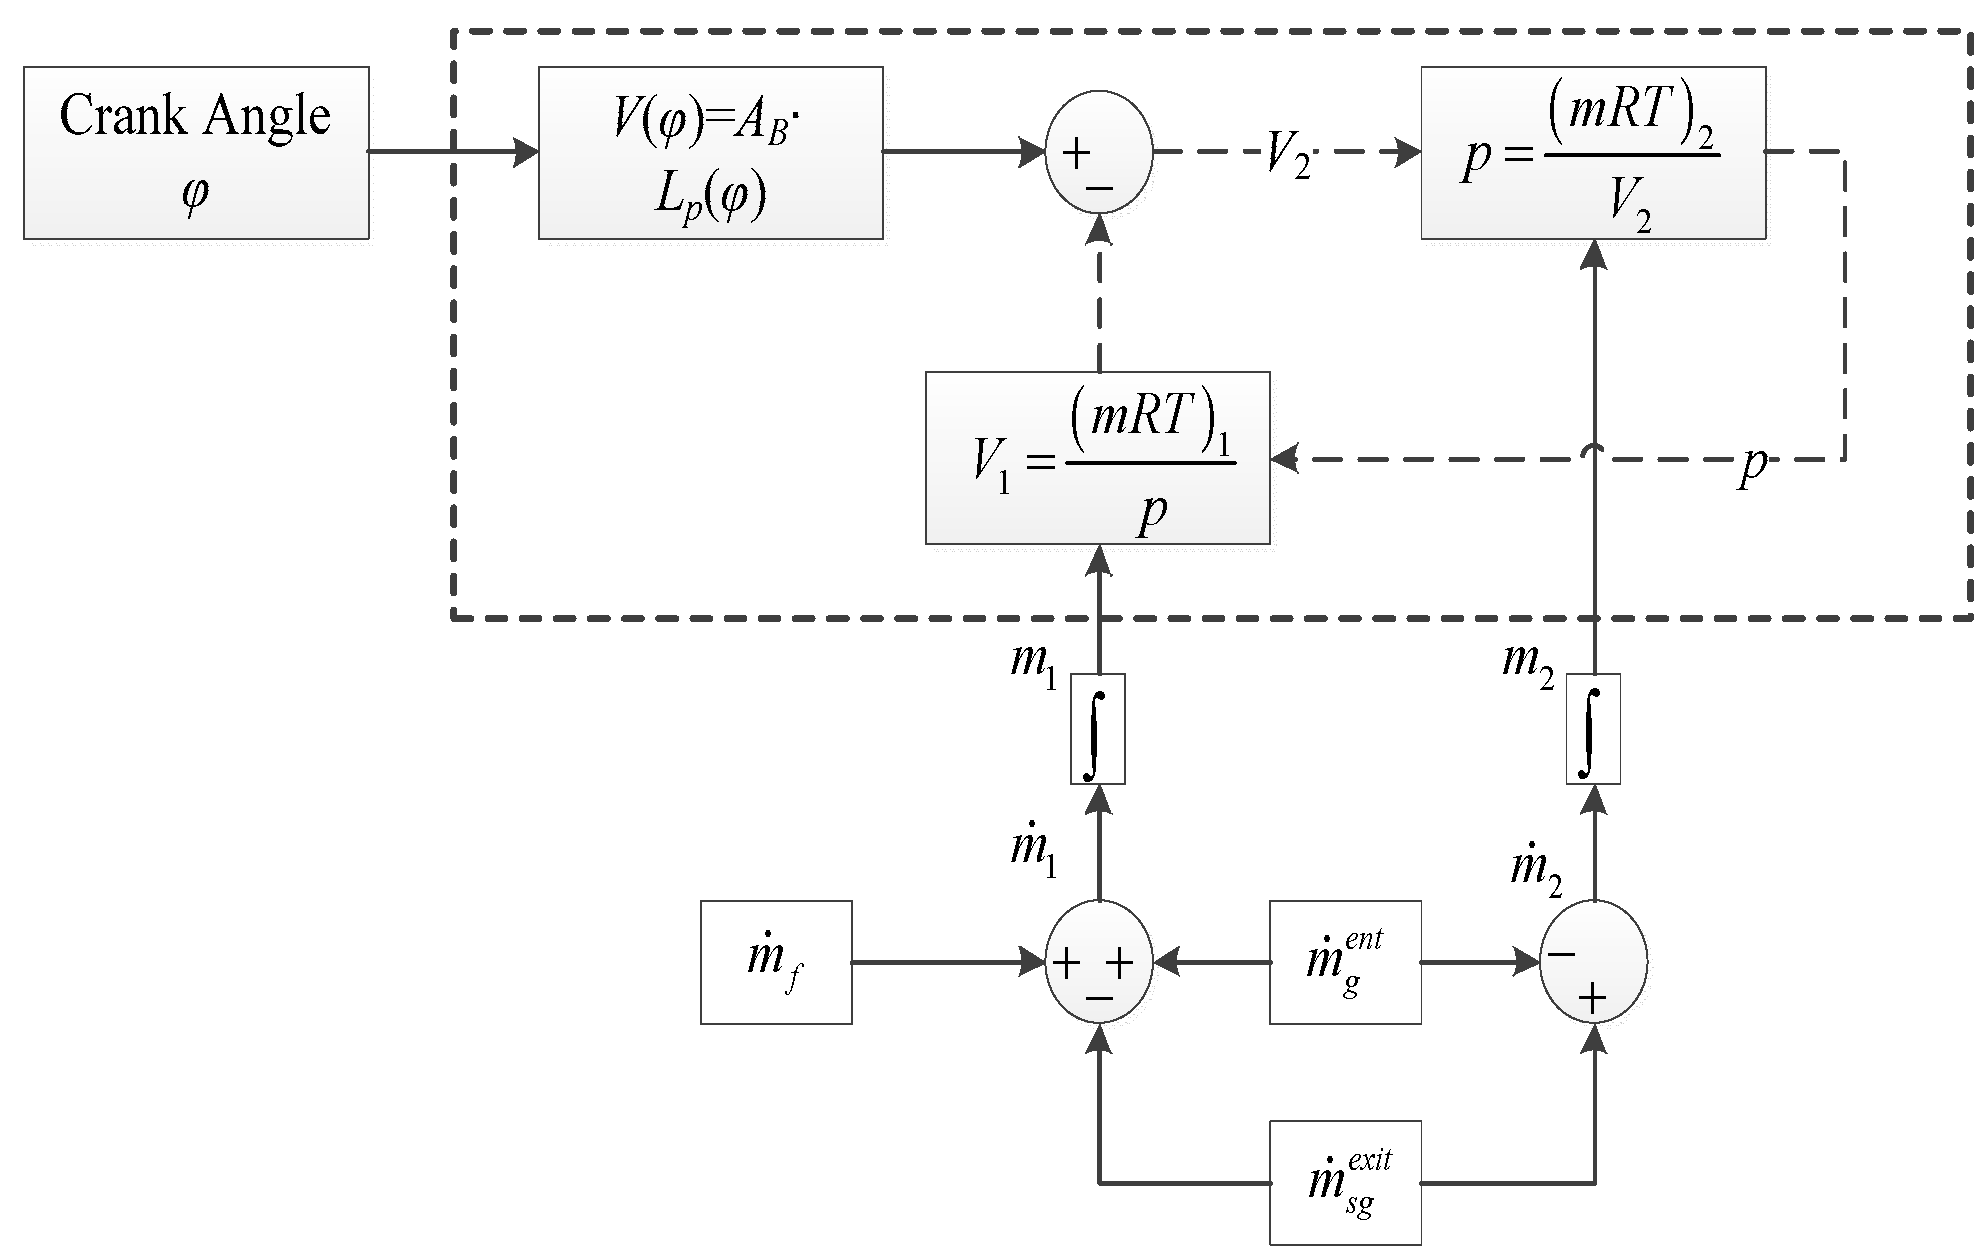
During the in-cylinder process, since the volume ratio of burnt zone and unburnt zone changes once the combustion begins, the volume balance is important to calculate each zone’s volume and the in-cylinder pressure. Figure 3 illustrates the calculation flow of volume balance, in which the Ideal Gas Law and geometry of the engine are used. Galindo [27] introduced three boundary parameters to describe the mass and energy flow between two gas phase zones in his three-zone diesel engine model, which guides solving the volume balance of the two-zone natural gas engine model in this paper.
The initial mass coefficient Smass is defined as the ratio of the initial mass of burnt zone and the overall cylinder zone:
where is the initial mass of burnt zone; is the initial mass of unburnt zone; and m0 is the mass of the whole cylinder at inlet valve close moment (kg).
The entrained rate represents the mass flowing from unburnt zone to burnt zone. It is determined by the stoichiometry of fuel σ and the combustion rate ξ on the assumption that the unburnt zone is composed of natural gas and air. In fact it is inevitable for the stoichiometric gas to enter the unburnt zone during the mass exchange process between the two zones. The entrainment factor λent is introduced to account for the existence of stoichiometric gas in the unburnt zone and the possibility that entrained air could be more than or less than the stoichiometric amount. Then, the entrained rate can be calculated by Equation (5):
Referring to the literature [19,20], on the one hand, in the research of Holhbaum, all the produced gas leaves the burnt zone, and, on the other hand, in the Heider model, the produced stoichiometric gas stays in the burnt zone. Therefore, the Heider–Holhbaum factor SHH [27] is defined as the quotient between the stoichiometric gas flow leaving the burnt zone and the stoichiometric gas production rate. Then, the mass flow of stoichiometric gas leaving the burnt zone can be worked out according to Equation (6):
2.3. Gas Properties
The ‘specific heat of combustion’ can be calculated by the internal energy of fuel, air and stoichiometric gas in Equation (7):
where uf, ua, and usg is the specific internal energy of diesel, air and stoichiometric gas (J/kg).
Gas properties of the mixtures are functions of in-cylinder temperature and the mixture fraction since each species are considered as ideal but non-prefect gases in the model. Thus, the specific heat in constant volume of in-cylinder gas can be calculated according to Equation (8). Specific internal energy, specific enthalpy and gas constant can be figured out in the same way:
where xa, xf, and xsg is the mass fraction of air, natural gas and stoichiometric gas in each zone; cv,a, cv,f, and cv,sg is the specific heat in constant volume of air, natural gas and stoichiometric gas (J/kg/K).
2.4. Knocking Model
According to the Otto principle operating window, the operation zone of natural gas SI engine gets narrower sharply when Brake Mean Effective Pressure (BMEP) is further promoted [31]. Figure 4 shows the Otto principle operation window of the Wärtsilä 9L50DF engine when it operates in dual-fuel mode [32]. The optimum performance point is determined by knocking limiting, misfiring limit, thermal efficiency and NOx emission. The knocking phenomenon is one of the most significant factors that limits the performance and thermal efficiency of SI engine, which is caused by spontaneous ignition in the end-gas zone before the flame front arrives. When this abnormal combustion process takes place, there is an extremely rapid release of the chemical energy in the end-gas, causing very high local pressures and the propagation of pressure waves of substantial amplitude across the combustion chamber.
The probability and corresponding position of knocking can be obtained by Equation (9). According to Heywood [7], knocking occurs when the integration in Equation (9) reaches unity:
where τ is the induction time at the instantaneous temperature and pressure for the mixture, t is the elapsed time from the start of the end-gas compression process (t = 0), and ti is the time of auto-ignition:
where τ is in milliseconds, p is absolute pressure in atmosphere, and T is in kelvin. ON is the appropriate octane number of the fuel. If the temperature and pressure time history of the end-gas during an individual cycle are known, Equations (9) and (10) can be used to determine whether auto-ignition occurs before the normally propagating flame consumes the end-gas.
2.5. NOx Model
The NOx sub-model is developed in this two-zone model to describe the NOx formation and consumption. While nitric oxide (NO) and nitrogen dioxide (NO2) are usually grouped together as NOx emissions, nitric oxide is the predominant oxide of nitrogen produced inside the cylinder. The NO formation has been modeled using a well-known extended Zeldovich oxidation mechanism [7] with three reactions (Equation (11)). In this equilibrium approach, it is assumed that the residence time in the flame is short enough to be neglected so that the NO formation only takes place in the burnt zone:
Since the third equilibrium reaction in Equation (11) contributes less to NO formation and slows down the calculation speed of the overall model, only the first two reactions are used to calculate NO concentration, i.e., the basic Zeldovich mechanism. According to Equation (12), NO concentration can be calculated with temperature assuming that main in-cylinder species reach equilibrium in a negligible time:
where the symbol bracket represents the concentrations of different species (mol/cm3), and kf1, kb1, kf2, and kb2 are temperature related reaction rate coefficients (cm3/(mol·s)).
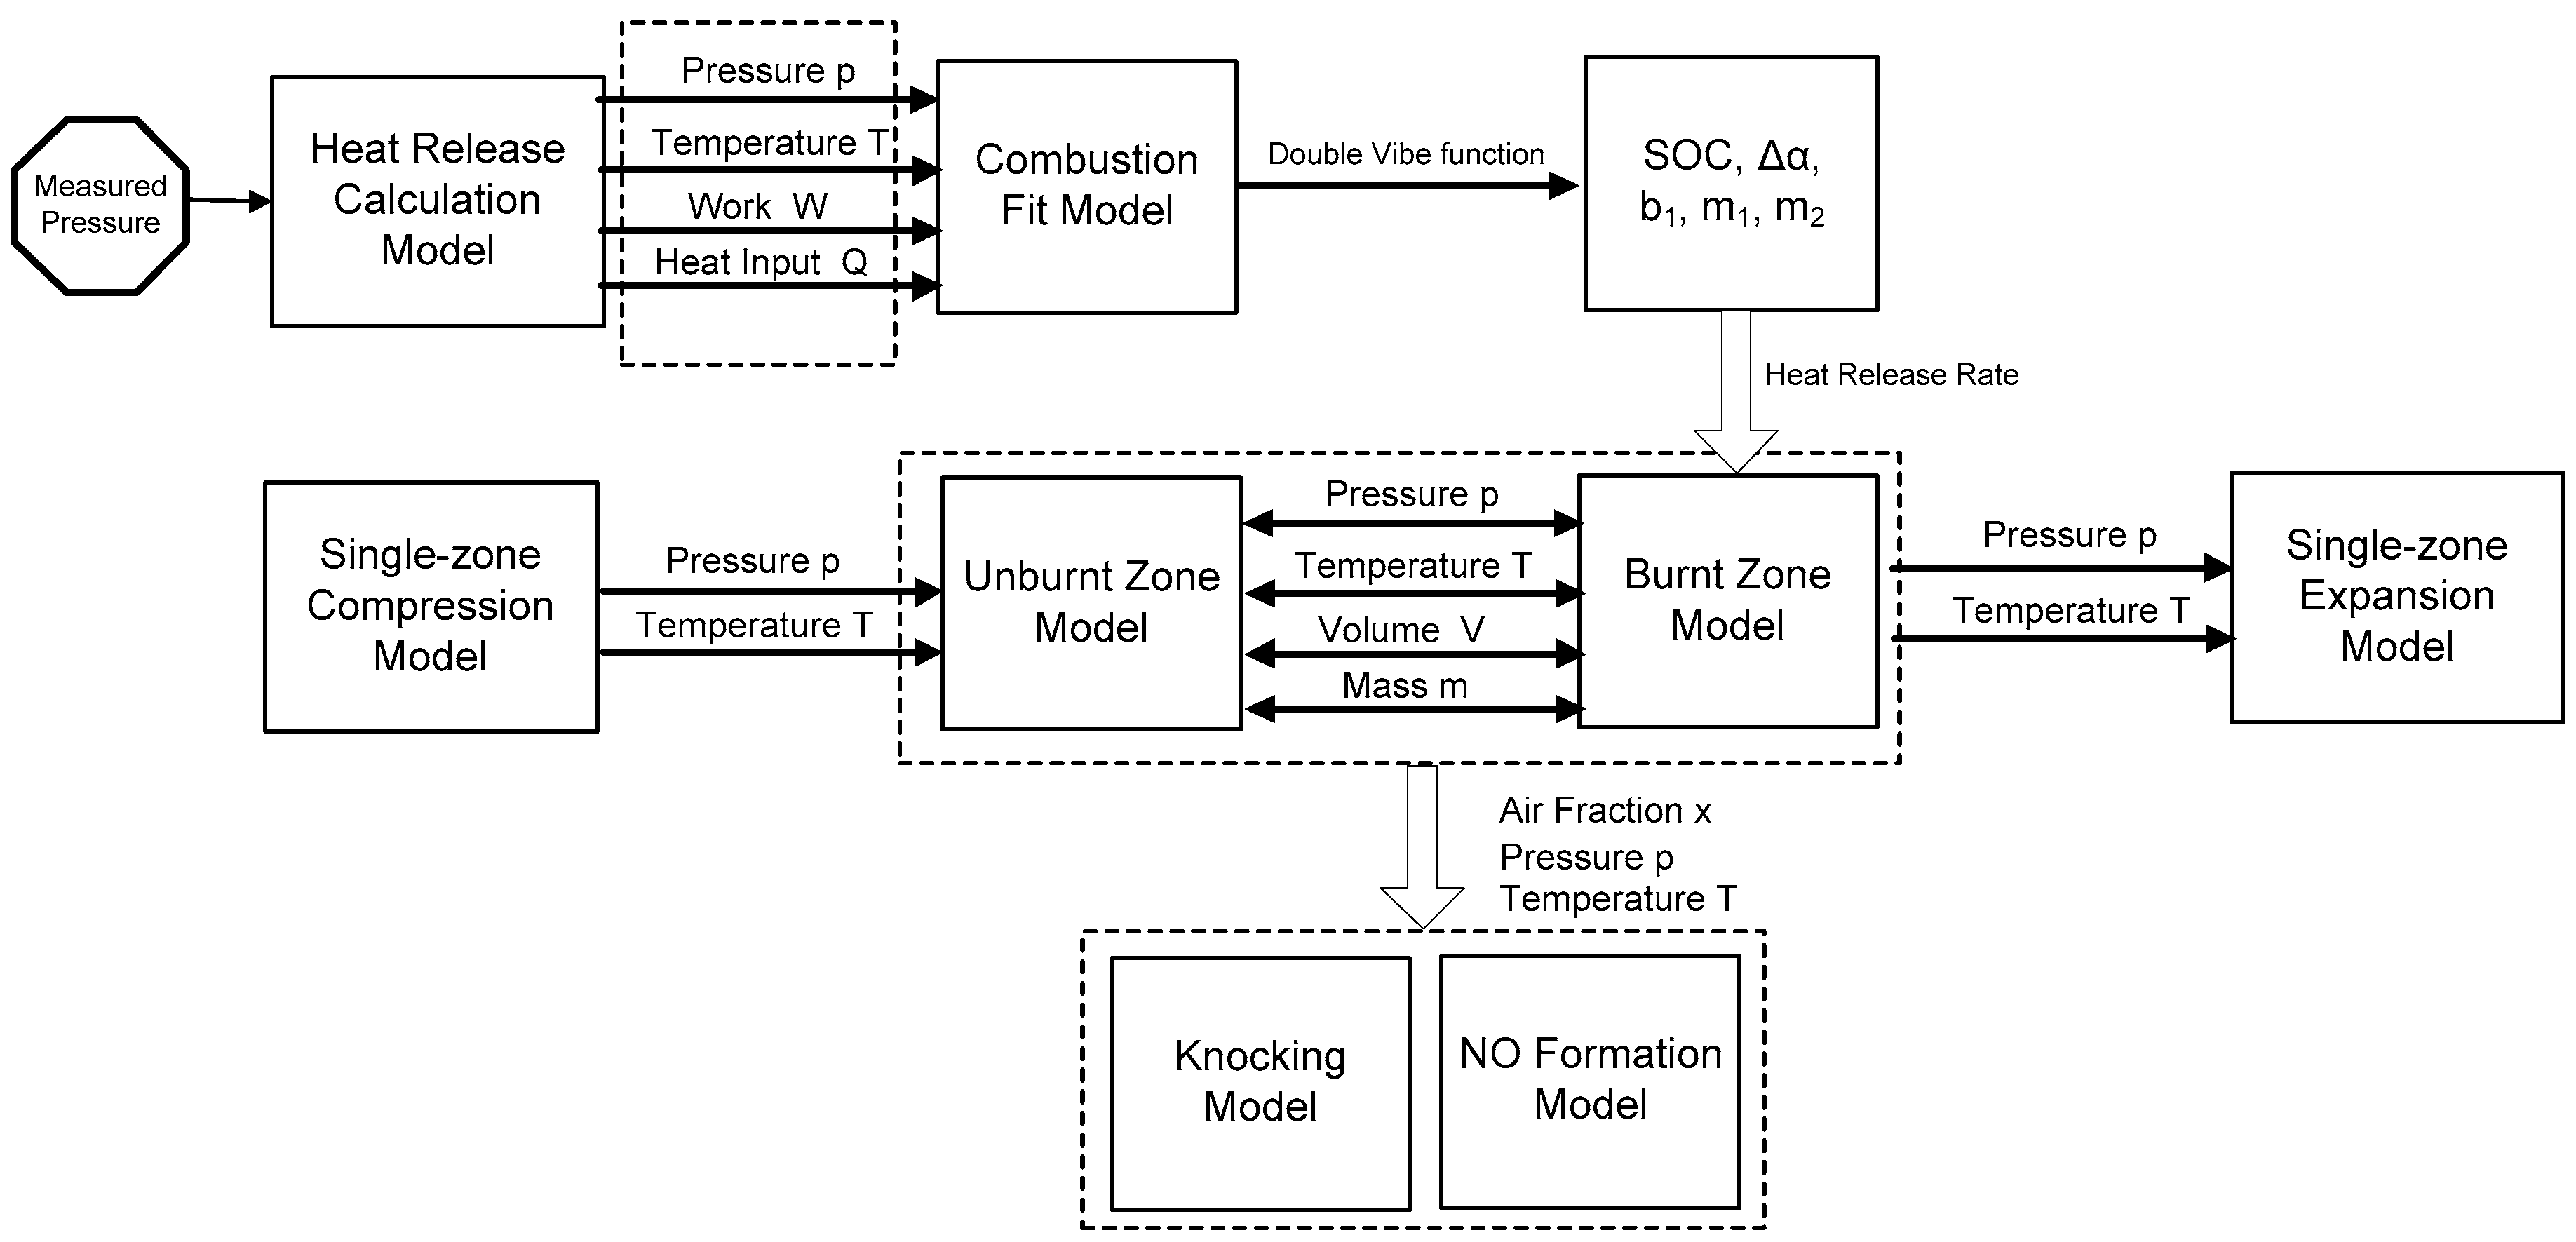
As shown in Figure 5, the in-cylinder process simulation model of natural gas engine is built in the MATLAB/SIMULINK environment, in which the calculation process is based on the above formulas. The first step is to calculate heat release rate from the measured in-cylinder pressure and obtain Vibe parameters under different working conditions by the curve fit model. The in-cylinder process model consists of a single-zone compression sub-model, a two-zone combustion sub-model and a single-zone expansion sub-model. The obtained Vibe parameters will be used to simulate the heat release rate of natural gas in the two-zone combustion sub-model. In-cylinder parameters like air fraction, pressure and temperature in burnt zone will be used to calculate knocking parameters and NO concentration.
3. Engine Performance Results of Two-Zone Model
An SI natural gas engine transformed from 2135 diesel engine is used in this paper to verify the simulation model. The main technical parameters are shown in Table 1.
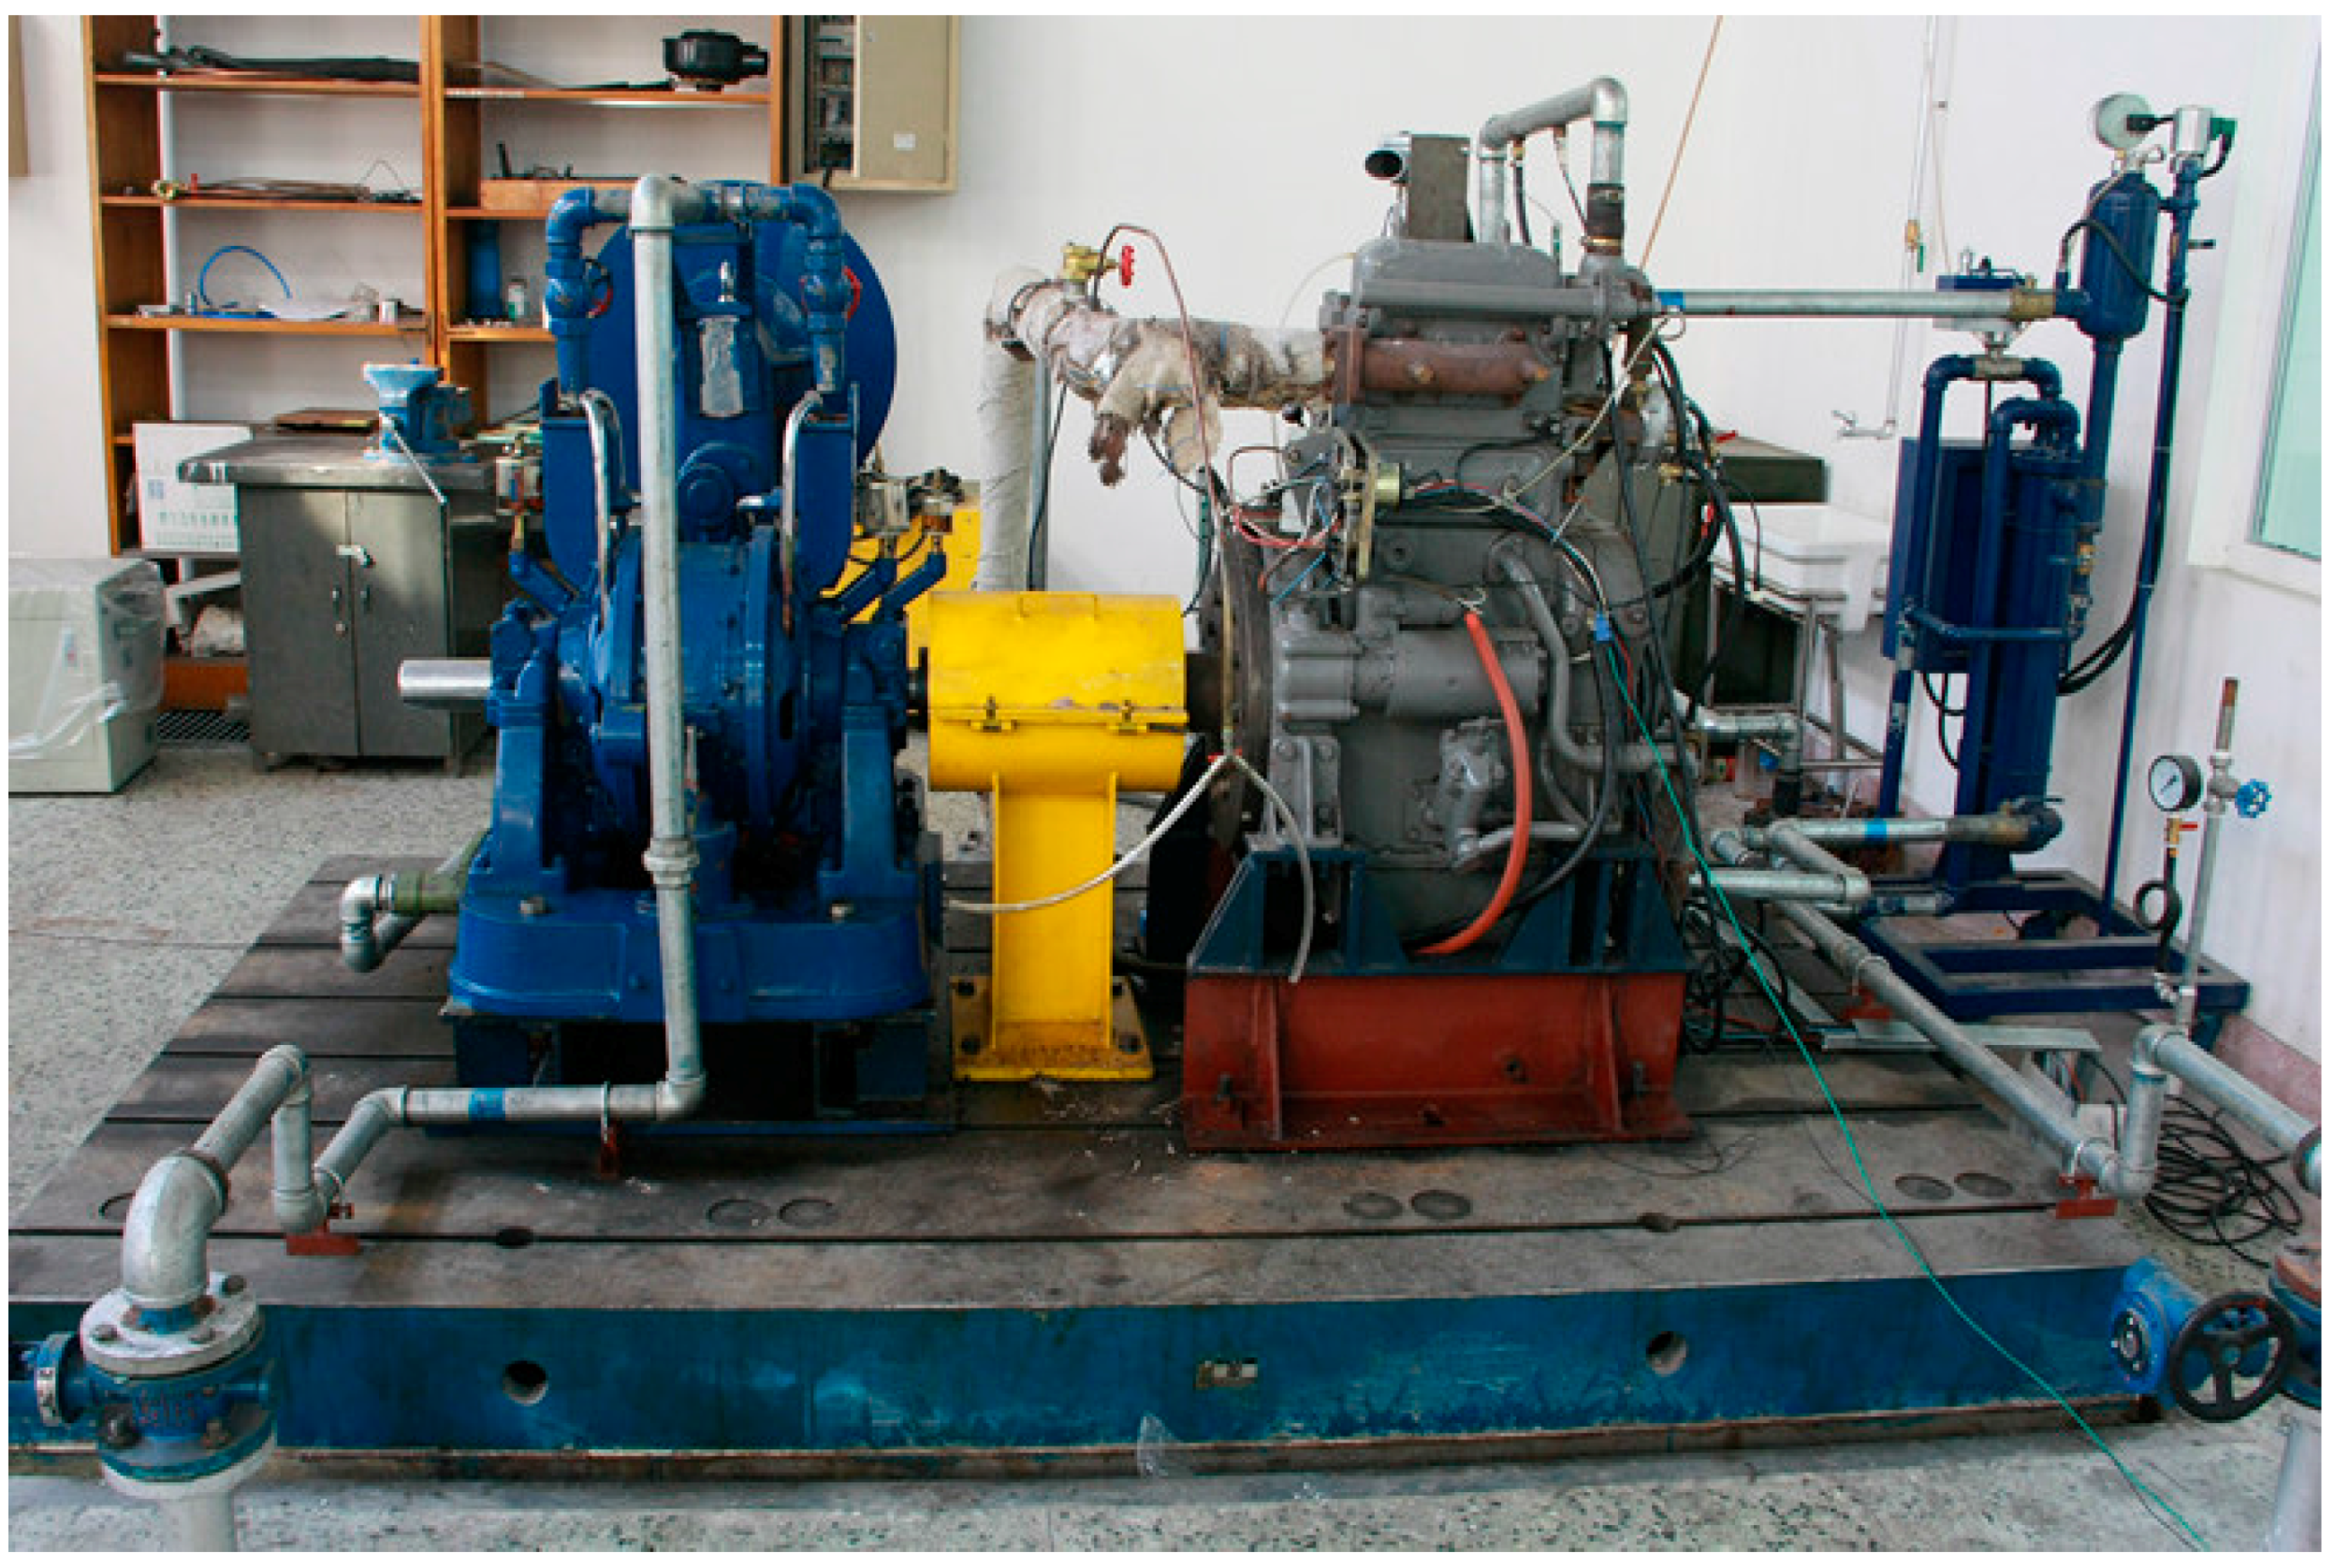
The transformation includes replacing the diesel fuel injection jet by a spark plug as well as adding a premixed natural gas supply system and related sensors. Multi-point injection technology is adopted by installing the electronic injection valve in each intake manifold, which enables the Electronic Control Unit (ECU) to precisely adjust the intake mass flow and supply timing of each cylinder. Related sensors are used to measure in-cylinder pressure, rotation speed, natural gas mass flow, intake temperature and pressure. Figure 6 shows the transformed 2135 natural gas engine. Since the engine geometric structure stays the same, natural gas decreases the charge efficiency by occupying a portion of the intake volume, resulting in a re-calibrated rated working condition of 1200 r/min and 22.05 kW (75% of original load).
Composition of the natural gas used in test actually is quite complicated, but can be simplified to be CH4, C2H6, C3H8, i-C4H10, n-C4H10, C5H12 and N2 in the simulation model, as shown in Table 2.
3.1. Validation of Two-Zone Model
In this part, the two-zone model will be validated by measured pressure from the engine test bed firstly. Then, a single-zone model is introduced for comparison since in-cylinder pressure is the only experimental data and more details of the two-zone model need be investigated.
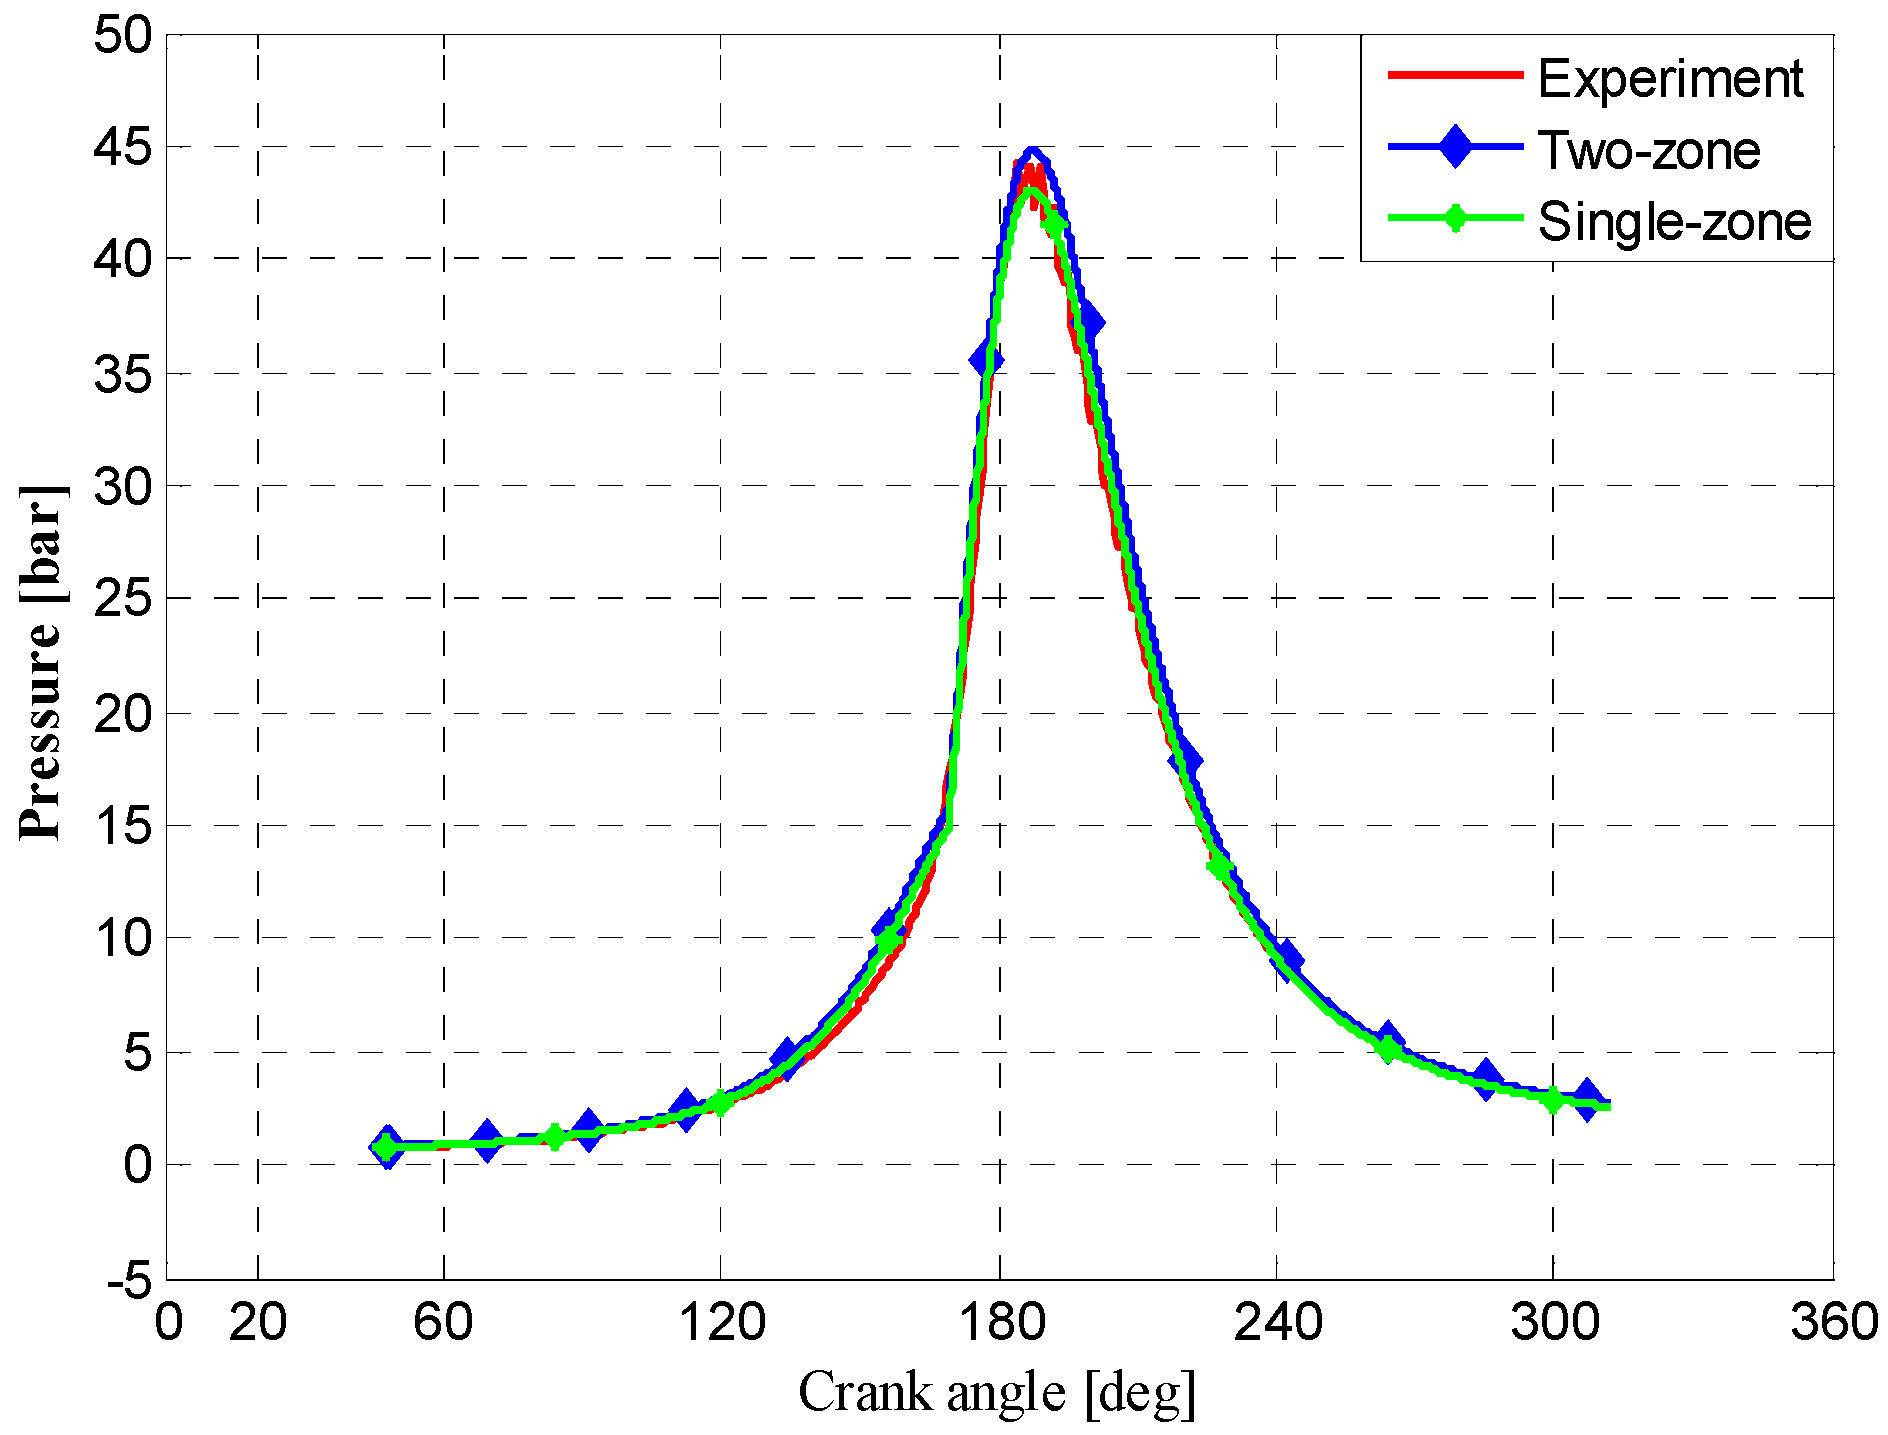
Figure 7 shows the profile of in-cylinder pressure simulated by the two-zone model and engine test data, as well as simulation results by the single-zone model. Apart from the combustion fluctuation and channel effect, the simulated pressure curves of both two-zone models and single-zone models coincide well with the experimental data.
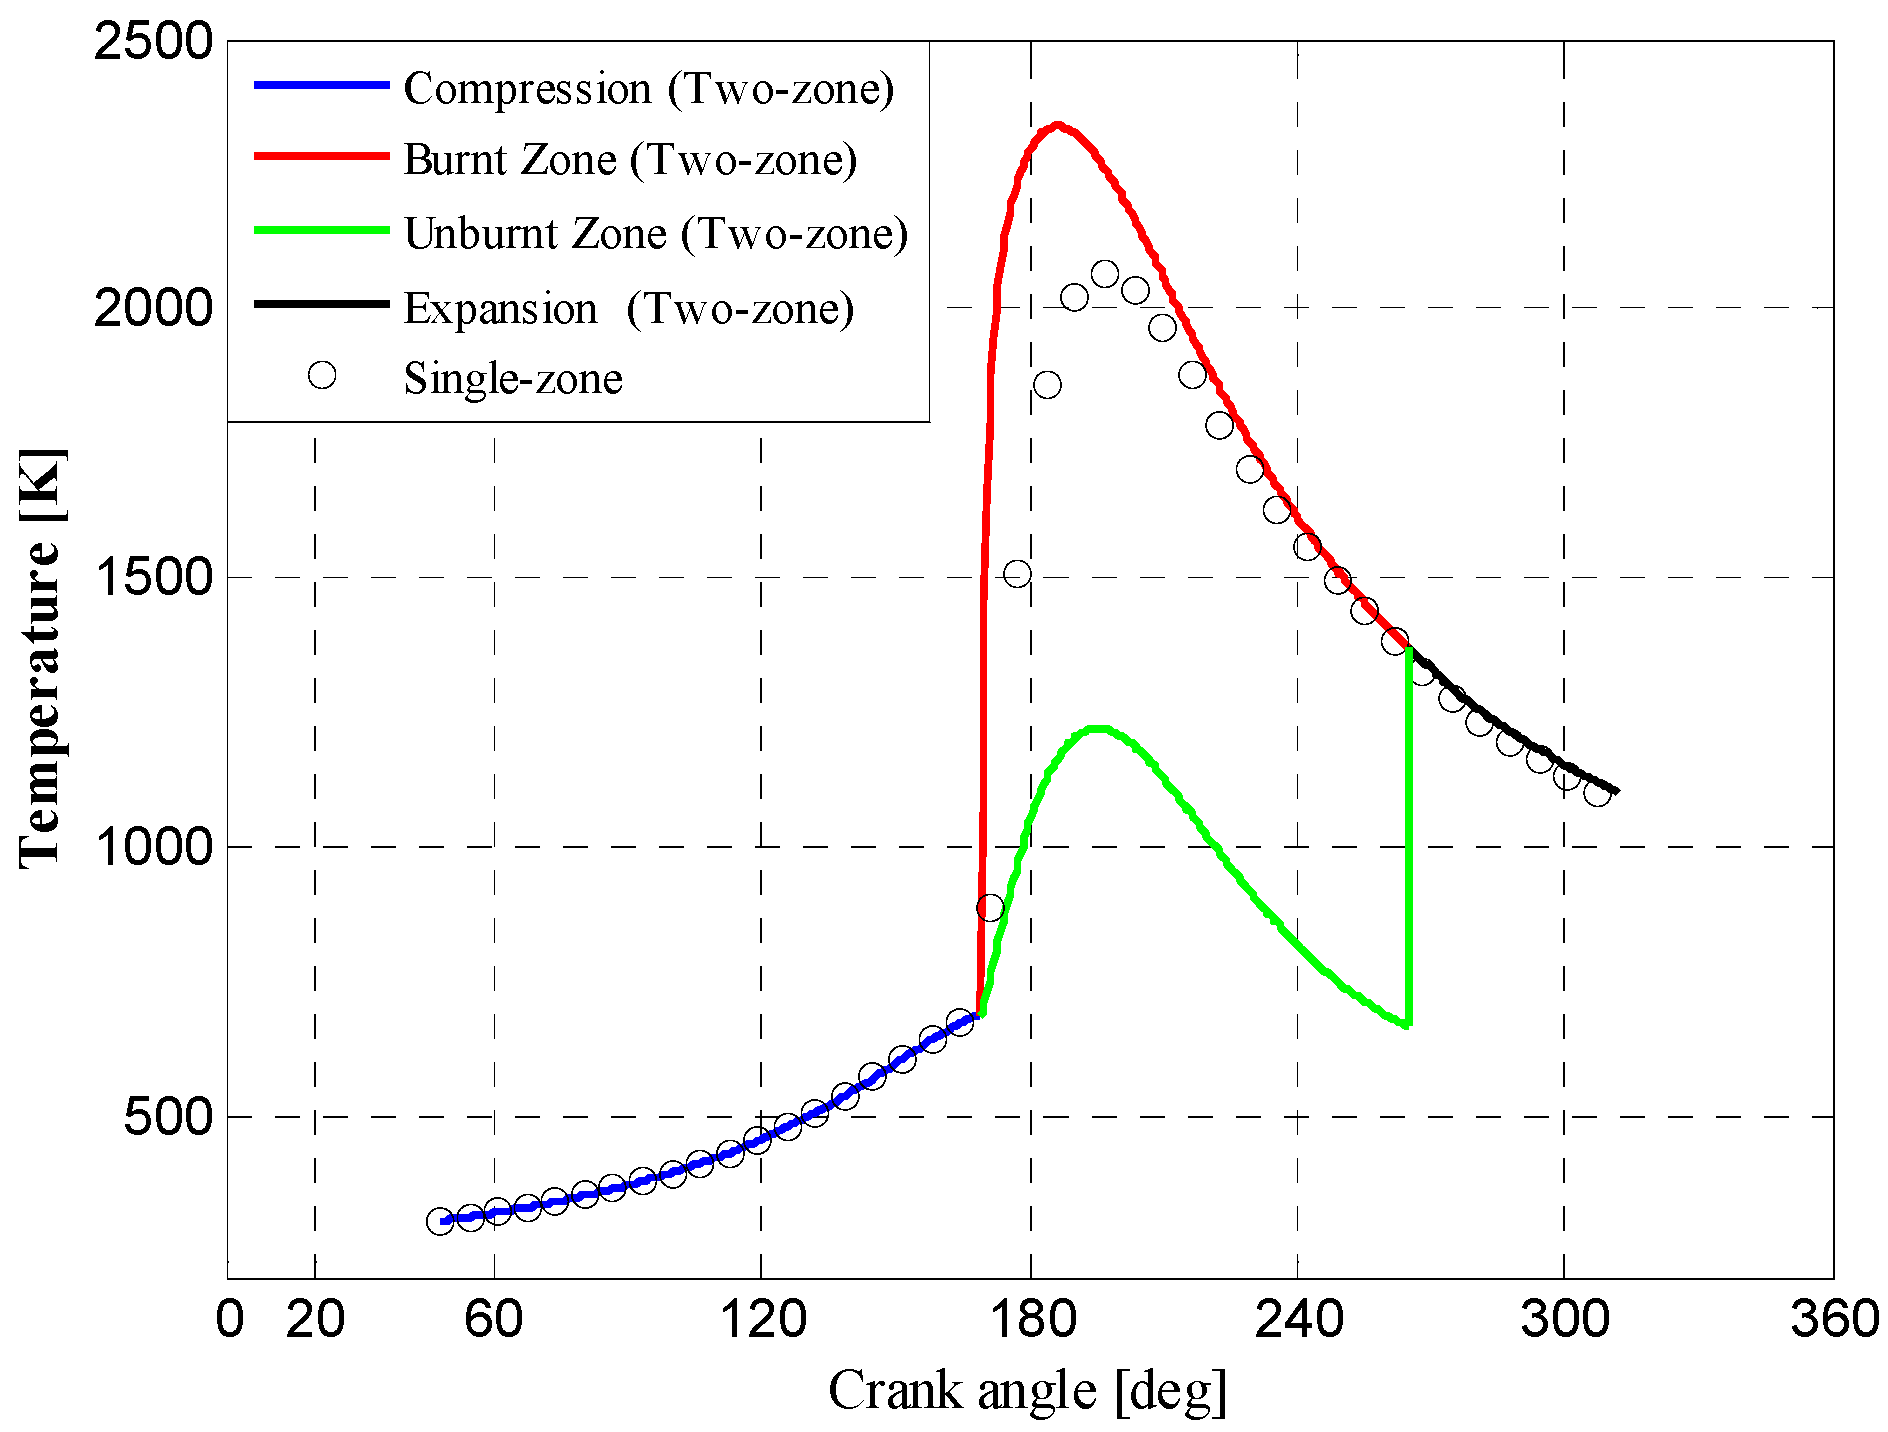
In-cylinder temperatures of two-zone models and single-zone models are compared in Figure 8. It can be seen that temperatures in these two models stay the same during the compression and expansion stages. Temperature curves begin to separate at the start of combustion (169° CA) and coincide with each other again after the end of combustion (265° CA). During the separated combustion stage, peak temperatures in burnt zone and unburnt zone, respectively, reach 2338 K and 1219 K, while that in a single-zone model is 2066 K.
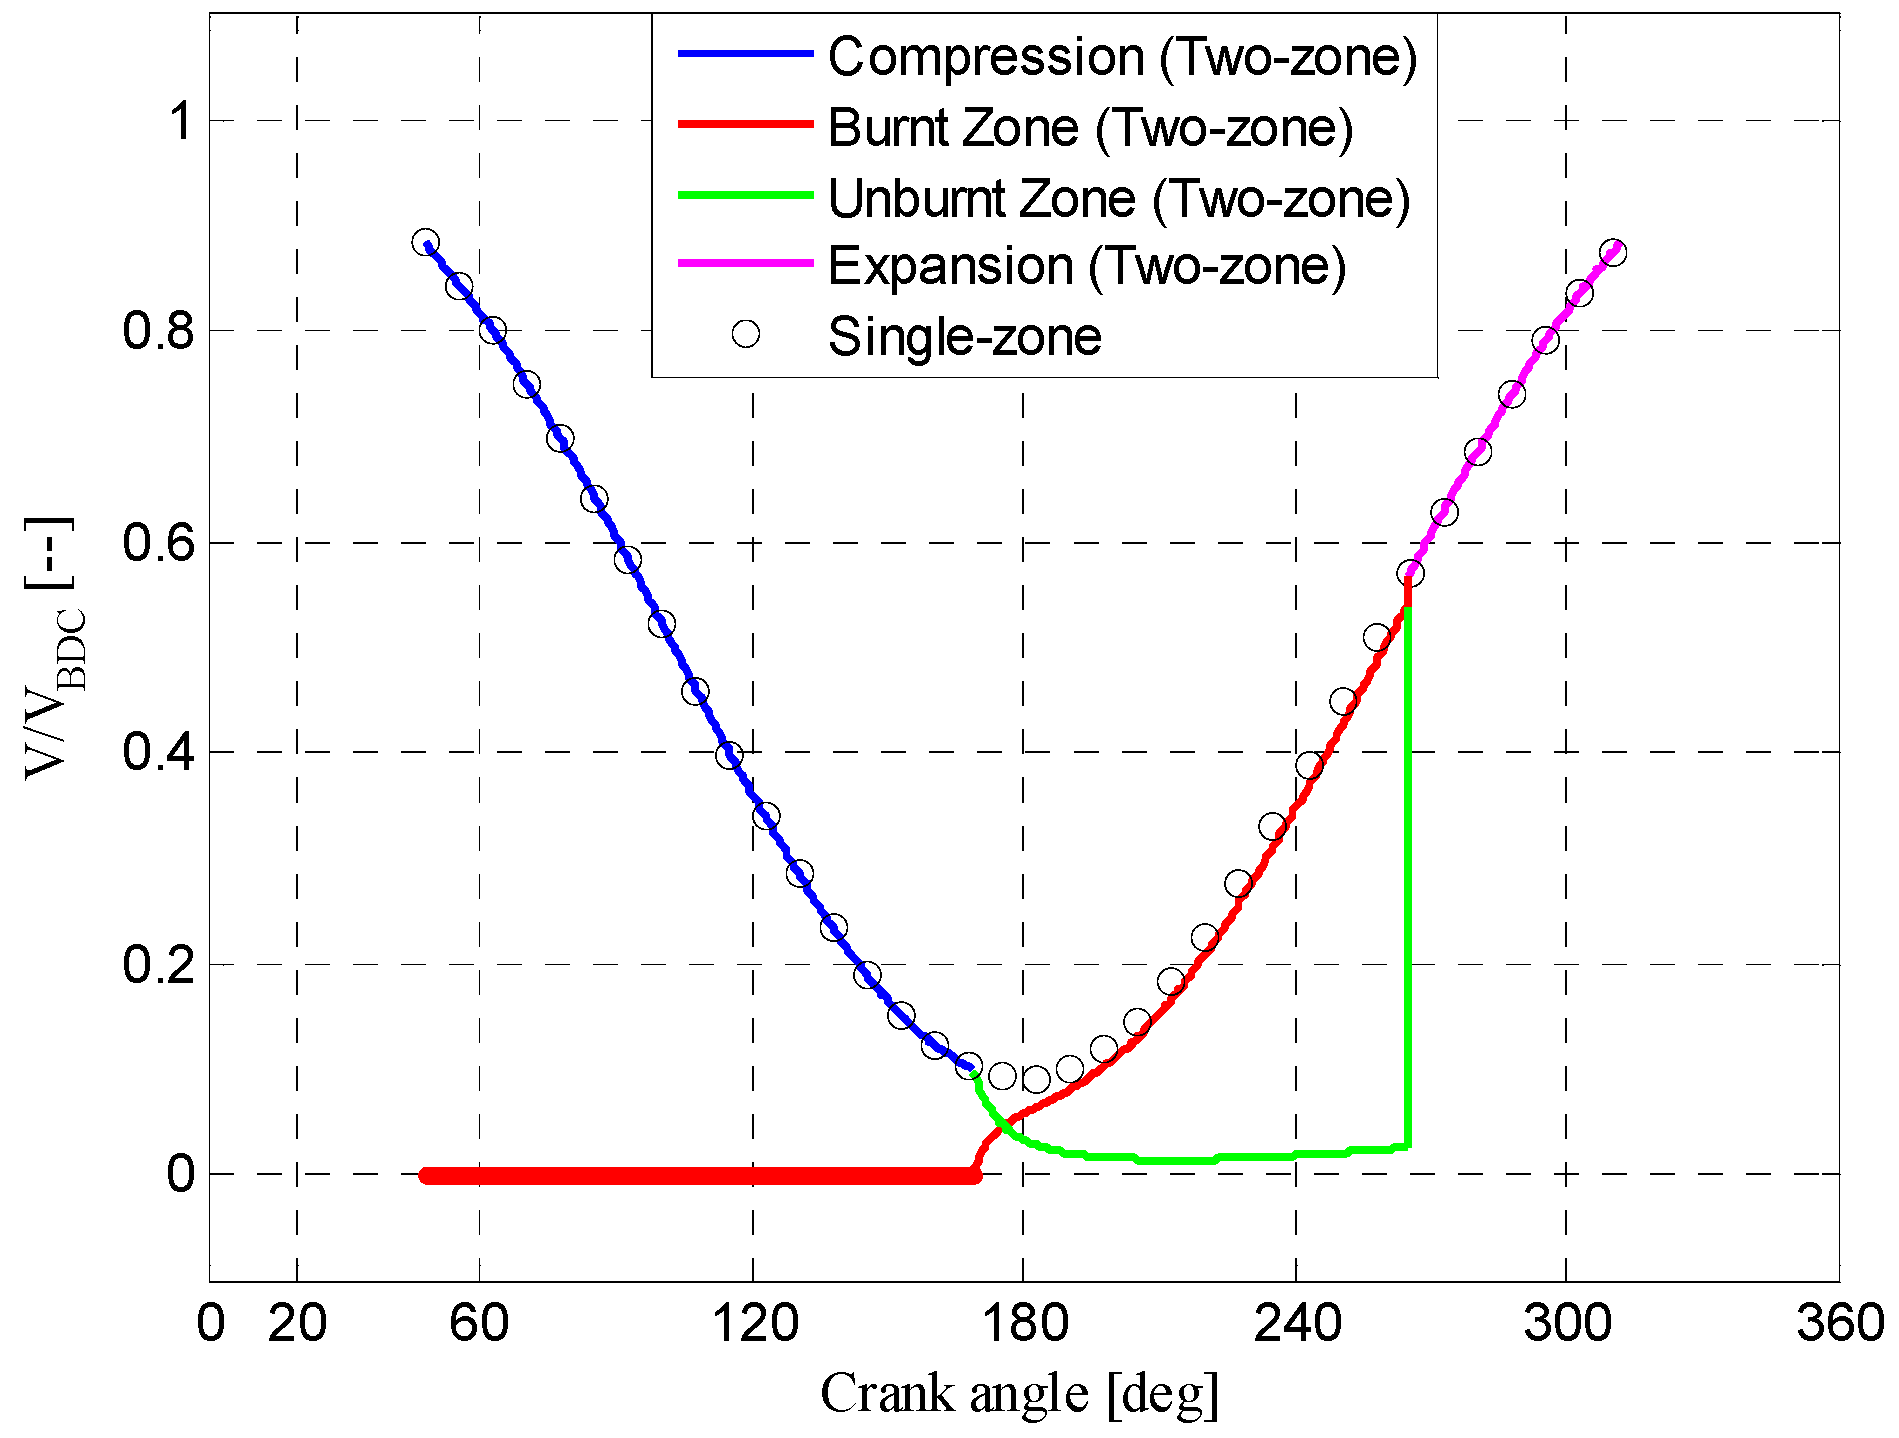
The volume variations of two-zone model and single-zone model are presented in Figure 9 in the form of instantaneous ratio to volume at the bottom dead center. During the compression stage, the in-cylinder spaces are assumed to be homogeneous in both two-zone models and single-zone models. Once combustion begins, the volume of burnt zone increases fast from zero and nearly occupies the whole cylinder at the end of combustion. However, the unburnt zone still exists at the end of combustion accounting for incomplete combustion in two-zone models. From the start of expansion stage, gases in burnt zones and unburnt zones start to mix and expand until the exhaust values open, which results in a homogeneous zone just like that in single-zone models.
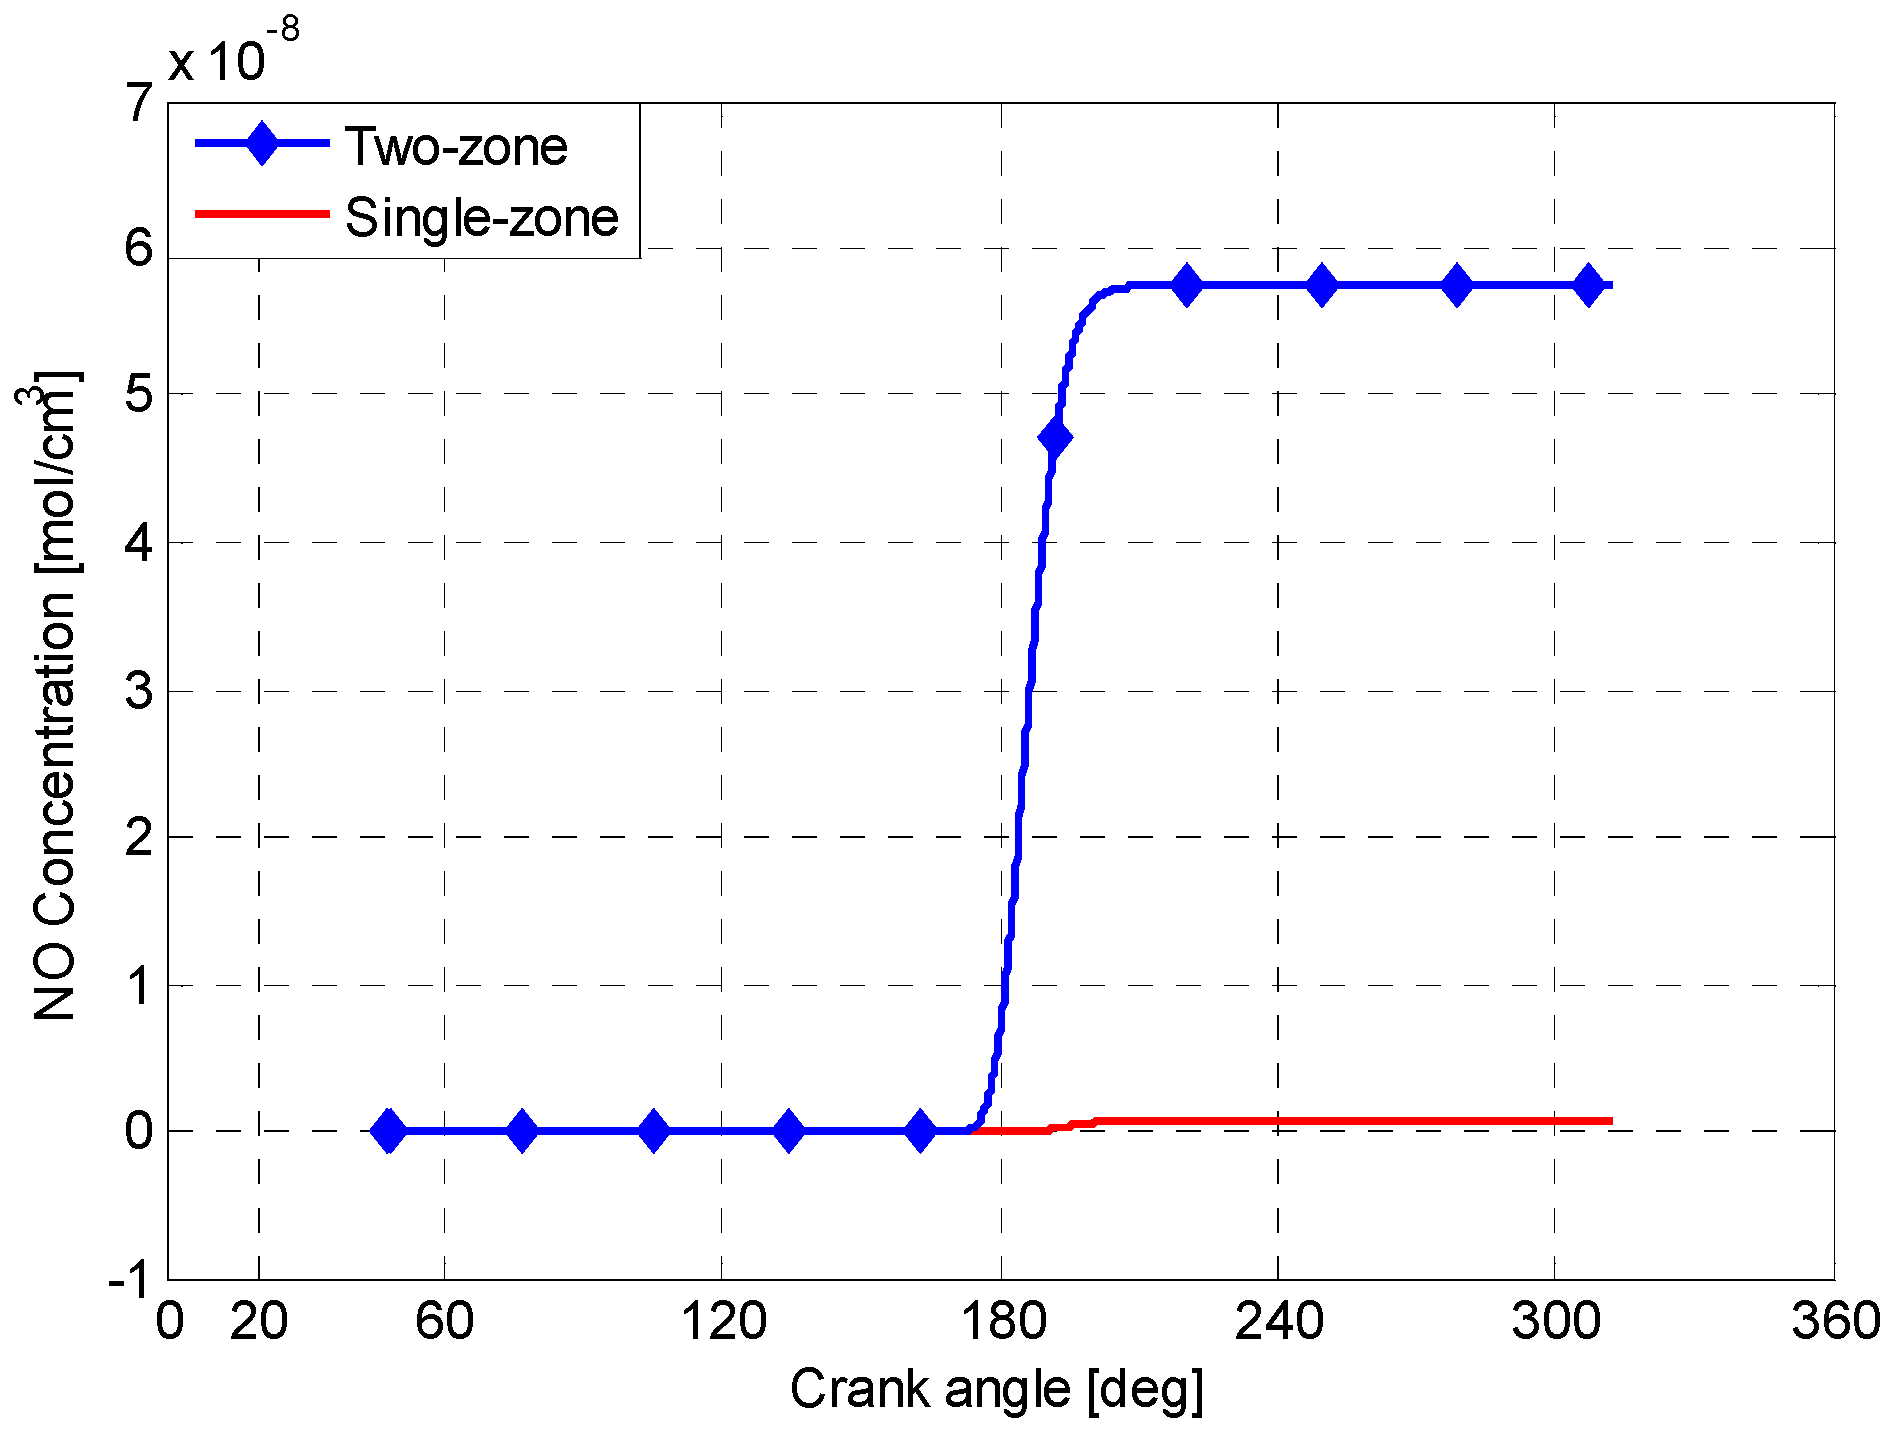
Figure 10 shows the NO concentration calculated by the basic Zeldovich mechanism. From Figure 10, the NO concentration predicted by single-zone models can be neglected compared to the two-zone model mainly because the single-zone temperature doesn’t exceed 2000 K for long, above which the thermal NO begins to form at a large scale. Combining with the engine speed and output power, the final NO emission can be computed to be 7.78 g/(kW·h).
3.2. Heat Release Analysis of Engine Different Working Conditions
Table 3 shows the engine operation parameters under engine different working conditions, which are measured in the 2135 natural gas engine test bed. For all the cases, the equivalence ratios are kept at 1 by controlling the throttle valve opening percentage and natural gas injection valve.
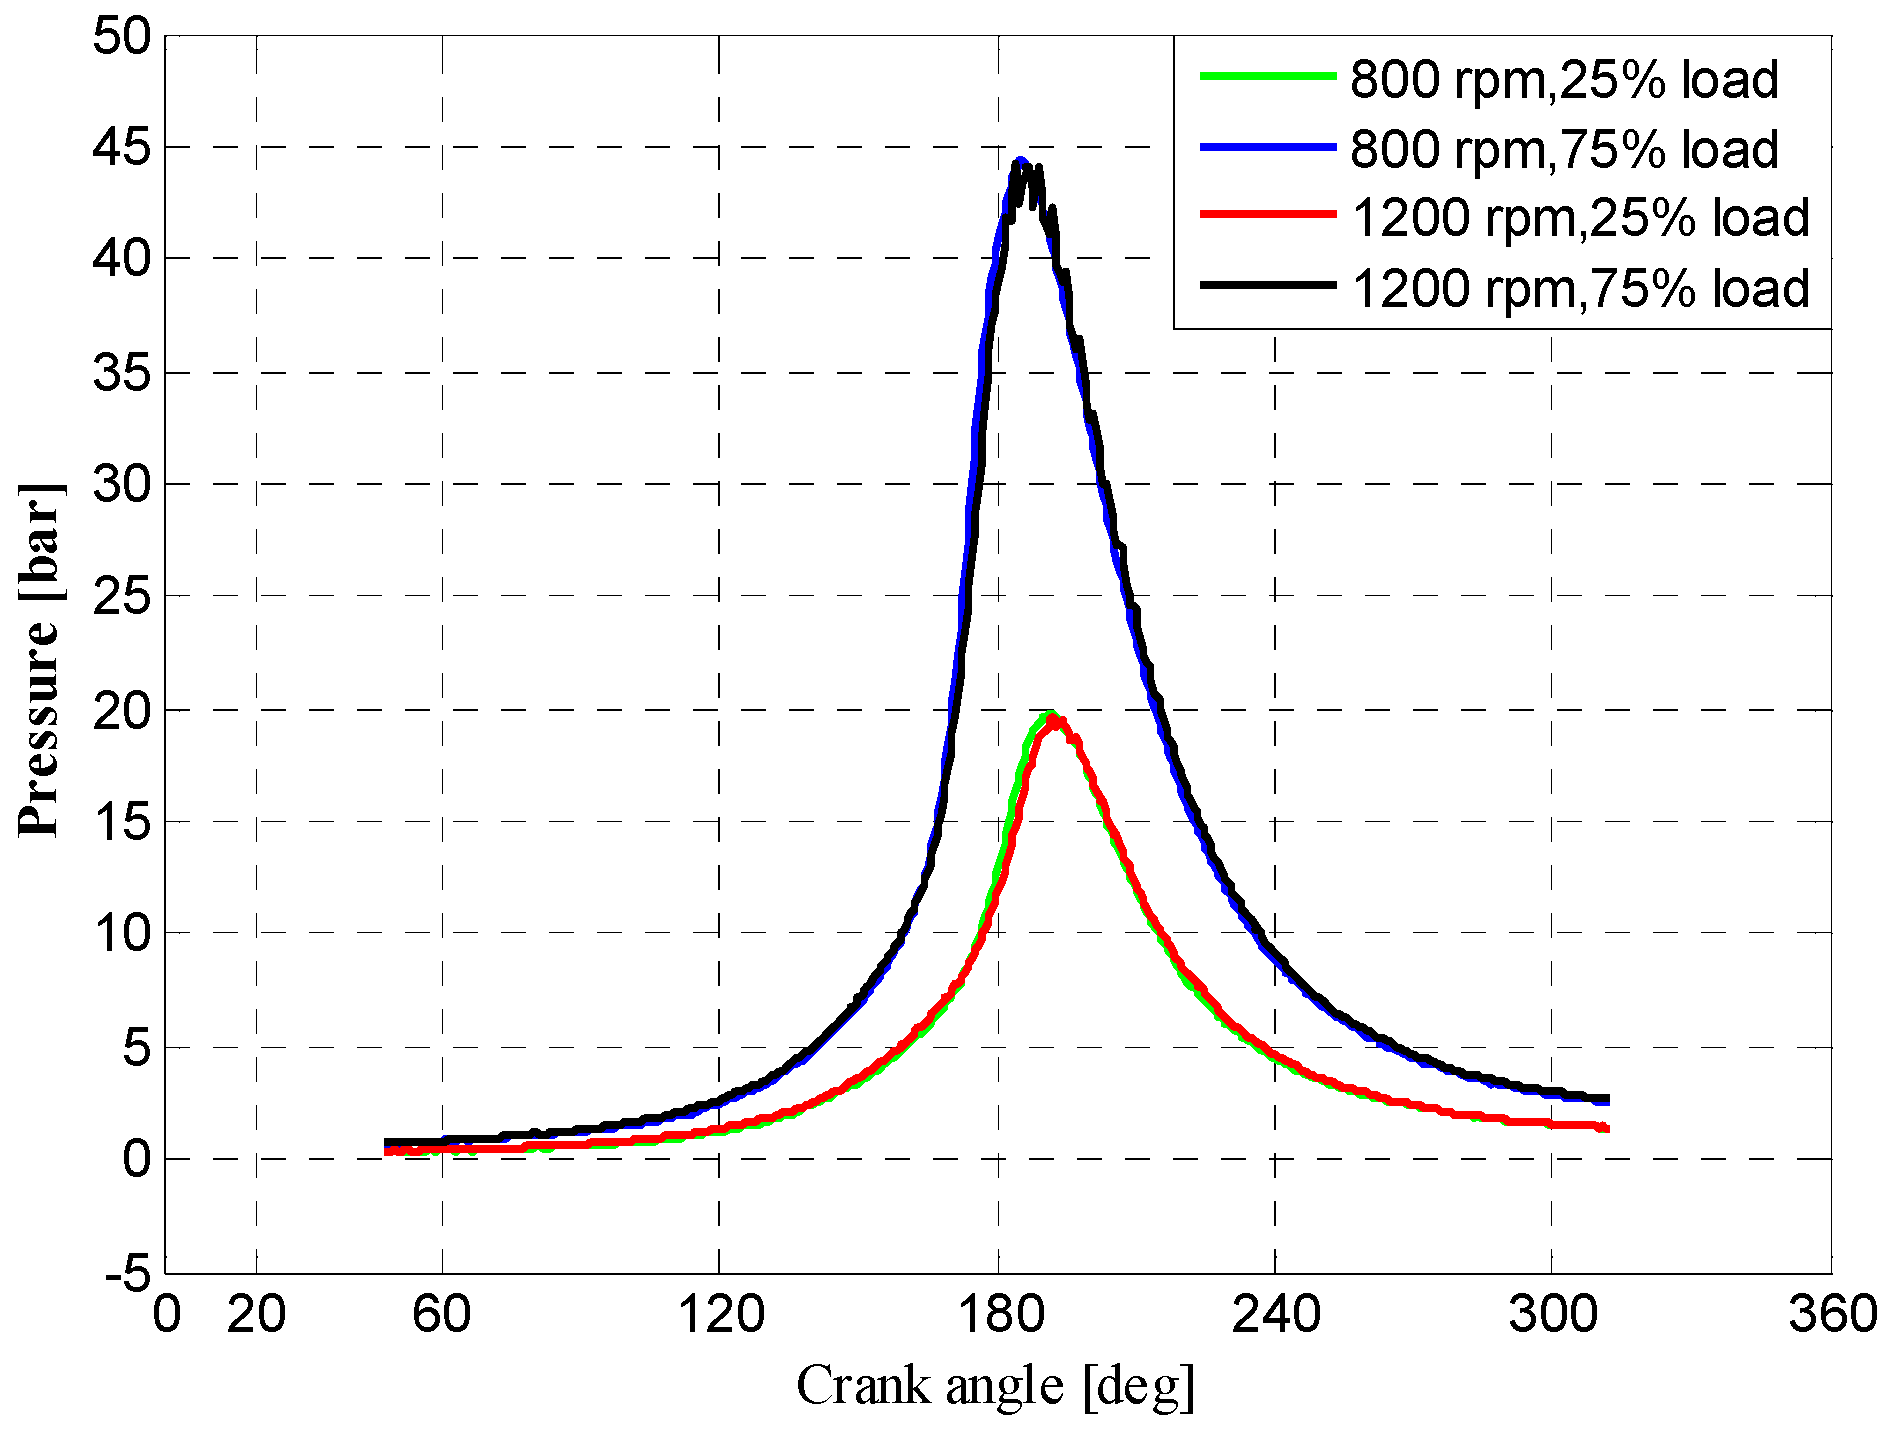
To investigate the heat release with variable operation parameters, four working conditions are chosen to present the calculation results: 800 rpm and 25% load, 800 rpm and 75% load, 1200 rpm and 25% load, 1200 rpm and 75% load (the load percentage is compared to the original power). Figure 11 is the measured in-cylinder pressure under four selected working conditions. It can be seen from Figure 10 that, when the engine speed is fixed, the engine load exerts obvious influence on the in-cylinder pressure. The peak pressure value gets larger and occurs closer to TDC with higher engine load. When the engine load remains constant, the pressure curves at different speeds almost coincide, and the corresponding positions appear less than 1 degree different.
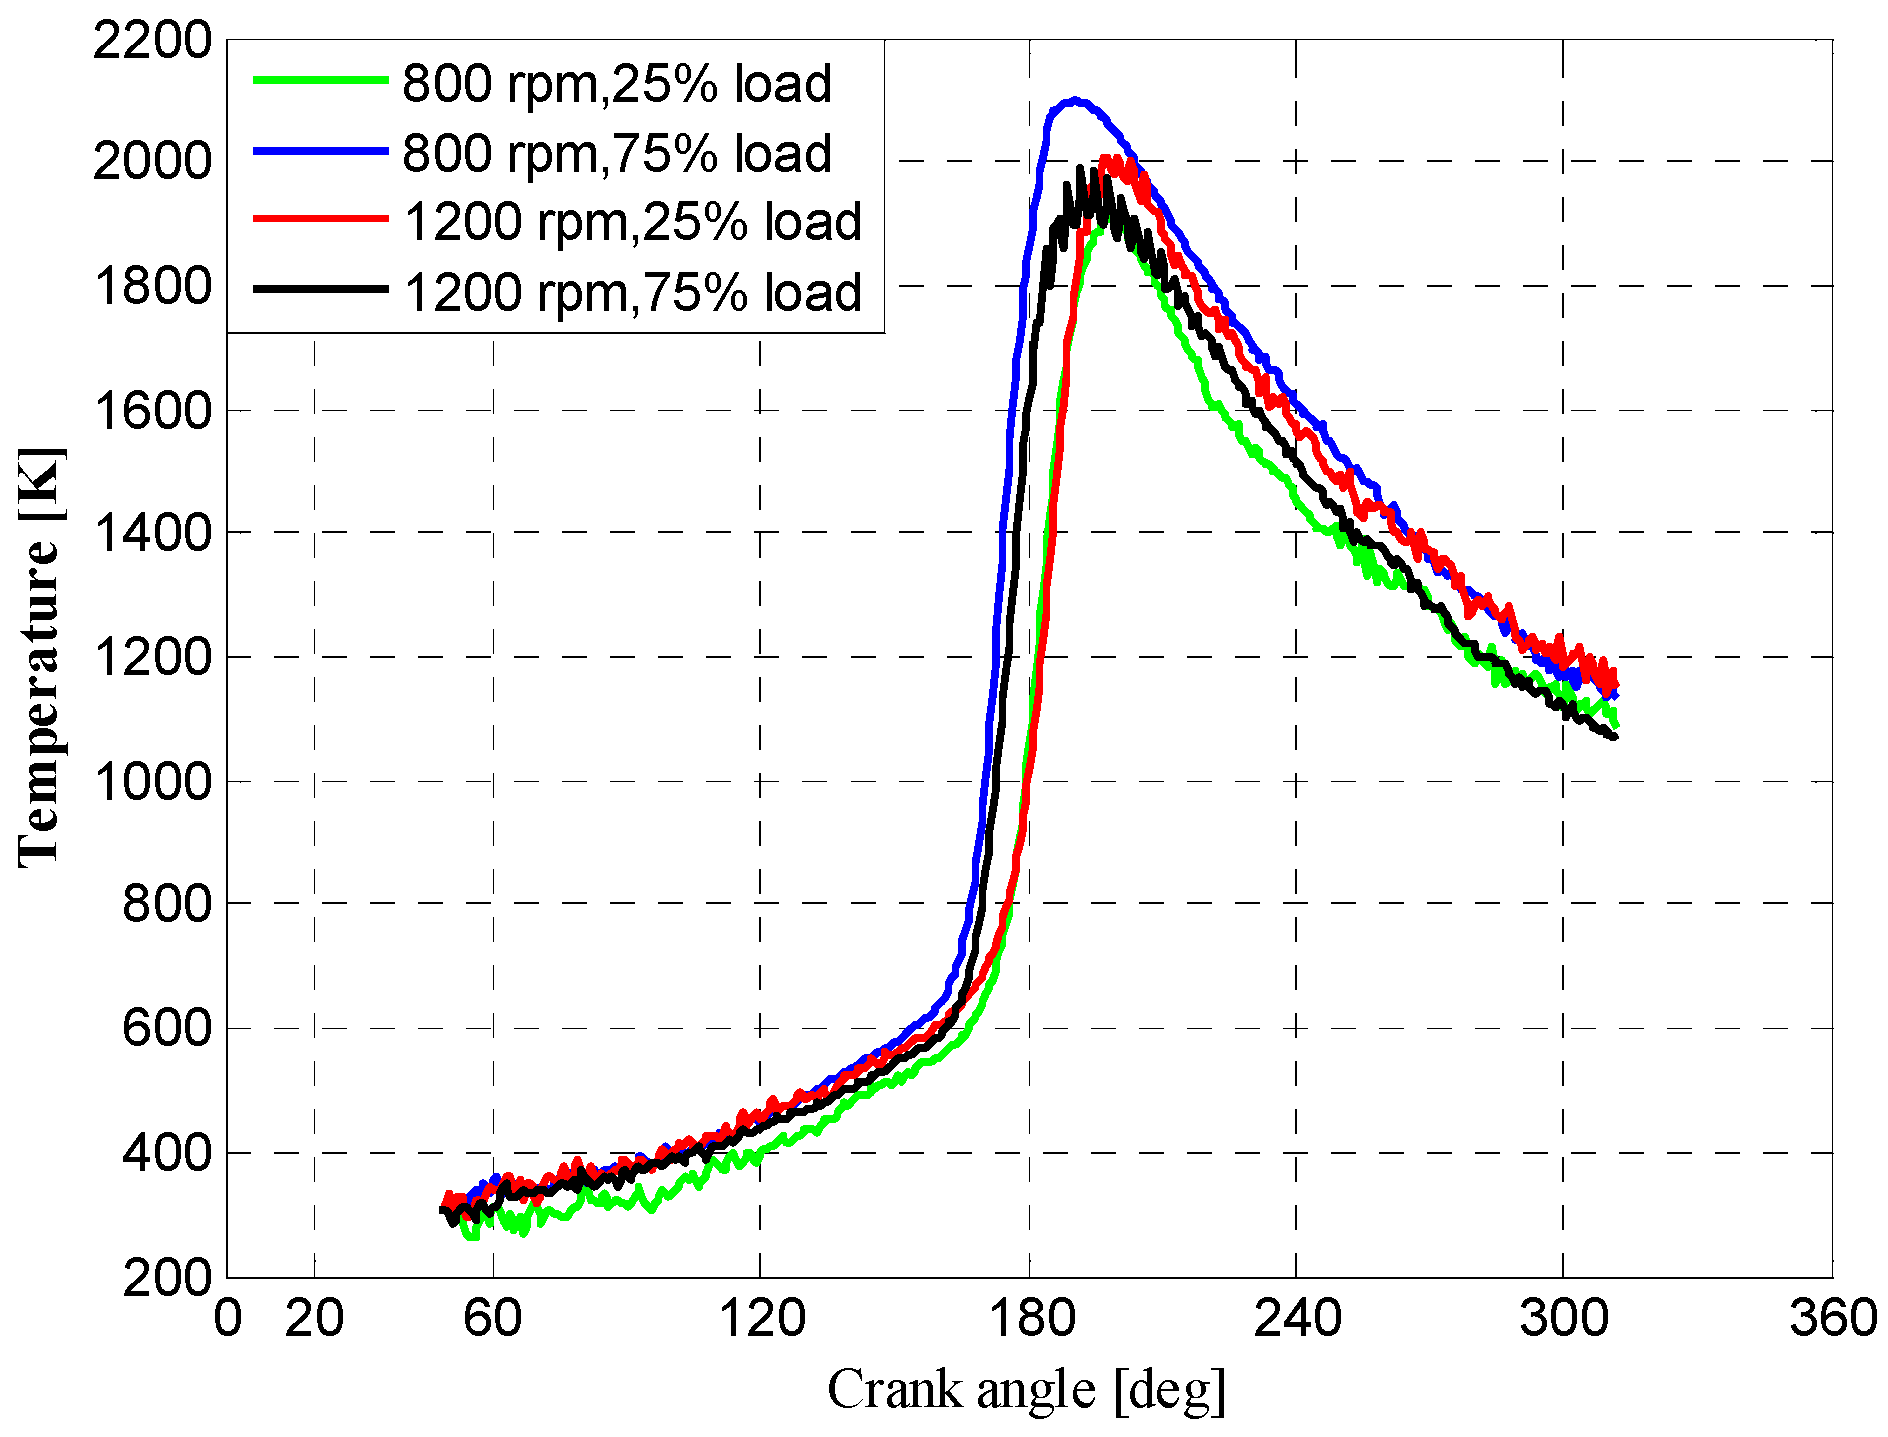
Figure 12 shows the corresponding in-cylinder temperatures. The temperature curve under 75% load separates firstly from the compression pressure curve, and the highest peak temperature occurs under the condition of 800 r/min and 75% load. For all working conditions, the peak temperatures vary from 1900 K to 2100 K, which are obviously higher than that in the original diesel engine. It is mainly because that the evaporation of liquid fuel in diesel engine absorbs heat from the surroundings and cools down in-cylinder gas.
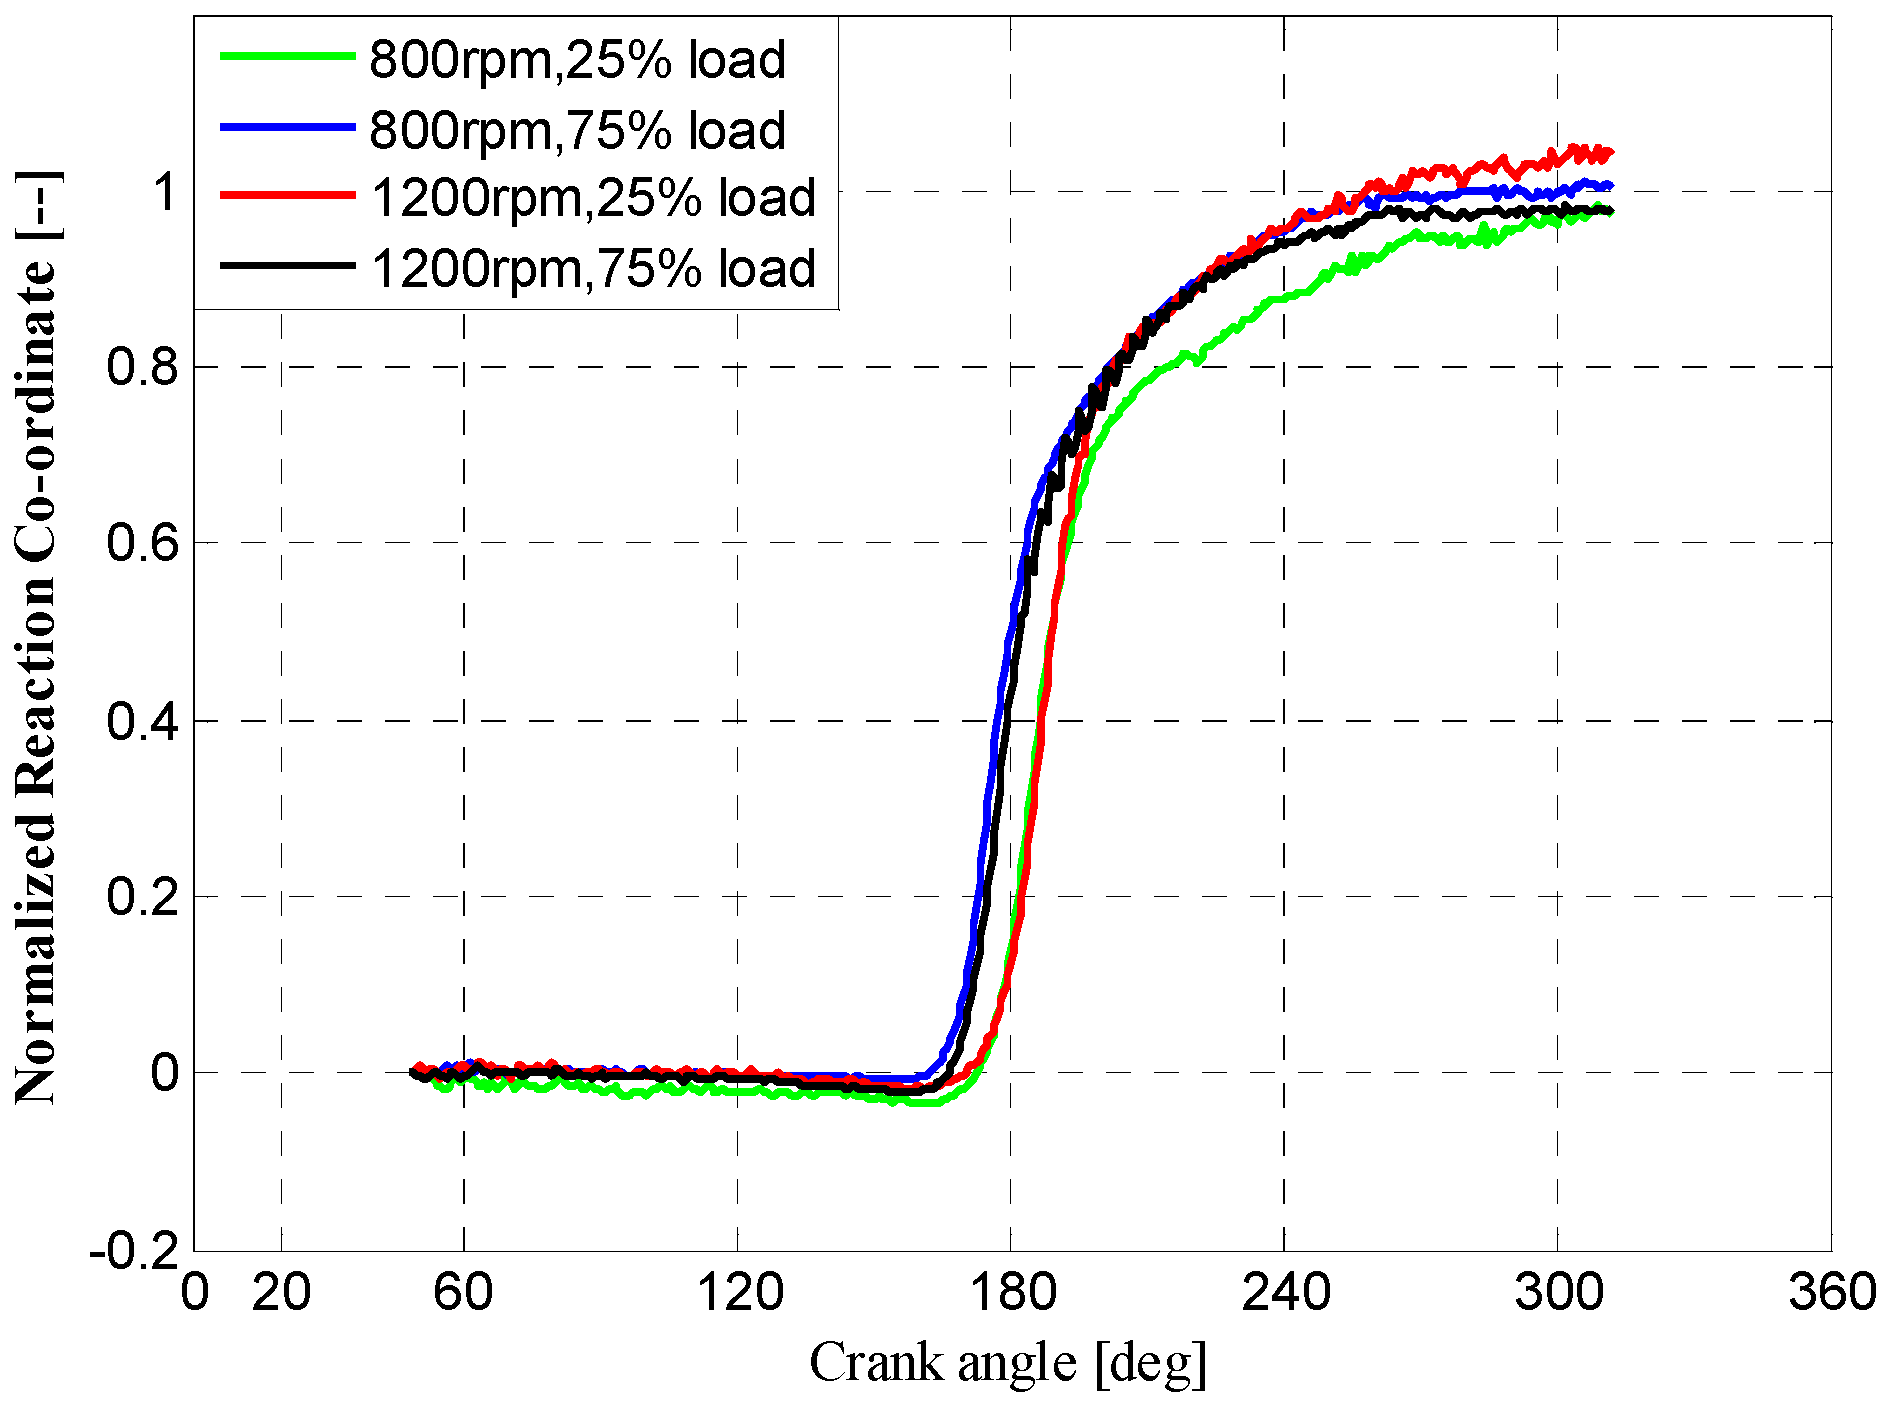
According to Gupta [33], the combustion process of natural gas SI engines can be divided into three stages, namely the flame development, flame propagation and flame quenching stages, and the way in which the stage durations are defined is usually arbitrary. In this paper, the interval points are defined as 5% and 90% percentage of the normalized reaction co-ordinate. It can be seen from Figure 13 that, with the same speed, combustion under high load condition starts and ends earlier than that under low load conditions, as well as the shorter combustion duration. The influence of engine speed on combustion start timing is not obvious, but the combustion duration is shortened with the increase of engine speed.
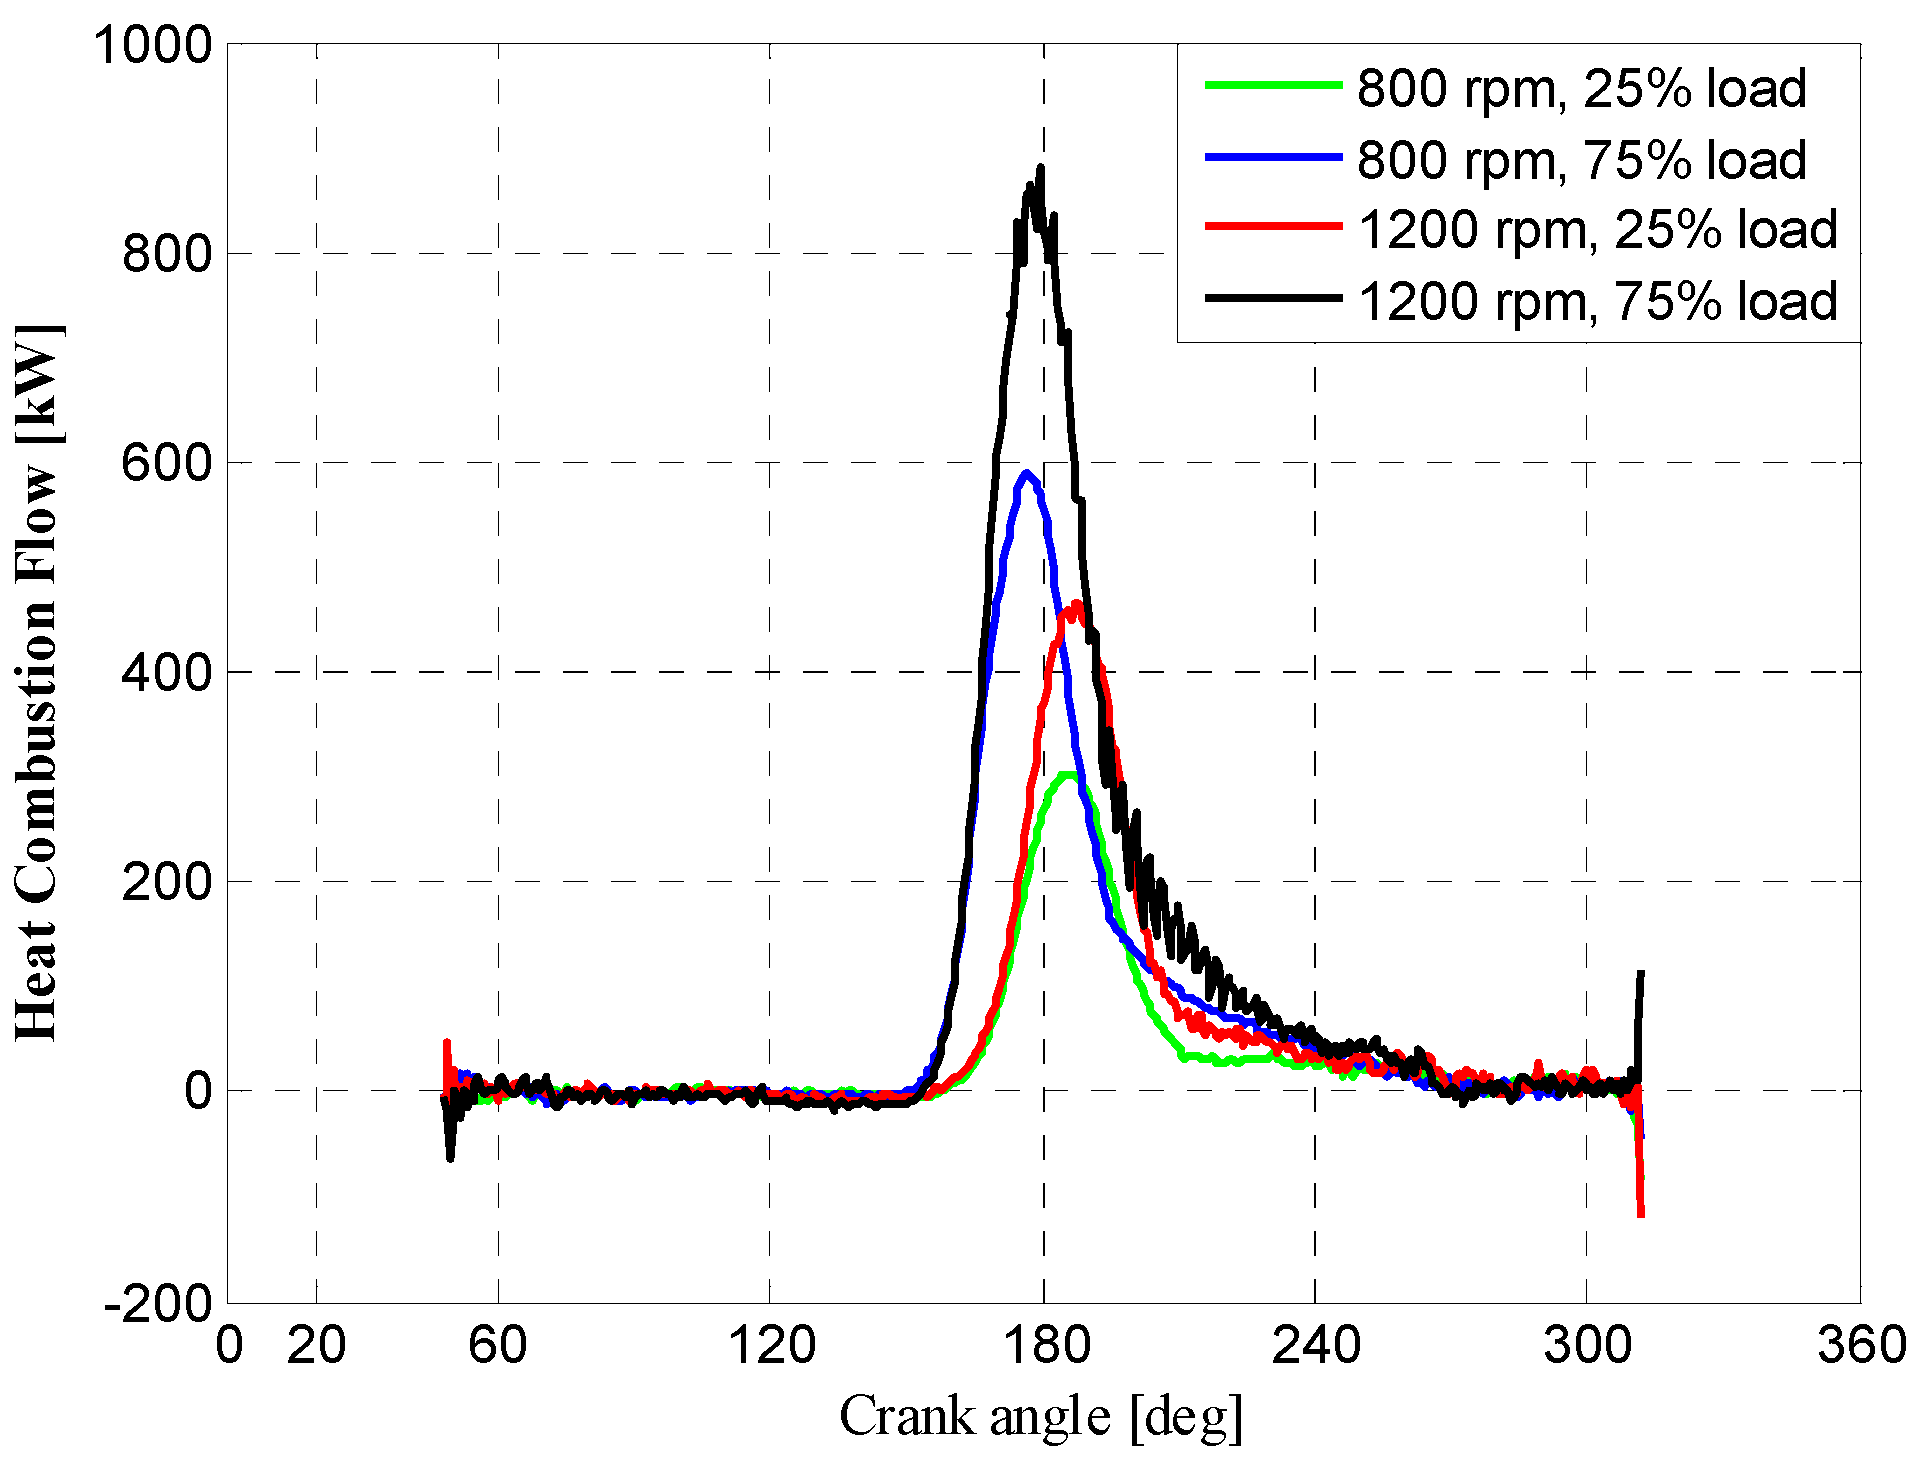
The heat combustion flow under different working conditions is shown in Figure 14. When rotation speed remains constant, the peak value of heat release rate appears earlier and climbs up with the load increase. When the engine load is fixed, the peak value rises with rotation speed increasing while the corresponding position stays the same.
Table 4 shows the fitting result of Vibe parameters under different engine working conditions. Although SI natural gas mainly shows the characteristic of premixed combustion, the weight factor of premixed combustion b1 is set to be 0.95 rather than 1 to consider the possible existing diffusion combustion. As can be seen in Table 4, with increasing of engine load at the same speed, the combustion starts early and the sustained period becomes shorter. Higher engine speed will shorten the combustion duration while it makes little difference to the start timing of combustion.
4. Boundary Parameters Investigation of Two-Zone Model
The three boundary parameters cast uncertain effects on peak pressure and temperature in burnt zones, which act as the key factors of engine thermal load. Thus, it is of great significance to investigate the effect of the boundary parameters on the peak value of in-cylinder pressure and temperature. The simulation investigation is carried out at rated working condition and the boundary parameters variations are set to be five equally-space values with one of them fixed, as shown in Table 5. The interval of each parameter is marked in brackets behind the corresponding values.
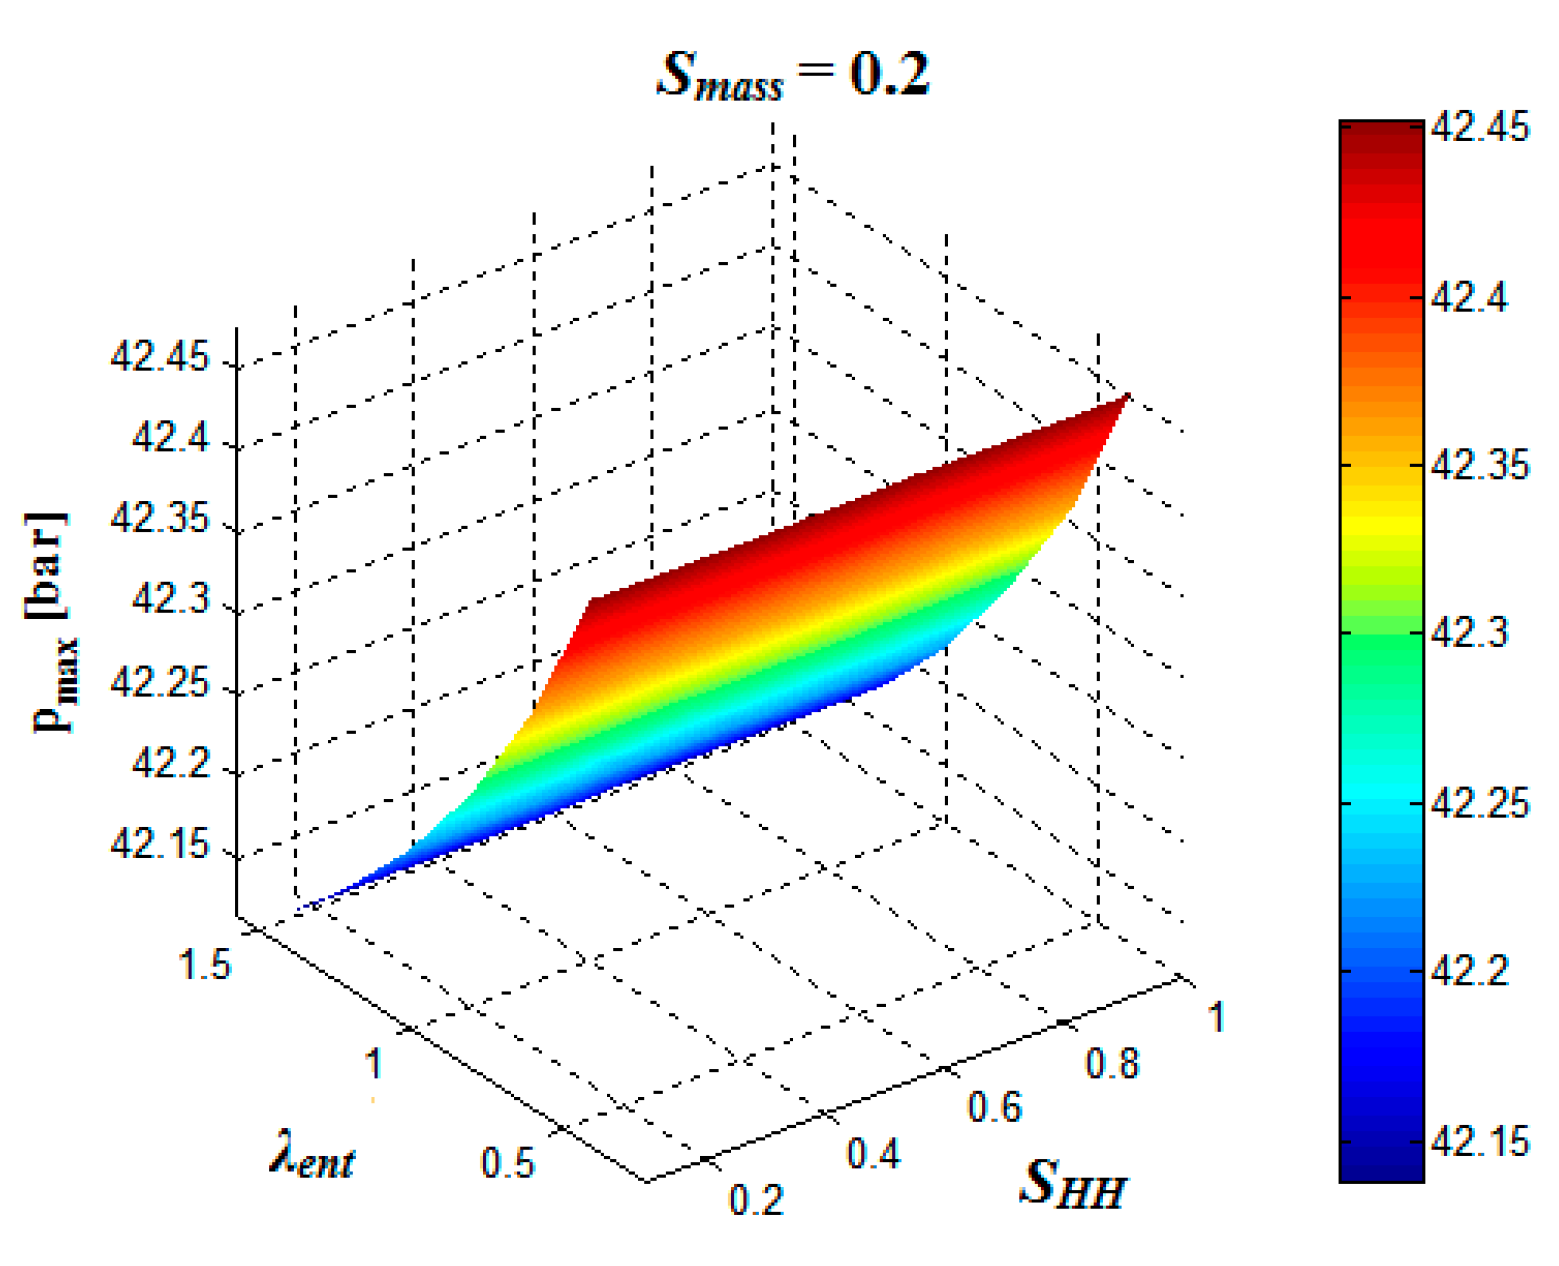
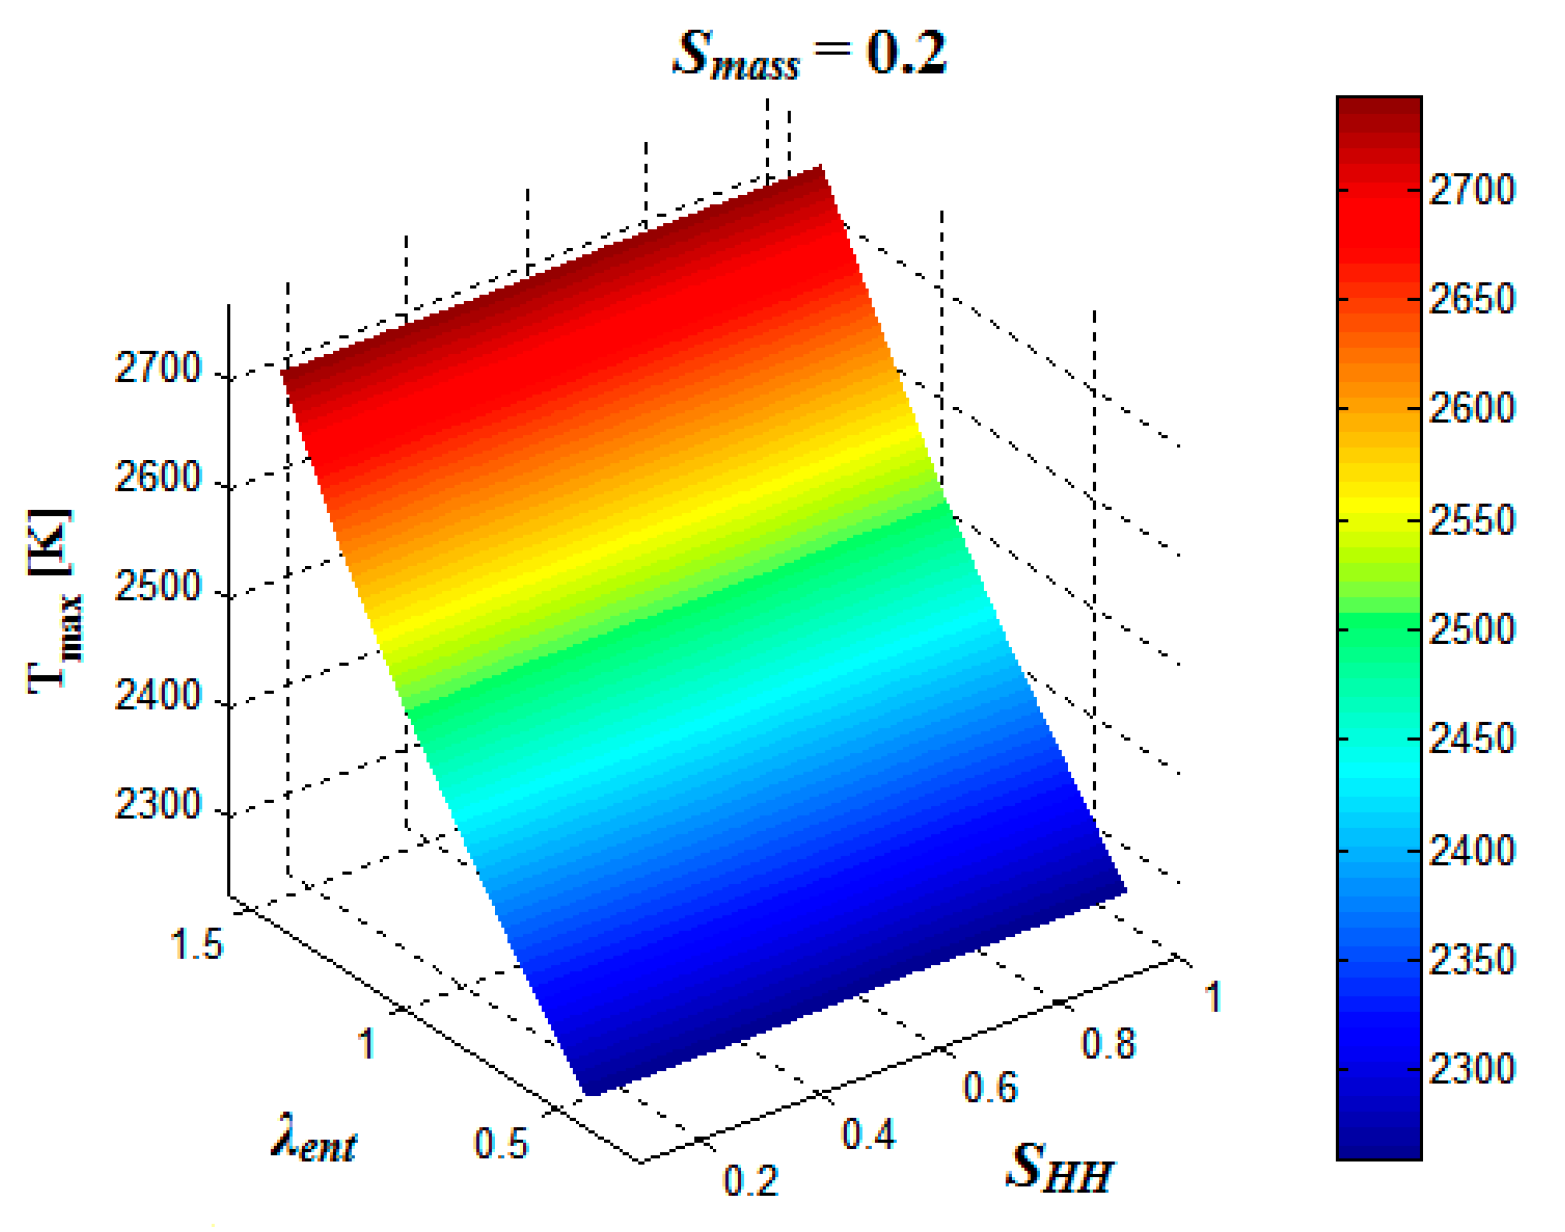
4.1. Case 1: Smass = 0.2
Since the combustion of SI engine is defined to start from 5% percent of total heat release, the initial mass coefficient Smass is introduced to consider residual gas of the last cycle and stoichiometric gas produced during the 5% combustion period. Figure 15 and Figure 16 show the peak pressure and temperature values when Smass is set to be 0.2. The entrainment factor λent causes a decrease of 0.3 bar in peak pressure and an increase of 500 K in peak temperature when λent climbs from 0.5 to 1.5. SHH makes little difference to both peak pressure and temperature.
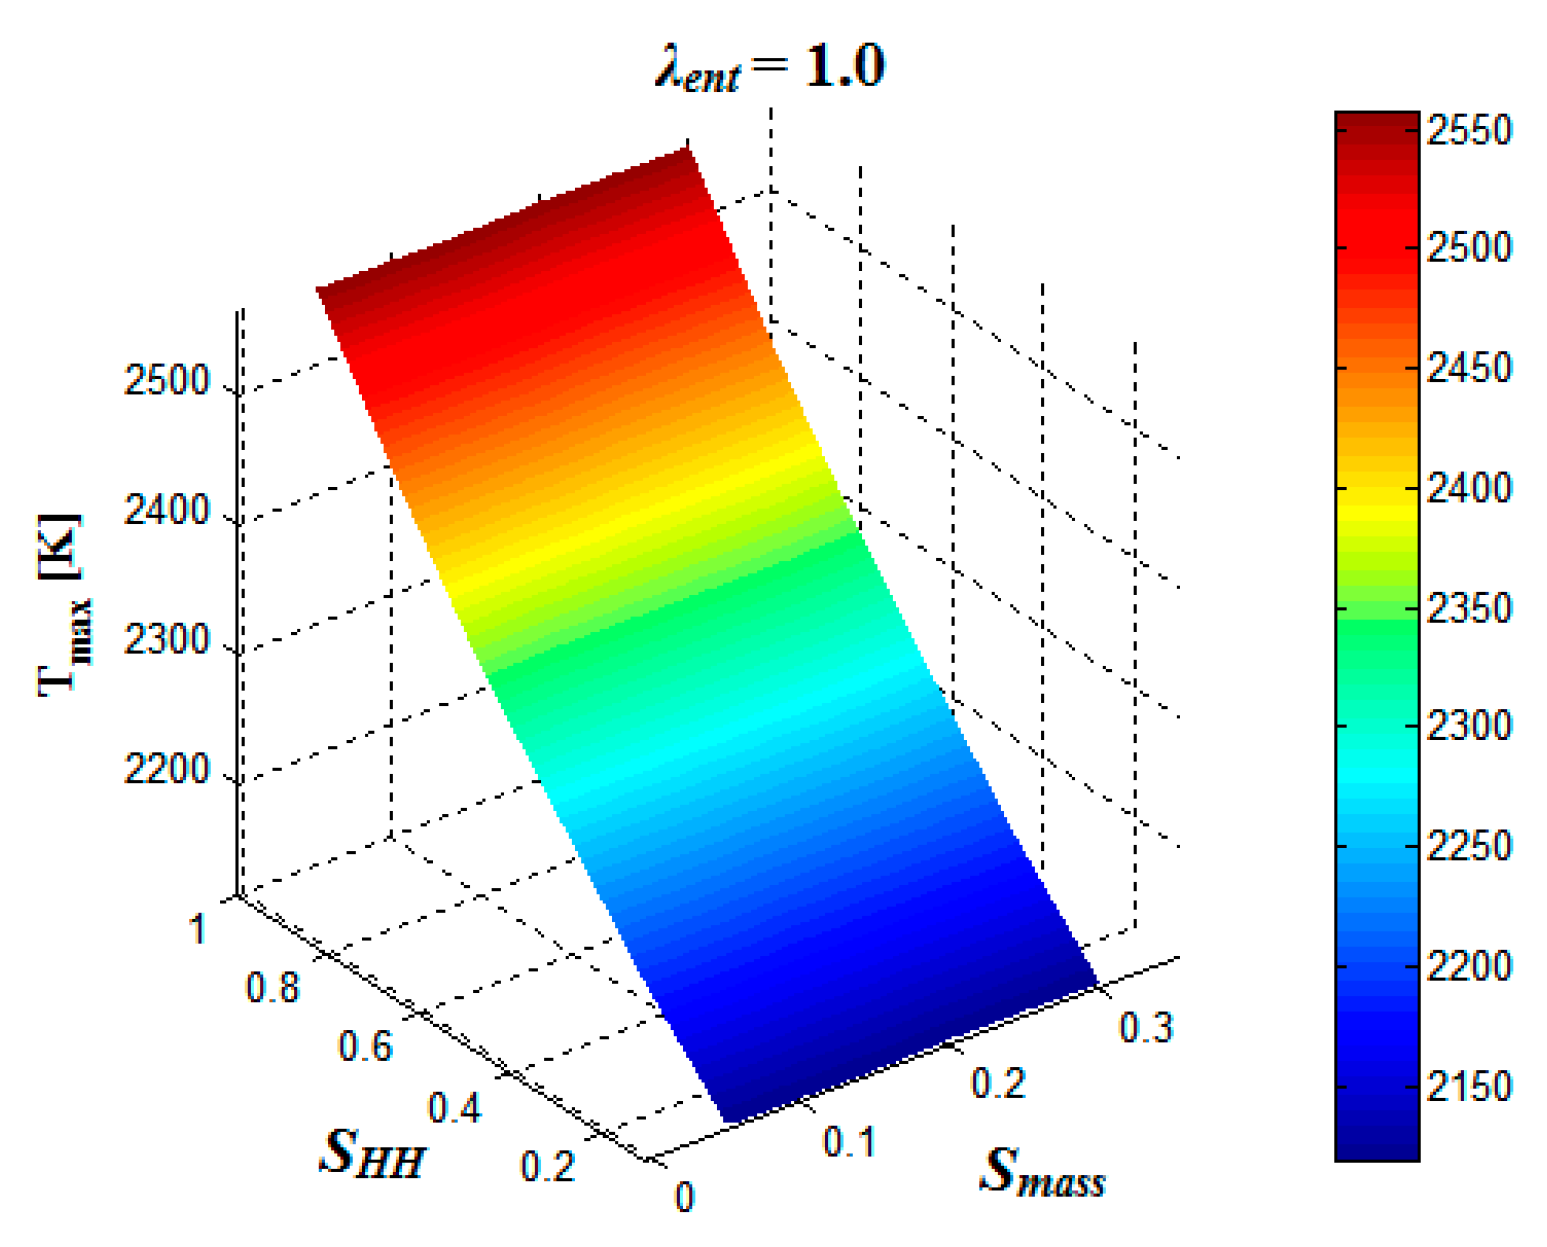
4.2. Case 2: λent = 1.0
The entrainment factor λent is defined to account for the existence of stoichiometric gas in the unburnt zone and correct the ratio of air and fuel entraining into the burnt zone. In this case, λent is set to be 1, which means that air and natural gas in unburnt zones are entrained into burnt zones in a strict stoichiometric ratio. Variation ranges of Smass and SHH are 0.05–0.3 and 0–1.0. It can be seen from Figure 17 that the peak pressure value decreases from 43.05 bar to 42.75 bar when the Heider–Holhbaum factor SHH climbs from 0 to 1. However, peak temperature value shows opposite trends rising from 2100 K to 2550 K, shown in Figure 18. The initial mass coefficient Smass does not cast visible influence on peak pressure and temperature values.
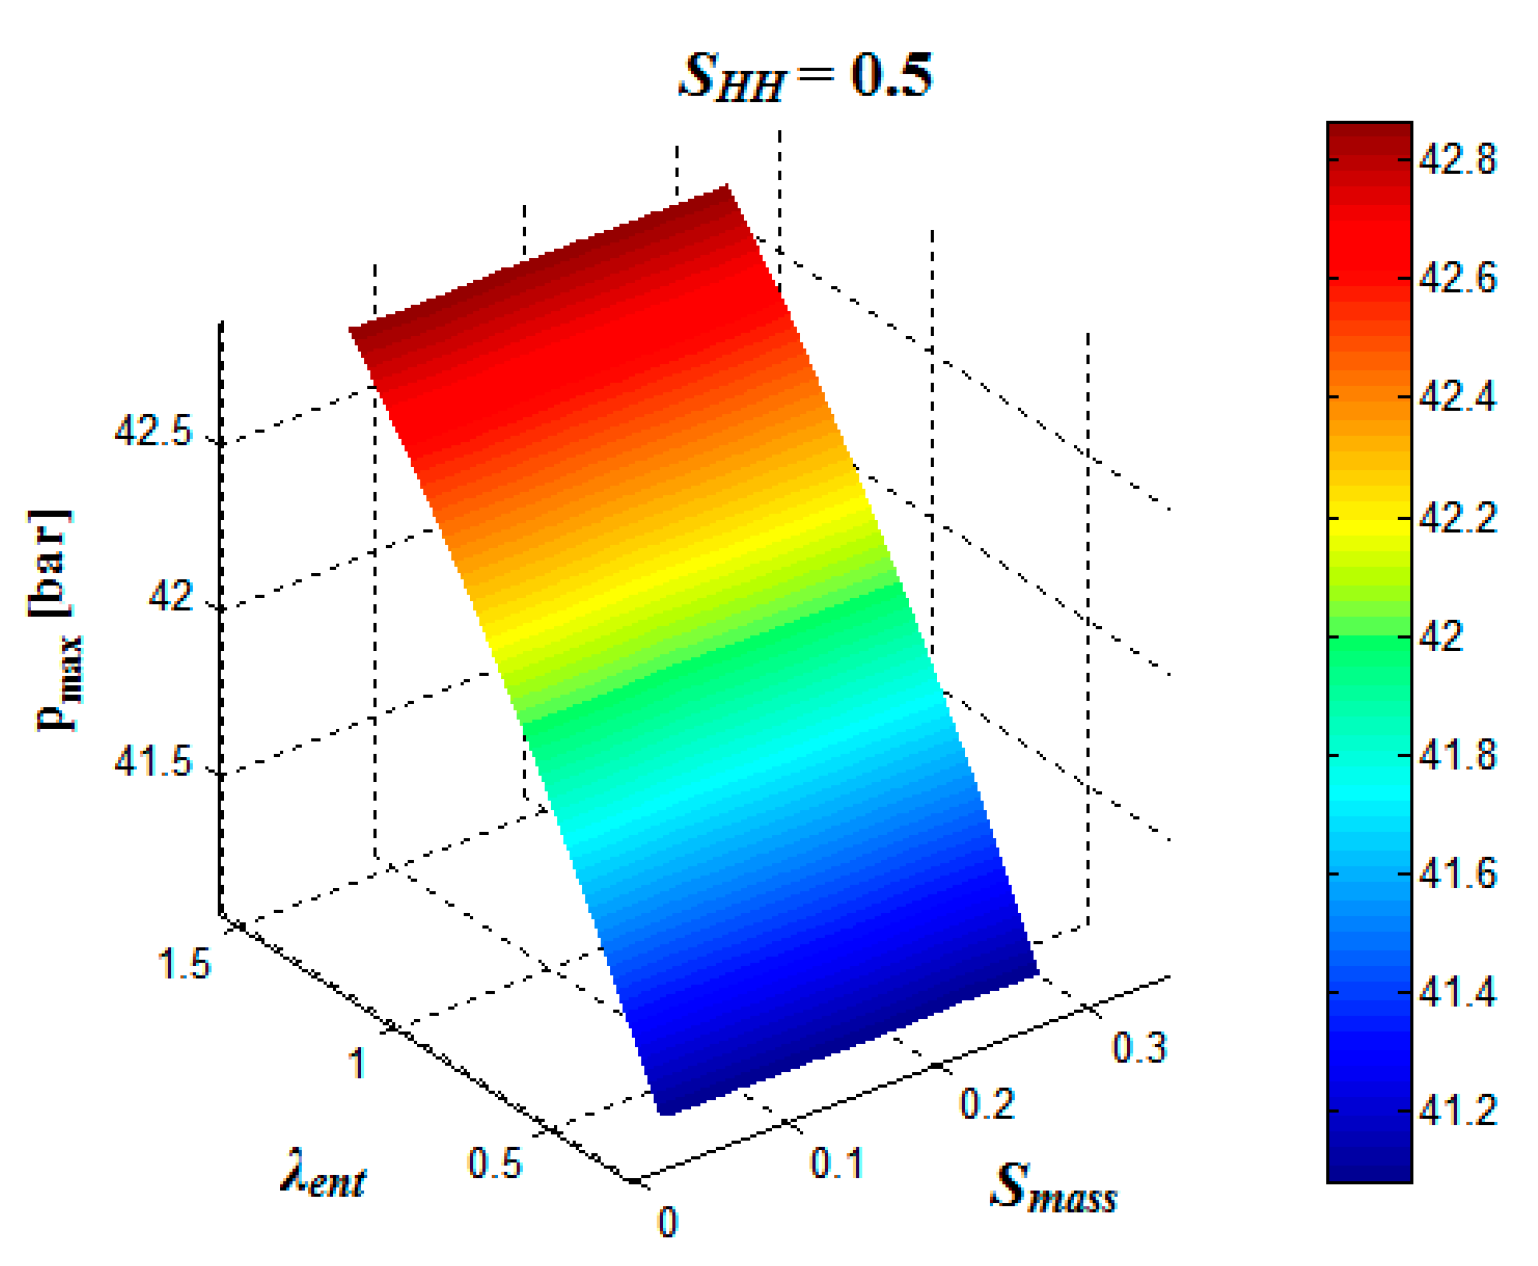
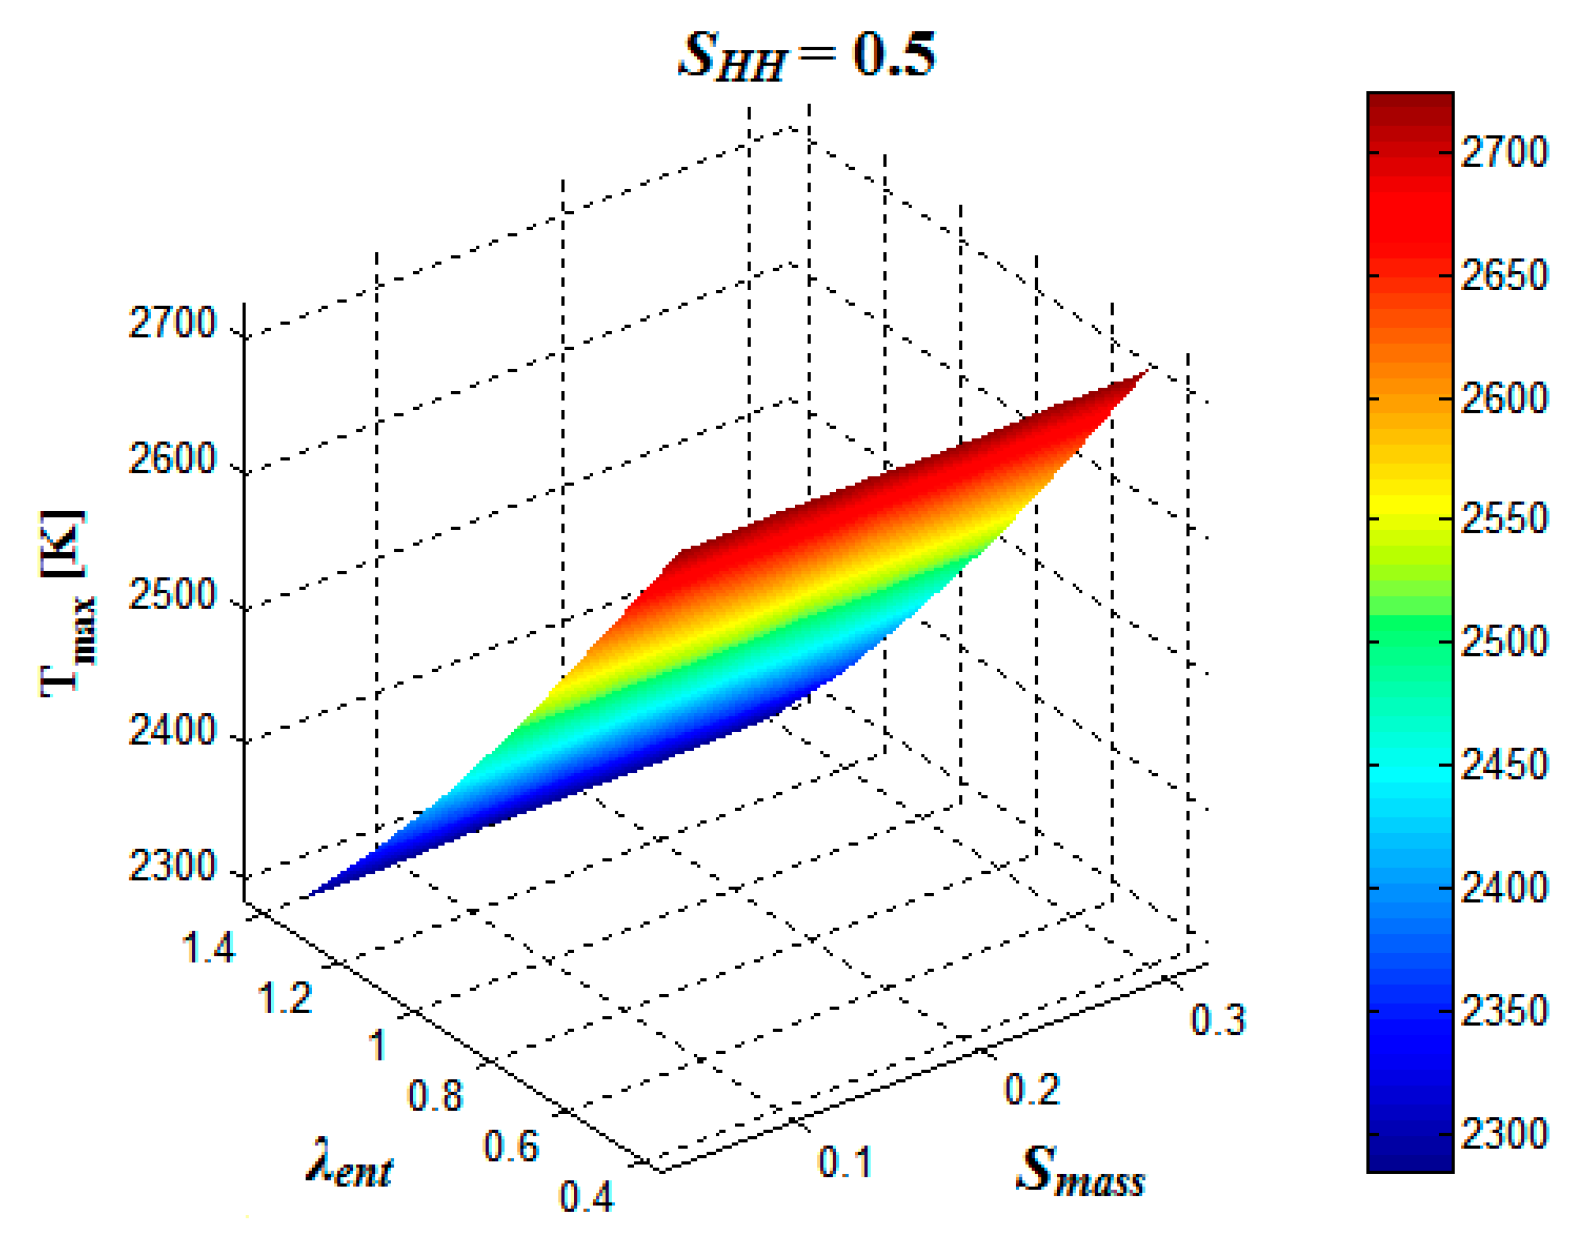
4.3. Case 3: SHH = 0.5
The Heider–Holhbaum factor SHH is introduced to correct the mass flow of stoichiometric gas leaving the burnt zone, which is originally calculated by the combustion rate ξ and air fuel ratio σ as in Equation (4). The variation ranges of λent and Smass are 0.45–1.45 and 0.05–0.30. Peak pressure rises from 41.1 bar to 42.8 bar when λent increases from 0.45 to 1.45, seen as Figure 19. Peak temperature in Figure 20 shows a downward trend from 2700 K to 2300 K with the increasing λent. Similar to case 2 (λent = 1.0), the initial mass coefficient Smass makes little difference to peak pressure and temperature.
5. Knocking Prediction
For SI natural gas engines, compression ratio and advanced ignition timing are two key joint factors of knocking and thermal efficiency, which should be considered firstly during the design period [34]. In this part, the verified simulation model will be used to investigate the effect of these two parameters on knocking probability and intensity.
5.1. Effect of Compression Ratio on Knocking
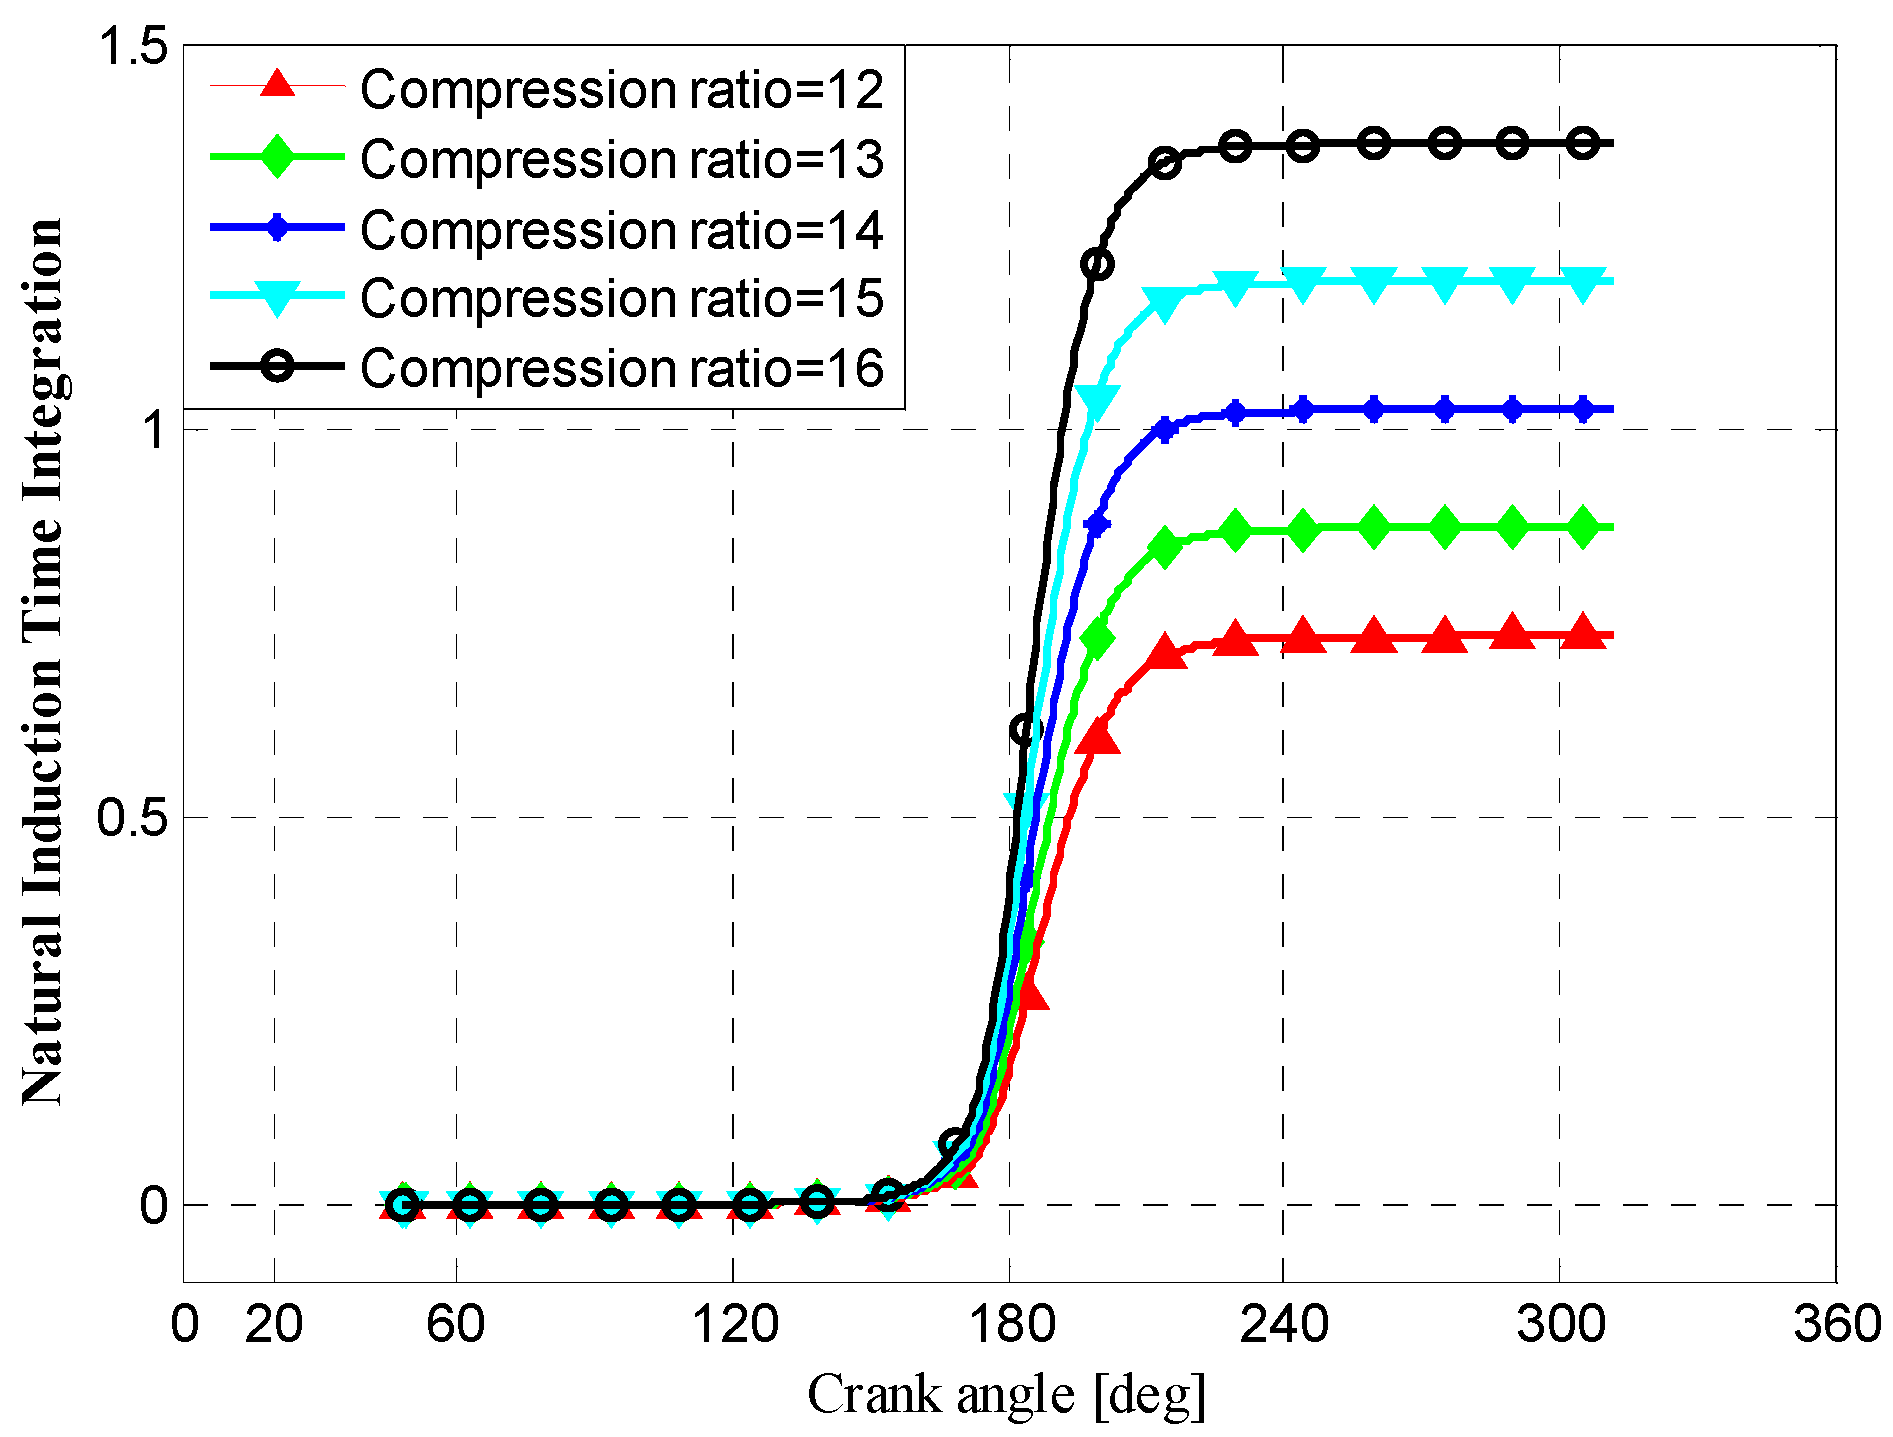
The natural gas engine with larger compression ratio burns fuel faster, achieving greater power output and better economic benefit. However, it is also accompanied with the possibility of knocking once the compression ratio reaches a certain limitation because larger compression ratios produce higher in-cylinder pressure and temperature, which promote spontaneous combustion before flame front arrives. In this section, the two-zone simulation model will be used to the investigate effect of compression ratio on knocking phenomenon.
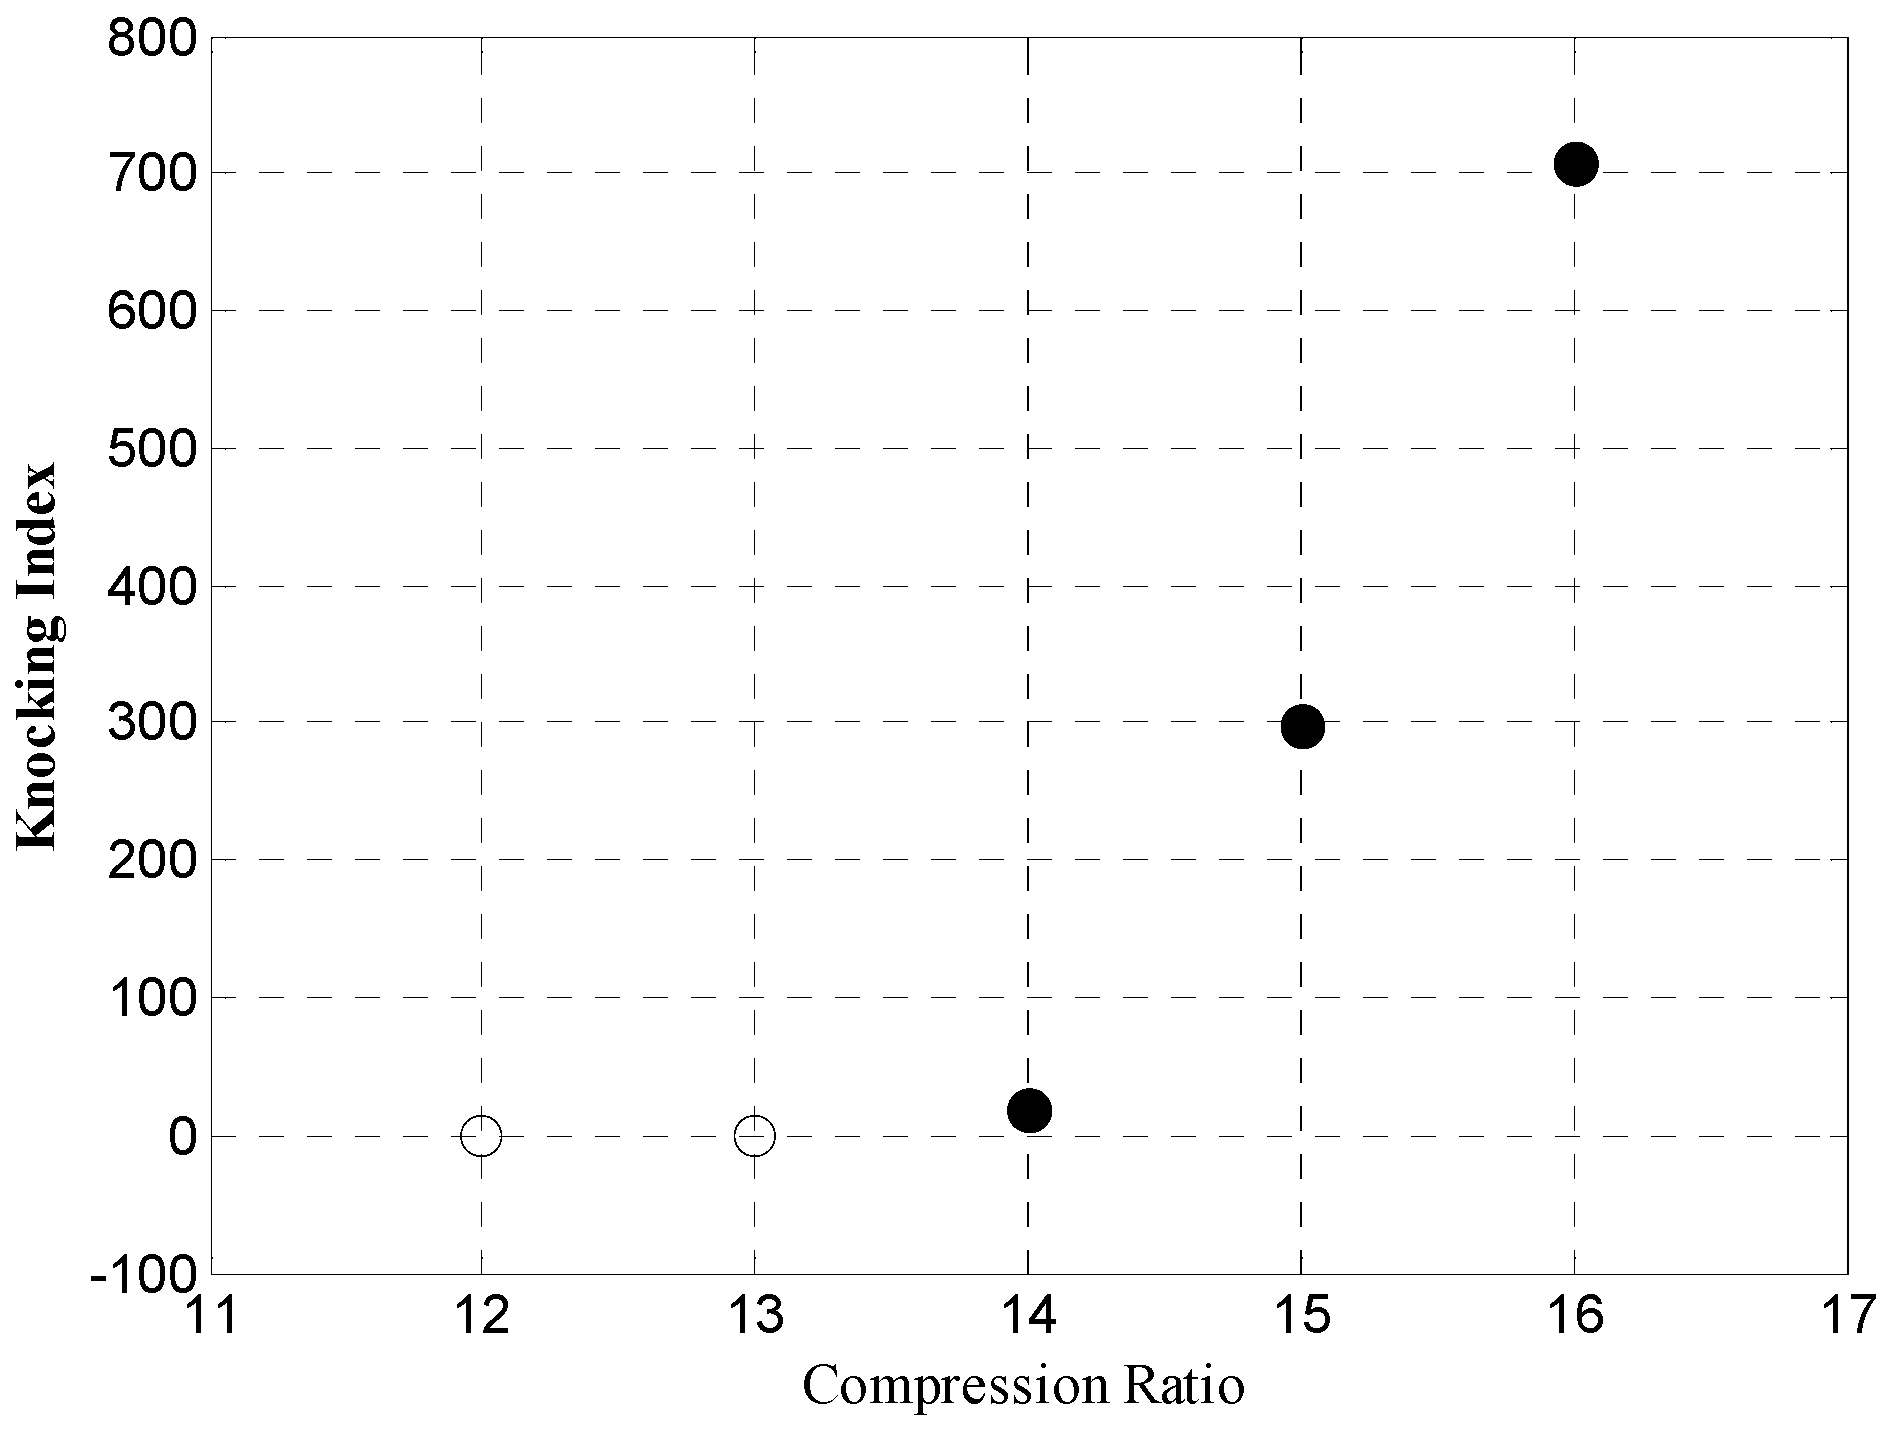
Figure 21 shows the natural induction time integration, which indicates knocking phenomenon occurring when it rises to unity. The figure indicates that compression ratio has a positive effect on knocking phenomenon since both the gradient and terminal value of natural induction time integration increase with compression ratio rising from 12 to 16. It seems the critical knocking point lies between the compression ratio of 13 and 14. The knocking index in Figure 22 represents the possibility of knocking, which shows the same trend with natural induction time integration in Figure 21.
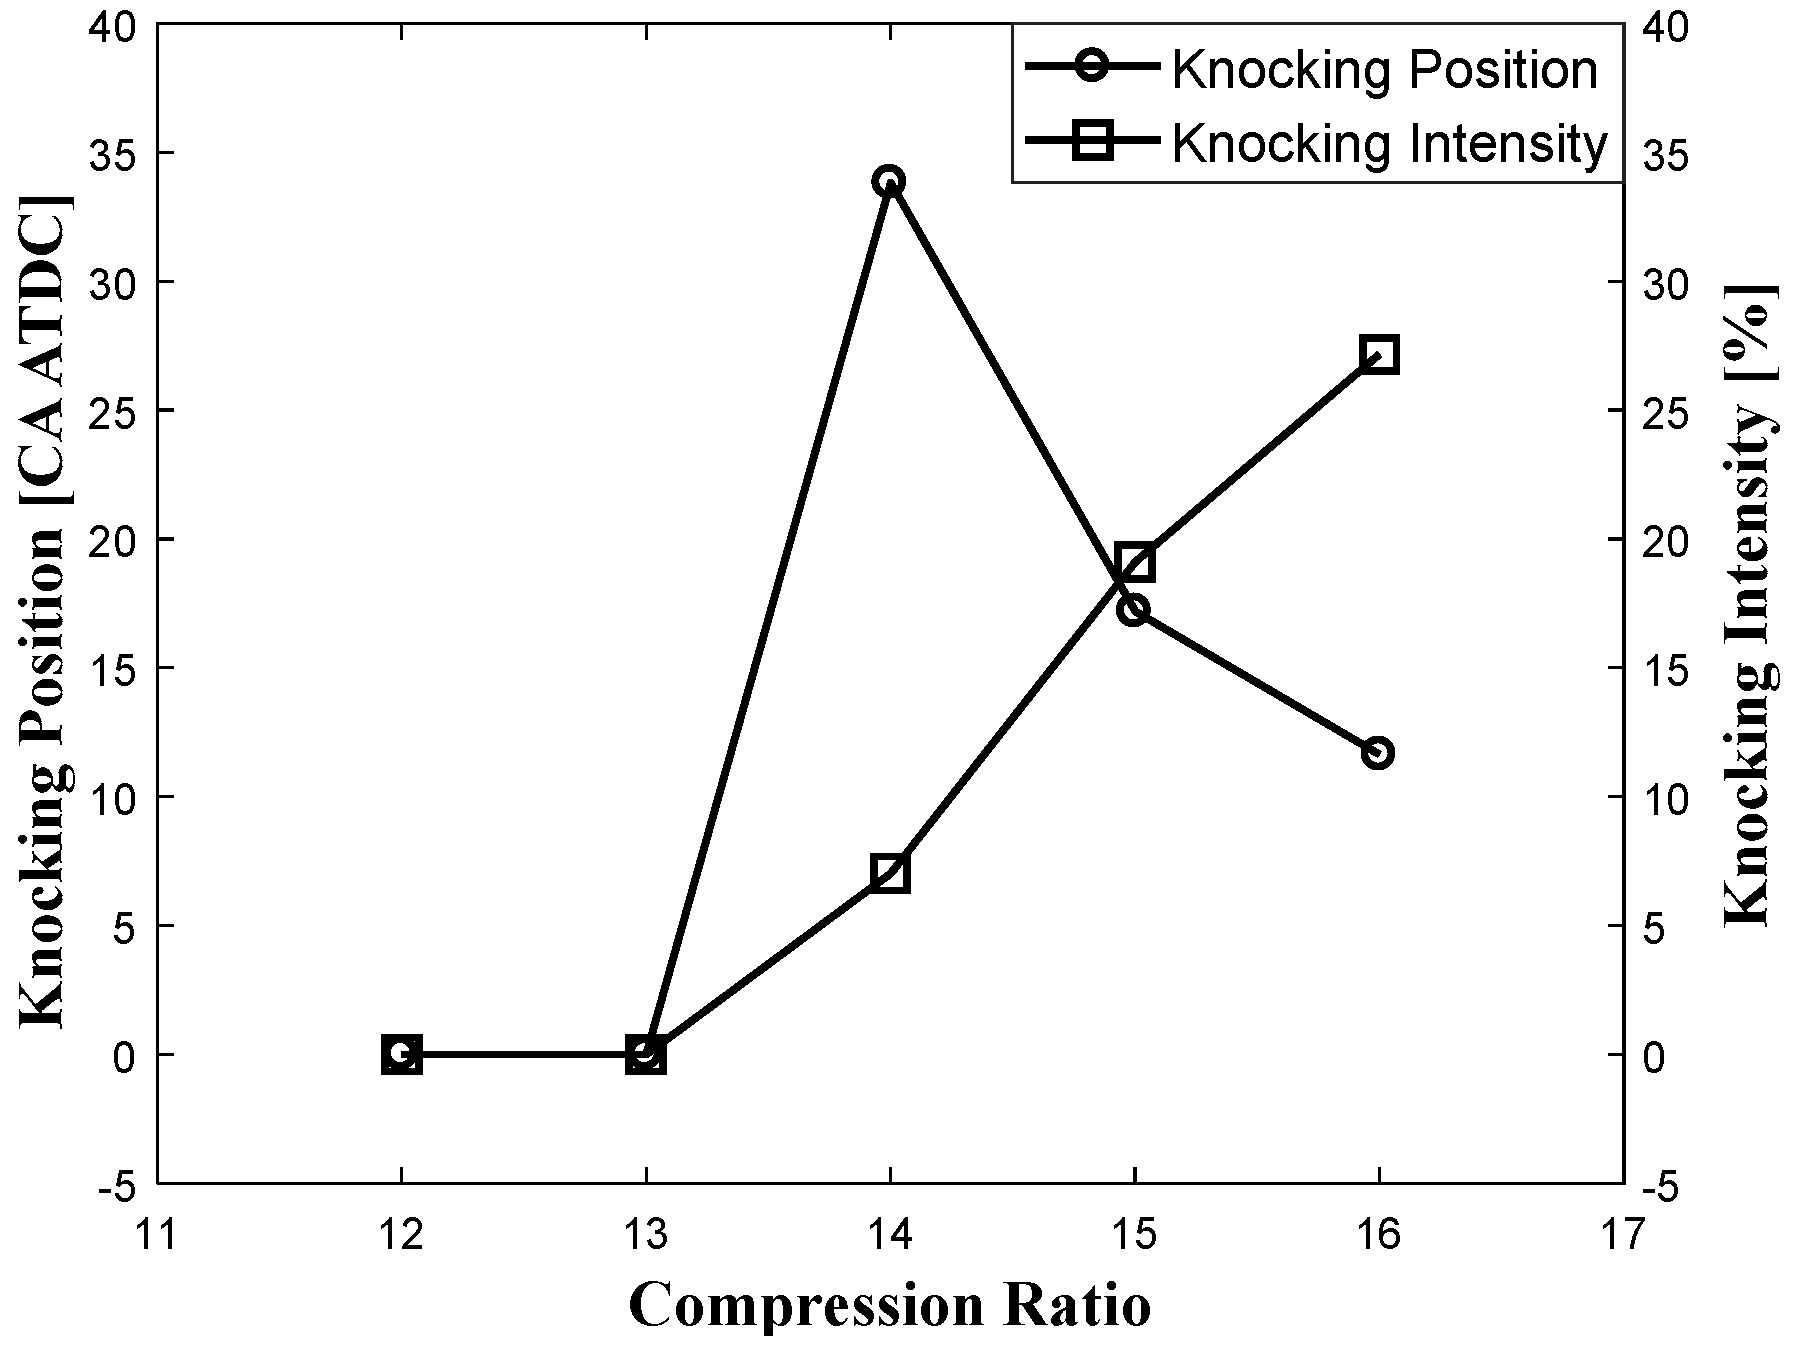
Figure 23 illustrates that the knocking phenomenon occurs 22 degrees earlier after top dead center when compression ratio increases from 14 to 16 because the temperature in unburnt zones gets higher with larger compression ratios, making natural gas in unburnt zones more prone to spontaneous combustion. The knocking intensity is shown in Figure 24, which is actually represented by the fuel percentage in unburnt zones when knocking phenomenon happens. On the assumption that all the fuel gets involved in knocking combustion, the more fuel remains in unburnt zones, the stronger the knocking intensity will be. As seen from Figure 23, knocking intensity gets stronger with larger compression ratio since the advance of knocking timing leaves more natural gas unburnt.
Compared to the original 2135 diesel engine, the compression ratio after transformation could be promoted from 11 to a value slightly below 14, which approaches the best thermal efficiency while preventing the engine from knocking. This is mainly because natural gas has a higher auto-ignition temperature than diesel fuel, which enables a larger compression ratio.
5.2. Effect of Advanced Ignition Timing on Knocking
The aim of advanced ignition timing optimization is to guarantee that the burning gas expands right at the working stroke under various working conditions, which achieves lowest mean temperature, minimum knocking probability and highest engine efficiency. In this section, the advanced ignition angle is set from 15° to 35° before top dead center (BTDC) to investigate the effect of ignition timing on knocking phenomenon.
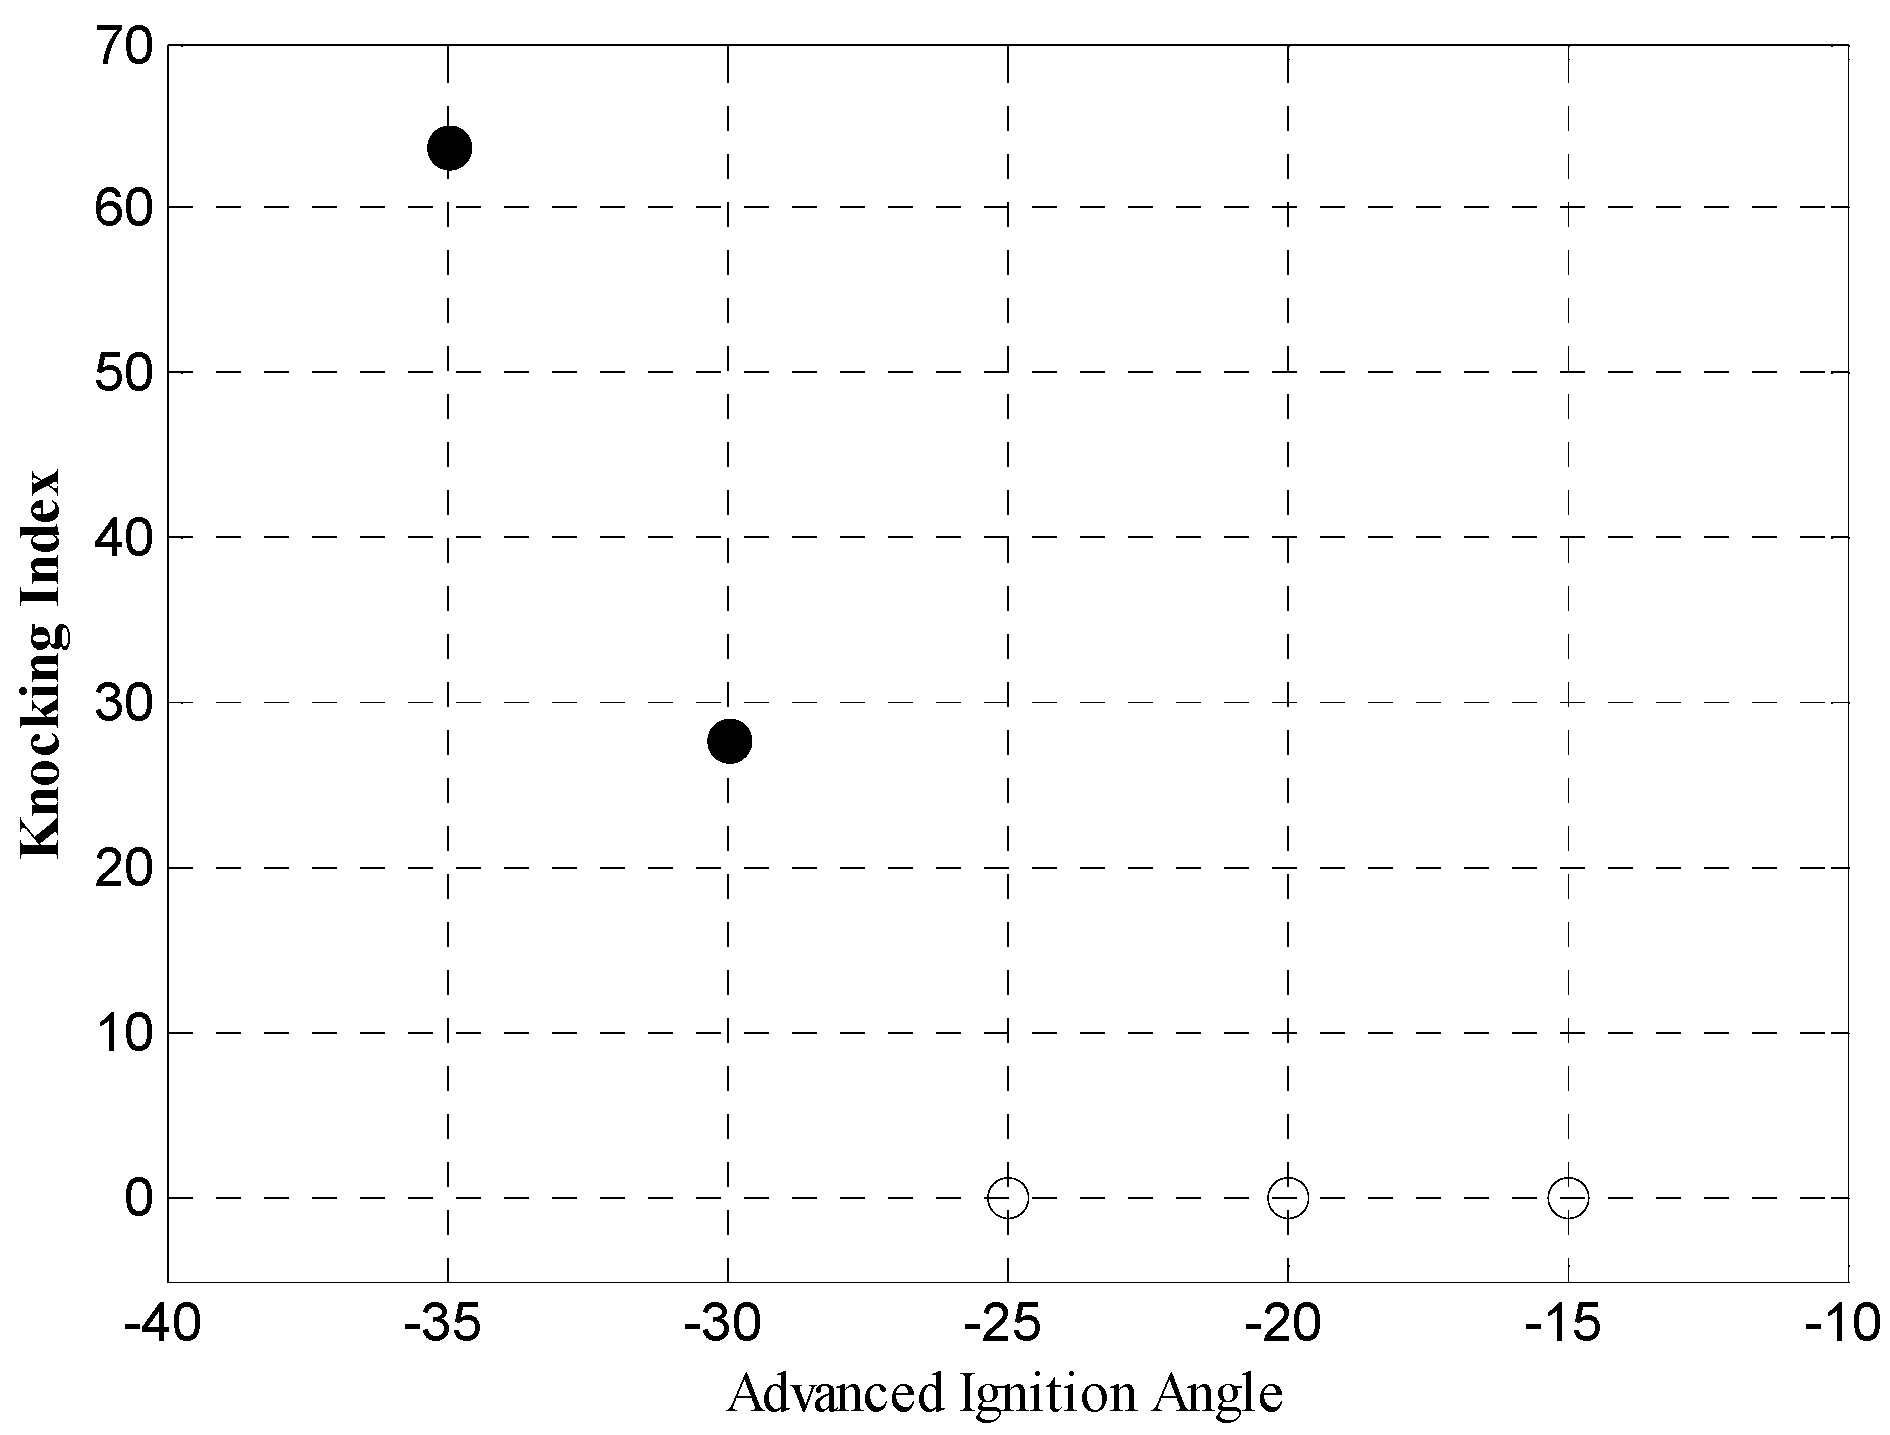
The influence of advanced ignition angle on natural induction time integration is shown in Figure 24. With increasing of advanced ignition angle, the natural induction time integration gets larger. It means knocking phenomenon is more likely to occur with the advanced ignition angle increasing, which shares the same trend with the knocking index in Figure 25. However, knocking does not occur when advanced ignition angle stays below 25° BTDC.
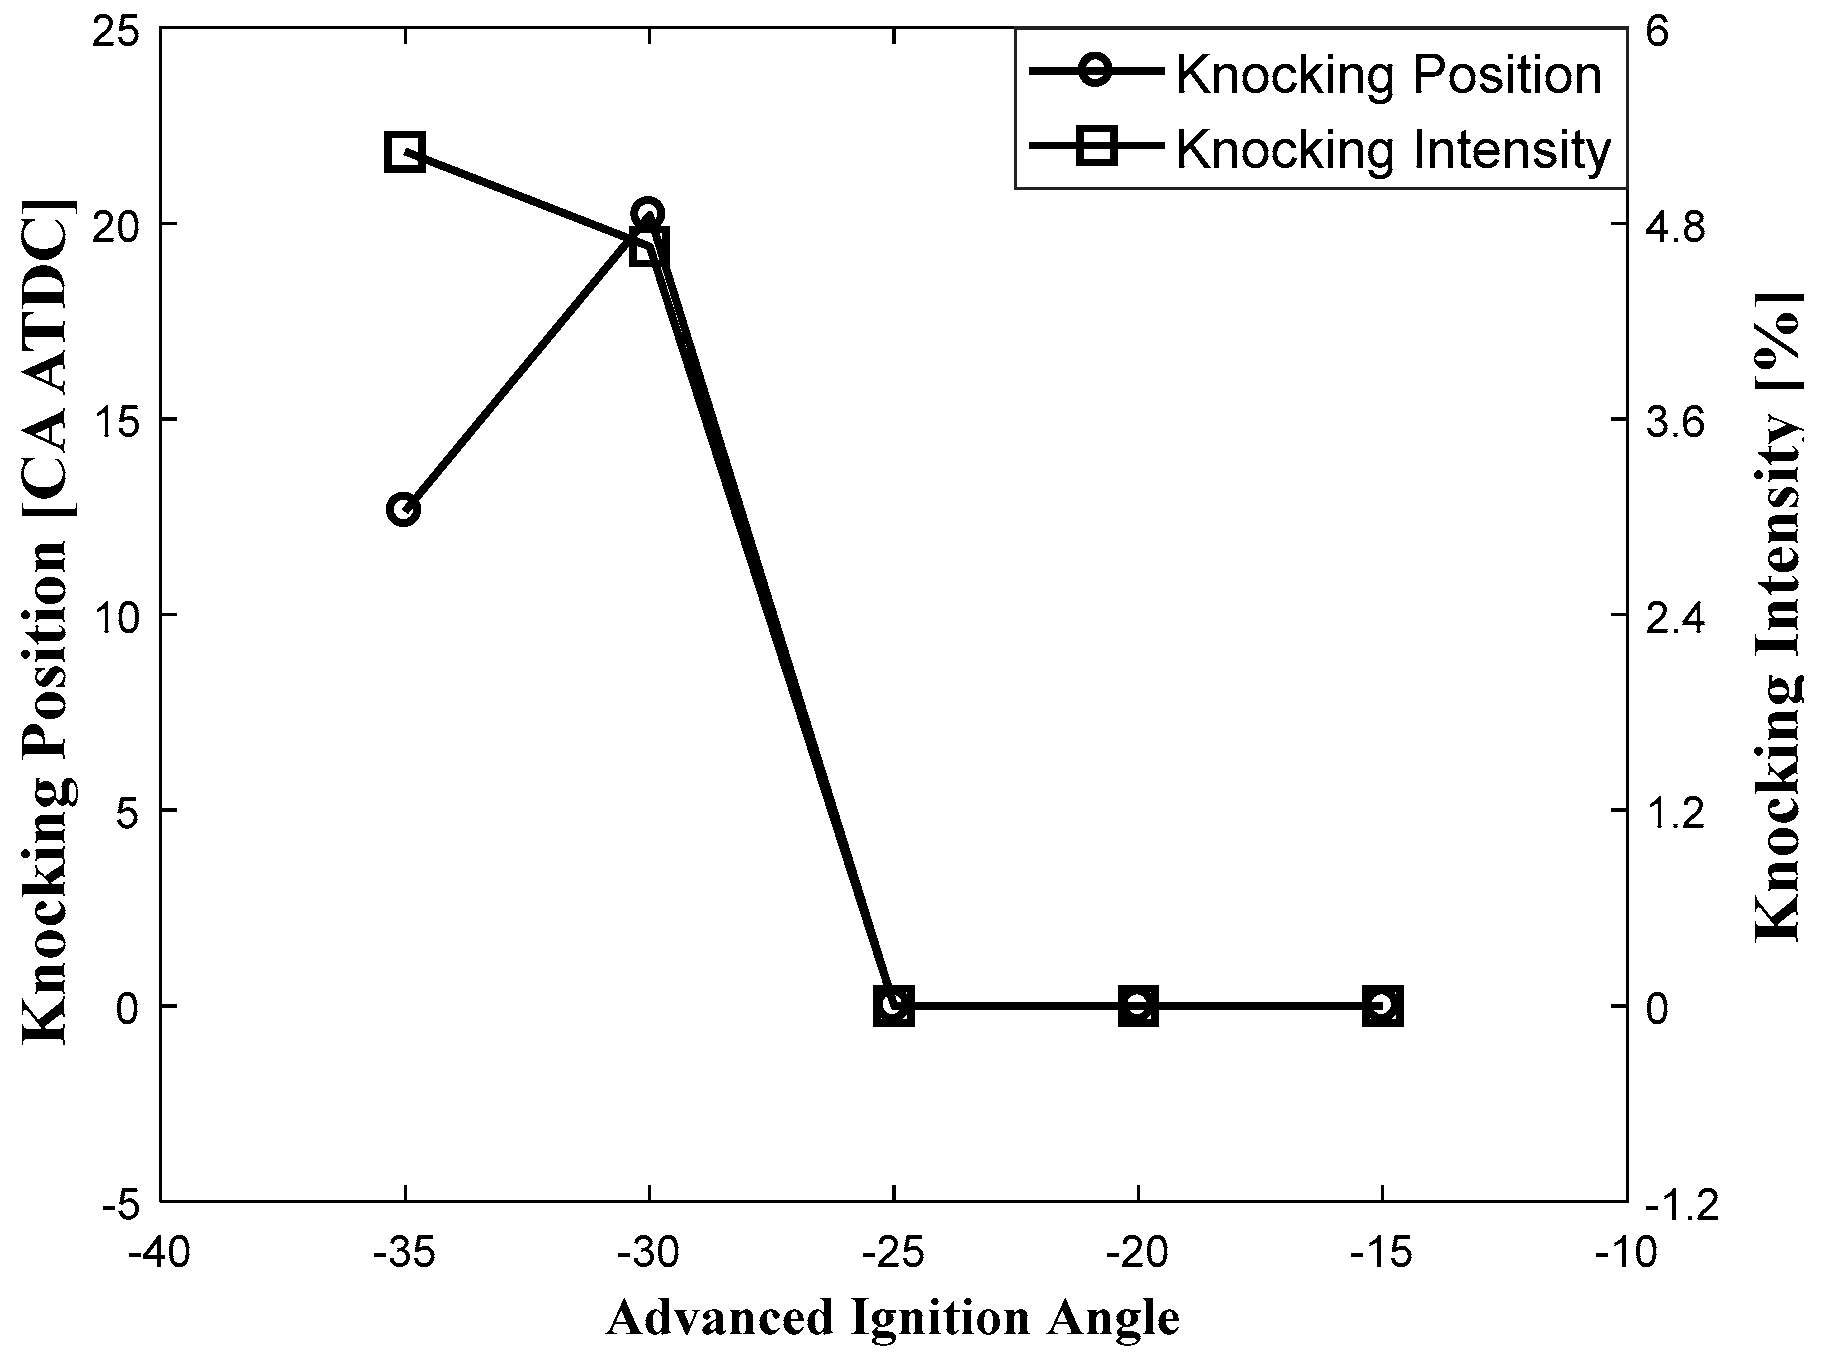
For corresponding knocking timing, Figure 26 shows that knocking phenomenon occurs early when advanced ignition angle increases. This is mainly because premature ignition advances the start of combustion and causes higher mean temperature, which promotes local spontaneous combustion in unburnt zones. In addition, the flame front has not yet spread far enough because of the advanced knocking timing, leaving more natural gas in unburnt zones. It explains why knocking gets stronger when advanced ignition angle increases, as shown in Figure 26.
According to the results above, retarding ignition timing seems a good way to prevent knocking phenomenon in SI natural gas engines. Nevertheless, overly retarded ignition timing could cause incomplete combustion due to insufficient time for flame kernel development, leading to lower engine efficiency and higher fuel consumption. Even worse misfiring happens when mixture temperatures in end zones drop below the misfiring temperature because of expansion and quenching [35]. Thus, the advanced ignition angle should be optimized to balance the knocking probability and engine efficiency.
6. Conclusions
In this paper, a two-zone model of natural gas SI engine is developed on the assumption that the combustion chamber is divided into two different temperature zones by flame front. The model accuracy is verified by measured pressure and more details are investigated by comparing to a single-zone model, including in-cylinder temperature and NO emission. Heat release rates under different working conditions are also analyzed and transformed into Vibe function form by curve fitting. Then, the three defined boundary parameters are discussed referring to peak pressure and temperature. Furthermore, research is carried out to investigate the effect of compression ratio and advanced ignition timing on knocking phenomenon. It can be concluded as follows:
- The two-zone model shows high accuracy in predicting engine performance and NO emission, thus forming a rival to its multi-zone counterpart due to the much lower computer time cost and effort needed for it.
- At the same speed, combustion starts early and the duration gets shorter with increasing of engine load. Higher engine speed shortens the combustion duration while it makes little difference to the start time of combustion.
- When Smass is fixed, increasing λent has a negative effect on peak pressure and a positive effect on peak temperature, which is the same as SHH when λent keeps constant. However, λent shows the completely opposite trend when SHH is determined. Smass does not cast a visible influence on peak pressure and temperature.
- Both the increasing compression ratio and advanced ignition angle have a promoting effect on knocking probability, knocking timing and knocking intensity. Knocking phenomenon will occur in the 2135 natural gas SI engine when compression ratio exceeds 14 or advanced ignition angle exceeds 30° BTDC.
The basic theory in this paper is to simply the flame propagation process as the volume balance between two cylindrical zones with three boundary parameters. For large-sized natural gas engines, pilot fuel or pre-chamber are commonly used as the ignition source, which indicates the existence of flame propagation. Therefore, the frame of the two-zone model in this paper can be used in large-sized gas engine simulation with an additional zone to characterize the combustion of pilot fuel or pre-chamber combustion.
Acknowledgments
This project partly is financially supported by the ‘International Science & Technology Cooperation Program of China’, 2014DFG72360 and 2014DFA71700; and the National Key R&D Program of China, 2016YFC0205203.
Author Contributions
All authors have contributed to this work. La Xiang built the simulation model, analyzed the data and write the first version of the manuscript. Enzhe Song proposed the research idea and contributed to the paper revision. Yu Ding contributed to the analysis of results, paper writing and the whole revision. All the authors have read and approved the final manuscript.
Conflicts of Interest
The authors declare no conflict of interest.
Abbreviations
| ABDC | after bottom dead center |
| ATDC | after top dead center |
| BBDC | before bottom dead center |
| BDC | bottom dead center |
| BMEP | brake mean effective pressure |
| BTDC | before top dead center |
| CA | crank angle |
| ECU | electronic control unit |
| EGR | exhaust gas recirculation |
| EO | exhaust valve open angle |
| EOC | end of combustion |
| IC | intake valve close angle |
| ICCD | intensified charge coupled detector |
| HCCI | homogeneous charge compression ignition |
| HIL | hardware-in-the-loop |
| LIF | laser-induced fluorescence |
| NO | nitric oxide |
| ON | octane number |
| SI | spark ignition |
| SOC | start of combustion |
| TDC | top dead center |
| Symbols | |
| Q1->wall | heat loss flow to cylinder wall in burnt zone |
| Q2->wall | heat loss flow to cylinder wall in unburnt zone |
| Smass | mass factor of burnt gas at initial time |
| SHH | Holhbaum-Heider coefficient |
| T1 | gas temperature in burnt zone |
| T2 | gas temperature in unburnt zone |
| V1 | volume of burnt zone |
| V2 | volume of unburnt zone |
| b1 | weight factor of premixed combustion |
| cv | specific heat at constant volume |
| cv,1 | specific heat at constant volume of burnt zone |
| cv,2 | specific heat at constant volume of unburnt zone |
| cv,a | specific heat at constant volume of air |
| cv,f | specific heat at constant volume of fuel |
| cv,sg | specific heat at constant volume of stoichiometric gas |
| enthalpy of the gas that leaves unburnt zone | |
| enthalpy of the gas that leaves burnt zone | |
| kf1, kb1, kf2, kb2 | reaction rate coefficients in Zeldovich mechanism |
| mburnt,0 | gas mass of the burnt zone at the initial moment |
| munburnt,0 | gas mass of the unburnt zone at the initial moment |
| mass flow from unburnt zone to burnt zone | |
| mass flow from burnt zone to unburnt zone | |
| m0 | gas mass in the combustion chamber at the initial time |
| m1 | gas mass in burnt zone |
| m2 | gas mass in unburnt zone |
| m1,v | shape factor of premixed combustion in Vibe function |
| m2,v | shape factor of diffusion combustion in Vibe function |
| n | rotation speed |
| p | in-cylinder gas pressure |
| ti | knocking timing |
| ua | thermodynamic energy of air |
| ucomb | combustion heat flow |
| uf | thermodynamic energy of fuel |
| usg | thermodynamic energy of chemical reaction gas |
| xa | air mass fraction |
| xf | fuel mass fraction |
| xsg | mass fraction of stoichiometric gas |
| λent | entrainment coefficient |
| σ | air fuel ratio |
| ξ | the combustion rate |
| τ | the induction time |
| Δα | combustion duration angle |
References
- Bhandari, K.; Bansal, A.; Shukla, A.; Khare, M. Performance and Emissions of Natural Gas Fueled Internal Combustion Engine: A Review; CSIR: Pretoria, South Africa, 2005. [Google Scholar]
- Kezirian, M.T.; Phoenix, S.L. Natural Gas Hydrate as a Storage Mechanism for Safe, Sustainable and Economical Production from Offshore Petroleum Reserves. Energies 2017, 10, 828. [Google Scholar] [CrossRef]
- Aziz, A.R.; Anbese, Y.T.; Hagos, F.Y.; Heikal, M.R. Characteristics of Early Flame Development in a Direct-Injection Spark-Ignition CNG Engine Fitted with a Variable Swirl Control Valve. Energies 2017, 10, 964. [Google Scholar] [CrossRef]
- Zurbriggen, F.; Hutter, R.; Onder, C. Diesel-Minimal Combustion Control of a Natural Gas-Diesel Engine. Energies 2016, 9, 58. [Google Scholar] [CrossRef]
- Mahmood, H.A.; Adam, N.M.; Sahari, B.B.; Masuri, S.U. New Design of a CNG-H2-AIR Mixer for Internal Combustion Engines: An Experimental and Numerical Study. Energies 2017, 10, 1373. [Google Scholar] [CrossRef]
- Zhen, X.; Wang, Y.; Xu, S.; Zhu, Y.; Tao, C.; Xu, T.; Song, M. The engine knock analysis—An overview. Appl. Energy 2012, 92, 628–636. [Google Scholar] [CrossRef]
- Heywood, J.B. Internal Combustion Engine Fundamentals; Mcgraw-Hill: New York, NY, USA, 1988; Volume 9, p. 457. [Google Scholar]
- Takahata, S.; Ishikawa, T.; Yamashita, T.; Kudo, T.I.; Shimizu, K.; Iijima, A.; Shoji, H. A Study of Autoignition Behavior and Knock Intensity in a SI Engine under Different Engine Speed by Using In-Cylinder Visualization; SAE Technical Paper; SAE International: Warrendale, PA, USA, 2017. [Google Scholar]
- Schießl, R.; Maas, U. Analysis of endgas temperature fluctuations in an SI engine by laser-induced fluorescence. Combust. Flame 2003, 133, 19–27. [Google Scholar] [CrossRef]
- Corti, E.; Forte, C. Statistical Analysis of Indicating Parameters for Knock Detection Purposes; SAE Technical Paper; SAE International: Warrendale, PA, USA, 2009. [Google Scholar]
- Worret, R.; Bernhardt, S.; Schwarz, F.; Spicher, U. Application of Different Cylinder Pressure Based Knock Detection Methods in Spark Ignition Engines; SAE Technical Paper; SAE International: Warrendale, PA, USA, 2002. [Google Scholar]
- Baldi, F.; Theotokatos, G.; Andersson, K. Development of a combined mean value–zero dimensional model and application for a large marine four-stroke Diesel engine simulation. Appl. Energy 2015, 154, 402–415. [Google Scholar] [CrossRef]
- Ding, Y.; Stapersma, D.; Grimmelius, H. Using Parametrized Finite Combustion Stage Models to Characterize Combustion in Diesel Engines. Energy Fuels 2012, 26, 7099–7106. [Google Scholar] [CrossRef]
- Sui, C.; Song, E.; Stapersma, D.; Ding, Y. Mean value modelling of diesel engine combustion based on parameterized finite stage cylinder process. Ocean Eng. 2017, 136, 218–232. [Google Scholar] [CrossRef]
- Demir, U.; Yilmaz, N.; Coskun, G.; Soyhan, H.S. Evaluation of zero dimensional codes in simulating IC engines using primary reference fuel. Appl. Therm. Eng. 2015, 76, 18–24. [Google Scholar] [CrossRef]
- Maurya, R.K.; Mishra, P. Parametric investigation on combustion and emissions characteristics of a dual fuel (natural gas port injection and diesel pilot injection) engine using 0-D SRM and 3D CFD approach. Fuel 2017, 210, 900–913. [Google Scholar] [CrossRef]
- Altın, I.; Bilgin, A. Quasi-dimensional modeling of a fast-burn combustion dual-plug spark-ignition engine with complex combustion chamber geometries. Appl. Therm. Eng. 2015, 87, 678–687. [Google Scholar] [CrossRef]
- Ma, F.; Mehra, R.K. Study of Quasi-Dimensional Combustion Model of Hydrogen-Enriched Compressed Natural Gas (HCNG) Engines. In Sustainable Energy-Technological Issues, Applications and Case Studies; InTech: London, UK, 2016. [Google Scholar]
- Merker, G.P.; Hohlbaum, B.; Rauscher, M. Two-Zone Model for Calculation of Nitrogen-Oxide Formation in Direct-Injection Diesel Engines; SAE Technical Paper; SAE International: Warrendale, PA, USA, 1993. [Google Scholar]
- Heider, G.; Zeilinger, K.; Woschni, G. Two-zone calculation model for the prediction of NO emissions from Diesel engines. In Proceedings of the 21st Cimac Conference, Interlaken, Switzerland, 15 May 1995. [Google Scholar]
- Rakopoulos, C.D.; Rakopoulos, D.C.; Kyritsis, D.C. Development and validation of a comprehensive two-zone model for combustion and emissions formation in a DI diesel engine. Int. J. Energy Res. 2003, 27, 1221–1249. [Google Scholar] [CrossRef]
- Gonca, G.; Sahin, B.; Parlak, A.; Ust, Y.; Ayhan, V.; Cesur, İ.; Boru, B. Theoretical and experimental investigation of the Miller cycle diesel engine in terms of performance and emission parameters. Appl. Energy 2015, 138, 11–20. [Google Scholar] [CrossRef]
- Gonca, G.; Sahin, B.; Ust, Y.; Parlak, A.; Safa, A. Comparison of steam injected diesel engine and miller cycled diesel engine by using two zone combustion model. J. Energy Inst. 2015, 88, 43–52. [Google Scholar] [CrossRef]
- Fiveland, S.B.; Assanis, D.N. Development of a Two-Zone HCCI Combustion Model Accounting for Boundary Layer Effects; SAE Technical Paper; SAE International: Warrendale, PA, USA, 2001. [Google Scholar]
- Ibrahim, A.; Bari, S. A comparison between EGR and lean-burn strategies employed in a natural gas SI engine using a two-zone combustion model. Energy Convers. Manag. 2009, 50, 3129–3139. [Google Scholar] [CrossRef]
- Liao, S.Y.; Jiang, D.M.; Huang, Z.H.; Cheng, Q.; Gao, J.; Hu, Y. Approximation of flammability region for natural gas–air–diluent mixture. J. Hazard. Mater. 2005, 125, 23–28. [Google Scholar] [CrossRef] [PubMed]
- Galindo Lopez, S. Three-Zone in-Cylinder Process Model for DI Diesel Engines; Mechanical, Maritime and Materials Engineering: Delft, The Netherlands, 2014. [Google Scholar]
- Zhang, S.; Zhu, G.; Sun, Z. A control-oriented charge mixing and two-zone HCCI combustion model. IEEE Trans. Veh. Technol. 2014, 63, 1079–1090. [Google Scholar] [CrossRef]
- Reyes, M.; Tinaut, F.V.; Melgar, A.; Pérez, A. Characterization of the combustion process and cycle-to-cycle variations in a spark ignition engine fuelled with natural gas/hydrogen mixtures. Int. J. Hydrogen Energy 2016, 41, 2064–2074. [Google Scholar] [CrossRef]
- The MathWorks. MATLAB/Simulink; The MathWorks: The Natick Mall, MA, USA, 2017. [Google Scholar]
- Kronholm, M. Demanding icebreaking—LNG-powered icebreaking features the industry’s most advanced technology. In Proceedings of the 28th CIMAC World Congress, Helsinki, Finland, 6–10 June 2016. [Google Scholar]
- Wärtsilä. 50DF Engine Technology; Wärtsilä: Helsinki, Finland, 2015. [Google Scholar]
- Gupta, M.; Bell, S.R.; Tillman, S.T. An investigation of lean combustion in a natural gas-fueled spark-ignited engine. J. Energy Resour. Technol. 1996, 118, 145–151. [Google Scholar] [CrossRef]
- Stone, R. Introduction to Internal Combustion Engines; Palgrave Macmillan: Basingstoke, UK, 2012; Volume 4. [Google Scholar]
- Cho, H.M.; He, B.-Q. Spark ignition natural gas engines—A review. Energy Convers. Manag. 2007, 48, 608–618. [Google Scholar] [CrossRef]
Figure 1.
In-cylinder space division of the SI engine.

Figure 2.
Mass and energy exchange in the two-zone model.

Figure 3.
Volume balance of the two zones.

Figure 4.
Operation window of Wärtsilä 9L50DF.

Figure 5.
Calculation flow of in-cylinder model.

Figure 6.
The transformed 2135 natural gas engine test bed.

Figure 7.
In-cylinder pressure comparison.

Figure 8.
In-cylinder temperature in two-zone models and single-zone models.

Figure 9.
Volume ratio in two-zone models and single-zone models.

Figure 10.
NO concentration in two-zone model and single-zone model.

Figure 11.
In-cylinder pressure at four working conditions.

Figure 12.
In-cylinder temperature at four working conditions.

Figure 13.
Normalized reaction coordinate at four working conditions.

Figure 14.
Heat combustion flow at four working conditions.

Figure 15.
Peak pressure values when Smass is fixed.

Figure 16.
Peak temperature values when Smass is fixed.

Figure 17.
Peak pressure values when λent is fixed.

Figure 18.
Peak temperature values when λent is fixed.

Figure 19.
Peak pressure values when SHH is fixed.

Figure 20.
Peak temperature values when SHH is fixed.

Figure 21.
Natural induction time integration with different compression ratios.

Figure 22.
Knocking index with different compression ratios.

Figure 23.
Knocking position and knocking intensity with different compression ratios.

Figure 24.
Natural induction time integration with different advanced ignition angles.

Figure 25.
Knocking index with different advanced ignition angle.

Figure 26.
Knocking position and knocking intensity with different advanced ignition angles.


Table 1.
Dimensions of original 2135 diesel engine.
| Parameter | |
|---|---|
| Bore (mm) | 135 |
| Stroke (mm) | 140 |
| Rated Engine Speed (rpm) | 1500 |
| Rated power per cylinder (kW) | 29.4 |
| Compression Ratio | 11 |
| IC (CA, ABDC) | 48 |
| EO (CA, BBDC) | 48 |
Table 2.
Natural gas composition used in engine test.
| Compositions | Volumetric Ratio (%) |
|---|---|
| CH4 | 76.66 |
| C2H6 | 17.76 |
| C3H8 | 4.61 |
| i-C4H10 | 0.19 |
| n-C4H10 | 0.41 |
| C5H12 | 0.06 |
| N2 | 0.31 |
Table 3.
Engine operation parameters at different engine working conditions.
| N (r/min) | Load (%) | Throttle Controller (%) | Torque (N∙m) | Fuel Flow (kg/h) | Peak Pressure (bar) | Peak Position (° CA) |
|---|---|---|---|---|---|---|
| 800 | 10 | 5.6 | 20.9 | 1.42 | 11.81 | 18 |
| 25 | 6.5 | 51.2 | 1.94 | 19.77 | 11 | |
| 50 | 10.5 | 99.3 | 2.83 | 32.92 | 6 | |
| 75 | 16 | 148.1 | 3.75 | 44.42 | 5 | |
| 1000 | 10 | 5.91 | 20.3 | 1.70 | 10.96 | 18 |
| 25 | 6.9 | 50.1 | 2.31 | 19.61 | 12 | |
| 50 | 12 | 101.6 | 3.47 | 31.08 | 9 | |
| 75 | 18 | 152.1 | 4.67 | 45.05 | 4 | |
| 1200 | 10 | 6.5 | 19.6 | 2.04 | 12.83 | 15 |
| 25 | 7.7 | 50.1 | 2.76 | 19.64 | 12 | |
| 50 | 13.5 | 100.4 | 4.07 | 31.07 | 9 | |
| 75 | 20 | 151.4 | 5.49 | 44.22 | 4 |
Table 4.
Vibe parameters under different working conditions
| n (r/min) | Load (%) | SOC (° CA) | Δα (° CA) | b1 | m1,v | m2,v |
|---|---|---|---|---|---|---|
| 800 | 10 | 178 | 120 | 0.95 | 0.14 | 6 |
| 25 | 174 | 121 | 0.95 | 0.06 | 6 | |
| 50 | 167 | 111 | 0.95 | 0.05 | 6 | |
| 75 | 166 | 112 | 0.95 | 0.08 | 6 | |
| 1000 | 10 | 180 | 115 | 0.95 | 0.16 | 8 |
| 25 | 171 | 119 | 0.95 | 0.12 | 8 | |
| 50 | 168 | 120 | 0.95 | 0.10 | 6 | |
| 75 | 166 | 119 | 0.95 | 0.04 | 6 | |
| 1200 | 10 | 178 | 110 | 0.95 | 0.08 | 8 |
| 25 | 175 | 113 | 0.95 | 0.10 | 8 | |
| 50 | 168 | 102 | 0.95 | 0.18 | 6 | |
| 75 | 168 | 102 | 0.95 | 0.15 | 6 |
Table 5.
Boundary parameters variation.
| Boundary Parameters | Case 1 | Case 2 | Case 3 |
|---|---|---|---|
| Smass | 0.2 | 0.05–0.30 (0.05) | 0.05–0.30 (0.05) |
| λent | 0.4–1.4 (0.2) | 1.0 | 0.4–1.4 (0.2) |
| SHH | 0.1–1.0 (0.18) | 0.1–1.0 (0.18) | 0.5 |
© 2018 by the authors. Licensee MDPI, Basel, Switzerland. This article is an open access article distributed under the terms and conditions of the Creative Commons Attribution (CC BY) license (http://creativecommons.org/licenses/by/4.0/).
Share and Cite
MDPI and ACS Style
Xiang, L.; Song, E.; Ding, Y. A Two-Zone Combustion Model for Knocking Prediction of Marine Natural Gas SI Engines. Energies 2018, 11, 561. https://doi.org/10.3390/en11030561
AMA Style
Xiang L, Song E, Ding Y. A Two-Zone Combustion Model for Knocking Prediction of Marine Natural Gas SI Engines. Energies. 2018; 11(3):561. https://doi.org/10.3390/en11030561
Chicago/Turabian StyleXiang, La, Enzhe Song, and Yu Ding. 2018. "A Two-Zone Combustion Model for Knocking Prediction of Marine Natural Gas SI Engines" Energies 11, no. 3: 561. https://doi.org/10.3390/en11030561
Note that from the first issue of 2016, this journal uses article numbers instead of page numbers. See further details here.