A High-Precision Adaptive Thermal Network Model for Monitoring of Temperature Variations in Insulated Gate Bipolar Transistor (IGBT) Modules


1
Tianjin Key Laboratory of Control Theory & Applications in Complicated System, Tianjin University of Technology, Tianjin 300384, China
2
School of Electrical Engineering and Automation, Tianjin University, Tianjin 300072, China
*
Author to whom correspondence should be addressed.
Energies 2018, 11(3), 595; https://doi.org/10.3390/en11030595
Submission received: 20 January 2018
/
Revised: 27 February 2018
/
Accepted: 6 March 2018
/
Published: 8 March 2018
Abstract
:This paper proposes a novel method for optimizing the Cauer-type thermal network model considering both the temperature influence on the extraction of parameters and the errors caused by the physical structure. In terms of prediction of the transient junction temperature and the steady-state junction temperature, the conventional Cauer-type parameters are modified, and the general method for estimating junction temperature is studied by using the adaptive thermal network model. The results show that junction temperature estimated by our adaptive Cauer-type thermal network model is more accurate than that of the conventional model.
1. Introduction
As a key component in the modern power-electronic system, insulated gate bipolar transistors (IGBTs) are widely used in high-reliability systems [1] and play a significant role in wind turbines [2,3], aircraft [3,4], electric vehicles [5,6,7,8], etc. The reason for the widespread application of IGBTs lies in IGBTs’ excellent performance in the aspects of switching frequency, energy efficiency, power density and cost effectiveness [9]. Simultaneously, ever more formidable working conditions and stricter operating conditions require higher quality. Almost 60% of power equipment failure results from higher junction temperatures caused by heat and increase of the thermal resistance or extra power loss, according to relevant data [10,11,12]. The reliability research of semiconductors depends on accurate measurement of the junction temperature. Consequently, the junction temperature of the IGBT is considered as one of important indices for its health and reliability.
The accurate junction temperature is the important foundation of virtual simulation, precise design and practice. The main prediction methods of junction temperature involve infrared camera detection, thermal-sensitive electrical parameters (TSEPs) and electrothermal network models [13]. The most obvious advantage of infrared camera detection lies in the capturing of the temperature field; however, the IGBT’s package must be removed during the measuring [14,15]. Regarding the TSEPs, on-state voltage (Vce-on) [16], gate threshold voltage (Vge) [17], turn-on time (ton) [18], turn-off time (toff) [19] and other electrical parameters will contribute to the prediction of the junction temperature. However, circuitry design would be more complicated with the higher precision required, making this method quite expensive [20]. The last method, the use of the electrothermal network model, can provide accurate transient junction temperature and steady-state junction temperature information, thereby enabling on-line monitoring of the junction temperature without a complicated measuring circuit. Hence, the electrothermal network model is extensively used and shows prospects for further development [21,22].
The current studies of the resistance-capacitance (RC) thermal network are divided into the use of the Foster-type and Cauer-type models; the Foster-type model is based on the measurement of the temperature dynamics of power devices [23], and the Cauer-type model is based on the physical structure of the device and is considered to be a relatively accurate model of the thermal behaviours of IGBTs [24,25]. In [26], a Foster-type model was introduced for the IGBTs used in a three-phase inverter. To solve the thermal coupling effects among the chips, the three-dimensional RC-lumped thermal networks were proposed [27,28]. As such, a dynamic electrothermal model extended to a paralleled system was proposed to establish a transient model to characterize the relationship between power losses and junction temperature [29]. One problem with the Foster-type thermal network is that its parameters are based on mathematical fitting of the measured/simulated junction temperature curves, and each of the RC-lumped elements in the Foster-type network has no physical meaning. Therefore, the Cauer-type model was proposed to obtain the temperature distribution of each layer. In [30], a Cauer-type model to monitor an IGBT’s health condition was presented. The thermal model consisting of a three-dimension network of RC cells constructed for time-dependent operation was proposed [31]. Malberti [32] introduced the Elmore delay equation to model the propagation delay times of the heat flux in the layers of IGBT. However, some problems were ignored in these studies: (a) based on the extraction of parameters at constant temperature, without considering the temperature dependence of the thermal conductivity and the specific heat capacity, the deviation of Cauer-type model will be amplified at certain temperatures; (b) the transient thermal behaviour of the IGBT is oversimplified by treating each layer as a block with uniform temperature distribution, resulting in poor prediction performance of the model.
On the basis of the previous analysis, this paper proposes the optimization of the adaptive temperature Cauer-type network model. The optimization lies in:
- (a)
- Obvious improvement of the accuracy of the prediction of the steady-state junction temperature, considering the influence of temperature.
- (b)
- Efficient improvement of the prediction performance of the transient junction temperature by redefining the hierarchical Cauer-type architecture for the internal structure of the module.
The updated network not only strongly improves the accuracy of the estimated transient junction temperature variation for IGBTs but also highly contributes to optimizing the prediction performance of the steady-state junction temperature.
This paper is organized as follows: Section 2 presents an analysis of the deviation of the model based on the materials properties and physical structures successively to perform optimization accordingly. Section 3 verifies the efficiency of the model via simulation experiments. Section 4 shows the validation of the simulation results in practice.
2. Methods
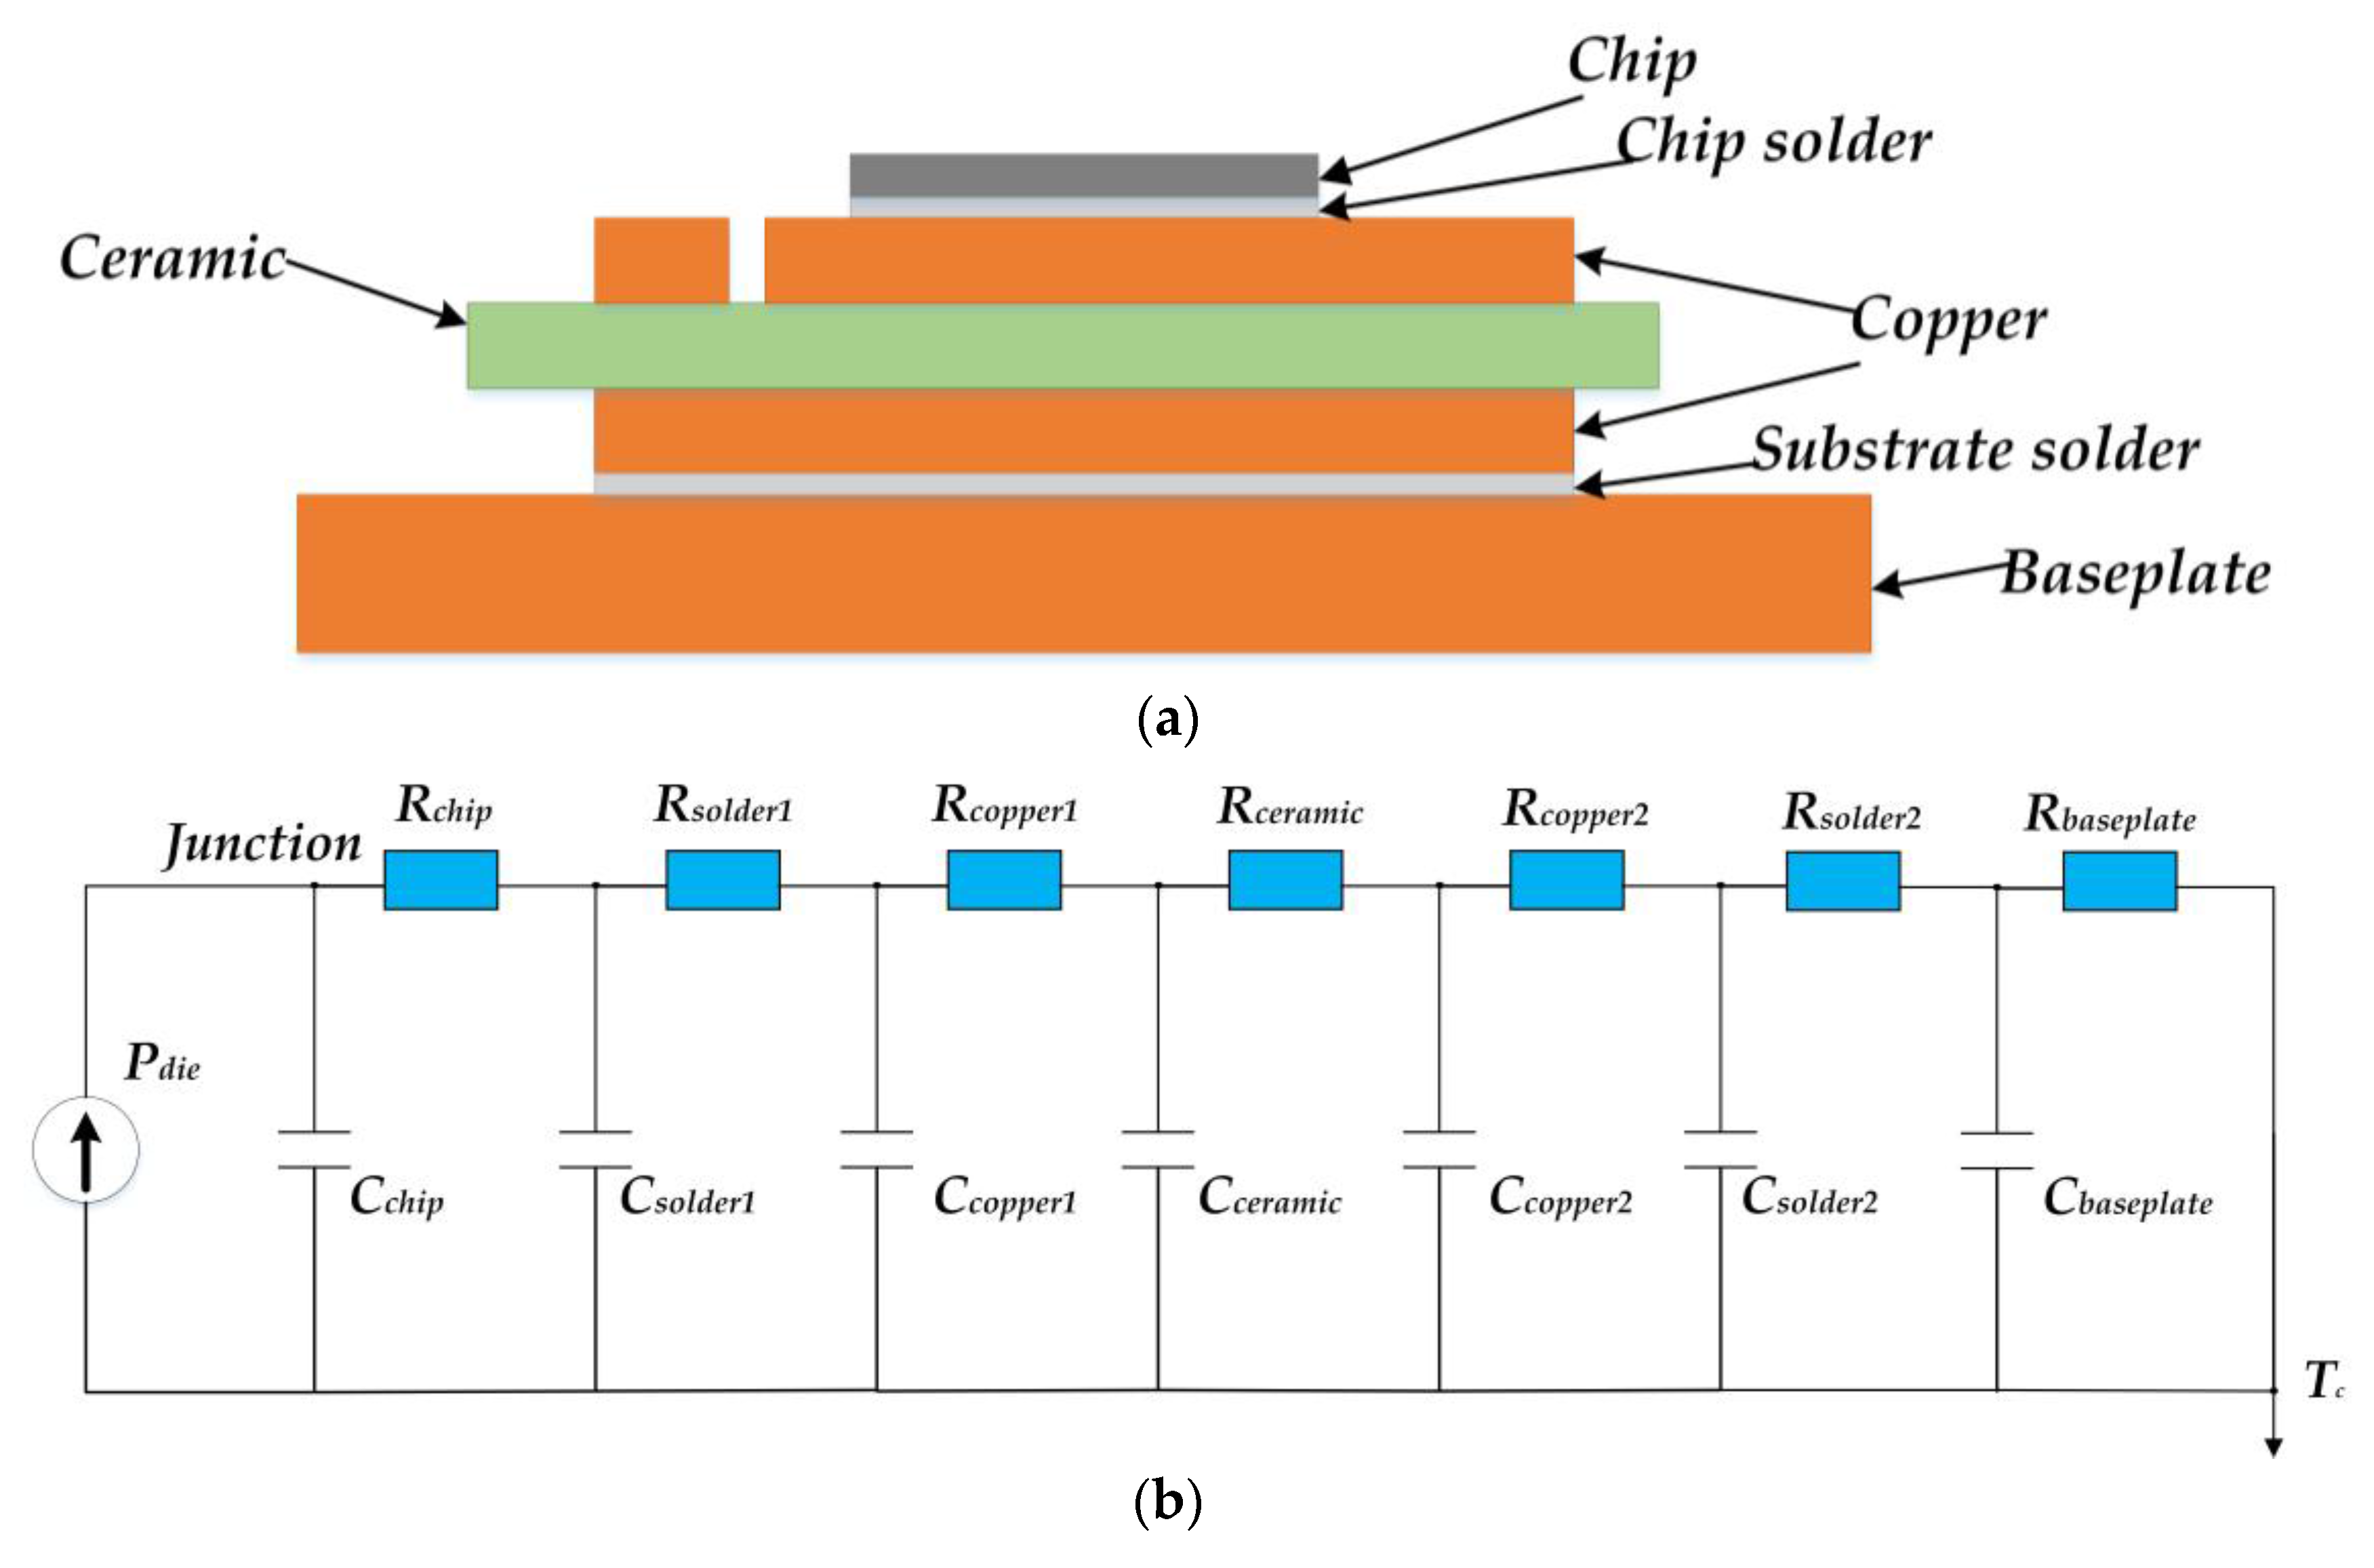
The basic structure of IGBT and its conventional lumped Cauer-type thermal network model are shown in Figure 1. Figure 1a shows the seven-level sandwich structure of the IGBT module from chip to baseplate. Figure 1b shows a circuit used to establish a complete seven-order IGBT heat transfer network structure on the basis of the theory of electrothermal analogy. For each layer, the thermal resistance Rth and thermal capacitance Cth are calculated using the equations below:
where di is the thickness of the ith layer, ki is the thermal conductivity of the ith layer, ci is the specific heat capacity of the ith layer, ρi is the density of the ith layer material, and A(z) is the effective cross-sectional area of the ith layer and the heat spreading angle of each layer can be calculated by Equations (3) and (4) [33]:
where a is the contact area with adjacent layers, and θ is the heat spreading angle.
Based on the conventional lumped Cauer-type model, the improved method proposed in this paper is conducted using the following two steps:
• Establish the Cauer-type thermal network of the non-constant thermal conductivity and the specific heat capacity.
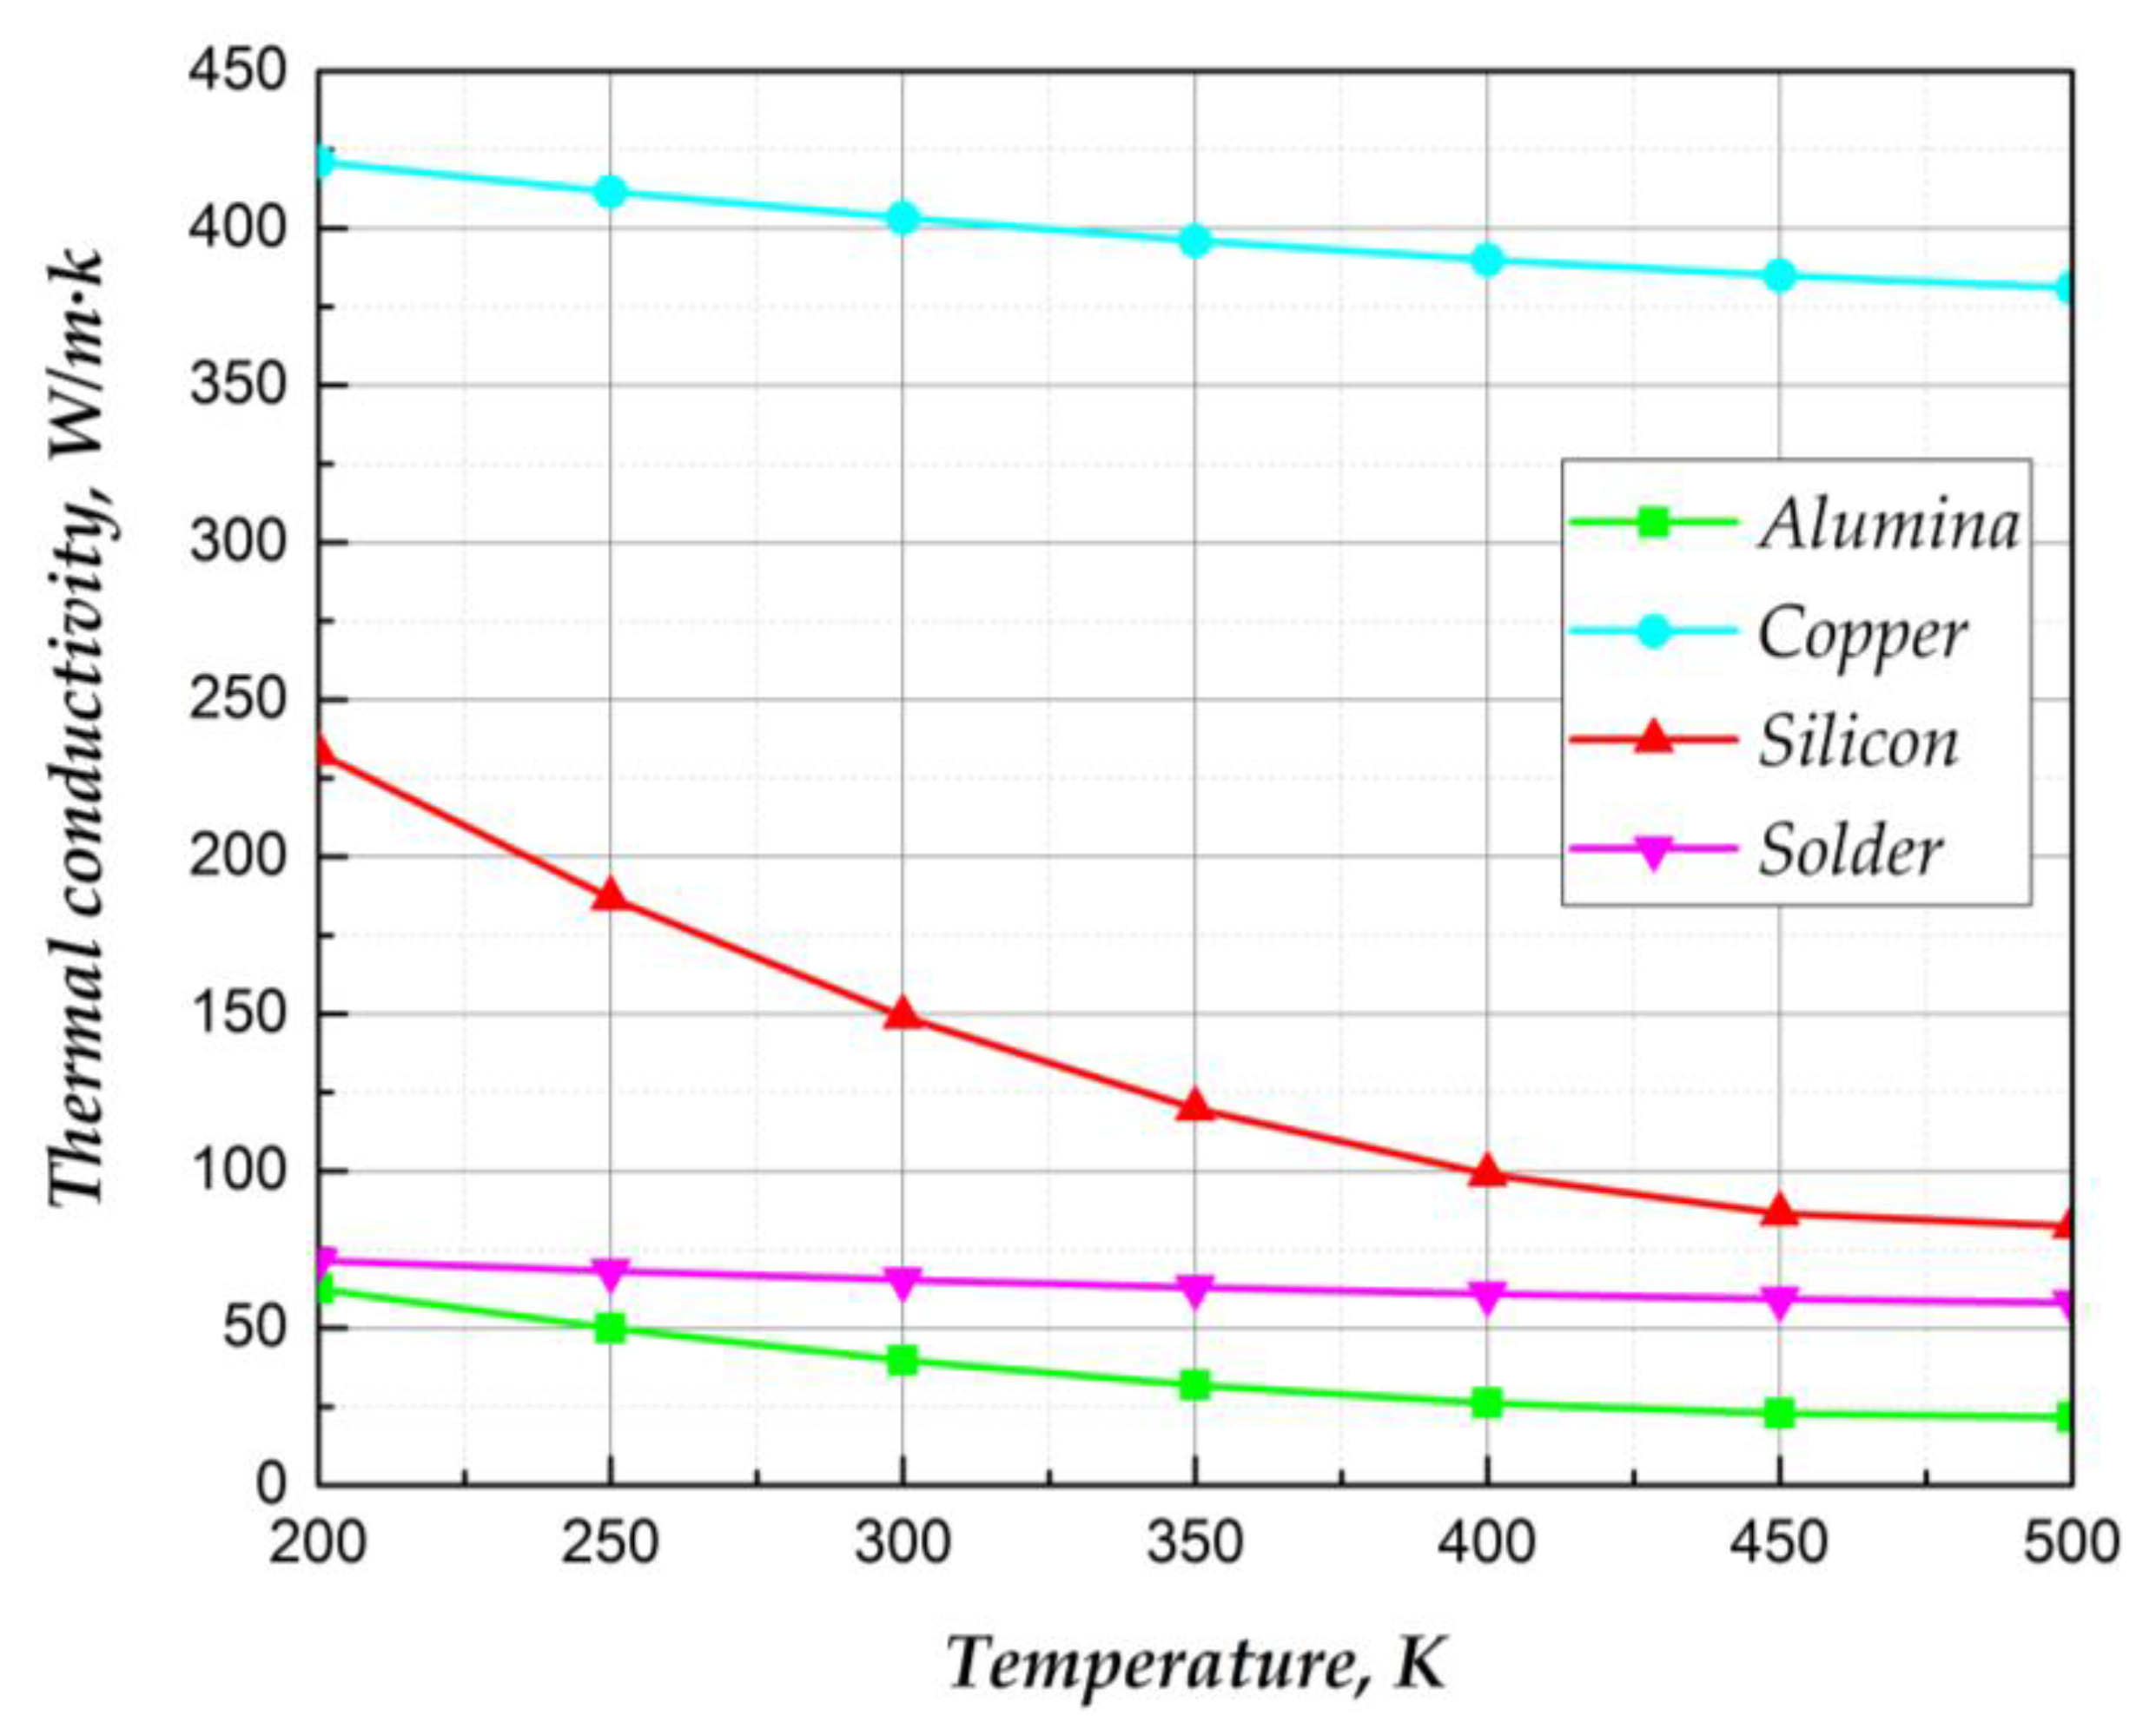
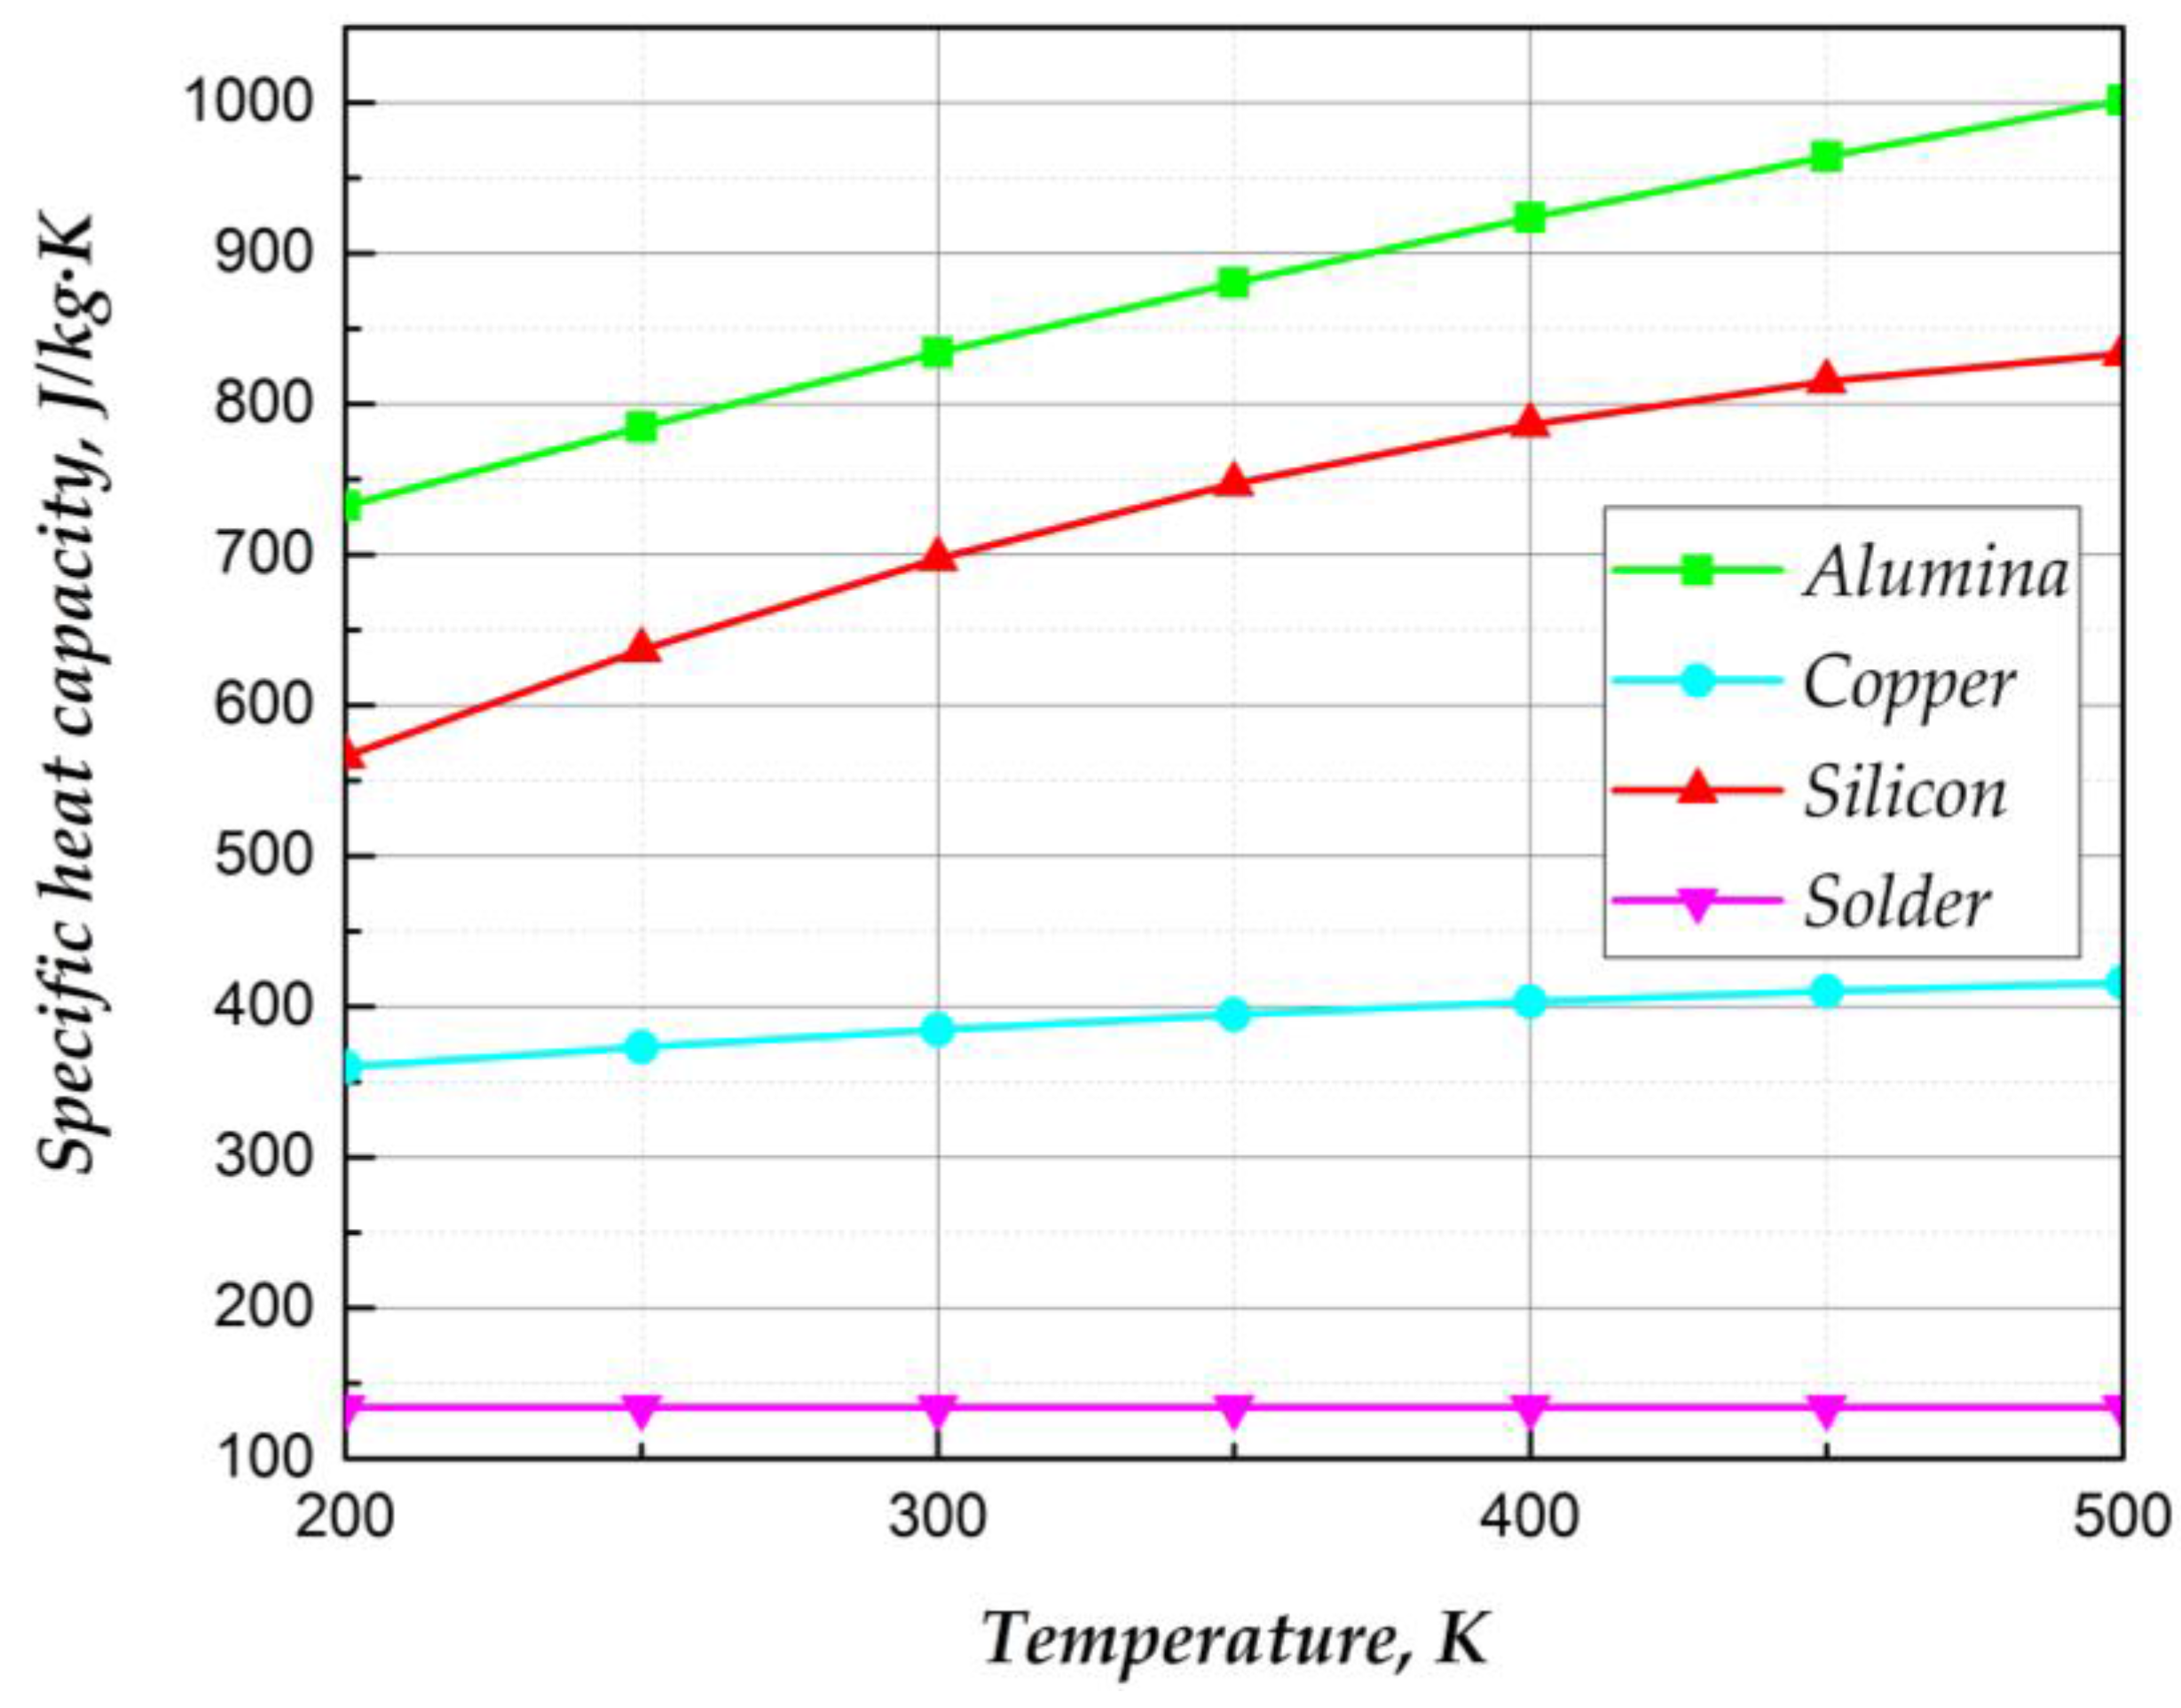
The conventional lumped Cauer-type model does not take into account the effect of operating environment temperature on the internal material properties. The thermal resistance of the IGBT power module is determined by the thermal conductivity, and the thermal conductivity is a variable related to the temperature. Similarly, the thermal capacitance is determined by the specific heat capacity, which is also a temperature-dependent variable. In the process of establishing the model, the effect of temperature on its parameters will be considered to improve the accuracy of the prediction of the junction temperature. According to [34,35], the relationship between thermal conductivity and specific heat capacity of different materials and temperature can be obtained. After fitting the data with the least squares method, the approximate expressions of thermal conductivity and heat capacity of materials are obtained, as shown in Figure 2 and Figure 3 below:
According to Equations (7) and (8), the heat transfer network with non-constant thermal conductivity and specific heat capacity is established; the accuracy of the model has been significantly improved. To further improve the accuracy of the model, this paper will optimize the physical structure of the Cauer-type model.
• Optimization of the Cauer-type model based on the physical structure
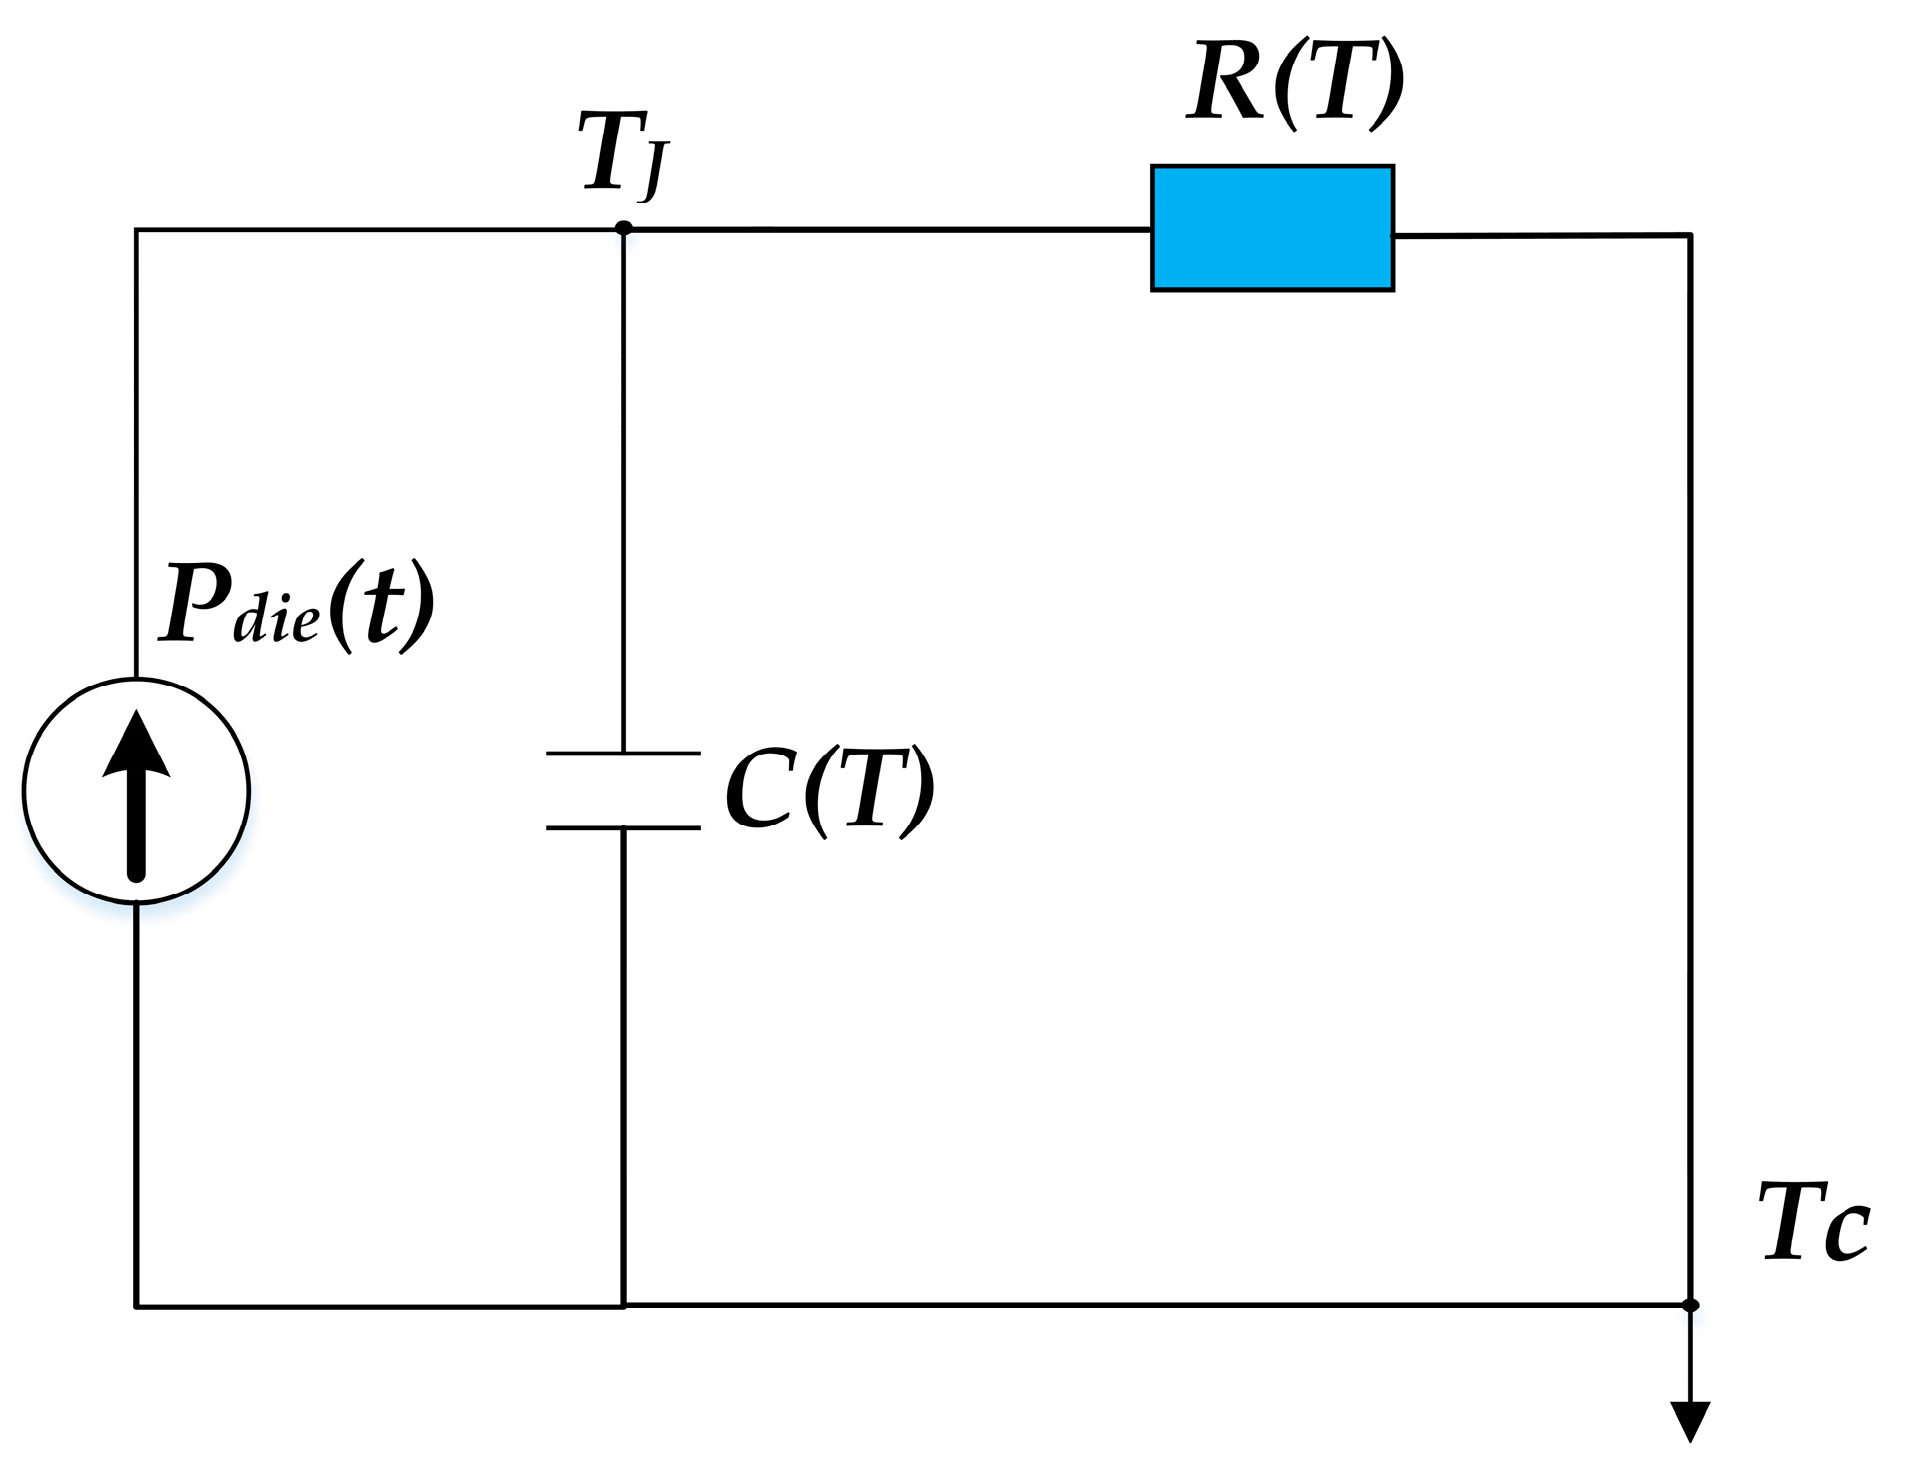
Although the seven-layer Cauer-type model established by the seven-layer physical structure of the IGBT power module has a high computational efficiency, the higher thermal resistance and higher thermal capacitance of the ceramic layer and the baseplate layer in the thermal network model lead to a longer time constant, which, in turn, results in a decrease in the model prediction performance of the overall junction temperature; as a result, it does not accurately capture the dynamic junction temperature changes of the IGBT module during the power cycle. Based on the seven-layer Cauer-type thermal network structure of the IGBT module, this paper analyses the operating characteristics of a single-layer RC network and compares the interaction between the layers of different time scales to establish the accurate prediction of the IGBT transient junction temperature using the heat transfer model. The single-level Cauer-type model is shown in Figure 4 below.
By using the electrothermal analogy method, the complete response of the first order equation of the single-layer Cauer-type thermal network is as follows:
Tjs is the steady-state junction temperature, Tjc is the temperature difference between the chip and the case, Tj is the junction temperature, Tc is the case temperature, and τ is the time constant. According to Equation (9), the time required for junction temperature to reach steady state is given by:
When Tjc = 0.98Tjs, the system is defined as the steady state; thus:
On this basis, different combinations of RC and power loss are simulated by PLECS, and the duty cycle set is 0.5, Tc = 25 °C. The results are shown in Table 1. Where ts1 is acquired in PLECS, ts2 is the calculation time using Equation (12).
According to Table 1, the characteristics of the single layer thermal network are obtained:
- (a)
- Tjcs is determined by the power loss when the time constant is same. The larger power loss, the higher Tjcs.
- (b)
- Compared with the results about ts1, the deviation of ts2 calculated by Equation (12) is always kept in a small range.
This paper takes the SKM75GB12T4 module of SEMIKRON Company as the research object. The specific dimensions of the module and the material properties including thermal resistance and thermal capacitance calculated by constant thermal conductivity and specific heat capacity (25 °C) which can be improved in this paper are shown in Table 2.
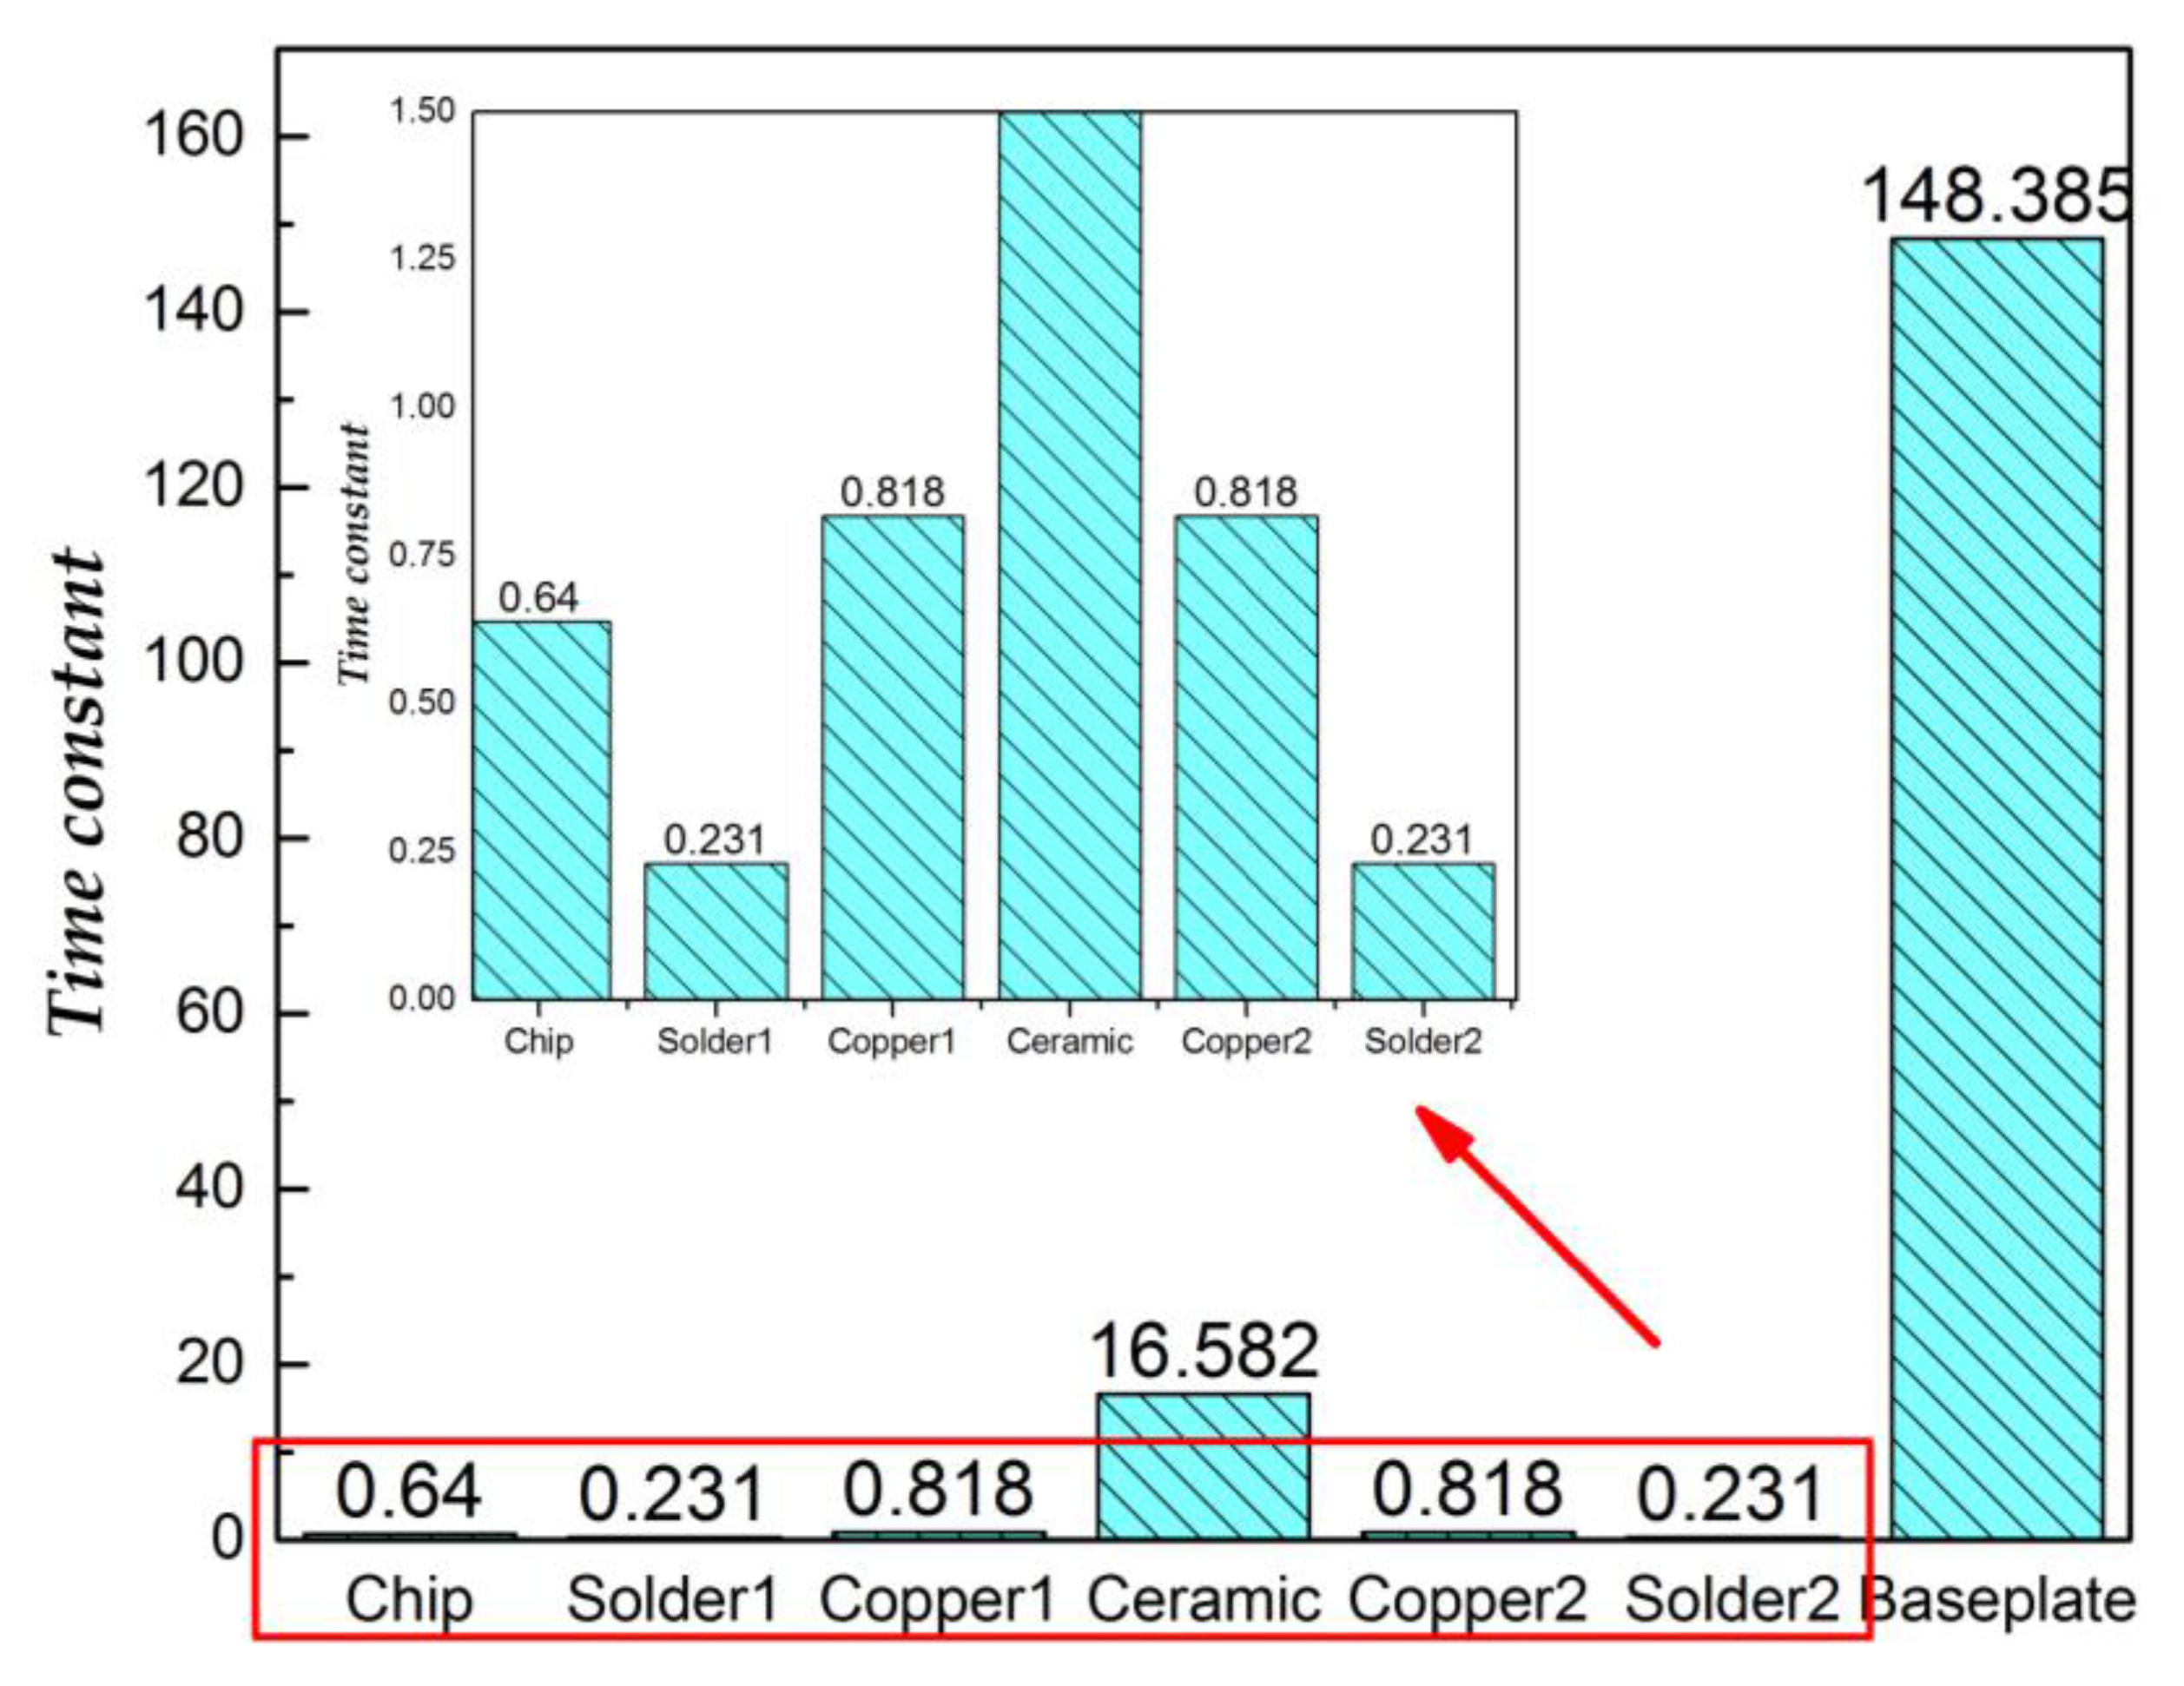
Based on Equations (7) and (8), the values and distribution of the time constant of each layer under ambient temperature (25 °C) are shown in Figure 5.
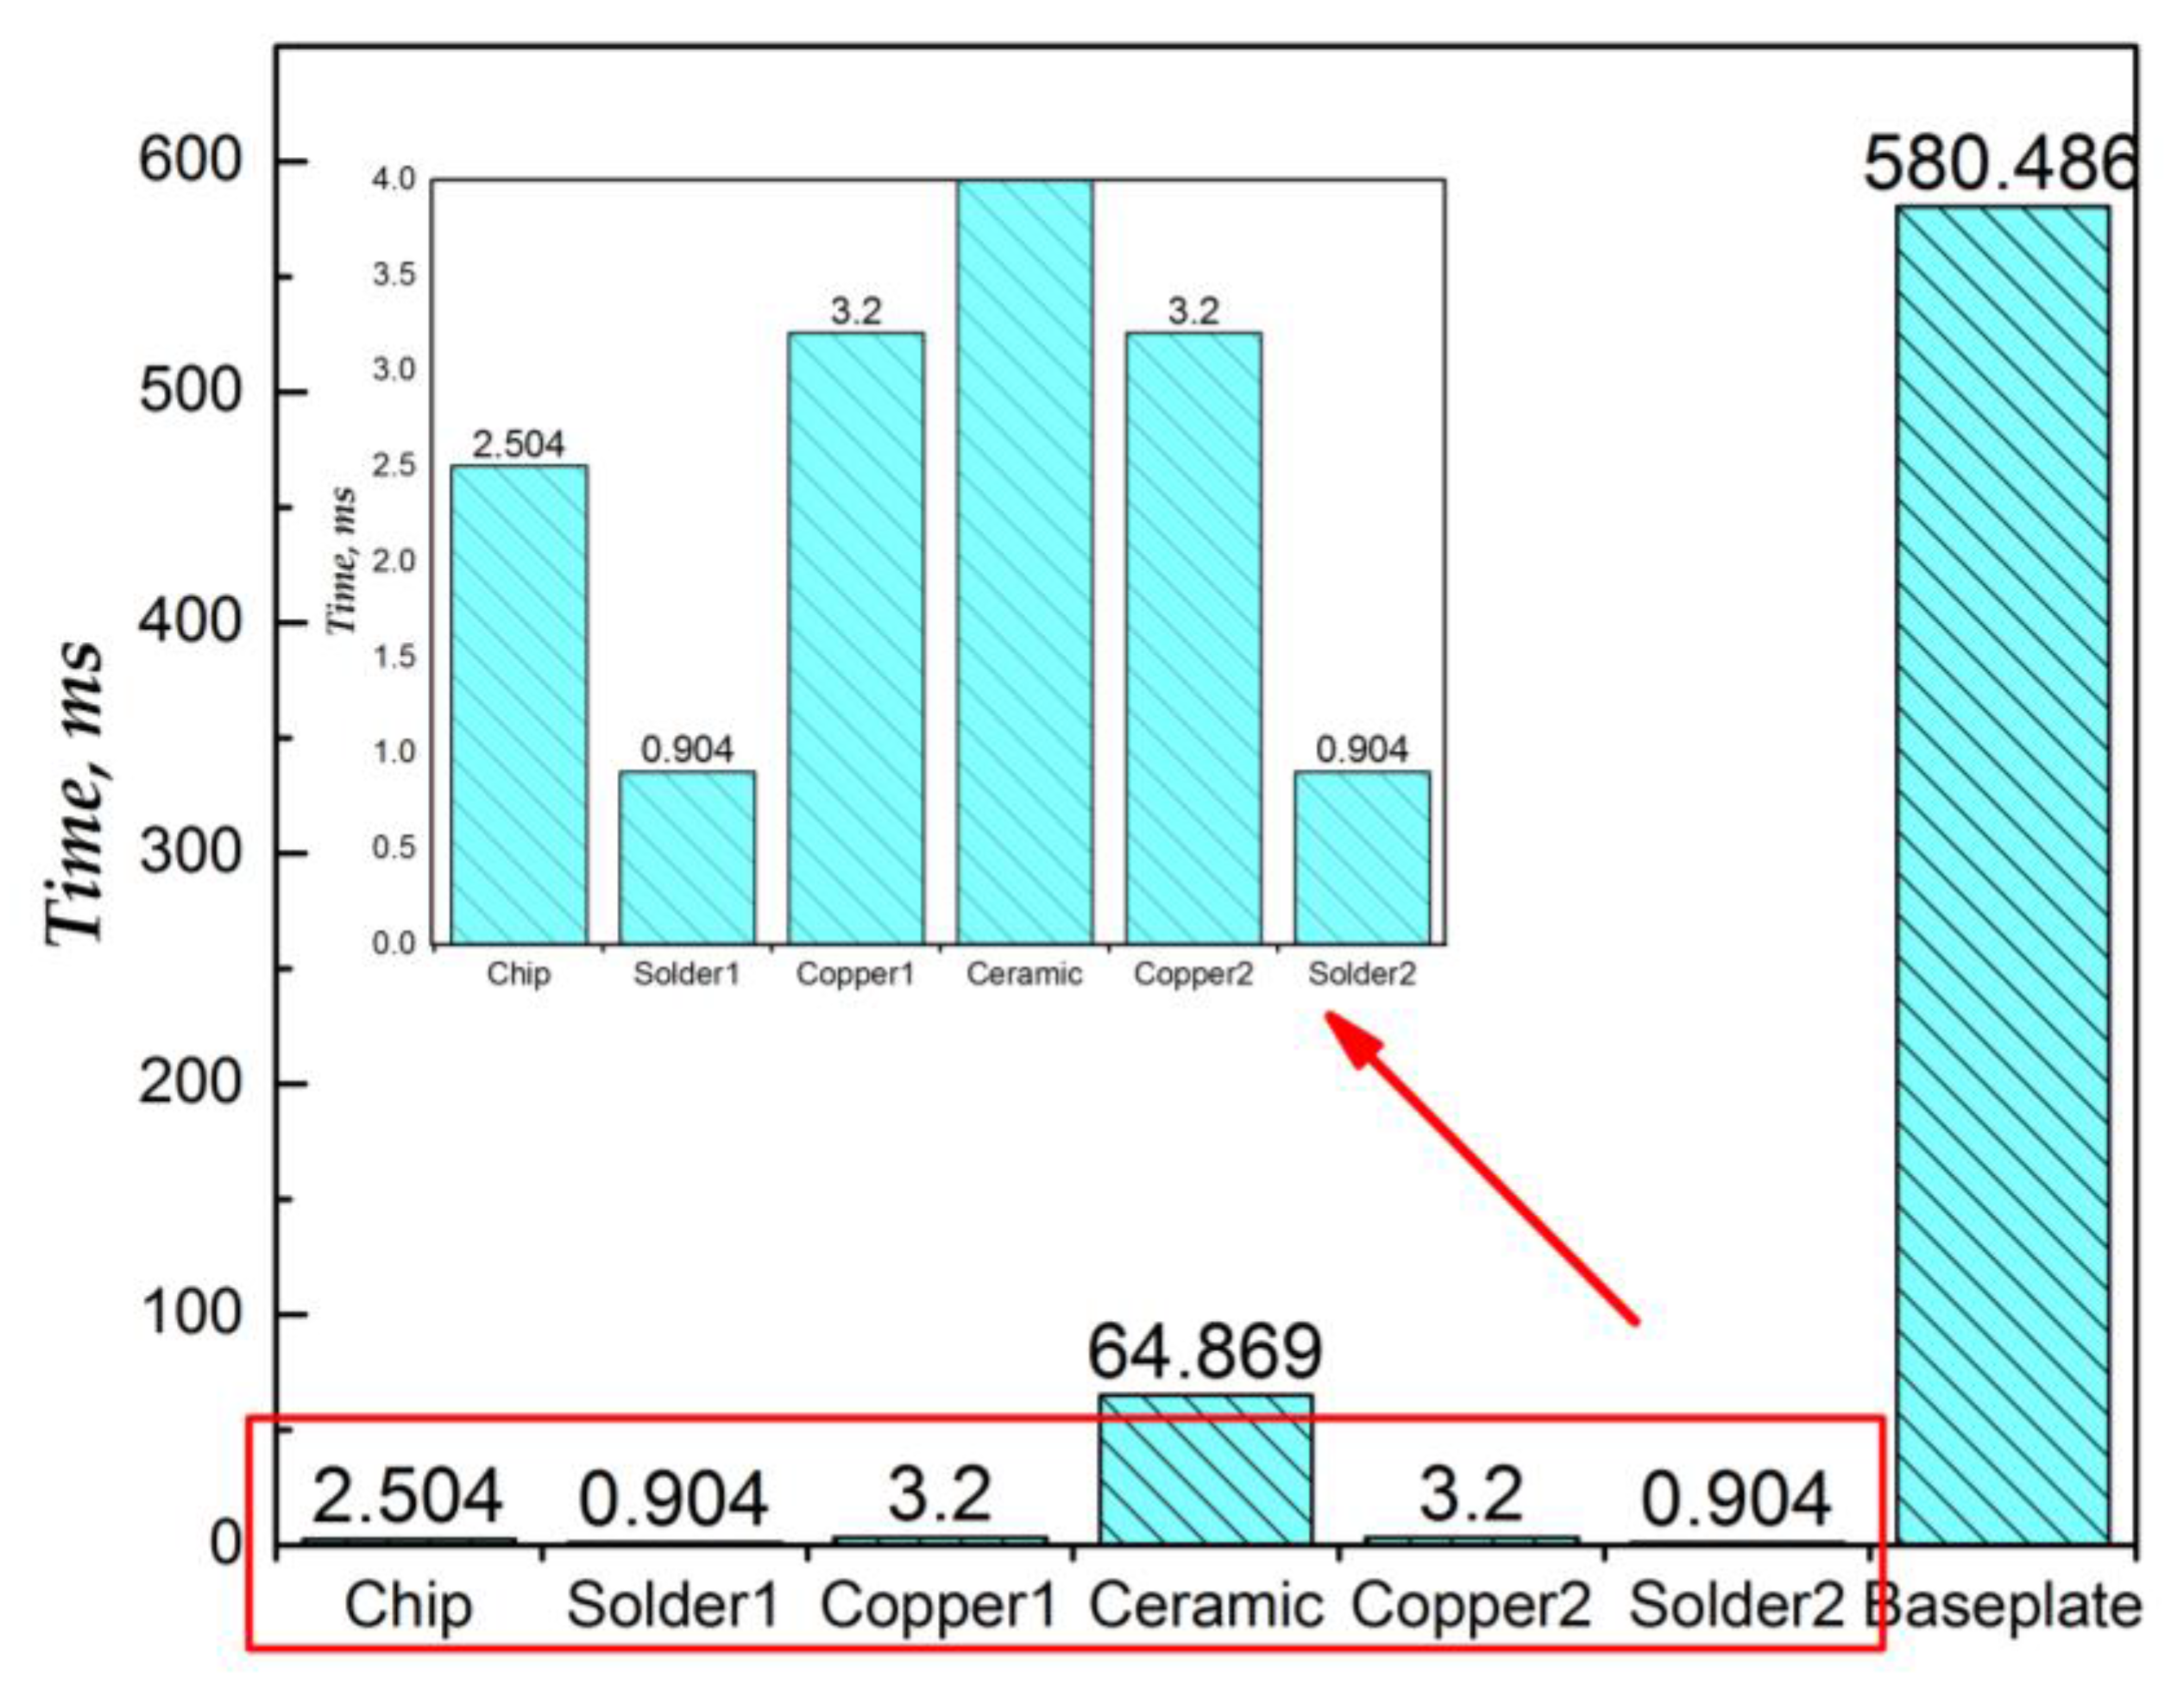
In the heat transfer model, the RC is a constant for the transition time of the network and is the physical parameter reflecting the time required to transfer the heat over the layer. The larger the time constant is, the longer the time it takes to transfer the heat over the layer. Equation (12) is used to solve the values and distribution of the time constant for each layer to obtain the steady-state under ambient temperature (25 °C), as shown in Figure 6.
According to the analysis of the data available in the figures, the times of the ceramic layer and the baseplate are much longer than those of the other layers. The much longer heat transfer time is in these two layers than in the other layers reduces the predictive performance of the transient junction temperature in the inner layer structures of thermal model network, thereby degrading the overall performance of capturing the transient junction temperature of the IGBT power module. To improve the performance of the lumped Cauer-type thermal network model, the prediction accuracy can be improved by the fine stratification of the ceramic layer and the baseplate layer. With the increase of the number of layers, Equation (10) can be rewritten as Equation (13) where n is the number of sublayers. The thermal resistance and thermal capacitance decrease with a trend of positive ratio function, and the time constant of new sublayer decreases with a trend of quadratic. According to Equation (12), the ceramic layer and the baseplate layer are divided into several smaller sublayers that can reach the steady-state in a shorter period, and the time of each layer after the re-division is in the same level, ensuring the smaller time span to required achieve the optimization of the thermal network model performance. The data in Figure 5 and Figure 6 can be calculated by Equations (7), (8) and (12). The ceramic layer can be divided into three sublayers and the copper baseplate can be divided into four sublayers to ensure the time of all layers can be kept at the same level. In addition, the transient temperature difference in milliseconds is determined by the thermal behaviour of chips. To better express the transient characteristics, chips are divided into three layers to improve the transient performance of the Cauer-type models:
Redefining the stratification of the Cauer-type model of IGBT can effectively improve the performance of capturing the dynamic junction temperature changes. The proposed multi-layered thermal network model is compared with the conventional model, and the results are shown below in Figure 7.
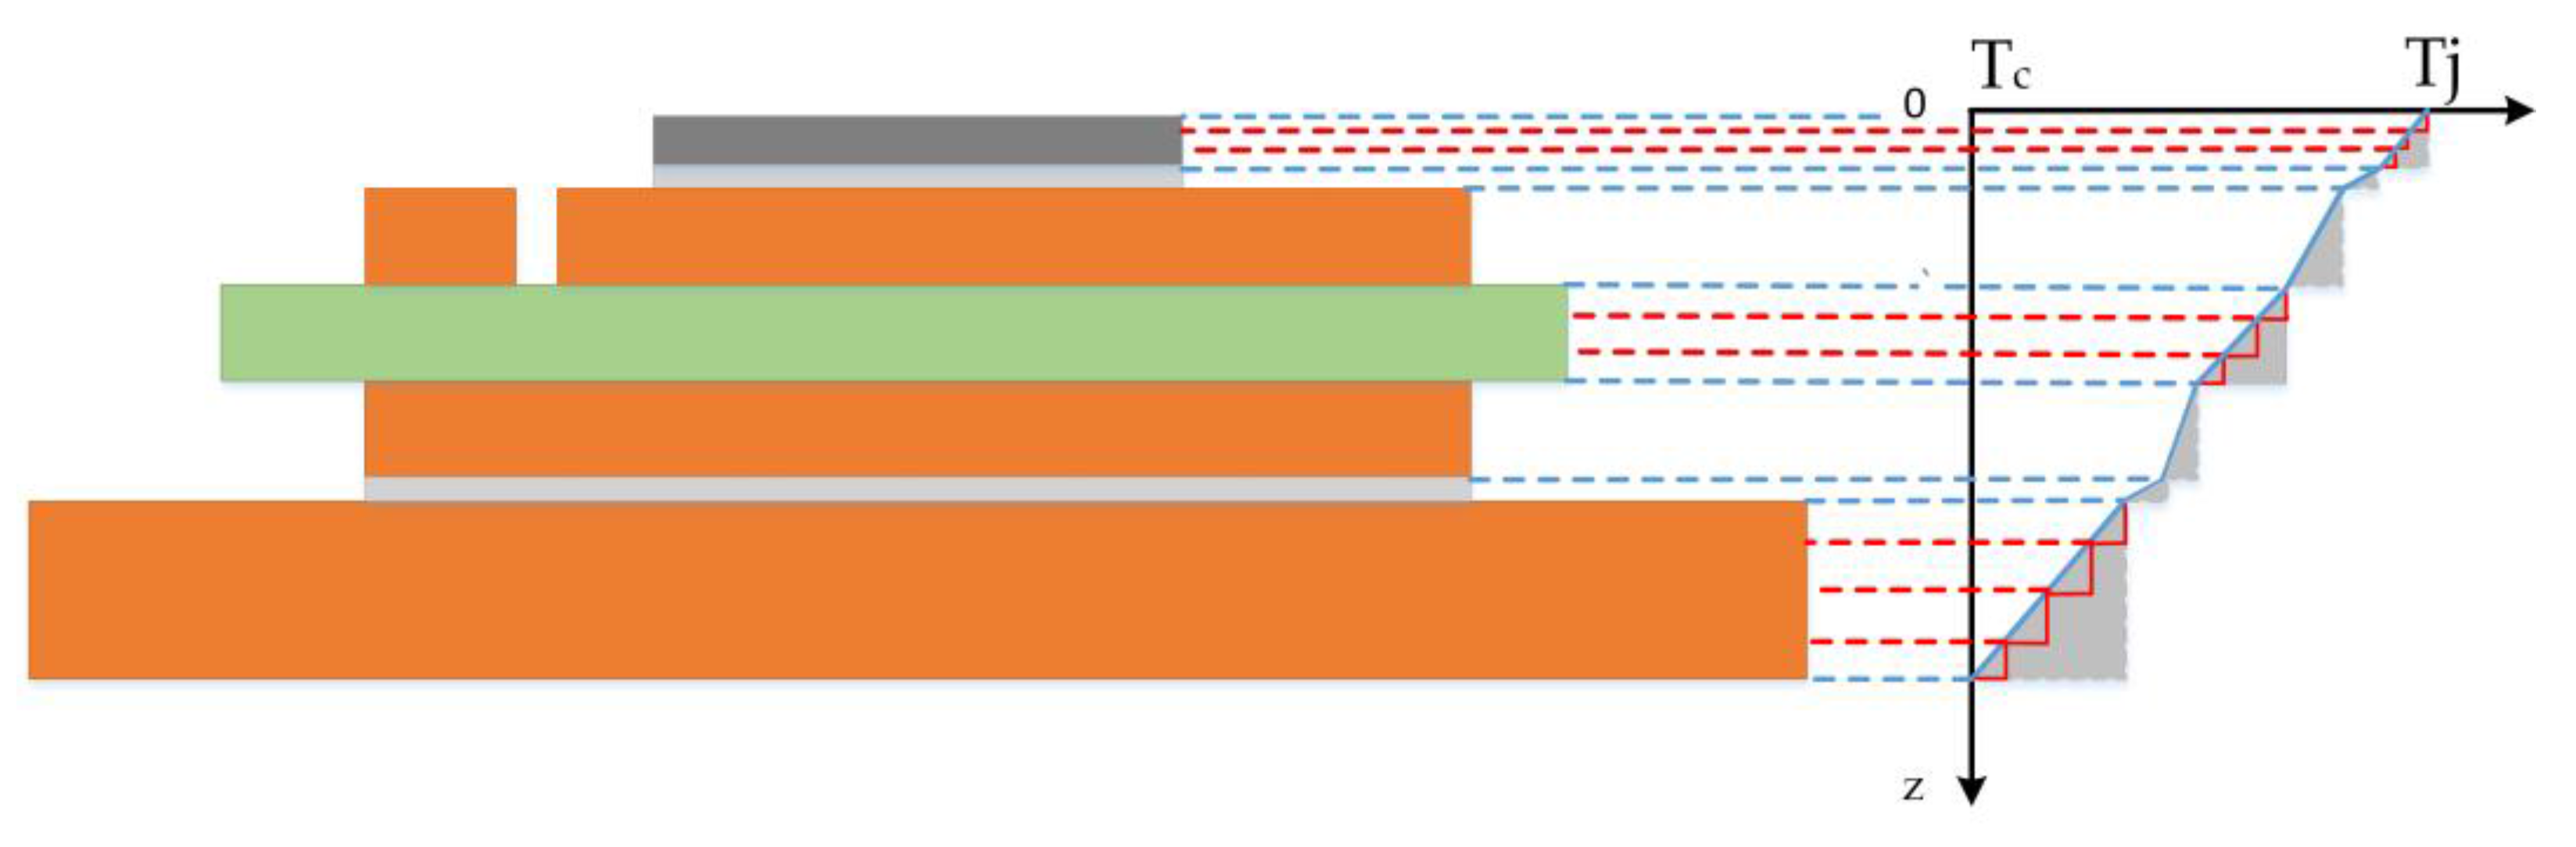
Analysis of Figure 7 shows that the method of subdividing the layer structure not only effectively improves the performance of the model in capturing the transient junction temperature but also largely reduces the error caused by ignoring the slope of the temperature distribution of the layers, that is the triangular area, thus achieving more accurate calculation of the heat inside each layer, thereby ensuring the accuracy of extracting thermal capacitance parameters of the model to accurately predict the transient junction temperature. Therefore, the improved Cauer-type thermal network model has been effectively improved in the prediction performance of transient junction temperature.
From the above, the Cauer-type thermal network model established on the basis of the proposed method, the performance of conventional Cauer-type model is optimized both in predicting the transient junction temperature and the steady-state junction temperature accuracy of the IGBT power module; remarkable results have been achieved.
3. Simulation Validation
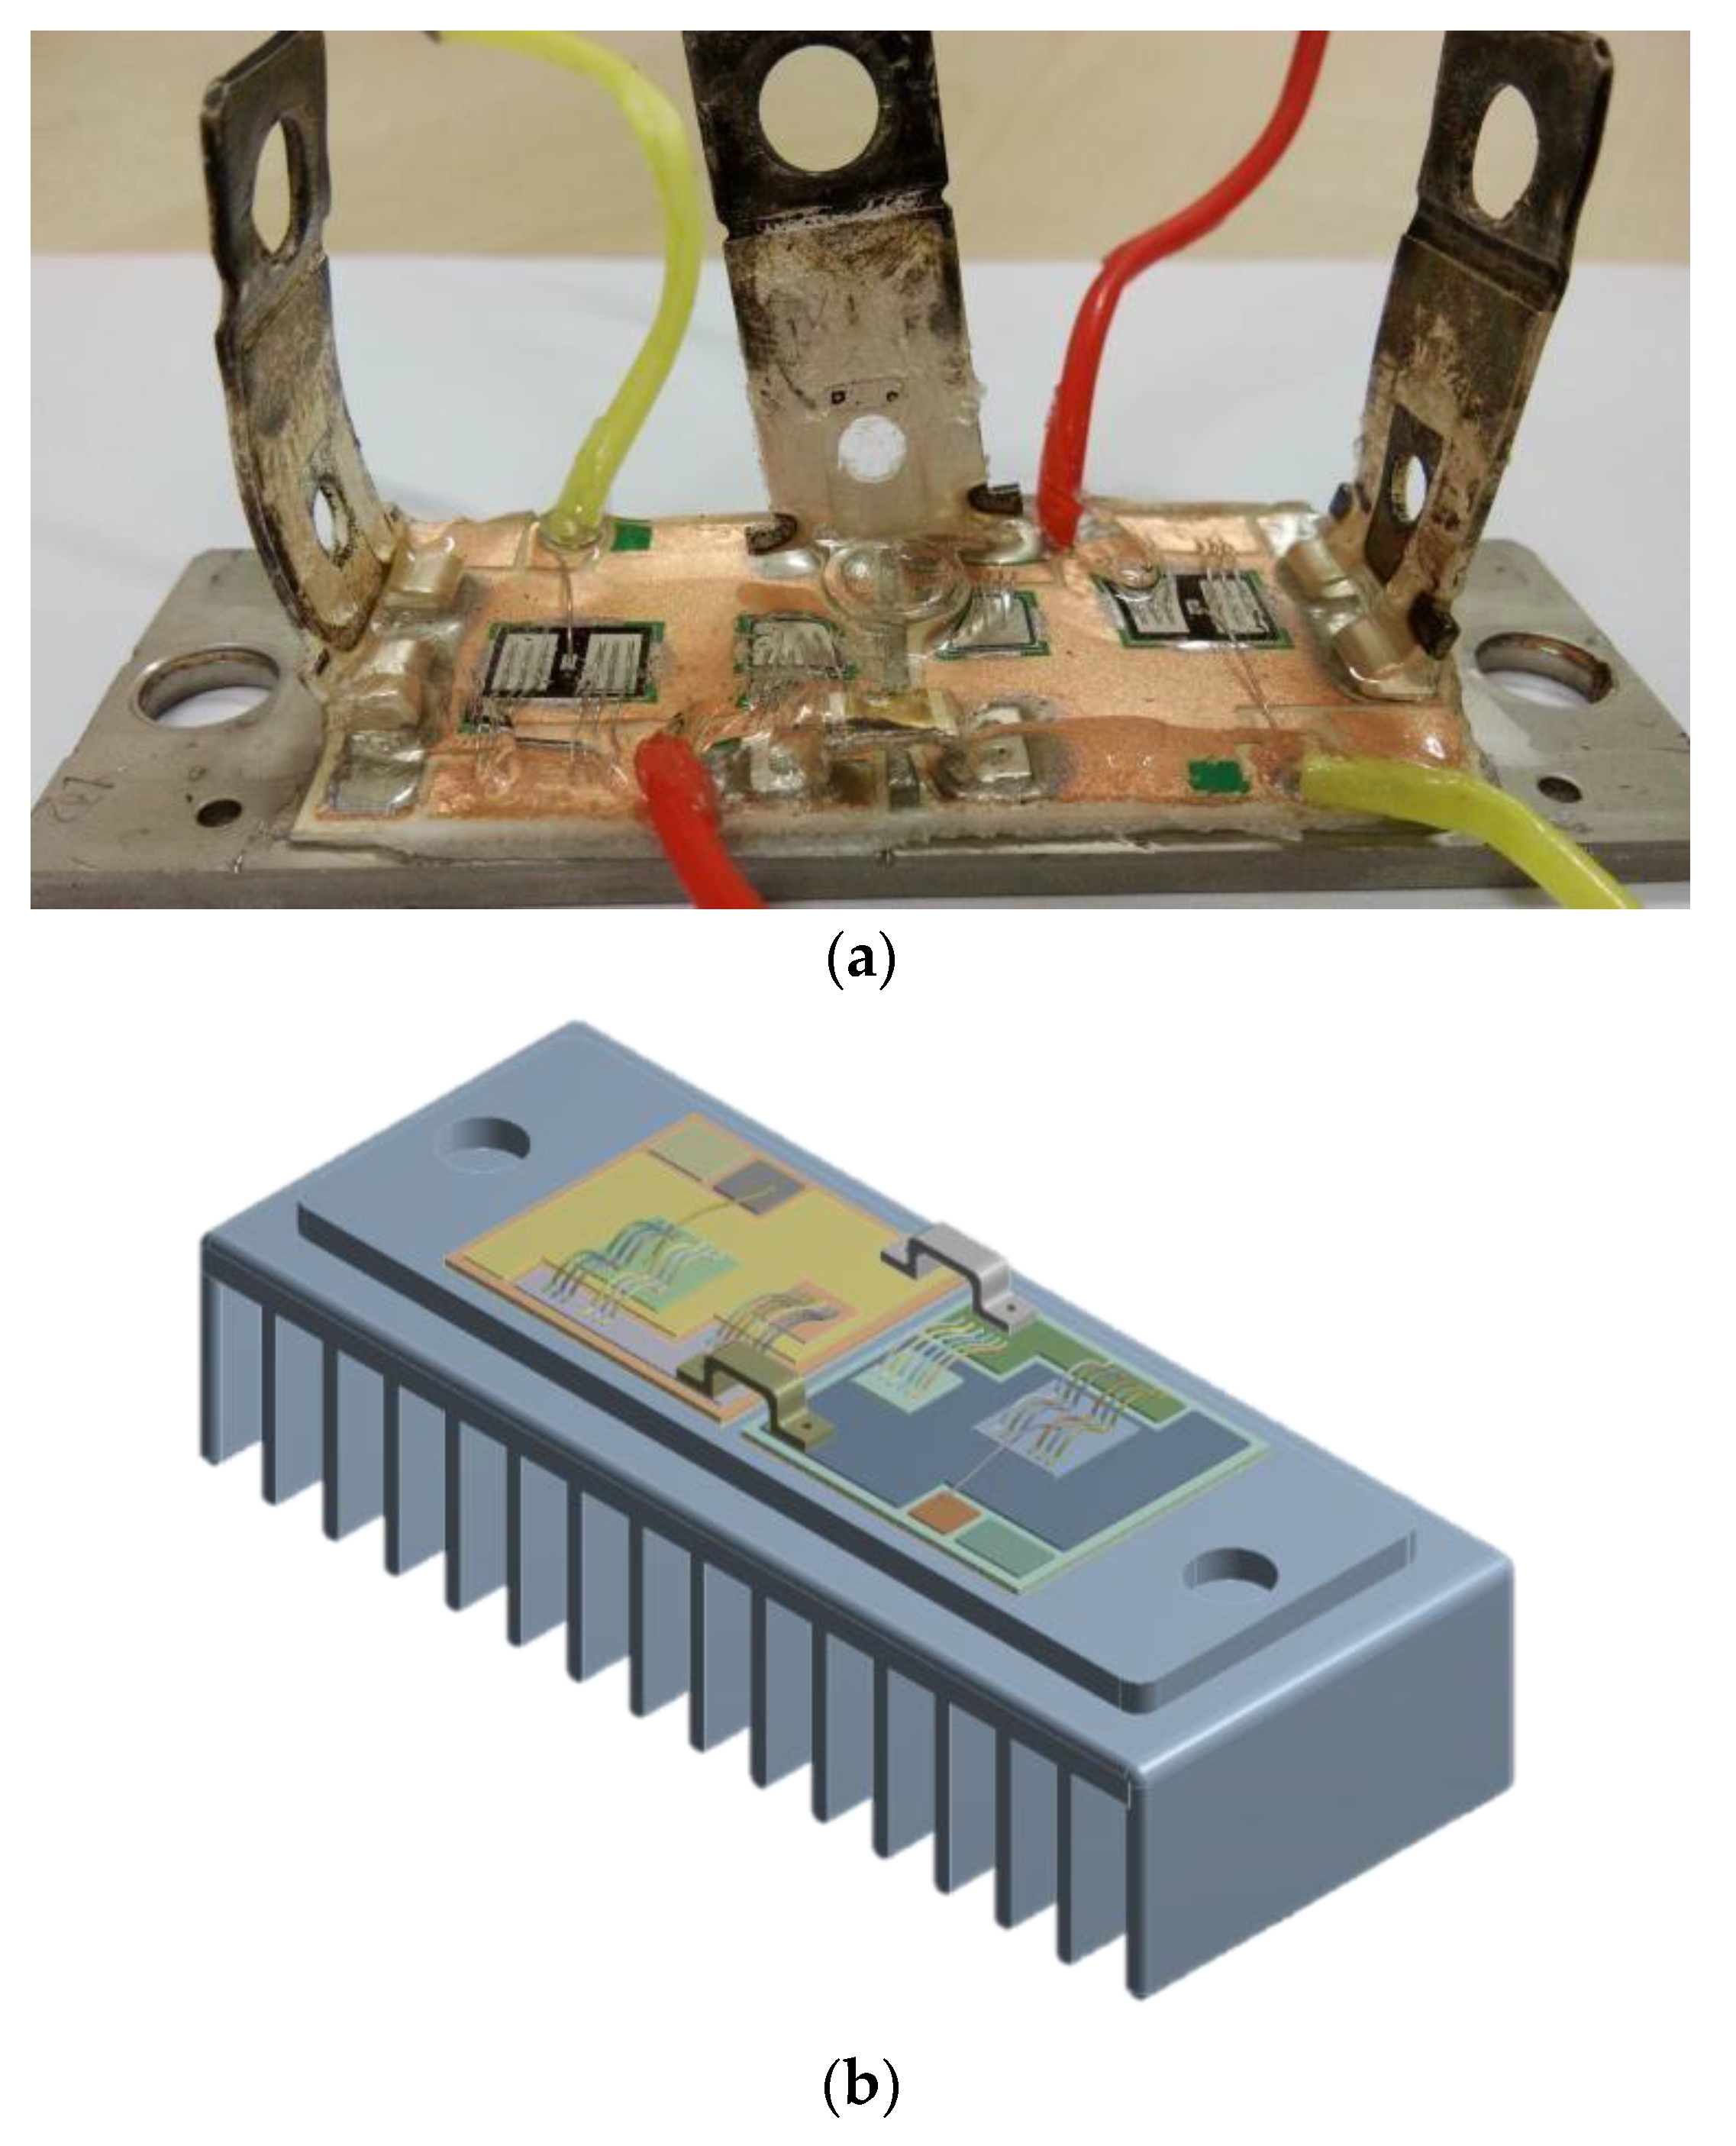
A commercial SKM75GB12T4IGBT module made by SEMIKRON Company (Nürnberg, Germany) was studied to verify the effectiveness of the proposed method. According to the geometric information provided in Table 1 and the material properties of each layer, the finite element analysis (FEA) model of the IGBT module in PRO/ENGINEER software (PROE3.0, Needham, MA, USA) is established, as shown in Figure 8.
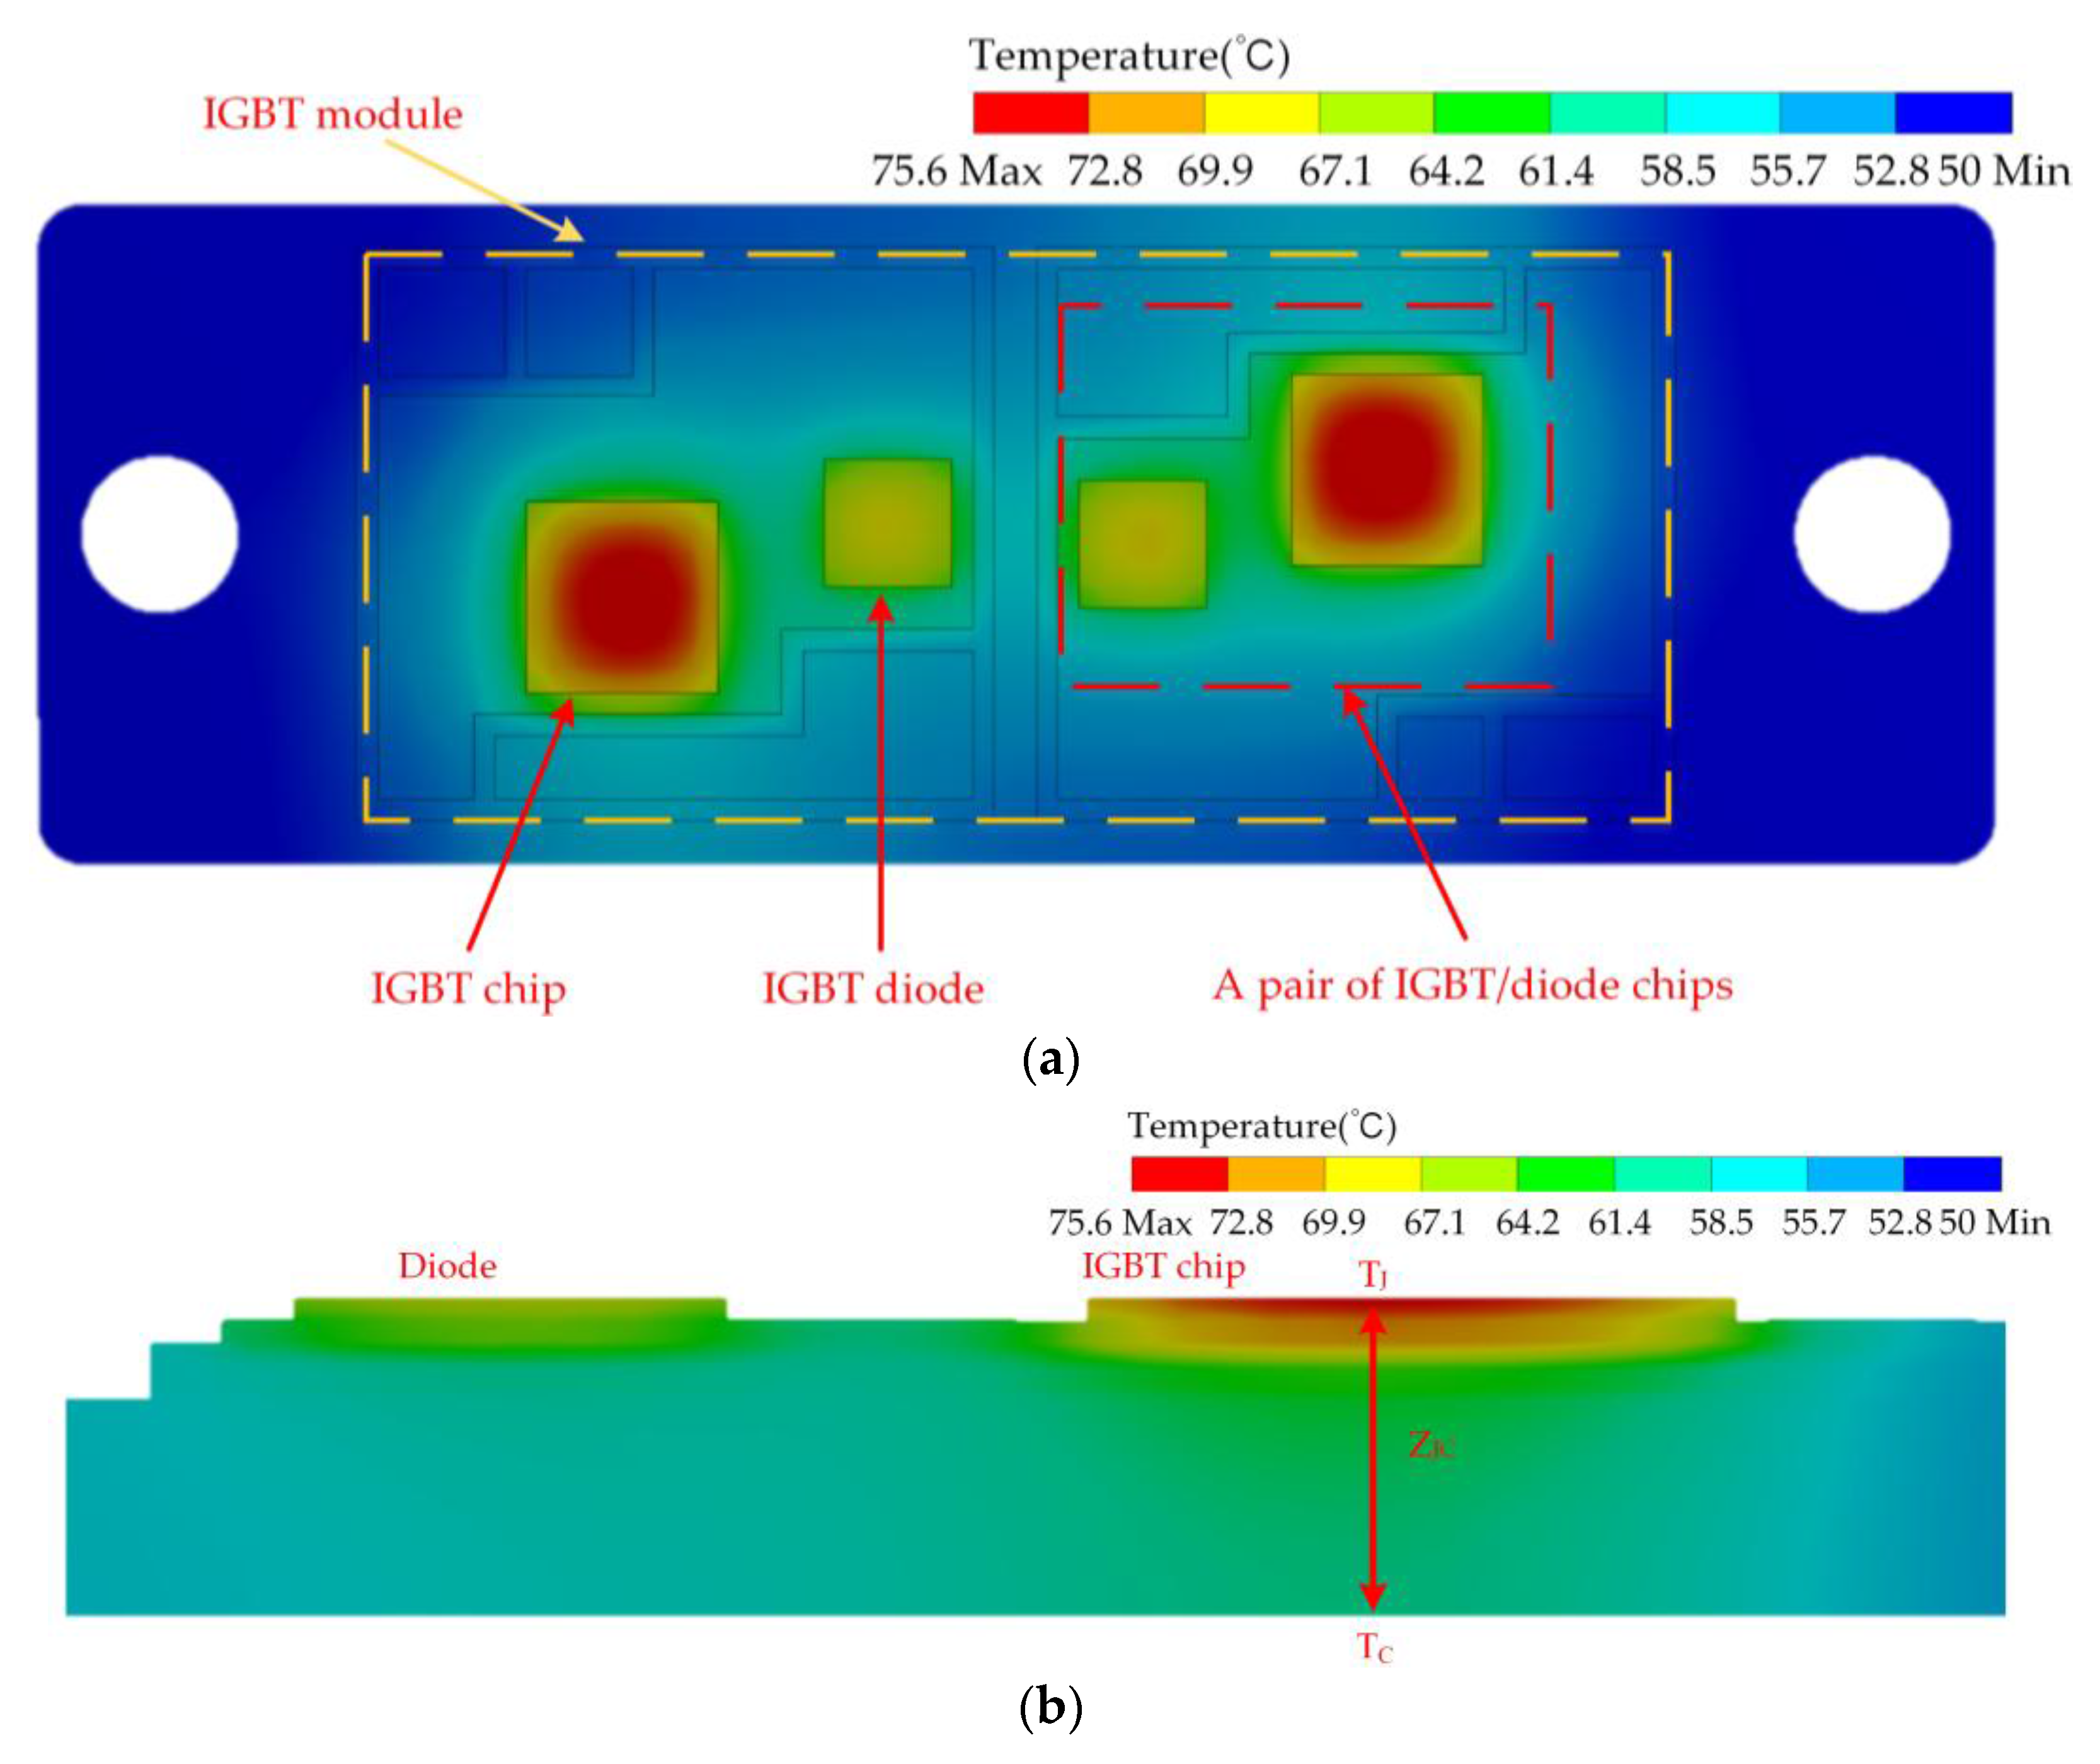
In the FEA model, the heat sink is simplified as an aluminium block, the bottom surface of the heat sink is set as a heat dissipative surface and the temperature of the bottom is set as a constant. The power loss is generated inside the chip near the surface; thus, the power loss is simulated on the chip surface, and the power loss set is shown in Figure 9. The temperature distribution of the IGBT module is obtained as shown in Figure 10. Therefore, the temperature information of different layers of the IGBT power module can be accurately mastered by the finite element model.
On this basis, the conventional Cauer-type thermal network model and the improved thermal network model are simulated, and the power loss, case temperature and ambient temperature as input parameters are input to obtain the temperature curve of each module of IGBT power module. And the parameters of the two models in different condition are shown in Table 3.
The forecast results of junction temperature are compared with the results in the finite element analysis model. The comparison results are shown in Figure 11.
The details of the simulation of Figure 11 are presented in Table 4. In a period of junction temperature fluctuation, the peak-to-valley value in the FEM model is 4.99 °C and 5.38 °C for 50 °C and 100 °C, respectively. The peak-to-valley value of the improved Cauer-type model is 4.35 °C and 4.96 °C for 50 °C and 100 °C, respectively. However, the peak-to-valley value of the conventional Cauer-type model is 3.68 °C and 3.71 °C for 50 °C and 100 °C, respectively. Therefore, the average change rate of junction temperature of the improved Cauer-type model is closer to the change rate of the junction temperature in the FEM model, showing that the modified Cauer-type model effectively improves the transient temperature prediction performance. Overall, the junction temperature value of the Cauer-type thermal network model is always greater than that of the conventional Cauer-type model and is closer to the predicting junction temperature in the FEM. Moreover, in the different ambient temperatures, the deviation prediction of the junction temperature from the improved Cauer-type model proposed in this paper is always kept in a small range, in good agreement with the results from the FEM model, indicating that the improved Cauer-type model has excellent prediction performance of steady-state junction temperature. With the continuous change of the working state of the IGBT power module, the junction temperature is increasing. The higher junction temperature will lead to the decrease of material thermal conductivity, leading to the increase of thermal resistance inside the package. Similarly, with the increase of junction temperature caused by the influence of specific heat capacity, the thermal capacitance in the package also increases. Thus, the increase of thermal resistance and thermal capacitance is the main reason for the difference between both of them in the predicted steady-state junction temperature. Moreover, with the increase of thermal capacitance and thermal resistance, the model cannot accurately simulate the law of the junction temperature, mainly including switching process, rise and fall time and so on. On the basis of guaranteeing the precision of prediction of steady-state junction temperature, the reasonable layering allows the improved Cauer-type model to realize the accurate simulation of the operating law of the junction temperature.
In summary, the improved Cauer-type thermal network model proposed in this paper modifies the conventional Cauer-type model from two aspects, namely, prediction of the transient junction temperature and prediction of the steady-state junction temperature, and the two aspects of optimization achieved notable results. The establishment of the temperature adaptive Cauer-type thermal network model is completed.
4. Experimental Validation
4.1. Experiment Setup
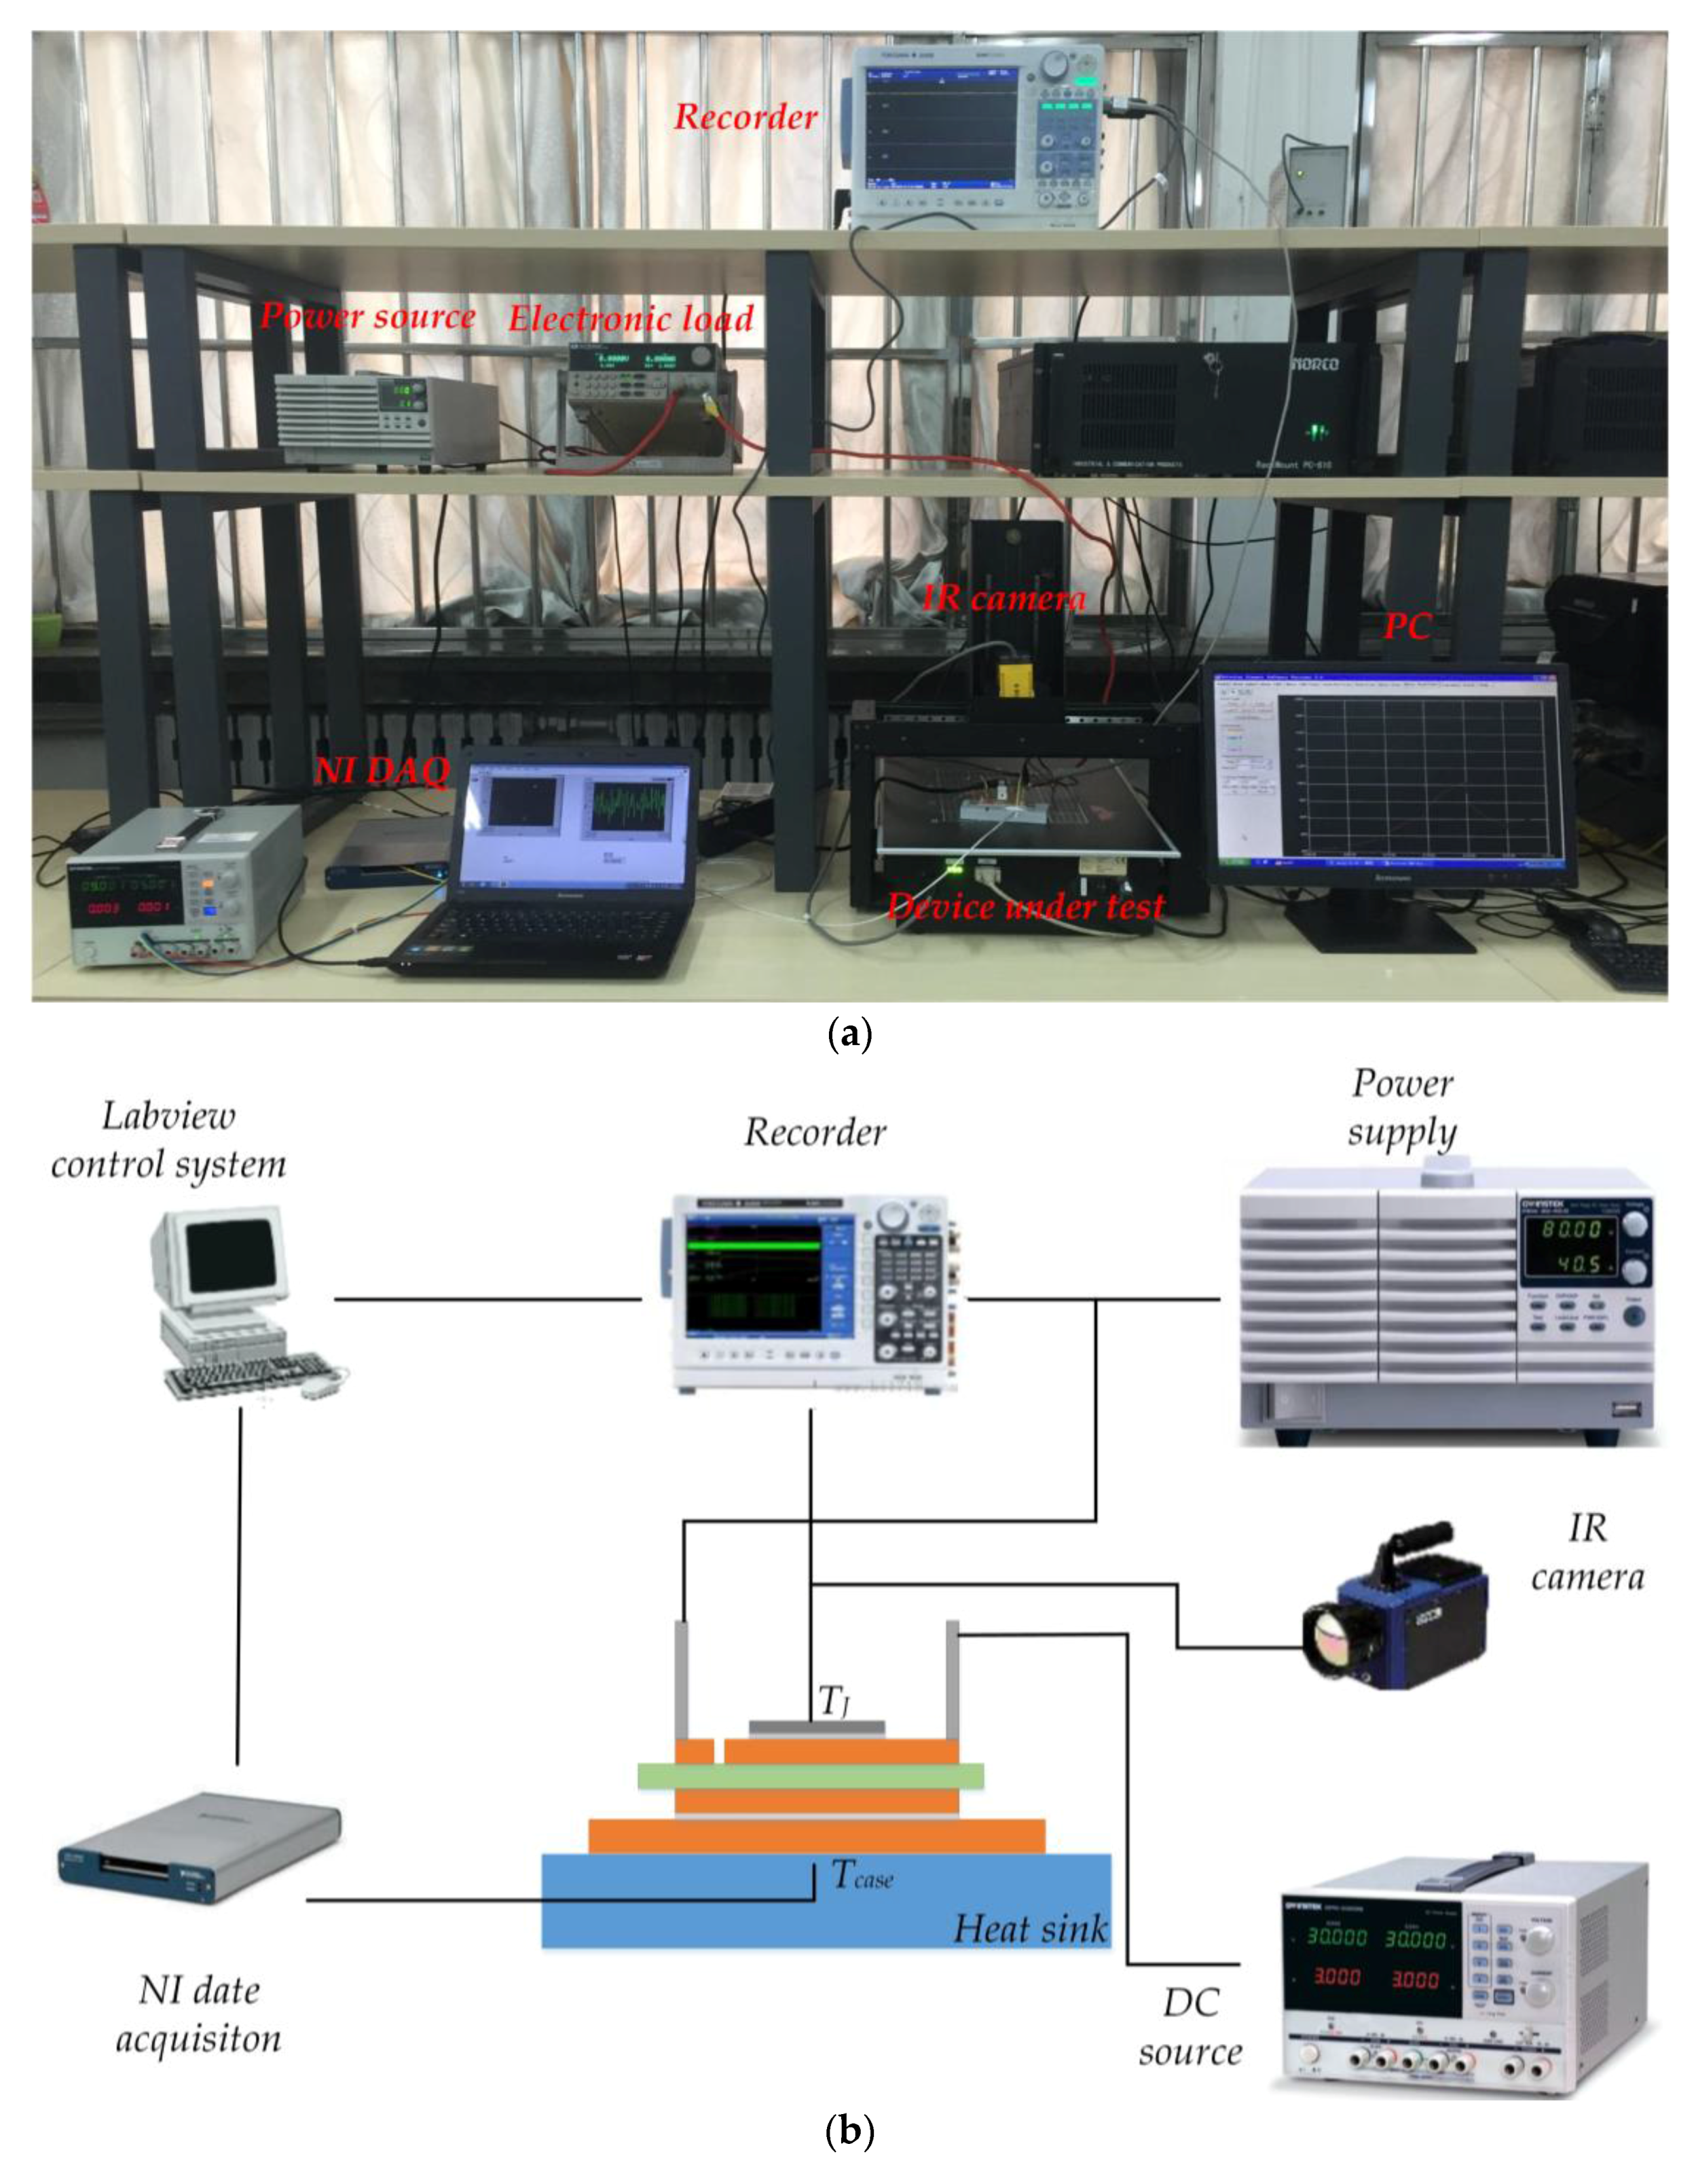
The improved method is further verified by experimental studies in accordance with Figure 12. Figure 12 shows the experimental setup, which consists of a high-DC power for supplying test current, a gate driver for generating gate signal for the test IGBT module, a recorder for electrical signal acquisition (such as Vce and Ic), an infrared camera for real-time collection of the junction temperature, a and National Instruments (NI) data acquisition instrument with a LabVIEW system for acquiring the Tc, which is measured by using precise fine-wire thermocouple.
4.2. Variable Current Test
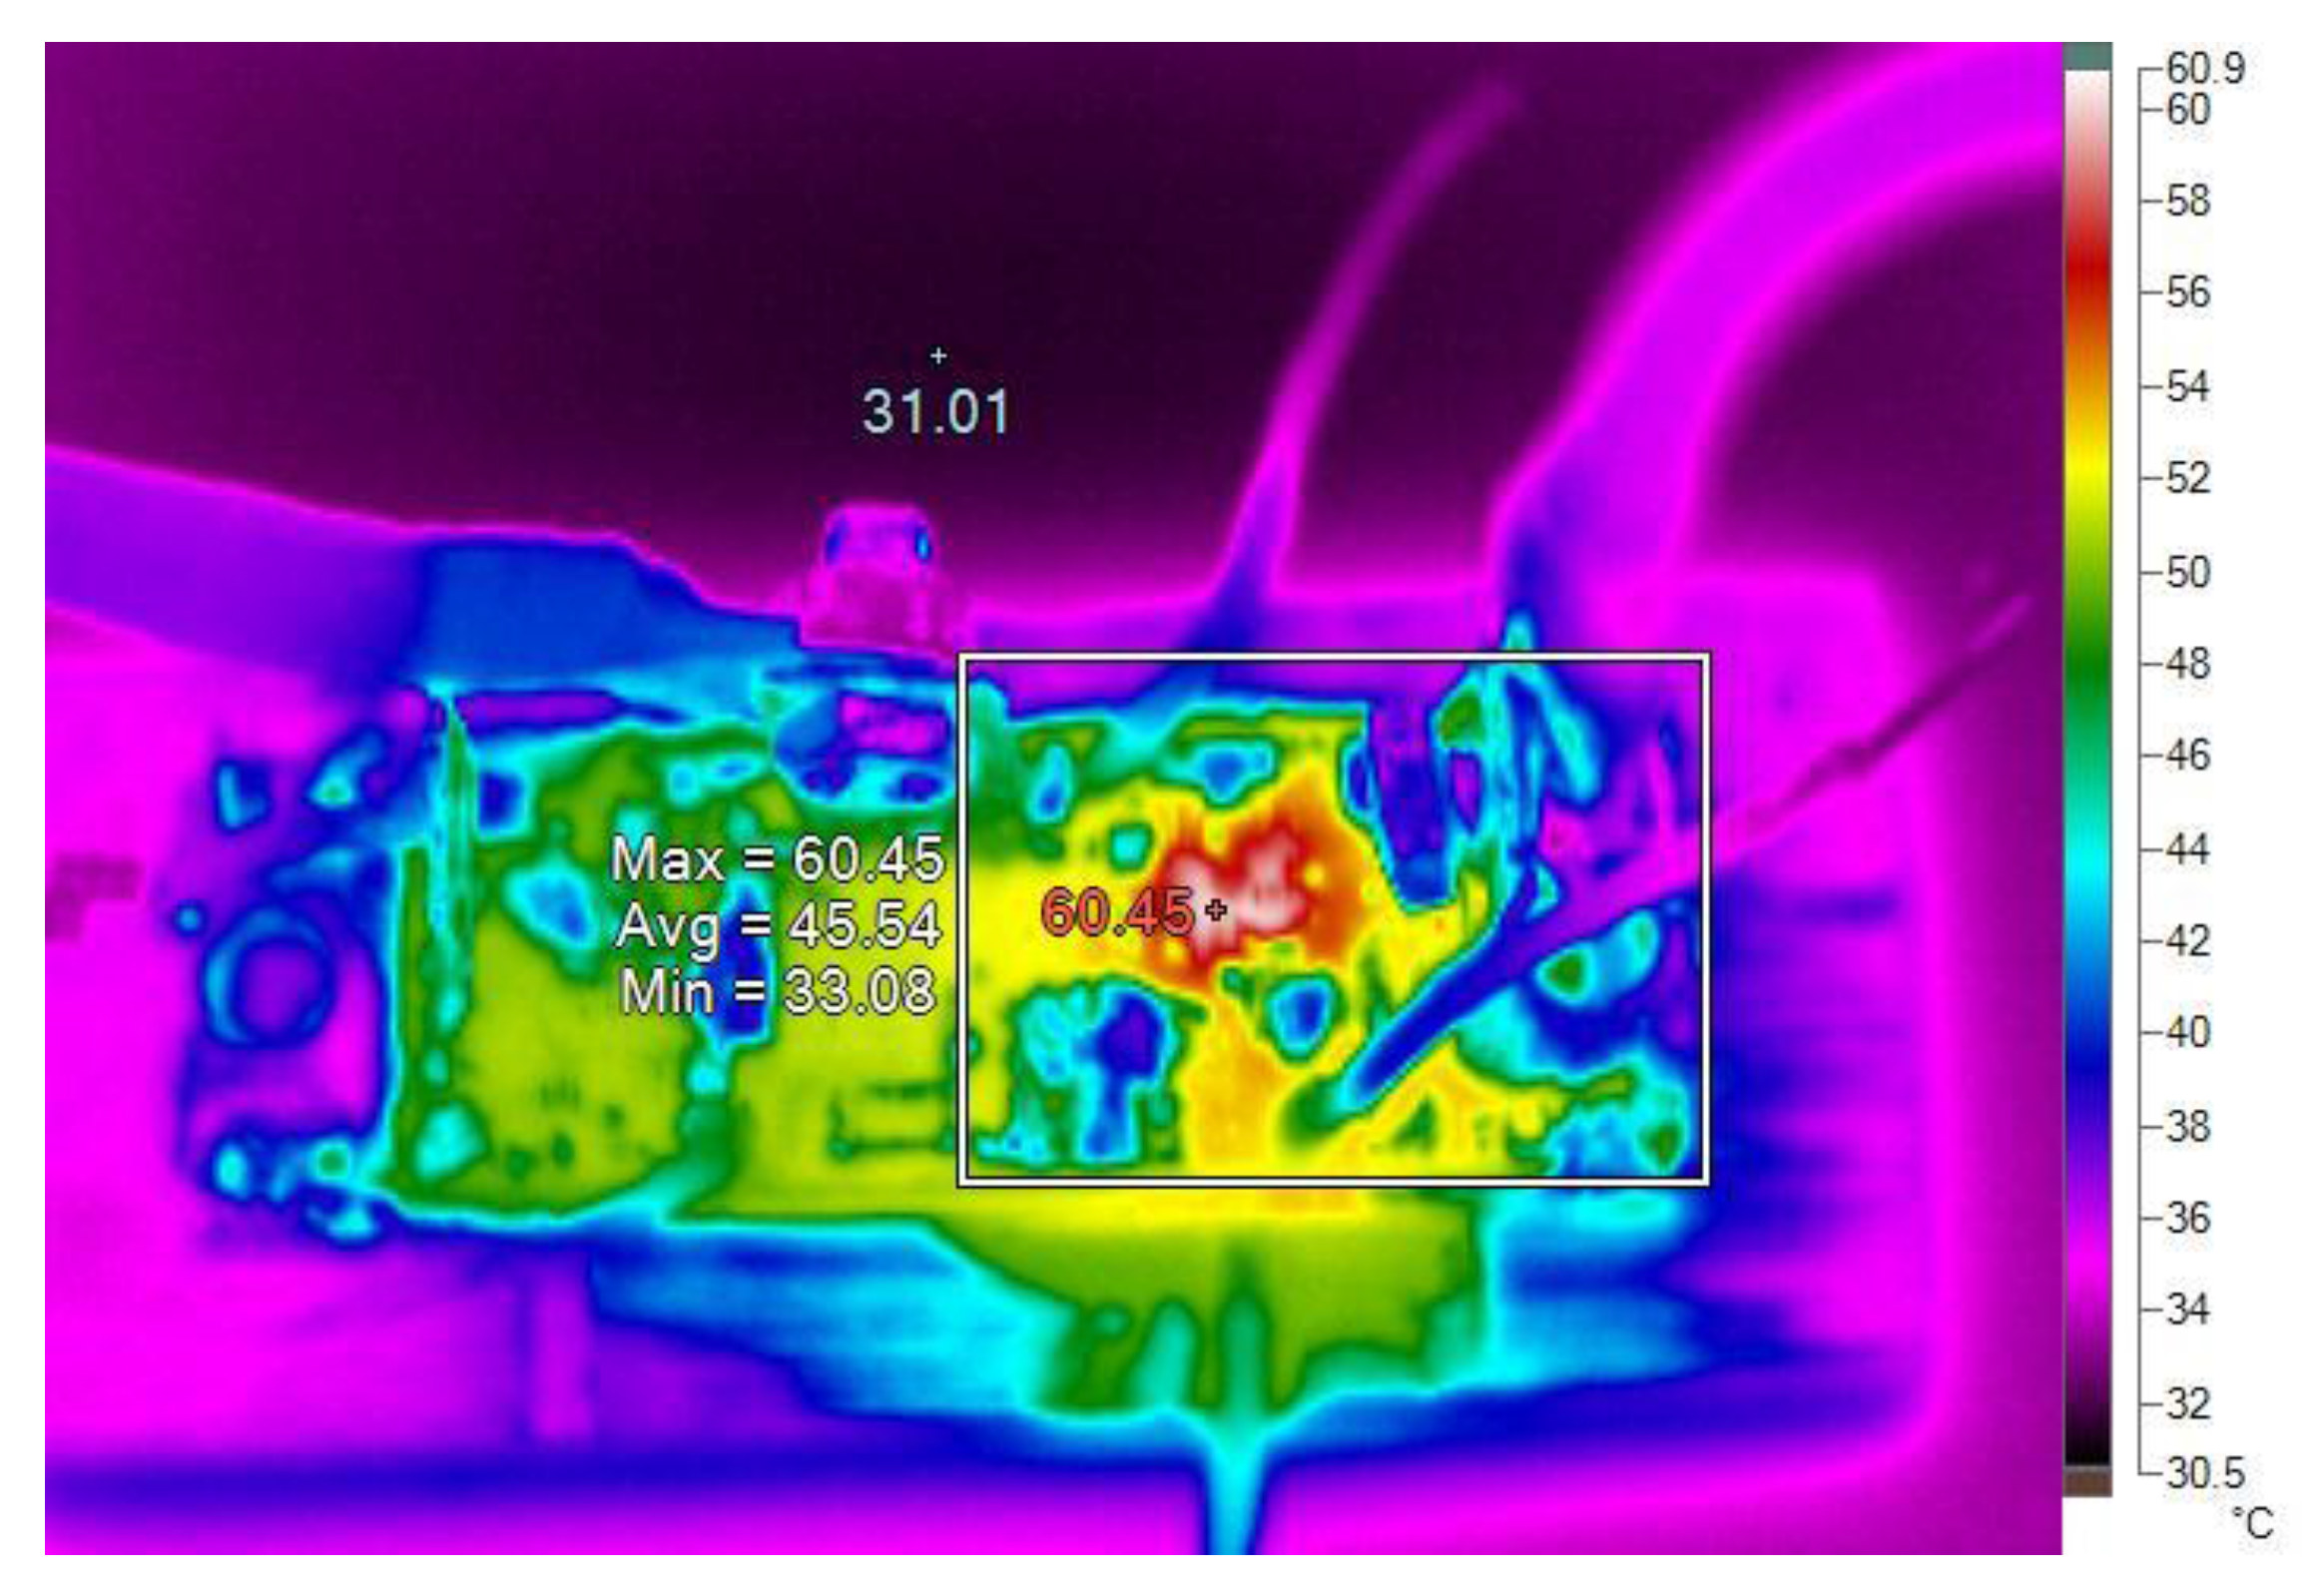
On this basis, the thermal network models are examined; the upper surface temperature distribution for the IGBT module obtained using the infrared imager is shown in Figure 13. To allow the infrared camera accurately capture the junction temperature, the silicon gels from the surface of the IGBT module should be removed deliberately and the camera should be aimed at the centre of the chip after it is calibrated. The temperature range measured herein within 150 °C and the effect of emissivity is small, can be neglected.
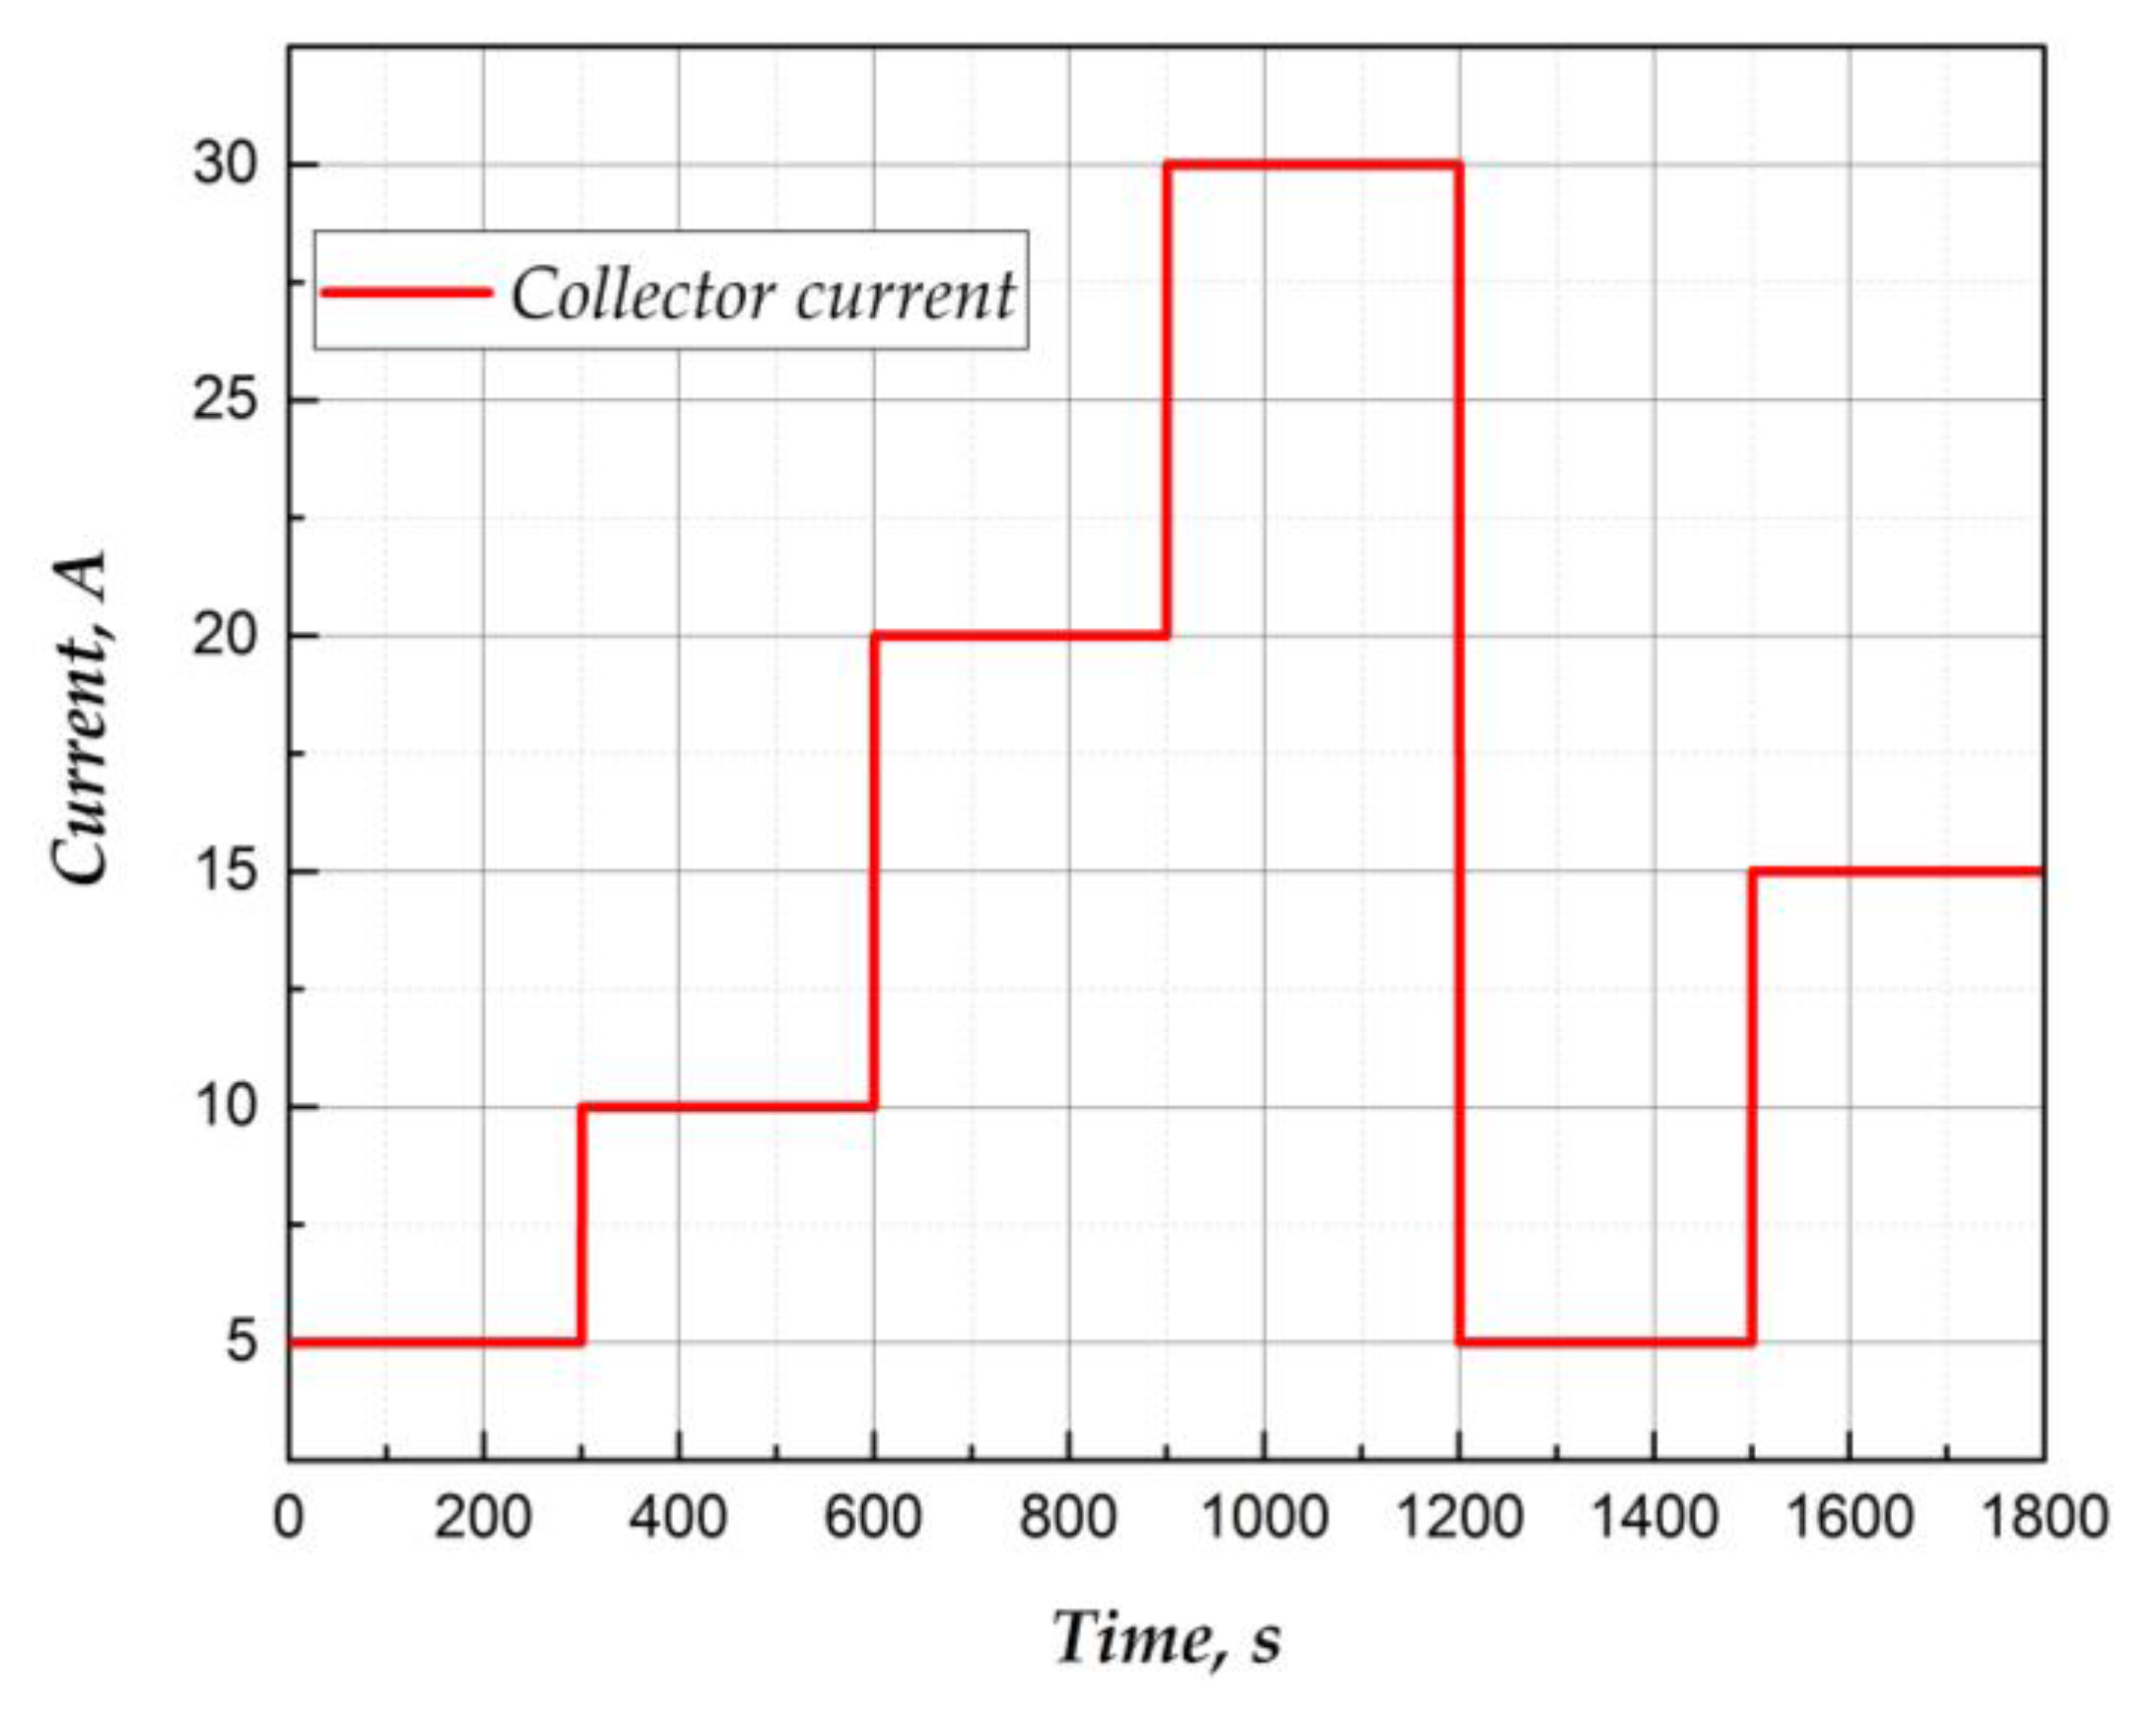
In addition, the gate drive voltage is set as VG = 15 V to set the IGBT in a constant conduction state. The current set is shown in Figure 14. The power loss of the IGBT, which will be integrated by Vce and Ic, is regarded as the input power unit of thermal network. Obtaining the real-time Tc by the thermocouple will be taken as the baseplate temperature unit input of thermal network.
Compared with experimental results, the results of the conventional Cauer-type model and the improved Cauer-type model are obtained, as shown in Figure 15.
The details of Figure 15 are given in Table 5. As the current changes, the junction temperature of the IGBT is constantly changing. Compared with the conventional Cauer-type model, the deviation of the prediction of the junction temperature from that of the improved Cauer-type model proposed in this paper is always kept in a small range. Figure 15b compares the values of the junction temperature estimation errors of the conventional Cauer-type model and those of the improved Cauer-type model with respect to the results obtained by the IR camera. As demonstrated in Figure 15b, the maximum deviation between the actual temperature and the junction temperature predicted by the improved Cauer-type thermal network is 2.34 °C, whereas the maximum deviation of the conventional Cauer-type model is 5.88 °C, which is approximately 2.5 times that of the improved Cauer-type model. After optimization, the error fluctuation ΔErrorc is 2.3 °C and 4.25 °C for the Cauer-type model and the conventional model, respectively, indicating that the improved Cauer-type model performs better in transient junction temperature prediction. Moreover, the average deviation of the improved Cauer-type model is only 33% of the conventional model, indicating that the prediction performance of steady-state junction temperature is effectively improved.
From the above, the improved Cauer-type thermal network proposed in this paper effectively corrects the conventional Cauer-type thermal network from two aspects, namely, prediction of the transient junction temperature and prediction of the steady-state junction temperature, making the improved Cauer-type model predicted junction temperature curve close to the experimental data. Moreover, the improved Cauer-type model also has excellent prediction performance in variable current conditions. As the result, the law of junction temperature can be captured accurately. The establishment of temperature-adaptive Cauer-type thermal network model is completed.
5. Conclusions
In this paper, a method to improve the conventional Cauer-type thermal network model of an IGBT by considering both the temperature influence on the extraction of parameters and the error caused by physical structure was presented. Furthermore, the efficiency of this model was verified through simulation and experiment on a commercial IGBT module. The improved Cauer-type thermal network modifies the convention model both in prediction of the transient junction temperature and in the steady-state junction temperature accuracy. Both modified models have remarkable effects, indicating the excellent prediction performance of the junction temperature. Based on the high-precision prediction performance, the temperature adaptive Cauer-type model was established.
Acknowledgments
The authors wish to acknowledge the financial support of National Key R&D Program of China (No. 2017YFB0102500) and Tianjin Natural Science Foundation of China (No. 17JCYBJC21300). Thanks to Prof. Hurley William Gerard from Electrical Engineering with the National University of Ireland, Galway, Ireland.
Author Contributions
Ning An: Operation of experiments, analysis and writing of article; Mingxing Du: Guidance of experiments and modification of manuscript and reply of comments; Zhen Hu: Support of simulations and experiments; Kexin Wei: Assistance of analysis in simulation part.
Conflicts of Interest
The authors declare no conflict of interest.
References
- Blaabjerg, F.; Ma, K. Future on power electronics for wind turbine systems. IEEE Trans. Power Electron. 2013, 1, 139–152. [Google Scholar] [CrossRef]
- Ji, B.; Pickert, V.; Cao, W. In situ diagnostics and prognostics of wire bonding faults in IGBT modules for electric vehicle. IEEE Trans. Power Electron. 2013, 28, 5568–5577. [Google Scholar] [CrossRef]
- Xu, Z.; Li, M.; Wang, F. Investigation of Si IGBT operation at 200°C for traction application. IEEE Trans. Power Electron. 2013, 28, 2604–2615. [Google Scholar] [CrossRef]
- Cao, W.; Mevrow, B.; Atkinson, G.J. Overview of electric motor technologies used for more electric aircraft (MEA). IEEE Trans. Ind. Electron. 2012, 59, 3523–3531. [Google Scholar]
- Senturk, O.; Helle, L.; Munk-Nielsen, S. Power capability investigation based on electrothermal models of press-pack IGBT three-level NPC and ANPC VSCs for multimegawatt wind turbines. IEEE Trans. Power Electron. 2012, 27, 3195–3206. [Google Scholar] [CrossRef]
- Li, H.; Hu, Y.; Liu, S. An improved thermal network model of the IGBT module for wind power converters considering the effects of base plate solder fatigue. IEEE Trans. Device Mater. Reliab. 2016, 16, 570–575. [Google Scholar] [CrossRef]
- Gong, X.; Ferreira, J.A. Comparison and reduction of conducted EMI in SiC JFET and Si IGBT-based motor drives. IEEE Trans. Power Electron. 2014, 29, 1757–1767. [Google Scholar] [CrossRef]
- Kexin, W.; Mingxing, D.; Linlin, X. Study of bonding wire faliure effects on external measurable signals of IGBT module. IEEE Trans. Device Mater. Reliab. 2014, 14, 83–89. [Google Scholar] [CrossRef]
- Shaoyong, Y.; Angus, B.; Philip, M.; Dawei, X.; Li, R.; Peter, T. An industry-based survey of reliability in power electronic converter. IEEE Trans. Ind. Appl. 2011, 47, 3151–3157. [Google Scholar] [CrossRef]
- Ismail, M.A.; Tamchek, N. A fiber bragg grating—Bimetal temperature sensor for solar panel inverters. Sensors 2011, 11, 8665–8673. [Google Scholar] [CrossRef] [PubMed]
- Liu, Z.; Mei, W.; Zeng, X.; Zhou, X. Remaining useful life estimation of insulated gate bipolar transistors (IGBTs) based on a novel volterra k-nearest neighbor optimally pruned extreme learning machine (VKOPP) model using degradation data. Sensors 2017, 17, 2524. [Google Scholar] [CrossRef] [PubMed]
- Zhen, H.; Mingxing, D.; Kexin, W. Online calculation of the increase in thermal resistance caused by solder fatigue for IGBT modules. IEEE Trans. Device Mater. Reliab. 2017, 17, 785–794. [Google Scholar]
- Riccio, M.; Carli, M.; Rossi, L.; Irace, A. Compact electro-thermal modeling and simultaion of large aera multicellular Trench-IGBT. In Proceedings of the 2010 27th International Conference on Microelectronics Proceedings (MIEL), Nis, Serbia, 16–19 May 2010; pp. 379–382. [Google Scholar]
- Dupont, L.; Avenas, Y.; Jeannin, P.-O. Comparison of junction temperature evaluations in a power IGBT module using an IR camera and three thermosensitive electrical parameters. IEEE Trans. Ind. Appl. 2013, 49, 1599–1608. [Google Scholar] [CrossRef] [Green Version]
- Irace, A. Infrared thermography application to functional and failure analysis of electron devices and circuits. Microelectron. Reliab. 2012, 52, 2019–2023. [Google Scholar] [CrossRef]
- Khatir, Z.; Dupont, L.; Ibrahim, A. Investigation on junction temperature estimation based on junction voltage measurements. Microelectron. Reliab. 2010, 50, 1506–1510. [Google Scholar] [CrossRef]
- Cao, X.; Wang, T. Characterization of lead-free solder and sintered nano-silver die-attach layers using thermal impedance. IEEE Trans. Compon. Packag. Manuf. Technol. 2011, 1, 495–501. [Google Scholar] [CrossRef]
- Avenas, Y.; Dupont, L.; Khatir, Z. Temperature measurement of power semiconductor devices by thermos-sensitive electrical parameters—A review. IEEE Trans. Power Electron. 2012, 27, 3081–3092. [Google Scholar] [CrossRef]
- Luo, H.; Chen, Y.; Sun, P. Junction temperature extraction approach with turn-off delay time for high-voltage high-power IGBT modules. IEEE Trans. Power Electron. 2016, 31, 5122–5132. [Google Scholar] [CrossRef]
- Perdersen, K.B.; Kristensen, P.K. Vce as early indicator of IGBT module failure mode. In Proceedings of the IEEE Reliability Physics Symposium, Aalborg, Denmark, 2–6 April 2017; pp. FA-1.1–FA-1.6. [Google Scholar]
- Shabany, Y. Heat Transfer: Thermal Management of Electronics; CRC Press: France, Francis, 2010; pp. 61–65. ISBN 9781439814673. [Google Scholar]
- Codecasa, L.; Dalessandro, V.; Magnani, A.; Irace, A. Circuit-based electrothermal simulation of power devices by an ultrafast nonlinear mor approach. IEEE Trans. Power Electron. 2016, 31, 5906–5916. [Google Scholar] [CrossRef]
- Chen, M.; Hu, A.; Yang, X. Predicting IGBT junction temperature with thermal network component model. In Proceedings of the Asia-Pacific Power and Energy Engineering Conference, Washington, DC, USA, 25–28 March 2011; pp. 1–4. [Google Scholar]
- Ma, K.; He, N.; Liserre, M. Frequency-domain thermal modeling and characterization of power semiconductor devices. IEEE Trans. Power Electron. 2016, 31, 7183–7193. [Google Scholar] [CrossRef]
- Dutta, S.; Parkhideh, B.; Subhashish, D. Development of a predictive observer thermal model for power semiconductor devices for overload monitoring in high power high frequency converters. In Proceedings of the Applied Power Electronics Conference and Exposition, Raleigh, NC, USA, 5–9 February 2012; pp. 2305–2310. [Google Scholar]
- Luo, Z.; Ahn, H. A thermal model for Insulated Gate Bipolar Transistor module. IEEE Trans. Power Electron. 2004, 19, 902–907. [Google Scholar] [CrossRef]
- Ma, K.; Liserre, M.; Blaabjerg, F.; Kerekes, T. Thermal loading and lifetime estimation for power device considering mission profiles in wind power converter. IEEE Trans. Power Electron. 2015, 30, 590–602. [Google Scholar] [CrossRef]
- Bahman, A.S.; Ma, K.; Ghimire, P. A 3-D-Lumped thermal network model for long-term load profiles analysis in high-power IGBT modules. IEEE J. Emerg. Sel. Top. Power Electron. 2016, 4, 1050–1063. [Google Scholar] [CrossRef]
- Tang, Y.; Ma, H. Dynamic electrothermal model of paralleled IGBT modules with unbalanced stray parameters. IEEE Trans. Power Electron. 2017, 32, 1385–1399. [Google Scholar] [CrossRef]
- Tian, B.; Qiao, W.; Wang, Z. Monitoring IGBT’s health condition via junction temperature variations. In Proceedings of the Applied Power Electronics Conference and Exposition, Lincoln, NE, USA, 16–20 March 2014; pp. 2550–2555. [Google Scholar]
- Batard, C.; Ginot, N.; Antonios, J. Lumped dynamic electrothermal model of IGBT module of inverters. IEEE Trans. Compon. Packag. Manuf. Technol. 2015, 5, 355–364. [Google Scholar] [CrossRef]
- Yun, C.; Malberti, P.; Ciappa, M.; Fichtner, W. Thermal component model for electrothermal analysis of IGBT module systems. IEEE Trans. Adv. Packag. 2001, 24, 401–406. [Google Scholar]
- Vermeersch, B.; Demey, G. A fixed-angle heat spreading model for dynamic thermal characterization of rear-cooled substrates. In Proceedings of the Semiconductor Thermal Measurement and Management Symposium, San Jose, CA, USA, 18–22 March 2007; pp. 95–101. [Google Scholar]
- Material Home. Available online: http://www.efunda.com/materials/materials_home/materials.cfm (accessed on 18 January 2018).
- Du, B.; Hudgins, J.; Santi, E. Transient electrothermal simulation of power semiconductor devices. IEEE Trans. Power Electron. 2010, 25, 237–248. [Google Scholar]
Figure 1.
(a) Sandwich structure of IGBT; (b) Cauer-type thermal model.

Figure 2.
The relationship between thermal conductivity and temperature of different materials.

Figure 3.
The relationship between specific heat capacity and temperature of different materials.

Figure 4.
Single-layer Cauer-type thermal network.

Figure 5.
Time constant of each layer.

Figure 6.
Time to reach steady-state of each layer.

Figure 7.
Comparison of two models.

Figure 8.
(a) IGBT module; (b) FEA model with a cold plate.

Figure 9.
The input of heat flow.

Figure 10.
Temperature distribution in IGBT: (a) Vertical view; (b) Cross-sectional view.

Figure 11.
Junction temperature Tj as a function of time for the SKM75GB12T4 module during the variable heat flow test estimated from two thermal models: (a) the ambient temperature is 50 °C; (b) the ambient temperature is 100 °C.
Figure 11.
Junction temperature Tj as a function of time for the SKM75GB12T4 module during the variable heat flow test estimated from two thermal models: (a) the ambient temperature is 50 °C; (b) the ambient temperature is 100 °C.

Figure 12.
Experimental setup: (a) schematic; (b) actual setup.

Figure 13.
The temperature distribution of IGBT taken by the infrared imager.

Figure 14.
The input of the collector current.

Figure 15.
Comparison of the junction temperature estimated by two models: (a) Tj(t); (b) errors with respect to the IR camera.
Figure 15.
Comparison of the junction temperature estimated by two models: (a) Tj(t); (b) errors with respect to the IR camera.


Table 1.
Characteristics of single layer when the thermal resistance and capacitance different.
| Rth (°C/W) | Cth (J/°C) | Power (W) | Tjcs (°C) | ts1 (ms) | ts2 (ms) |
|---|---|---|---|---|---|
| 0.03 | 0.50 | 50 | 1.5 | 58.7 | 58.7 |
| 0.05 | 0.30 | 50 | 2.5 | 58.7 | 58.7 |
| 0.06 | 0.30 | 50 | 3 | 70.4 | 70.4 |
| 0.10 | 0.10 | 100 | 10 | 39.1 | 39.1 |
| 0.30 | 0.05 | 100 | 30 | 58.7 | 58.7 |
| 0.50 | 0.03 | 100 | 50 | 58.7 | 58.7 |
Table 2.
Parameters of the IGBT module (SKM75GM12T4).
| Material Layer | Thickness (mm) | Density (kg/m3) | Length (mm) | Width (mm) | Rth (°C/W) | Cth (J/°C) |
|---|---|---|---|---|---|---|
| Silicon | 0.15 | 2329 | 7.24 | 6.9 | 1.65e−2 | 2.60e−2 |
| Solder | 0.12 | 7300 | 7.24 | 6.9 | 2.26e−2 | 9.51e−3 |
| Copper | 0.3 | 8960 | 28.5 | 25.8 | 9.17e−3 | 8.55e−2 |
| Alumina | 0.38 | 3780 | 30.65 | 28 | 0.112 | 0.104 |
| Copper | 0.3 | 8960 | 28.5 | 25.8 | 8.18e−3 | 9.56e−2 |
| Solder | 0.12 | 7300 | 28.5 | 25.8 | 1.93e−2 | 1.12e−2 |
| Copper | 2.8 | 8960 | 91.4 | 31.4 | 7.71e−2 | 1.44 |
Table 3.
The RC parameters of the two models in different condition (R; C, °C/W; J/°C).
| Model | Chip | Chip Solder | Copper | Ceramic | Copper | Substrate Solder | Baseplate |
|---|---|---|---|---|---|---|---|
| Convention | 1.65 × 10⁻²; 2.60 × 10⁻² | 2.26 × 10⁻²; 9.51 × 10⁻³ | 9.17 × 10⁻³; 8.55 × 10⁻² | 0.112; 0.104 | 8.18 × 10⁻³; 9.56 × 10⁻² | 1.93 × 10⁻²; 1.12 × 10⁻² | 7.71 × 10⁻²; 1.44 |
| Improved (50 °C) | 1.86 × 10⁻²; 2.72 × 10⁻² | 2.31 × 10⁻²; 9.51 × 10⁻³ | 9.27 × 10⁻³; 8.69 × 10⁻² | 0.126; 0.108 | 8.27 × 10⁻³; 9.72 × 10⁻² | 1.97 × 10⁻²; 1.12 × 10⁻² | 7.80 × 10⁻²; 1.47 |
| Improved (100 °C) | 2.21 × 10⁻²; 2.90 × 10⁻² | 2.43 × 10⁻²; 9.51 × 10⁻³ | 9.42 × 10⁻³; 8.90 × 10⁻² | 0.151; 0.114 | 8.41 × 10⁻³; 9.96 × 10⁻² | 2.07 × 10⁻²; 1.12 × 10⁻² | 7.93 × 10⁻²; 1.50 |
Table 4.
Comparison of two models.
| Model | Peak-to-Valley Value (°C) | Average Rate of Change (°C/s) |
|---|---|---|
| FEM | 4.99; 5.38 | 9.98; 10.76 |
| Improved | 4.35; 4.96 | 8.7; 9.92 |
| Convention | 3.68; 3.71 | 7.36; 7.42 |
Table 5.
Comparison of the two models with respect to the IR camera.
| Model | Maximum Deviation (°C) | Error Fluctuation (°C) | Average Deviation (°C) |
|---|---|---|---|
| Improved | 2.34 | 2.30 | 1.03 |
| Convention | 5.88 | 4.25 | 3.13 |
© 2018 by the authors. Licensee MDPI, Basel, Switzerland. This article is an open access article distributed under the terms and conditions of the Creative Commons Attribution (CC BY) license (http://creativecommons.org/licenses/by/4.0/).
Share and Cite
MDPI and ACS Style
An, N.; Du, M.; Hu, Z.; Wei, K. A High-Precision Adaptive Thermal Network Model for Monitoring of Temperature Variations in Insulated Gate Bipolar Transistor (IGBT) Modules. Energies 2018, 11, 595. https://doi.org/10.3390/en11030595
AMA Style
An N, Du M, Hu Z, Wei K. A High-Precision Adaptive Thermal Network Model for Monitoring of Temperature Variations in Insulated Gate Bipolar Transistor (IGBT) Modules. Energies. 2018; 11(3):595. https://doi.org/10.3390/en11030595
Chicago/Turabian StyleAn, Ning, Mingxing Du, Zhen Hu, and Kexin Wei. 2018. "A High-Precision Adaptive Thermal Network Model for Monitoring of Temperature Variations in Insulated Gate Bipolar Transistor (IGBT) Modules" Energies 11, no. 3: 595. https://doi.org/10.3390/en11030595
Note that from the first issue of 2016, this journal uses article numbers instead of page numbers. See further details here.