Article

Energy Management of Combined Cooling, Heating and Power Micro Energy Grid Based on Leader-Follower Game Theory

1
School of Electrical Engineering, Beijing Jiaotong University, Haidian District, Beijing 100044, China
2
China Electric Power Research Institute Limited Company, Haidian District, Beijing 100192, China
*
Author to whom correspondence should be addressed.
Energies 2018, 11(3), 647; https://doi.org/10.3390/en11030647
Submission received: 13 February 2018 / Revised: 7 March 2018 / Accepted: 12 March 2018 / Published: 14 March 2018
(This article belongs to the Section F: Electrical Engineering)

Abstract

:
In this paper, we consider a general model and solution algorithm for the energy management of combined cooling, heating, and power micro energy grid (MEG) under the game theory framework. An innovative dynamic leader-follower game strategy is proposed in this paper to balance the interactions between MEG and user. We show that such game between MEG and user has a unique Nash equilibrium (NE), and in order to quantify the user’s expenditure and dissatisfaction, we model them and adopt the fuzzy bi-objective algorithm. For more details in the proposed game model, the MEG leads the game by deciding energy sales prices and optimizing the power, cooling and heating outputs according to the user’s load plan to maximize its own profit. With the prices being released by MEG, user’s adjustment of energy consumption follows and is again fed to MEG. In practice, we initialize simulations with daily loads of a typical community. As the numerical results demonstrate, MEG is proficient in consumption capacity of renewable energy and energy optimization. It also shows that the user achieves his economic optimum with experience of energy usage taken into account.

1. Introduction

As an economic and environment-friendly energy utilization system, the concept of Energy Internet (EI) is first introduced by American scholar Jeremy Rifkin [1]. EI is designed to transport clean energy, connect different energy sources and provide users with cooling, heating, and electrical energy services in various forms. Moreover, it is closely related to and highly compatible with information technology. A Micro Energy Grid (MEG) [2] is a group of multiple distributed generation devices and loads operating as an integrated energy system, which is connected to the power grid and is able to function in parallel with the grid or in isolated island mode. Being the kernel of EI, MEG is thus researched to boost energy management of the whole network.
The technology of combined cooling, heating and power (CCHP) [3,4] has greatly developed MEG and brought benefits to economy and eco-system. With the aid of CCHP, MEG is not only able to organize and manage the distribution of energies, but can also undertake the task of supplying cooling, heating, and electrical needs [5]. MEG can now link diverse energy conversion devices such as internal combustion engine, ice-storage air-conditioner, photovoltaic (PV), and wind turbines (WT), and possess different operation conditions (isolated island/grid). In March 2017, China National Energy Administration published “Notice on Conducting Pilot Project of Market-oriented Distributed Power Generation Market”, with the purpose of enhancing the multi-energy complementary community and further enlarging the energy market. Consequently, MEG is facing a two-sided challenge due to these technological innovations and government guidelines. Firstly, the increase of energy types and technological advancements has enhanced the structural complexity of MEG, making equipment control and management more complicated. Secondly, the gradual opening-up of energy market and the increase of multi-type participants cause higher variability in the relationship between MEG and users, which leads to difficulties in operating and managing. With all of the above said, the modeling and energy management of MEG are the current focus of the academic community.
In the modeling aspect, the partial load performance of CCHP and the performance of ice-storage air-conditioner has been modulated, and the cooling and electricity coordinated microgrid day-ahead scheduling model is established [6]. Ref. [7] presents a highly integrated and reconfigurable microgrid testbed containing various distributed generation units and diverse energy storage systems, which can provide energy both electrically and thermally. In [8,9], to augment the flexibility of energy management, the authors discuss the energy hub structure (including cooling, heating, and power hubs) and the corresponding optimal dispatch strategies for multiple energy system on the whole MEG level. In [10], based on a model predictive control approach, a novel framework of energy management system in microgrid is proposed, which yields optimal dispatch decisions of generators, energy storage system, and peak demand for controllable loads. Though laying down the cornerstones of the MEG framework, most of the above-mentioned works only paid attention to the operating costs of the microgrid, without discussing the pros of MEG pricing to the market.
In the energy management aspect, the relevant researches addressing the optimization methods adopted for CCHP or microgrid are shown, as follows. An approach-EABOT (energetic analysis as a basis for robust optimization of tri-generation systems by linear programming) is proposed in [11] to perform CCHP optimization. Ref. [12] addresses the optimization problem of an Organic Rankine Cycles system, and uses a multi-objective approach to optimize the electric efficiency and overall area of the heat exchangers simultaneously. In [13], a multi-period artificial bee colony optimization algorithm is implemented for economic dispatch to combine generation, storage, and responsive load offers in microgrids. In order to improve the operational efficiency, the improved particle swarm optimization (PSO) algorithm is proposed in [14,15] to solve the multi-period optimization problem in microgrid energy management system. Ref. [16,17] propose an effective approach to identify the most stable modular cogeneration plant solutions through a multi-objective robust design optimization, and highlight how the optimized combined heat and power plants can be characterized by reasonable levels of energetic and economic sensitivity. A hybrid grey wolf optimizer-PSO algorithm is introduced to solve the multi-objective energy management problem in [18]. The above works use traditional multi-objective optimization algorithms for energy management optimization to obtain Pareto non-inferior solution front. Yet, usually, the non-inferior solution front produces a set multiple optimal solutions for managers to choose from. The final decisions, without doubt, are heavily influenced by the personal biases of the managers.
Unlike the traditional multi-objective optimization, the game-theoretical optimization method can obtain the unique optimal strategy for rational participants. The resulting game equilibrium can serve to guide the formulation of energy price and microgrid planning and operation. In the microgrid related game optimization, Ref. [19] contemplates on a distributed energy management algorithm by taking the interactions and interconnections among utility companies, microgrids, and customers into consideration. In [20,21], a Stackelberg game-theoretical framework is used to study the interactions between production units and microgrids. In [22], a data-based Stackelberg market strategy for a distribution market operator is proposed to coordinate power dispatch among different virtual power plants, e.g., the demand response aggregators. In [23,24], a novel game model based on the hierarchical Stackelberg game for analyzing the multiple energies trading problem is discussed in integrated energy systems. Ref. [25] proposes a novel incentive-based demand response model from the view of a grid operator to enable system-level dispatch of demand response resources. Ref. [26] proposes a distributed demand-side energy management scheme in residential smart grids based on ordinal state-based potential game with various kinds of household electrical appliances. Ref. [27] designs an incentive contract menu to achieve long-term stability for electricity prices in a day-ahead electricity market, together with a bi-level Stackelberg game model to search for the optimal incentive mechanism. Nevertheless, most of the above game models with energy trading focus only on the electrical energy trading. The researches on various energy trading and the impact of user’s individual motivation are not integrated enough into these researches.
By taking consideration of the coordination between different decision-making entities, and with the intention of treating the user in energy market in an unbiased way, this paper introduces an analytical method based on leader-follower game theory, which is aiming to solve multi-energy trading problems between the CCHP integrated MEG and the user. The main contributions of this work are as follows:
  • An innovative dynamic leader-follower game is proposed in this paper to balance the interactions between MEG and user; moreover, different from Pareto front obtained by the traditional multi-objective optimization, the Nash equilibrium (NE) here that provides optimal solutions is proven to exist uniquely.
  • The proposed analytical method accommodates both the individual rationality and activity of participants in the decision-making process, and resolves the conflict between different stakeholders.
  • In the process of game optimization, the multi-energy needed on the user side are fully considered and used as optimization variables.
  • The user dissatisfaction function is proposed, which is characterized as the inherent relationship between the actual load and the demand load.
  • The user’s expenditure and dissatisfaction are quantified in the fuzzy bi-objective algorithm, which makes the user objective function more reasonable.
The rest of the paper proceeds as follows. First, we describe the leader-follower game model in Section 2; we then propose a complete set of analytical methods to solve game model in Section 3; through simulations in different scenarios, we next obtain the equilibrium strategies and analyze the results in Section 4; and, the conclusions and future works are provided in Section 5.

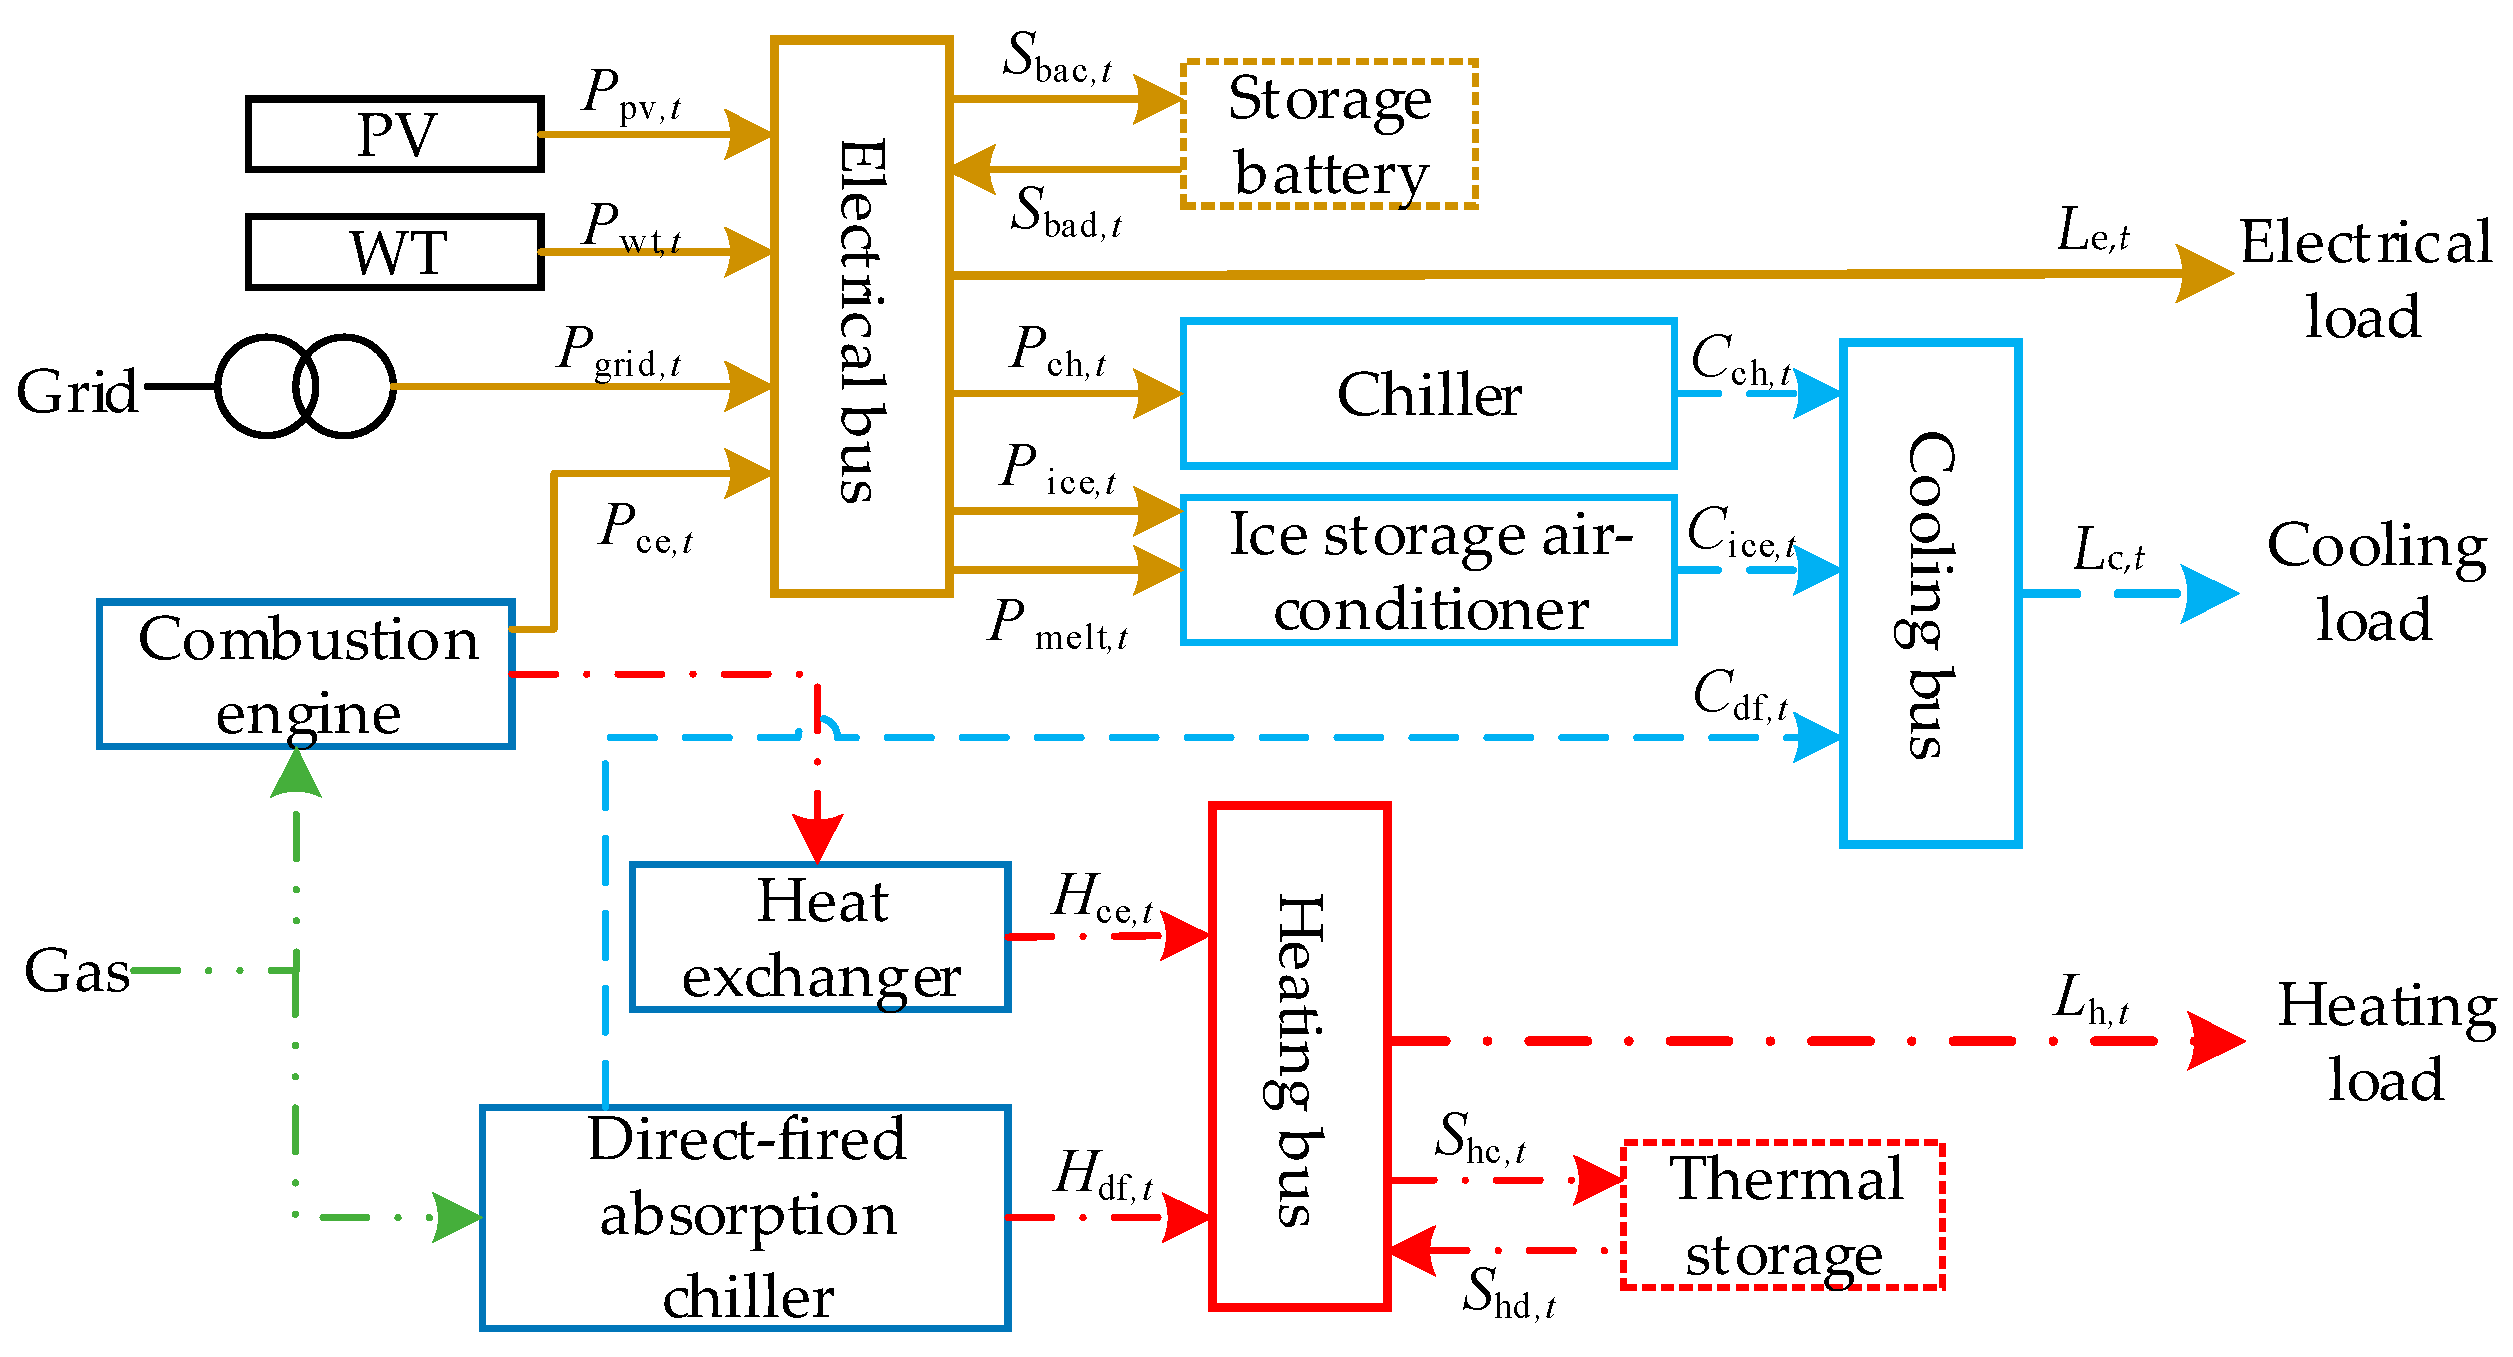
2. The Modeling of MEG

In this paper, we establish the CCHP integrated MEG model based on energy bus [28]. According to the type of energy conversion, energy buses are divided into three types: electrical energy bus, heating energy bus, and cooling energy bus. The devices connecting to the bus are divided into four types: source, converter, energy storage, and load. Energy bus-based structure of CCHP integrated MEG is shown in Figure 1. The figure shows not only the coupling relationships among different devices in detail, but also the conversion relationships between devices and energies. Internal combustion engine, ice-storage air conditioner, energy storage, PV, WT, and other main devices modeling reference to [6,8,9]. Independent modeling of different sources (wind/light/electricity/gas), storages (electrical/thermal/cold), and conversion devices in MEG must satisfy the cooling, heating, and electrical balance equations, and their operation constraints in each t period. The followings are the energy balance equations in MEG.

2.1. The Balance in Energy Bus

  • Electrical balance
    P grid , t + P pv , t + P wt , t + P ce , t + I bad , t S bad , t = L e , t + P ch , t + I cc , t P ice , t + I cd , t P melt , t + I bac , t S bac , t
  • Heating balance
    H ce , t + H df , t + I hd , t S hd , t = L h , t + I hc , t S hc , t
  • Cooling balance
    C df , t + C ch , t + C ice , t = L c , t
Equations (1)–(3) are the energy balances in electrical energy bus, heating energy bus, and cooling energy bus, respectively. t represents the time period.
In Equation (1), Pgrid,t is the exchange power between the electrical bus and the power grid. Defining that Pgrid,t is positive indicating purchasing power from the grid, while negative means selling power to the grid. Ppv,t, Pwt,t, Pce,t are power outputs of PV, WT, and internal combustion engine, respectively. Pch,t, Pice,t, Pmelt,t are, respectively, electricity consumptions while chiller working, ice-storage air-conditioner making, and melting ice. Icc,t, Icd,t represent status values of ice-storage air-conditioner when making and melting ice (0/1, 0 is off and 1 is on). Sbad,t, Sbac,t represent discharging and charging power of battery storage. Ibad,t, Ibac,t represent status values of battery storage when discharging and charging. Le,t is the actual electrical load consumed by the user.
In Equation (2), Hce,t, Hdf,t, are heating outputs of heat exchanger and direct-fired absorption chiller. Shd,t, Shc,t represent heating discharging and charging power of thermal storage. Ihd,t, Ihc,t represent status values of thermal storage when discharging and charging. Lh,t is the actual heating load consumed by the user.
In Equation (3), Cdf,t, Cch,t, Cice,t, are cooling outputs of direct-fired absorption chiller, chiller, and ice-storage air-conditioner. Lc,t is the actual cooling load that is consumed by the user.
In addition to the above energy balances in energy buses, the output constraints and operating conditions of each device need to be taken into account, including the output upper and lower bounds of each device and the status constraints of the energy storage device. Device constraints are as follows.

2.2. Device Output Constraints

Each device must work within upper and lower bounds. In Equations (4)–(7), Pce,max, Pm,max, Hn,max, Ck,max are, respectively, the maximum power output bounds for internal combustion engine, m-type device, n-type device, and k-type device. Pce,min is the minimum power output bound for internal combustion engine. Pce,t, Pm,t, Hn,t, Ck,t represent the power output of internal combustion engine, m-type device, n-type device, and k-type device, respectively. Here, the m types of devices include direct-fired absorption chiller, chiller, ice-storage air-conditioner, PV, and WT. The n types of devices include heat exchanger and direct-fired absorption chiller. The k types of devices include direct-fired absorption chiller, chiller, and ice-storage air-conditioner.
P ce , min P ce , t P ce , max
0 P m , t P m , max
0 H n , t H n , max
0 C k , t C k , max

2.3. Constraints for Energy Storage Devices

Energy storage devices (battery storage, thermal storage, ice tank) cannot store more energy than their own capacity and release too much energy per unit time. In addition, the devices need to retain some redundancy in the case of power failure accident. In Equations (8)–(11), Ein,t, Eout,t are the energy storage and release rates in period t, respectively. Ein,max, Eout,max are the maximum charge and discharge rates per unit time. SOCt is the state of charging of the energy storage device. It is worth mentioning that charging mode and discharging mode cannot operate simultaneously. Besides, the initial SOC value equals the final SOC value.
0 E in , t E in , max
0 E out , t E out , max
0.2 S O C t 1
S O C 0 = S O C 24

3. Leader-Follower Game between MEG and User

3.1. The Basic Idea of the Game

Due to the randomness of renewable energy (PV, WT) and the adjustability of user’s energy usage, the main focal points of MEG are: optimizing device outputs rationally to consume renewable energy, and deciding the energy sales prices to increase the economic benefits. From the user’s point of view, how to adjust consumed energy loads according to different energy sales prices, and reduce the expenditure within the acceptable experience of energy usage are also the key issues. Therefore, the MEG and the user belong to different stakeholders. Both of them have their goals, needs, and adjustment strategies. These two are closely related and have some interest relations. However, the objective benefits of both are affected by each other’s strategies. Obviously, it is a typical game problem.
Game theory is an effective tool to solve the conflicts among different stakeholders [29]. Among the different game theories, the leader-follower game is the dynamic game of decision-making existing in order with complete information. There are at least one leader and one follower existing in the leader-follower game. The process of the game is that the leader first determines his own decision, and the follower makes the decision that maximizes his own interests according to the leader’s decision. The interactive process of MEG energy sales prices and user’s energy utilization strategies can be regarded as the leader-follower game. As the leader, MEG decides the best energy sales prices to maximize its profit. As a follower, the user adjusts energy utilization strategies to minimize the expenditure and dissatisfaction, according to the leader’s decision. It is worth mentioning that, the user energy strategy in the paper is similar to the demand response. In recent years, with the development of smart grid technology, users can actively change their own electricity consumption behavior, according to released information, thus making the demand response possible. With the gradual improvement of relevant policies and technology, more users participate in the electricity market as the demand response side. For residential users, the load is controlled by adjusting the time and period of the usage of energy-consuming equipment, such as refrigerators, air conditioners, heaters, electric vehicles, etc., or by using a home energy management system. In addition, the residential users’ loads can be aggregated by a load aggregator. For the prices that were released by MEG, the load aggregator responds by adjusting users’ loads. Because the load aggregator has signed a contract with the user, and the users’ loads can be adjusted within a certain range, that is, the user can adopt the energy strategy to some extent. Commercial and industrial users have a large base of energy consumption and a regular pattern of energy usage, which can participate well in demand response and make a certain degree of load adjustment. Therefore, it is possible for the user to adopt an energy strategy. The leader-follower game model of MEG and user constructed in this paper is as follow [30]:
  • Participants
    G = { MEG , User }
  • Strategies
    Ω = ( Ω p r , Ω l )
  • Profit/Payment function
    I MEG ( p r , l t ) , I user ( p r , l t )
In Equations (12)–(14), there are three basic elements of a general leader-follower game: participants G, strategies Ω, profit/payment I. In this leader-follower game, participants are MEG and user. During the game, the MEG decides the energy sales prices pr, and the user uses the load lt as strategies to adjust his own profit/payment.
In the leader-follower game, when the follower makes the optimal response accepted by the leader, the game reaches Nash equilibrium. At this moment, the utility function of the participants reaches the optimum, namely:
p r * = arg max ( p r , l t * )
l t * = arg max ( p r * , l t )
where pr*, l t * are the participants’ equilibrium strategies. When all of the game participants’ strategies are NE strategies, no player can gain more by adjusting their strategies independently.

3.2. Profit Function of the MEG

Profit/payment is the goal pursued by each participant in the game. It is a function of strategy. Reasonably constructing the profit/payment function has a great influence on the solution of the game model. The leader-follower game model established in this paper divides one day into N = 24 periods, and takes each period as the basic unit to make scheduling and optimization.
The profit of MEG is related to the distributed energy capacity, output characteristics, real-time electricity price (RTP), heating price, and unit emissions. The expression is as follow:
max I MEG = t = 1 N ( p r t l t C t E m i t ) ρ
where prtlt represents the energy sales revenue in period t, prt represent the energy sales prices (including the RTP p r t e , heating, and cooling price p r t h / c ) of the MEG in period t, lt represents the actual loads consumed by the user in period t.
Ct is the production cost of MEG, including the operation cost and maintenance cost of each unit, the expression is as follow:
C t = ( J g V g , t + J e P grid , t ) + i = 1 I K i P i , t
where Jg is the price of natural gas, Je is electricity price of the grid, Vg,t is the total gas volume consumed by MEG in period t. Ki is the maintenance cost factor for i-type device, Pi,t is the output power of the i-type device in period t, I is the total number of devices in MEG. The operation costs of renewable energy devices (PV and WT) are negligible.
Emit is the emission cost of MEG. The emissions include emissions from the purchase of electricity through the power grid and from the gas combustion. The expression is as follow:
E m i t = p emi [ V g , t ( w gasC + w gasN ) + P grid , t ( w elcC + w elcN ) ]
where pemi is the emission price of gas per unit volume, and wgasC, wgasN are the CO2 and NOx emission volume corresponding to the kWh unit of gas consumed, respectively. welcC, welcN are the CO2 and NOx emission volume corresponding to the kWh unit of electricity that is purchased from the grid, respectively.
ρ is the punishment fee that represents the deviation between the generation of renewable energy and the actual electrical load in MEG:
ρ = δ t = 1 N ( l t g re )
where gre is the total generating capacity of renewable energy in period t, and δ is the penalty price per unit of electricity.

3.3. Payment Function of the User

The payment function of the user includes the energy-purchasing expenditure P and the user dissatisfaction function R towards the actual loads.
The expenditure P is expressed as:
P = t = 1 N p r t l t
As for the user dissatisfaction function, the following requirements should be satisfied:
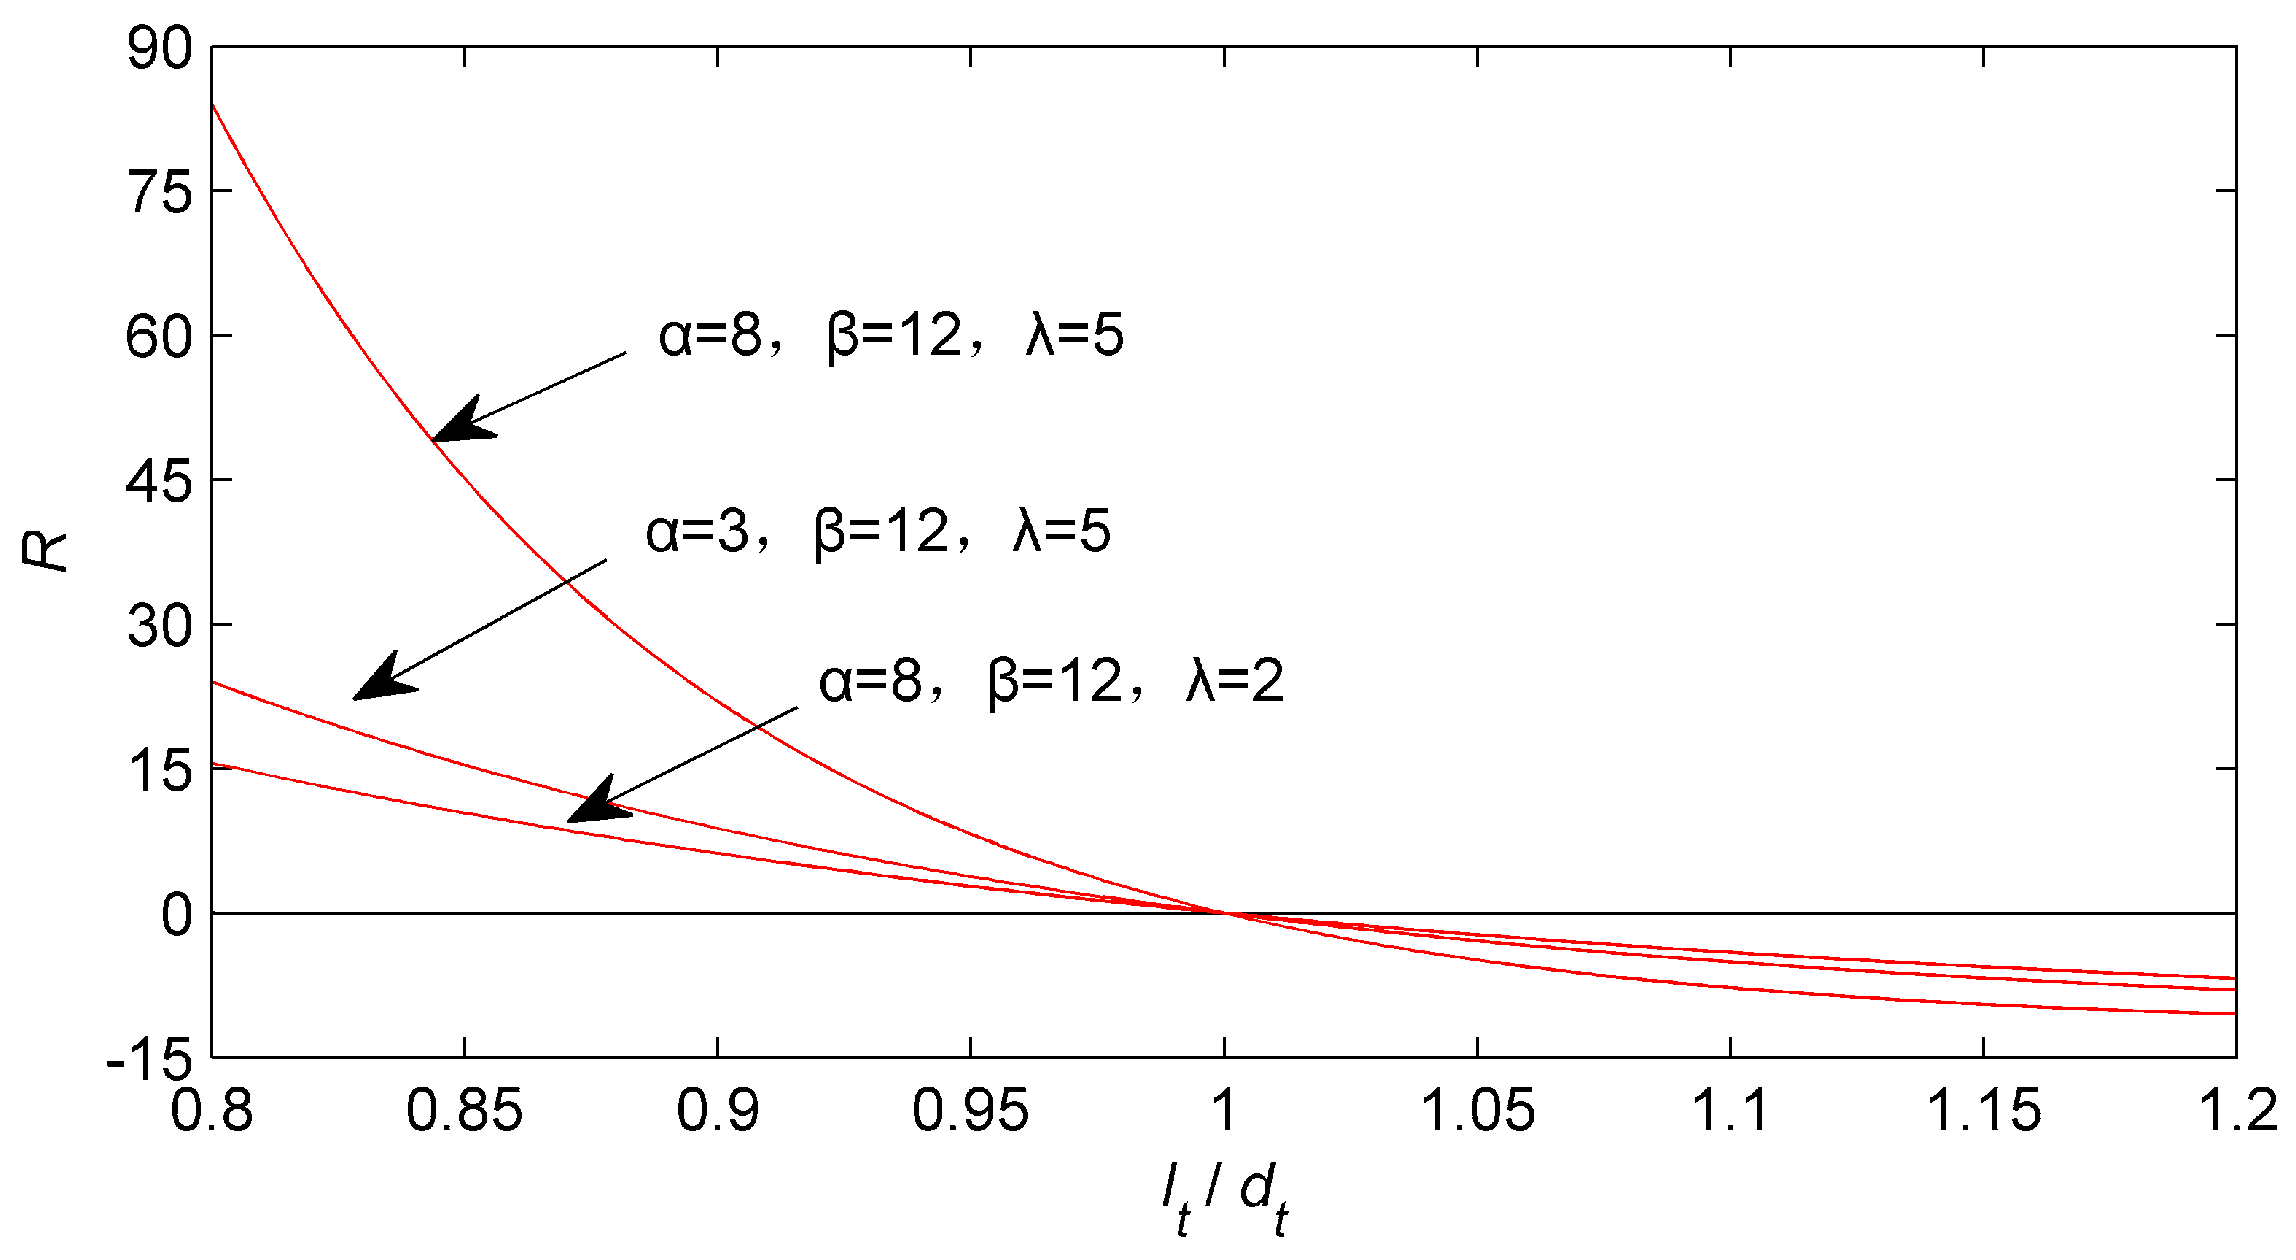
  • Before reaching the user demand load, the larger the actual load reduction ratio is, the higher the dissatisfaction is.
  • When reaching the demand load, the dissatisfaction becomes zero.
  • When the actual load exceeds the demand load, the dissatisfaction becomes negative, which means that it becomes satisfaction.
  • However, the user satisfaction cannot increase indefinitely with the increase of the actual load. When the actual load increases to a certain extent, the change of user satisfaction tends to be slow and close to a preset value.
Based on the above requirements, this paper takes the deviation between the user’s actual load and the demand load as variables [31], and constructs the following function to quantify the user dissatisfaction with the actual load. The user dissatisfaction function R is expressed as:
R t = β ( α λ ( 1 l t d t ) 1 )
where α > 1, β > 0, λ > 1. Parameter β is the preset value that the function close to when the actual load increases to a certain extent. Parameter λ is related to the proportional elasticity of load adjustment, which makes the adjustment more sensitive. Parameter α is related to the magnitude of the function. dt is the user’s demand load. When taking into account the economy, the user experience of energy usage should also be considered. Therefore, we take the user dissatisfaction as one of the user’s goals. In other words, the user’s actual load is adjusted within a reasonable range, so as not to affect the experience of energy usage. Under the determined demand load dt, with the adjustment of lt, the user dissatisfaction function curves with different parameters are shown in Figure 2.
Figure 2 shows the changing trend of the user dissatisfaction function R. Analyzing the trend of the three curves, we can see that it meets the requirements of the specific meaning of the user dissatisfaction. In addition, with the different values of α, β, and λ, it can be seen that the values of α, β affect the upper and lower bounds of the function R, and the value of λ affects the sensitivity of load adjustment.
The user payment function needs to take into account the user expenditure P and the user dissatisfaction R, which is a bi-objective optimization problem. When considering the different dimensions and ranges of the functions, it may not be sensible to do the simple linear addition, even if a factor is multiplied. We uses a fuzzy solution to deal with the bi-objective optimization problem based on [32]. The key of fuzzy bi-objective optimization approach is to establish two mappings of objective function values to the optimal solution membership degree, respectively. Here, the membership degree is as the degree of satisfaction of each objective function value. The main steps of fuzzy bi-objective optimization of the user payment function are as follows:
  • Step 1: Solve the optimization problem with only expenditure objective. Get the optimal expenditure Pm, and calculate the user dissatisfaction in this condition, noted as RM.
  • Step 2: Solve the optimization problem with only dissatisfaction objective. Get the optimal dissatisfaction Rm, and calculate the expenditure in this condition, noted as PM.
  • Step 3: Fuzz the objective function value and establish the mapping from single objective function value to membership degree. The membership degree function in this paper is a semi-trapezoidal distribution: the membership degree equals 1 when P < Pm, and it equals 0 when P > PM (the same as R). When Pm < P < PM and Rm < R < RM, the membership degree is a linear distribution. The two membership degree functions are shown in Equations (23) and (24).
    μ ( P ) = { 1 P P m P M P P M P m    P m < P < P M 0 P P M
    μ ( R ) = { 1 R R m R M R R M R m    R m < R < R M 0 R R M
  • Step 4: Add the weighted membership degree functions linearly, and then the fuzzy bi-objective function can be obtained. According to the principle of maximizing membership degree, the fuzzy bi-objective function is taken as the payment function of the user to be optimized in the game.
In summary, the payment function of the user is shown in Equation (25):
max I user = max [ a μ ( P ) + b μ ( R ) ]
where a, b are the weight coefficients of objective 1 and objective 2, respectively.

3.4. Nash Equilibrium

According to the definition of NE [33], when assuming that (prt*, lt*) t = 1 N is the NE strategy of the game model when the leader-follower game has a unique NE. It indicates that the MEG (leader) decides the energy sales prices (prt*) t = 1 N as its strategy, and the user (follower) adjusts his own energy load strategy (lt*) t = 1 N on the basis of the released MEG strategy, in which case the benefits of both participants can reach the equilibrium.
The strategies determined by the MEG and the user in this paper belong to pure strategies. If and only if the following theorem is satisfied, the NE of the leader-follower game exists uniquely.
Theorem 1.
In a multi-participants game, if (1) the pure strategy set S of each participant is a non-empty, closed, bounded convex set in the Euclid space; (2) for the leader’s optimal strategy, the follower has the only optimal strategy; (3) for the follower’s optimal strategy, the leader has the only optimal strategy.
Proof of Theorem 1.
 
(1) Since the strategy space of game between MEG and user is non-empty, tight, convex set in Euclid space, the condition (1) of the Theorem 1 is satisfied.
(2) For the leader’s optimal strategy, we solve the follower’s optimal strategy. By taking the derivative of the user payment function Iuser with respect to lt, we can obtain:
I user l t = a p r t P 0 + b β α λ ( 1 l t d t ) ln α λ R 0 d t
where P0 = PMPm, R0 = RMRm.
By letting the left of Equation (26) equal to 0, we can obtain the user’s optimal strategy:
l t ( p r t ) = d t ( 1 log α ( a R 0 d t p r t b β ln α λ ) λ )
Then, by taking the second-order derivatives of the user payment function Iuser with respect to lt and li, we can obtain:
2 I user l t l i = { b β α λ ( 1 l t d t ) ( ln α ) 2 λ 2 R 0 d t 2    t = i 0 t i
From Equation (28), we can see that Hessian matrix of Iuser is a negative definite matrix, which means that the user’s payment function is a concave function, and (lt*) t = 1 N is the user’s optimal strategy for the given energy sales prices. So, the condition (2) of the Theorem 1 is satisfied.
(3) Substituting user’s optimal strategy (27) into MEG’s profit function (17), we can obtain:
I MEG ( p r t ) = t = 1 N ( p r t l t ( p r t ) C t E m i t ) t = 1 N δ ( l t ( p r t ) g re )
In Equation (29), Emit and Ct are, respectively, linear and non-linear functions of Pgrid,t, Vg,t, which would not change with the strategy (prt*) t = 1 N . Therefore, they can be considered as constants. By taking the second-order derivatives of the MEG’s profit function IMEG, with respect to prt and pri, we can obtain:
2 I MEG p r t p r i = { d t ( p r t + δ ) λ ln α p r t 2    t = i 0 t i
Similarly, we can see from Equation (30) that the Hessian matrix of IMEG is a negative definite matrix, which means that the profit function of the MEG is a concave function. Moreover, the MEG’s strategy set is a convex set, so there is a unique solution to the MEG’s profit optimization problem. That is, (prt* ) t = 1 N is the optimal price strategy for the user’s optimal load strategy. So, the condition (3) of the Theorem 1 is satisfied. ☐
The above proofs show that there is a unique NE existing in the leader-follower game proposed in this paper, and the equilibrium strategy can be obtained through the following solution.

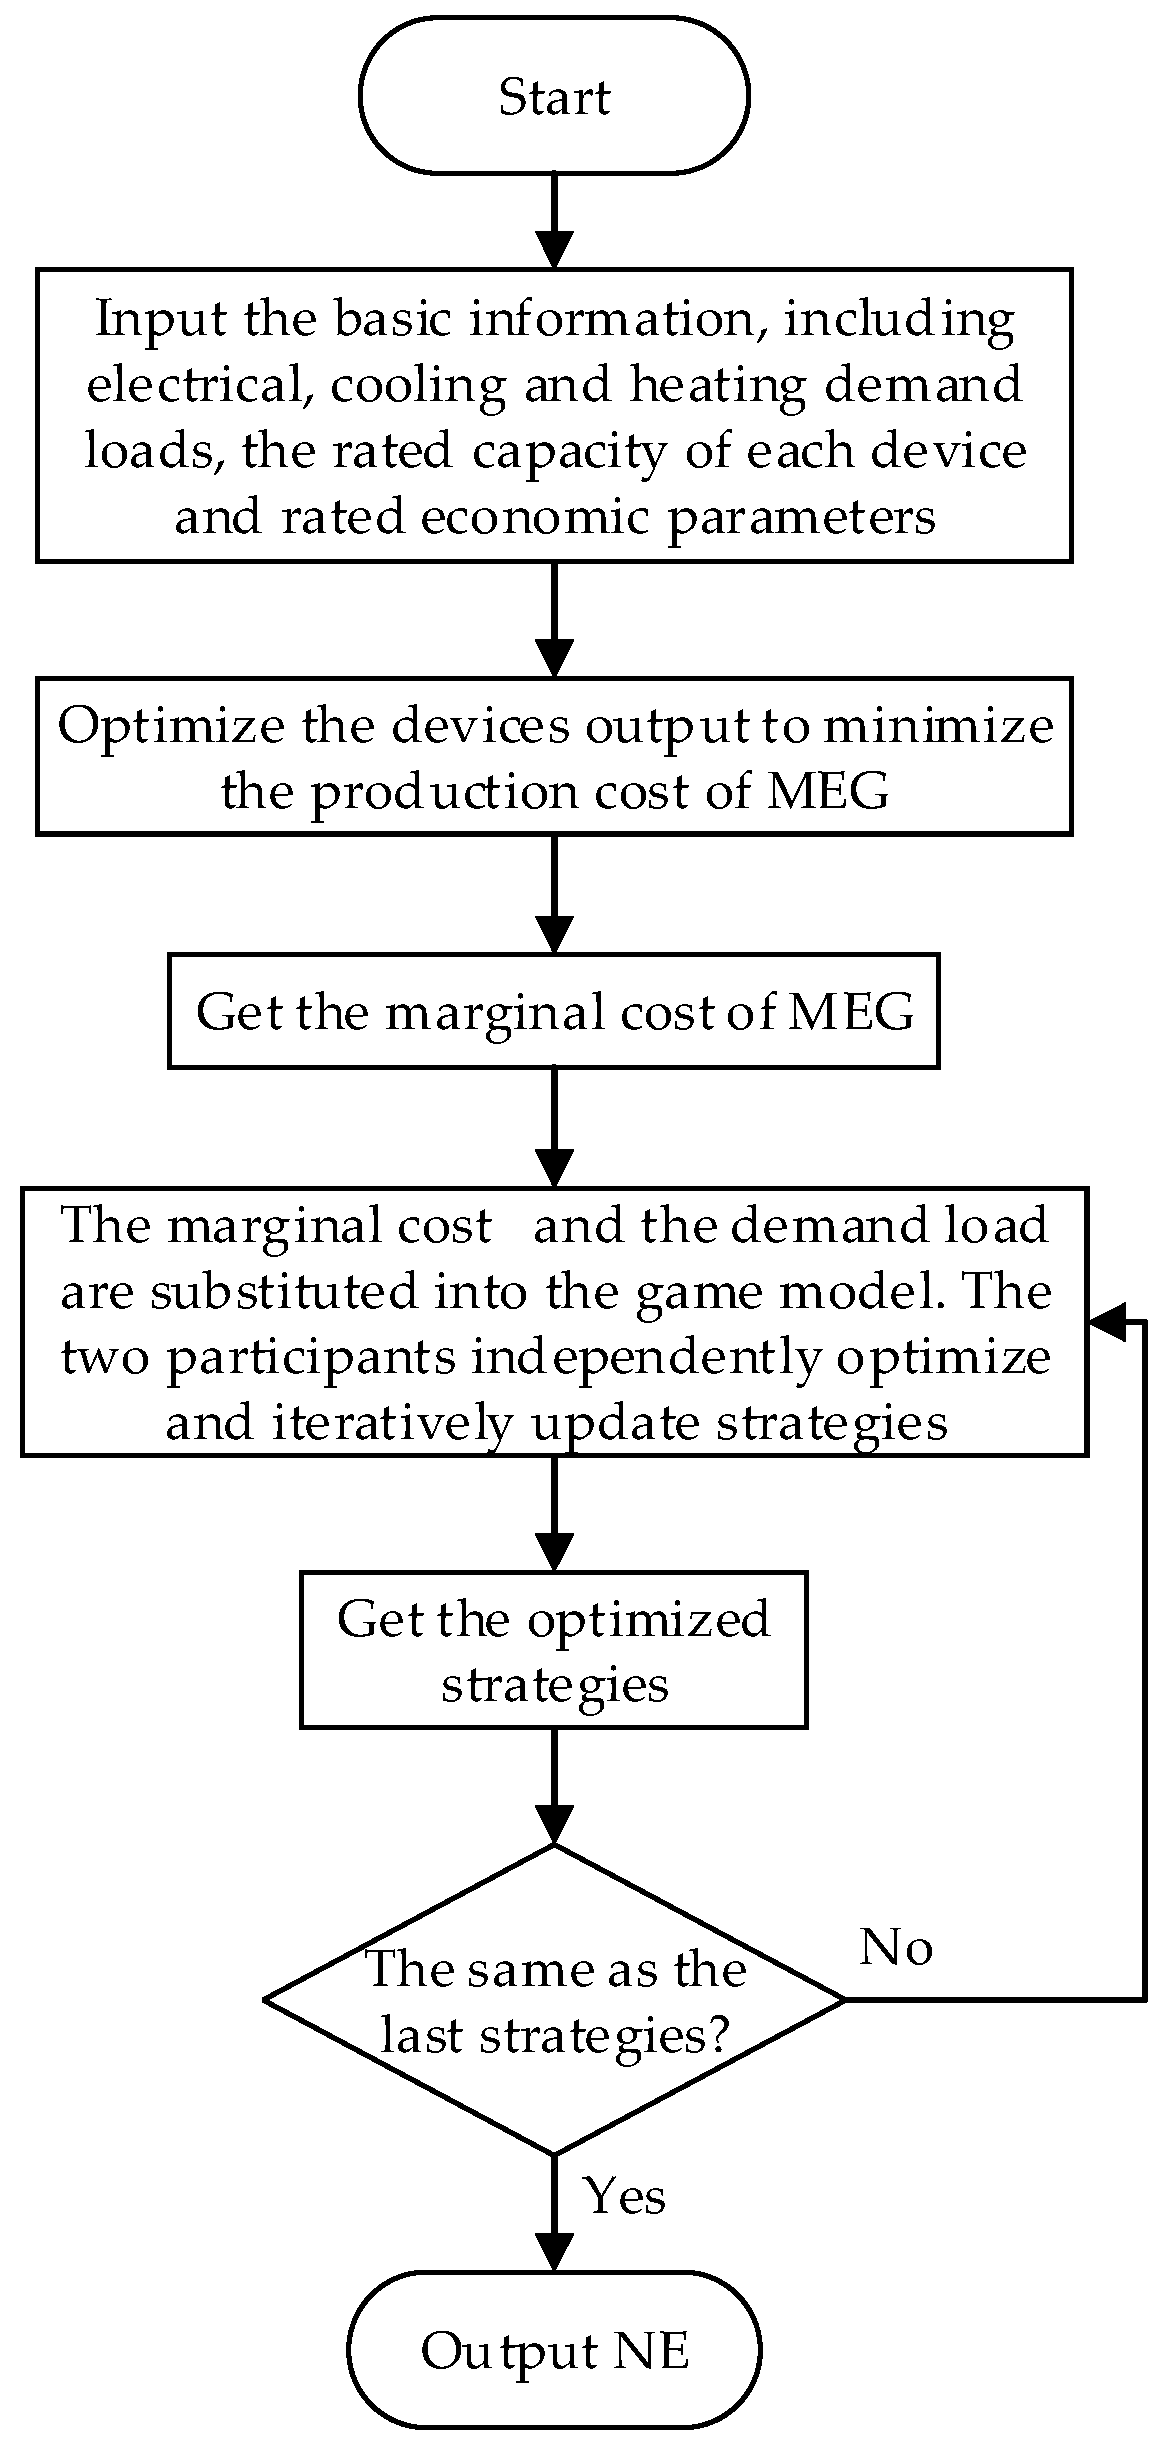
3.5. Game Solving Process

The game in this paper is a dynamic game of complete information. The decision of each round of MEG or user is a function of the information obtained before the decision-making. After a series of rounds, the game results in equilibrium. According to the user’s historical data, MEG sets the initial price strategy; the user adjusts his energy strategy according to the energy sales prices and feedbacks to the MEG. The constraints of user’s energy strategy are as follows:
l t , un l t d t
t = 1 N ( d t l t ) υ t = 1 N d t
where lt,un is the uninterruptible load, that is, the user’s minimum load requirement must be satisfied in period t. ν is the maximum interruptible load ratio. The user-adjusted load cannot be too much to affect the normal demand.
According to the user’s energy strategy, MEG adjusts the energy sales prices to optimize the profit IMEG. From Equation (26), the function of prt about lt can be obtained:
p r t = b β α λ ( 1 l t d t ) ln α λ P o a R o d t = x α λ ( 1 l t d t ) y
The constraints of MEG’s strategy are as follows:
p r mc , t p r t x α λ ( 1 l t , un d t ) y
where prmc,t is the marginal cost of MEG generating energy.
MEG updates price strategy and then feedbacks to the user. This process alternates iteratively until it reaches equilibrium. Flow chart of solving the leader-follower game is shown in Figure 3.

4. Case Study

In the simulation, we take a CCHP integrated MEG as an example. The PV, WT, power grid, and gas provide power and fuel, and the conversion devices in MEG meet the user’s cooling, heating, and electrical loads by converting the energy. In this paper, the leader-follower game between MEG and user is simulated in three scenarios:
Scenario 1: MEG is not connected to the power grid and under isolated island operation. The MEG only use electricity price as the strategy to game with the user.
Scenario 2: MEG is connecting to the power grid, which electricity can be purchased from or sold to the power grid. The MEG only use electricity price as the strategy to game with the user.
Scenario 3: MEG is connecting to the power grid. The MEG uses electricity price and heating price as strategies to game with the user.
The models proposed in the paper are solved in Matlab platform. Since the problems of this paper are mixed integer nonlinear programming, fmincon is selected as the solution engine. Each model is run for one typical day, with three types of loads, electrical load, heating load, and cooling load.

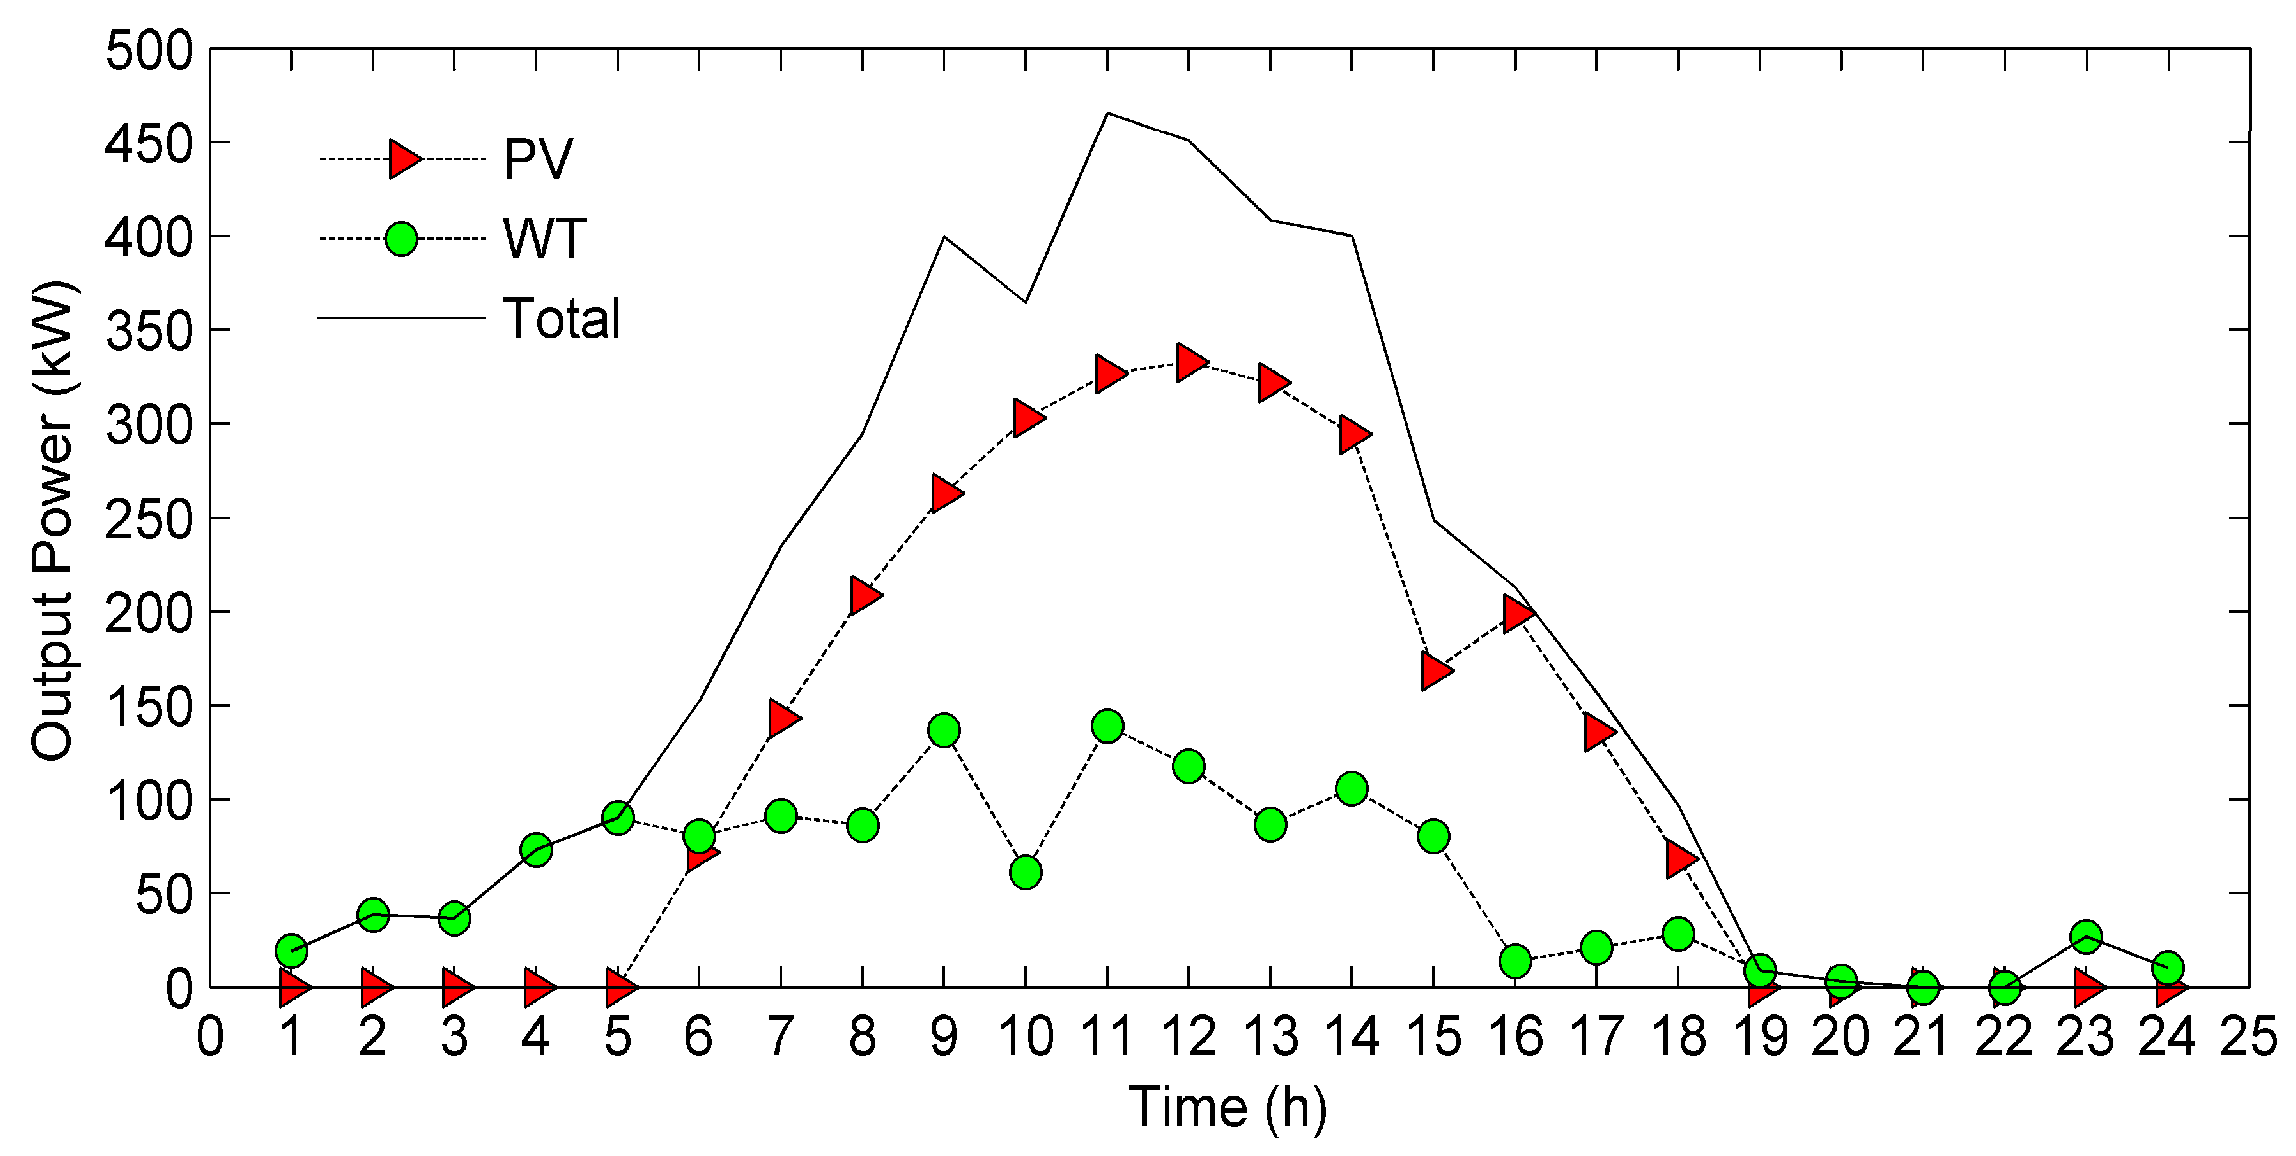
4.1. Simulation Settings

We take the representative typical day, with three types of loads, electrical load, heating load, and cooling load of a certain community in summer as an example to run the simulation. In the simulation, the maximum interruptible load ratio ν is 0.1. In dissatisfaction function, α is 8, β is 12, λ is 5; the weight coefficients a, b are, respectively, 0.85 and 0.15. In the Scenario 1 and 2, the heating price is 0.233 Yuan/kWh. The rated capacity of each device in MEG is shown in Table 1. The cold, thermal, and electrical energy storage configurations are shown in Table 2. The predicted renewable energy outputs of the typical day are shown in Figure 4. The detailed time of use (TOU) price and the set MEG electricity-selling (to the grid) price are illustrated in Figure 5.

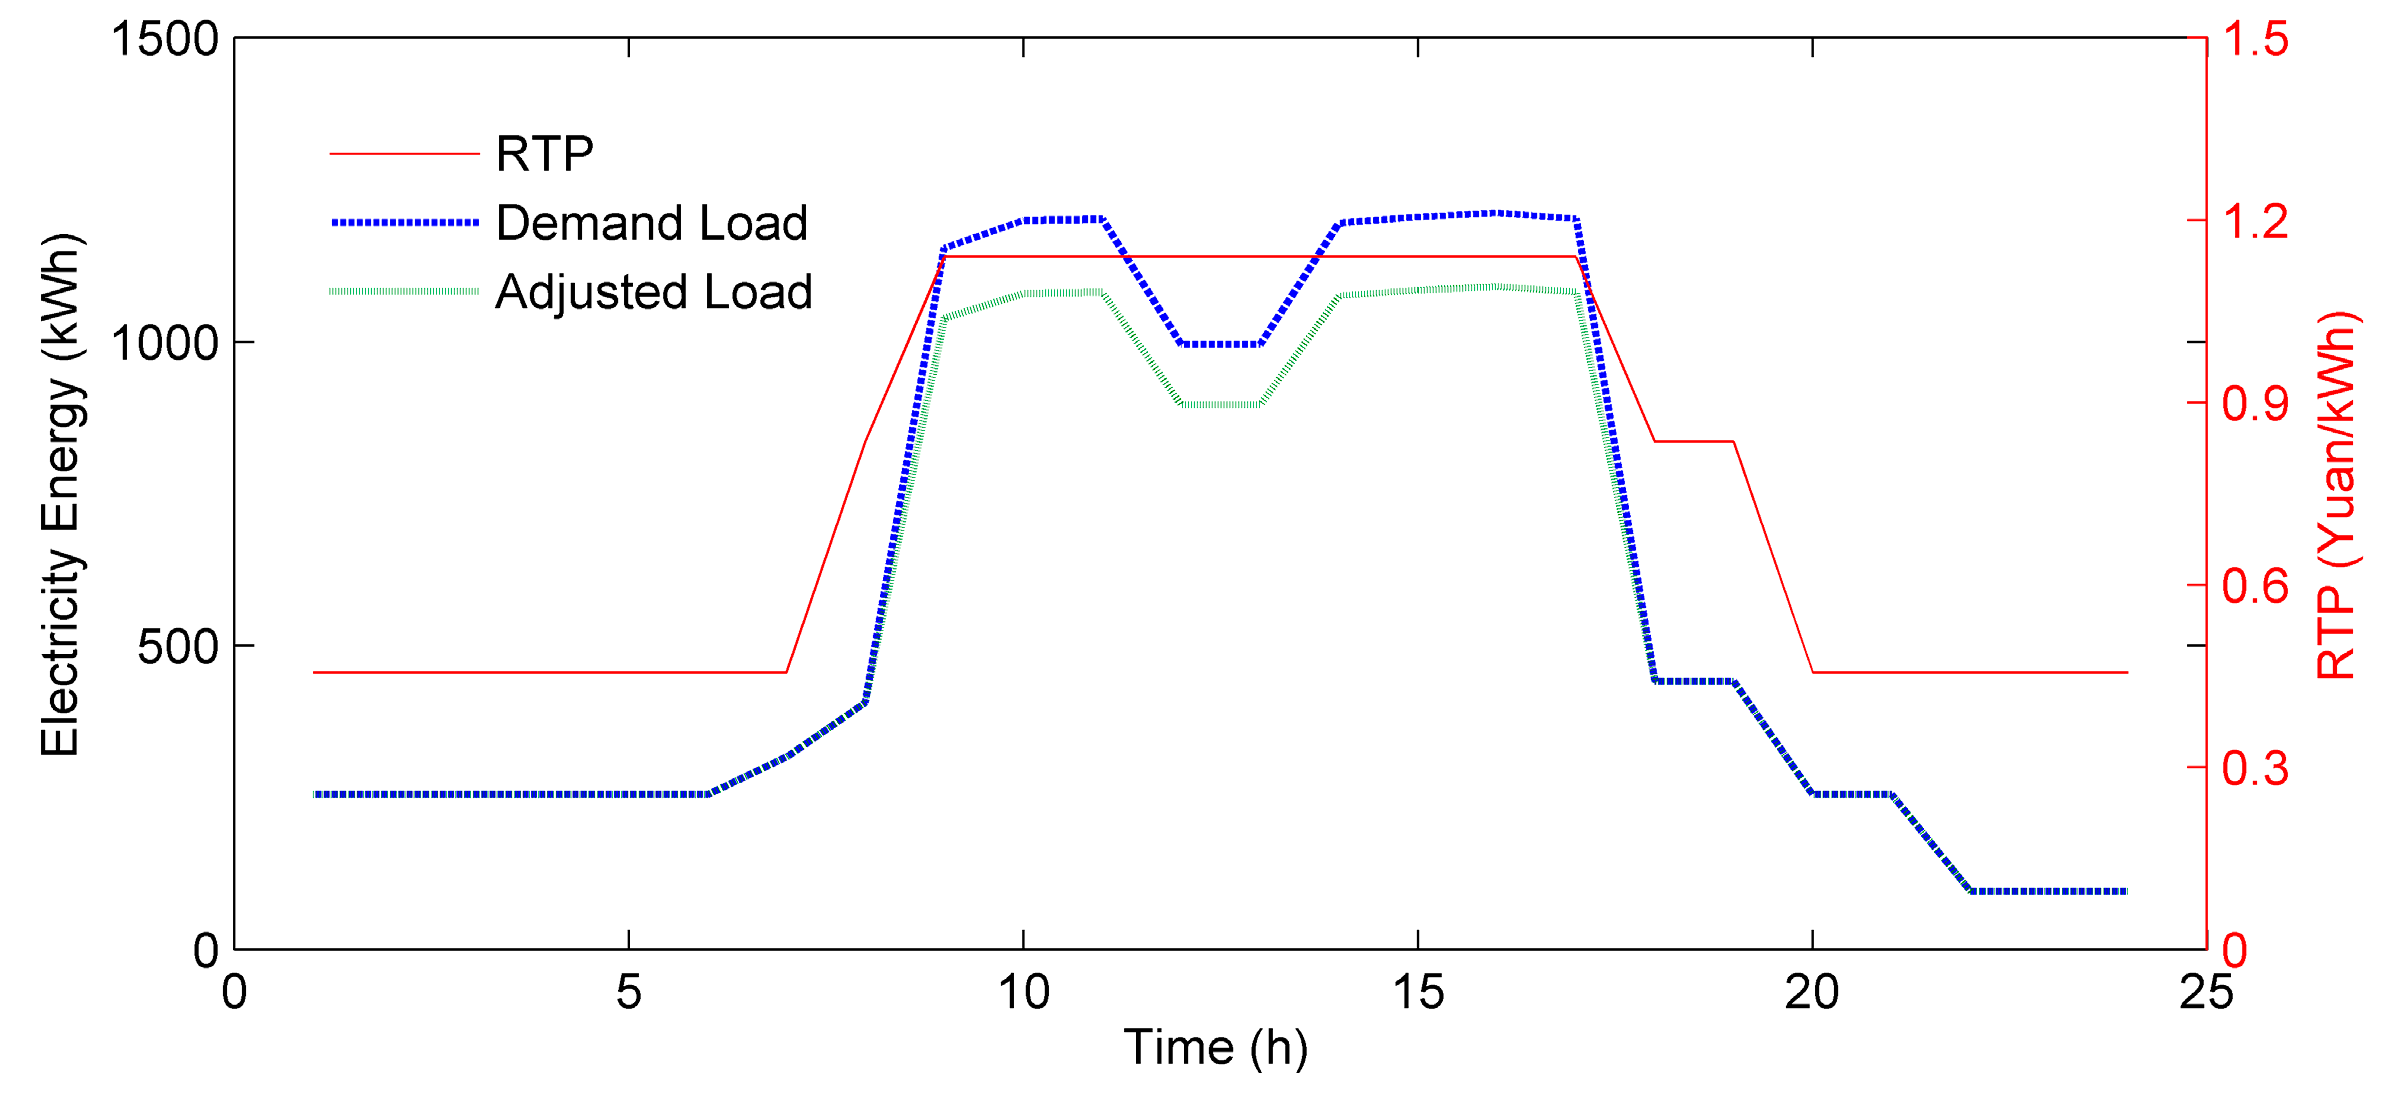
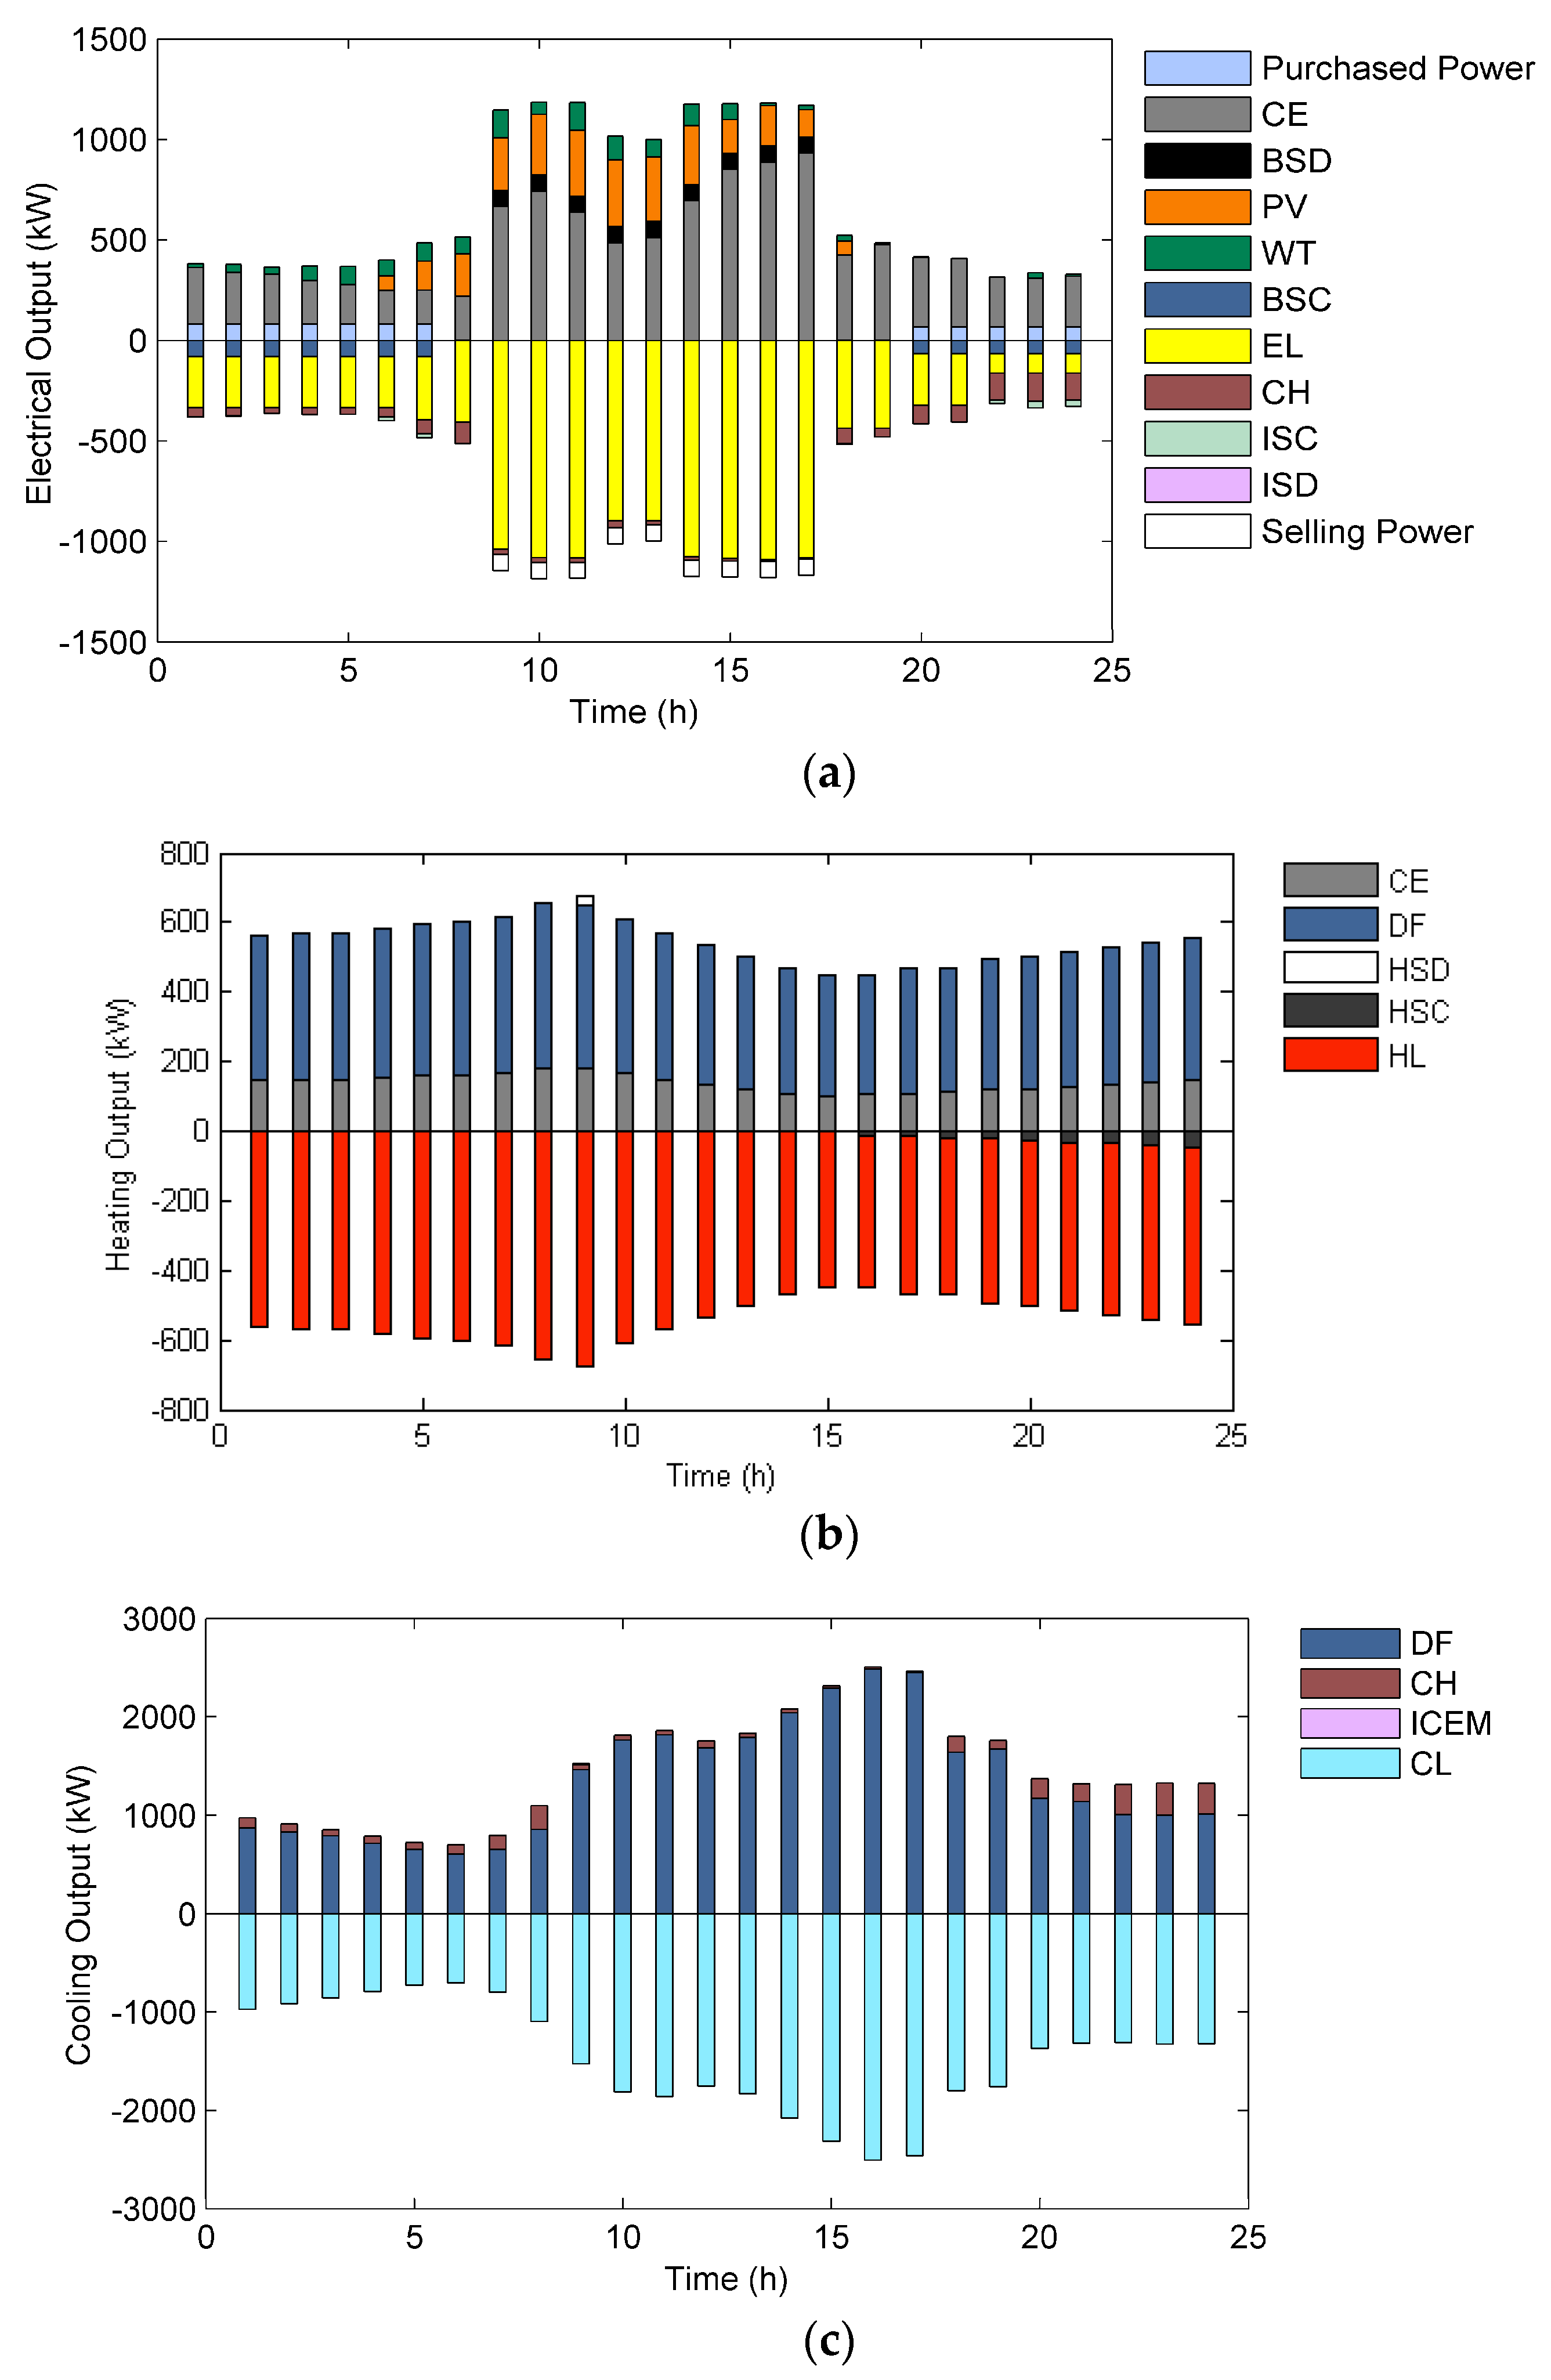
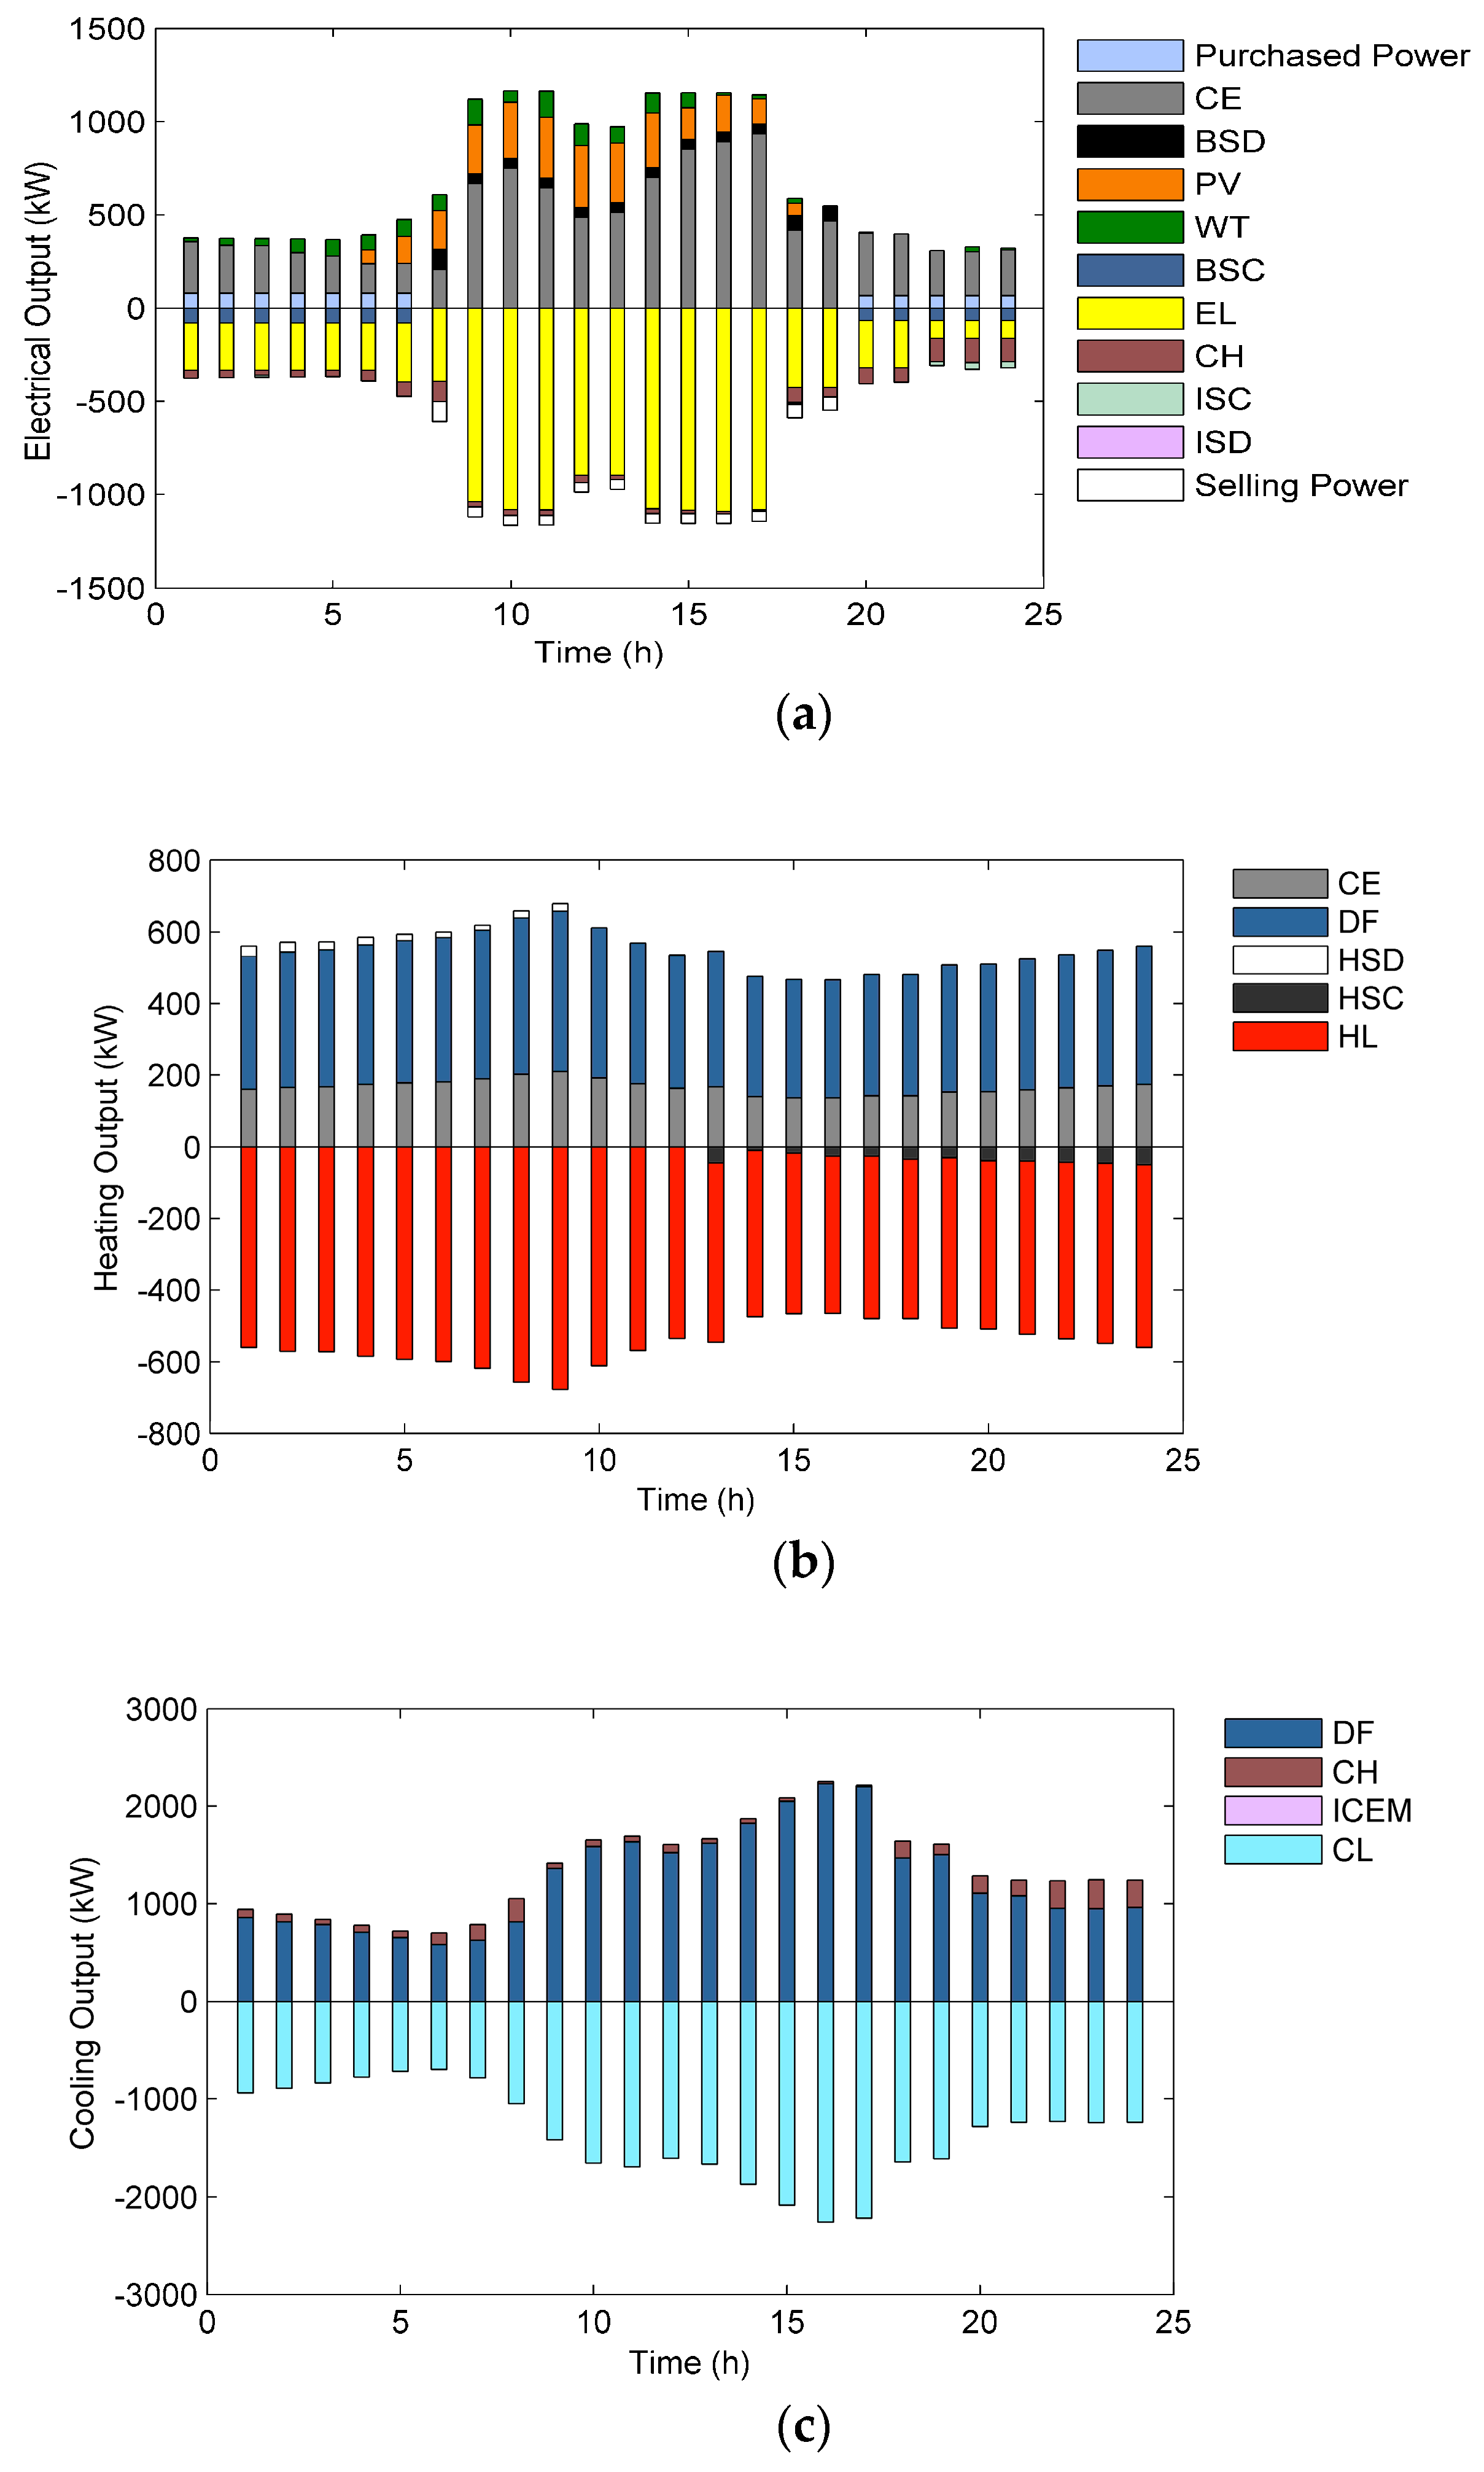
4.2. Optimal Results Analysis in Different Scenarios

According to the established game model, the game optimal simulation results of the typical day in different scenarios are shown in Figure 6, Figure 7, Figure 8, Figure 9, Figure 10 and Figure 11. Figure 6, Figure 8 and Figure 10 are the final strategies of both participants in the game at the NE point. Figure 7, Figure 9 and Figure 11 present the optimal results of the electrical, heating, and cooling outputs of all devices in MEG after game optimization. For Figure 7, Figure 9 and Figure 11, the upper part of the abscissa axis represents the power injected into the energy bus from distributed energy sources, while the lower part represents the power flowed out from the energy bus. Table 3 shows MEG production costs, profits, user payment, and user expenditure in different scenarios. This paper takes RMB as the currency unit, and $1 USD is about ¥6.30 RMB.
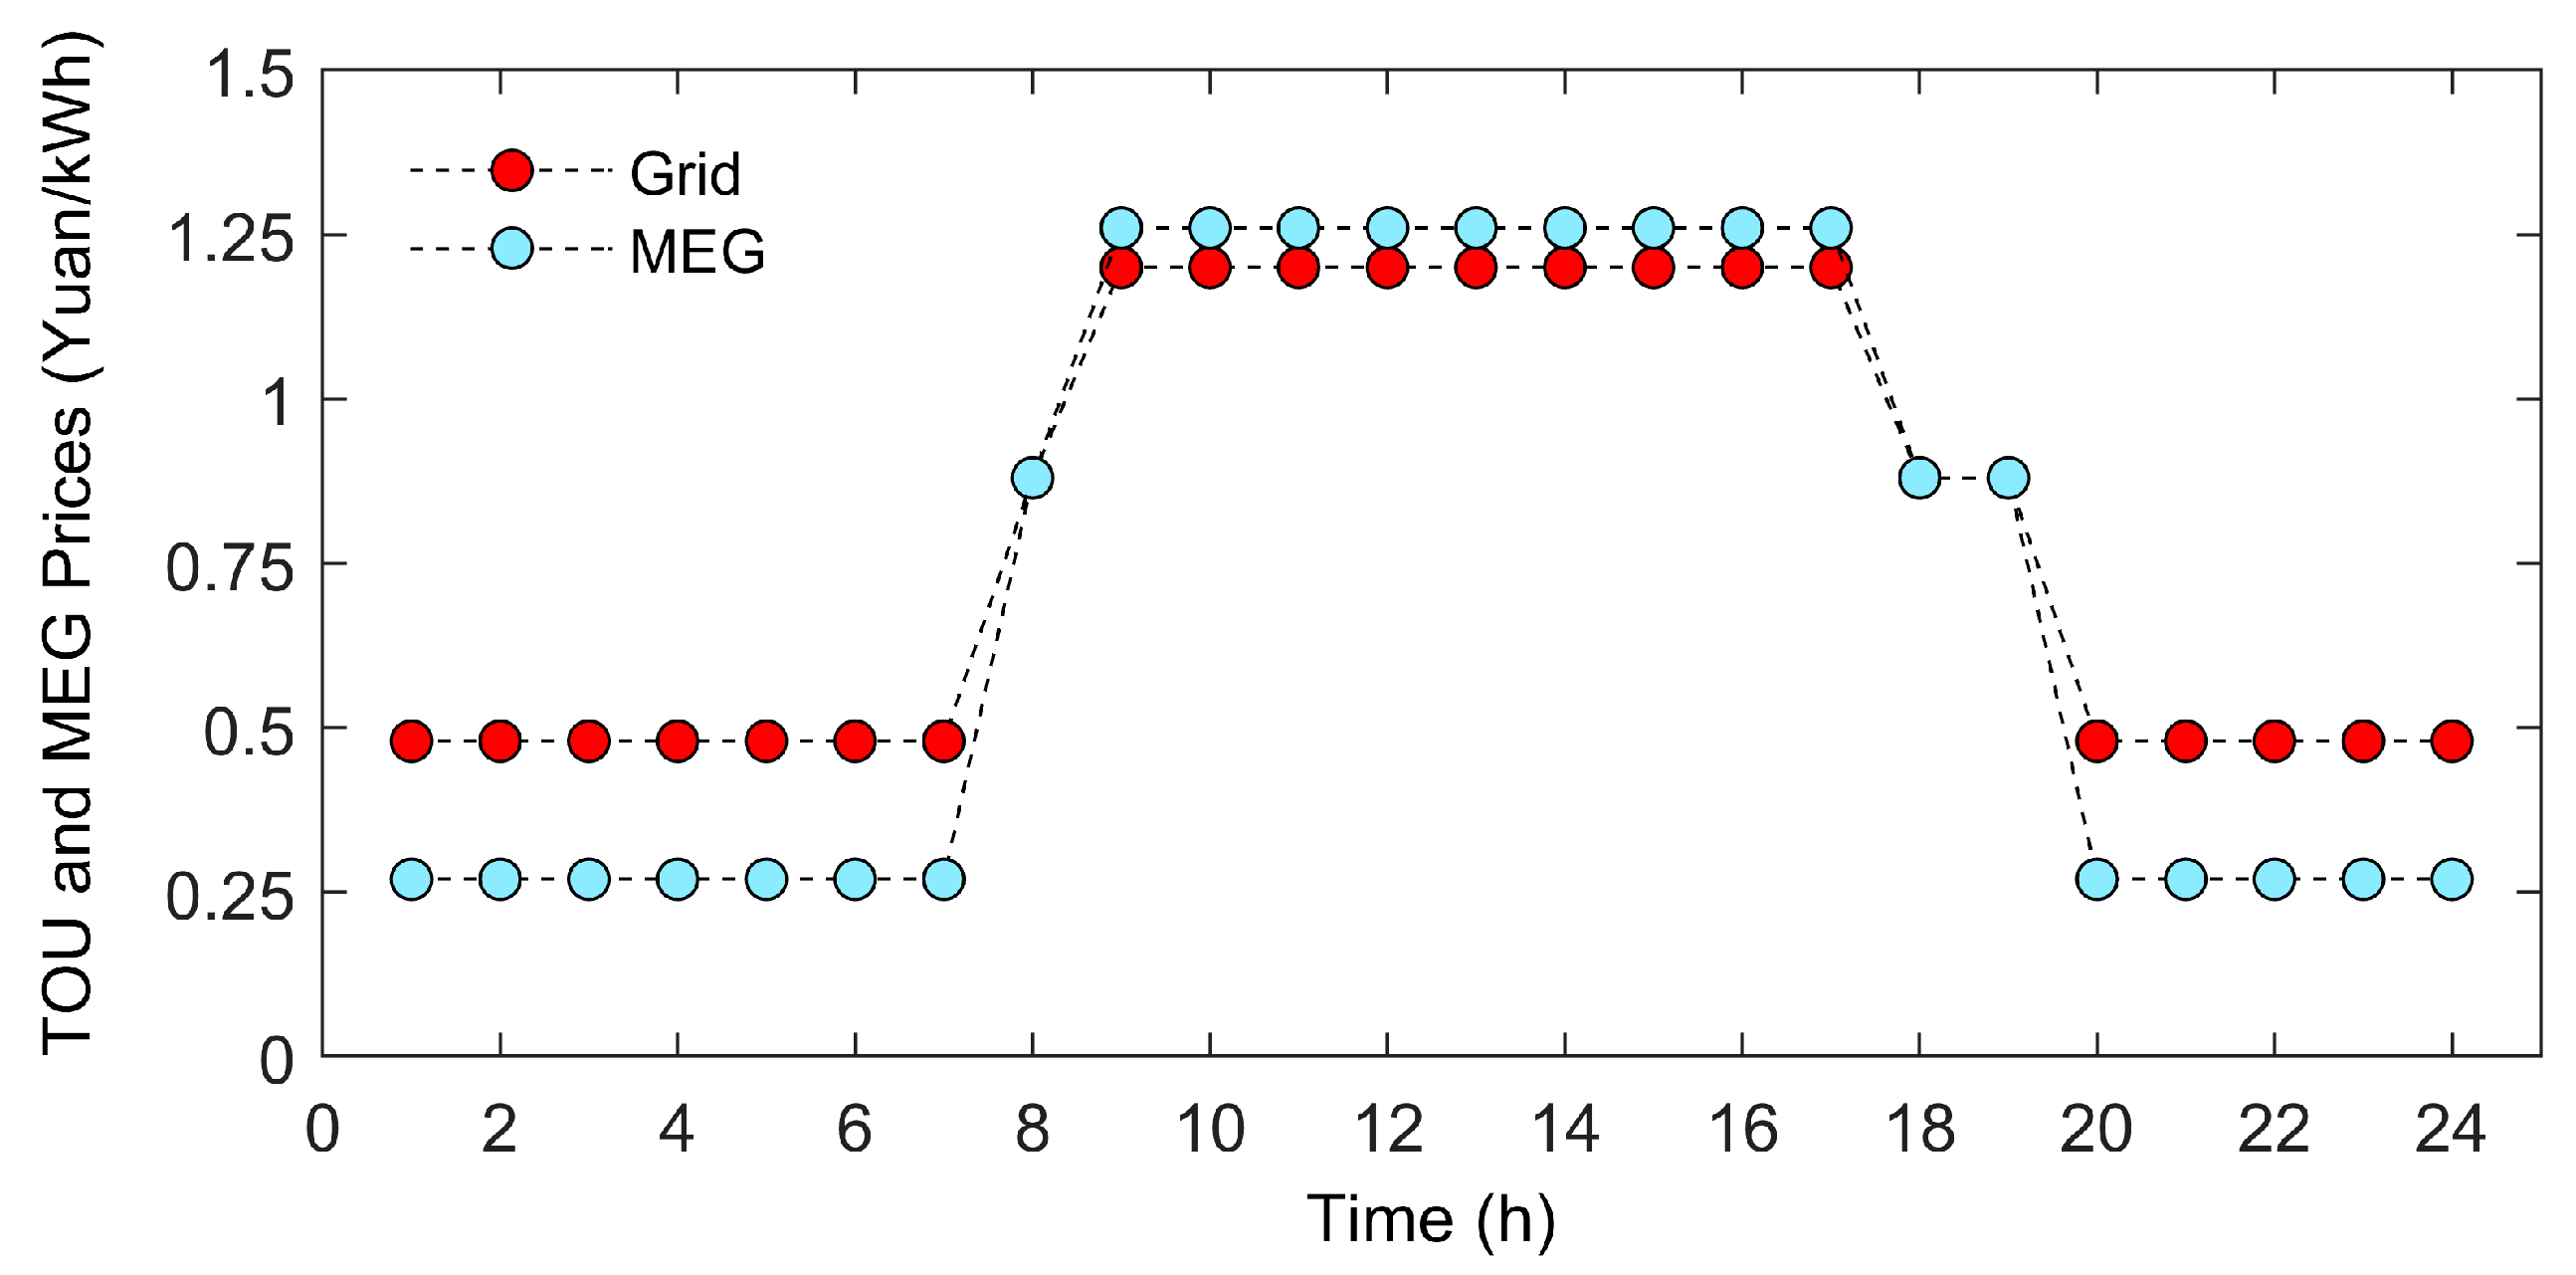
  • The optimal results in Scenario 1
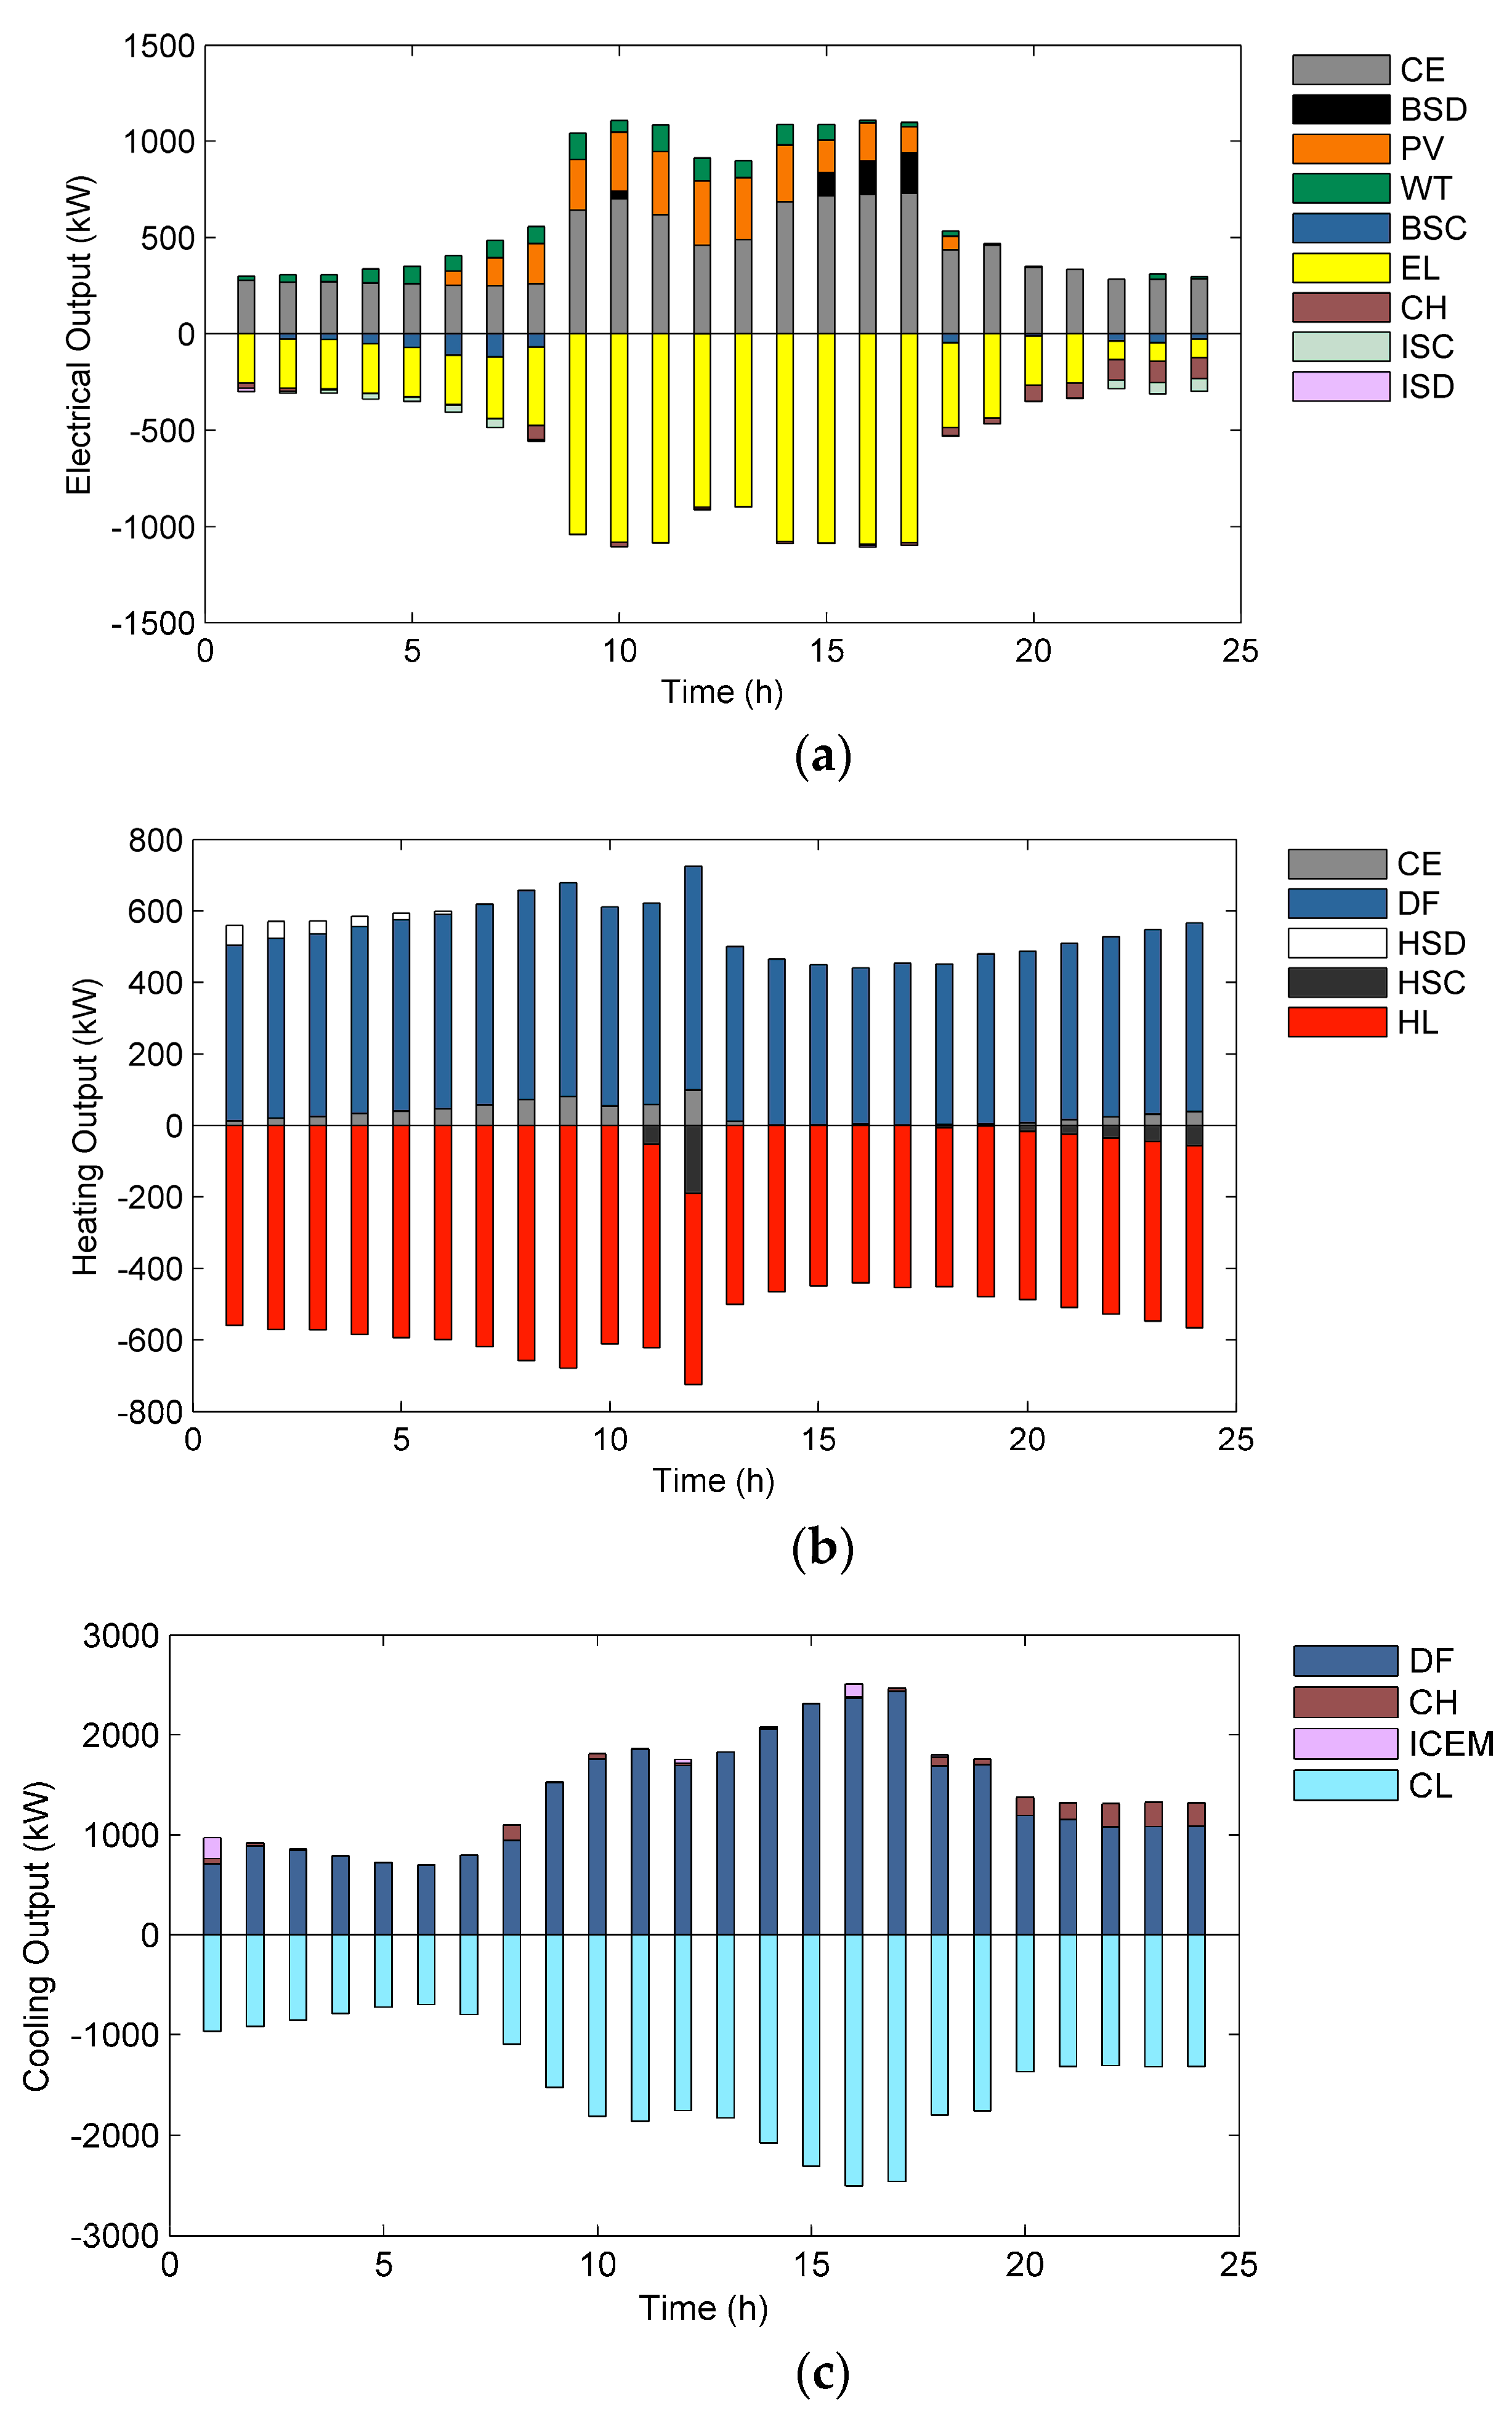
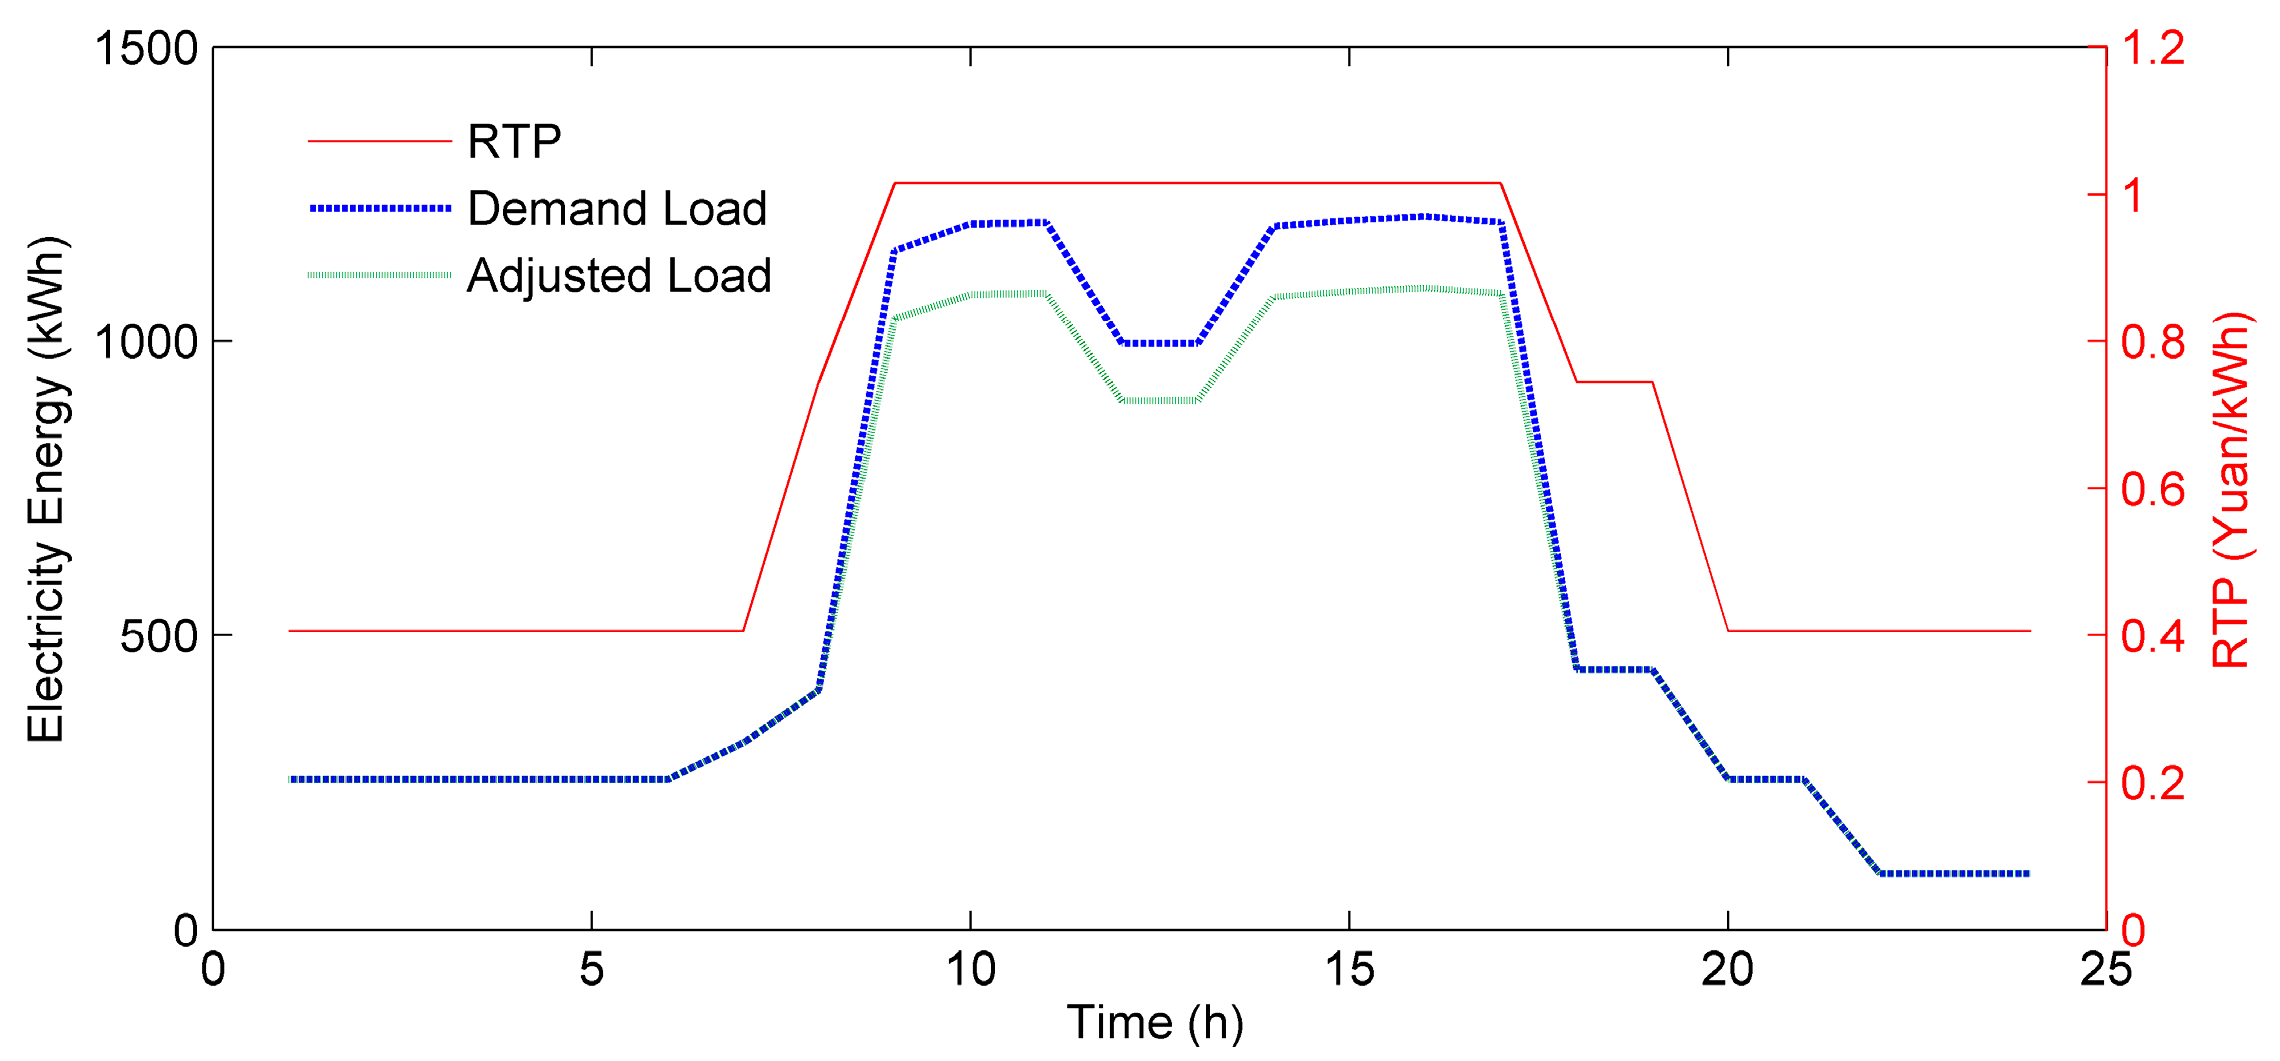
  • The optimal results in Scenario 2
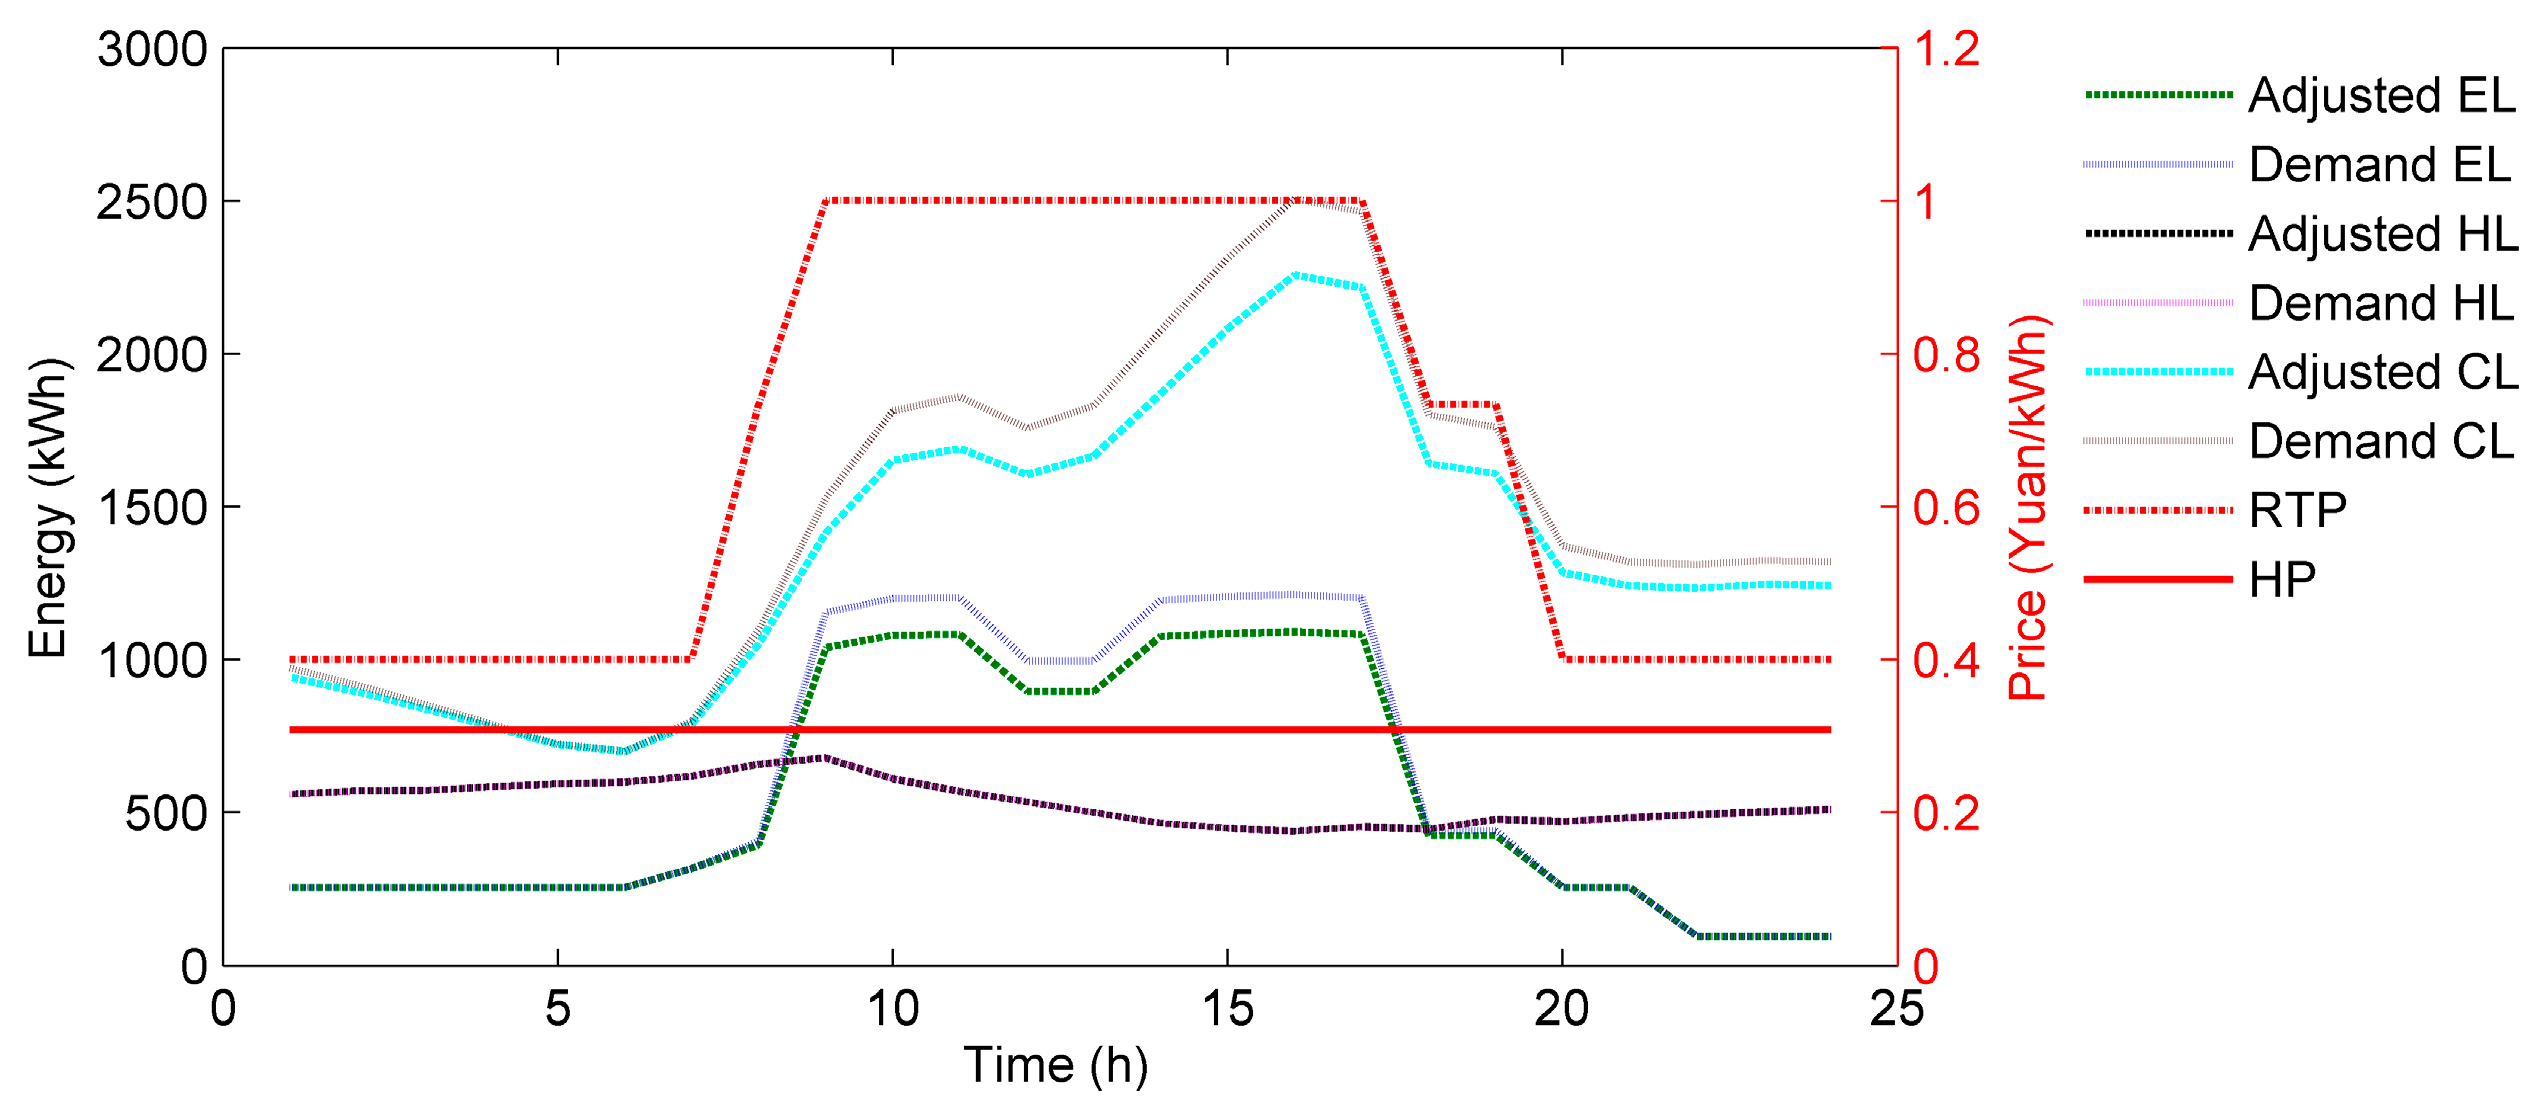
  • The optimal results in Scenario 3
From Figure 6, Figure 7, Figure 8, Figure 9, Figure 10 and Figure 11, the following conclusions can be drawn by analyzing the optimal results of the leader-follower game between MEG and user:
(1) In the game mode, the user has high sensitivity to electricity prices, and he can independently and flexibly responds to different prices released by MEG to adjust the load. In the lower electricity price periods (1–7, 20–24), the user gives priority to experience of energy usage, so the dissatisfaction drops to lowest. Because the expenditure is within acceptable range, no load needs to be adjusted. In the higher electricity price periods (9–17), the electricity consumption is large, so the user gives priority to the expenditure. The user maximizes the reduction of non-essential load for reducing the expenditure, according to his own needs. In other periods (8, 18–19), the electricity prices are at a medium level, the load need is lower, and the expenditure is within the acceptable range. Therefore, no adjustment is made.
(2) The initial electricity price strategy of MEG is based on the historical electricity peak and valley periods data of the user. We can see that the electricity price strategy is closely related to the user load strategy at the game equilibrium point. In the lower load level periods (1–7, 20–24), MEG adjusts the price in order to prevent user to reduce the load, so that it could keep the lowest dissatisfaction and ensure the profit. In the higher load level periods (9–17), MEG raises the price within the user acceptable range in order to maximize the profit. In other periods (8, 18–19), user loads are at a medium level, MEG chooses the highest price under the condition of ensuring the lowest user dissatisfaction to maximize the profit.
(3) When comparing the electrical optimal outputs and production costs of MEG in Scenario 1 and Scenario 2, we can see that the grid mode has better economy than the isolated island mode. MEG stores electricity through the energy storage devices when the electricity price is low, discharges and sells electricity to the power grid during peak period. Therefore, MEG can flexibly adjusts the electrical outputs and increases its profit.
(4) When comparing the game optimal results in Scenario 2 and Scenario 3, we can see that the production cost is reduced and the profit is increased, when MEG adopts the electricity price and heating price as the game strategies simultaneously. The user also adjusts his heating and cooling loads according to the heating price. As the heating load is relatively small, the user does not make adjustments and the experience of energy usage would not be affected. As the cooling load is relatively large, the user adjusts the cooling load within the acceptable range to reduce the expenditure.
(5) As the user’s actual loads in the game are adjusted to the RTP and heating price, the total amount of the user’s loads are decreased from the original loads, while the adjusted loads are still in the acceptable range of user experience of energy usage. For MEG, the reduction in actual loads means lower production costs, less emissions, and lower penalty costs.
When compared with the method in this paper, the non-inferior solution front in the Pareto obtained by the traditional multi-objective optimization method is a set of multiple optimal solutions. The final decisions, without doubt, are heavily influenced by the personal biases of the decision-maker. However, game theory is an effective tool to solve the conflict between different stakeholders and reflects the independent decision-making process of the MEG side and the user side. It can not only obtain the unique NE solution, but also can avoid the subjective bias of the decision-maker, which can be well reflected the subjective initiative and individual rationality of participants. From this perspective, game theory has the advantages in information diversity and practical significance that multi-objective optimization does not have.

5. Conclusions

To facilitate the development of MEG, a general model and solution algorithm for the energy management of MEG under the leader-follower game theory framework are presented, to help the MEG obtain optimal economic profits and operational strategies, with considering user’s expenditure and dissatisfaction. Under the proposed framework, it becomes feasible to enable system-level dispatch of multi-type energy resources, and the value of MEG can be appropriately reflected in the energy market. In order to balance the interaction between MEG and user in multi-type energy trading, a leader-follower game model is established in this paper, and the uniqueness of the Nash Equilibrium of the constructed game model has been proven. The user dissatisfaction function is constructed by leveraging the actual load and the demand load, and the fuzzy bi-objective algorithm is adopted to quantify the expenditure and user dissatisfaction. When compared with the mono-price energy market trading model, the leader-follower game model we proposed here not only considers the operational strategy in the MEG, but also takes into account the user’s initiative and experience of energy usage in the multiple rounds of dynamic game optimization process. Case studies are taken in three scenarios, comprehensive simulations have been done, and the following conclusions are achieved:
(1) Under the proposed leader-follower game framework, MEG has better consumption capacity of renewable energy, and achieves the best energy management in individual rational situations and obtains better economic profits. The MEG can improve the penetration of renewable energy resource, which will alleviate the power supply tension during peak hours and reduce the carbon emission.
(2) In the leader-follower game mode, the user can well balance the energy-purchasing expenditure and the experience of energy usage, and then reach an equilibrium point. Therefore, the user can achieve economic optimum, while taking into account the experience of energy usage after the game.
(3) When compared with Pareto front that was obtained by traditional multi-objective optimization methods, the proposed approach can not only obtain the unique NE solution, but also avoid the subjective bias of the decision-maker, reflect the subjective initiative and individual rationality of participants well.
In the near future, the proposed leader-follower game model will be extended to incorporate full competitions among MEGs, which will allow for the users to freely choose their energy providers. Moreover, deep analyses will be conducted on how the MEG’s profit and user’s payment will be affected by the intervention of other participants. Relevant researches, including cooperative game and leader-follower game involving more participants will become the focus in the future work.

Acknowledgments

This work is supported by the project of researching on flexible interface and interactive service technology for intelligent power consumption under demand side energy interconnection circumstance of State Grid Corporation of China (YDB17201700249).

Author Contributions

The first three authors made significant contributions to this research. More specifically, Kaijun Lin performed the experiments, carried out the theoretical analysis and wrote the paper. Junyong Wu determined the direction of the research and revised the paper. Di Liu provided important comments on the paper’s structure and corrected the language and format of the paper. The last two authors (Dezhi Li and Taorong Gong) are partners in the article’s project.

Conflicts of Interest

The authors declare no conflicts of interest.

Nomenclature

Indices
tperiod
mm-type device
nn-type device
kk-type device
ii-type device
Sets
Gset of participants
Ωset of strategies
Ωprset of energy sales prices
Ωlset of loads
Parameters
Ein,maxmaximum charge rate per unit time
Eout,maxmaximum discharge rate per unit time
Jgnatural gas price, ¥/m3
Jeelectricity price of the grid, ¥/kWh
Kimaintenance cost factor for i-type device, ¥/kW
pemiemission price of gas, ¥/m3
wgasCCO2 emission volume of gas consumed, m3/kWh
wgasNNOx emission volume of gas consumed, m3/kWh
welcCCO2 emission volume of electricity purchased from the grid, m3/kWh
welcNNOx emission volume of electricity purchased from the grid, m3/kWh
δpenalty price, ¥/kWh
αrelated to the magnitude of function R
βpreset value that the function R close to when the actual load increases to a certain extent
λrelated to the proportional elasticity of load adjustment
dtuser’s demand load, kW
aweight coefficient of objective P
bweight coefficient of objective R
νmaximum interruptible load ratio
lt,ununinterruptible load, kW
Functions
IMEGprofit of MEG, ¥
Iuserpayment function of the user
Ctproduction cost of MEG, ¥
Emitemission cost of MEG, ¥
ρpunishment fee, ¥
Penergy-purchasing expenditure, ¥
Ruser dissatisfaction function
Variables
Pgrid,texchange power between the electrical bus and the power grid in period t, kW
Ppv,tpower output of PV in period t, kW
Pwt,tpower output of WT in period t, kW
Pce,tpower output of internal combustion engine in period t, kW
Pch,telectricity consumption while chiller working in period t, kW
Pice,telectricity consumption while ice-storage air-conditioner making ice in period t, kW
Pmelt,telectricity consumption while ice-storage air-conditioner melting ice in period t, kW
Icc,tstatus value of ice-storage air-conditioner making ice in period t
Icd,tstatus value of ice-storage air-conditioner melting ice in period t
Sbad,tdischarging power of battery storage in period t, kW
Sbac,tcharging power of battery storage in period t, kW
Ibad,tstatus value of battery storage discharging in period t
Ibac,tstatus value of battery storage charging in period t
Le,tactual electrical load consumed by the user in period t, kW
Hce,theating output of heat exchanger in period t, kW
Hdf,theating output of direct-fired absorption chiller in period t, kW
Shd,theating discharging power of thermal storage in period t, kW
Shc,theating charging power of thermal storage in period t, kW
Ihd,tstatus value of thermal storage discharging in period t
Ihc,tstatus value of thermal storage charging in period t
Lh,tactual heating load consumed by the user in period t, kW
Cdf,tcooling output of direct-fired absorption chiller in period t, kW
Cch,tcooling output of chiller in period t, kW
Cice,tcooling output of ice-storage air-conditioner in period t, kW
Lc,tactual cooling load consumed by the user in period t, kW
Ein,tenergy storage rate in period t
Eout,tenergy release rate in period t
SOCtstate of charging of the energy storage device in period t
prtenergy sales prices of MEG in period t, ¥/kWh
ltactual loads consumed by the user in period t, kW
Vg,ttotal gas volume consumed by MEG in period t, m3
Pi,toutput power of the i-type device in period t, kW
gretotal generating capacity of renewable energy in period t, kW
Abbreviations
MEGmicro energy grid
NENash equilibrium
CCHPcombined cooling, heating and power
PVphotovoltaic
WTwind turbines
PSOparticle swarm optimization
CEcombustion engine
CHchiller
ICEice-storage air-conditioner
DFdirect-fired absorption chiller
RTPreal-time electricity price
TOUtime of use price
HPheating price
CDFcooling capacity of direct-fired absorption chiller
HDFheating capacity of direct-fired absorption chiller
BSDbattery storage discharges
BSCbattery storage charges
ISCice storage device charges
ISDice storage device discharges
HSDheating storage device discharges
HSCheating storage device charges
ICEMice-storage air-conditioner melts ice
ELelectrical load
HLheating load
CLcooling load

References

  1. Rifkin, J. The Third Industrial Revolution. Eng. Technol. 2012, 6, 8–11. [Google Scholar] [CrossRef]
  2. Mei, S.; Li, R.; Xue, X.; Chen, Y.; Lu, Q.; Chen, X.; Carsten, D.A.; Li, R.; Chen, L. Paving the Way to Smart Micro Energy Grid: Concepts, Design Principles, and Engineering Practices. CSEE J. Power Energy Syst. 2017, 3, 440–449. [Google Scholar]
  3. Goldstein, L.; Hedman, B.; Knowles, D.; Freedman, S.I.; Woods, R.; Schweizer, T. Gas-Fired Distributed Energy Resource Technology Characterizations; National Renewable Energy Lab. Technic Report; National Renewable Energy Lab.: Golden, CO, USA, 2003. [Google Scholar] [CrossRef]
  4. Piacentino, A.; Cardona, F. On Thermoeconomics of Energy Systems at Variable Load Conditions: Integrated Optimization of Plant Design and Operation. Energy Convers. Manag. 2007, 48, 2341–2355. [Google Scholar] [CrossRef]
  5. Siddiqui, A.S.; Firestone, R.M.; Ghosh, S.; Stadler, M.; Edwards, J.L.; Marnay, C. Distributed Energy Resources Customer Adoption Modeling with Combined Heat and Power Applications. Off. Sci. Tech. Inf. Tech. Rep. 2003, 3, 322–330. [Google Scholar]
  6. Bao, Z.; Zhou, Q.; Yang, Z.; Yang, Q.; Xu, L.; Wu, T. A Multi Time-Scale and Multi Energy-Type Coordinated Microgrid Scheduling Solution—Part I: Model and Methodology. IEEE Trans. Power Syst. 2015, 30, 2257–2266. [Google Scholar] [CrossRef]
  7. Wang, C.; Yang, X.; Wu, Z.; Che, Y.; Guo, L.; Zhang, S.; Liu, Y. A Highly Integrated and Reconfigurable Microgrid Testbed with Hybrid Distributed Energy Sources. IEEE Trans. Smart Grid 2016, 7, 451–459. [Google Scholar] [CrossRef]
  8. Ma, T.; Wu, J.; Hao, L. Energy Flow Modeling and Optimal Operation Analysis of the Micro Energy Grid Based on Energy Hub. Energy Convers. Manag. 2017, 133, 292–306. [Google Scholar] [CrossRef]
  9. Li, D.; Wu, J.; Lin, K.; Gong, T.; Du, C.; Liu, D. Research on Optimization of Multi Energy-Type Coordinated Microgrid Considering User Satisfaction. In Proceedings of the 2017 IEEE Conference on Energy Internet and Energy System Integration (EI2), Beijing, China, 26–28 November 2017. [Google Scholar]
  10. Solanki, B.V.; Raghurajan, A.; Bhattacharya, K.; Cañizares, C.A. Including Smart Loads for Optimal Demand Response in Integrated Energy Management Systems for Isolated Microgrids. IEEE Trans. Smart Grid 2017, 8, 1739–1748. [Google Scholar] [CrossRef]
  11. Piacentino, A.; Cardona, F. EABOT–Energetic Analysis as a Basis for Robust Optimization of Trigeneration Systems by Linear Programming. Energy Convers. Manag. 2008, 49, 3006–3016. [Google Scholar] [CrossRef]
  12. Gimelli, A.; Luongo, A.; Muccillo, M. Efficiency and Cost Optimization of a Regenerative Organic Rankine Cycle Power Plant through the Multi-Objective Approach. Appl. Therm. Eng. 2016, 114, 601–610. [Google Scholar] [CrossRef]
  13. Marzband, M.; Azarinejadian, F.; Savaghebi, M.; Guerrero, J.M. An Optimal Energy Management System for Islanded Microgrids Based on Multiperiod Artificial Bee Colony Combined with Markov Chain. IEEE Syst. J. 2017, 11, 1712–1722. [Google Scholar] [CrossRef]
  14. Wang, S.; Su, L.; Zhang, J. MPI Based PSO Algorithm for The Optimization Problem in Micro-grid Energy Management System. In Proceedings of the 2017 Chinese Automation Congress (CAC), Jinan, China, 20–22 October 2017. [Google Scholar]
  15. Bao, Z.; Zhou, Q.; Yang, Z.; Yang, Q.; Xu, L.; Wu, T. A Multi Time-Scale and Multi Energy-Type Coordinated Microgrid Scheduling Solution—Part II: Optimization Algorithm and Case Studies. IEEE Trans. Power Syst. 2015, 30, 2267–2277. [Google Scholar] [CrossRef]
  16. Gimelli, A.; Muccillo, M.; Sannino, R. Optimal Design of Modular Cogeneration Plants for Hospital Facilities and Robustness Evaluation of the Results. Energy Convers. Manag. 2017, 134, 20–31. [Google Scholar] [CrossRef]
  17. Gimelli, A.; Muccillo, M.; Sannino, R. Effects of Uncertainties on the Stability of the Results of an Optimal Sized Modular Cogeneration Plant. Energy Procedia 2017, 126, 369–376. [Google Scholar] [CrossRef]
  18. Azizivahed, A.; Naderi, E.; Narimani, H.; Fathi, M.; Narimani, M.R. A New Bi-Objective Approach to Energy Management in Distribution Networks with Energy Storage Systems. IEEE Trans. Sustain. Energy 2018, 9, 56–64. [Google Scholar] [CrossRef]
  19. Zhou, Z.; Bai, J.; Sheng, Z. A Stackelberg Game Approach for Energy Management in Smart Distribution Systems with Multiple Microgrids. In Proceedings of the 2015 IEEE Twelfth International Symposium on Autonomous Decentralized Systems, Taichung, Taiwan, 25–27 March 2015. [Google Scholar]
  20. Asimakopoulou, G.E.; Dimeas, A.L.; Hatziargyriou, N.D. Leader-Follower Strategies for Energy Management of Multi-Microgrids. IEEE Trans. Smart Grid 2013, 4, 1909–1916. [Google Scholar] [CrossRef]
  21. Chen, J.; Zhu, Q. A Stackelberg Game Approach for Two-Level Distributed Energy Management in Smart Grids. IEEE Trans. Smart Grid 2017. [Google Scholar] [CrossRef]
  22. Lu, T.; Wang, Z.; Wang, J.; Ai, Q.; Wang, C. A Data-Driven Stackelberg Market Strategy for Demand Response-Enabled Distribution Systems. IEEE Trans. Smart Grid 2018. [Google Scholar] [CrossRef]
  23. Wei, F.; Wu, P.Z.; Wu, Q.H.; Jing, Z.X. A Stackelberg Game Approach for Multiple Energies Trading in Integrated Energy Systems. Appl. Energy 2017, 200, 315–329. [Google Scholar] [CrossRef]
  24. Han, K.; Lee, J.; Choi, J. Evaluation of Demand-Side Management over Pricing Competition of Multiple Suppliers Having Heterogeneous Energy Sources. Energies 2017, 10, 1342. [Google Scholar] [CrossRef]
  25. Yu, M.; Hong, S.H. Incentive-Based Demand Response Considering Hierarchical Electricity Market: A Stackelberg Game Approach. Appl. Energy 2017, 203, 267–279. [Google Scholar] [CrossRef]
  26. Liang, Y.; Liu, F.; Wang, C.; Mei, S. Distributed Demand-Side Energy Management Scheme in Residential Smart Grids: An Ordinal State-Based Potential Game Approach. Appl. Energy 2017, 206, 991–1008. [Google Scholar] [CrossRef]
  27. Yu, Y.; Jin, T.; Zhong, C. Designing an Incentive Contract Menu for Sustaining the Electricity Market. Energies 2015, 8, 14197–14218. [Google Scholar] [CrossRef]
  28. Wang, C.; Hong, B.; Li, G.; Zhang, D.; Liu, W. A General Modeling Method for Optimal Dispatch of Combined Cooling, Heating and Power Microgrid. Proc. CSEE 2013, 33, 26–33. [Google Scholar]
  29. Myerson, R.B. Game Theory: Analysis of Conflict; Harvard University Press: Cambridge, MA, USA, 1997. [Google Scholar]
  30. Başar, T.; Olsder, G.J. Dynamic Noncooperative Game Theory; Academic Press: London, UK, 1995. [Google Scholar]
  31. Yang, P.; Tang, G.; Nehorai, A. A Game-Theoretic Approach for Optimal Time-of-Use Electricity Pricing. IEEE Trans. Power Syst. 2013, 28, 884–892. [Google Scholar] [CrossRef]
  32. Zhang, N.; Zhou, Y.; Yao, M.; Zhang, J.; Cong, X.; Xiao, X. A Fuzzy Bi-Objective Unit Commitment Model Considering Source-Grid-Load Interactions. In Proceedings of the 2013 IEEE PES Asia-Pacific Power and Energy Engineering Conference (APPEEC), Kowloon, China, 8–11 December 2013. [Google Scholar]
  33. Nash, J. Non-Cooperative Games. Ann. Math. 1951, 54, 286–295. [Google Scholar] [CrossRef]
Figure 1. Energy bus-based structure of Micro Energy Grid (MEG).
Energies 11 00647 g001
Figure 2. User dissatisfaction function with different parameters.
Energies 11 00647 g002
Figure 3. Flow chart of solving the leader-follower game.
Energies 11 00647 g003
Figure 4. Renewable energy outputs of the typical day.
Energies 11 00647 g004
Figure 5. The time of use (TOU) and the MEG selling electricity prices.
Energies 11 00647 g005
Figure 6. Strategies of Nash equilibrium (NE) in Scenario 1.
Energies 11 00647 g006
Figure 7. Optimal outputs of MEG in Scenario 1. (a) The optimal electrical outputs; (b) The optimal heating outputs; and, (c) The optimal cooling outputs.
Energies 11 00647 g007
Figure 8. Strategies of NE in Scenario 2.
Energies 11 00647 g008
Figure 9. Optimal outputs of MEG in Scenario 2. (a) The optimal electrical outputs; (b) The optimal heating outputs; and, (c) The optimal cooling outputs.
Energies 11 00647 g009
Figure 10. Strategies of NE in Scenario 3.
Energies 11 00647 g010
Figure 11. Optimal outputs of MEG in Scenario 3. (a) The optimal electrical outputs; (b) The optimal heating outputs; and, (c) The optimal cooling outputs.
Energies 11 00647 g011
Table 1. The rated capacity of each device in MEG.
PVWTCE
400 kW150 kW1200 kW
CDFHDFCH
1500 kW1000 kW1000 kW
Table 2. Cold, thermal, and electrical energy storage configurations.
Energy Storage TypeCapacity(kWh)Maximum Charging Power (kW)Maximum Discharging Power (kW)
Battery storage1000200300
Thermal storage1000200300
Ice tank1000500500
Table 3. The economic in different scenarios.
ScenarioProduction Cost of MEG (¥)Profit of MEG (¥)User PaymentUser Expenditure (¥)
112,398.0810,530.810.281224,114.38
212,333.279156.510.419322,703.29
312,136.6311,970.470.459825,306.61

