Article

The Effect of a Large Backfill Area on Grounding Grid Performance

1
Department of Electrical Engineering, Shandong University, Jinan 250061, China
2
Jinan Power Supply Company of State Grid Shandong Electric Power Company, Jinan 250012, China
*
Author to whom correspondence should be addressed.
Energies 2018, 11(4), 698; https://doi.org/10.3390/en11040698
Submission received: 2 February 2018 / Revised: 18 March 2018 / Accepted: 19 March 2018 / Published: 21 March 2018
(This article belongs to the Section F: Electrical Engineering)

Abstract

:
The construction of a substation will undoubtedly change the properties of any surrounding native soil. In order to study the influence of backfill material on grounding grid performance and in turn optimize that performance, current distribution, electromagnetic fields, ground, and soil structure analysis (CDEGS) was undertaken to simulate the secondary peak of the step voltage generated by a large backfill soil area. As for the various parameters of the finite soil volume, the influence of the soil length L, the edge gradient tan θ, and the resistivity ρ on the secondary peak of step voltage was researched. Then, a grounding test system was established, the selection process of the protection resistors was clarified, and the usage method of agar gel was improved. The feasibility of simulating backfill material with agar gel was verified, and the influence of resistivity and soil scale on the secondary peak of the step voltage was tested. The results show that the larger the backfill material length is, the larger the resistivity is, and the lower the peak voltage is. The effect of soil resistivity on the secondary peak will be greater when the range of backfill material is larger, which means that reducing soil resistivity can effectively reduce the secondary peak. Therefore, a smaller slope can be formed at the edge of the earthwork in the actual substation to reduce the project amount and save investment, which has a certain degree of engineering significance.

1. Introduction

Soil condition has the greatest influence on the safety of a substation grounding grid [1,2,3]. In order to accurately analyze the effect of soil on the performance of a grounding grid, it is important to establish a soil model that reflects the actual conditions of the soil in the substation area [4,5,6,7,8,9,10,11]. In the construction process of a substation, the native soil is usually processed to obtain a flat terrain. The related excavation and backfill will change the soil of the site surface, which is a key problem in areas with high soil resistivity or areas where nuclear power plant are constructed. In such cases, surface soil, unlike cases of traditional vertical or horizontal stratification, presents a heterogeneous soil structure [12,13,14,15,16,17].
Nahman et al. studied the influence of backfill material soil on substation grounding via the finite element method [18] and analyzed the effect of resistivity, length, range, and other parameters of backfill material soil on the performance of the grounding grid. However, the study was limited to samples with a relatively small soil range and high resistivity. In addition, the research mainly focused on simulation and lacked experimental proof. In [19], the effect of a small area of low-resistivity backfill material on the performance of a substation grounding grid is discussed. It is pointed out that a small area of low-resistivity backfill material will raise the local ground potential and lead to sudden changes in step voltage at the edge of the region. However, this paper also mainly focuses on numerical calculations. In [20], a numerical solution to the problem of horizontal multi-layered soil with a finite soil volume is proposed. Fortin et al. conducted a large-scale grounding grid experiment with a low-resistivity backfill material soil layer covering a large area. It was revealed that an abnormal increase of step voltage will appear outside a substation when a backfill area with low resistivity is larger than the grounding grid area. Because of the complexity of the experiment itself, there is no more discussion about this phenomenon.
In the past, the study of low-resistivity backfill material was concentrated on cases in which areas covered by backfill material, such as wet soil layers or pools in the substation, are small. Studies on large areas of backfill material with low resistivity have mainly focused on numerical calculations and lack experimental research, which is insufficient. Meanwhile, related research shows that the secondary peak of a 110 kV substation can reach several hundred volts. Substation voltage levels are now increasing, and land resources are becoming scarcer, so it has become necessary to perform more simulation and experimental research on the causes and mechanisms of secondary peak.
In view of the above problems and the shortcomings of the present research, the influence of the length, slope, and resistivity of large areas of backfill on grounding grids was studied. In addition, under laboratory conditions, the selection process of protection resistors was clarified, the usage method of agar gel was improved, and an improved grounding test is conducted. Based on our experiments, the influence of the multiple parameters of backfill material on the step voltage secondary peak was studied and measured.

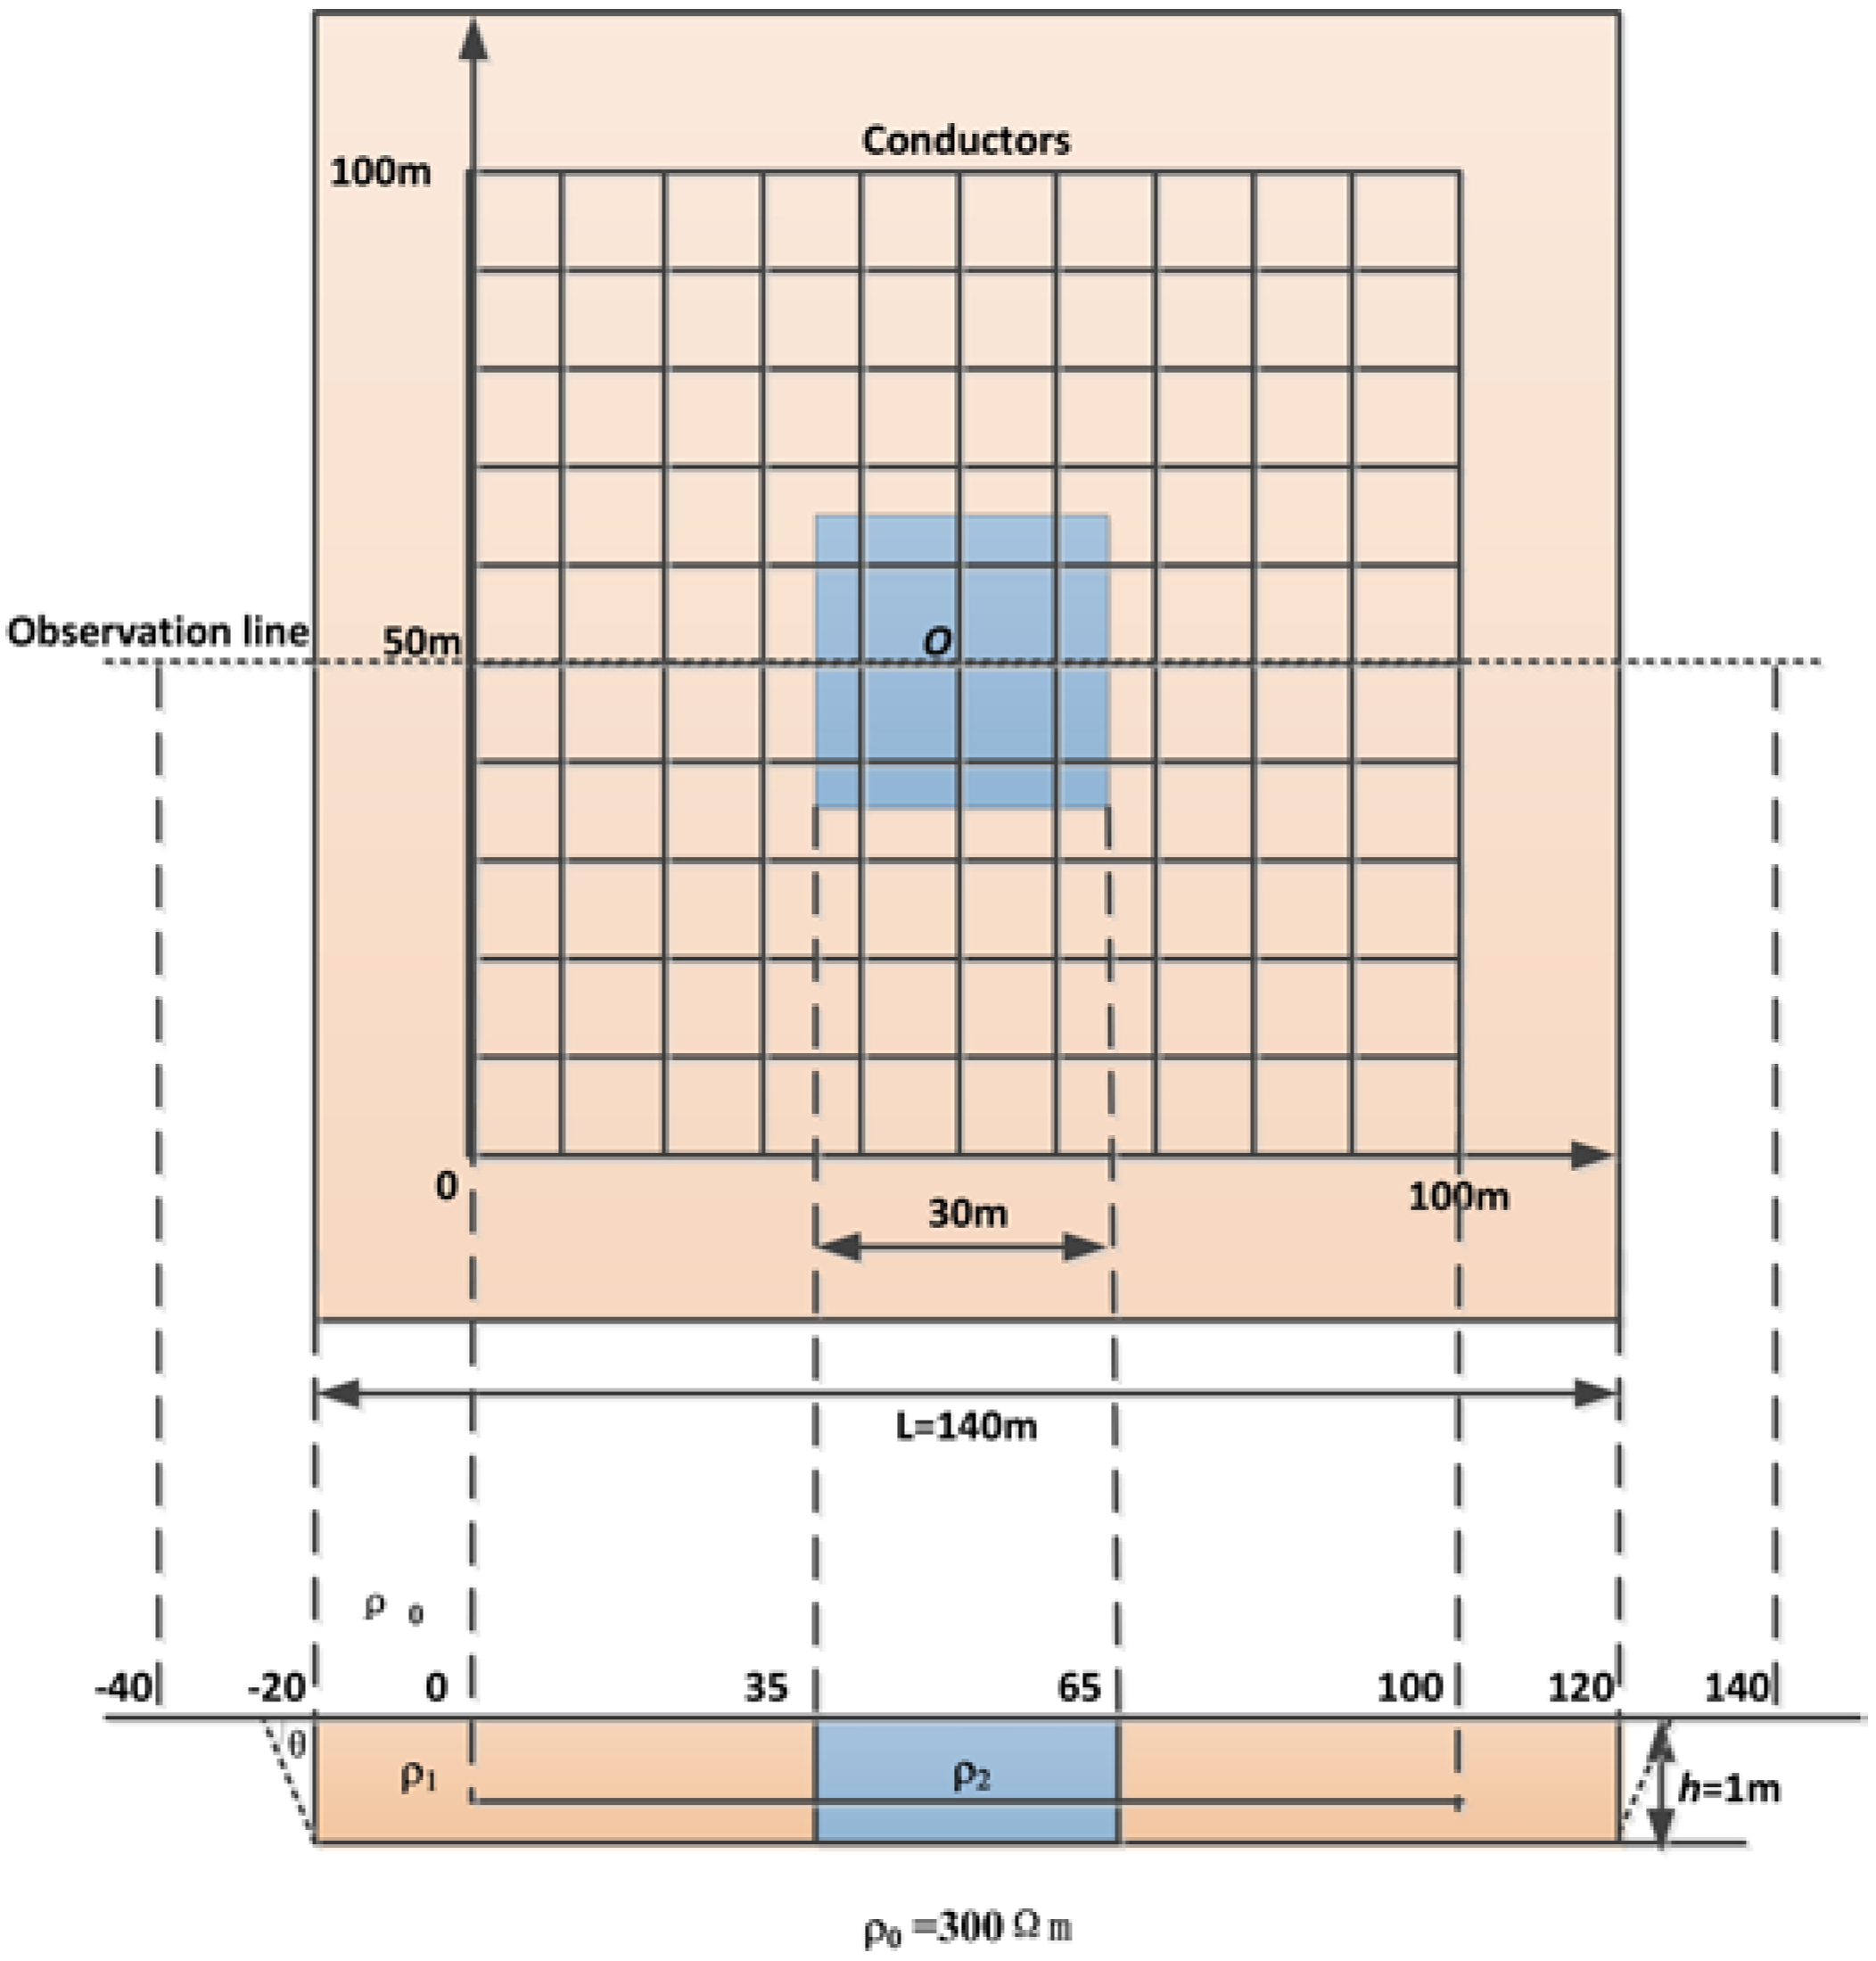
2. The Simulation Model of Massive Soil Surface

2.1. Simulation Model Establishment

When the area of grounding grid and backfill material is not particularly large (hundreds of meters-square), current distribution, electromagnetic fields, ground, and soil structure analysis (CDEGS), which combines the moment method and the indirect boundary element method, can be used to obtain relatively accurate calculation results [10,12,21].
In order to compare a large backfill area with a small backfill area, a grounding grid model was constructed, as shown in Figure 1, which includes top and side views. The specific parameters are as follows: the area of grounding grid is 100 m × 100 m, and the model mesh is 10 × 10. There are 11 conductors in both the vertical and horizontal directions. Each conductor is 100 m long and divided into 10 segments with a length of 10 m. The buried depth is 0.8 m. The diameter of grounding conductor is 5 mm. The resistivity is 1.78 × 10⁻⁷ Ωm. The relative permeability is 200. Among them, the external soil resistivity is 300 Ωm, the large backfill area is 140 m × 140 m, and the thickness is 1 m. The small backfill area is 30 m × 30 m, and the thickness is 1 m.

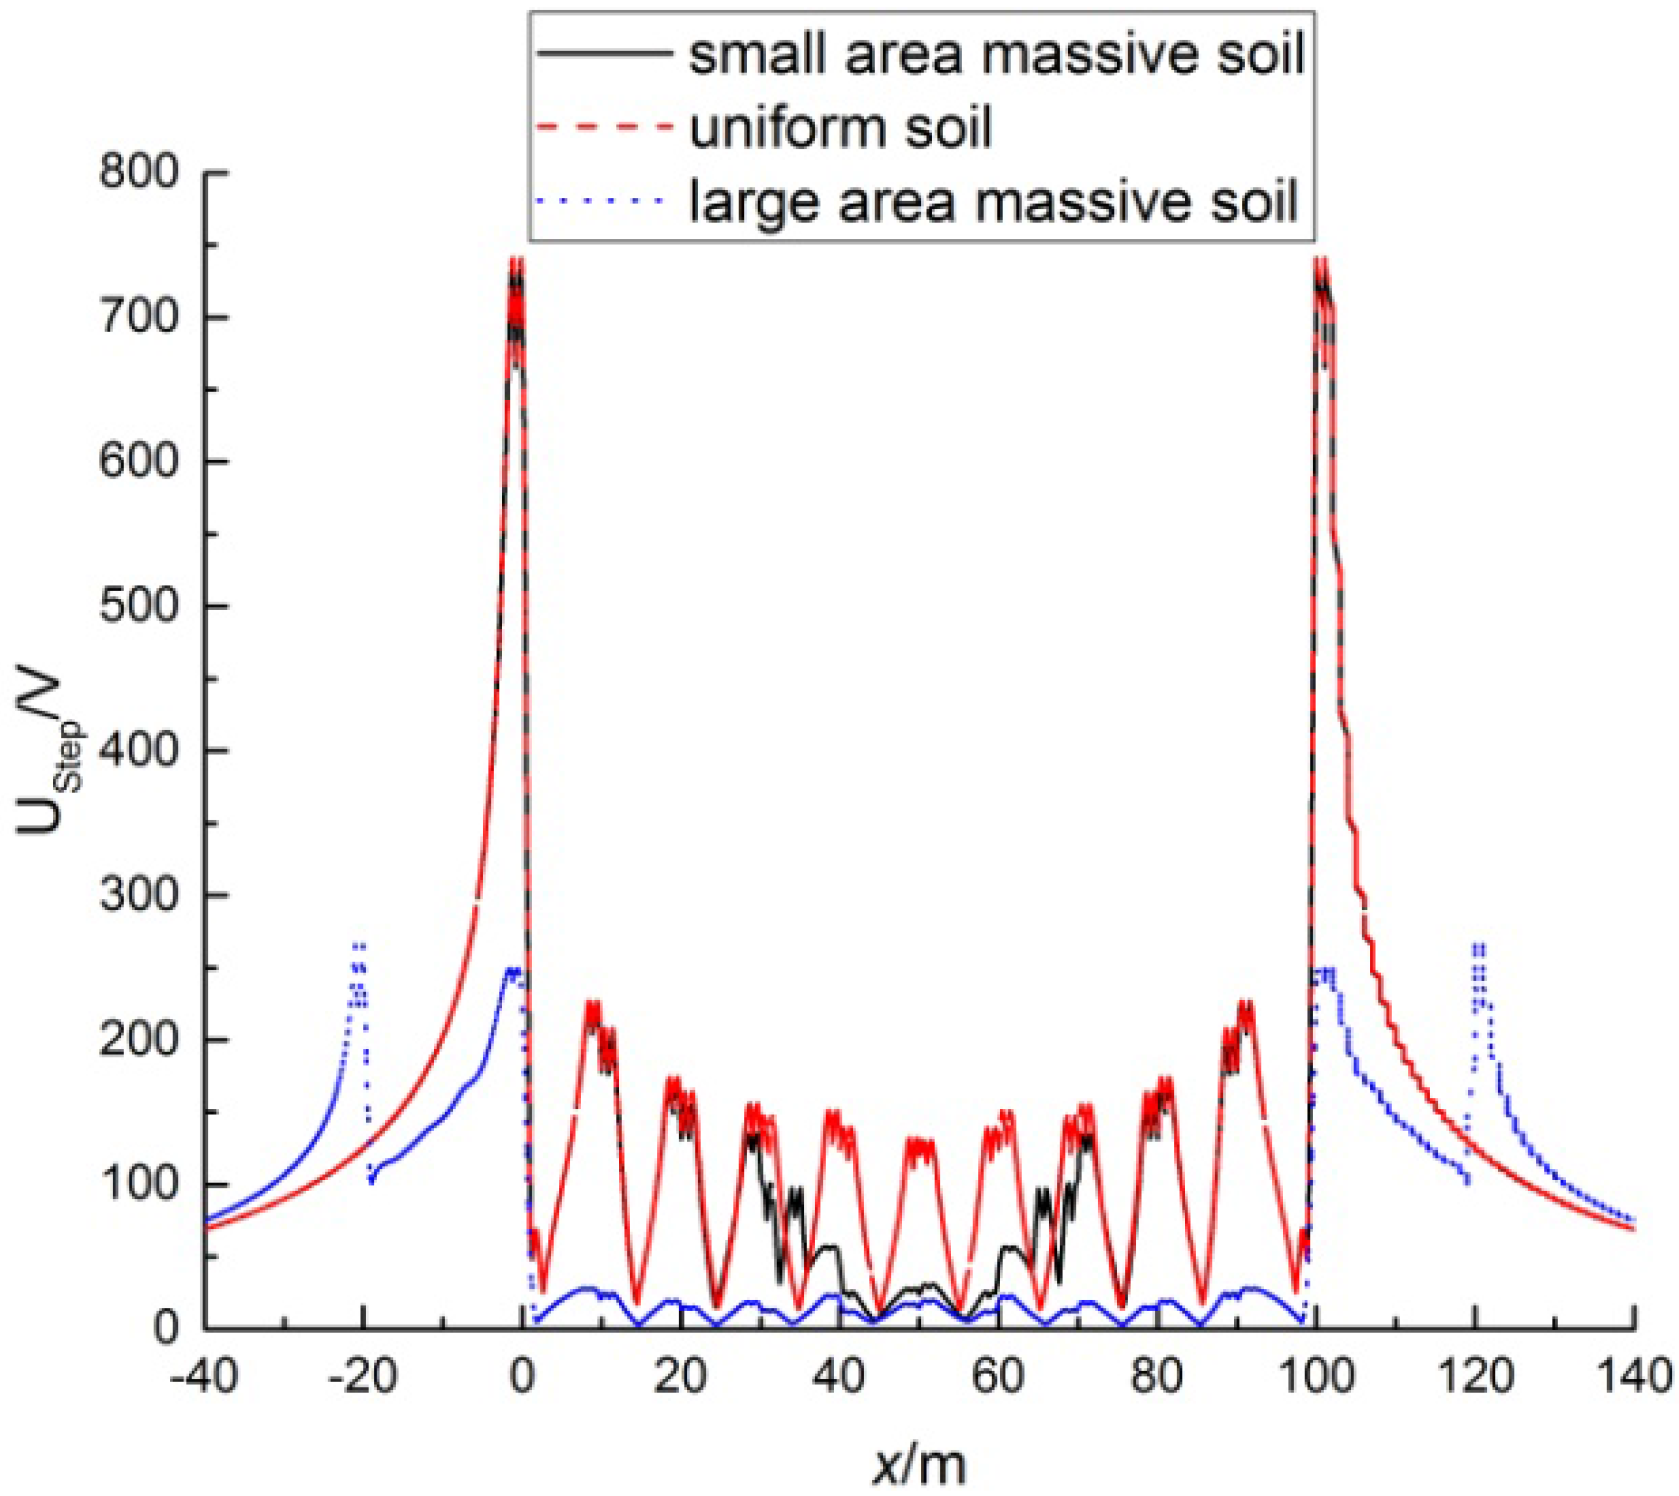
2.2. Secondary Peak of Step Voltage

The resistivity of the small backfill area is taken as ρ1 = 30 Ωm. Ten kiloamperes of fault current is injected into the point O, and the step voltage is calculated when the backfill material area is relatively small, when there is no backfill material, and when the backfill material area is relatively large. Meanwhile, y = 50 m is taken as the observation line, and the step voltage Ustep with the change in backfill material is shown in Figure 2.
It can be seen in Figure 2 that a small backfill area with low resistivity reduced step voltage. This is because, with the same current, the low-resistivity backfill material reduced the potential difference between the measurement points, which made the step voltage of the region decrease at the same time. This also shows that a small low-resistivity backfill area has little effect on the safety of the grounding grid.
On the contrary, the large backfill area showed a different effect. Although the large backfill area of low resistivity greatly reduced the magnitude of the step voltage peak, it can be seen in Figure 2 that, at the edge of the grounding grid, where x = 0 m and x = 100 m, the peak value of step voltage appears, which is consistent with previous work; namely, the maximum of the substation grounding system step voltage appears at the edge of the grounding grid mesh. In addition, the large backfill area pulled down the step voltage difference within the grounding grid. This principle is similar to the principle of small backfill areas. It is noteworthy that the secondary peak of step voltage appears outside the grounding grid, where x = −20 m and x = 120 m. This phenomenon shows that a large backfill area is the main reason for the secondary peak of step voltage. Therefore, it is not sufficient to pay attention to the safety measures within a substation—the security measures outside a substation need to be strengthened as well.

3. The Influence of Backfill Material Parameters on the Secondary Peak of Step Voltage

When calculating the soil problems of backfill material using the boundary element method, it is necessary to subdivide large backfill material areas into patches. If the quantity of patches is sufficiently high, the calculation results will be relatively accurate, though the corresponding calculation complexity will further increase.
For the calculation of backfill material, an adaptive threshold algorithm was used. Patch area and resistivity ratio were used as the priority criterion. The threshold parameters can be set as small as possible to obtain relatively accurate results.
Assuming that the native soil resistivity is constant, the control variable method is used to determine the influence of the parameters of the large backfill area. The influence of the large backfill area’s length L, thickness h, slope angle tan θ, and resistivity ρ on the secondary peak of step voltage and the corresponding grounding resistance are studied.

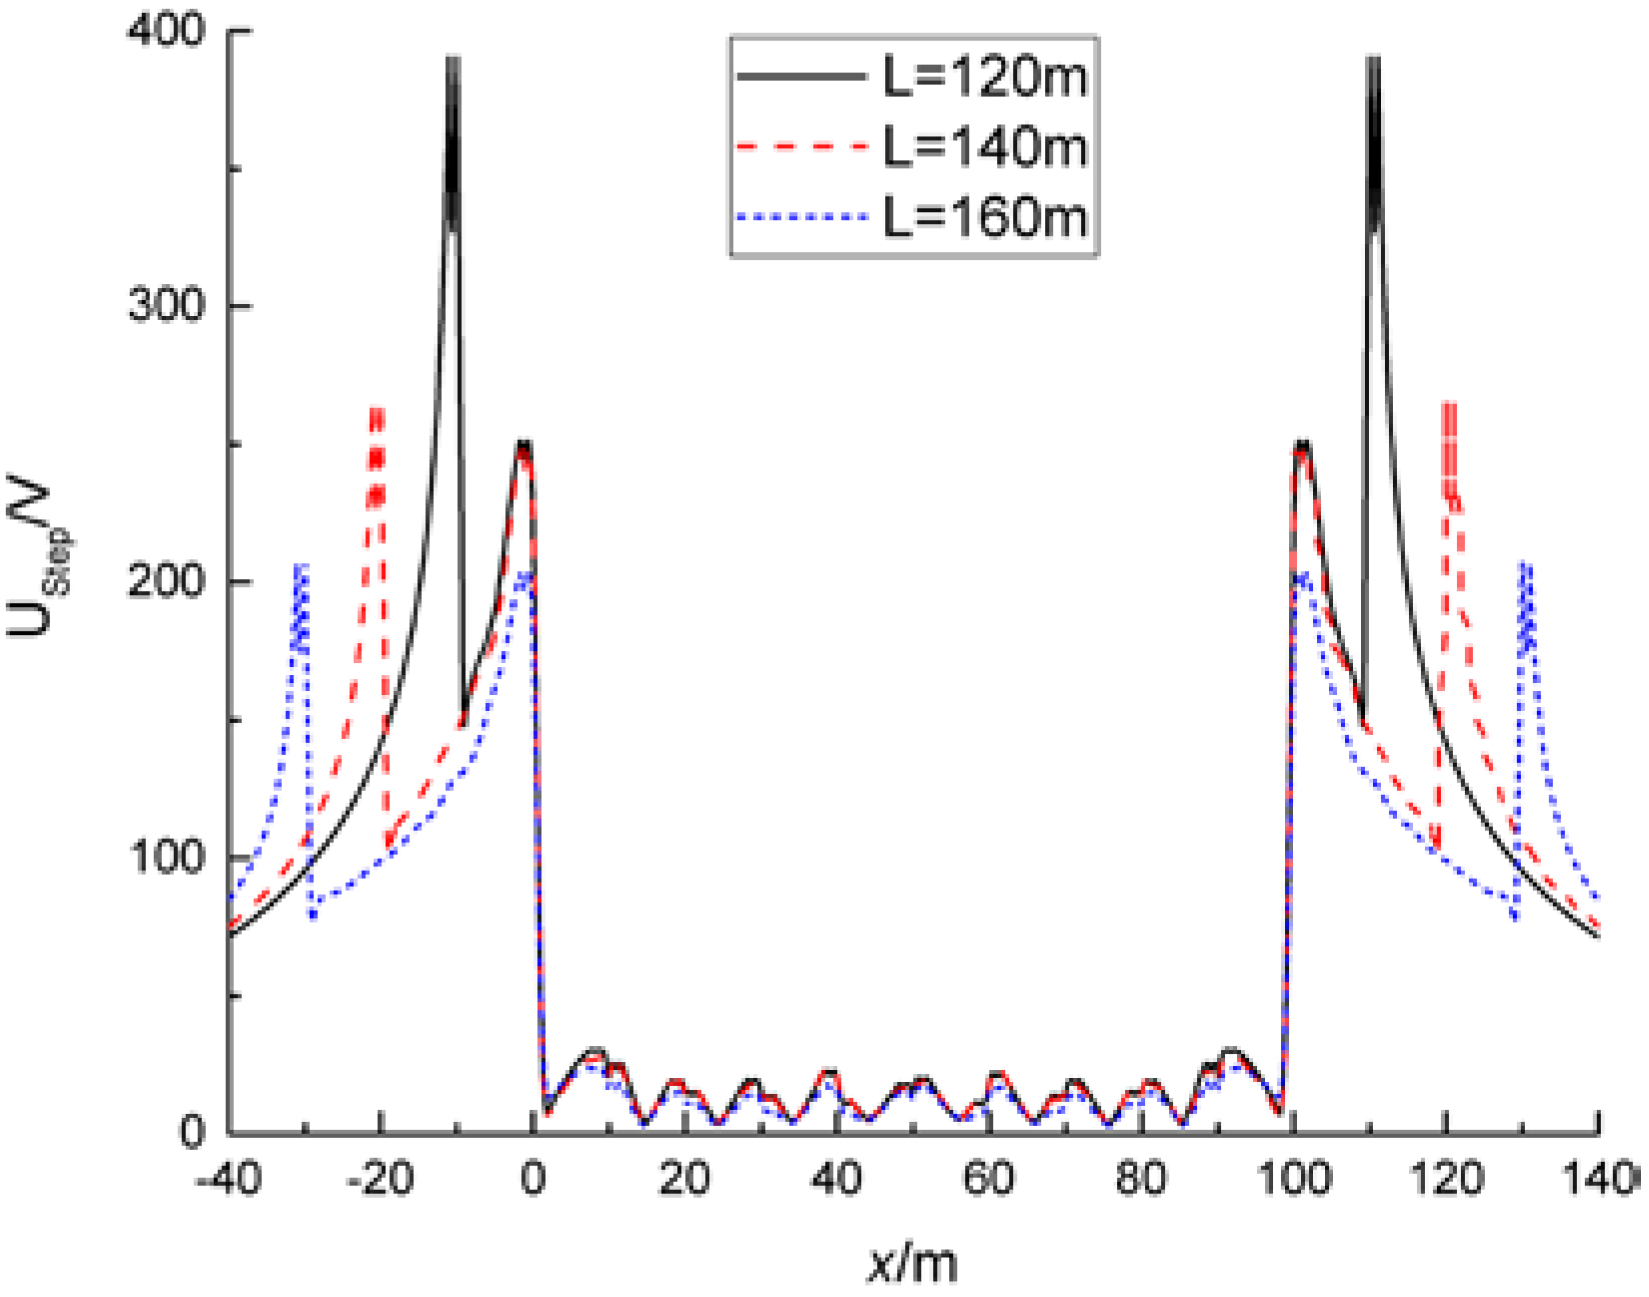
3.1. The Effect of Length L on the Secondary Peak of Step Voltage and Grounding Resistance

Let the native soil resistivity ρ0 = 300 Ωm, the large backfill area’s resistivity ρ1 = 30 Ωm, and the thickness h = 1 m. If the length L is set to 120 m, 140 m, and 160 m, the corresponding step voltage on the observation line changes as shown in Figure 3, and the grounding resistance changes as shown in Table 1.
It can be seen in Figure 3 that the position of the secondary peak of step voltage also changes with the change in L. This is because low-resistance backfill material can increase the potential of the internal edge; at the same time, the potential of the external edge is lower. Therefore, the secondary peak of the step voltage is generated; namely, the secondary peak always rapidly changes in terms of soil resistivity. In addition, the secondary peak of step voltage decreases with the increase in length L, which is related to the ground resistance reduction and ground potential decline.

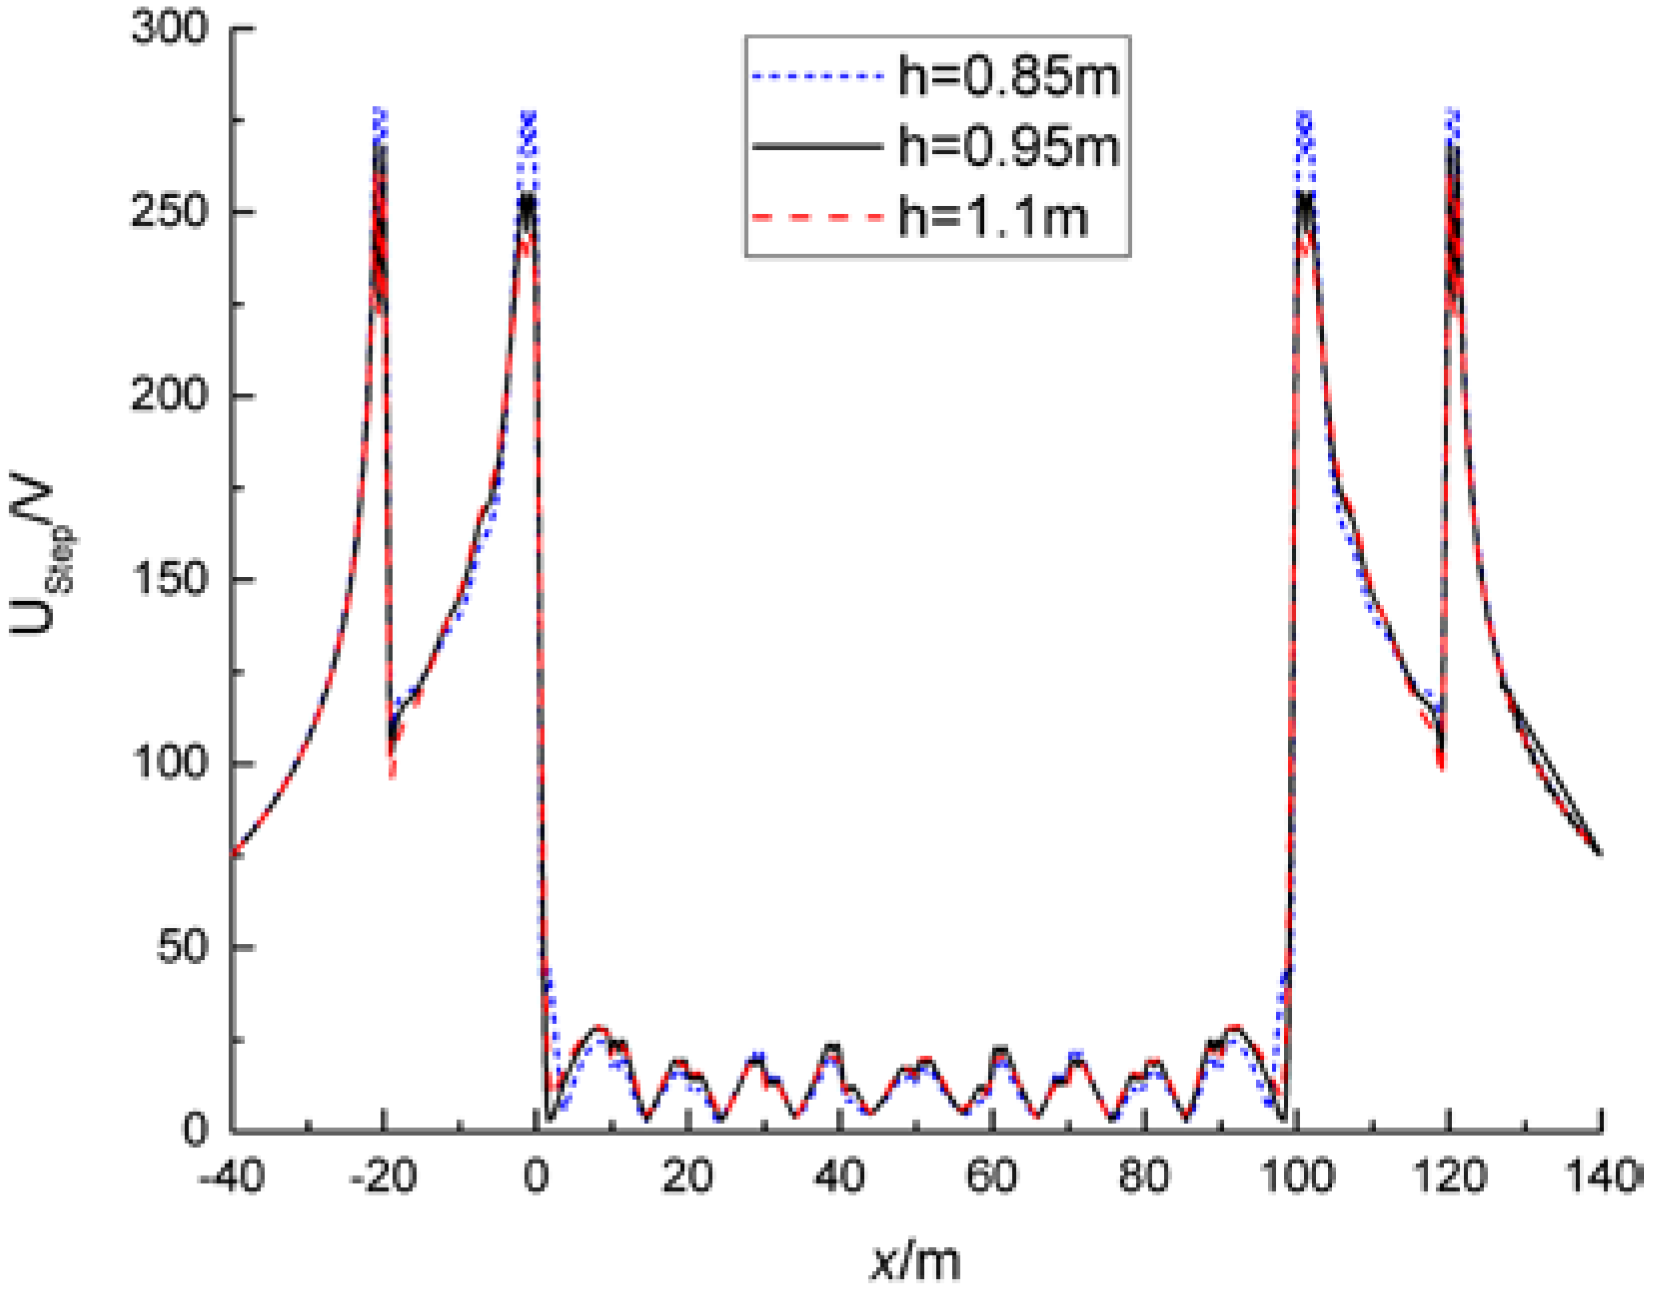
3.2. The Influence of Thickness h on Step Voltage and Ground Resistance

Let the native soil resistivity ρ0 = 300 Ωm, the large backfill area’s resistivity ρ1 = 30 Ωm, the burial depth = 0.8 m, and the range L = 140 m. In consideration of the limitations of earthwork engineering in substations, when the thickness h is changed to 0.85 m, 0.95 m, and 1.1 m, the corresponding step voltage changes as shown in Figure 4, and the grounding resistance will change as shown in Table 1.
It can be seen in Figure 4 that the primary and secondary peaks of the step voltage are slightly reduced with the increase in the thickness of the large backfill area, which indicates that the slight change in thickness has little effect on the secondary peak of the step voltage. Therefore, there is no further discussion about the depth of the large backfill area in subsequent experiments. In addition, the results in Table 1 show that the change in grounding resistance caused by the thickness is less than that in the length, indicating that the secondary peak of step voltage is affected by grounding resistance to a certain degree.

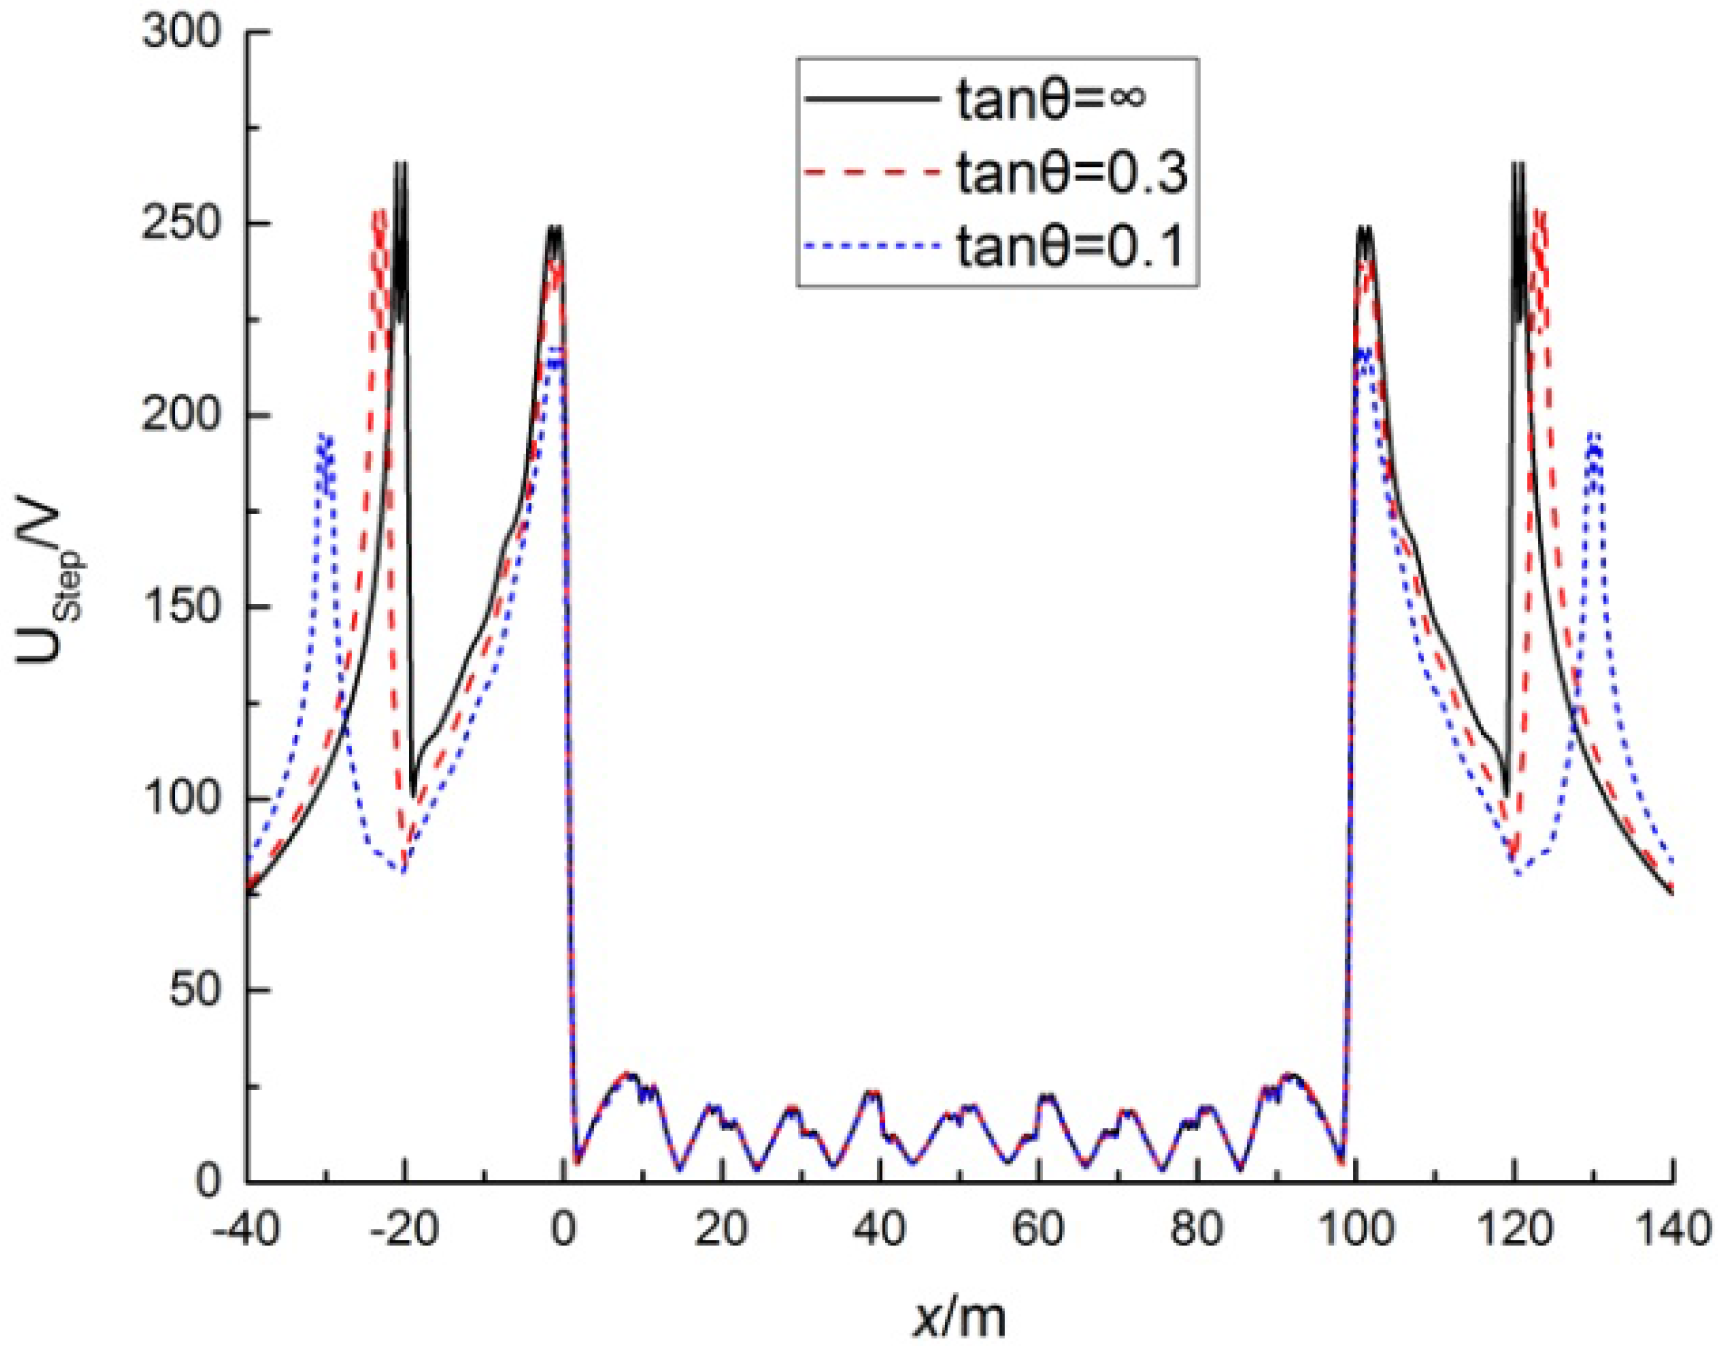
3.3. The Influence of Slope on Stepping Voltage and Grounding Resistance

The slope is the angle of slope and horizontal plane in slope excavation. Let the native soil resistivity ρ0 = 300 Ωm, the large backfill area’s resistivity ρ1 = 30 Ωm, the burial depth = 0.8 m, the range L = 140 m, and the thickness of the soil h = 1 m. When the slope tan θ is changed to ∞, 0.3, and 0.1, the corresponding step voltage on the observation line changes as shown in Figure 5.
It can be seen in Figure 5 that there is little effect on the primary peak and secondary peaks of the step voltage when the slope change is small, and the secondary peak is significantly reduced only when the slope is small. In other words, the secondary peak will be ostensibly reduced when the length of the large backfill area is large. Meanwhile, the principle is similar to the change in length L.

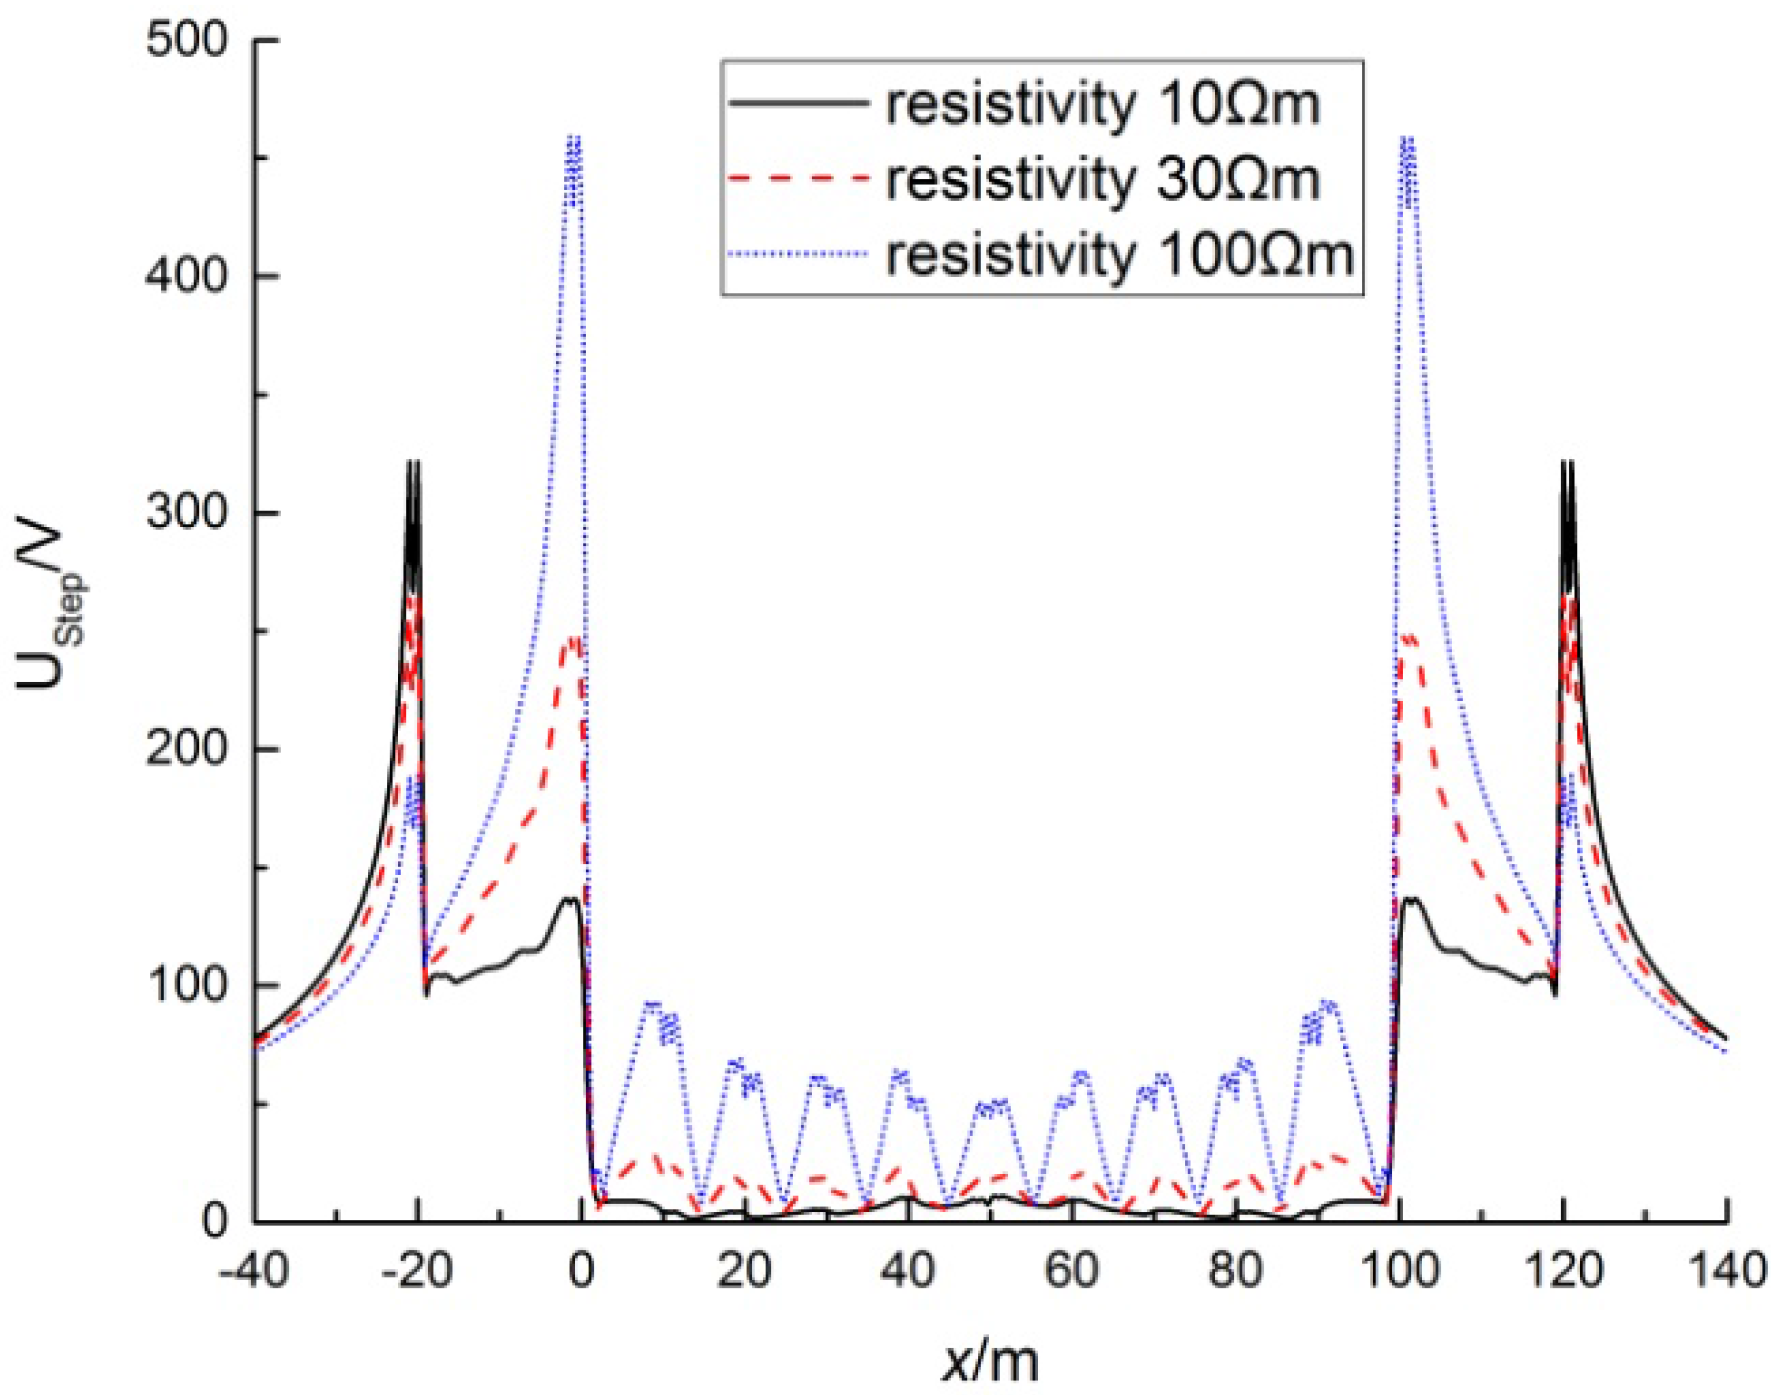
3.4. The Influence of Resistivity on Step Voltage and Grounding Resistance

Let the native soil resistivity ρ0 = 300 Ωm, the burial depth = 0.8 m, the range L = 140 m, the thickness of soil h = 1 m, and the slope = ∞. If the resistivity ρ1 of the large backfill area is changed to 10 Ωm, 30 Ωm, and 100 Ωm, then the corresponding step voltage on the observation line changes as shown in Figure 6, and the grounding resistance changes as shown in Table 1.
It can be seen in Figure 6 that the primary peak of step voltage increases and the secondary peak of step voltage decreases with the increase in surface soil resistivity, which shows an opposite trend. The increase in grounding resistance leads to an increase in step voltage in the large backfill area, but the ground potential of the area covered by backfill material will decrease with the same fault current. Therefore, the secondary peak will decrease. In addition, the increase in the large backfill area’s resistivity can also increase the grounding resistance while the secondary peak of step voltage decreases.
In conclusion, combined with engineering practice, a series of simulation results show that it is feasible to reduce the secondary peak of step voltage via certain measures, including the surface length, the slope, and the resistivity of the large backfill area.

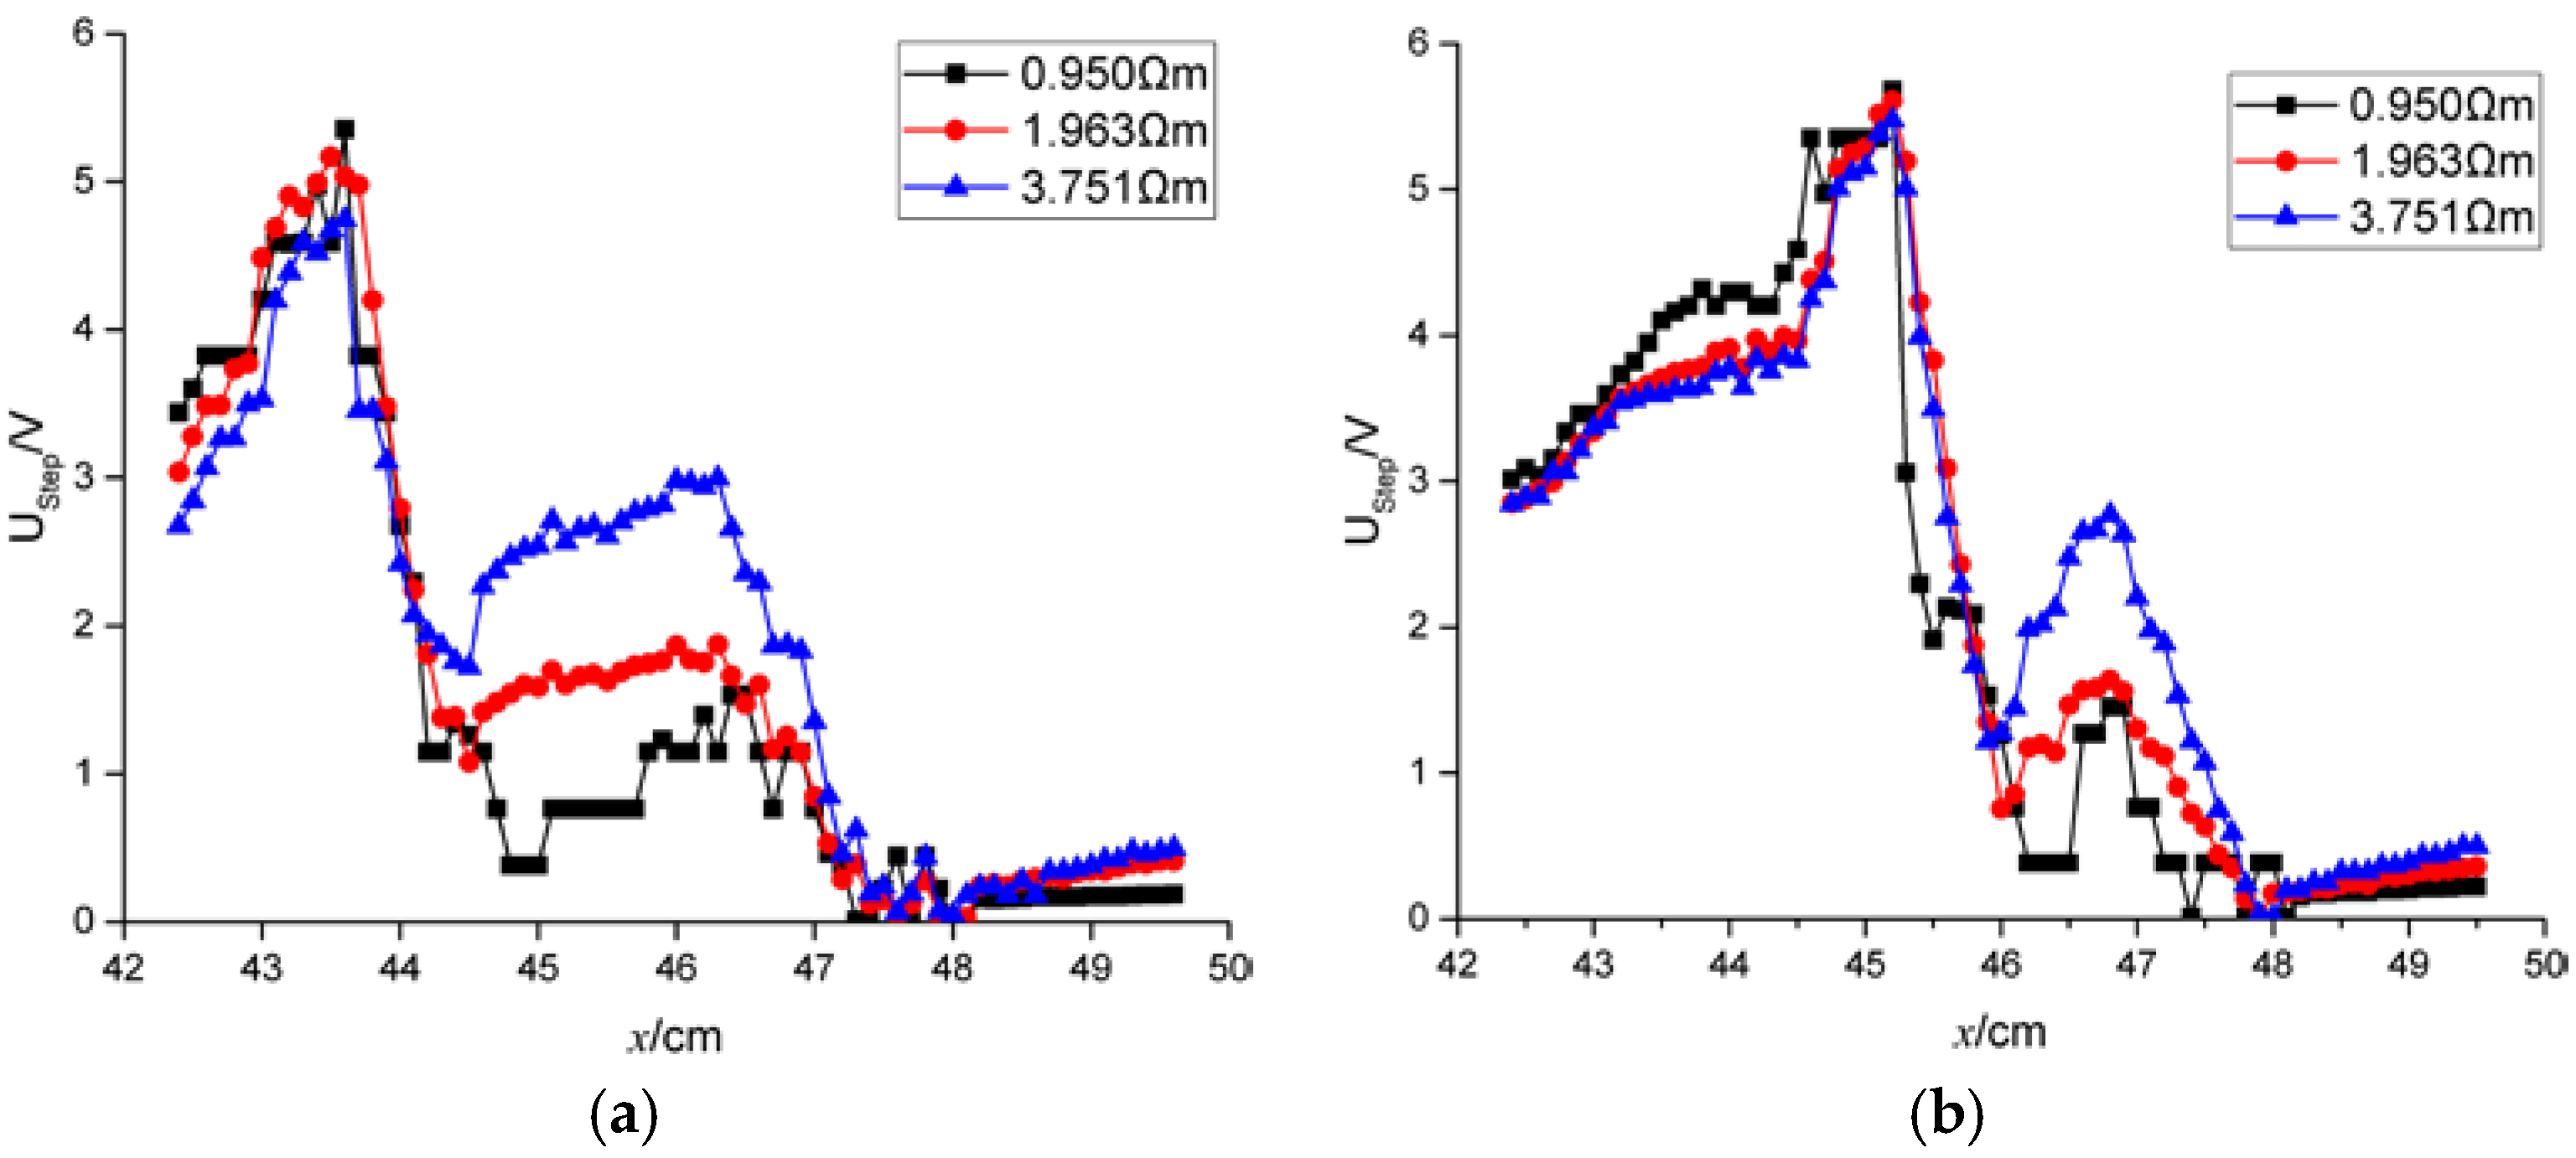
4. The Grounding Simulation Test

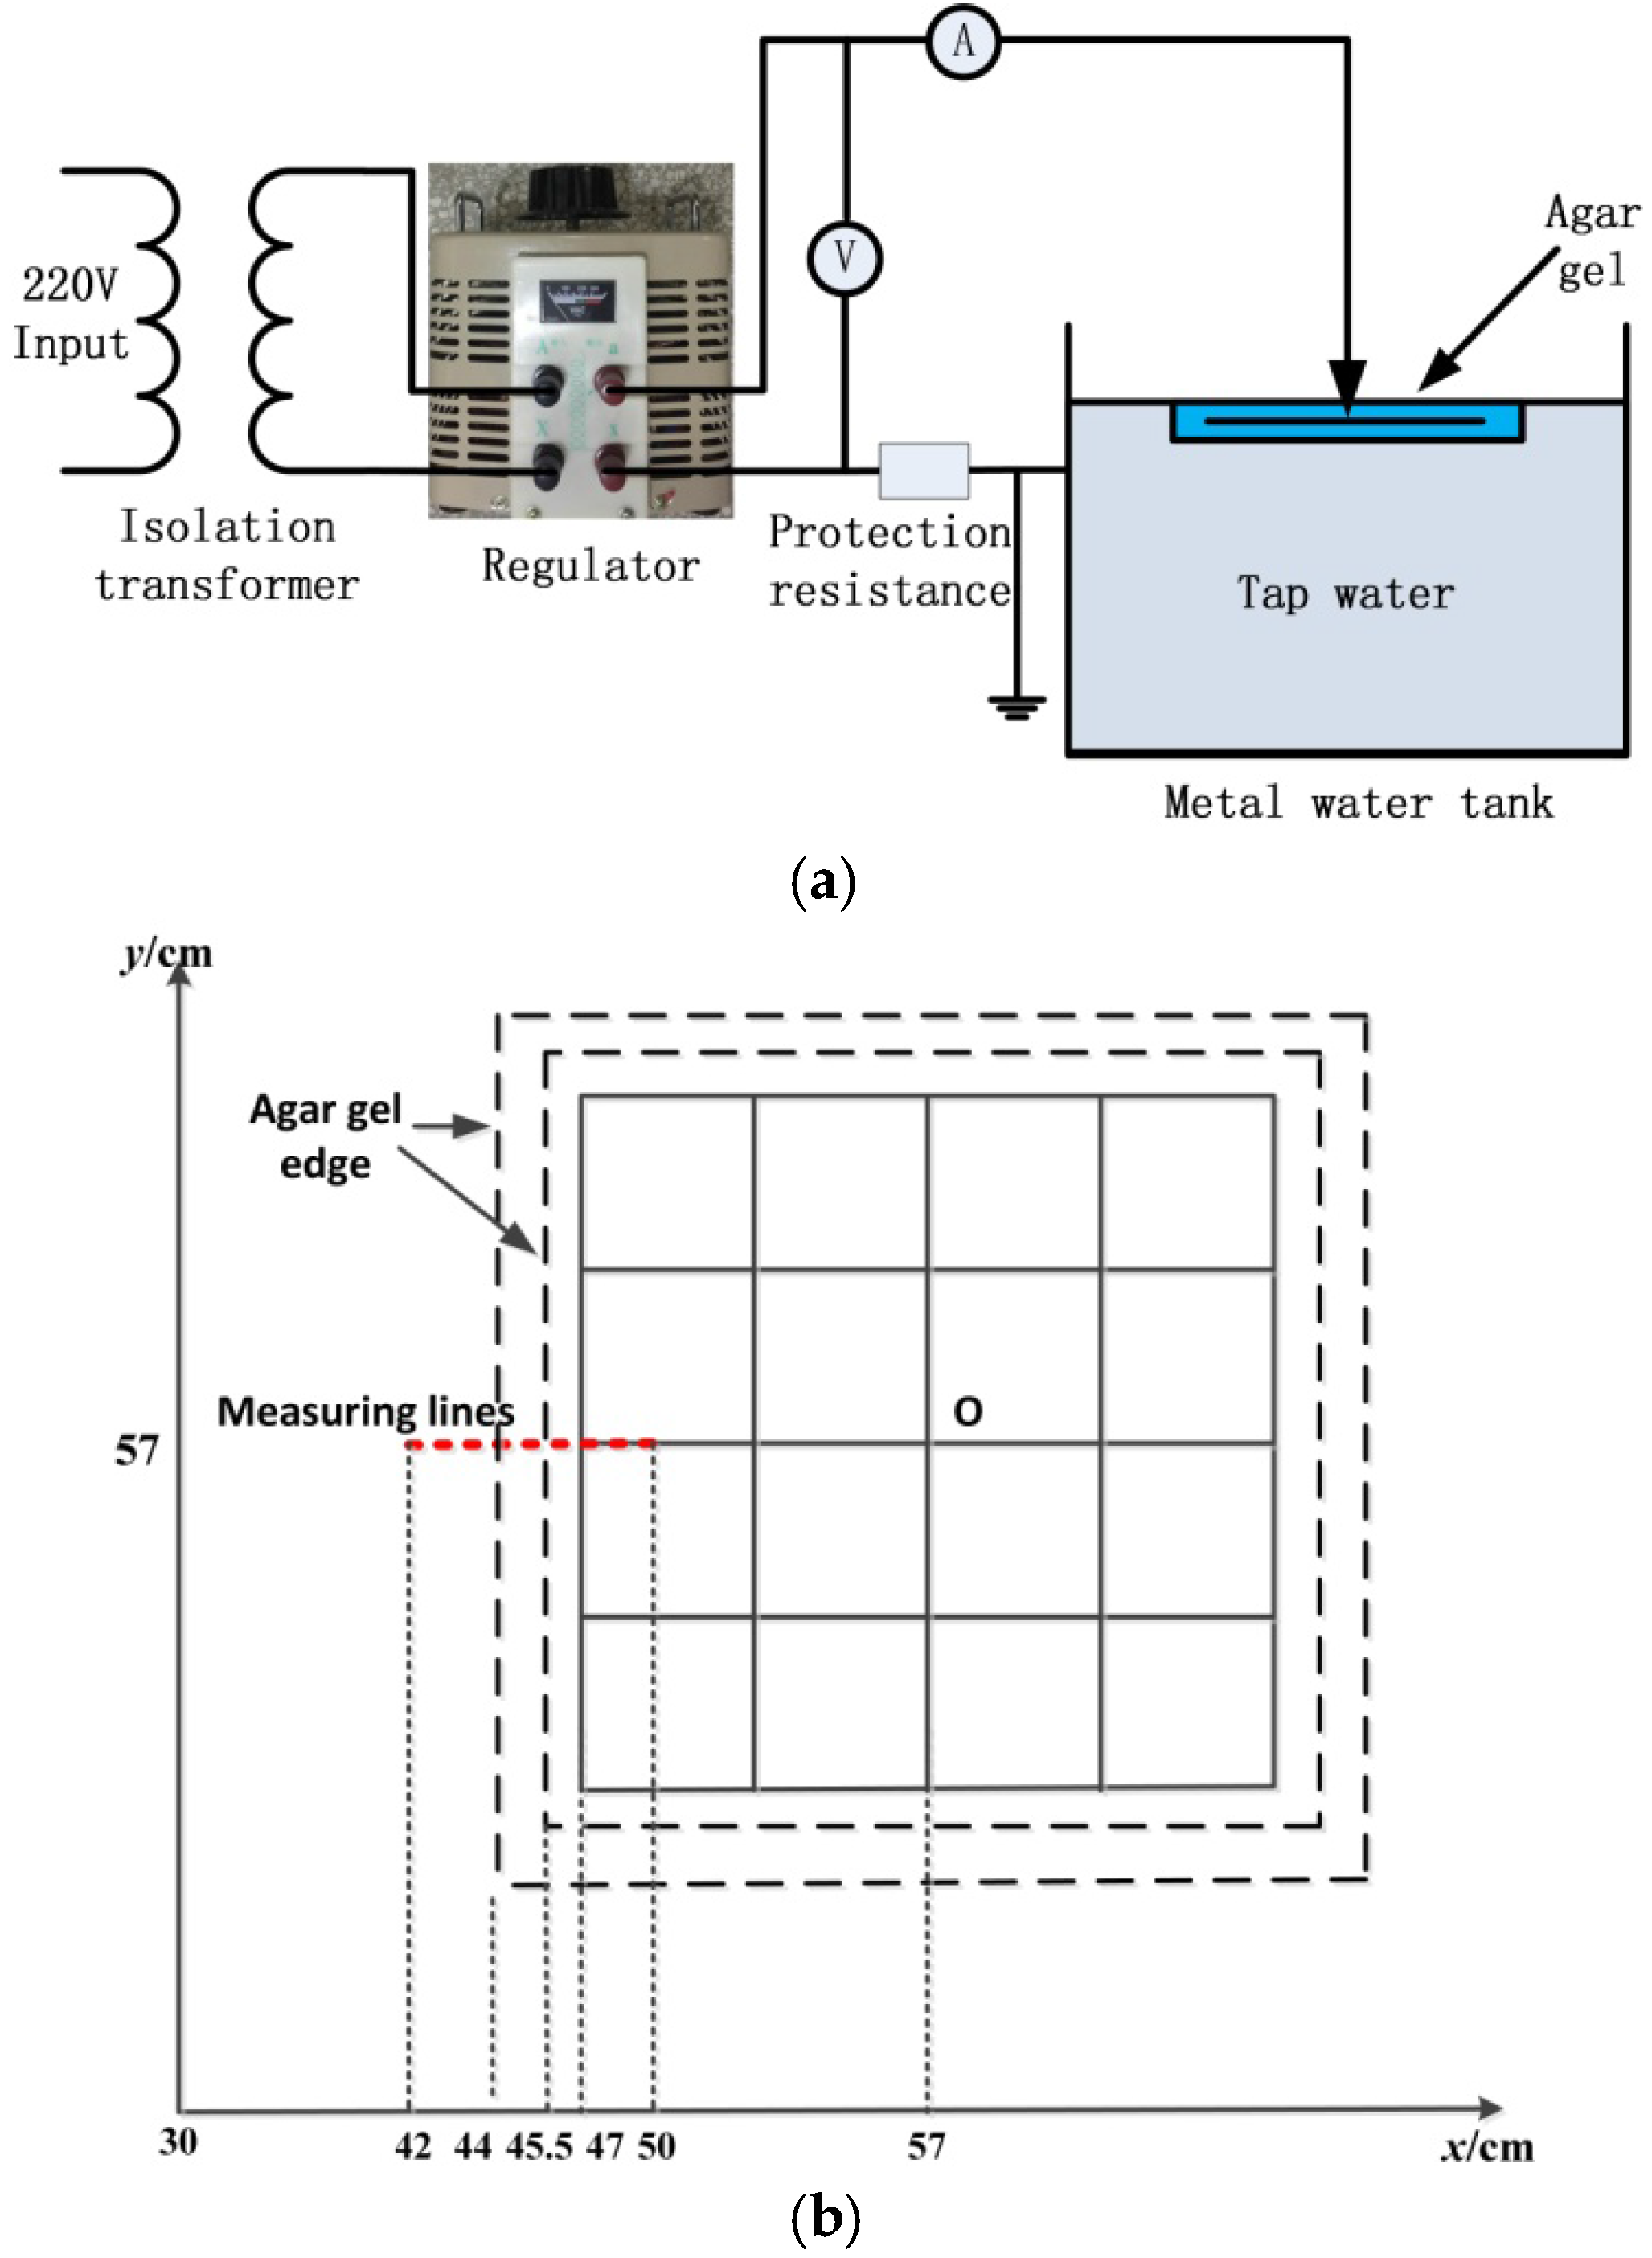
4.1. The Test Platform and Test Method

When the grounding simulation test is conducted, in order to minimize the effect of the tank wall on the current field distribution of the grounding grid model as much as possible, the radius of the metallic tank should be greater than twice the diagonal of the grounding grid model. Based on [22,23,24,25], the grounding simulation test system was introduced, and parameters were selected. Agar gel and tap water were used to simulate the soil medium in the test.
However, the agar gel is generally used as the bottom layer of the double-layer medium, and water used as the upper layer of the double-layer medium in the conventional grounding simulation test. If the agar gel were used as the lower layer of medium in the backfill material problem of the present study, too much agar would be required in the test and the cost would be higher. It is also not a good idea to adjust the size variables of the agar gel.
Therefore, tap water was used to simulate the native soil, and agar gel was used to simulate the large backfill area. The conductivity of the tap water used was about 898 µS/cm, and the resistivity was 11.13 Ωm after measurement. Considering that there were no obvious changes at room temperature during the experimental period, the resistivity can be considered constant.
The production process of agar gel is as follows: Firstly, a certain amount of NaCl is dissolved in water. Secondly, a certain amount of agar powder is added into the water and evenly stirred. Then, the mixture is heated and poured into a custom mold. The grounding grid model is fixed in the mold with a 0.8-mm-diameter cotton thread in advance so as to adjust the relative position of the model in the mold. When the mixture is cooled, the agar gel, which was used to simulate a large backfill area, can be obtained, and the grounding grid model can be fixed in the agar gel. The mass ratio of the agar powder to water used in the test was 3.5:100. The molded agar gel has a certain strength. The integrity of the agar gel is not destroyed even though the grounding grid model is lifted with a cotton thread in the metal tank. Lastly, the height of the water in the metal tank can be adjusted properly so that the water surface can be the same as the upper surface of the agar gel. Thus, the large backfill area and the native soil can be simulated.
In the selection process of the protection resistors, the power limitation of the isolation transformer used in the test, the injected fault current, and the resistance of the metal tank need to be considered comprehensively. In this test, the capacity of the used isolation transformer is 1000 W, and a fault current of 5 A is injected. At the same time, the resistance of the metal tank is shown in Table 2 and Table 3, which is about 10 Ω. Considering the overall power limitation, the safety, and the stability of the test process, one protection resistor of about 10 Ω and 250 W is required. As there are almost no high-power and low-resistance resistors on the market, five 50 Ω and 50 W resistors are paralleled to act as the protection resistors, and the test results show that the solution is feasible.
The grounding simulation system is designed as shown in Figure 7a and mainly consists of an isolation transformer, a regulator, and a metal tank. The length, width, and height of the tank are 114 cm, 114 cm, and 30 cm, respectively. The scale factor of the model is 1/100. The size of the grounding grid model is 20 cm × 20 cm, and mesh size is 4 × 4. The diameter of the conductor is 2 mm, and the burier depth is 0.8 cm.
Combined with [24] regarding the resistivity of molded agar gel, the resistivity of the agar gel could be adjusted relatively accurately in the test. The agar gel with low resistivity was produced first. The quality ratio of water, NaCl, and agar powder was 100:0.42:3.5. The resistivity of molded agar gel was approximately 0.95 Ωm.
Firstly, the agar gel with dimensions of 26 cm × 26 cm × 1 cm was produced to simulate the large backfill area, the size of which is 26 m × 26 m × 1 m. The center of the grounding grid model was 0.8 cm deep in the agar gel. A 5 A fault current was injected into the center point O. Considering the symmetry, in order to reduce the complexity of this test, only the grounding potential of the key area left of O was measured, as shown in Figure 7b. The diameter of the probe used was 2 mm, and the depth of the pinpoint in the water was 1 mm. The test begins from x = 42 cm, and one point is taken every 0.1 cm. This process continued until x = 50 cm, so there was a total of 81 points. Usually, a normal step is 1 m. In the test, the step voltage UStep at point x0 was defined as the difference between the surface potential V x 0 + 0.5 and V x 0 0.5   at 0.5 cm before and after the point.
U Step = V x 0 + 0.5 V x 0 0.5 .
Secondly, the size of agar gel was adjusted to 23 cm × 23 cm, and the measurements in Step 1 were repeated.
The agar gel with relatively high resistivity was then produced. The quality ratios of the water, NaCl, and agar powder were 100:0.16:3.5 and 100:0.09:3.5, respectively. The resistivity of the molded agar gel was about 1.96 Ωm and 3.75 Ωm.
This process would be repeated again.

4.2. Analysis of Test Result

The experimental data were sorted out to obtain the step voltage distribution curve of the agar gel with different resistivities and grounding resistances of Table 2.
It can be seen in Figure 8 that the secondary peak of step voltage mostly appears at the edge of the agar gel, namely the edge of the large backfill area. In addition, the changes in voltage curves with resistivity in Figure 8 illustrate that the rise in the resistivity of the massive soil surface could help to reduce the secondary peak of step voltage. However, some conclusions can be drawn by comparing the two images in Figure 8, namely, that the reduction of the secondary peak is not obvious when the scale of the agar gel is small. Namely, the effect of soil resistivity on the secondary peak will be greater when the range of backfill material is larger, and improving the backfill soil can have a more positive effect only when the backfill soil area is sufficiently large.
In Table 2, it can be seen that grounding resistance will increase with the increase in agar gel resistivity and decrease with the increase in agar gel size. Meanwhile, the secondary peak both decreases under the above-mentioned two conditions, indicating that the blind pursuit of grounding resistance reduction is not conducive to any improvement in grounding grid performance. Therefore, practical applications should be flexible.
The numerical results of the 20 m × 20 m grounding grid under the same parameters as the test were simulated. After the result was divided by the scale factor, it was converted into the same scale as the simulation test and compared with some experimental data.
It can be seen in Figure 9 that there is a little difference between the curves obtained from the simulation and the curves of the experimental data. This is closely related to the uncertainty of the test itself, and human error will affect the accuracy of the measuring point too. However, it can be seen that the measured voltages are higher than the simulated voltages. The main reason may be the boundary effects of the tank walls, and the potential of the ground point in the test is not the ideal ground potential.
In order to study the influence of the slope, the agar gel, whose upper and lower surface size are 26 cm × 26 cm, the lower surface size to 23 cm × 23 cm was adjusted to form a certain slope. By repeating the previous measurements, the step voltage curves with the size of the agar gel whose resistivity was 1.96 Ωm were obtained as shown in Figure 10. The grounding resistance were also obtained as shown in Table 3.
It can be seen in Figure 10 that the secondary peak appears in the upper edge of the agar when there is a certain slope in the agar gel, which is similar to the position when the upper and lower surface size of agar gel are both 26 cm × 26 cm. The secondary peak is smaller than that when the upper and lower surface size of agar gel are both 23 cm × 23 cm. Namely, the secondary peak of step voltage caused by the large backfill area always appears at the edge of the backfill soil. In addition, the slope of the agar gel could effectively reduce the secondary peak of step voltage. In a word, the slope has an effect that is similar to that of the expansion of the backfill soil range, which has practical significance.
The secondary peak of step voltage changes very little under the agar gel with a slope of 1, relative to a complete 26 cm × 26 cm agar gel. The peak was much smaller than the secondary peak under a 23 cm × 23 cm agar gel. This could help to reduce investments required for engineering applications. A suitable slope could be formed at the edge of the construction to reduce the amount of digging and filling on the project, while the safety of the staff is ensured.

5. Analysis and Discussion

The threshold parameter was used to control the number of patches on the surfaces of soil blocks when using software to obtain simulation results. In the actual operation, we found that the calculation results had stabilized when the threshold was small enough, indicating that the obtained result was relatively accurate. Dawalibi et al. [20] obtained convergent results when they calculated soil blocks with a radius of 1000 m. Therefore, smaller soil blocks with a radius of 100 m and 10 m were easy to converge.
It can be seen by comparing the results of the simulation and the test that there are two maximums near each peak of step voltage obtained via CDEGS. On the contrary, there was only one maximum in the test. This is because the step voltage of one point in simulation is defined as the difference in ground potential between the point and the point 1 m outside the former. In addition, the step voltage was calculated by the maximum grounding potential within the sphere. In the test, one step is defined as 1 m, and the step voltage of one point is defined as the difference in the grounding potential before and after the point. Therefore, there is only one maximum. The difference in data processing exerts no effect on the maximum of step voltage and has no significant effect on the test analysis.
The step voltage distribution of the agar gels whose lengths are 26 and 23 cm was measured in the test. The secondary peak of step voltage was always at the edge of the agar gel, which is consistent with the simulation results; namely, the secondary peak always appeared near the interface of the soils with different resistivities. In addition, the change in agar resistivity exerts no significant influence on the step voltage. On the one hand, there are some restrictions on step voltage when the grounding simulation test is miniaturized; on the other hand, changing substation soil locally is not ideal. The change in grounding resistance shows that reducing the grounding resistance, increasing the area of the grounding grid, increasing the burial depth, and connecting to the exterior grounding conductor can reduce the secondary peak of step voltage.
Agar gel with one certain slope at the edge was made. Voltage reduction was evident comparing with that in the simulation, which had one certain relationship with the miniaturization of the grounding simulation test. In addition, the slope had no significant effect on grounding resistance. Thus, in practice, the amount of earthwork in the project can be reduced, and costs can be reduced.
The actual high-resistivity upper layer needs to ensure the safety of staff. This layer is mainly concentrated in the inner station. However, the main study object of this paper is the secondary peak of step voltage outside the station. This layer has little effect on the area outside the station and is not the focus of this paper. Moreover, even though this layer is considered, its own high impedance may raise the peak of step voltage, but this will not have much impact on the overall experimental conclusion; however, the measurement of agar gel potential will be seriously affected if this layer is taken into consideration in the ground simulation test. Experiments related to this layer were not conducted after comprehensive consideration but may be conducted in future studies.

6. Conclusions

This paper clarifies the selection process of the protection resistors and provides an improved usage method of agar gel. The secondary peak of the step voltage generated by a large backfill area is simulated and tested in this paper. The results are highly applicable in areas with high-resistivity soil, hydropower stations, or laying conductor metal plates. The conclusions are as follows:
(1)
Large areas of backfill with low resistivity are the main cause of secondary peaks of step voltage.
(2)
Increasing the length of backfill soil can reduce the secondary peak of step voltage and the grounding resistance. Increasing the resistivity of large areas of backfill can also reduce this peak, but the grounding resistance would also increase.
(3)
It is feasible to simulate large areas of backfill with agar gel, which can be used in the multi-level grounding simulation tests.
(4)
In engineering practice, the secondary peak of step voltage can be reduced by expanding the scope of construction and dealing with backfill soil.
(5)
When the earthwork of the substation is carried out, a small slope could be built at the edge, which could reduce the risk of accidents outside the station and, at the same time, reduce the amount of digging and filling, which can save costs.

Author Contributions

Yaguang Tao and Jianchun Wei conceived and designed the experiments; Yaguang Tao wrote the paper; Qingquan Li and Jianchun Wei revised the paper; Yalin Shi and Tongqiao Zhang set up the experimental platform and provided financial support; Jiwei Zhang and Xiao Liu prepared the agar gel and participated in the experiments.

Conflicts of Interest

The authors declare no conflict of interest.

References

  1. Capelli, F.; Riba, J.-R.; Pérez, J. Three-Dimensional Finite-Element Analysis of the Short-Time and Peak Withstand Current Tests in Substation Connectors. Energies 2016, 9, 418. [Google Scholar] [CrossRef] [Green Version]
  2. Guide for Safety in AC Substation Grounding; IEEE 80-2000; The Institute of Electrical and Electronics Engineers, Inc.: New York, NY, USA, 2000.
  3. Sun, W.; He, J.; Gao, Y.; Zeng, R.; Wu, W.; Su, Q. Optimal design analysis of grounding grids for substations built in non-uniform soil. IEEE Trans. Power Appar. Syst. 2000, 3, 1455–1460. [Google Scholar]
  4. Hajiaboli, A.; Fortin, S.; Dawalibi, F.P. Numerical Techniques for the Analysis of HVDC Sea Electrodes. IEEE Trans. Ind. Appl. 2015, 51, 5175–5181. [Google Scholar] [CrossRef]
  5. Dolado, P.; Lazaro, A.; Delgado, M.; Peñalosa, C.; Mazo, J.; Marin, J.M.; Zalba, B. An Approach to the Integrated Design of PCM-Air Heat Exchangers Based on Numerical Simulation: A Solar Cooling Case Study. Resources 2015, 4, 796–818. [Google Scholar] [CrossRef]
  6. Takahashi, T.; Kawase, T. Calculations of earth resistance for a deepdriven rod in a multilayer earth structure. IEEE Trans. Power Deliv. 1991, 6, 608–614. [Google Scholar] [CrossRef]
  7. Hua, X.U.; Wen, X.; Ling, H. Optimization Design of Grounding Grid of Large Substation. High Volt. Eng. 2005, 31, 6365. [Google Scholar]
  8. Visacro, S.; Alipio, R. Frequency dependence of soil parameters: Experimental results, predicting formula and influence on the lightning response of grounding electrodes. IEEE Trans. Power Deliv. 2012, 27, 927–934. [Google Scholar] [CrossRef]
  9. IEEE Recommended Practice for Grounding of Industrial and Commercial Power System; IEEE Std. 142-1991; IEEE: Piscataway, NJ, USA, 1991.
  10. Calixto, W.P.; Neto, L.M.; Wu, M.; Yamanaka, K.; da Paz Moreira, E. Parameters estimation of a horizontal multilayer soil using genetic algorithm. IEEE Trans. Power Deliv. 2010, 25, 1250–1257. [Google Scholar] [CrossRef]
  11. Gouda, O.E.; Amer, G.M.; EL-Saied, T.M. Optimum design of grounding system in uniform and non-uniform soils using ANN. Int. J. Soft Comput. 2006, 1, 175–180. [Google Scholar]
  12. Zhao, Z.; Cui, X.; Zhang, B.; Li, L. Analysis of grounding systems in multi-layer soil with finite volumes of different resistivities. Proc. Chin. Soc. Electr. Eng. 2004, 24, 218–223. [Google Scholar]
  13. Gyung, S.K.; Hyong, J.G.; Park, D.-W. Simulator for potential distribution analysis. J. Eng. Technol. 2012, 7, 225–229. [Google Scholar]
  14. Thabet, A. Grounding Systems of Electric Substations in Non-Uniform Earth Structure with New Analysis. Master’s Thesis, High Institute of Energy, Aswan, Egypt, 2002. [Google Scholar]
  15. Pereira, W.; Soares, M.; Martins, N.L. Horizontal multilayer soil parameter estimation through differential evolution. IEEE Trans. Power Deliv. 2015, 31, 622–629. [Google Scholar] [CrossRef]
  16. Long, X.; Dong, M.; Xu, W.; Li, W. Online Monitoring of Substation Grounding Grid Conditions Using Touch and Step Voltage Sensors. IEEE Trans. Smart Grid 2012, 3, 761–769. [Google Scholar] [CrossRef]
  17. Dawalibi, F.P.; Mitskevitch, N.; Allard, G. Grounding analysis of large hydroelectric generating complex using soil structure containing heterogeneous volumes. In Proceedings of the 17th CEPSI, Macau, China, 27–31 October 2008. [Google Scholar]
  18. Nahman, J.; Paunovic, I. Effects of the local soil nonuniformity upon performances of ground grids. IEEE Trans. Power Deliv. 2007, 22, 2180–2184. [Google Scholar] [CrossRef]
  19. Liu, J.; Dawalibi, F.P.; Mitskevitch, N.; Joyal, M.-A.; Tee, S. Realistic and accurate model for analyzing substation grounding systems buried in various backfill material. In Proceedings of the 2014 IEEE PES Asia-Pacific Power and Energy Engineering Conference (APPEEC), Hong Kong, China, 7–10 December 2014; pp. 1–6. [Google Scholar]
  20. Fortin, S.; Mitskevitch, N.; Dawalibi, F.P. Analysis of grounding systems in horizontal multilayer soils containing finite heterogeneities. IEEE Trans. Ind. Appl. 2015, 51, 5095–5100. [Google Scholar] [CrossRef]
  21. Wei, G.; Huang, W.; Wen, X.; Wei, W.; Hailiang, L.U.; Yao, S.; Tan, B.; Li, W. A study of grounding parameters of grounding grid in soil with massive texture by using fast multipole boundary method. Proc. CSEE 2014, 34, 1436–1445. [Google Scholar]
  22. Gouda, O.E.; El Dein, A.Z. Ground potential rise of faulty substations having equal and unequal spacing grounding grids conductors. IET Gener. Transm. Distrib. 2017, 11, 18–26. [Google Scholar] [CrossRef]
  23. Substation Grounding Programs; EPRI TR-100622; SGSYS Version 4.4; Product ID: TR-100622-V3; Electric Power Research Institute: Palo Alto, CA, USA, 1992; Volume 3.
  24. El-Morshedy, A.; Zeitoun, A.G.; Ghourab, M.M. Modeling of substation grounding grids. IEE Proc. C 1986, 133, 287–292. [Google Scholar]
  25. Webster, J.G. Electrical Impedance Tomography; Institute of Physics Publishing: London, UK, 1990. [Google Scholar]
Figure 1. Grounding grid model and backfill material.
Energies 11 00698 g001
Figure 2. Step voltage with different backfill material areas.
Energies 11 00698 g002
Figure 3. The change in step voltage with length L.
Energies 11 00698 g003
Figure 4. The change in step voltage with thickness h.
Energies 11 00698 g004
Figure 5. The change in step voltage with slope.
Energies 11 00698 g005
Figure 6. The change in step voltage with resistivity.
Energies 11 00698 g006
Figure 7. Grounding simulation test. (a) Test platform; (b) measuring lines with agar and grounding grid.
Energies 11 00698 g007
Figure 8. The changes in step voltage with agar gel resistivity under different agar gel sizes. (a) The changes in step voltage with agar gel resistivity when the size of the agar gel is 26 cm × 26 cm. (b) The changes in step voltage with agar gel resistivity when the size of the agar gel is 23 cm × 23 cm.
Energies 11 00698 g008
Figure 9. The difference in the simulation results and the experiment data.
Energies 11 00698 g009
Figure 10. The changes in step voltage changes with agar size.
Energies 11 00698 g010
Table 1. The maximum ground potential rise and the grounding resistance under different parameters of large backfill area.
Influence FactorsGPRmax/VGrounding Resistance/Ω
lengthL = 120 m11,984.651.198465
L = 140 m11,529.621.152962
L = 160 m10,985.421.098542
thicknessh = 0.85 m12,014.671.201467
h = 0.95 m11,529.621.152962
h = 1.1 m11,493.231.122057
slopetan θ = 111,490.131.149013
tan θ = 311,522.31.15223
tan θ = ∞11,529.621.152962
resistivityρ1 = 10 Ωm10,866.991.086699
ρ1 = 30 Ωm11,529.621.152962
ρ1 = 100 Ωm12,570.811.257081
Table 2. The changes in grounding resistance with agar resistivity under different sizes.
Agar Gel Size/cmAgar Gel Resistivity/ΩmGrounding Resistance/Ω
26 × 260.9510.03
1.9610.35
3.7510.86
23 × 230.9510.39
1.9610.73
3.7510.97
Table 3. The changes in grounding resistance with different agar size.
Agar Gel Size/cm26 × 26Higher Surface 26 × 26
Lower Surface 23 × 23
23 × 23
Grounding resistance/Ω10.3510.4910.73

