A Numerical Study of Fluid Flow and Heat Transfer in Carbon Dioxide Enclosures on Mars

1
Laboratory of Fundamental Science on Ergonomics and Environmental Control, School of Aeronautic Science and Engineering, Beihang University, Beijing 100191, China
2
State Key Laboratory of Aerodynamics, China Aerodynamics Research and Development Center, Mianyang 621000, China
3
School of Chemical and Process Engineering, University of Leeds, Leeds LS2 9JT, UK
*
Author to whom correspondence should be addressed.
Energies 2018, 11(4), 756; https://doi.org/10.3390/en11040756
Submission received: 24 February 2018
/
Revised: 13 March 2018
/
Accepted: 21 March 2018
/
Published: 27 March 2018
Abstract
:In order to support the future thermal control and energy conservation design for the Mars rover, numerical studies on natural convection in CO2 enclosures on Mars’ surface were conducted for both horizontal and vertical enclosures. The parameters are as follows: the atmospheric pressure was 1000 Pa, the gravitational acceleration was 3.62 m/s2, and the Prandtl number was 0.77. The heat flux, temperature, and velocity fields of the CO2 enclosures were obtained with the aspect ratio ranging from 5.56 to 200 and the Grashof number ranging from 430 to 2.6 × 10⁴. It was found that natural convection formed more easily in the horizontal enclosures than that in the vertical enclosures when the enclosures had same thickness. With the increasing thickness of the enclosures, Rayleigh–Bénard convections formed in the horizontal enclosures, while only single-cell convections formed in the vertical enclosures. The heat flux through the horizontal enclosures was greater than that through the vertical enclosures with the same thickness when natural convection formed. The maximum difference between them reached 35.26%, which was illustrated by the field synergy principle. A hysteresis phenomenon of the natural convection dominating the heat transfer was found in the vertical enclosure on Mars’ surface. New values for the critical Grashof number and correlations for the average Nusselt number for both the horizontal and vertical CO2 enclosures on Mars’ surface were also developed.
1. Introduction
In order to support exploration on Mars, Mars rovers are sent to Mars’ surface to work long hours. Once there, they have to confront a low-pressure and extremely low-temperature environment. Accordingly, it is usually necessary to utilize insulation materials and CO2 gas enclosures to avoid energy loss and keep the internal equipment at a normal working temperature. Therefore, the heat transfer characteristic of the CO2 gas enclosure is one of the most significant factors influencing the Mars rover’s thermal insulation configuration. The enclosure is usually used for thermal insulation and energy conservation, such as double glazed glass, energy transfer equipment, the solar thermal collector, etc. The heat transfer characteristics inside the enclosure differ a lot under different conditions, depending on where the enclosures are located. In typical applications, most of the research has focused on cavities that are filled with air on Earth, as reviewed below.
Many researchers have investigated natural convection heat transfer in air rectangular enclosures. A number of studies have obtained the heat transfer or Nusselt number correlations for different aspect ratios and Rayleigh numbers [1,2,3,4,5,6]. Eckert and Carlson [7] and Ganguli et al. [8] performed an experimental study on the temperature fields in the air layers enclosed between two isothermal vertical plates at different temperatures. They found that boundary layers existed along the surfaces, while in the central core the temperature was uniform in the horizontal direction. Ganguli et al. [8] and Gill [9] found that when the temperature difference was large enough, the heat transfer was almost convection, and conduction was only present in thin boundary layers near the walls. Aviram et al. [10] and Wakitan [11] demonstrated that heat transfer increased with a decreasing aspect ratio, and Jin and Chen [12] found that the critical Grashof number had an inverse relationship with the Prandtl number. Lartigue et al. [13] proposed that cells did not keep stationary in vertical enclosures with an aspect ratio of 40 and a Rayleigh number of 9222. Betts and Bokhari [14] carried out experimental studies to investigate the turbulent natural convection of air in a tall rectangular cavity and showed that the flow and temperature fields were closely two-dimensional. Manz [15] found that the onset of turbulence occurred at higher Rayleigh numbers for lower aspect ratios in vertical enclosures. Wu and Ching [16] experimentally studied the effect of the top wall temperature on the laminar natural convection. They found that the flow departed from the top wall with an undulating flow, resulting in nonuniformity in the temperature fields. Zhang et al. [17] used PIV to observe the forming process of the circle convection in a large cavity with a small heat source.
Some researchers have investigated natural convection heat transfer in air square cavities. Markatos and Pericleous [18] studied heat transfer in a square cavity with a Rayleigh number from 103 to 1016. They found that the buoyancy effects were dominant in the heat transfer. Ramesh and Venkateshan [19] experimentally investigated laminar natural convection in air square cavities having heated isothermal vertical walls and concluded that the emissivity of the top and bottom walls did not affect the Nusselt number. Ampofo and Karayiannis [20] conducted an experimental investigation on natural convection in an air square cavity of low-level turbulence with a Rayleigh number of 1.58 × 10⁹. They found that the maximum local Nusselt number was at the top of the cold wall as well as the bottom of the hot wall. Yang et al. [21] investigated a case with a high Grashof number of 1.8 × 10¹³ and found that a secondary upward flow appeared near the heated walls, which was induced by the buoyancy.
Several researchers have found Rayleigh–Bénard convections, a kind of multiple-cell convection, in the enclosure during their studies. Bejan and Tien [22] performed a numerical study on laminar natural convection in a vertical enclosure. They posited that there were three models that formed as the Rayleigh number increased: the regime of vanishing Rayleigh numbers, the intermediate regime, and the boundary layer regime. Hasnaoui et al. [23] conducted a numerical study of natural convection in enclosed horizontal cavities. They found that the Rayleigh number, aspect ratio, and length and position of the heat source on the bottom surface had significant influence on the occurrence of single and multiple-cell convections. Lu and Zhuang [24] focused on the stability of convective motion across a vertical slot. They observed that three kinds of flow transitions formed successively as the Grashof number increased: unicellular flow to steady multicellular flow; steady multicellular flow to unsteady multicellular flow; and unsteady multicellular flow to steady multicellular flow. Zhou et al. [25] used the Lattice–Boltzmann algorithm to simulate the buoyancy-driven flows of turbulent natural convection in enclosed tall air cavities and captured the stability of the Rayleigh–Bénard convection near the critical Rayleigh number. Ganguli et al. [8] showed that as the enclosure aspect ratio increased, the transition from unicellular to multicellular flow occurred, which enhanced the convective heat transfer coefficient. In addition, some researchers [23,24,25,26] have proposed that the inclination angle also affects the formation of the Rayleigh–Bénard convection.
Based on the previous literature review, relevant conclusions were drawn from studies of the natural convection phenomenon inside enclosures with air as the working medium under working conditions similar to the Earth’s surface environment. There were few studies, however, about heat transfer inside CO2 enclosures under conditions similar to Mars’ surface. In order to find the critical thickness corresponding to the minimum heat transfer for the cylinder enclosures of the Mars rover, Bhandari et al. [27] conducted experimental and numerical studies on heat transfer in a cylindrical CO2 enclosure The enclosure had five different thicknesses under working conditions with low pressure of 1066 Pa and gravitational acceleration of 9.8 m/s2. They found that the transition from thermal conduction to convection occurred at about H = 63.5 mm as the enclosure thickness increased. However, they did not consider the difference in the gravity between Earth and Mars. Moreover, they only investigated a horizontal cylinder enclosure with one diameter and did not consider a vertical case. Although they studied critical thickness (Hcrit), they did not analyze gas flow and heat transfer characteristics. They also did not obtain the Nusselt number correlation.
This paper focuses on the numerical study of the fluid flow and heat transfer characteristics inside CO2 enclosures on Mars’ surface, paying attention to whether the different orientation of the enclosure (horizontal or vertical) could affect the heat transfer characteristics inside the enclosure. The main work described in this paper is as follows: (1) conducting the numerical simulation of the fluid flow and heat transfer inside the CO2 enclosures to obtain the relationship between the heat transfer characteristics and the thickness of the vertical and horizontal enclosures; (2) analyzing the velocity and temperature distribution in order to explain further the fluid flow and heat transfer characteristics inside the enclosure; (3) interpreting the different formation of the fluid flow between the horizontal and vertical enclosures and demonstrating the hysteresis phenomenon of the natural convection dominating the heat transfer in the vertical enclosure on Mars’ surface; (4) applying the field synergy principle (FSP) to illustrate the different heat flux between the horizontal and vertical enclosures; (5) acquiring the critical Grashof number and developing the correlations of the average Nusselt number in the horizontal and vertical CO2 enclosures on Mars.
2. Problem Description and Method
2.1. Physical Model
For the CO2 enclosure of the Mars rover—within a certain thickness range—the thicker the enclosure, the larger the thermal resistance, which can inhibit heat transfer and maintain the normal working temperature for the internal equipment. However, natural convection—which enhances heat transfer in the enclosures and is adverse to thermal insulation and energy conservation—is more likely to occur in thicker enclosures. Therefore, there must be a critical enclosure thickness that corresponds to the lowest heat flux (q).
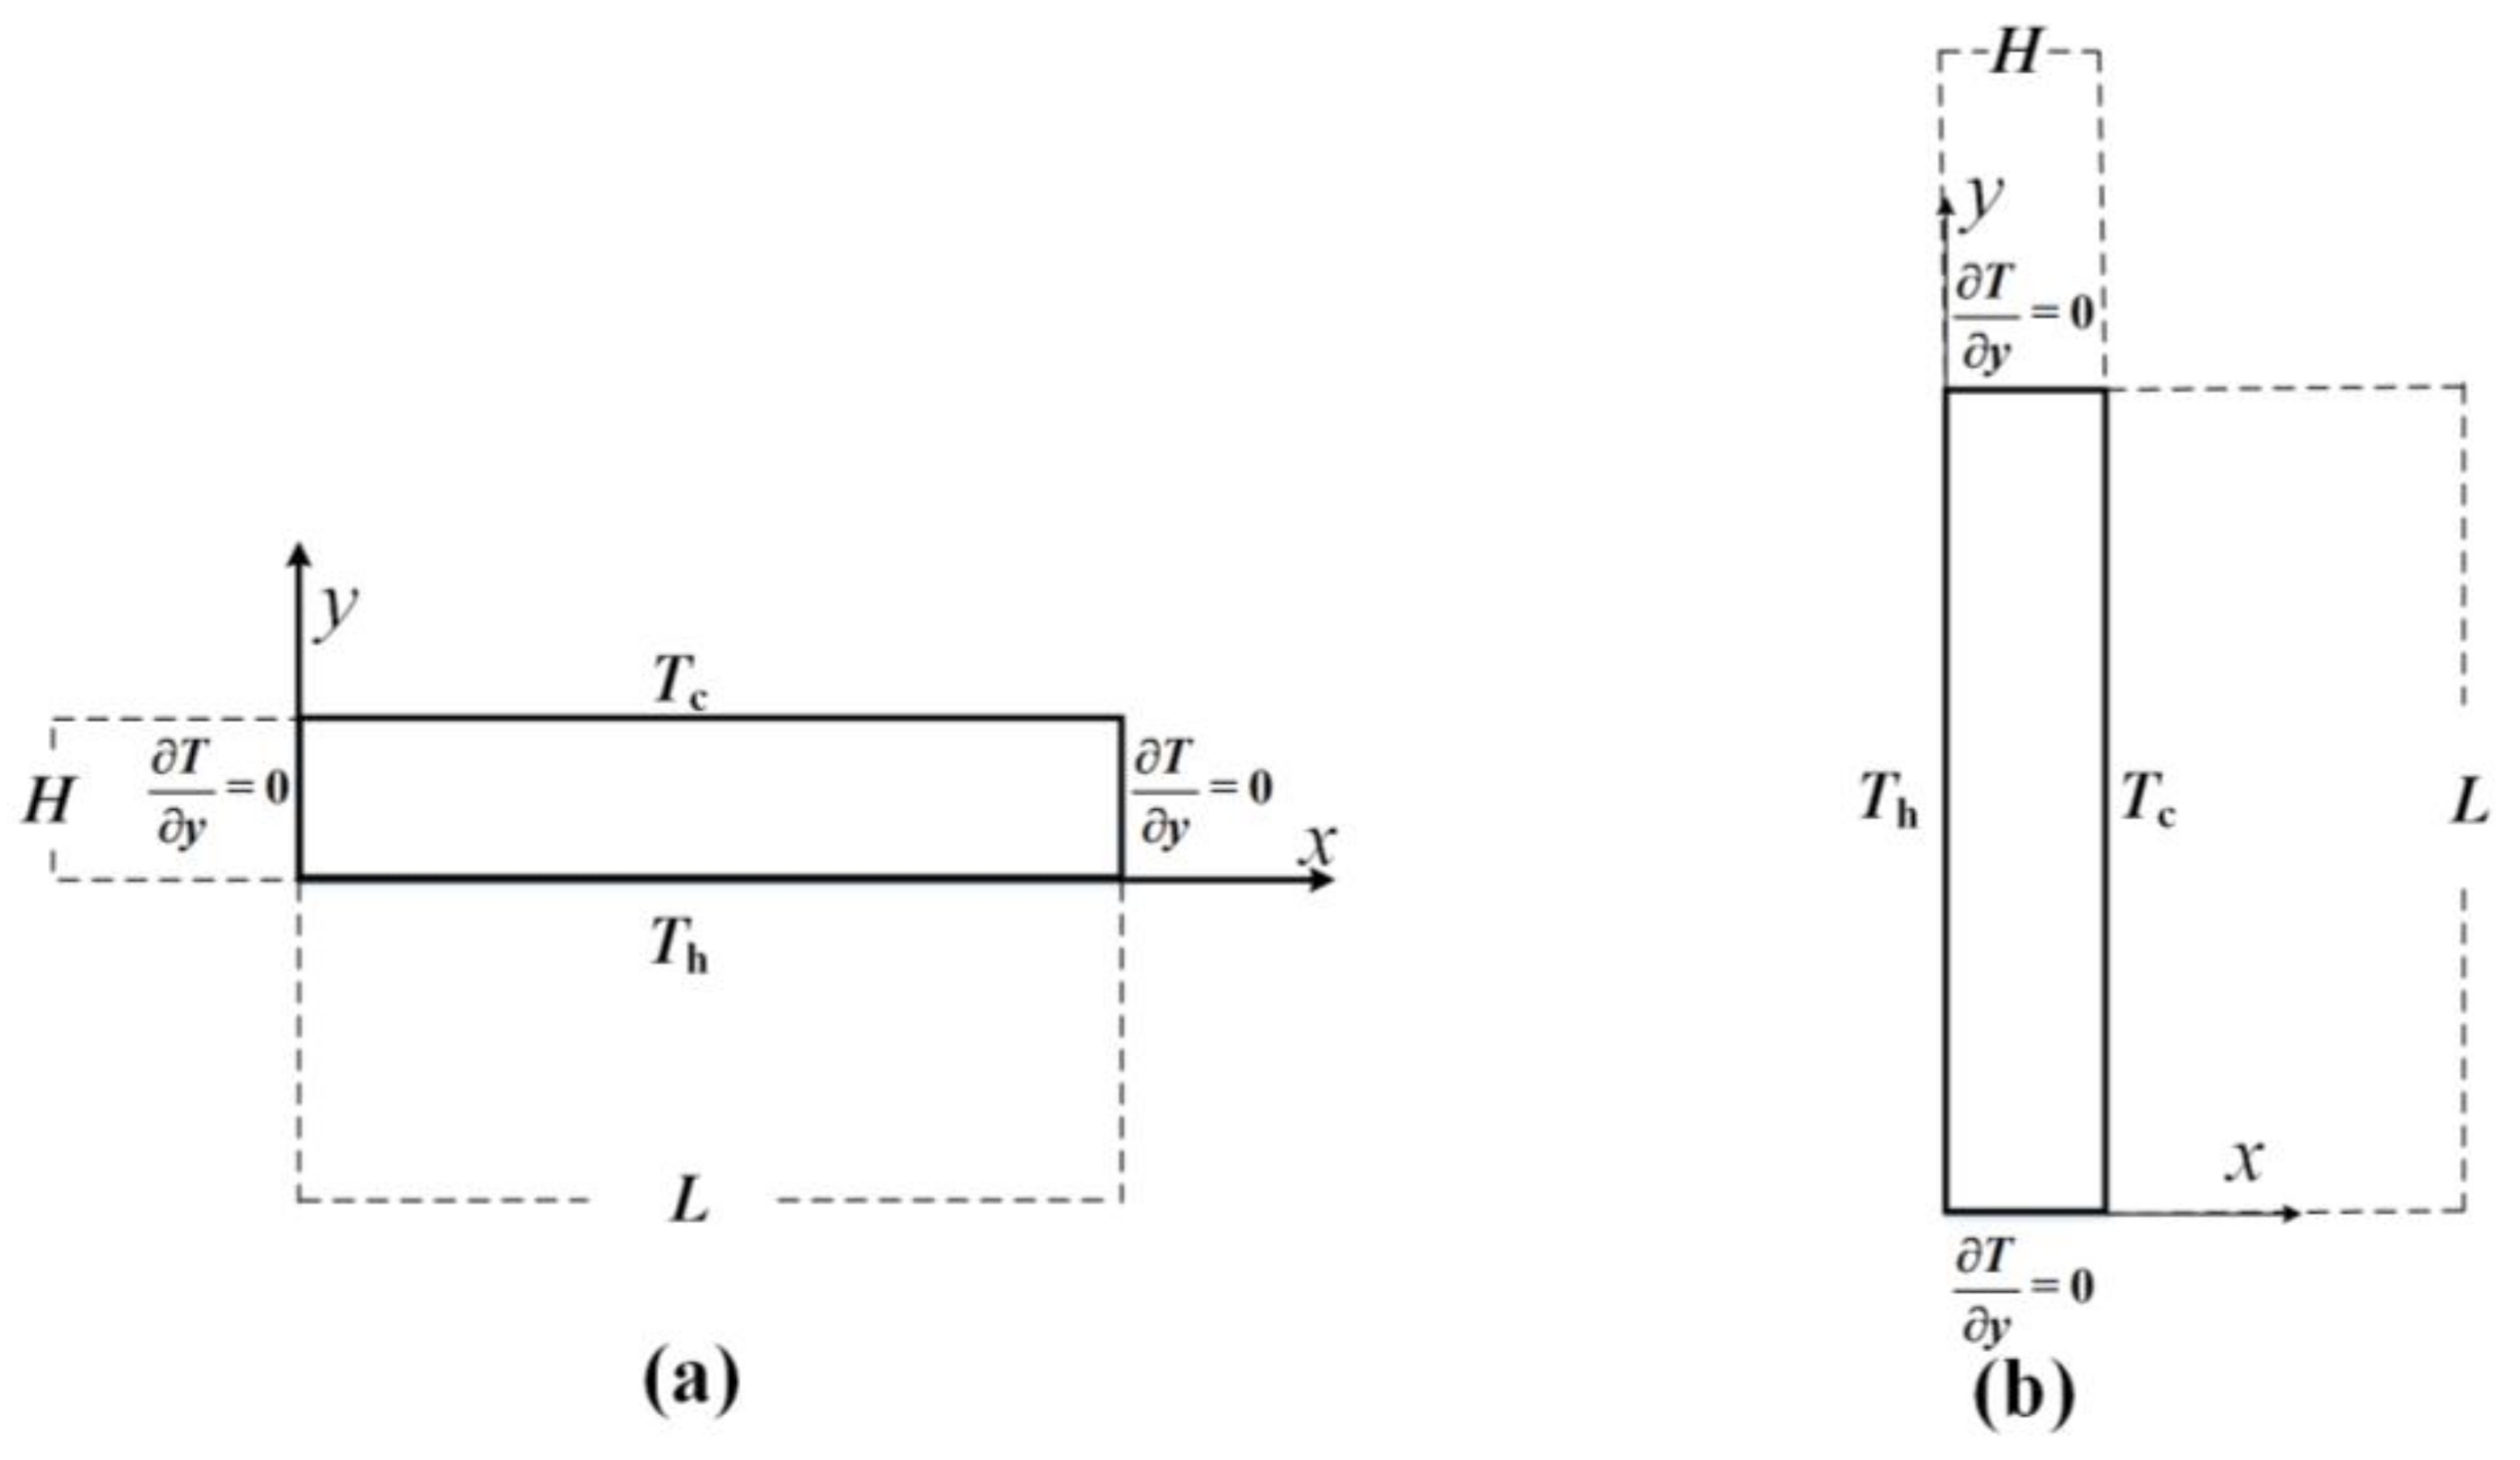
The enclosures studied here included horizontal and vertical orientations, as shown in Figure 1. The enclosure parameters were as follows: thickness range of 5 mm ≤ H ≤ 180 mm; temperature of the high-temperature surface of Th = 220 K, 230 K, 240 K, 250 K, 260 K, 270 K, 280 K; and temperature of the low-temperature surface of Tc = 200 K and the rest of the surface of adiabatic wall. The gas in the enclosure was carbon dioxide, and the pressure was 1000 Pa [27]. The length of the enclosures in the normal direction of the xy plane was large enough so that a two-dimensional flow was assumed. Manz [15] and Wu [16] have noted that the difference in heat transfer calculated by two-dimensional and three-dimensional flows was negligible.
2.2. Mathematical Formulation and Solution Method
The Knudsen number (Kn = λ/l) could be used to judge the flow state of carbon dioxide in the enclosures. With the mean free path (λ) of carbon dioxide on Mars’ surface approximately 5 × 10⁻⁶ m [28] and the characteristic length (l) of the enclosures studied in this paper ranging from 5 × 10⁻³ m to 180 × 10−3 m, the Knudsen number of enclosures would always be no more than 0.001. Therefore, it was determined that the fluid flow in the enclosures on Mars’ surface belonged to a continuous flow.
The steady-state two-dimensional versions of continuity, momentum, and energy equations are employed in the mathematical model as follows.
Continuity:
Momentum balance:
x-direction:
y-direction:
Energy balance:
The boundary conditions are as follows:
The physical property parameters of carbon dioxide were obtained from the National Institute of Standards and Technology (NIST) database [27,29]:
where μ is the dynamic viscosity, k is the thermal conductivity, cp is the specific heat of the fluid, and T is the fluid temperature.
The Boussinesq approximation is accurate as long as changes in actual density are small. In this paper, β × (T − T0) ≪ 1, so the well-known Boussinesq approximation can be employed, and the density is treated as a constant value in all of the solved equations, except for the buoyancy term in the momentum equation [30]:
where T0 is the mean temperature of the hot and cold surfaces T0 = (Th + Tc)/2 and ρ0 is the corresponding density of the fluid.
Fluent 14.0 [30] was used for the numerical simulations and the solution methods were as follows: The pressure-based coupled algorithm was adopted for the solution of the governing equation. As for the discretization scheme, the least squares cell-based method was selected as the discretization method for the gradient; the PRESTO! (Pressure Staggering Option) scheme was used as the pressure interpolation scheme, and the second order upwind discretization scheme was applied to the momentum and energy equations. The value of the residual tolerance was set to 10−6 as the convergence criteria throughout the course of the computation, and we made sure that a steady state was always reached.
The Grashof number, a dimensionless parameter relevant to fluid dynamics and heat transfer in enclosures, is approximately the ratio of the buoyancy to the viscous force acting on a fluid. When the Grashof number is less than a certain critical value, pure heat conduction dominates the heat transfer; when the Grashof number is greater than the critical value, natural convection dominates the heat transfer in the enclosure. As the Grashof number increases, the degree of natural convection intensifies further. When the Grashof number increases to a certain value (Gr × Pr = 106), the nature convection in the enclosure will transit from laminar flow to turbulence [18].
The Grashof number is defined as follows:
where g is the acceleration of gravity; ΔT is the difference of temperatures of the high and low temperature surface; β is the thermal expansion coefficient; and ν is the kinematic viscosity, ν = μ/ρ.
In this paper, g equaled 3.62 m/s2, which was the acceleration of gravity on Mars’ surface. ΔT were 20 K, 30 K, 40 K, 50 K, 60 K, 70 K, and 80 K. respectively. The enclosure thickness range was 5 mm ≤ H ≤ 180 mm. The Grashof number was calculated as 430 ≤ Gr ≤ 2.6 × 10⁴, indicating Gr × Pr < 106 and merely laminar natural convection in the enclosure.
2.3. Grid Sensitivity
The grid density may have a huge influence on the results of the fluid flow and heat transfer; therefore, grid sensitivity analysis was conducted. Typical thicknesses of the horizontal and vertical enclosures were selected to conduct the grid sensitivity tests with pressures of 1000 Pa and gravity accelerations of 3.62 m/s2. The detailed parameters of the six enclosures are shown in Table 1.
Uniform grids were generated on these six enclosures according to the following three different methods because of the laminar flow in the enclosure: uniform distribution of grids with unit-grid length of 1.5 mm in the directions of length and thickness (Manner a); uniform distribution of grids with unit-grid length of 1.0 mm in the directions of length and thickness (Manner b); and uniform distribution of grids with unit-grid length of 0.8 mm in the directions of length and thickness (Manner c). The results of the heat flux and maximum velocity obtained by CFD simulation are shown in Table 1.
The results were as follows: (1) For the relatively thin enclosures, such as enclosures 1 and 4 with thickness of 10 mm, the above three different grid structures basically caused the same results for heat flux and maximum velocity; (2) For enclosures 2 and 5 with thickness of 100 mm, the values of heat flux and maximum velocity were the same when based on the grid generated in Manner b and Manner c, whereas the values were lower when based on the grid generated in Manner a; (3) For enclosures 3 and 6 with thickness of 150 mm, the heat flux and maximum velocity were the same when based on the grid generated in Manner b and Manner c, while the iteration diverged when based on the grid generated in Manner a.
Other cases with different aspect ratio and temperature differences were also examined. For both the horizontal and vertical enclosures, with increasing enclosure thickness, the deviations between the heat flux and maximum velocity results based on the grid generated in Manner a and that in Manner b became greater and greater, while there was no difference between the results based on the grid generated in Manner b and that in Manner c. However, the grid in Manner c had more meshes than that in Manner b. This meant that the calculations with the grid in Manner c would consume more computation of memory and time. Thus, the grid generated in Manner b not only guarantees the precision of the calculation, but also controls the number of grids, saving calculation time.
3. Comparison and Validation with Experiments
As mentioned in the introduction, it was difficult to find previous studies about the heat transfer inside CO2 enclosures on Mars’ surface. The most similar experimental study was conducted by Bhandari et al. [27]. In order to find the critical thickness for the cylinder enclosures of the Mars rover, they investigated natural convection in a horizontal CO2 cylinder enclosure under low pressure of 1066 Pa and gravitational acceleration of 9.8 m/s2. The temperature of the enclosure’s upper surface was 200 K and the temperature of the surrounding and lower surface was 240 K. The heat transfer fluid, temperature, and pressure in their paper were all in accordance with the parameters on Mars’ surface. The same horizontal cylinder enclosure that was used in that study [27] was selected for comparison purposes in this paper. The diameter of the cylinder was 368.3 mm, remaining constant, and the enclosure thickness was changed to be 38.1 mm, 50.8 mm, 76.2 mm, 101.6 mm, and 127 mm. Figure 2 shows the comparison between our results and the experimental results from the literature [27]. As the thickness of enclosure increased, the changing tendency of the thermal conductance calculated in this paper was in accordance with the experimental results in the literature and possessed great goodness of fit (deviation within 8.5%).
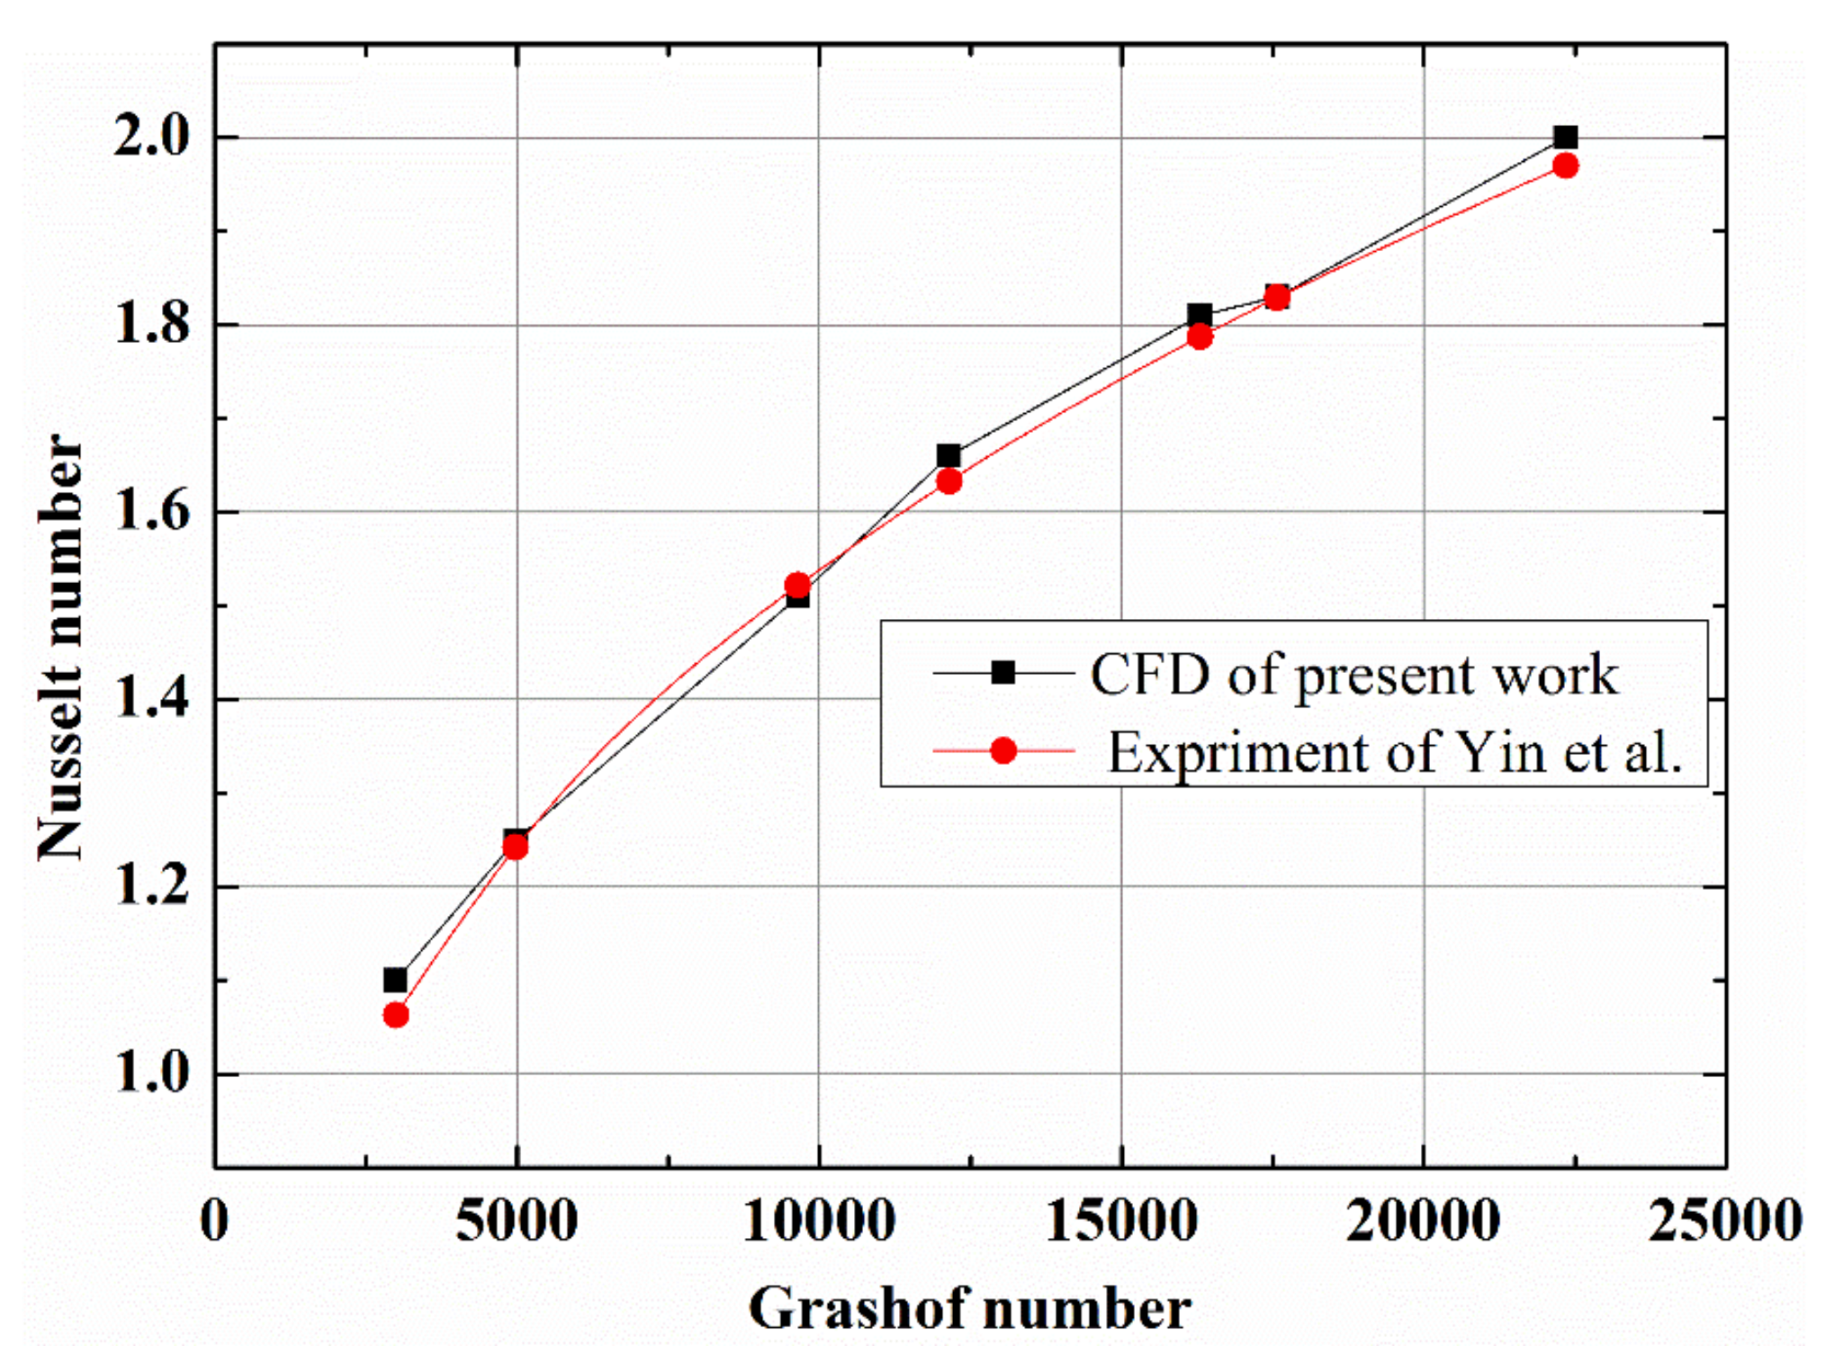
To further validate the numerical simulation in this paper, an experimental study [4] was chosen for comparison purposes as well. The experimental study investigated natural convection in a vertical air enclosure on the Earth’s surface with the Grashof number ranging from 1.5 × 10³ to 1.58 × 10⁹. The heat-transfer apparatus in the literature [4] consisted of two opposite vertical rectangular isothermal plates (1005 mm × 505 mm) and four rectangular insulated walls, which was as same as the enclosure model in our paper as shown in Figure 1b. The cases with the Grashof numbers of 3000, 4980, 9650, 1.215 × 10⁴, 1.63 × 10⁴, 1.758 × 10⁴, and 2.235 × 10⁴ were selected, respectively, from the literature [4] for comparison, because the Grashof number in our paper ranged from 430 to 2.6 × 10⁴ as calculated in Section 2.2. Figure 3 clearly presents the comparison between our CFD results and the experimental results in the literature [4], which showed great agreement (deviation within 2%). Therefore, we concluded that the CFD calculation model and method used in this paper were feasible and accurate.
4. Results and Discussion
4.1. Heat Transfer Characteristics in the Horizontal Enclosures
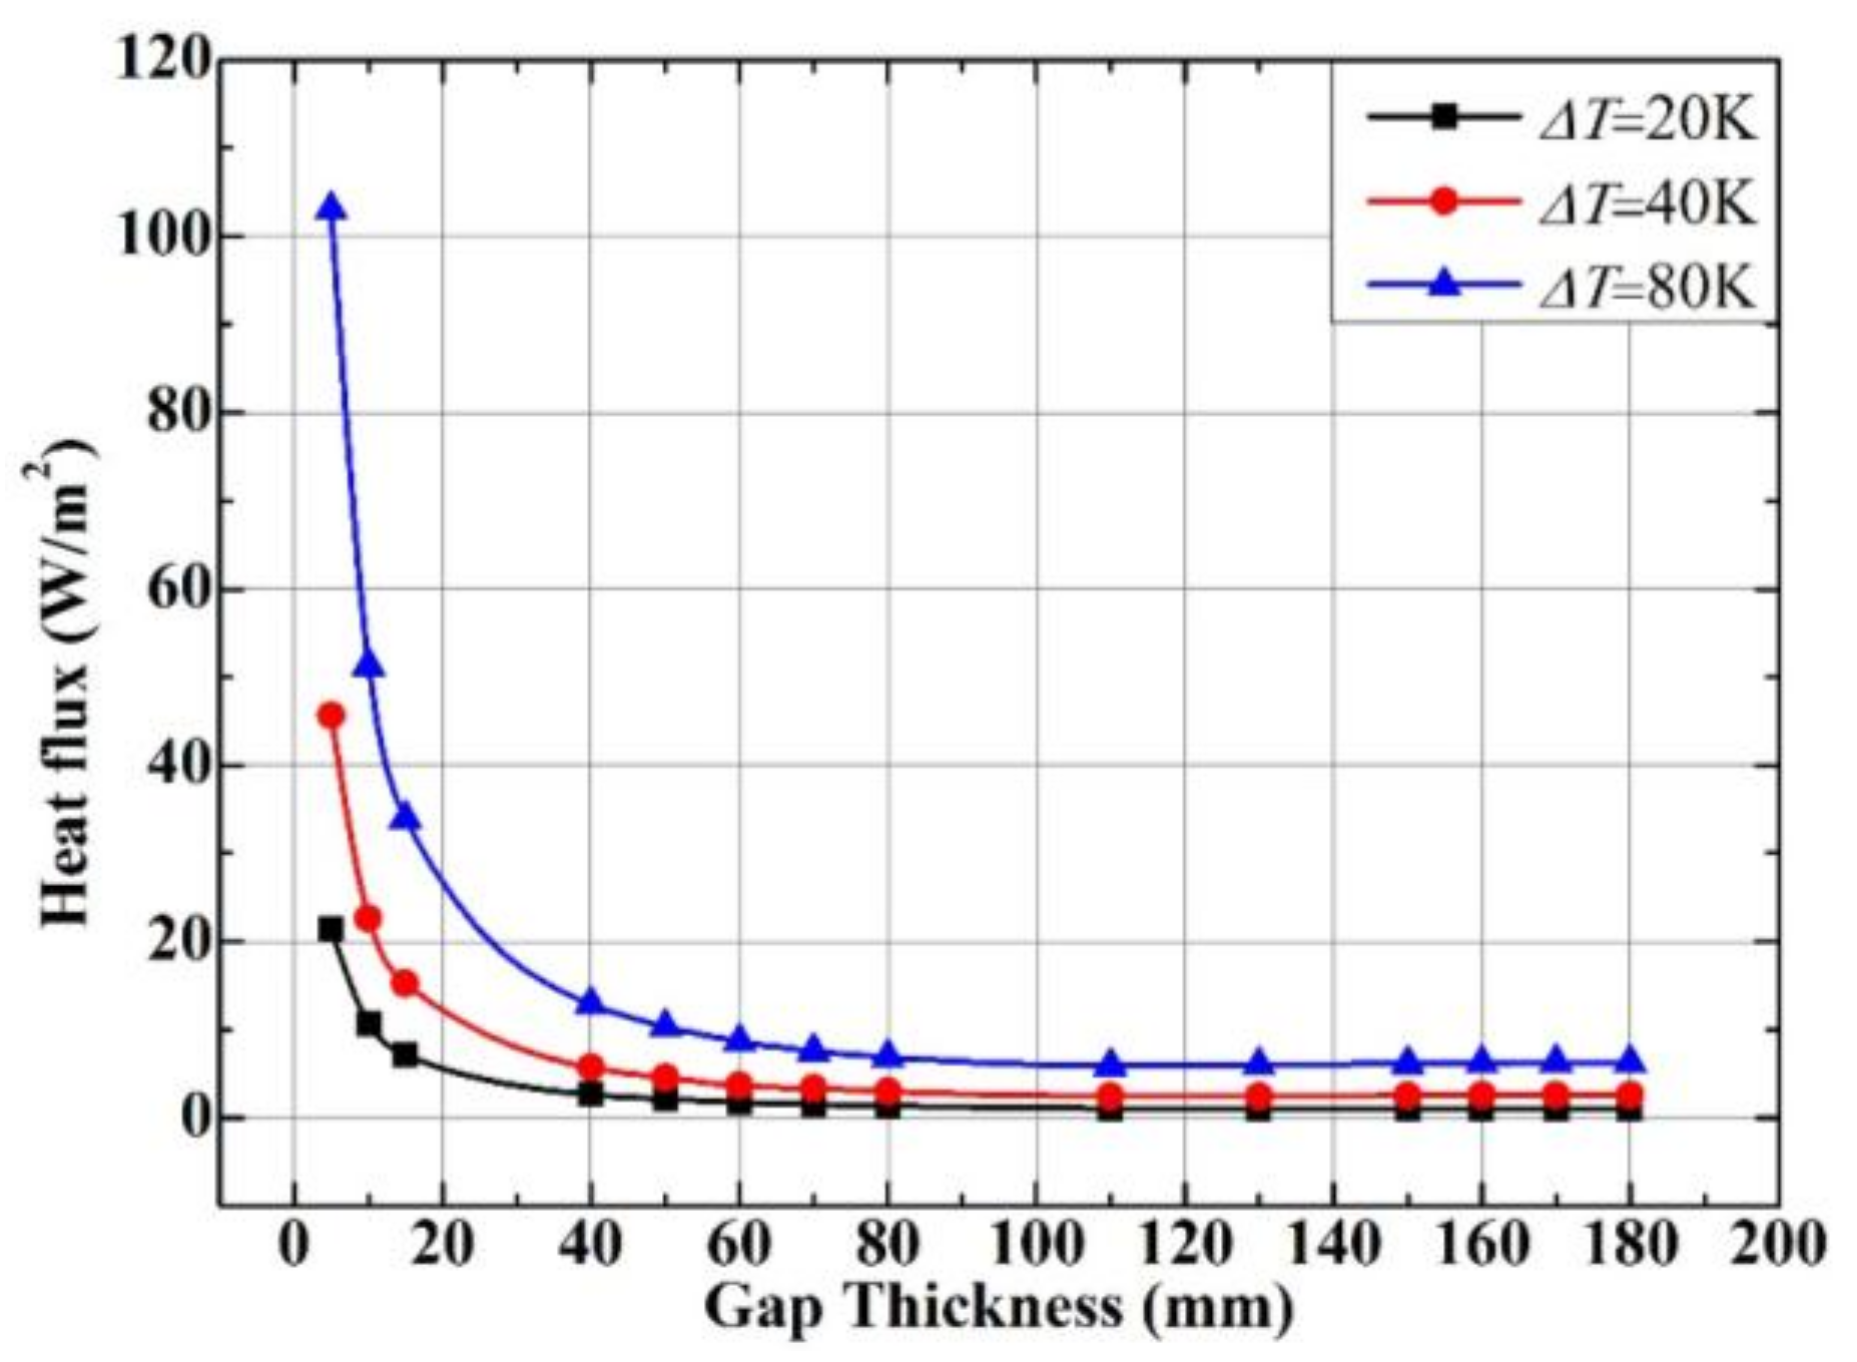
The fluid flow and heat transfer of three horizontal CO2 enclosures with different temperatures differences and different thicknesses (L = 1000 mm, 5 mm ≤ H ≤ 180 mm, 5.56 ≤ AR ≤ 200) were investigated in this section. The three temperature differences were as follows: ΔT = 20 K, Th = 220 K, Tc = 200 K (case 1); ΔT = 40 K, Th = 240 K, Tc = 200 K (case 2); and ΔT = 80 K, Th = 280 K, Tc = 200 K (case 3), respectively.
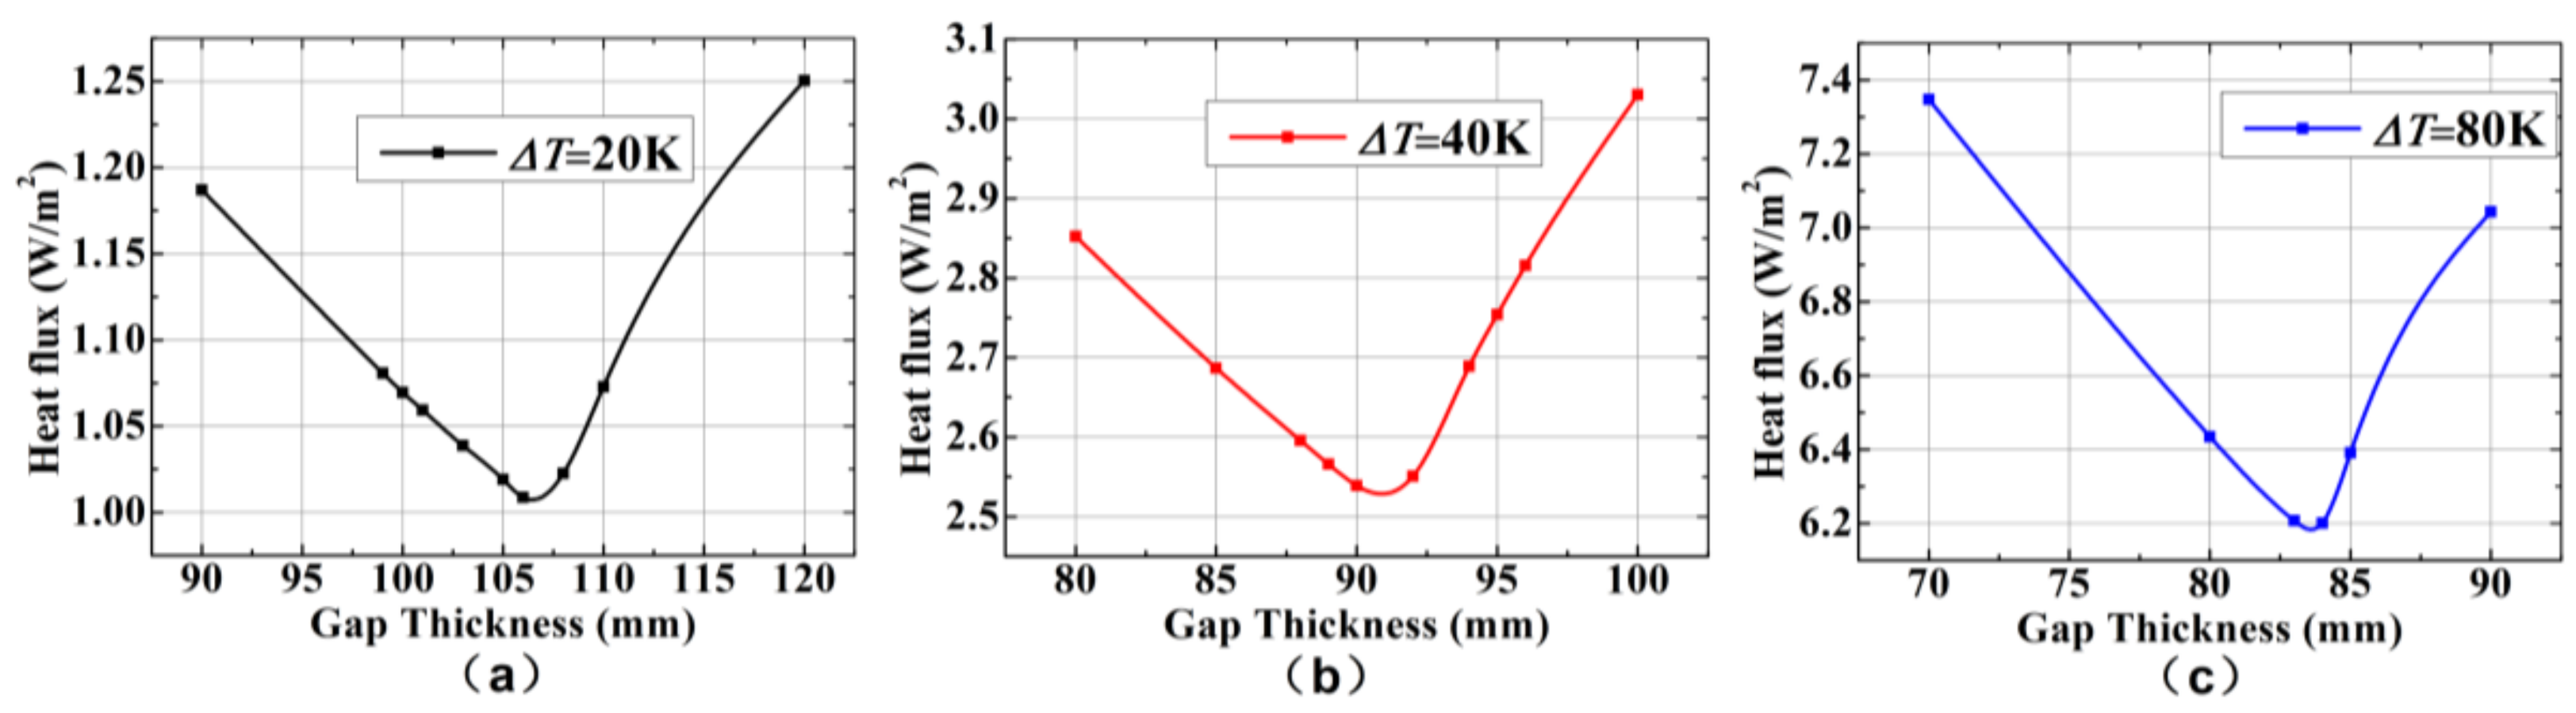
Figure 4 shows the influence of the gap thickness on the heat flux with different ΔT. At first, the heat flux decreased with the increasing enclosure gap thickness. But the heat flux began to increase slowly once the enclosure thickness reached a certain critical thickness as shown in Figure 5. Figure 5 is an enlarged figure showing the variation in the heat flux when the gap thickness was near the critical thickness. A reasonable explanation for this phenomenon is that the heat transfer mode turned to natural convection dominant from pure heat conduction dominant when the enclosure thickness increased to a critical thickness. This could also result in a slight increase of heat flux. The minimum heat flux through the horizontal CO2 enclosures with the three temperature differences and the corresponding critical enclosure thicknesses were as follows: in case 1, qmin,hor = 1 W/m2, Hcrit,hor = 107 mm; in case 2, qmin,hor = 2.51 W/m2, Hcrit,hor = 91 mm; and in case 3, qmin,hor = 6.2 W/m2, Hcrit,hor = 84 mm. Thus, the critical enclosure thickness Hcrit,hor decreased with the increasing temperature difference ΔT, which indicated that the larger the temperature difference, the more likely the natural convection phenomenon was to occur in the enclosure.
The mean value of the critical Grashof number for the horizontal CO2 enclosure was obtained based on the results of the critical enclosure thickness, Gr*hor,co2 = 2625. The average critical Grashof number can be used to conveniently obtain the critical thickness of the horizontal enclosure under other temperature differences on Mars’ surface.
4.2. Heat Transfer Mechanism Analysis in the Horizontal Enclosures
Taking the CO2 enclosure with ΔT = 40 K as an example in this section, the fluid flow and heat transfer characteristics in the horizontal enclosure under different gap thicknesses were analyzed.
When the enclosure thickness was 40 mm, it was observed from the velocity contour in Figure 6a that there was no formation of the high-speed Rayleigh–Bénard convection. The fluid velocity was in the range of 2 × 10⁻¹⁶ to 3.4 × 10⁻¹⁵ m/s, close to zero, because the viscous force was more intense than the buoyancy force with the low Grashof number of 220. From the temperature field in Figure 6a, it was found that temperature changed, stratified, and conformed to the temperature distribution rules of pure heat conduction. Figure 7a shows the variation in temperature with vertical distance (y) at different relative positions in this enclosure x/L = 0.2, x/L = 0.5, and x/L = 0.8. It was observed that there was a linear function relationship between the temperature and the vertical distance, which was the same as that in the pure heat conduction.
When the gap thickness increased to 80 mm, it was observed from Figure 6b that there was partial annular flow forming in the central part of the enclosure. This meant that the CO2 in the enclosure started rising from the high-temperature surface and declining from the low-temperature surface, tending to form a Rayleigh–Bénard convection in the center. Yet the change in velocity was relatively small—only from 2 × 10⁻¹³ to 3.8 × 10⁻¹² m/s. From the temperature contour in Figure 6b, it was observed that the temperature distribution in the enclosure with the thickness of 80 mm was similar to that in the enclosure with the thickness of 40 mm. Also, from Figure 7b, it was observed that there was a linear function relationship between the temperature and the vertical distance, which indicated that the mode of heat transfer was still pure heat conduction dominant at that condition.
As the enclosure thickness increased to 100 mm, as shown in the velocity contour in Figure 6c, a high-speed Rayleigh–Bénard convection had completely formed in the enclosure. The gas velocity, ranging from 0.002 to 0.042 m/s, was far greater than that in the enclosures with 40 mm and 80 mm thickness because the Grashof number was larger than 2625, which led to the domination of the buoyancy force in the enclosure. From the temperature contour in Figure 6c, it was observed that the phenomena of high-temperature gas rising and low-temperature gas descending occurred in the enclosure, which could be understood as the heat transfer transition from pure heat conduction to natural convection. Hot gas rose at the position of x/L = 0, 1/6, 1/3, 1/2, 2/3, 5/6, and 1. Cool gas descended at the position of x/L = 1/12, 1/4, 5/12, 7/12, 3/4, and 11/12. As the fluid moved, it promoted heat transfer. As shown in Figure 7c, at the x/L = 0.5 position, where hot gas rose, the temperature gradient near the low-temperature wall surface was higher than that near the high-temperature wall surface; whereas, at the x/L = 0.25 position, where cold gas descended, the opposite phenomenon was observed. The main reason for this phenomenon is that in the process of forming an annular cell, with hot gas rising and cool gas descending, the hot and cool gases were blocked by the wall surface. This led to the acceleration of the velocity variation and further increased the temperature gradient.
When enclosure thickness reached 130 mm, it could be observed from the velocity contour in Figure 6d that the phenomenon of the Rayleigh–Bénard convection was more noticeable with a much larger gas velocity in the range of 0.005 to 0.08 m/s. As presented in Figure 6d, the hot gas rose at the position of x/L = 1/8, 3/8, 5/8, and 7/8. The cool gas descended at the position of x/L = 0, 1/4, 1/2, 3/4, and 1. These changes were much more obvious than those in the enclosure with 100 mm thickness. As shown in Figure 7d, the temperature variations at the x/L = 0.375 position, where hot gas rose, and at the x/L = 0.25 position, where cold gas descended, were similar to those at certain positions in the enclosure with 100 mm thickness. Moreover, the temperature gradient of the flow confronting the wall was greater than that in the enclosure with 100 mm thickness. The above results indicated that the degree of natural convection in the enclosure with 130 mm thickness was far more intense than that in the enclosure with 100 mm thickness.
From the comparison of the results of Figure 6a–d, we concluded that when the enclosure temperature difference and length remained constant, the larger the enclosure thickness, the stronger the convection in the enclosure. The Rayleigh–Bénard convection formed with the conversion of the heat transfer mode from heat conduction dominant to natural convection dominant.
4.3. Heat Transfer Characteristics in the Vertical Enclosure
The simulation of fluid flow and heat transfer was conducted in vertical CO2 enclosures under varying temperature differences and different enclosure thicknesses (L = 1000 mm, 5 mm ≤ H ≤ 180 mm, 5.56 ≤ AR ≤ 200). The flow and heat transfer characteristics in the vertical enclosure of three cases were analyzed in this section, which were as follows: ΔT = 20 K, Th = 220 K, Tc = 200 K (case 4); ΔT = 40 K, Th = 240 K, Tc = 200 K (case 5); and = ΔT = 80 K, Th = 280 K, Tc = 200 K (case 6).
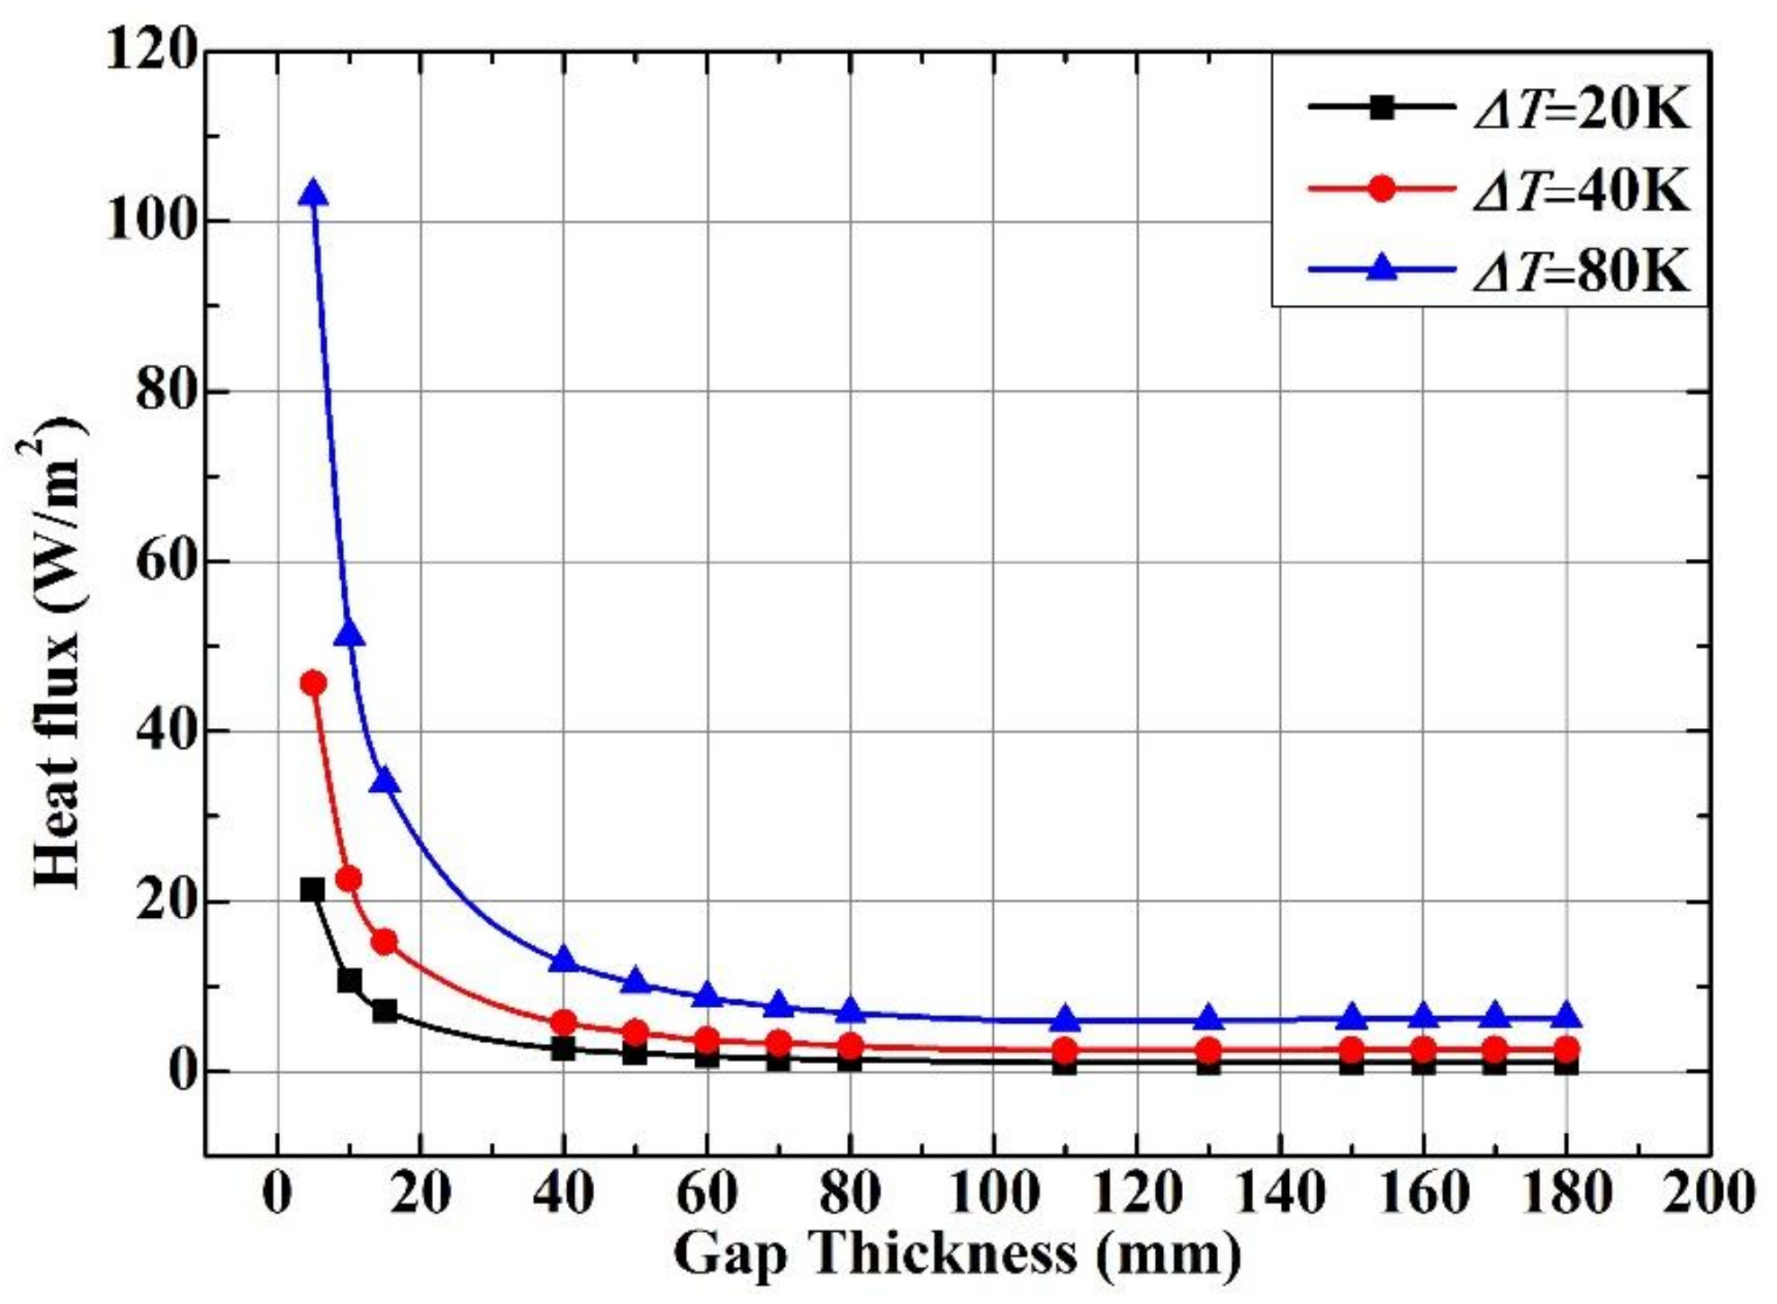
Figure 8 is the variation in heat flux with the increase in the vertical enclosure thickness. It was observed that the heat flux through the vertical enclosure decreased as the enclosure thickness increased, which was similar to that through the horizontal enclosure. When the enclosure gap thickness reached a certain critical thickness, the heat flux started rising slowly, as shown in Figure 9. This meant that the heat transfer turned to natural convection dominant from pure heat conduction dominant. The minimum heat flux through the vertical CO2 enclosures under the three temperature differences and the corresponding critical enclosure thicknesses were as follows: for case 4, qmin,ver = 1.03 W/m2, Hcrit,ver = 135 mm; for) case 5, qmin,ver = 2.46 W/m2, Hcrit,ver = 121 mm; and for case 6, qmin,ver = 5.94 W/m2, Hcrit,ver = 114 mm.
The mean value of the critical Grashof number for the vertical CO2 enclosure was obtained based on the results of the critical enclosure thickness, Gr*ver,co2 = 6006. It can be used to obtain the critical thickness of the vertical enclosure under other temperature differences on Mars’ surface.
4.4. Heat Transfer Mechanism in the Vertical Enclosures
Taking the vertical CO2 enclosure with ΔT = 40 K as an example in this section, the fluid flow and heat transfer characteristics in the vertical enclosure under different thicknesses were analyzed.
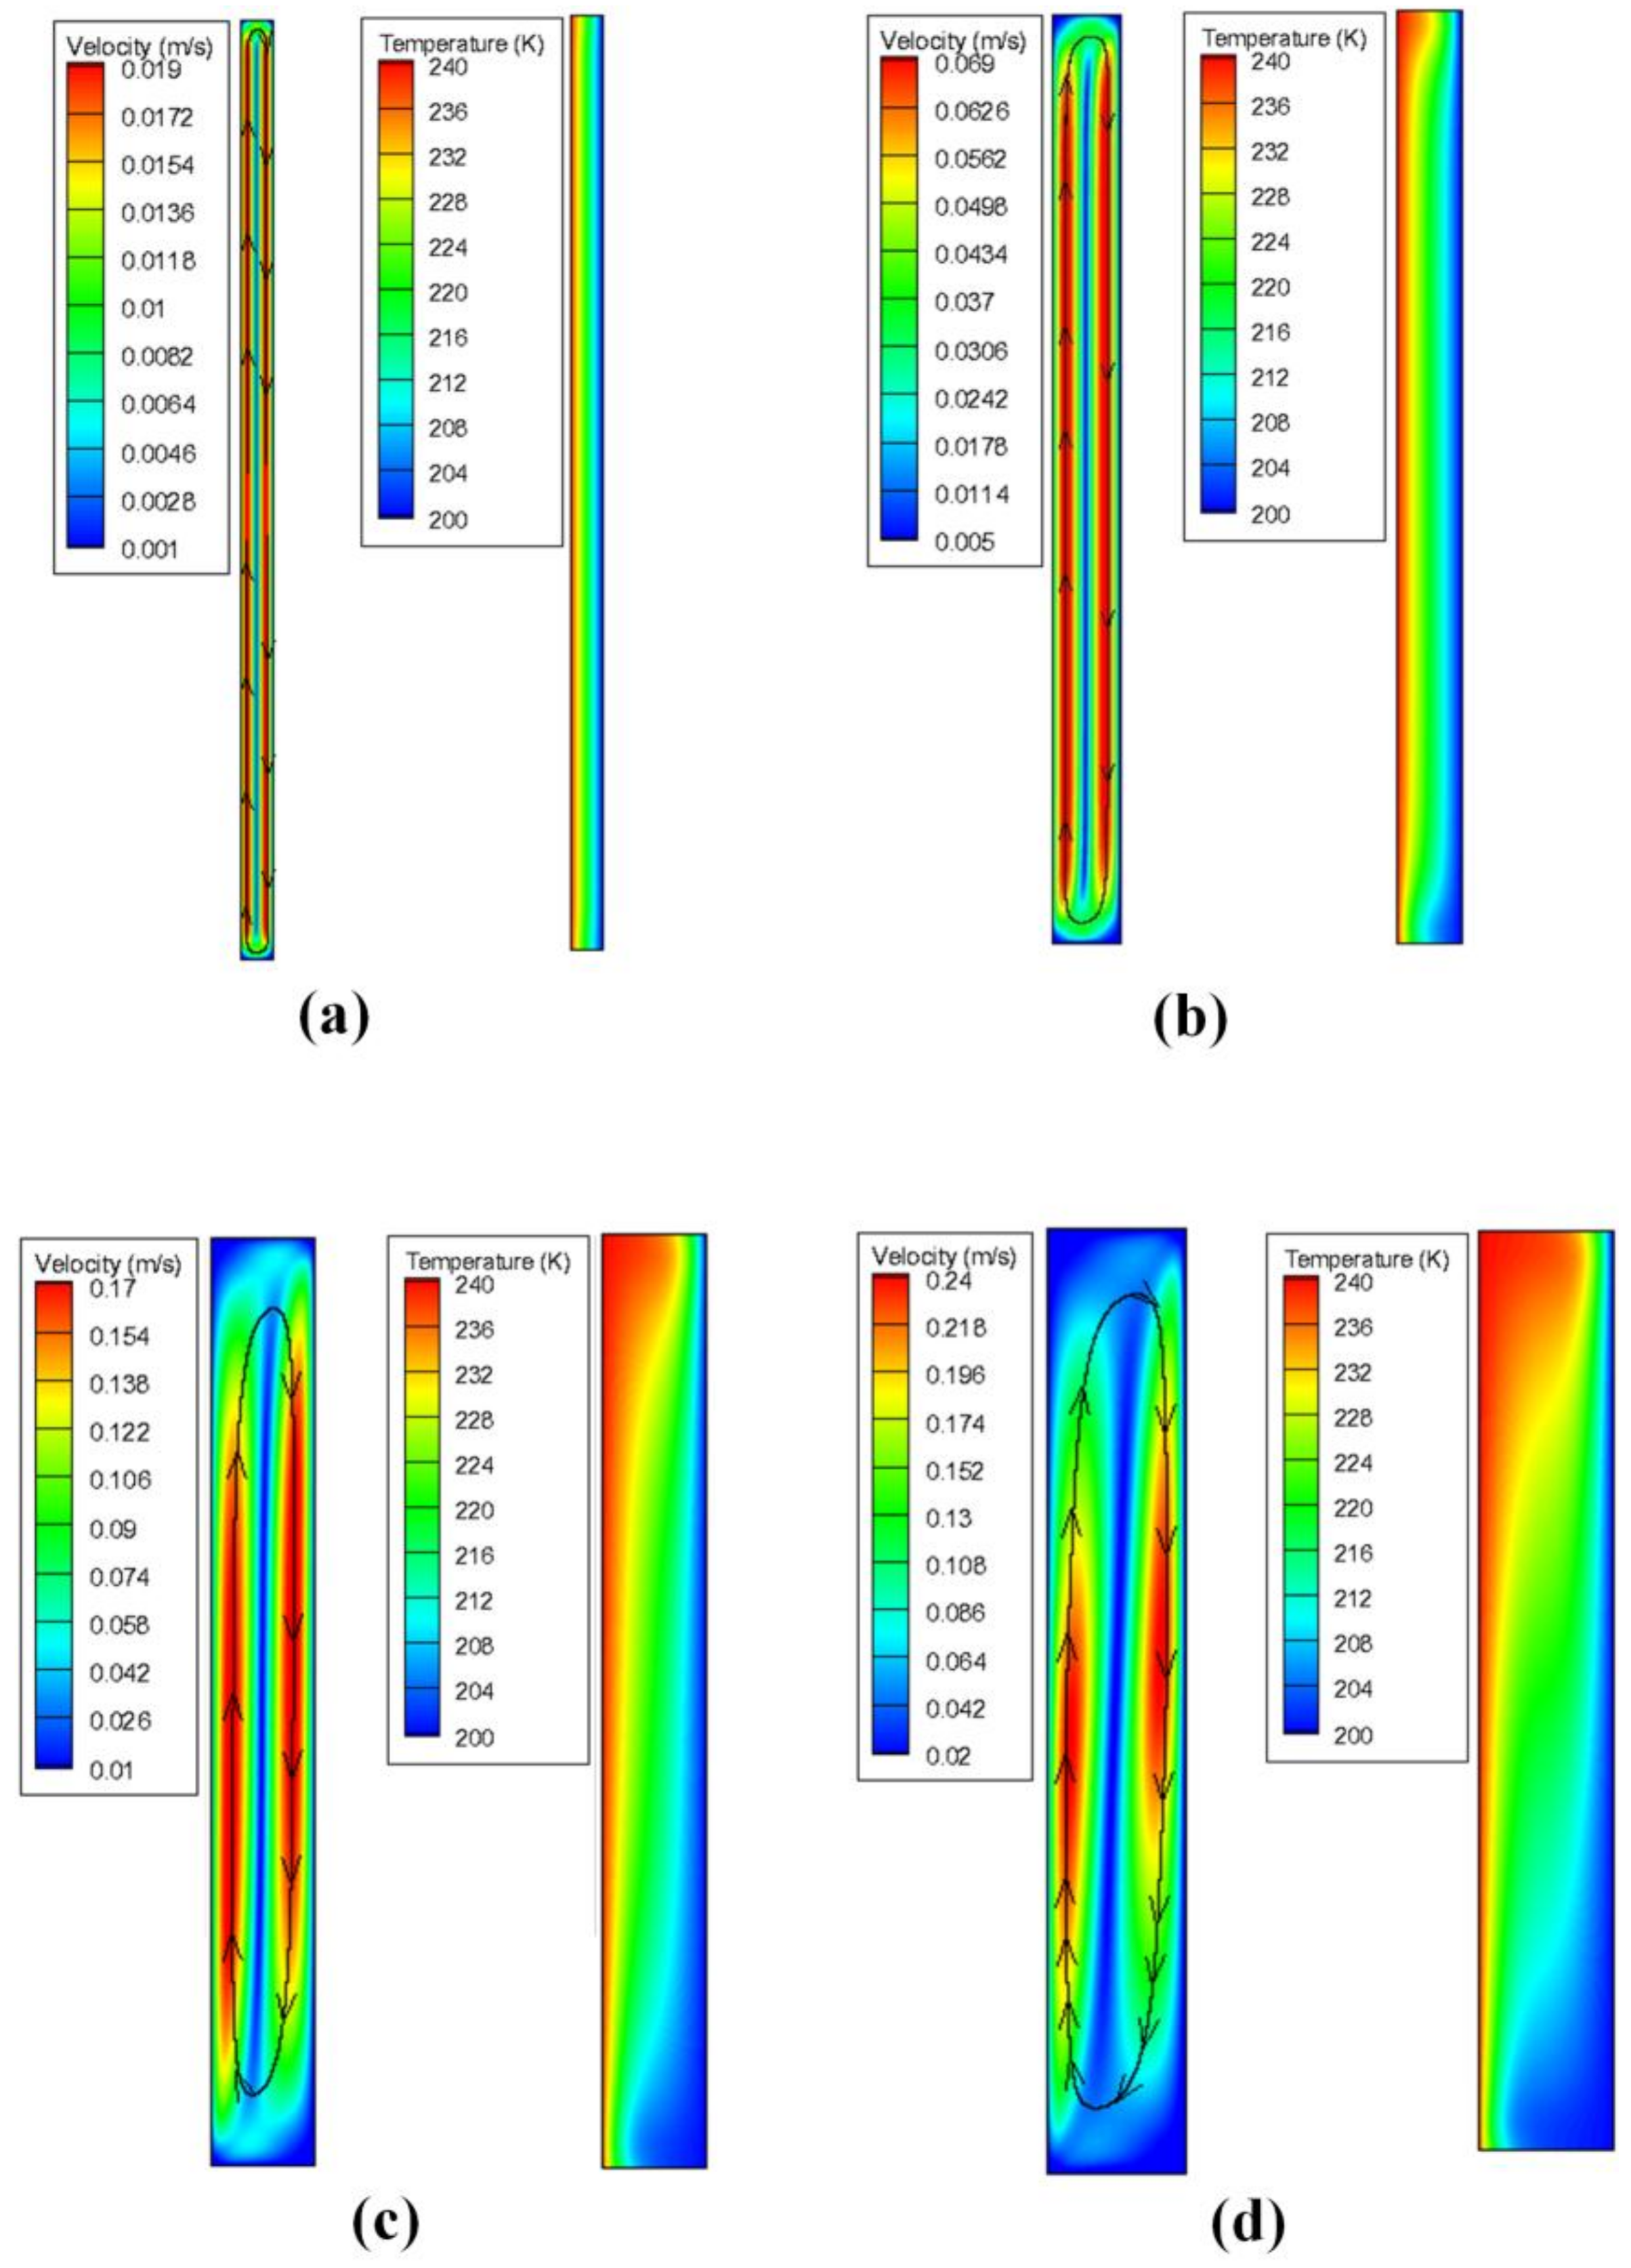
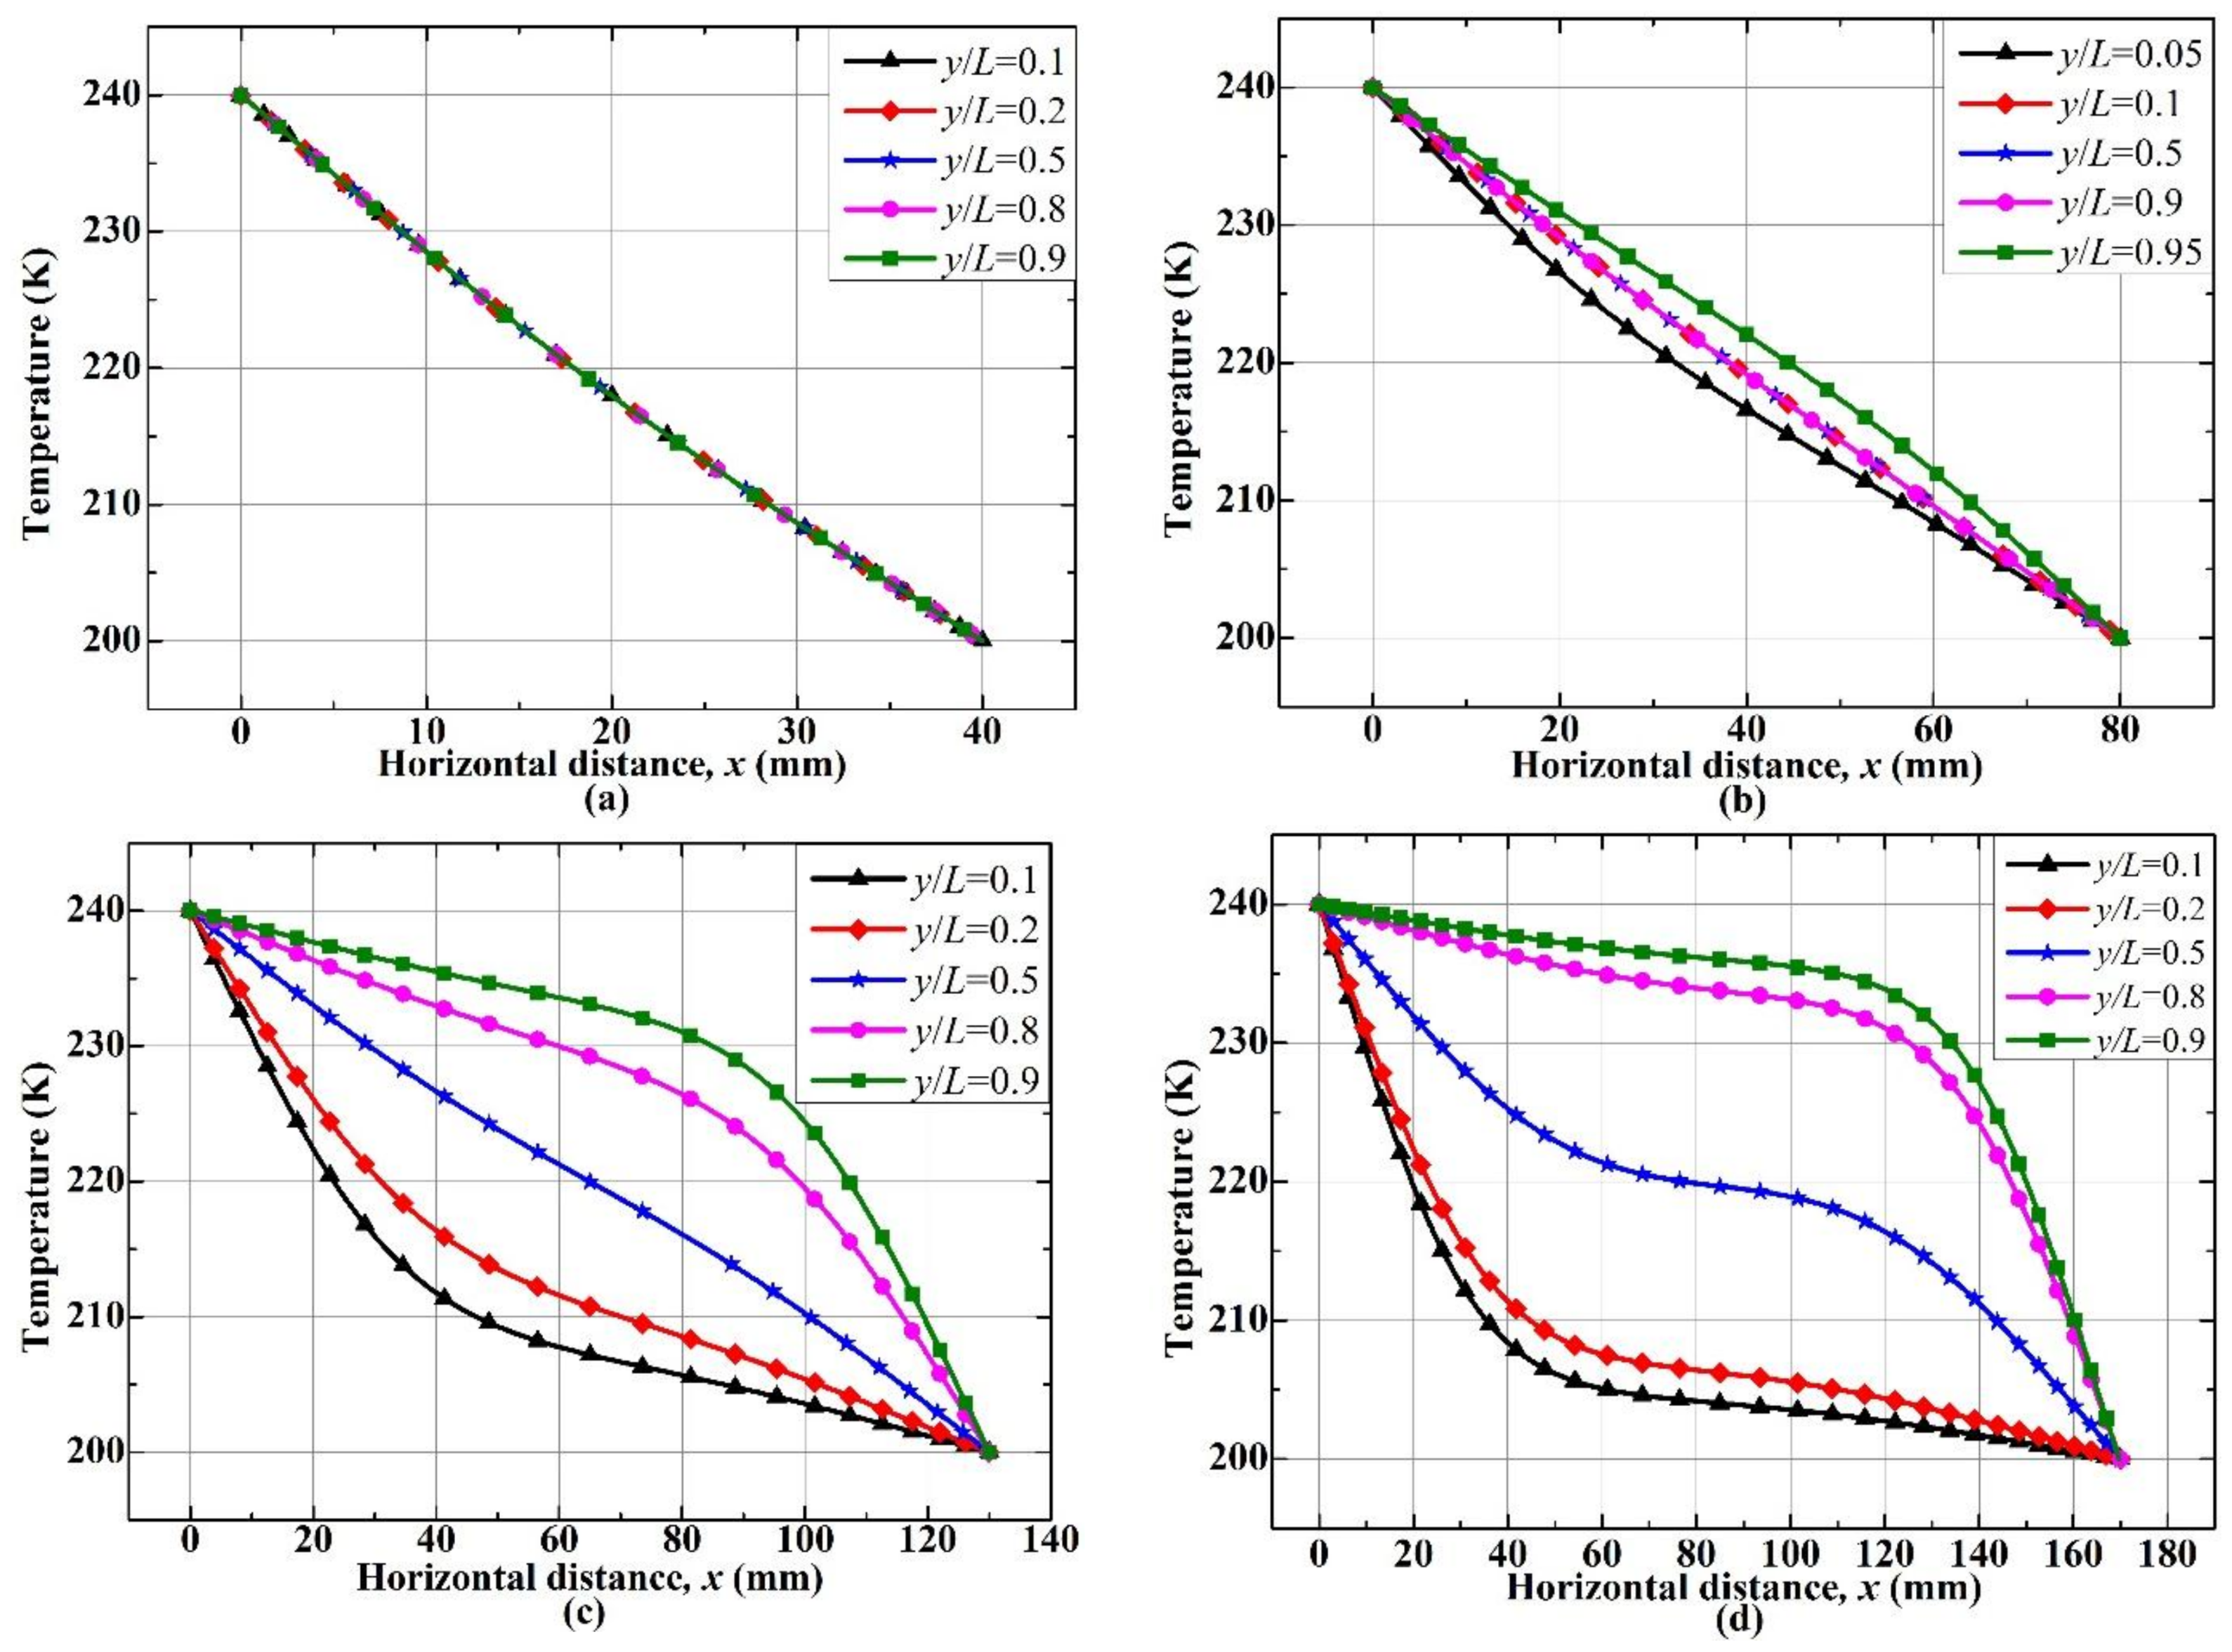
When the gap thickness was 40 mm, it was observed from the velocity field in Figure 10a that the high-temperature wall enabled the CO2 to be heated and to expand further, attaining a rising velocity. The low-temperature wall enabled the gas to cool down and compress, obtaining a falling velocity. However, when the fluid approached the top and bottom wall, with the influence of the adiabatic wall, its velocity was far less than that near the left and right sides of enclosure. Therefore, it could not form a circulating high-speed single-cell convection. The velocity was in the range of 0.001 m/s to 0.019 m/s because the viscous force was more intense than the buoyancy force with a low Grashof number of 220. It was found from the temperature field in Figure 10a that the temperature stratified and conformed according to the temperature distribution rules of pure heat conduction. Figure 11a shows the variation in temperature with the horizontal distance (x) at relative positions of y/L = 0.1, y/L = 0.2, y/L = 0.5, y/L = 0.8, and y/L = 0.9. It was found that there was a linear function relationship between the temperature and the horizontal distance, the same as that of the pure heat conduction.
When the gap thickness increased to 80 mm, it was observed from the velocity field in Figure 10b that the velocity distribution had few differences from that in the enclosure with 40 mm thickness, merely with the gas flow velocity increasing to the range of 0.005 m/s to 0.069 m/s. From the temperature field in Figure 10b, it was found that the gas temperature changed unevenly near the top and bottom adiabatic boundaries, yet the temperatures of most other locations still stratified in x direction. Figure 11b indicated that at the positions of y/L = 0.1, y/L = 0.5, and y/L = 0.9, there was a linear function relationship between the gas temperature and the horizontal distance, which was the same as that of the pure heat conduction. However, at the positions of y/L = 0.05 and y/L = 0.95 near the top and bottom walls, there was no linear function relationship between the fluid temperature and the horizontal distance. This meant that the natural convection occurred in this little corner area. Nevertheless, this non-linear area was extremely small and could be essentially be ignored regarding the heat transfer. In this case, the mode of heat transfer was still considered pure heat conduction dominant.
When the gap thickness increased to 130 mm, it was found from the velocity field in Figure 10c that there were still no obvious changes in the velocity distribution compared to that in the enclosure with 80 mm thickness, yet the velocity had risen to the range of 0.01 m/s to 0.17 m/s. From the temperature field in Figure 10c, it was found that the distribution of the temperatures in the enclosure was not in layered structure, with more space in the upper enclosure for a high-temperature region and more space in the lower enclosure for a low-temperature region. This occurred because that at that moment, the Grashof number was 6035, larger than 6006, which led to the domination of the buoyancy force in the enclosure. Thus, the heat transfer mode transitioned from pure heat conduction dominant to natural convection dominant. Figure 11c shows the variations in temperature with the horizontal distance at the relative positions of y/L = 0.1, y/L = 0.2, y/L = 0.5, y/L = 0.8, and y/L = 0.9. It was observed that the closer it was to the bottom and top of enclosure (y/L = 0.1 and y/L = 0.9, for example), the larger the degree of steepness near the side wall, indicating the cellular patterns had formed and the heat transfer rate had been enhanced. The variation in the temperature at the position of y/L = 0.5, at the vertical center of the enclosure, presented an approximately linear function. It was believed that the heat transfer mode dominating the central area remained heat conduction, yet this area was essentially too small to evaluate fully.
When gap thickness increased to 170 mm, as shown in velocity field of Figure 10d, the CO2 velocity in the enclosure rose to the range of 0.02 m/s to 0.24 m/s. It was observed from the temperature field in Figure 10d that the temperature distribution in the enclosure deviated more from the status of pure heat conduction. An extremely thin, hot gas layer formed near the hot-temperature wall in the bottom half of the enclosure, and an extremely thin cold gas layer formed near the cold-temperature wall in the top half of the enclosure. The natural convection heat transfer was further strengthened. It was found from Figure 11d that a non-linear temperature distribution appeared throughout the entire enclosure, which indicated that convection was developing in the core area. It should be noted that there were small sections near the middle of the curves where the temperature gradient nearly equaled zero. This was because single-cell convection dominated the heat transfer, leading the heat transfer to be influenced mainly by the moving flow in the boundary layer near the walls. Thus, the heat transfer through the core of the enclosure was negligible. This was also confirmed by the observations of Ganguli [8].
From the comparison of the temperature fields results in Figure 10, we concluded that when the enclosure temperature difference and length remained constant, the thicker the enclosure, the stronger the convection in the enclosure. The mode of heat transfer also converted from pure heat conduction to natural convection, but remained single-cell convection in this paper. However, the formation of Rayleigh–Bénard convections (multiple-cells convections) inside vertical enclosures could be found in the literature [8] and [24]. This occurred because the effect of gravity and kinematic viscosity on the fluid flow was very noticeable in the vertical enclosure because of the large distance of gravity and viscous force action. As a result, it was easier to form the Rayleigh–Bénard convection on Earth where the gravity acceleration is greater and the kinematic viscosity is much smaller than the equivalents on Mars.
4.5. Comparison between the Horizontal and Vertical Enclosures
Table 2 shows the comparison of the critical thicknesses of the horizontal and vertical enclosures. The critical thickness for the horizontal enclosure was less than that for the vertical enclosure, indicating that the mode of heat transfer in the horizontal enclosure was easier to convert from pure heat conduction to natural convection than that in the vertical enclosure. The buoyancy force was along the hot wall (the long side of the enclosure) in the vertical enclosure, while it was parallel to the adiabatic wall (the short side of the enclosure) in the horizontal enclosure. Therefore, the viscous force could play a larger role in the vertical enclosure, and natural convection was thus more difficult to form in the vertical enclosure than in the horizontal enclosure.
It was observed from Figure 4 and Figure 8 that the heat flux through horizontal enclosure was the same as that through vertical enclosure when the heat transfer mode was thermal conduction, and far more than that through vertical enclosure after the transition to natural convection. In this paper, the maximum percentage of heat flux difference between the horizontal and vertical enclosure reached up to 35.26% when the gap thickness was 180 mm and the temperature difference was 80 K. The principal reason for this phenomenon was the different cell convections forming in horizontal and vertical enclosures. Comparing the velocity fields in Figure 6 and Figure 10, it was found that the Rayleigh–Bénard convection formed in the horizontal enclosure while only single-cell convection formed in the vertical enclosure. For the horizontal enclosure, the direction of gravity was perpendicular to the surface of isothermal wall, making the fluid flow between the two heat transfer surfaces more intense. Therefore, the Rayleigh–Bénard convection was easier to form in the horizontal enclosure. For the vertical enclosure, the direction of gravity was parallel to the surface of the side isothermal wall, resulting in a single-cell flow inside the enclosure. The reason why the Rayleigh–Bénard convection led to a larger heat transfer than the single-cell convection can be further illustrated by the theory of field synergy principle (FSP) [31].
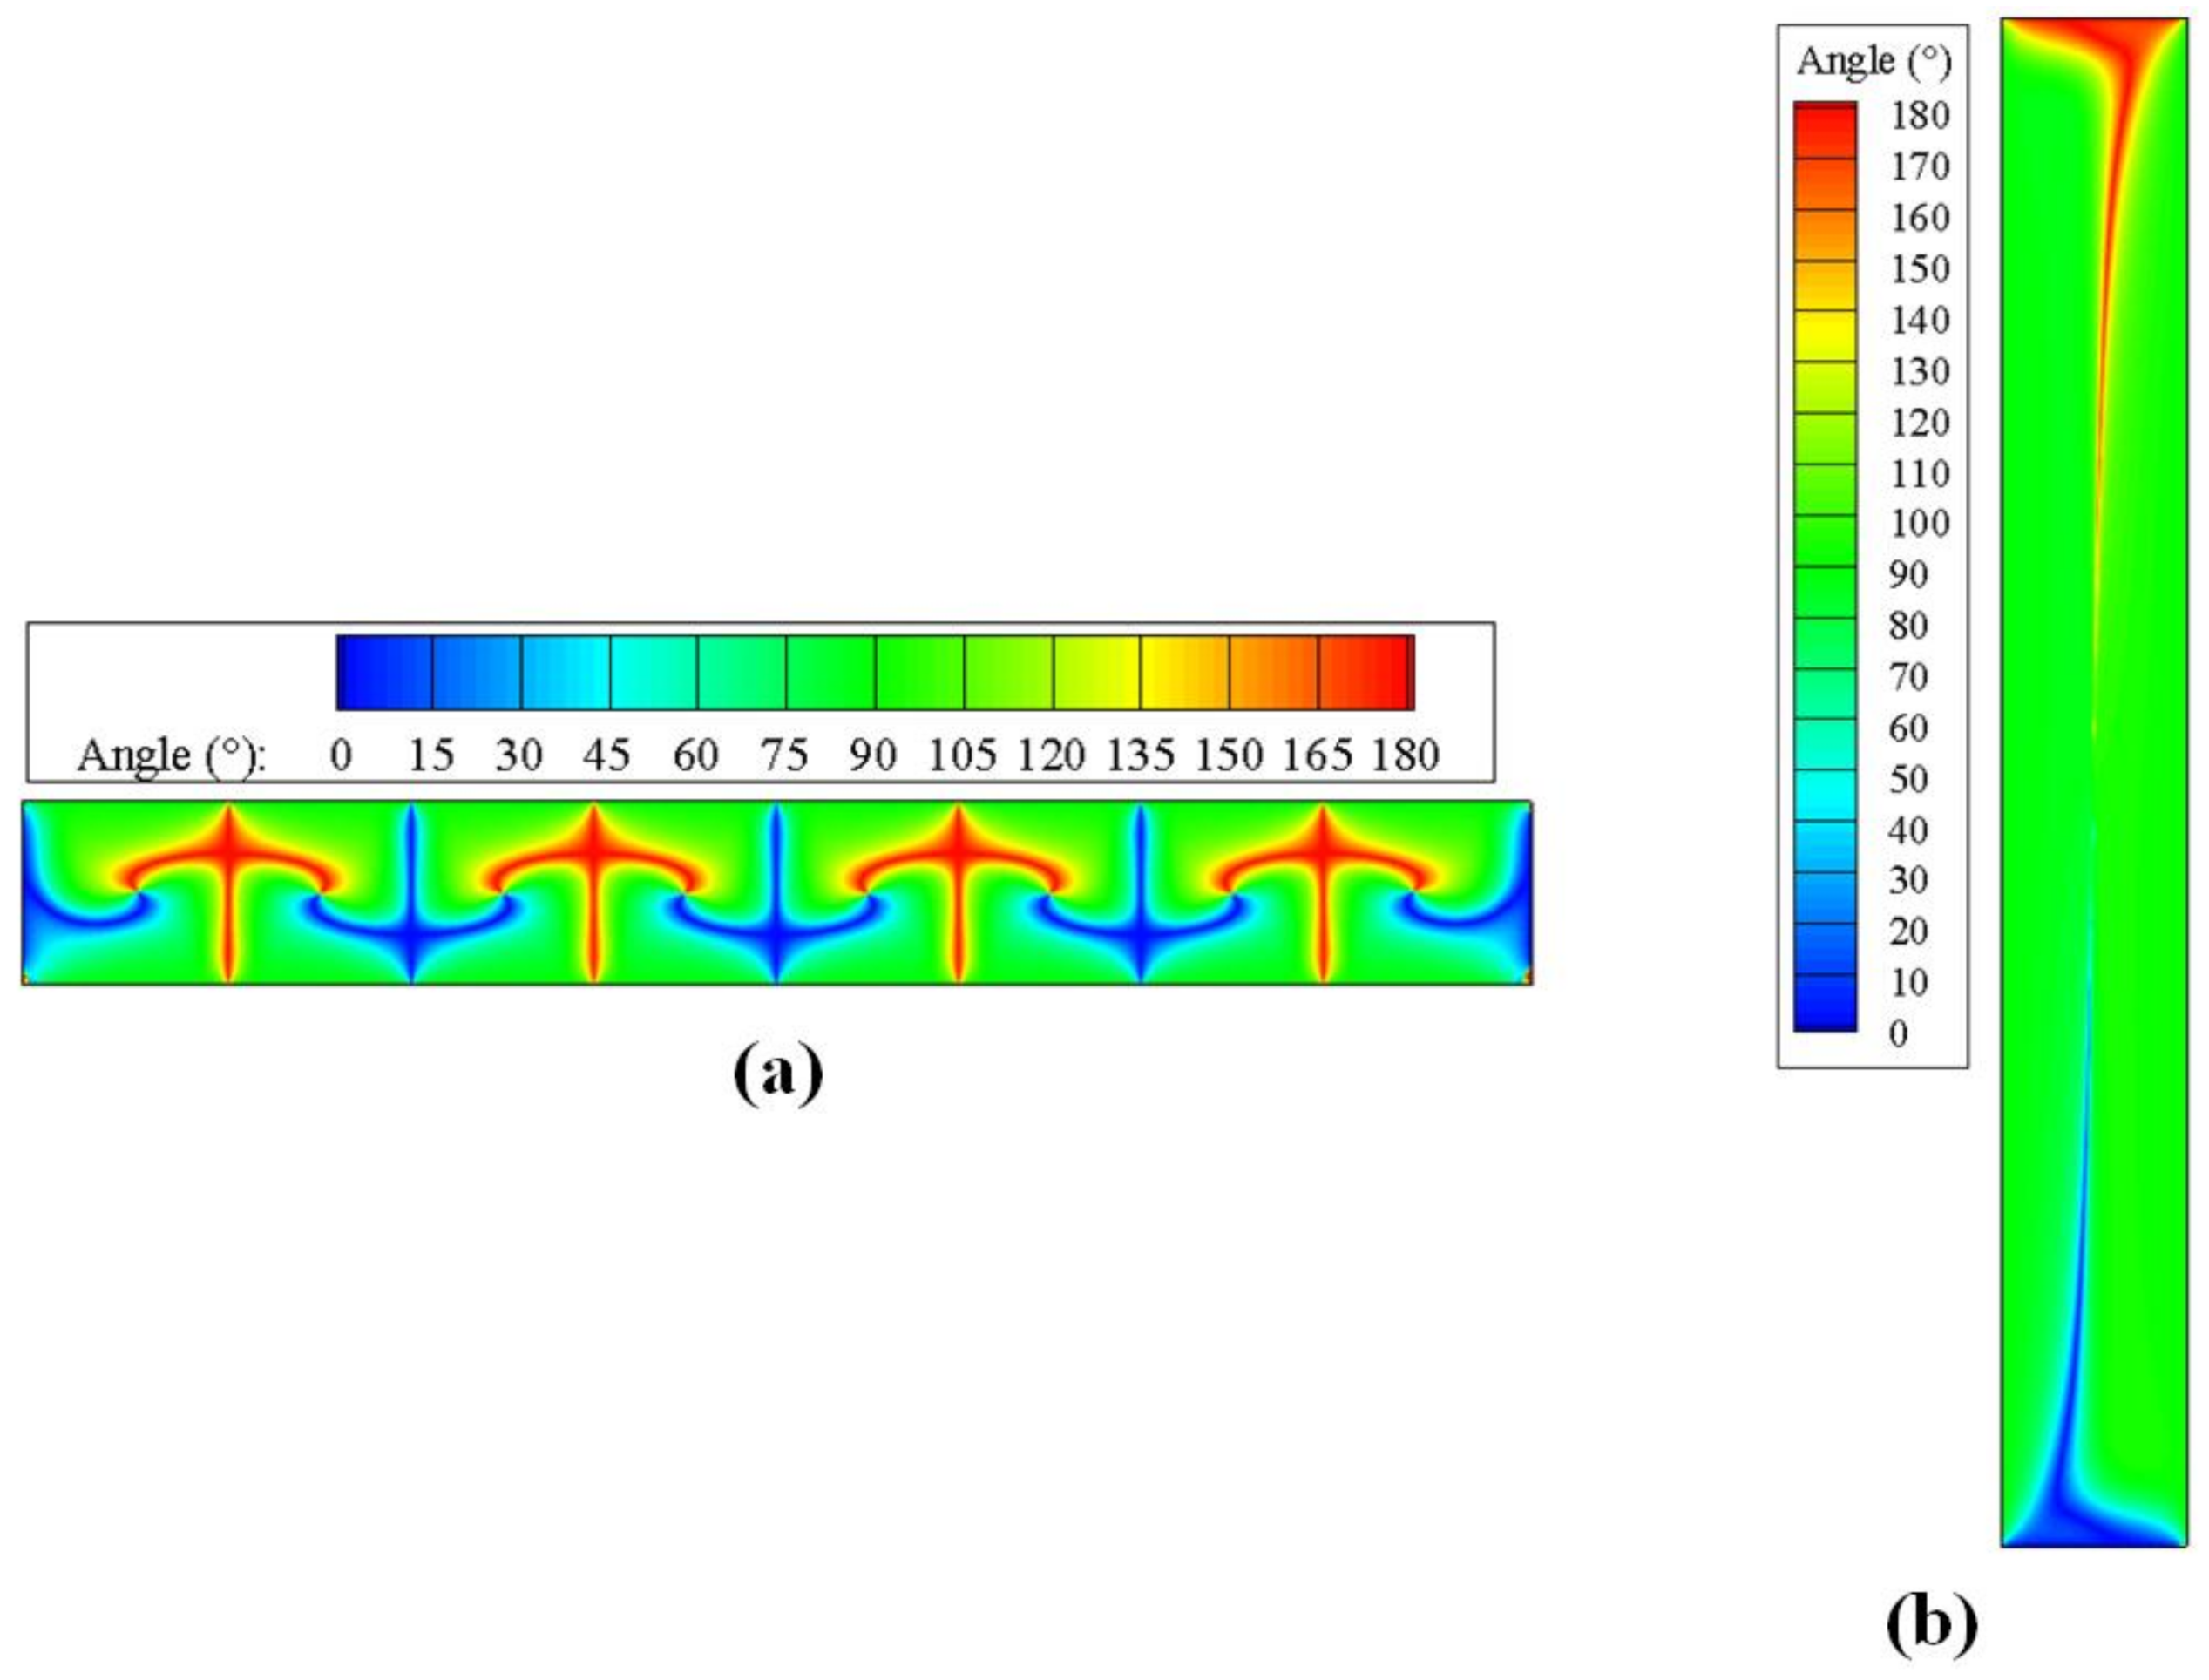
As the theory of field synergy principle [31] states, the closer the intersection angle between the velocity vector and the temperature gradient vector is to 0 and 180 degrees, the more the convective heat transfer can be enhanced. The intersection angle is stated as follows:
where is the velocity vector and is the temperature gradient vector.
Comparing the intersection angle fields for the horizontal and vertical enclosures under the same conditions in Figure 12, it was found that there were more regions where the angle between the velocity vector and the temperature gradient vector was closer to 0 or 180 degrees in the horizontal enclosure than in the vertical enclosure. Therefore, heat transfer was enhanced more in the horizontal enclosure.
It is also worth noting that the natural convection was dominant in the heat transfer as soon as it appeared in the horizontal enclosure. However, in the vertical enclosure, when the natural convection dominated the fluid flow the thickness of the enclosure was larger than that when the convection initially appeared in the corner of the enclosure (as shown in Figure 9b and Figure 10b). In other words, there was a hysteresis phenomenon of the natural convection dominating the heat transfer in the vertical enclosure. The reason for this could be that the formation of the natural convective domination was restrained due to the larger viscous force function along the longitudinal walls in the vertical enclosure when the fluid flowed as a single cell. As for the horizontal enclosure, the natural convection appeared in the whole enclosure and dominated the fluid flow without strong restriction by the viscous force as the Rayleigh–Bénard convection appeared.
5. Proposed Correlation Equations
5.1. Correlation of Average Nusselt Number for Horizontal Enclosure
New correlations for the both horizontal and vertical CO2 enclosures on Mars’ surface will be proposed and validated in this section. The definition of the average Nusselt number is given as follows.
where qm is the mean heat flux; H is the enclosure thickness; and k is the thermal conductivity of CO2 at temperature of T0.
The parameters relevant to the horizontal enclosure’s average Nusselt number are the Grashof number, the Prandtl number, and aspect ratio of the enclosure. However, the Pr remains nearly constant at 0.77 in the conditions of this paper. Thus, the function relationship
where the Grashof number is stated as in Equation (10) and aspect ratio is defined as follows:
where L is the length for the horizontal enclosure or the height for vertical enclosure, and H is the enclosure thickness.
In order to ensure that the correlation can be more accurate and more suitable for a wide working condition, more temperature differences (ΔT = 20 K, 30 K, 40 K, 50 K, 60 K, 70 K, and 80 K) and the lengths of the enclosure (L = 1000 mm and 500 mm) were considered in the calculation. Based on the CFD simulation results, the correlation of the average Nusselt number for the horizontal enclosure on Mars’ surface in terms of the Grashof number and the aspect ratio was obtained as follows:
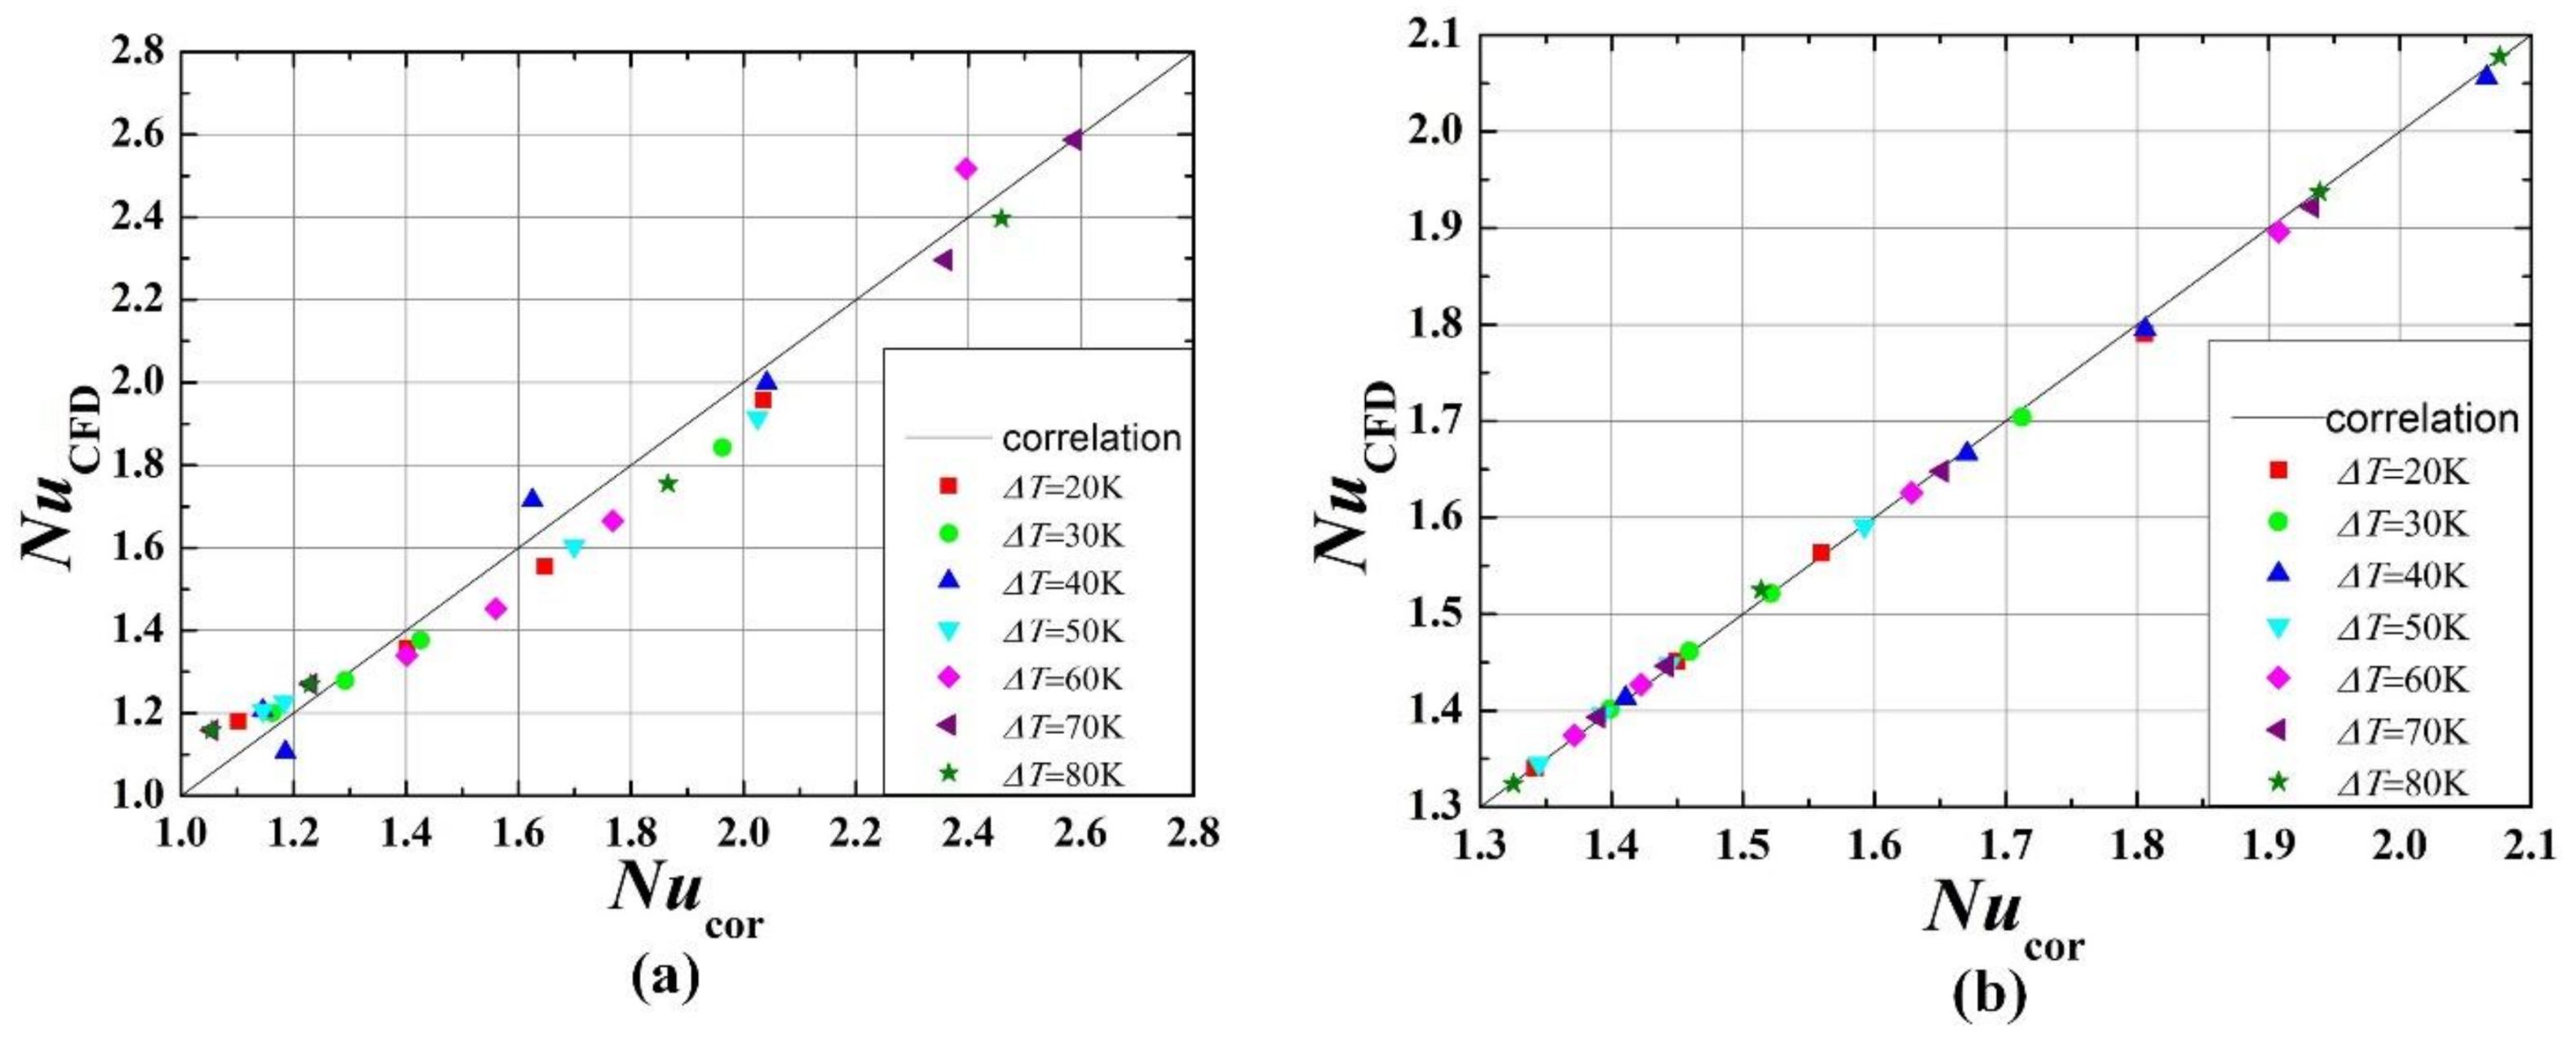
The above correlation is valid for a wide range of parameters under Mars’ surface conditions, (i.e., 20 K ≤ ΔT ≤ 80 K, 5.56 ≤ AR ≤ 200, Gr*hor,co2 ≤ Gr ≤ 2.6 × 10⁴). Gr*hor,co2 = 2625. In order to verify the accuracy of the correlation, more cases of various temperature differences were simulated and compared with the correlation results, as shown in Figure 13a. The results indicated that the difference between the CFD and correlation results was within 5%.
5.2. Correlation of Average Nusselt Number for Vertical Enclosure
Based on the CFD simulation results, the correlation of the average Nusselt number for the vertical enclosure on Mars’ surface, in terms of the Grashof number and the aspect ratio, was obtained as follows:
The above correlation is valid for a wide range of parameters under Mars’ surface conditions, (i.e., 20 K ≤ ΔT ≤ 80 K, 5.56 ≤ AR ≤ 200, Gr*ver,co2 ≤ Gr ≤ 2.6 × 10⁴). Gr*ver,co2 = 6006. The difference between the CFD and the correlation results was within 1%, as shown in Figure 13b.
6. Conclusions
Due to the fact that the natural convection characteristics in the CO2 enclosure is the core issue influencing the thermal insulation configuration of the Mars rover, extensive numerical studies of fluid flow and heat transfer in CO2 enclosure on Mars’ surface were conducted in this work. The parameter ranges in this paper were p = 1000 Pa, g = 3.62 m/s2, 20 K ≤ ΔT ≤80 K, 5.56 ≤ AR ≤ 200, 430 ≤ Gr ≤ 2.6 × 10⁴ and the following main conclusions can be drawn:
- (1)
- For both the horizontal and vertical CO2 enclosures, there was a critical thickness and a corresponding critical Grashof number in accordance with the lowest heat flux. The critical Grashof number of the horizontal CO2 enclosure (Gr*hor,co2) was 2625 and that of the vertical CO2 enclosure (Gr*ver,co2) was 6006.
- (2)
- With increasing gap thickness, the Rayleigh–Bénard convection formed in the horizontal enclosure, while the single-cell convection formed in the vertical enclosure.
- (3)
- For an enclosure under the same circumstances, natural convection was easier to form in the horizontal enclosure than that in vertical enclosure, and the heat flux through the natural convection in the horizontal enclosure was larger. The maximum percentage of the heat flux difference reached up to 35.26%.
- (4)
- There was a hysteresis phenomenon of the natural convection dominating the heat transfer in the vertical enclosure on Mars’ surface.
- (5)
- Based on the numerical data, correlations of the average Nusselt number for both the horizontal and vertical enclosures on Mars’ surface, in terms of aspect ratio and Grashof number, were developed and validated, which were applicable to the following parameter ranges: 20 K ≤ ΔT ≤ 80 K, Gr*co2 ≤ Gr ≤ 2.6 × 10⁴, and 5.56 ≤ AR ≤ 200.
Acknowledgments
This work was supported by the National Natural Science Foundation of China (No. 51776012) and the European Union Marie Curie Actions-International Incoming Fellowships (FP7-PEOPLE-2013-IIF-913576). The authors would like to thank Zuodong Mu for his help with the CFD simulation and Yuandong Guo for his constructive suggestions for the manuscript preparation.
Author Contributions
Yue Sun conceived and designed the study, established the model, conducted the numerical simulation, analyzed the data, and wrote the paper. Guiping Lin, Xueqin Bu, and Lizhan Bai provided theoretical guidance and revised the paper. Dongsheng Wen and Chunhua Xiao helped refine the language. All authors have read and approved the final manuscript.
Conflicts of Interest
The authors declare no conflict of interest.
Nomenclature
| AR | enclosure aspect ratio |
| cp | specific heat capacity (J/kg∙K) |
| Gr | Grashof number |
| Gr* | critical Grashof number |
| g | gravitational acceleration (m/s2) |
| H | thickness of enclosure (mm) |
| Kn | Knudsen number |
| k | thermal conductivity (W/m∙K) |
| L | length of the layer (mm or m) |
| l | characteristic length (m) |
| m | mass (kg) |
| Nu | average Nusselt number |
| Pr | Prandtl number |
| p | pressure (Pa) |
| Q | heat transfer rate (W) |
| q | heat flux (W/m2) |
| Re | Reynolds number |
| T | temperature (K) |
| T0 | mean temperature of of the hot and cold surfaces (K) |
| u | velocity components of x direction (m/s) |
| velocity vector | |
| V | velocity (m/s) |
| v | velocity components of y direction (m/s) |
| x | x coordinate location (mm) |
| y | y coordinate location (mm) |
| Greek symbols | |
| β | thermal expansion coefficient (1/K) |
| λ | mean free path (m) |
| μ | dynamic viscosity (kg/m∙s) |
| ν | kinetic viscosity (m2/s) |
| ρ | density of fluid (kg/m3) |
| ρ0 | constant density of the flow (kg/m3) |
| ΔT | difference of temperatures ΔT = Th − Tc (K) |
| intersection angle (degree) | |
| Subscripts | |
| c | cold |
| crit | critical |
| h | hot |
| hor | horizontal |
| max | maximum |
| min | minimum |
| ver | vertical |
References
- Batchelor, G.K. Heat transfer by free convection across a closed cavity between vertical boundaries at different temperatures. Q. Appl. Math. 1954, 12, 209–233. [Google Scholar] [CrossRef]
- Emery, A.; Chu, N.C. Heat Transfer across Vertical Layers. J. Heat Transf. 1965, 87, 110–114. [Google Scholar] [CrossRef]
- Macgregor, R.K.; Emery, A.F. Free Convection through Vertical Plane Layers-Moderate and High Prandtl Number Fluids. J. Heat Transf. 1969, 91, 391–401. [Google Scholar] [CrossRef]
- Yin, S.H.; Wung, T.Y.; Chen, K. Natural convection in an air layer enclosed within rectangular cavities. Int. J. Heat Mass Transf. 1978, 21, 307–315. [Google Scholar] [CrossRef]
- Bejan, A.; Alhomoud, A.A.; Imberger, J. Experimental study of high-Rayleigh-number convection in a horizontal cavity with different end temperatures. J. Fluid Mech. 2006, 109, 283–299. [Google Scholar] [CrossRef]
- Kiš, P.; Herwig, H. Natural convection in a vertical plane channel: DNS results for high Grashof numbers. Heat Mass Transf. 2014, 50, 957–972. [Google Scholar] [CrossRef]
- Eckertf, E.R.G.; Carlson, W.O. Natural convection in an air layer enclosed between two vertical plates with different temperatures. Int. J. Heat Mass Transf. 1961, 2, 106–110. [Google Scholar] [CrossRef]
- Ganguli, A.A.; Pandit, A.B.; Joshi, J.B. CFD simulation of heat transfer in a two-dimensional vertical enclosure. Chem. Eng. Res. Des. 2009, 87, 711–727. [Google Scholar] [CrossRef]
- Gill, A.E. The boundary-layer regime for convection in a rectangular cavity. J. Fluid Mech. 1966, 26, 515–536. [Google Scholar] [CrossRef]
- Aviram, D.; Fried, A.; Roberts, J. Thermal properties of a variable cavity wall. Build. Environ. 2001, 36, 1057–1072. [Google Scholar] [CrossRef]
- Wakitani, S. Experiments on Convective Instability of Large Prandtl Number Fluids in a Vertical Slot. J. Heat Transf. 1994, 116, 120–126. [Google Scholar] [CrossRef]
- Jin, Y.Y.; Chen, C.F. Instability of Convection and Heat Transfer of High Prandtl Number Fluids in a Vertical Slot. J. Heat Transf. 1996, 118, 359–365. [Google Scholar] [CrossRef]
- Lartigue, B.; Lorente, S.; Bourret, B. Multicellular natural convection in a high aspect ratio cavity: Experimental and numerical results. Int. J. Heat Mass Transf. 2000, 43, 3157–3170. [Google Scholar] [CrossRef]
- Betts, P.L.; Bokhari, I.H. Experiments on turbulent natural convection in an enclosed tall cavity. Int. J. Heat Fluid Flow 2000, 21, 675–683. [Google Scholar] [CrossRef]
- Manz, H. Numerical simulation of heat transfer by natural convection in cavities of facade elements. Energy Build. 2003, 35, 305–311. [Google Scholar] [CrossRef]
- Wu, W.; Ching, Y.C. The effect of the top wall temperature on the laminar natural convection in rectangular cavities with different aspect ratios. J. Heat Transf. 2009, 131, 052501. [Google Scholar] [CrossRef]
- Zhang, X.; Su, G.; Yu, J.; Yao, Z.; He, F. PIV measurement and simulation of turbulent thermal free convection over a small heat source in a large enclosed cavity. Build. Environ. 2015, 90, 105–113. [Google Scholar] [CrossRef]
- Markatos, N.C.; Pericleous, K.A. Laminar and turbulent natural convection in an enclosed cavity. Int. J. Heat Mass Transf. 1984, 27, 755–772. [Google Scholar] [CrossRef]
- Ramesh, N.; Venkateshan, S.P. Experimental study of natural convection in a square enclosure using differential interferometer. Int. J. Heat Mass Transf. 2001, 44, 1107–1117. [Google Scholar] [CrossRef]
- Ampofo, F.; Karayiannis, T.G. Experimental benchmark data for turbulent natural convection in an air-filled square cavity. Int. J. Heat Mass Transf. 2003, 46, 3551–3572. [Google Scholar] [CrossRef]
- Yang, G.; Huang, Y.; Wu, J.; Zhang, L.; Chen, G.; Lv, R.; Cai, A. Experimental study and numerical models assessment of turbulent mixed convection heat transfer in a vertical open cavity. Build. Environ. 2017, 115, 91–103. [Google Scholar] [CrossRef]
- Bejan, A.; Tien, C.L. Laminar Natural Convection Heat Transfer in a Horizontal Cavity with Different End Temperatures. J. Heat Transf. 1978, 100, 641. [Google Scholar] [CrossRef]
- Hasnaoui, M.; Bilgen, E.; Vasseur, P. Natural convection heat transfer in rectangular cavities partially heated from below. J. Thermophys. Heat Transf. 1992, 6, 255–264. [Google Scholar] [CrossRef]
- Lu, Y.X.; Zhuang, L.X. Numerical study of natural convection flow in a vertical slot. Acta Mech. Sin. 1999, 15, 215–224. [Google Scholar] [CrossRef]
- Zhou, Y.; Zhang, R.; Staroselsky, I.; Chen, H. Numerical simulation of laminar and turbulent buoyancy-driven flows using a lattice Boltzmann based algorithm. Int. J. Heat Mass Transf. 2004, 47, 4869–4879. [Google Scholar] [CrossRef]
- Varol, Y.; Oztop, H. A comparative numerical study on natural convection in inclined wavy and flat-plate solar collectors. Build. Environ. 2008, 43, 1535–1544. [Google Scholar] [CrossRef]
- Bhandari, P.; Anderson, K.; Karlmann, P.; Novak, K. CO2 insulation for thermal control of the Mars science laboratory. In Proceedings of the 41st International Conference on Environmental Systems, Portland, Oregon, 17–21 July 2011. AIAA Paper 2011-5119. [Google Scholar] [CrossRef]
- Noll, R.B.; McElroy, M.B. Engineering Model of the Mars Atmosphere. In Proceedings of the 13th Aerospace Sciences Meeting, Pasadena, CA, USA, 20–22 January 1975. AIAA Paper 75-197. [Google Scholar] [CrossRef]
- Bhandari, P.; Anderson, K.R. CFD analysis for assessing the effect of wind on the thermal control of the Mars science laboratory curiosity rover. In Proceedings of the 43rd International Conference on Environmental Systems, Vail, CO, USA, 14–18 July 2013. AIAA Paper 2013-3325. [Google Scholar] [CrossRef]
- ANSYS Inc. Fluent 14.0 Theory Guide; ANSYS Inc.: Canonsburg, PA, USA, 2013. [Google Scholar]
- Guo, Z.Y.; Tao, W.Q.; Shah, R.K. The field synergy (coordination) principle and its applications in enhancing single phase convective heat transfer. Int. J. Heat Mass Transf. 2005, 48, 1797–1807. [Google Scholar] [CrossRef]
Figure 1.
Enclosure schematic model: (a) horizontal enclosure; (b) vertical enclosure.

Figure 2.
Comparison of thermal conductance between the present study and the literature [30].
Figure 2.
Comparison of thermal conductance between the present study and the literature [30].
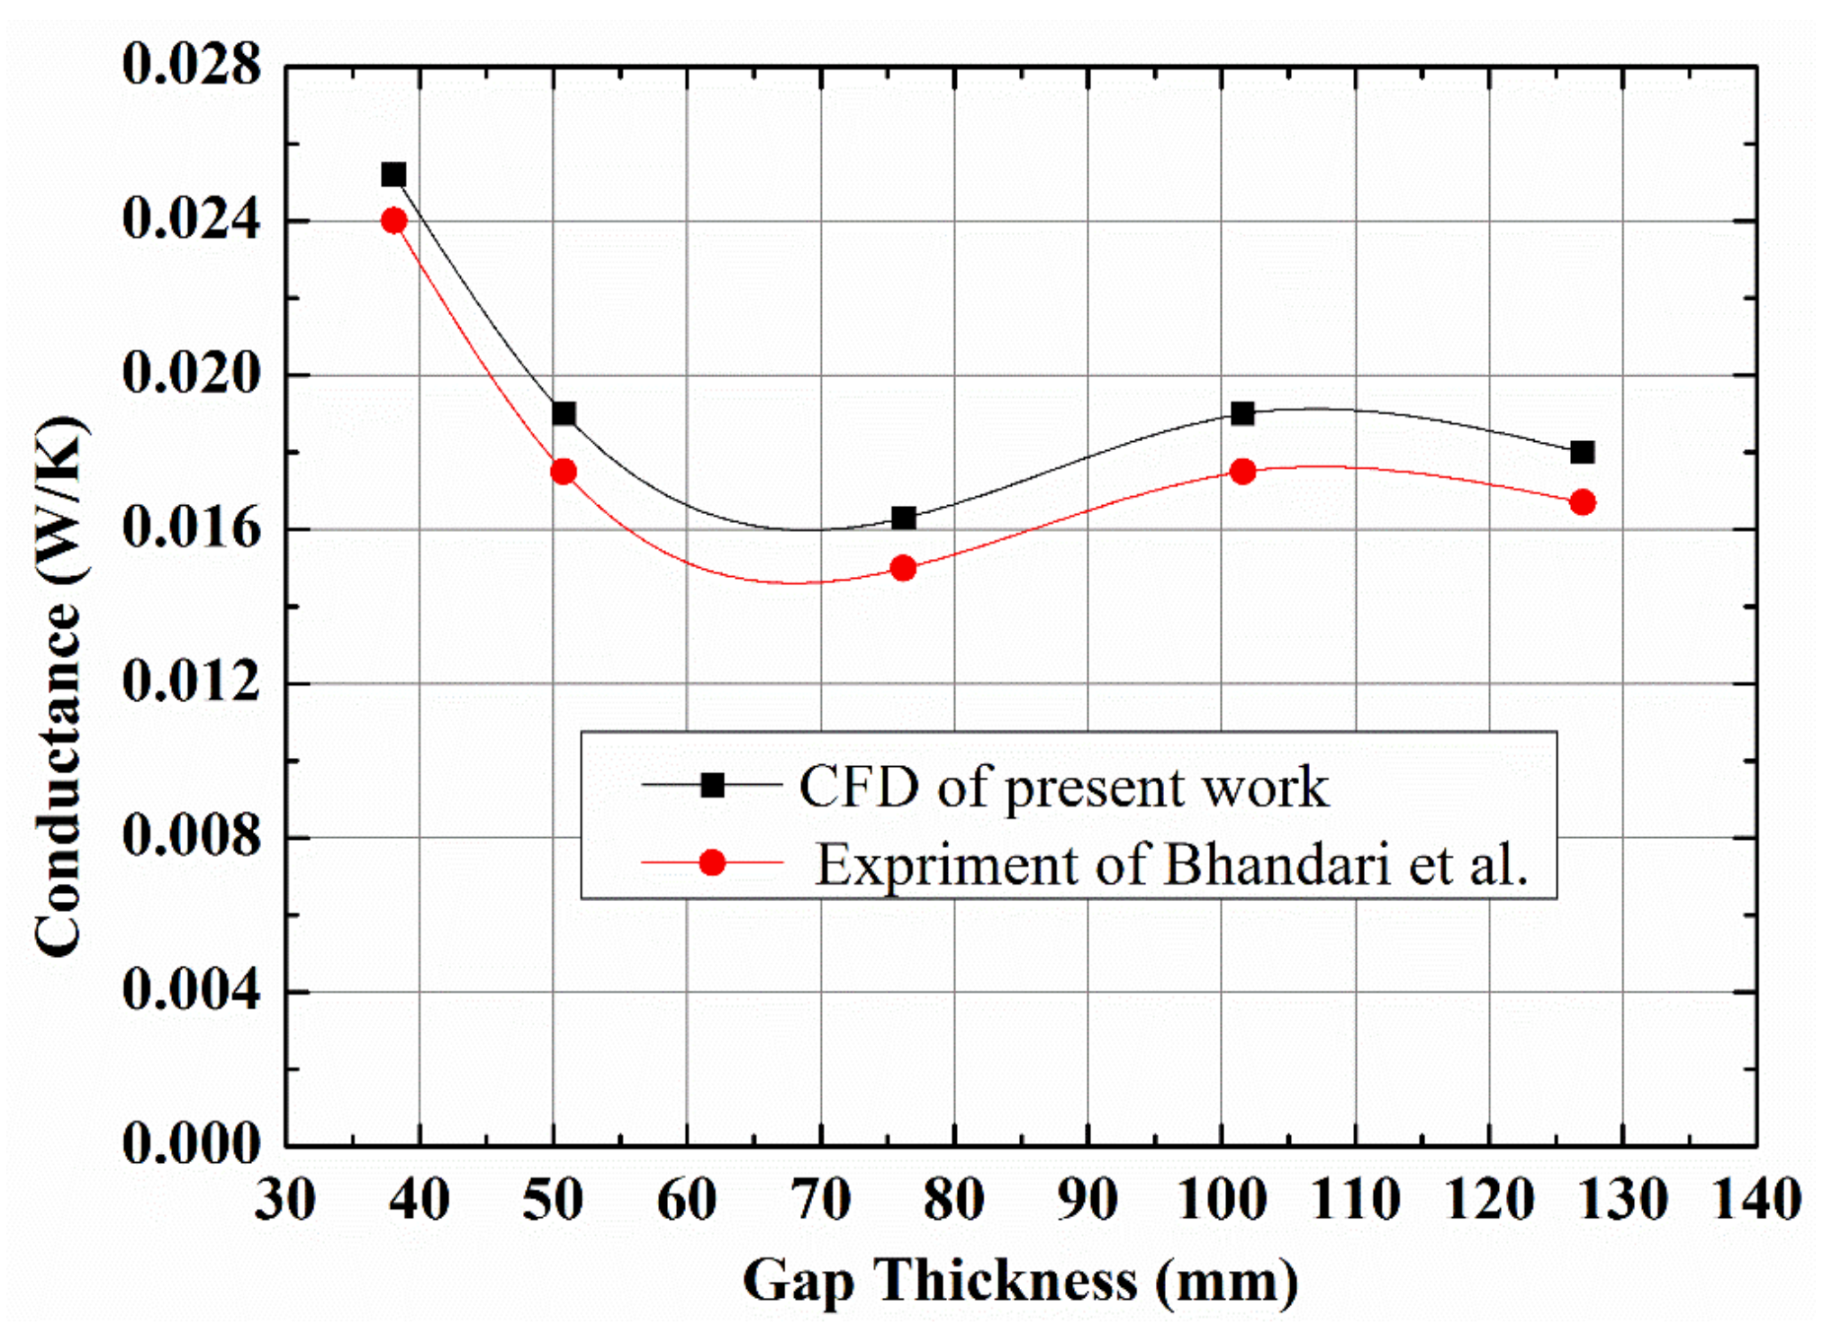
Figure 3.
Comparison of the Nusselt numbers between the present study and the literature [4].
Figure 3.
Comparison of the Nusselt numbers between the present study and the literature [4].

Figure 4.
Variation in heat flux with horizontal enclosure gap thickness.

Figure 5.
Variation in heat flux with horizontal enclosure gap thickness near critical enclosure thickness: (a) ΔT = 20 K; (b) ΔT = 40 K; (c) ΔT = 80 K.
Figure 5.
Variation in heat flux with horizontal enclosure gap thickness near critical enclosure thickness: (a) ΔT = 20 K; (b) ΔT = 40 K; (c) ΔT = 80 K.

Figure 6.
Velocity and temperature contours in the horizontal enclosures at L = 1000 mm, ΔT = 40 K: (a) H = 40 mm; (b) H = 80 mm; (c) H = 100 mm; (d) H = 130 mm.
Figure 6.
Velocity and temperature contours in the horizontal enclosures at L = 1000 mm, ΔT = 40 K: (a) H = 40 mm; (b) H = 80 mm; (c) H = 100 mm; (d) H = 130 mm.
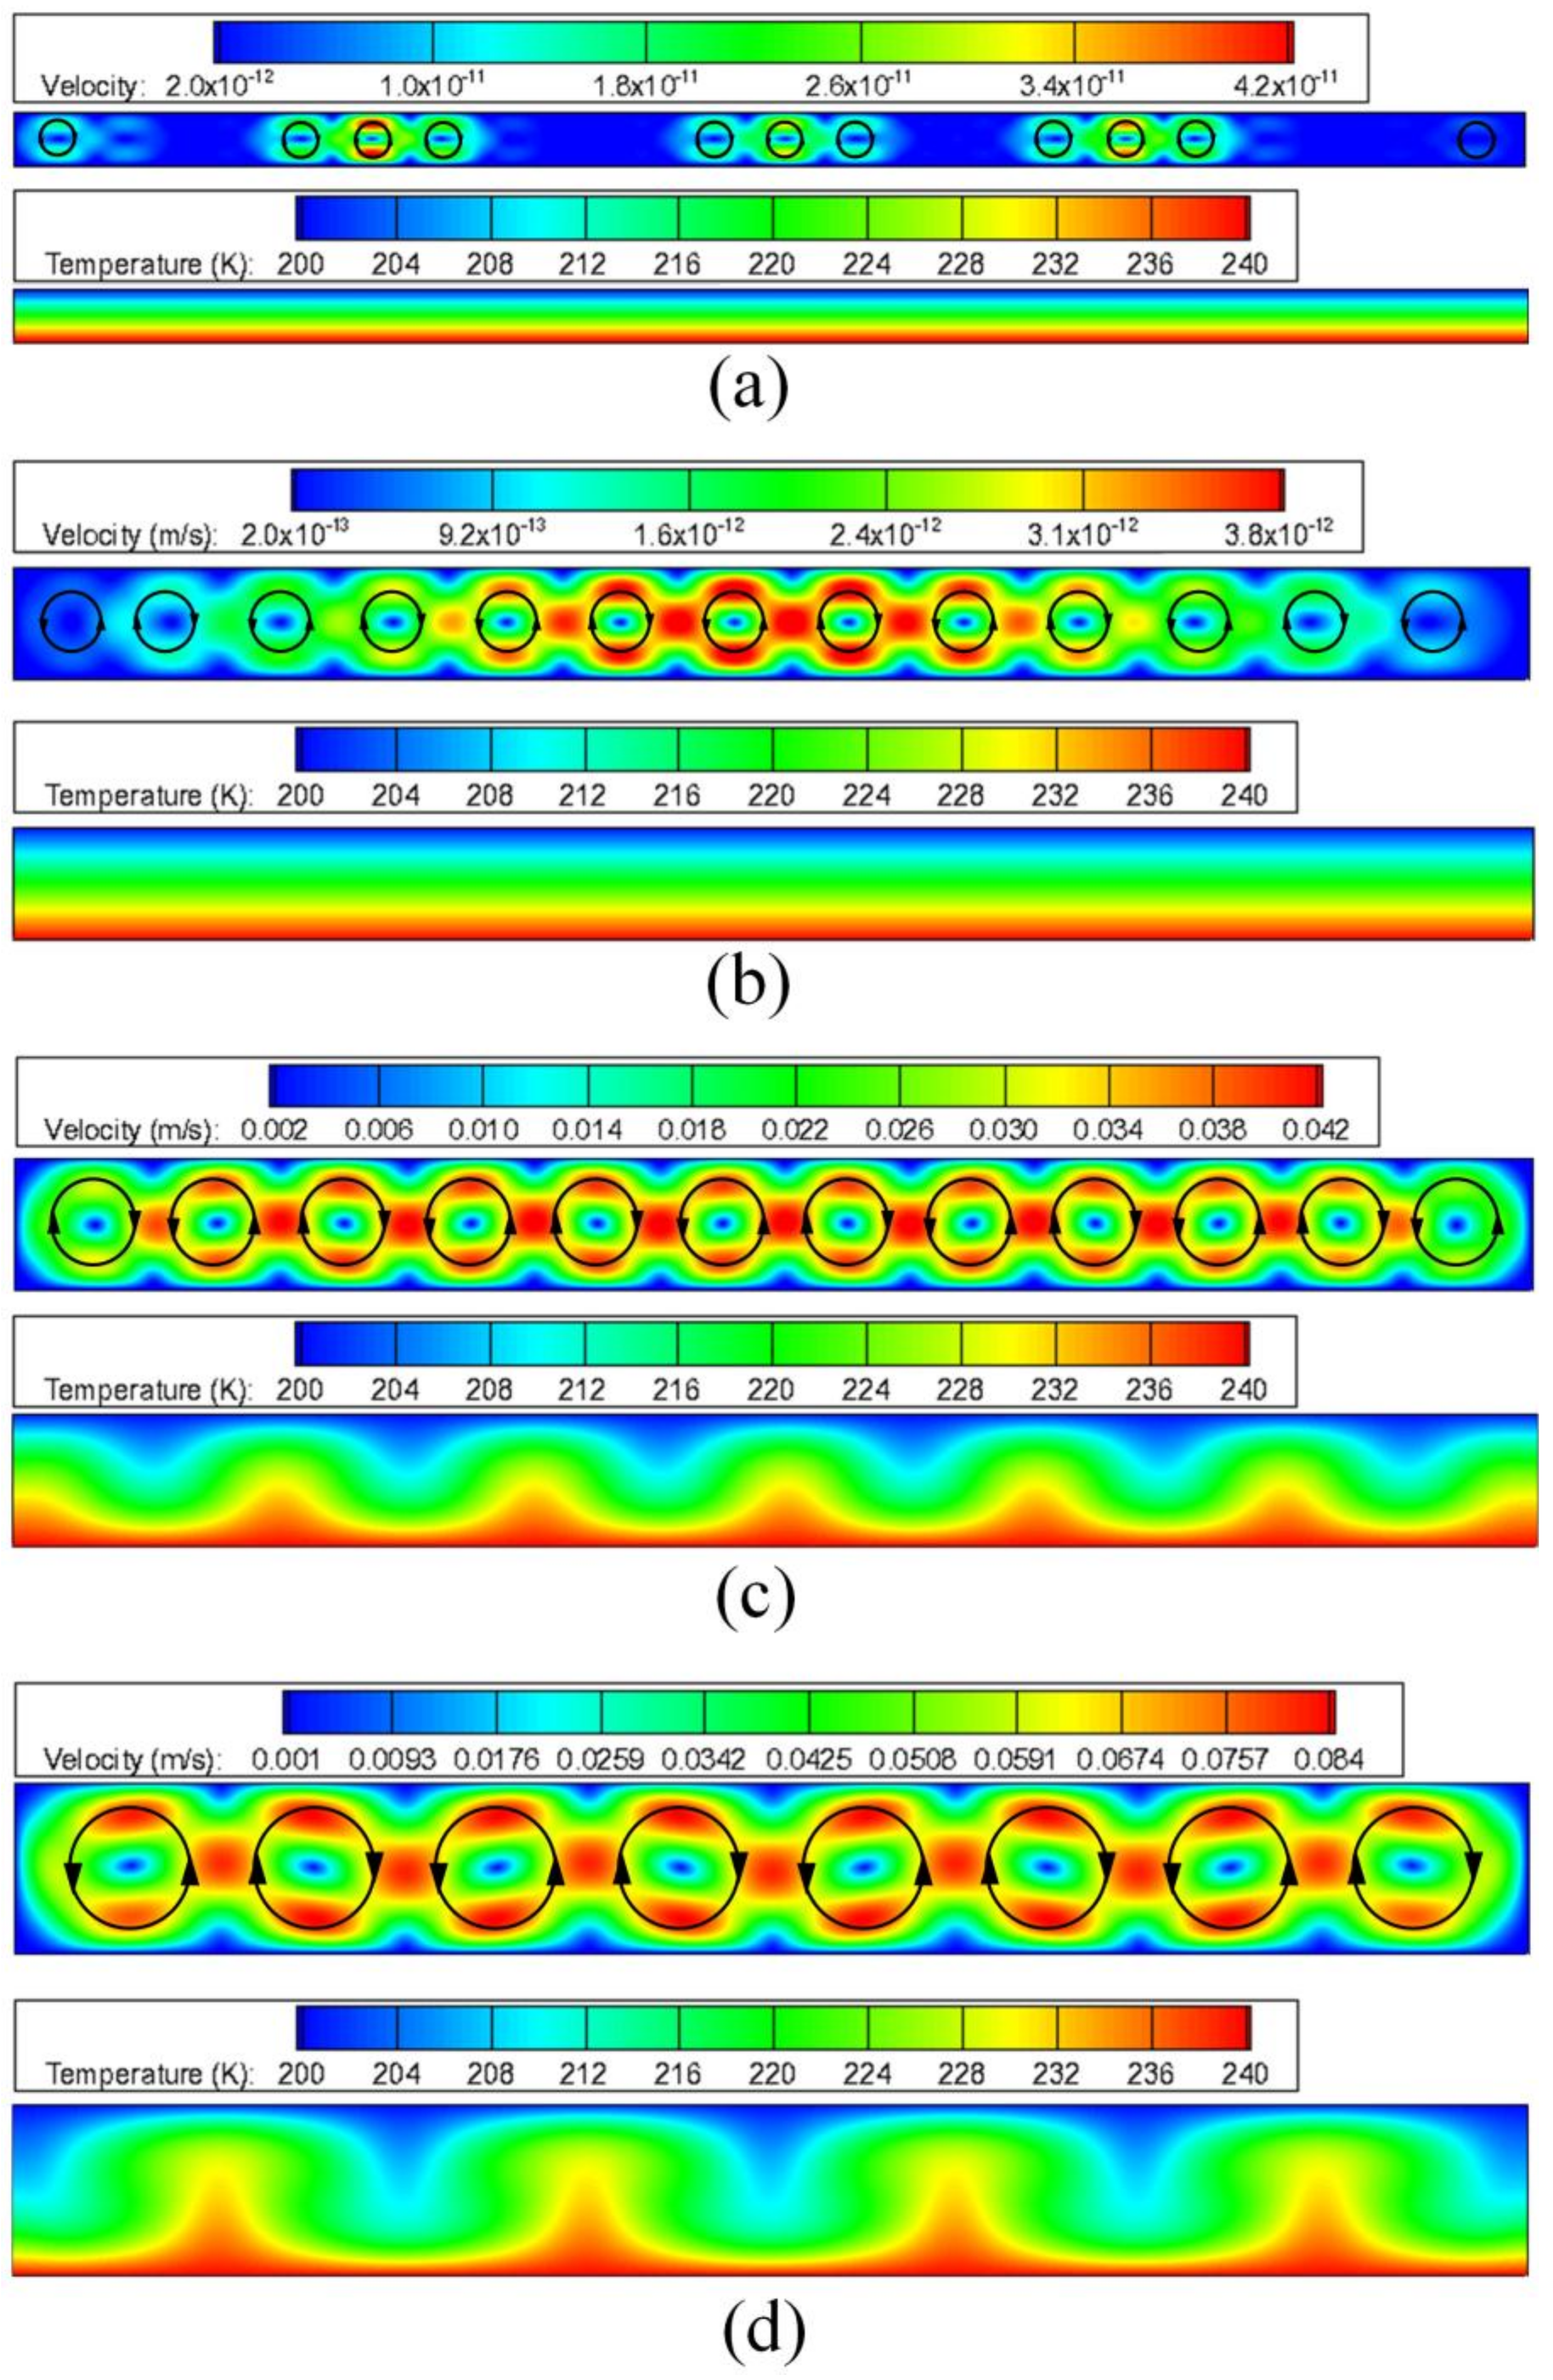
Figure 7.
Variation in the horizontal enclosure temperatures with vertical distance at L = 1000 mm, ΔT = 40 K: (a) H = 40 mm; (b) H = 80 mm; (c) H = 100 mm; (d) H = 130 mm.
Figure 7.
Variation in the horizontal enclosure temperatures with vertical distance at L = 1000 mm, ΔT = 40 K: (a) H = 40 mm; (b) H = 80 mm; (c) H = 100 mm; (d) H = 130 mm.
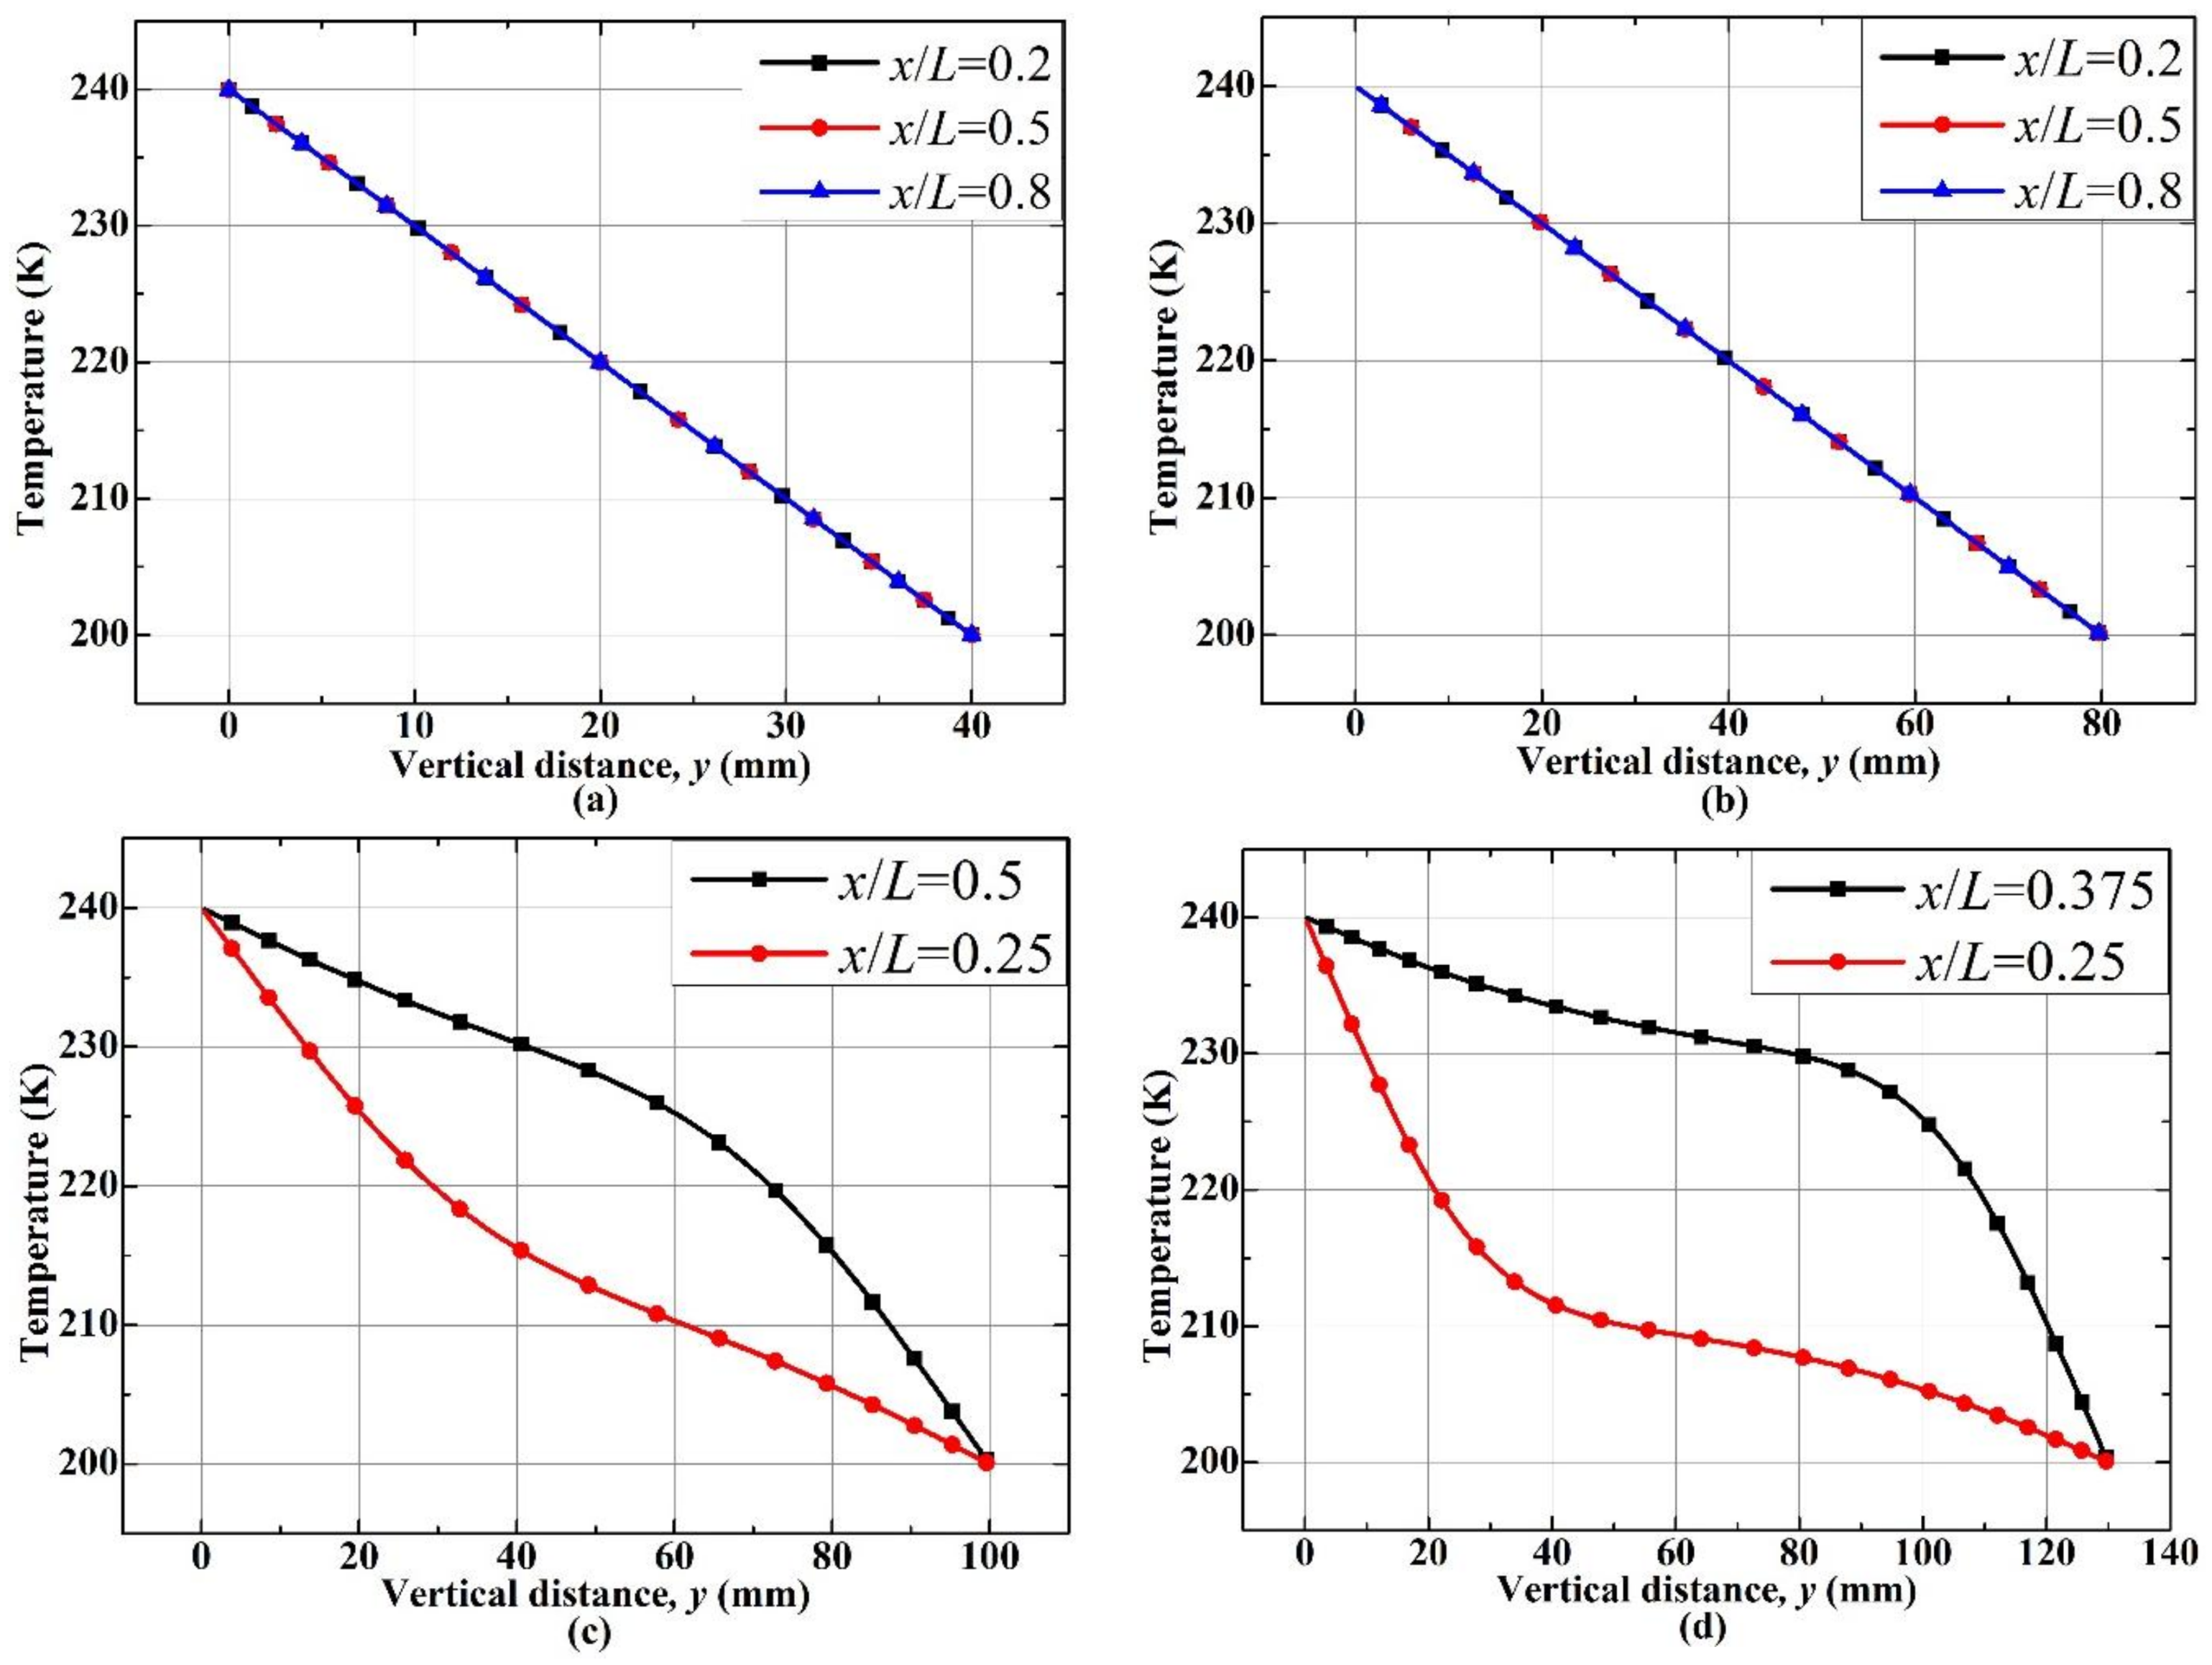
Figure 8.
Variation in heat flux with the vertical enclosure gap thickness.

Figure 9.
Variation in heat flux with the vertical enclosure gap thickness near the critical enclosure thickness: (a) ΔT = 20 K; (b) ΔT = 40 K; (c) ΔT = 80 K.
Figure 9.
Variation in heat flux with the vertical enclosure gap thickness near the critical enclosure thickness: (a) ΔT = 20 K; (b) ΔT = 40 K; (c) ΔT = 80 K.
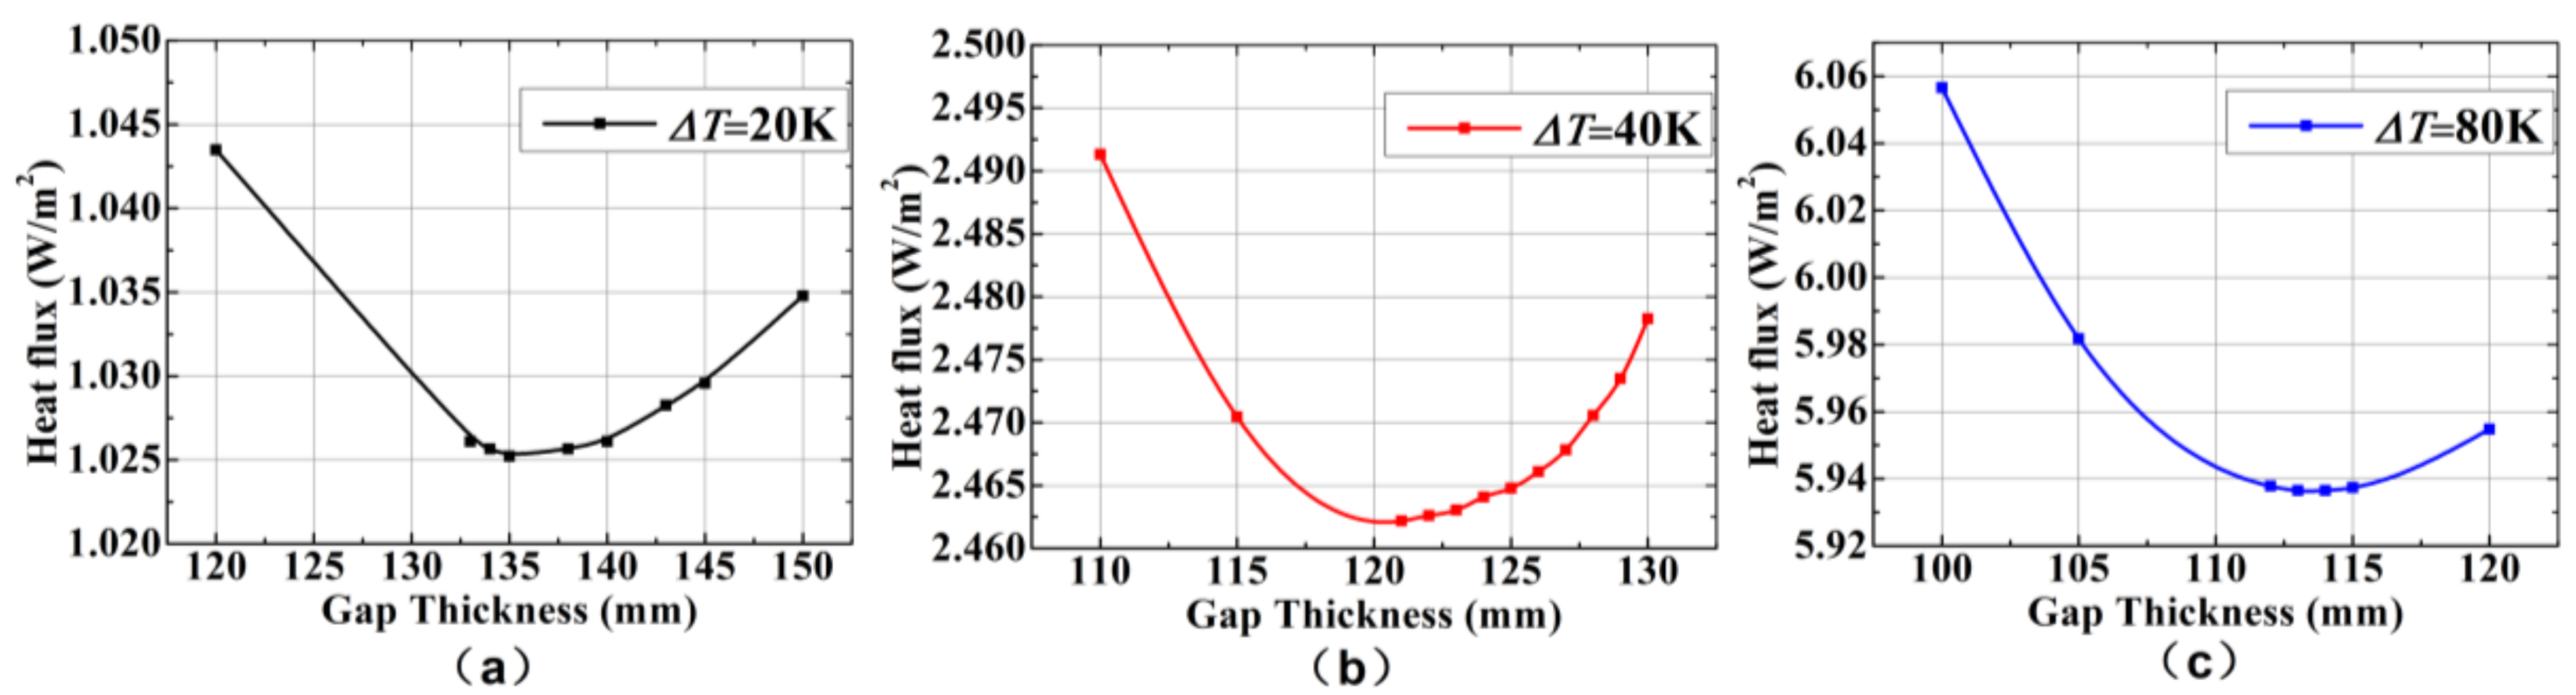
Figure 10.
Velocity and temperature fields in the vertical enclosures at L = 1000 mm, ΔT = 40 K: (a) H = 40 mm; (b) H = 80 mm; (c) H = 130 mm; (d) H = 170 mm.
Figure 10.
Velocity and temperature fields in the vertical enclosures at L = 1000 mm, ΔT = 40 K: (a) H = 40 mm; (b) H = 80 mm; (c) H = 130 mm; (d) H = 170 mm.

Figure 11.
Variation in the vertical enclosure temperatures with horizontal distance at L = 1000 mm, ΔT = 40 K: (a) H = 40 mm; (b) H = 80 mm; (c) H = 130 mm; (d) H = 170 mm.
Figure 11.
Variation in the vertical enclosure temperatures with horizontal distance at L = 1000 mm, ΔT = 40 K: (a) H = 40 mm; (b) H = 80 mm; (c) H = 130 mm; (d) H = 170 mm.

Figure 12.
Intersection angle fields of the horizontal and vertical enclosures at L = 1000 mm, H = 130 mm, ΔT = 40 K: (a) horizontal enclosure; (b) vertical enclosure.
Figure 12.
Intersection angle fields of the horizontal and vertical enclosures at L = 1000 mm, H = 130 mm, ΔT = 40 K: (a) horizontal enclosure; (b) vertical enclosure.

Figure 13.
Comparison between calculated results by correlation equations and CFD results for average Nusselt number: (a) horizontal enclosure; (b) vertical enclosure.
Figure 13.
Comparison between calculated results by correlation equations and CFD results for average Nusselt number: (a) horizontal enclosure; (b) vertical enclosure.


Table 1.
Grid sensitivity test model and results.
| Enclosure | L (mm) | H (mm) | Position | Th (K) | Tc (K) | Manner | Nodes | q (W/m2) | Vmax (m/s) |
|---|---|---|---|---|---|---|---|---|---|
| 1 | 1000 | 20 | horizontal | bottom: 240 | top: 200 | A | 667 × 14 | 22.84 | 5.76 × 10⁻¹⁶ |
| B | 1001 × 21 | 22.84 | 5.76 × 10⁻¹⁶ | ||||||
| C | 1251 × 26 | 22.84 | 5.76 × 10⁻¹⁶ | ||||||
| 2 | 1000 | 100 | horizontal | bottom: 240 | top: 200 | A | 667 × 67 | 3.06 | 4.37 × 10⁻² |
| B | 1001 × 101 | 3.03 | 4.35 × 10⁻² | ||||||
| C | 1251 × 126 | 3.03 | 4.35 × 10⁻² | ||||||
| 3 | 1000 | 150 | horizontal | bottom: 240 | top: 200 | A | 667 × 101 | divergence | divergence |
| B | 1001 × 151 | 3.63 | 1.10 × 10⁻¹ | ||||||
| C | 1251 × 188 | 3.63 | 1.10 × 10⁻¹ | ||||||
| 4 | 1000 | 20 | vertical | left: 240 | right: 200 | A | 667 × 14 | 22.83 | 5.00 × 10⁻³ |
| B | 1001 × 21 | 22.83 | 5.00 × 10⁻³ | ||||||
| C | 1251 × 26 | 22.83 | 5.00 × 10⁻³ | ||||||
| 5 | 1000 | 100 | vertical | left: 240 | right: 200 | A | 667 × 67 | 2.60 | 1.14 × 10⁻¹ |
| B | 1001 × 101 | 2.58 | 1.13 × 10⁻¹ | ||||||
| C | 1251 × 126 | 2.58 | 1.13 × 10⁻¹ | ||||||
| 6 | 1000 | 150 | vertical | left: 240 | right: 200 | A | 667 × 101 | divergence | divergence |
| B | 1001 × 151 | 2.55 | 2.17 × 10⁻¹ | ||||||
| C | 1251 × 188 | 2.55 | 2.17 × 10⁻¹ |
Table 2.
Comparisons between horizontal and vertical critical enclosure thicknesses.
| ΔT (K) | Hcrit,hor (mm) | Hcrit,ver (mm) |
|---|---|---|
| 20 | 107 | 135 |
| 40 | 91 | 121 |
| 80 | 84 | 114 |
© 2018 by the authors. Licensee MDPI, Basel, Switzerland. This article is an open access article distributed under the terms and conditions of the Creative Commons Attribution (CC BY) license (http://creativecommons.org/licenses/by/4.0/).
Share and Cite
MDPI and ACS Style
Sun, Y.; Lin, G.; Bu, X.; Bai, L.; Xiao, C.; Wen, D. A Numerical Study of Fluid Flow and Heat Transfer in Carbon Dioxide Enclosures on Mars. Energies 2018, 11, 756. https://doi.org/10.3390/en11040756
AMA Style
Sun Y, Lin G, Bu X, Bai L, Xiao C, Wen D. A Numerical Study of Fluid Flow and Heat Transfer in Carbon Dioxide Enclosures on Mars. Energies. 2018; 11(4):756. https://doi.org/10.3390/en11040756
Chicago/Turabian StyleSun, Yue, Guiping Lin, Xueqin Bu, Lizhan Bai, Chunhua Xiao, and Dongsheng Wen. 2018. "A Numerical Study of Fluid Flow and Heat Transfer in Carbon Dioxide Enclosures on Mars" Energies 11, no. 4: 756. https://doi.org/10.3390/en11040756
Note that from the first issue of 2016, this journal uses article numbers instead of page numbers. See further details here.