Improving the Penetration of Wind Power with Dynamic Thermal Rating System, Static VAR Compensator and Multi-Objective Genetic Algorithm


Abstract
:1. Introduction
2. Problem Description
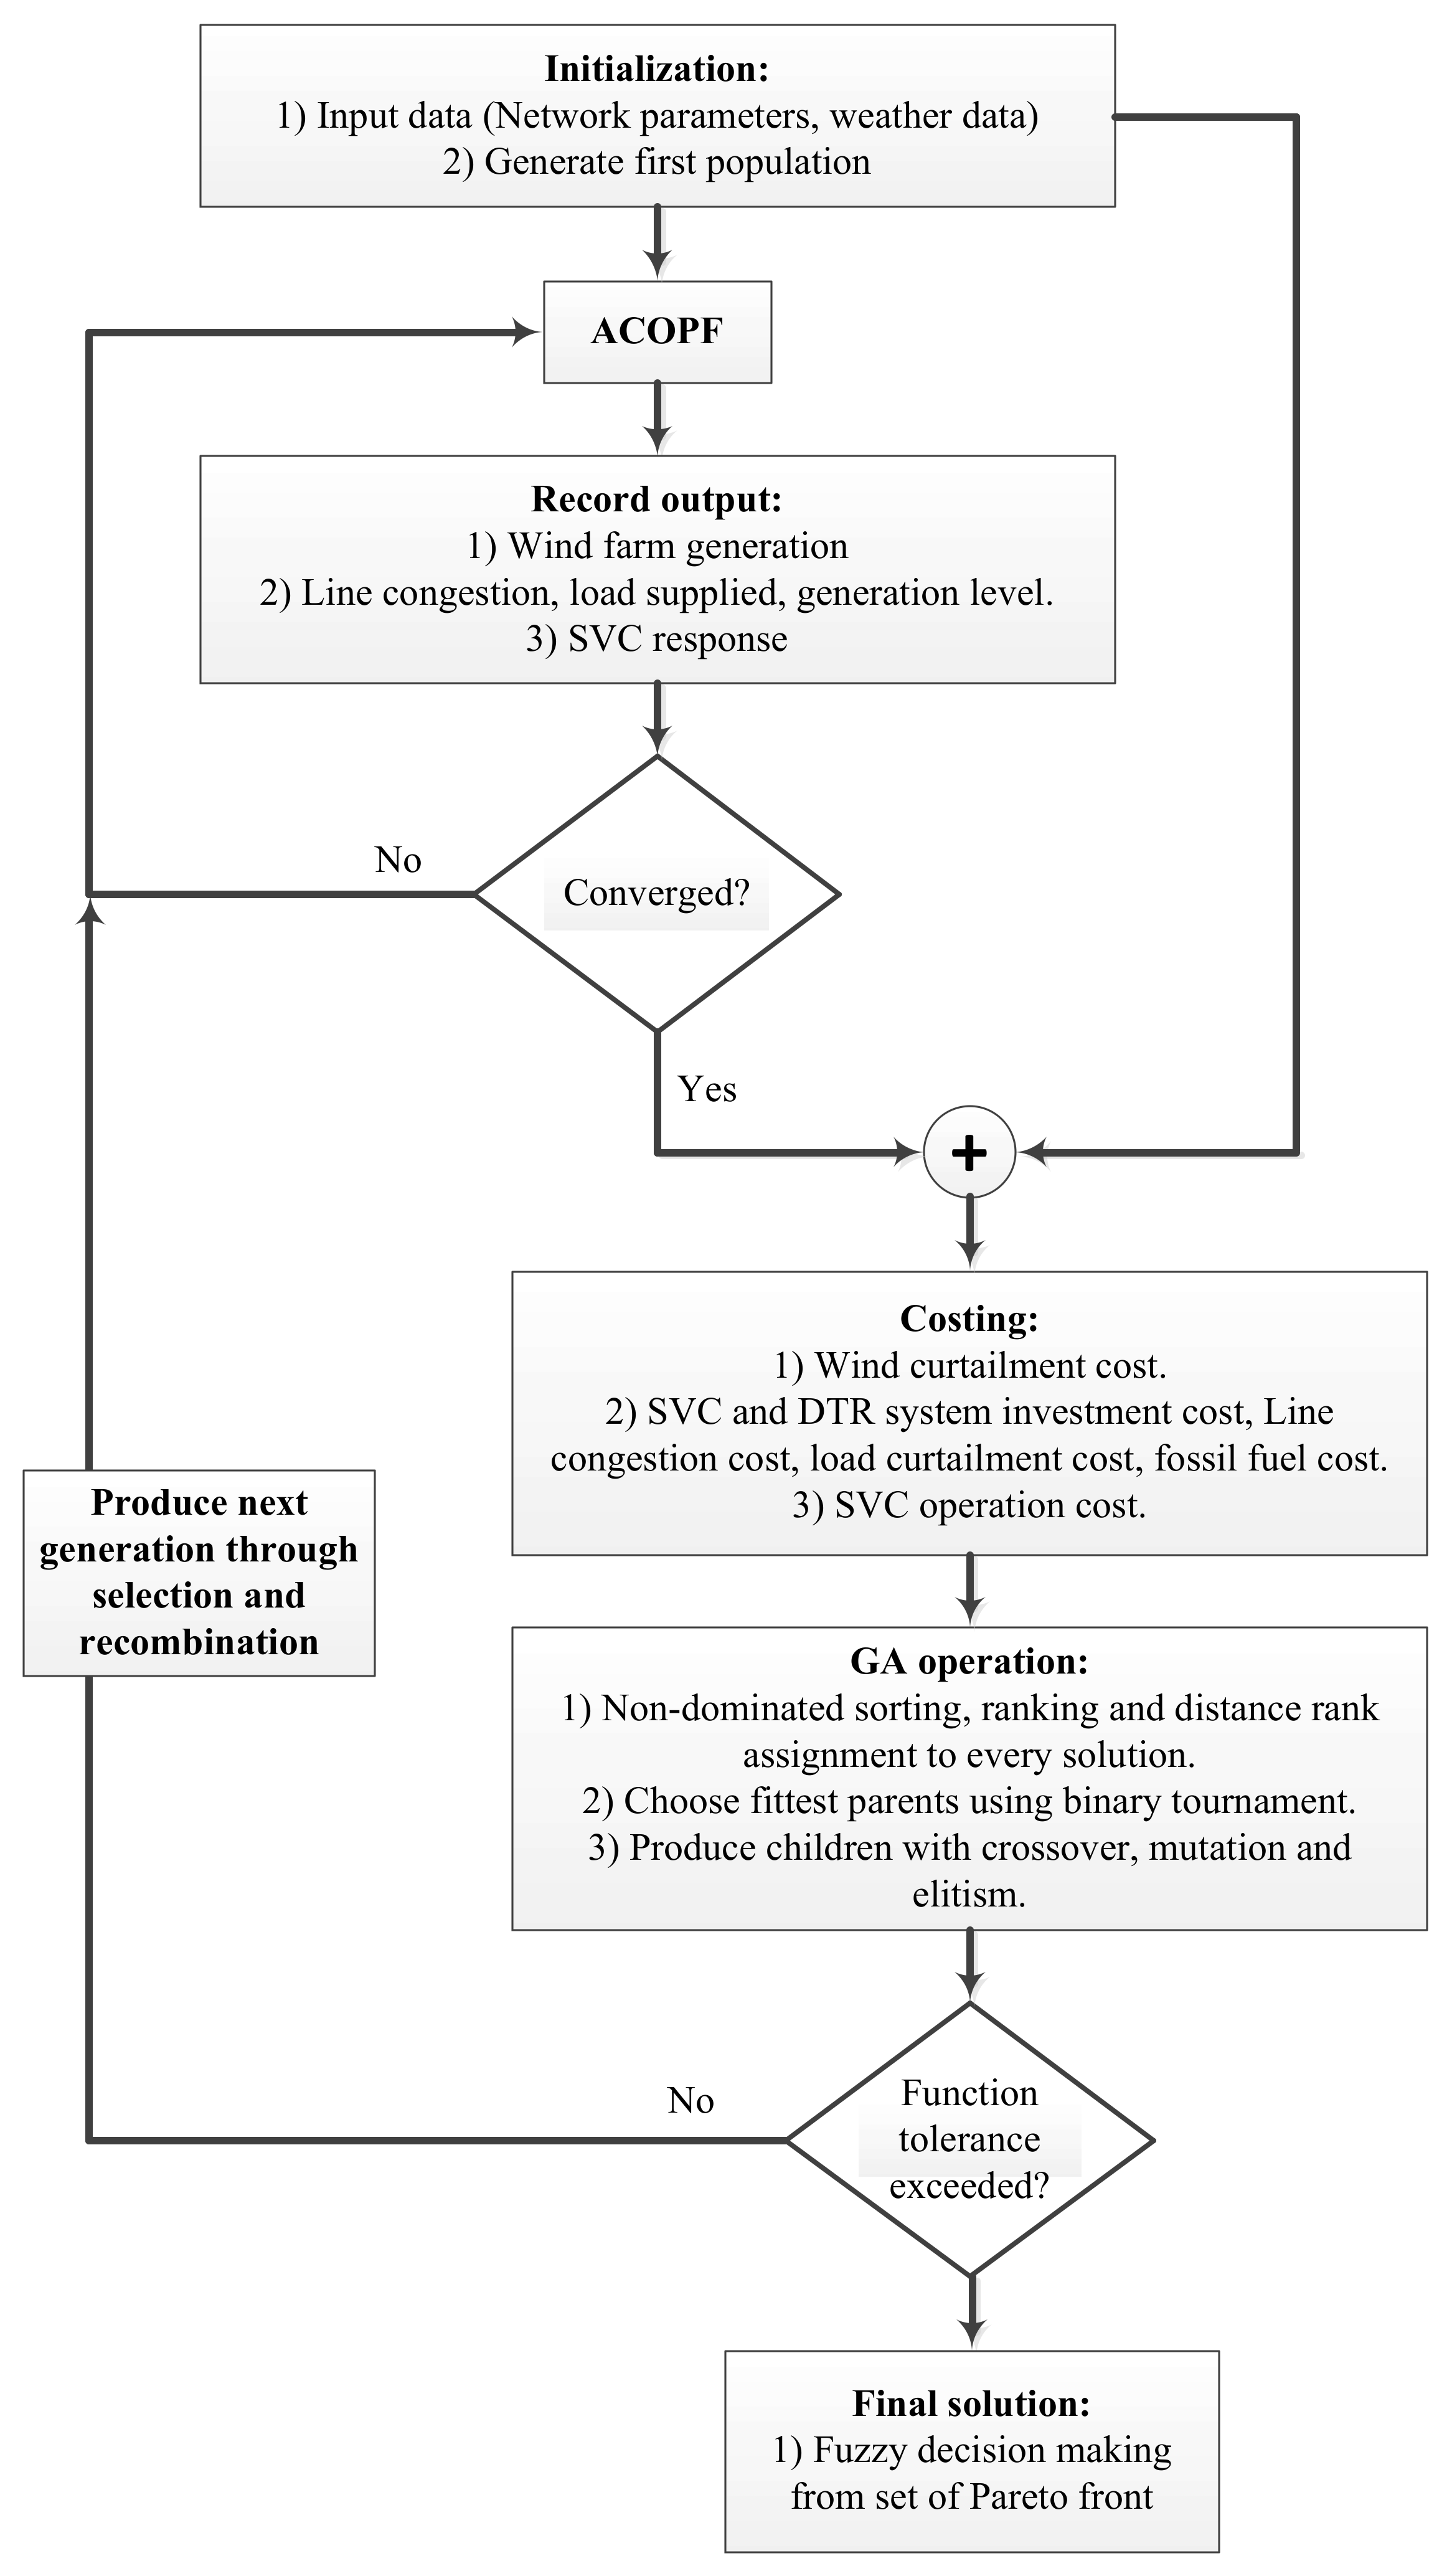
- Wind energy curtailment costA penalty cost is attached to every unit of wind energy curtailment. By doing this, wind energy curtailment is minimized by reducing the wind energy curtailment cost.
- Social costThis consists of the investment costs of the SVCs and DTR systems, transmission line congestion cost, load curtailment cost, and the fossil fuel cost of the thermal generators.
- SVC operational costAn operation cost is attached to every unit of reactive power produced by the SVC. Minimizing this cost is equivalent to minimizing the production of the reactive power.
3. Methodology
3.1. Wind Farm Model
3.2. SVC Model
3.3. DTR System Model
3.4. Problem Formulation
3.5. Multi-Objective Optimization Method
3.6. Final Decision Making Method
3.7. Algorithm of the Proposed Approach
3.8. Test System
4. Results and Discussion
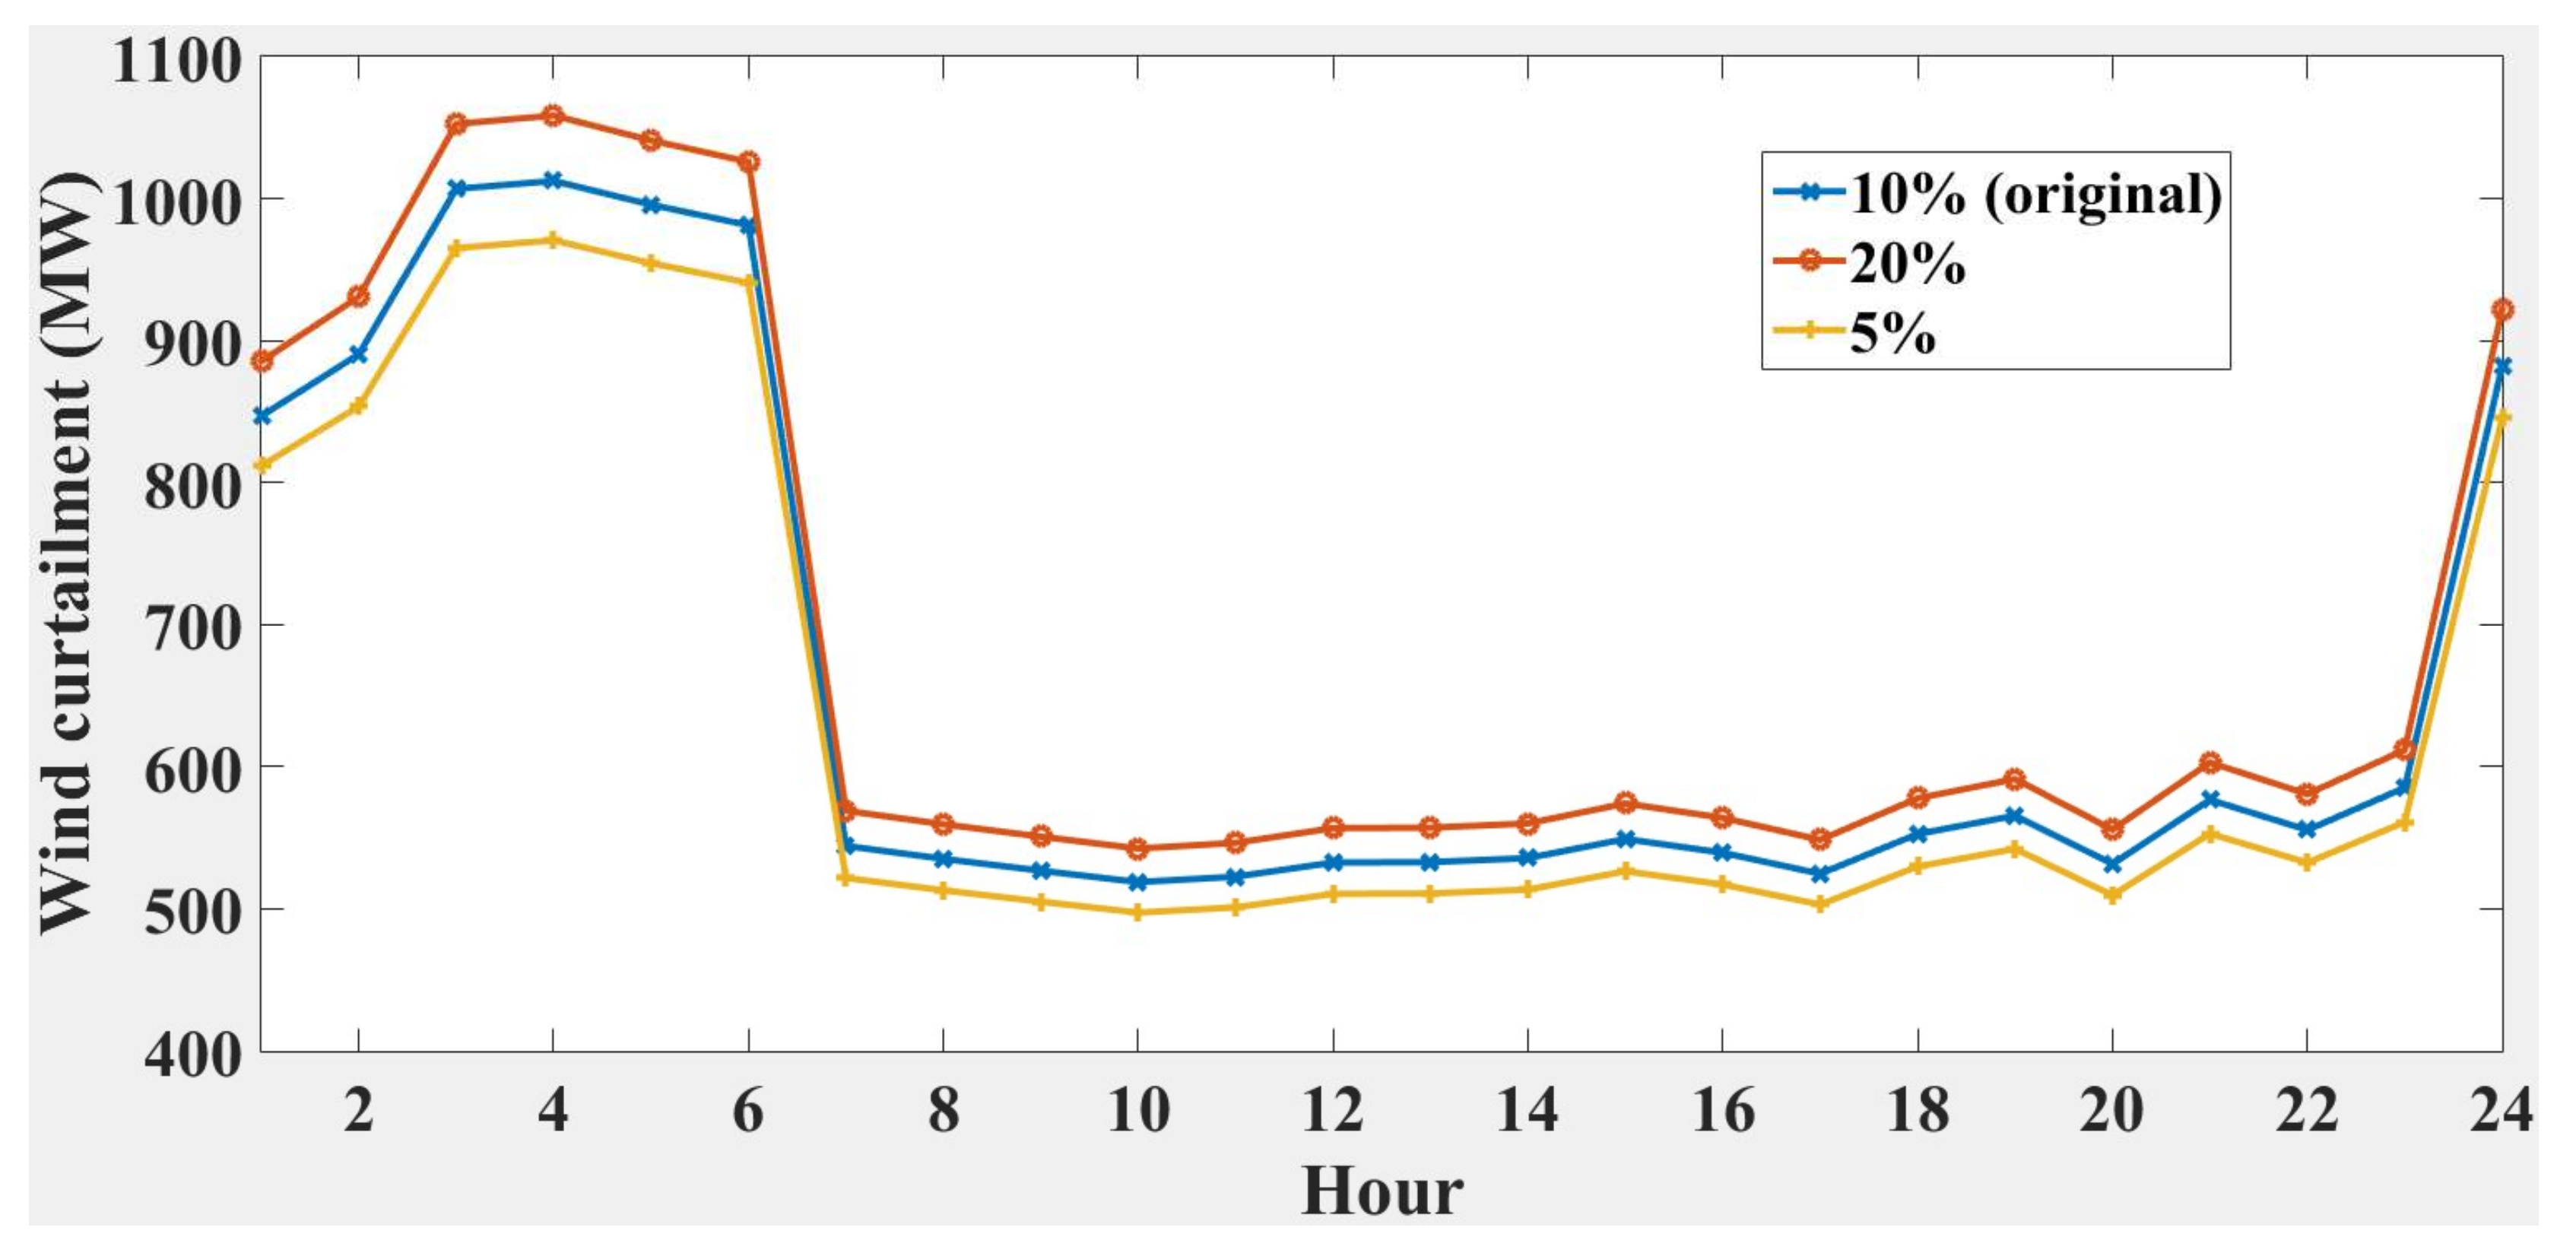
Sensitivity Analysis
5. Conclusions
Acknowledgments
Author Contributions
Conflicts of Interest
References
- Global Wind Energy Council (GWEC). Global Wind Report 2016—Annual Market Update; Global Wind Energy Council: Brussels, Belgium, 2016. [Google Scholar]
- European Comission. Energy Roadmap 2050 [COM/2011/885]; European Comission: Brussels, Belgium, 2011. [Google Scholar]
- Haileselassie, T.M.; Uhlen, K. Power System Security in a Meshed North Sea HVDC Grid. Proc. IEEE 2013, 101, 978–990. [Google Scholar] [CrossRef]
- Burke, D.J.; Malley, M.J.O. Factors Influencing Wind Energy Curtailment. IEEE Trans. Sustain. Energy 2011, 2, 185–193. [Google Scholar] [CrossRef]
- RTE. Business and Sustainable Development Report; RTE: Paris, France, 2015. [Google Scholar]
- Gautam, D.; Vittal, V.; Harbour, T. Impact of Increased Penetration of DFIG-Based Wind Turbine Generators on Transient and Small Signal Stability of Power Systems. IEEE Trans. Power Syst. 2009, 24, 1426–1434. [Google Scholar] [CrossRef]
- Billinton, R.; Wangdee, W. Reliability-Based Transmission Reinforcement Planning Associated with Large-Scale Wind Farms. IEEE Trans. Power Syst. 2007, 22, 34–41. [Google Scholar] [CrossRef]
- Park, H.; Baldick, R. Transmission Planning Under Uncertainties of Wind and Load: Sequential Approximation Approach. IEEE Trans. Power Syst. 2013, 28, 2395–2402. [Google Scholar] [CrossRef]
- Moeini-Aghtaie, M.; Abbaspour, A.; Fotuhi-Firuzabad, M. Incorporating Large-Scale Distant Wind Farms in Probabilistic Transmission Expansion Planning—Part I: Theory and Algorithm. IEEE Trans. Power Syst. 2012, 27, 1585–1593. [Google Scholar] [CrossRef]
- Moeini-Aghtaie, M.; Abbaspour, A.; Fotuhi-Firuzabad, M. Incorporating Large-Scale Distant Wind Farms in Probabilistic Transmission Expansion Planning—Part II: Case Studies. IEEE Trans. Power Syst. 2012, 27, 1594–1601. [Google Scholar] [CrossRef]
- Orfanos, G.A.; Georgilakis, P.S.; Hatziargyriou, N.D. Transmission Expansion Planning of Systems with Increasing Wind Power Integration. IEEE Trans. Power Syst. 2013, 28, 1355–1362. [Google Scholar] [CrossRef]
- Fernandes, C.; Frías, P.; Olmos, L. Expanding interconnection capacity to integrate intermittent generation in the Iberian Peninsula. IET Renew. Power Gener. 2013, 7, 45–54. [Google Scholar] [CrossRef]
- WG B2.13. Guidlines for Increased Utilization of Existing Overhead Transmission Line. In CIGRE Brochure; 2008; Available online: https://e-cigre.org/publication/353-guidelines-for-increased-utilization-of-existing-overhead-transmission-lines (accessed on 26 March 2018).
- Matevosyan, J. Wind Power Integration in Power Systems with Transmission Bottlenecks. In Proceedings of the 2007 IEEE Power Engineering Society General Meeting, Tampa, FL, USA, 24–28 June 2007; pp. 1–7. [Google Scholar]
- Teh, J.; Cotton, I. Critical span identification model for dynamic thermal rating system placement. IET Gener. Transm. Distrib. 2015, 9, 2644–2652. [Google Scholar] [CrossRef]
- Teh, J.; Cotton, I. Reliability Impact of Dynamic Thermal Rating System in Wind Power Integrated Network. IEEE Trans. Reliab. 2016, 65, 1081–1089. [Google Scholar] [CrossRef]
- Greenwood, D.M.; Ingram, G.L.; Taylor, P.C. Applying Wind Simulations for Planning and Operation of Real-Time Thermal Ratings. IEEE Trans. Smart Grid 2017, 8, 537–547. [Google Scholar] [CrossRef] [Green Version]
- Ali, M.; Degefa, M.Z.; Humayun, M.; Safdarian, A.; Lehtonen, M. Increased Utilization of Wind Generation by Coordinating the Demand Response and Real-time Thermal Rating. IEEE Trans. Power Syst. 2016, 31, 3737–3746. [Google Scholar] [CrossRef]
- Ara, A.L.; Kazemi, A.; Niaki, S.A.N. Multiobjective Optimal Location of FACTS Shunt-Series Controllers for Power System Operation Planning. IEEE Trans. Power Deliv. 2012, 27, 481–490. [Google Scholar] [CrossRef]
- Zhu, J.; Cheung, K.; Hwang, D.; Sadjadpour, A. Operation Strategy for Improving Voltage Profile and Reducing System Loss. IEEE Trans. Power Deliv. 2010, 25, 390–397. [Google Scholar] [CrossRef]
- Ghahremani, E.; Kamwa, I. Optimal placement of multiple-type FACTS devices to maximize power system loadability using a generic graphical user interface. IEEE Trans. Power Syst. 2013, 28, 764–778. [Google Scholar] [CrossRef]
- Hossain, M.J.; Pota, H.R.; Mahmud, M.A.; Ramos, R.A. Investigation of the Impacts of Large-Scale Wind Power Penetration on the Angle and Voltage Stability of Power Systems. IEEE Syst. J. 2012, 6, 76–84. [Google Scholar] [CrossRef]
- Alhasawi, F.B.; Milanovic, J.V. Techno-Economic Contribution of FACTS Devices to the Operation of Power Systems with High Level of Wind Power Integration. IEEE Trans. Power Syst. 2012, 27, 1414–1421. [Google Scholar] [CrossRef]
- Nasri, A.; Conejo, A.J.; Kazempour, S.J.; Ghandhari, M. Minimizing Wind Power Spillage Using an OPF With FACTS Devices. IEEE Trans. Power Syst. 2014, 29, 2150–2159. [Google Scholar] [CrossRef]
- Billinton, R.; Karki, R. Maintaining supply reliability of small isolated power systems using renewable energy. IEE Proc. Gener. Transm. Distrib. 2001, 148, 530–534. [Google Scholar] [CrossRef]
- Bouffard, F.; Galiana, F.D. Stochastic Security for Operations Planning with Significant Wind Power Generation. IEEE Trans. Power Syst. 2008, 23, 306–316. [Google Scholar] [CrossRef]
- Burke, D.J.; Malley, M.J.O. Maximizing Firm Wind Connection to Security Constrained Transmission Networks. IEEE Trans. Power Syst. 2010, 25, 749–759. [Google Scholar] [CrossRef]
- Salehi-Dobakhshari, A.; Fotuhi-Firuzabad, M. Integration of large-scale wind farm projects including system reliability analysis. IET Renew. Power Gener. 2011, 5, 89–98. [Google Scholar] [CrossRef]
- Abdullah, M.A.; Muttaqi, K.M.; Sutanto, D.; Agalgaonkar, A.P. An Effective Power Dispatch Control Strategy to Improve Generation Schedulability and Supply Reliability of a Wind Farm Using a Battery Energy Storage System. IEEE Trans. Sustain. Energy 2015, 6, 1093–1102. [Google Scholar] [CrossRef]
- Subcommittee, P.M. IEEE Reliability Test System. IEEE Trans. Power Appar. Syst. 1979, PAS-98, 2047–2054. [Google Scholar] [CrossRef]
- Billinton, R.; Chen, H.; Ghajar, R. Time-series models for reliability evaluation of power systems including wind energy. Microelectron. Reliab. 1996, 36, 1253–1261. [Google Scholar] [CrossRef]
- Vestas. Available online: https://www.vestas.com/en/products/turbines (accessed on 26 March 2018).
- Cai, L.J.; Erlich, I.; Stamtsis, G. Optimal Choice and Allocation of FACTS Devices in Deregulated Electricity Market Using Genetic Algorithms. In Proceedings of the IEEE PES Power Systems Conference and Exposition, New York, NY, USA, 10–13 October 2004; Volume 1, pp. 201–207. [Google Scholar]
- IEEE. IEEE Standard for Calculating the Current-Temperature of Bare Overhead Conductors; IEEE Std 738-2006 (Revision of IEEE Std 738-1993); IEEE: Piscataway Township, NJ, USA, 2007. [Google Scholar] [CrossRef]
- Kopsidas, K.; Kapetanaki, A.; Levi, V. Optimal Demand Response Scheduling with Real Time Thermal Ratings of Overhead Lines for Improved Network Reliability. IEEE Trans. Smart Grid 2017, 8, 2813–2825. [Google Scholar] [CrossRef]
- WG B2.06. How Overhead Lines Are Redesignd for Uprating/upgrading-Analysies of the Replies to the Questionnaire. In Cigre Brochure; 2006; Available online: https://e-cigre.org/publication/294-how-overhead-lines-are-redesignd-for-upratingupgrading-analysies-of-the-replies-to-the-questionnaire (accessed on 26 March 2018).
- CIGRE. Increasing Capacity of Overhead Transmission Lines: Needs and Solutions; Technical Brochure; CIGRE: Paris, France, 2010. [Google Scholar]
- Varadarajan, M.; Swarup, K.S. Solving multi-objective optimal power flow using differential evolution. IET Gener. Transm. Distrib. 2008, 2, 720–730. [Google Scholar] [CrossRef]
- Srinivas, N.; Deb, K. Muiltiobjective Optimization Using Nondominated Sorting in Genetic Algorithms. Evolut. Comput. 1994, 2, 221–248. [Google Scholar] [CrossRef]
- Deb, K. Multi-Objective Optimization Using Evolutionary Algorithm; Wiley: Chichester, UK, 2001; Volume 2012. [Google Scholar]
- Billinton, R.; Allan, R.N. Reliability Evaluation of Power Systems; Plenum: New York, NY, USA, 1984. [Google Scholar]
- Zimmerman, R.D.; Murillo-Sanchez, C.E. MATPOWER 5.0 User’s Manual; Power System Engineering Research Center (PSERC), Arizona State University: Tempe, AZ, USA, 2014. [Google Scholar]
- Gu, Y.; Xie, L. Fast Sensitivity Analysis Approach to Assessing Congestion Induced Wind Curtailment. IEEE Trans. Power Syst. 2014, 29, 101–110. [Google Scholar] [CrossRef]
- British Atmospheric Data Center (BADC). Available online: http://badc.nerc.ac.uk/home/ (accessed on 26 March 2018).


| = 0.8, = 0.5, = 0.5 | = 1, = 0.5, = 0.5 | = 1, = 0.5, = 0.8 | ||
|---|---|---|---|---|
| Placement | Optimal bus for SVC | 6, 15, 16, 24 | 3, 6, 9, 11 | 3, 6, 9, 11, 15 |
| Optimal line for DTR system | 4-18, 8-16, 9-17, 9-23, 11-21, 19-37 | 1-26, 2-14, 4-18, 8-16, 9-23, 11-21, 19-37 | 4-18, 6-15, 8-16, 9-17, 19-37 | |
| Cost | Wind curtailment cost (M$) | 0.8063 | 0.7962 | 0.8258 |
| Total social cost (M$) | 4.4088 | 4.7846 | 3.6439 | |
| SVC operation cost (M$) | 5.1953 | 5.5119 | 4.4377 | |
© 2018 by the authors. Licensee MDPI, Basel, Switzerland. This article is an open access article distributed under the terms and conditions of the Creative Commons Attribution (CC BY) license (http://creativecommons.org/licenses/by/4.0/).
Share and Cite
Teh, J.; Lai, C.-M.; Cheng, Y.-H. Improving the Penetration of Wind Power with Dynamic Thermal Rating System, Static VAR Compensator and Multi-Objective Genetic Algorithm. Energies 2018, 11, 815. https://doi.org/10.3390/en11040815
Teh J, Lai C-M, Cheng Y-H. Improving the Penetration of Wind Power with Dynamic Thermal Rating System, Static VAR Compensator and Multi-Objective Genetic Algorithm. Energies. 2018; 11(4):815. https://doi.org/10.3390/en11040815
Chicago/Turabian StyleTeh, Jiashen, Ching-Ming Lai, and Yu-Huei Cheng. 2018. "Improving the Penetration of Wind Power with Dynamic Thermal Rating System, Static VAR Compensator and Multi-Objective Genetic Algorithm" Energies 11, no. 4: 815. https://doi.org/10.3390/en11040815