Article

Lithium-Ion Cell Fault Detection by Single-Point Impedance Diagnostic and Degradation Mechanism Validation for Series-Wired Batteries Cycled at 0 °C

1
U.S. Naval Research Laboratory, Washington, DC 20375, USA
2
Hawaii Natural Energy Institute, University of Hawaii at Manoa, Honolulu, HI 96815, USA
3
Maxim Integrated, San Jose, CA 95134, USA
4
Pine Research Instruments, Durham, NC 27705, USA
*
Authors to whom correspondence should be addressed.
Energies 2018, 11(4), 834; https://doi.org/10.3390/en11040834
Submission received: 1 March 2018 / Revised: 30 March 2018 / Accepted: 2 April 2018 / Published: 4 April 2018
(This article belongs to the Section D: Energy Storage and Application)

Abstract

:
The utility of a single-point impedance-based technique to monitor the state-of-health of a pack of four 18650 lithium-ion cells wired in series (4S) was demonstrated in a previous publication. This work broadens the applicability of the single-point monitoring technique to identify temperature induced faults within 4S packs at 0 °C by two distinct discharge cut-off thresholds: individual cell cut-off and pack voltage cut-off. The results show how the single-point technique applied to a 4S pack can identify cell faults induced by low temperature degradation when plotted on a unique state-of-health map. Cell degradation is validated through an extensive incremental capacity technique to quantify capacity loss due to low temperature cycling and investigate the underpinnings of cell failure.

1. Introduction

Lithium-ion batteries are pervasive in applications spanning from small commercial electronics to electrified vehicles. As lithium-ion battery technologies penetrate additional market segments their performance requirements will inevitably be expanded to include abusive operating environments, such as low and high temperatures, as well as large pack designs composed of many series and parallel-wired cells [1]. As commercial batteries are pushed closer to the edge of their operating limits, there is a need for novel and redundant safety features external to the battery. This includes robust diagnostic and monitoring techniques to improve the effectiveness of battery management systems that provide continual user feedback of the state-of-health (SOH) and of internal stability of the cells within the pack [2]. The utility of a single-point impedance-based technique to monitor the SOH of a pack of four 18650 lithium-ion cells wired in series (4S) was demonstrated in a previous publication [3]. Electrochemical impedance spectroscopy (EIS) is a well utilized technique to identify electrochemical reaction processes inside lithium-ion batteries. Often, full EIS spectra are collected over a vast frequency range and the data are compared to a theoretical equivalent circuit model of the cell consisting of various resistance and capacitance elements. Full spectrum impedance data collection requires significant computing capabilities and time, especially for low frequency impedance, reducing its utility for fielded systems. Additionally, the reliance of an equivalent circuit to model an evolving system, where chemical and electrochemical degradation processes are occurring based upon calendar and cycle aging, is difficult to quantify [4]. Progressing from the cell to pack level further complicates this approach [5] and requires additional sophistication [6]. Therefore, we have been proponents of an empirical diagnostic to continuously monitor the impedance associated with a single perturbation frequency to identify potential hazardous faults within a battery. This approach is data-based rather than model-based and allows for continual screening and simple implementation of decision-making algorithms to compare the impedance response against a known acceptable value. Impedance-response boundaries can be adjusted based upon risk appetite to develop acceptable impedance ranges. The use of single-point measurements have been adopted previously at 1000 Hz [7] which provides the real impedance or direct current (DC) resistance of the cell, but misses SOH information contained in the imaginary component of the impedance response. We have found changes in the imaginary impedance to be related to degradation processes within lithium-ion cells that are tied to the anode solid electrolyte interphase (SEI) as a result of overcharge abuse [8]. As such, the single-point impedance frequency should directly correspond to processes occurring at this interphase and be inclusive of both real and imaginary contributions of the impedance response. We have found the single-point state-of-health frequency, fSOH, for monitoring anode SEI and overall cell SOH is unique to each type of cell; and where chemistry, manufacturer and cell form factor determine the exact frequency [8]. To date a variety of pouch and cylindrical cells of various chemistries have each shown a unique fSOH, generally within the 100–500 Hz frequency range. An added advantage of the single-point impedance approach is the response at fSOH is nearly invariant with state-of-charge (SOC), making it an ideal probe for continual online monitoring which is not reliant on preconditioning the cell under test.
In this work, we build upon past success to broaden the applicability of the single-point monitoring technique to identify temperature-induced faults within 4S packs, specifically at sub-ambient temperature, 0 °C. At low temperatures, lithium-ion cells are prone to performance loss and a number of safety concerns associated with anode degradation [9,10], lithium dendrite formation [11,12,13,14], impedance increases [14,15], thermal fluctuations [16,17] and capacity and impedance mismatch amongst cells within a battery pack to create imbalance [18]. When cycled at low temperatures, impedance differences between cells in series can cause weaker cells to overcharge and overdischarge while the pack still maintains a perceived acceptable voltage within the normal operational boundaries.
The primary objectives of this paper are twofold; to enhance the utility of the single-point impedance monitoring technique to provide new and increased capabilities to lithium-ion battery packs at low temperature and to identify the specific sources of cell degradation detected from application of the single-point diagnostic to battery packs. These functionalities include: (i) the ability to use a current amplitude perturbation for EIS measurements; (ii) the validation of the universality of fSOH at sub-ambient temperatures; and (iii) the diagnosis-ability assessment of the single-point impedance methodology for cell faults within 4S packs operated at low temperature. Two distinct discharge thresholds were tested, one at the single cell level and one at the pack level. Observations from single-point impedance monitoring technique were validated against an exhaustive analysis of different cells degradation mechanisms using an electrochemical voltage spectroscopy [19,20].

2. Materials and Methods

2.1. Electrochemical Characterization

This study utilized 21 commercial 18650 cylindrical lithium-ion cells of 2.6 Ah nominal capacity. This cell type has been used previously for similar impedance-based testing [3,21]. Every cell of the purchased batch was screened prior to testing using the University of Hawaii developed initial cycling and conditioning testing (ICCT) protocol [20], and cells presenting similar characteristics were selected for this study. The ICCT test is meant to assess cell-to-cell variations and consists of several cycles at C/2 (discharge in 2 h, where 1C = 1.3 A) until the capacity of the cell is stable within 0.2% then 2 additional cycles at C/2 and C/5 (discharge in 5 h) with 4 h rest before and after the discharges. All charges were performed using the manufacturer recommended conditions. Additionally, reference performance tests (RPTs) were performed prior to and after testing on selected cells. The RPT test consisted of two cycles at constant current, C/35 and C/5, with a residual capacity measurement collected between two 4-h rest periods. All tests were performed on an Arbin BTS system (ARBIN Instruments, College Station, TX, USA). One cell was disassembled for half-cell testing of the positive electrode (PE). In order to be safely disassembled, the cell was first fully discharged to 2 V using a constant current-constant voltage (CC-CV) technique with a C/200 limiting current. After completion of the discharge, the cell was entered into an argon-filled glove box for disassembly. Once in place, a pipe cutter was used to cut both end caps and a rotary tool equipped with a diamond-coated cutting disc was used to cut a straight line in the central cylinder freeing the “jelly roll” of electrodes. Thorough explanations of similar cell disassembly procedures are provided by Williard et al. [22] Waldmann et al. [23]. The PE was wiped with a solvent-soaked cotton tip and punched to size. Electrochemical analyses were performed in Swagelok type cells (1/2” PTFE-type) with a lithium metal-coated stainless steel disk as counter electrode and two layers of Whatman GF/D borosilicate glass fiber disk as separator. The electrolyte consisted of a 1 M LiPF6 in 1:1 (by weight) ethylene carbonate/dimethyl carbonate (EC/DMC) solution with 2% wt. vinylene carbonate (VC) additive. Electrochemical measurements were carried out using a VMP3 potentiostat from Bio-Logic (Claix, France). The PE was cycled between 4.35 V to 3.0 V. Conditioning cycles consisted of 1 charge/discharge cycle at a C/45 rate, followed by 6 cycles at a C/3.5 rate. These conditioning cycles were followed by a RPT that consisted of a series of charge/discharge cycles at different rates: C/40, C/20, C/10, C/5, C/2 and C/1. Computer simulations were performed using Hawaii Natural Energy Institute (HNEI) ‘alawa toolbox [24] that served as a user interface to facilitate the use of a mechanistic degradation model [25].
Single cell and pack-level impedance testing and charge/discharge were performed using the modular one-channel signal treatment-battery testing system (MIST-BTS) described and shown pictorially in a previous publication [3]. Single cells and packs were tested in a thermal chamber at 25 °C or 0 °C. The manufacturer recommended voltage boundaries for charge/discharge cycling of these cells are 2.75–4.2 V per cell. Discharge cycling in the 4S configuration used two different modes of lower voltage cutoff: (i) when the first cell in the pack reached 2.75 V or (ii) when the pack voltage reached 11.0 V. The charge profile consisted of a constant current C/2 rate followed by a constant voltage step held at 4.2 V for single cells and 16.8 V for packs until the current dropped below 0.013 A (C/200). EIS data for baselining cells were taken at a variety of current amplitudes between 50 kHz and 10 mHz at 25 °C and 0 °C. Long-term charge/discharge cycling was performed within the recommended voltage boundaries as discussed above with impedance data collected after the completion of discharge cycles 1, 10, 30 and 50. A rest period of 30 min was established after discharge cycling to give time for the cell to equilibrate. Thermal equilibration was established by a thermal soak at the desired temperature in an environmental chamber for greater than 1 h.

2.2. Initial Conditioning and Characterization Testing (ICCT) of Li-Ion Cells

Before starting the cycle life evaluation, it is important to quantify the amount of cell-to-cell variation within the batch of cells. It was essential to verify the consistency of the single cells beforehand to ensure that no outlier cell was used during the main experiment. For this purpose, ICCT was implemented on every cell of the batch before starting the main experiment. The capacities as well as the rest cell voltages measured during the final part of the ICCT were used to calculate the three parameters critical to determine the manufacturing variability in a batch of cells: the rate capability, the capacity ration and the resistance [5].
Cell mass were on average 45.3 g with a 0.4% standard deviation. All cells presented similar as-received open circuit voltage (OCV), ranging from 3.782 V to 3.829 V, a 47 mV spread. The average was 3.804 V and the standard variation 0.3%. This corresponded to SOC between 47.2% and 56.2%. The average capacities for the low (C/5) and high (C/2) rate were 2.624 Ah and 2.601 Ah with standard deviations at 0.5% and 0.6%, respectively. The average rate capability, the ratio of the capacity at both rates, was 99.3 with a standard deviation of 0.13%.
All but three cells had DC resistance values between 65–85 mΩ identified as C5, C6 and C15 in Figure 1. These cells are clear outliers with resistances in the 100–160 mΩ range. Including the outliers, the average sits at 78.5 mΩ with a 22% standard deviation. Without the outliers, the average was at 71 mΩ with a 3.8% standard deviation.
The end of discharge rest cell voltages were influenced by the discharge regime and presented a spread of 0.4% for the low rate and 0.6% for the high rate. These rest cell voltages were used to calculate the beginning and end of discharge SOCs and the capacity rations (capacity divided by delta SOC as calculated from an OCV curve). Looking at the capacity ration, the average was at 2.66 mAh/%SOC with a 0.5% standard variation.
Table 1 presents the results of the cell-to-cell variations analysis for the tested batch of cells. Overall, the variations on the rate capability and capacity ration are small (0.5% or below). The spread of resistances was considered small as it is below 5%. The cells were therefore considered of acceptable quality and appropriate for testing. Figure 1 shows the breakdown cell by cell. It clearly shows the three outliers in terms of resistance (Cells 5, 6 and 15). These cells were not been used in this study. The fact that outliers were found validated the need for performing the ICCT.
Figure 2a presents the results of the initial reference performance test (RPT1) for the positive electrode (PE). Higher current through a cell results into less returned capacity and more polarization. For example, at C/1, the positive electrode delivered around 80% of the low rate capacity only and it presented a 300 mV higher polarization. The RPT data was imported in the ‘alawa toolbox [24] in order to emulate the full cell behavior from the half-cell data [25] using a reference graphite as the negative electrode (taken from [26], cycled between 0.01 V to 1.2 V). The matching of the electrodes depends mainly on two parameters; the initial loading ratio and offset. The loading ratio corresponds to the capacity ratio between the two electrodes. The offset correspond to the slippage between the electrodes induced during the formation of the cell (initial SEI growth and/or irreversible material loss during the first few cycles). Figure 2b showcases the results of the emulation. The loading ratio was estimated at 1.04 and the offset at −0.5%. Since the half-cell data was collected using different electrolyte and separators than of the one used in the full cell, some minor adjustments were necessary to yield a better fit; the resistance was reduced by 0.4 Ω and the PE kinetics were accelerated by a factor of 1.33. From Figure 2b, it can be seen that the incremental capacity (IC) response for this cell has several specific features, labeled A to E. Peak A corresponds to the low voltage peak starting around 3.5 V. B corresponds to the low potential shoulder of the most intense peak C. D corresponds to the minimum of intensity between 3.8 and 3.9 V which is referred to as the arch. Finally, E refers to the intensity of the high voltage constant IC value at 4.1 V. Another reference performance test (RPT2) was performed after long-term cycling and compared against RPT1 to identify contributors to cell performance degradation.

3. Results

3.1. Single-Point Impedance Diagnostic Parameters

3.1.1. Determination of Current Perturbation Amplitude

Figure 3a,b show the narrow frequency range, 100–1000 Hz, EIS response for representative 18650 cells at 50% SOC (discharged 1.3 Ah) to various current perturbation amplitudes between 0.05–0.52 A at (a) 25 °C and (b) 0 °C analogous to a current of C/52–C/5, respectively. There is a significant improvement in the signal-to-noise ratio for current amplitudes 0.2 A and greater. The least noise is observed at an amplitude of 0.52 A (C/5 equivalent), a current within the capabilities of the cell chemistry. While the impedance responses change with temperature the precision in the EIS measurement remains high at this amplitude; and 0.52 A was selected as the current amplitude for subsequent EIS measurements, independent of temperature.

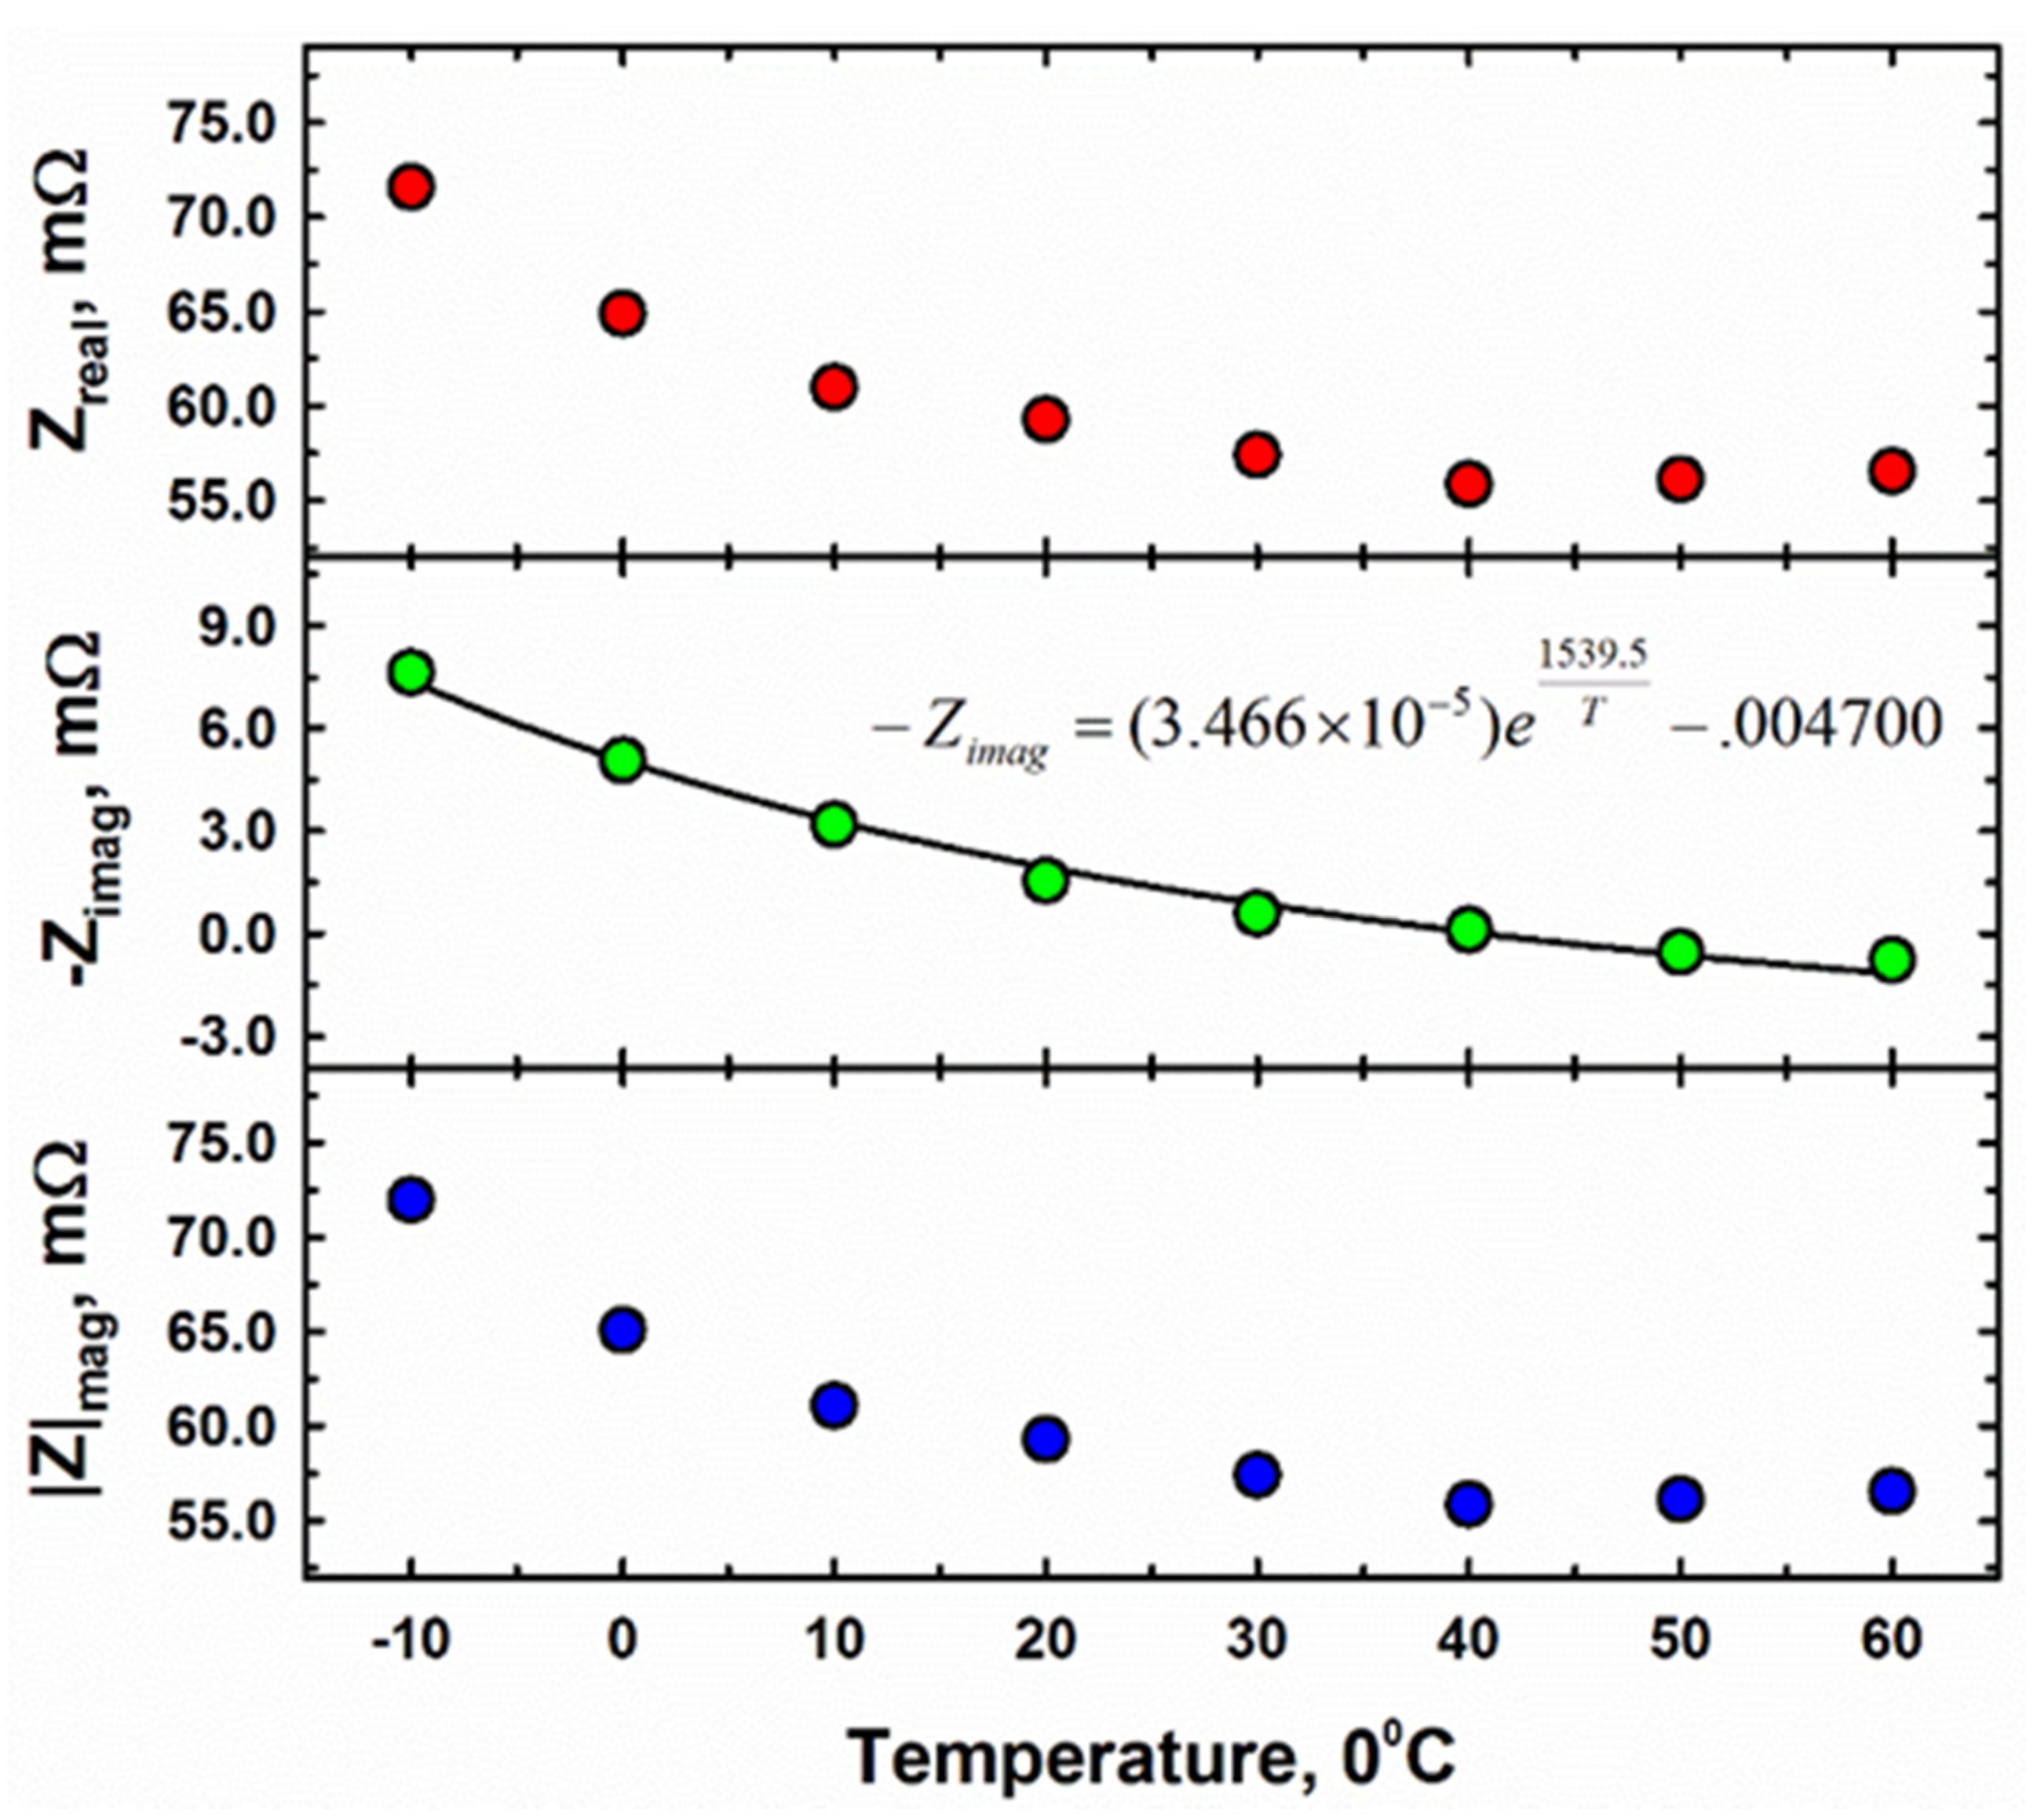
3.1.2. Continuity of fSOH with Temperature

Figure 3c,d show the average impedance and variance for EIS collected at 10% SOC increments between 10–100% for (c) 25 °C and (d) 0 °C between 100–1000 Hz, respectively. Close inspection of the impedance spectra shows a minimum variance in both the real and imaginary components at 316 Hz which corroborates previous findings for this commercial lithium-ion cell [3,18]. The results suggest that the SOH frequency provides the least variance in impedance response even with changes in temperature.

3.1.3. Temperature Dependence of Impedance Response

Figure 4 shows the temperature correspondence of the real and imaginary components of EIS collected at fSOH = 300 Hz between a broad temperature range of −10 °C to 60 °C as part of an unpublished effort [27]. An empirical relationship is found between impedance response and temperature using a least squares approximation. This simplistic relationship can then be used to adjust the expected impedance response based upon an additional input temperature value. The empirical exponential expression is given in the middle panel of Figure 4. Since the real component of impedance is an order of magnitude larger than the imaginary component, the relationship with temperature for the real impedance (top panel) and magnitude of impedance (bottom panel) are nearly identical. The temperature relationship with the imaginary component is important to develop a look-up style SOH map which is presented in the following section. The coupling of a single-point cell impedance, specifically the imaginary component, and internal temperature was reported by Spinner et al. [21] and validated against similar methodologies by Beelen et al. [28].

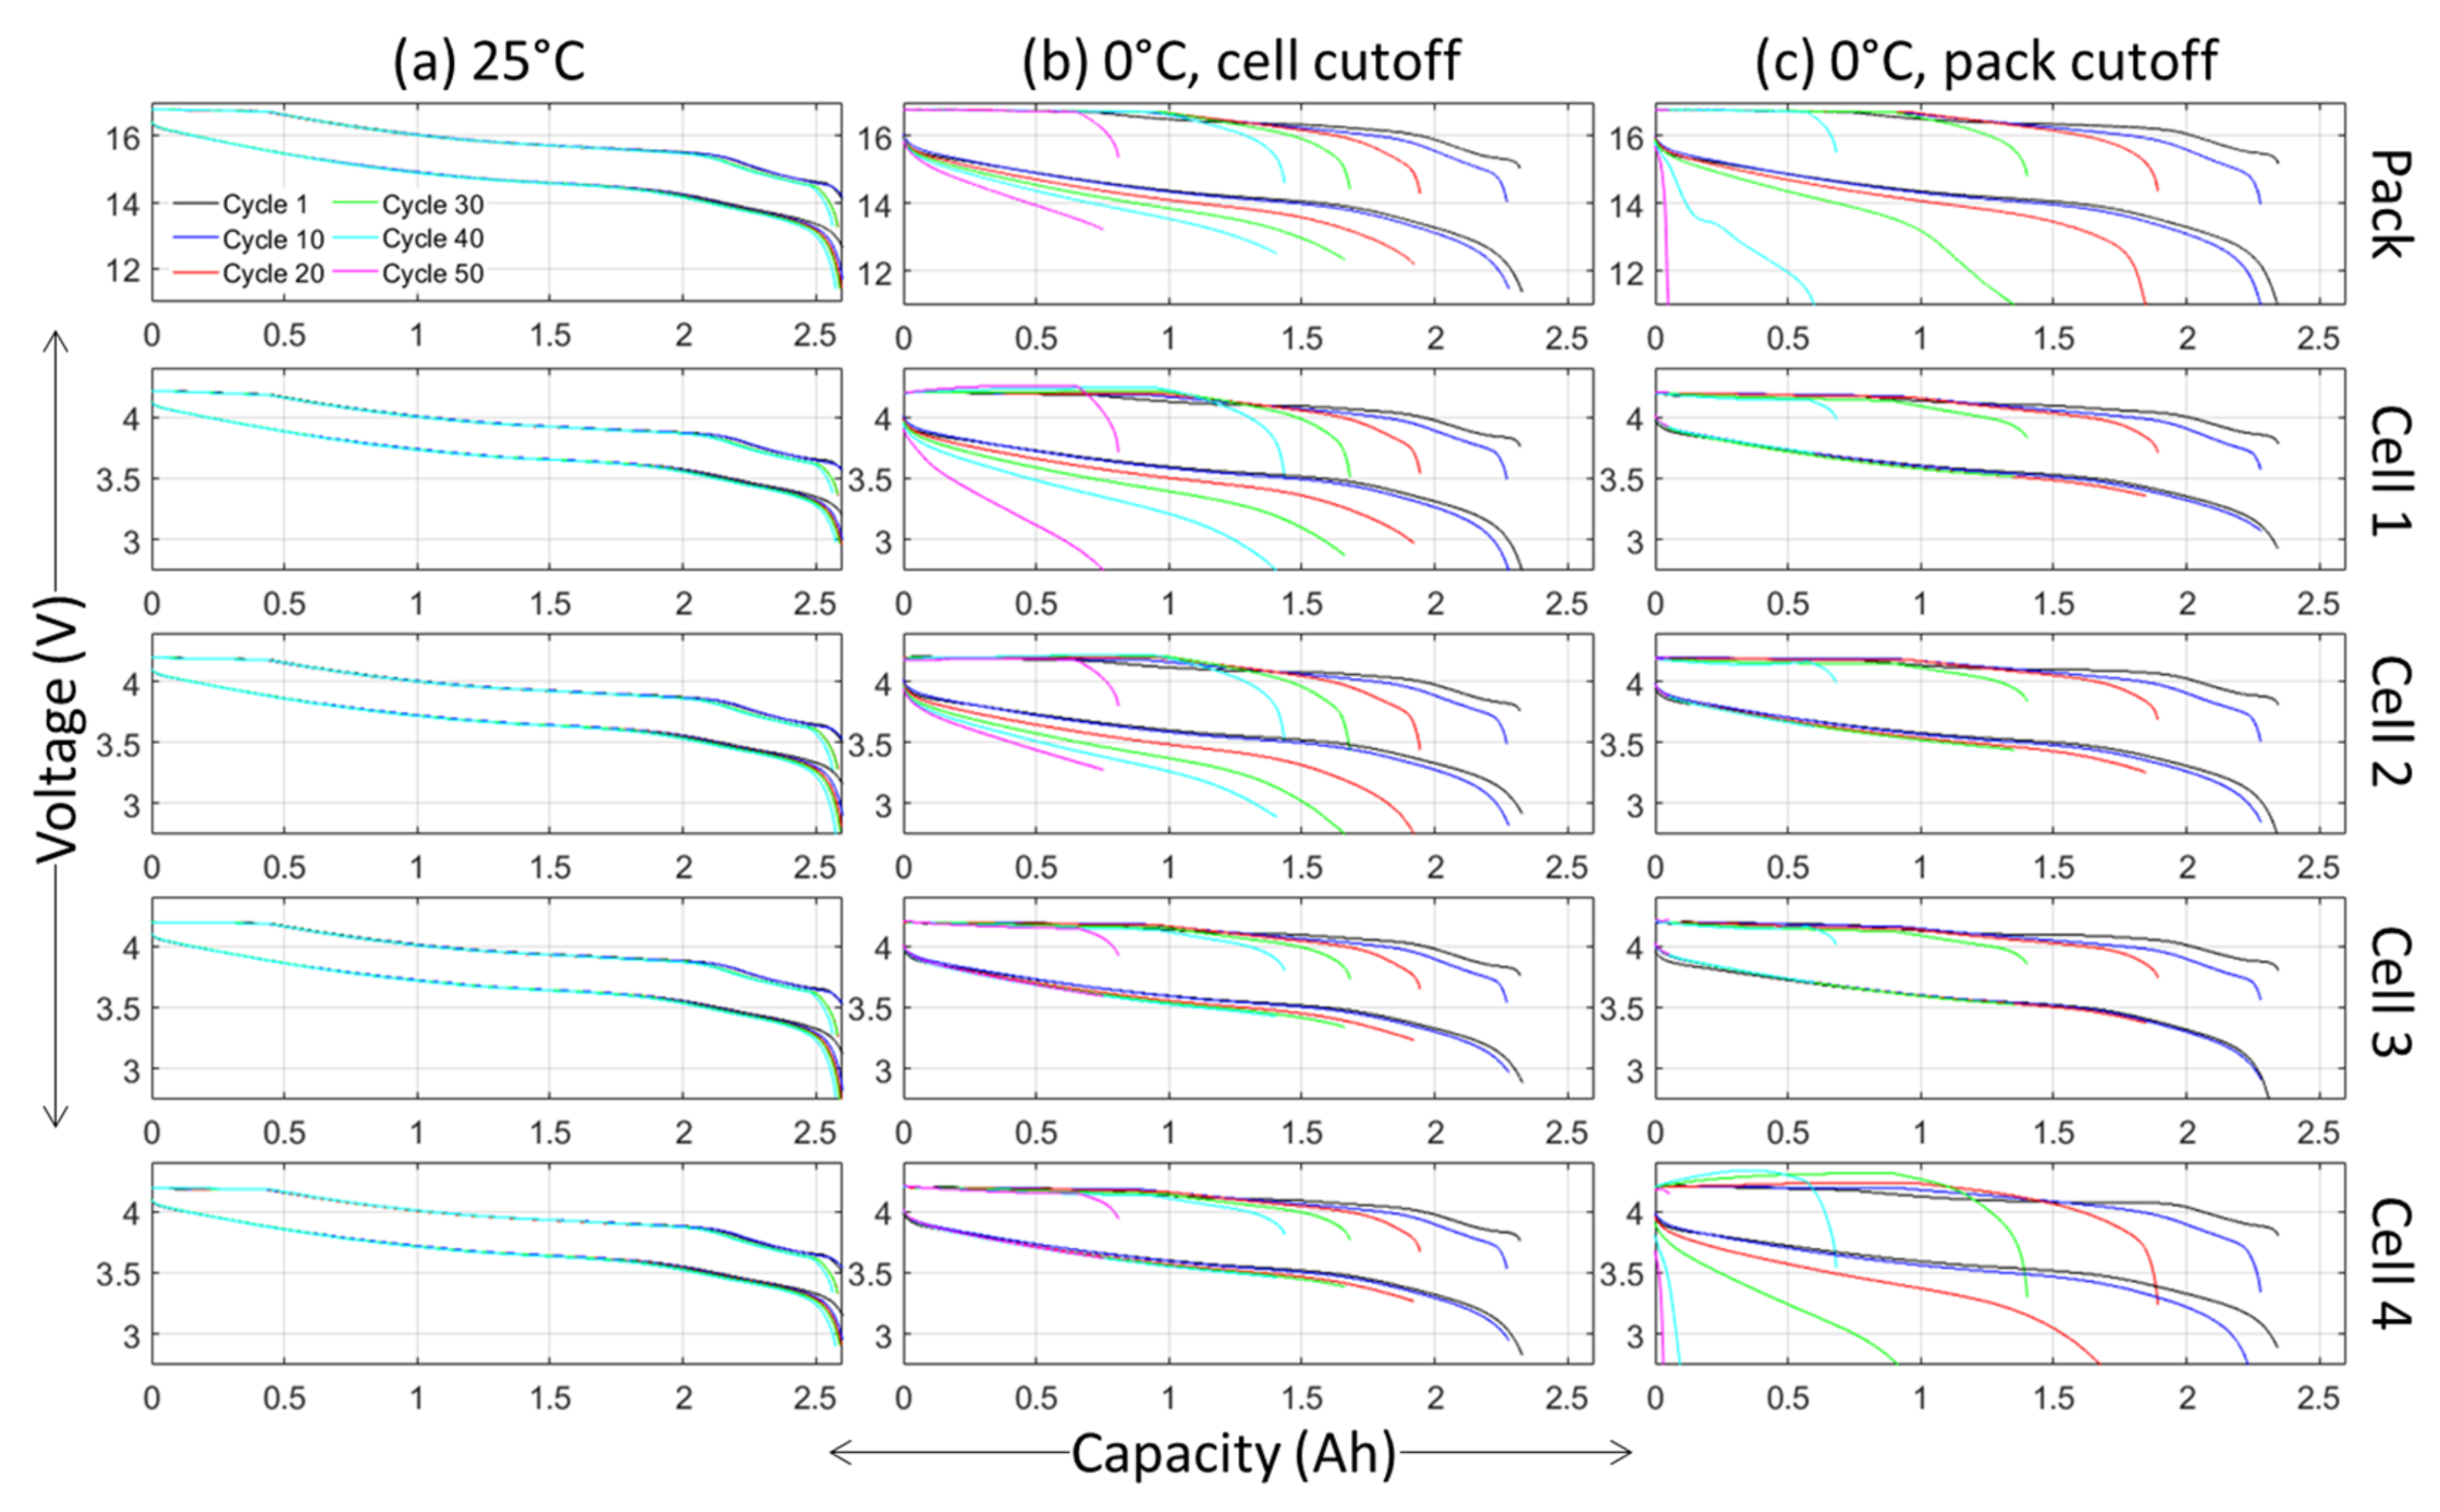
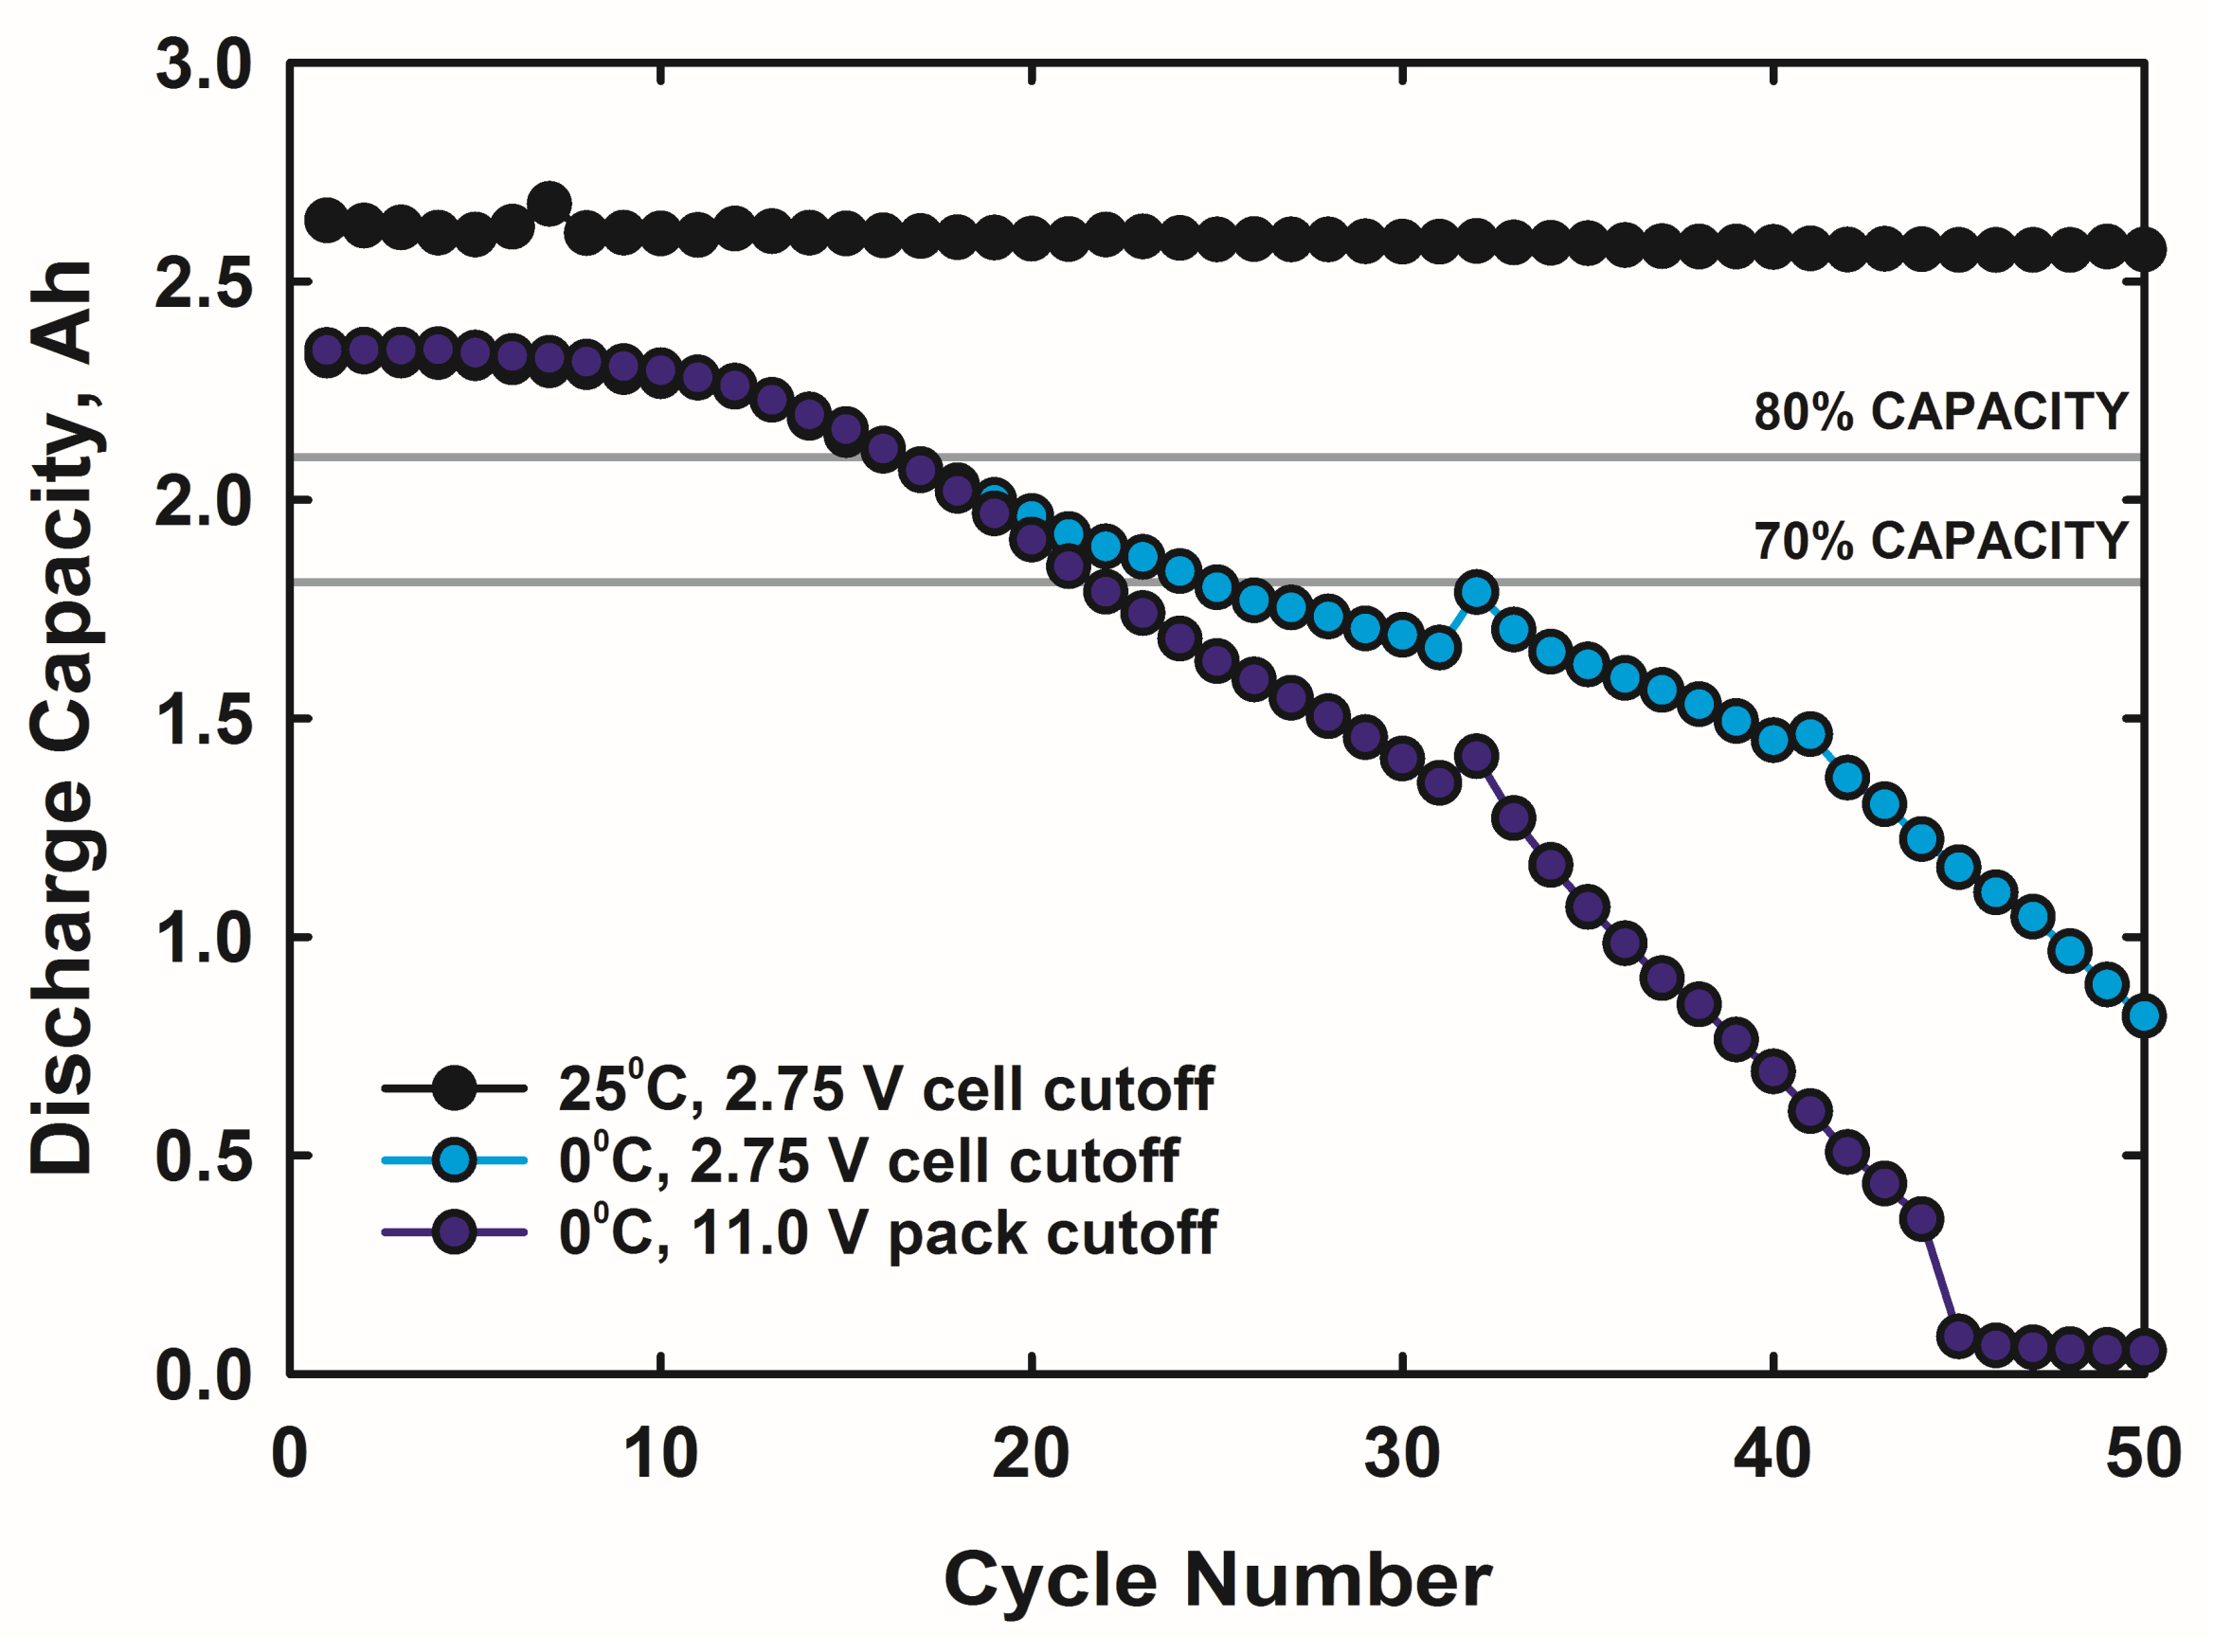
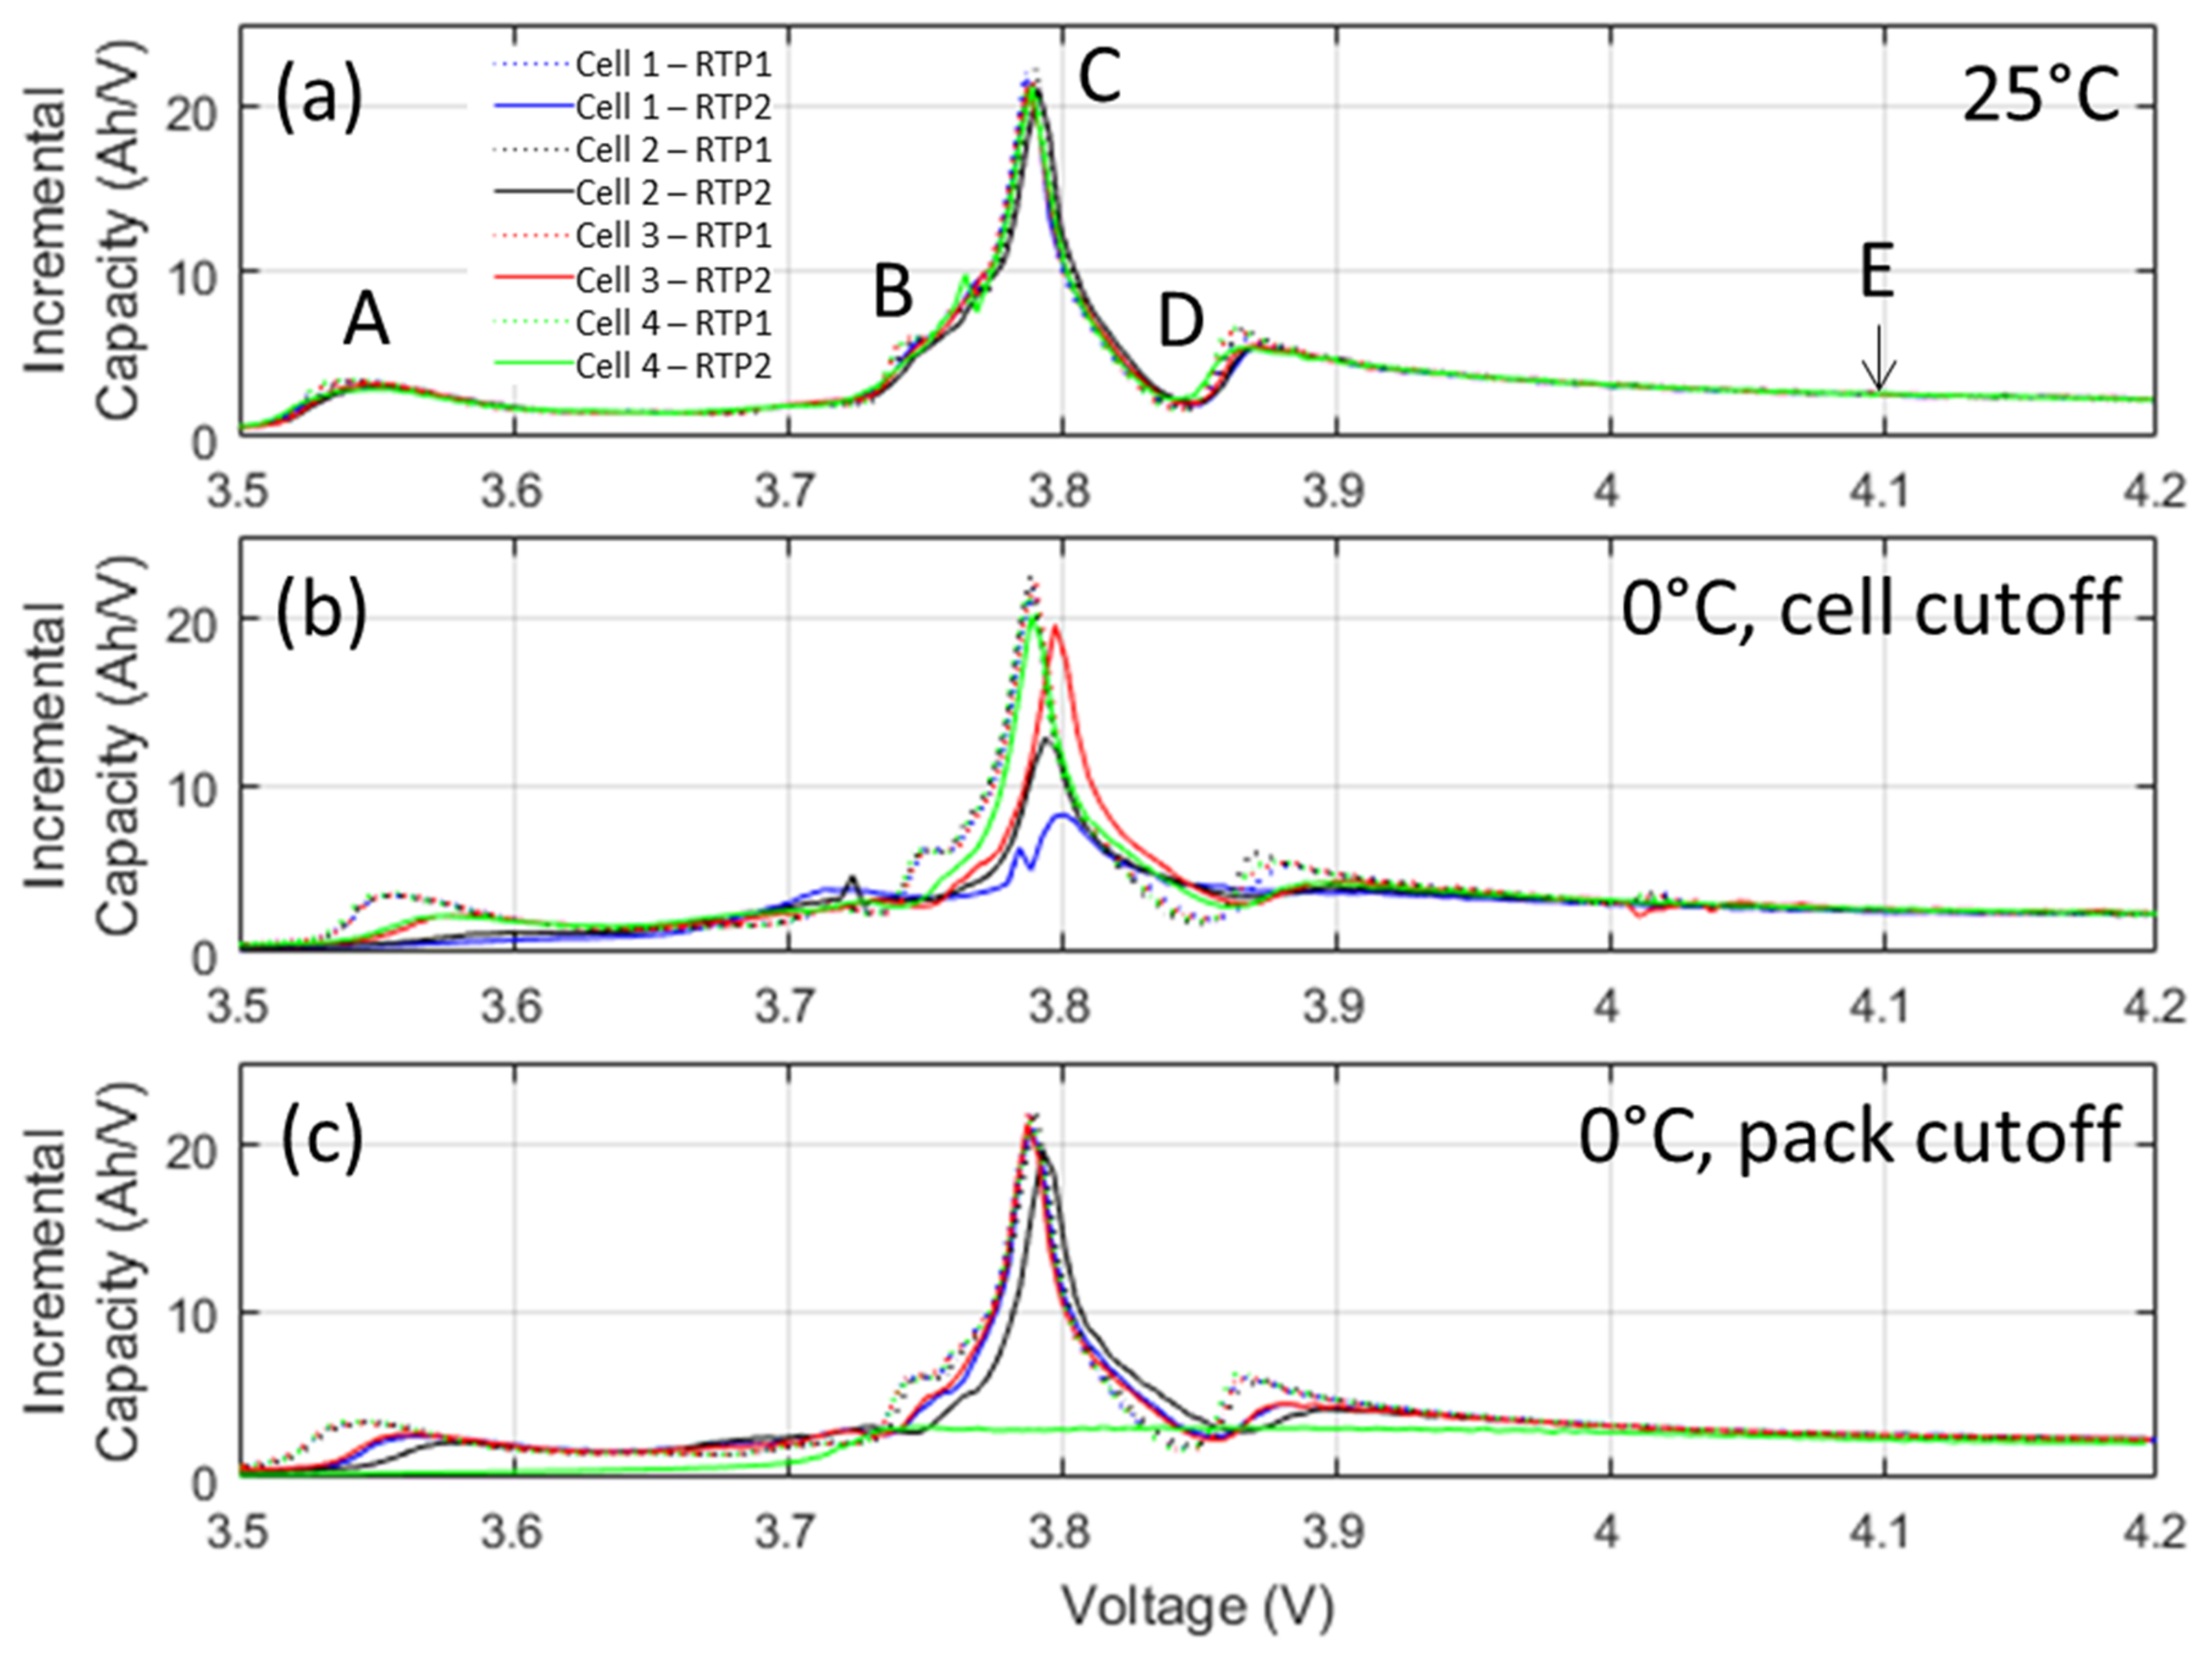
3.2. Pack Level Cycling

Figure 5 shows the charge/discharge vs. voltage curves for each individual cell within the 4S packs at three conditions for cycles 1, 10, 20, 30, 40 and 50: (a) 25 °C; (b) 0 °C with 2.75 V individual cell cutoff and (c) 0 °C with 11.0 V pack voltage cutoff. Charging was the same for all experiments with a 16.8 V cutoff voltage CC step followed by a CV step ending at a C/200 limiting current. Figure 5a shows a high degree of Coulombic efficiency for each of the four cells within the pack near ambient temperature operating conditions. Near uniform discharge capacity is displayed amongst each of the cells over the first 50 cycles. Cell 3 reaches the discharge cut-off voltage first but does not limit the available discharge capacity of the pack, which is the nominal 2.6 Ah. Cycling the cells at low temperature has a detrimental effect on the cycling performance. The initial discharge capacity decreases 10% to 2.34 Ah (Figure 5b,c) in part due to the increasing overpotentials required to overcome increases cell resistance at low temperature as reported by Friesen et al. [29] and Li et al. [30]. With repeated charge/discharge cycles at 0 °C the capacity fade becomes more significant. The decrease in capacity at low temperature has been reported to be linked to lithium plating on the graphite anode, causing a loss in available lithium ions for intercalation [13,31,32]. Figure 5b shows that for the pack at 0 °C with individual cell cutoff, Cell 1 reaches the discharge cut-off voltage first during cycles 1, 10 and 50. Cell 2 reaches the cut-off voltage first in the 30th cycle. Cells 3 and 4 within this pack cycled uniformly, albeit at reduced capacity, due to premature discharge cut-off associated with the limitations of Cells 1 and 2. Looking at the charges, Cells 1 and 2 started overcharging (end of charge > 4.22 V) around cycle 30. When the lower pack voltage terminated the discharge cycle, Figure 5c, the initial discharge capacity is similar for the first 20 cycles. After 20 cycles, however, there is a significant degradation in capacity retention due to the weakest cell, Cell 4, and it is starts overcharging around cycle 20. The charge/discharge profiles for Cells 1, 2 and 3 are nearly identical even though Cell 3 is driven below the recommended discharge voltage cut-off during the initial cycle. By the 10th cycle, Cell 4 is driven below 1 V after cycle 30 and near 0 V for the 50th discharge. The stronger performing cells (Cells 1–3) drive the weaker cell (Cell 4) towards voltage reversal. The forced overdischarge did not propagate a venting event nor thermal runaway.
Figure 6 shows the effects of temperature on capacity loss and the useful capacity for 4S packs cycled at three conditions.
Both packs cycled at 0 °C retain 80% capacity at 16 charge/discharge cycles and reached 70% nominal capacity after 24 cycles for 2.75 V individual cell voltage cut-off and 21 cycles for 11.0 V pack voltage cut-off, respectively.

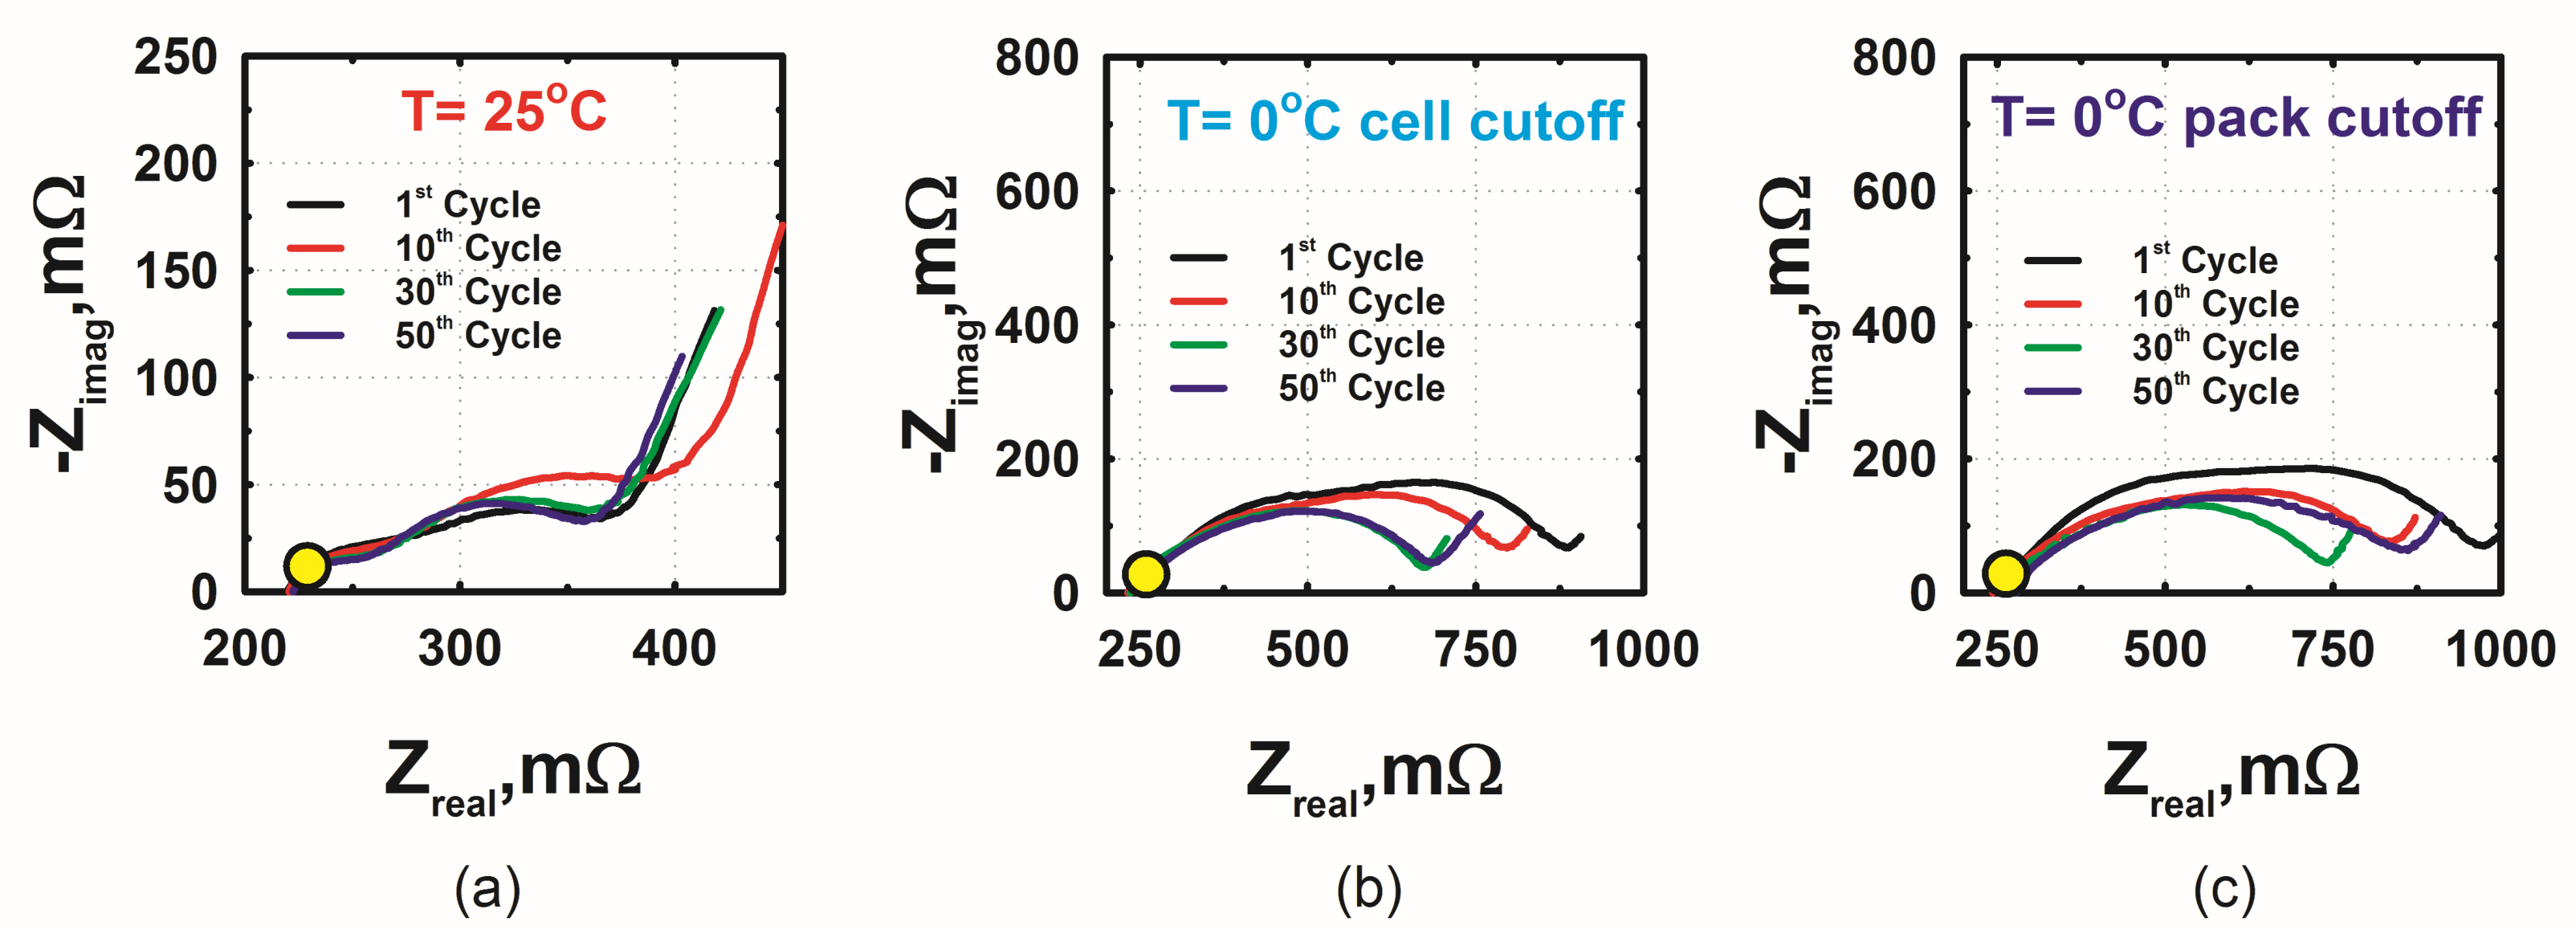
3.3. Analysis of Pack-Level EIS Monitoring

The impedance of the 4S pack is additive of each of the individual cells in series. Therefore, changes in individual cell impedance values are represented by a shift in the pack-level impedance. Figure 7 shows the evolution of the impedance spectrum from the 4S packs at 25 °C and 0 °C after 1, 10, 30 and 50 cycles. At 25 °C the typical impedance response includes 2 resistance/capacitance arcs and a Warburg impedance tail. Increased impedance is observed at cycle 10 before returning to original impedance for cycles 30 and 50. The origins of this reversible impedance gain and loss are unknown. Impedance within the 4S pack cells increase at low temperature. The single point impedance diagnostic at 316 Hz (identified as yellow circles) is insensitive to the larger physical impedance changes and continues to monitor the impedance response of most importance, the anode and cathode electrolyte interphases. These dynamic interphases evolve with cycling due to thickness and chemical compositional changes [33] which correspond to small variations in impedance response while large deviations in impedance response could be attributed to larger disruptions and degradation of these interphases. The overall pack impedance increases as the pack is cycled at 0 °C. The 0 °C voltage cutoff displays the largest impedance with cycling.
Figure 8 shows the impedance contributions for each cell in the 4S packs collected at fSOH = 316 Hz. Figure 8a shows the real and imaginary impedance of Cells 1–4 cycled at 25 °C through 50 cycles. The initial real impedance for Cell 3 is higher but does not propagate towards larger impedance with cycling. The imaginary component for all cells increases uniformly with cycling. Overall, slight initial impedance mismatch after the first cycle does not propagate towards larger scale impedance changes or variance when the pack is cycled at 25 °C. Modest and uniform increases in impedance do not significantly impact discharge capacity, as previously shown in Figure 6. The effects of impedance mismatch and imbalance are more evident with low temperature cycling. Figure 8b illustrates the real impedance increases in Cell 1 and the imaginary impedance increases for Cells 1 and 2 at the 50th cycle. For the pack voltage cut-off condition, Figure 8c, the weakest cell, Cell 4, is driven towards higher impedance as degradation increases until ultimately nearing a complete cell voltage reversal.
The data in Figure 3 and Figure 4 are utilized to develop the SOH Map specific to the cells under test presented in Figure 9. The SOH Map shows the average impedance response of uncycled cells at 25 °C and 0 °C, identified by a yellow circles. The dashed line represents the empirical relationship established between impedance response and local temperature, similar to that shown in Figure 4. As temperature decreases, the acceptable impedance responses shifts toward higher real and imaginary impedance. The free form shapes represent arbitrary risk indexes where green envelopes 3× the impedance variance across 0–100% SOC , orange is 4× and red is 5× the impedance variance at the identified temperatures. The boundaries for the risk indexes are developed arbitrarily, but can be informed with future safety testing of cells cycled under the abusive low temperature condition. The small black dots indicate the actual impedance response of the 4S pack to the fSOH when cycled at 25 °C for 1st, 10th, 30th and 50th cycles. There is little change in the impedance response over 50 charge/discharge cycles at this temperature. The pack level impedance response is much different for 4S packs cycled at 0 °C. The pack level impedance is shown for 4S with 2.75 V cell cutoff (light blue circles) and 11.0 V pack cutoff (dark blue circles) where the number inside the circle indicates the number of completed cycles prior to diagnostic testing. Clearly the low temperature cycling condition is abusive to the 4S pack, particularly the pack discharged to pack voltage cutoff of 11.0 V. The increased impedance which has been presented previously is due to the slow kinetics of cell reactions at low temperatures [34].

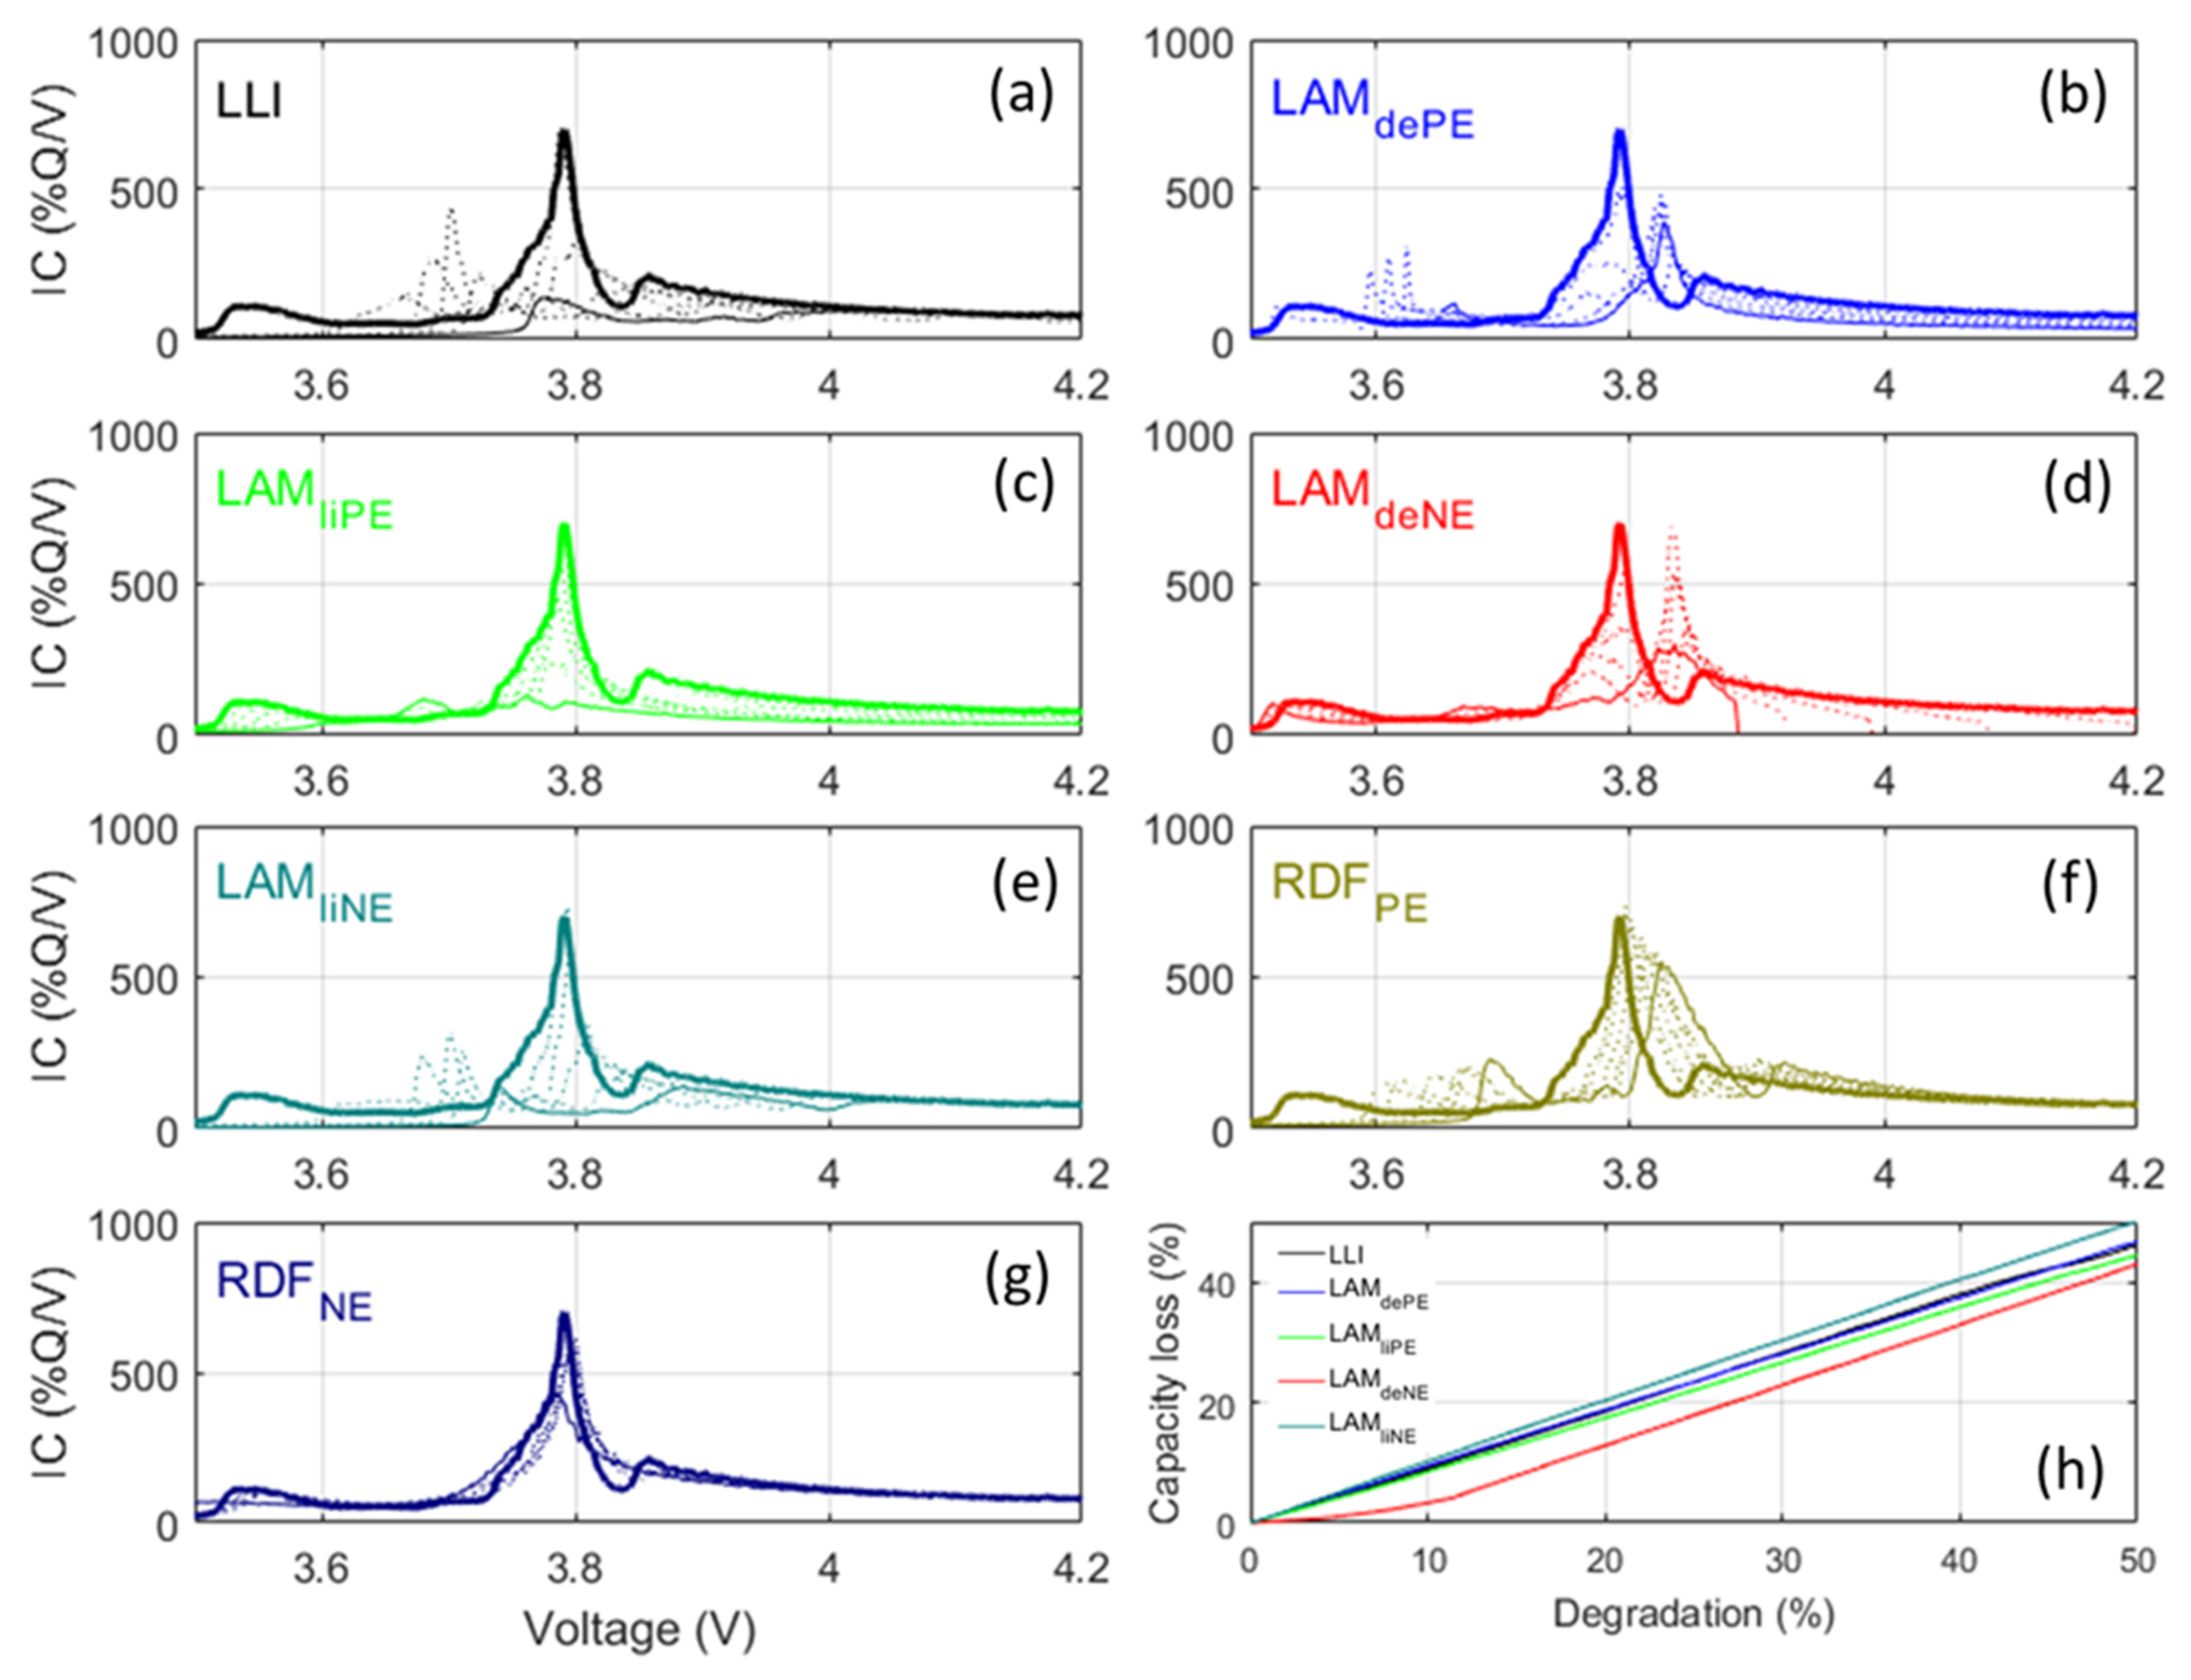
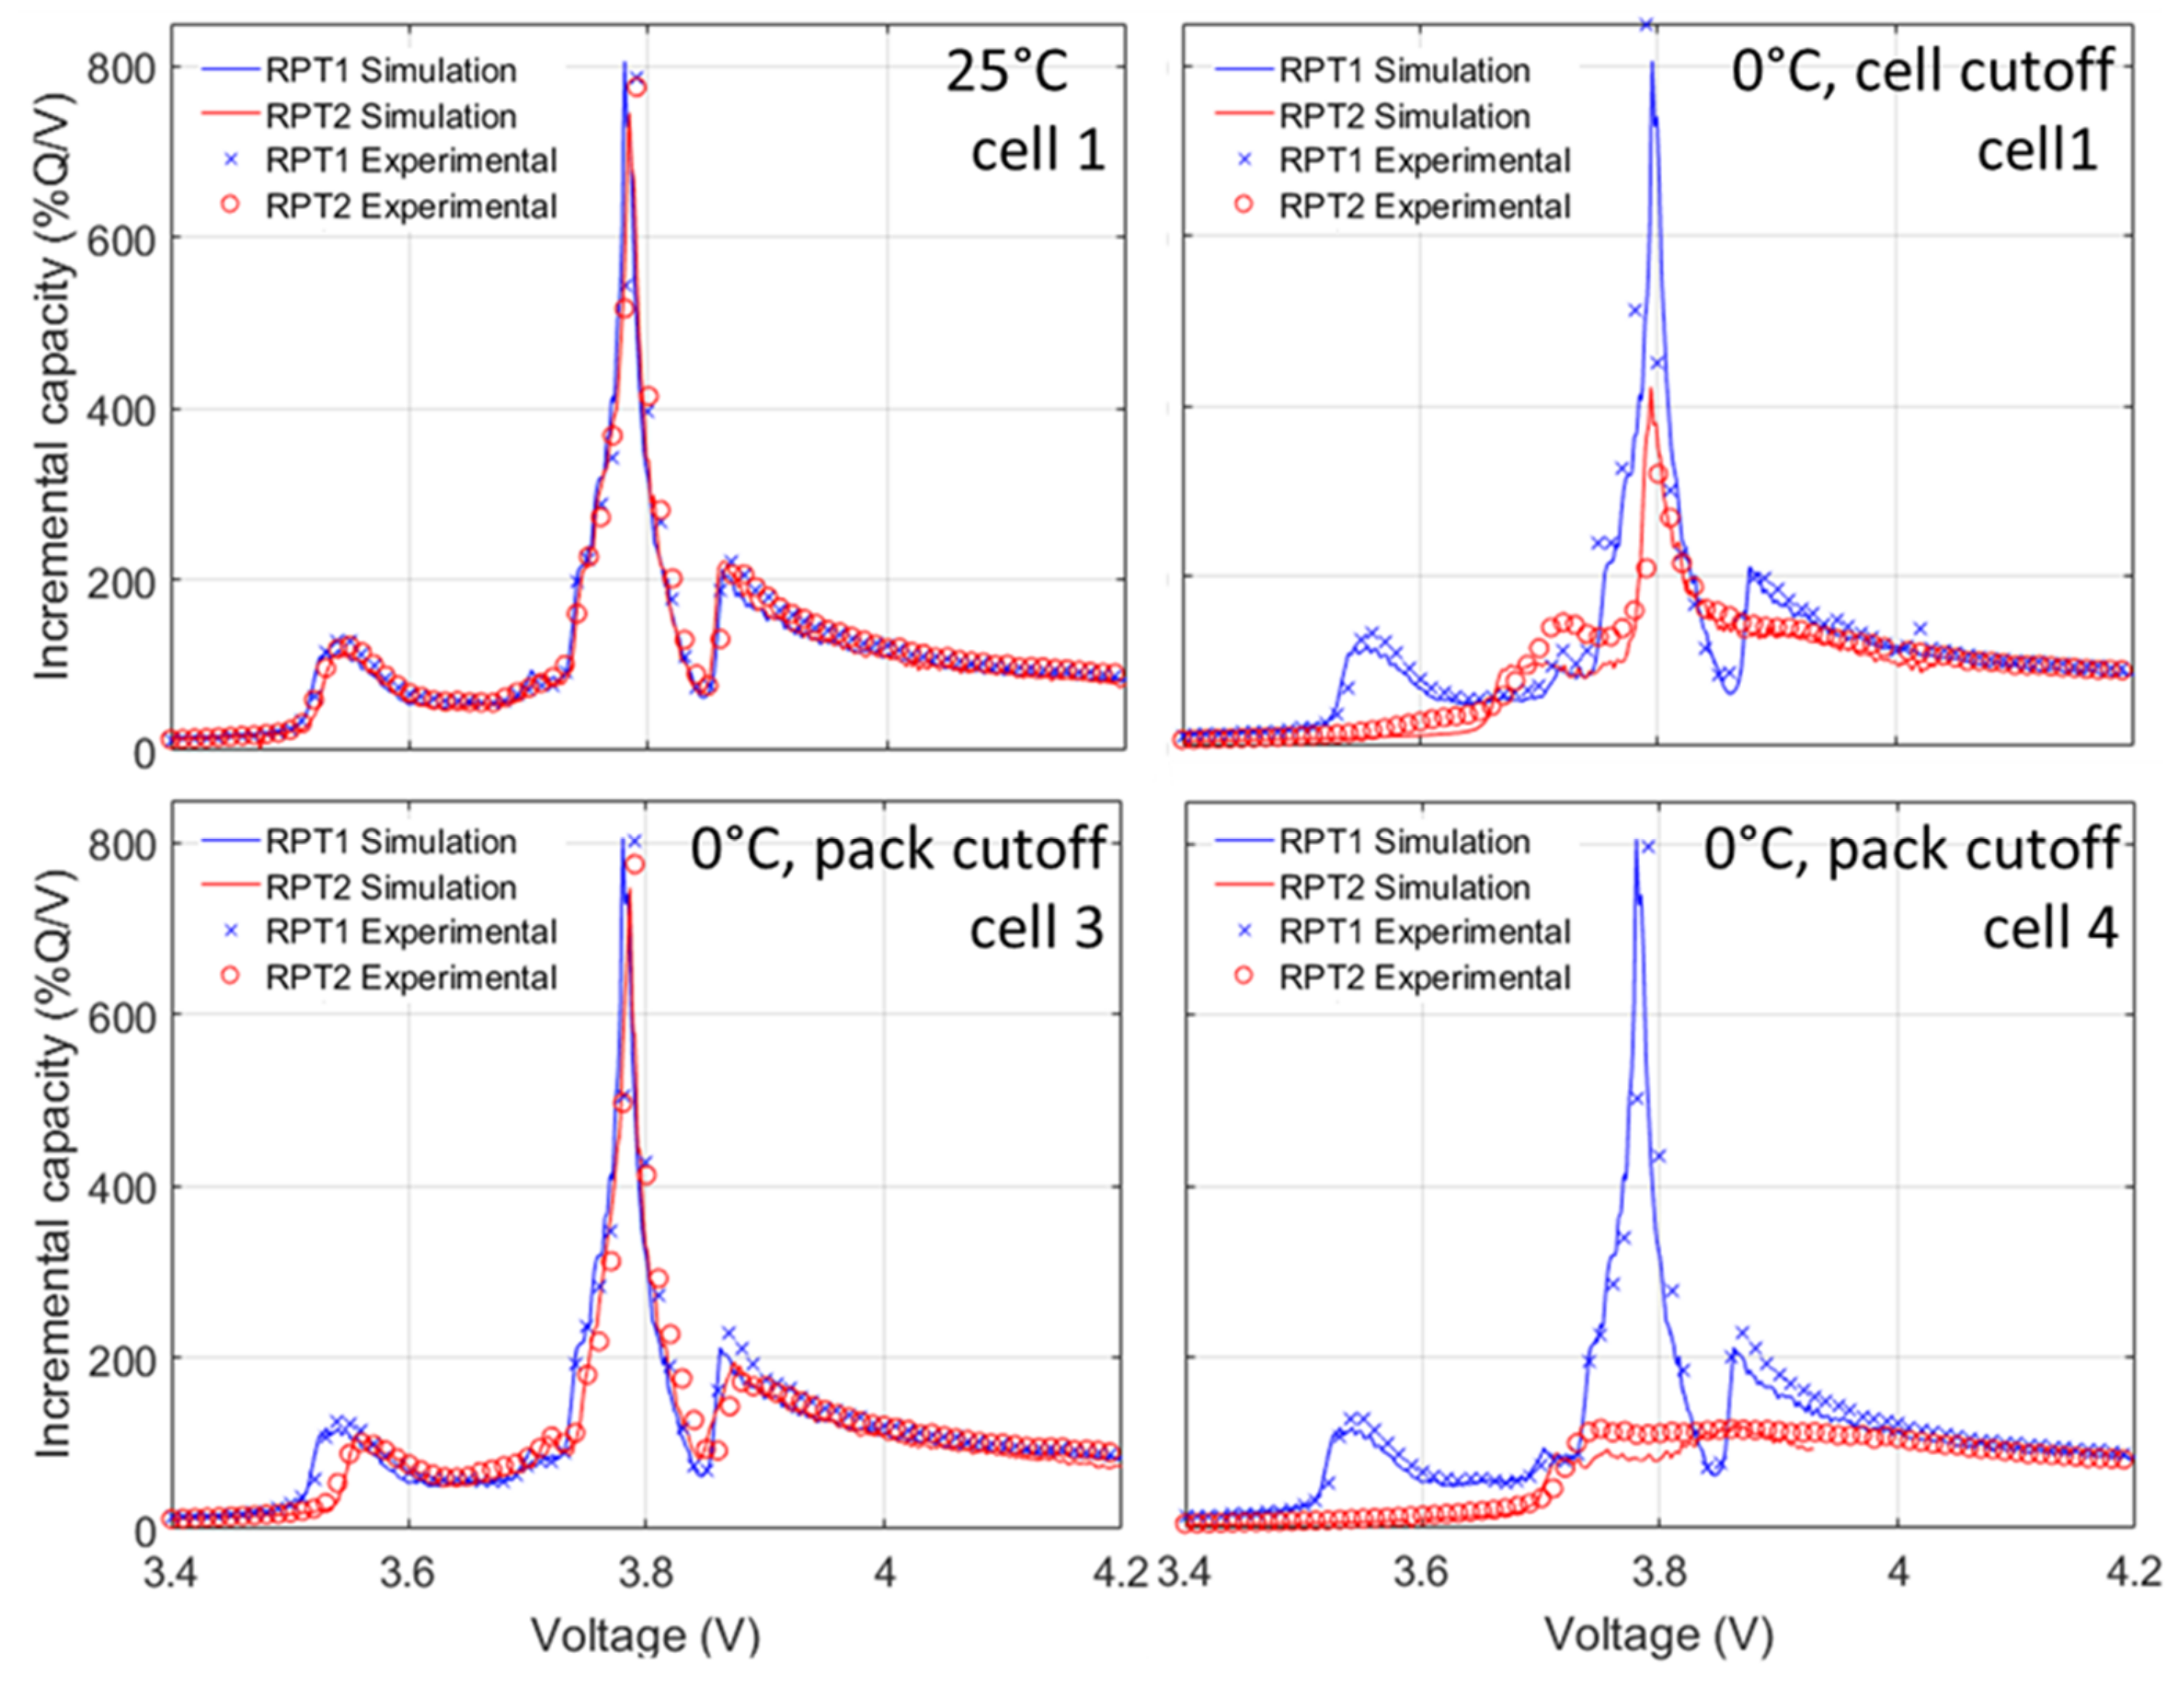
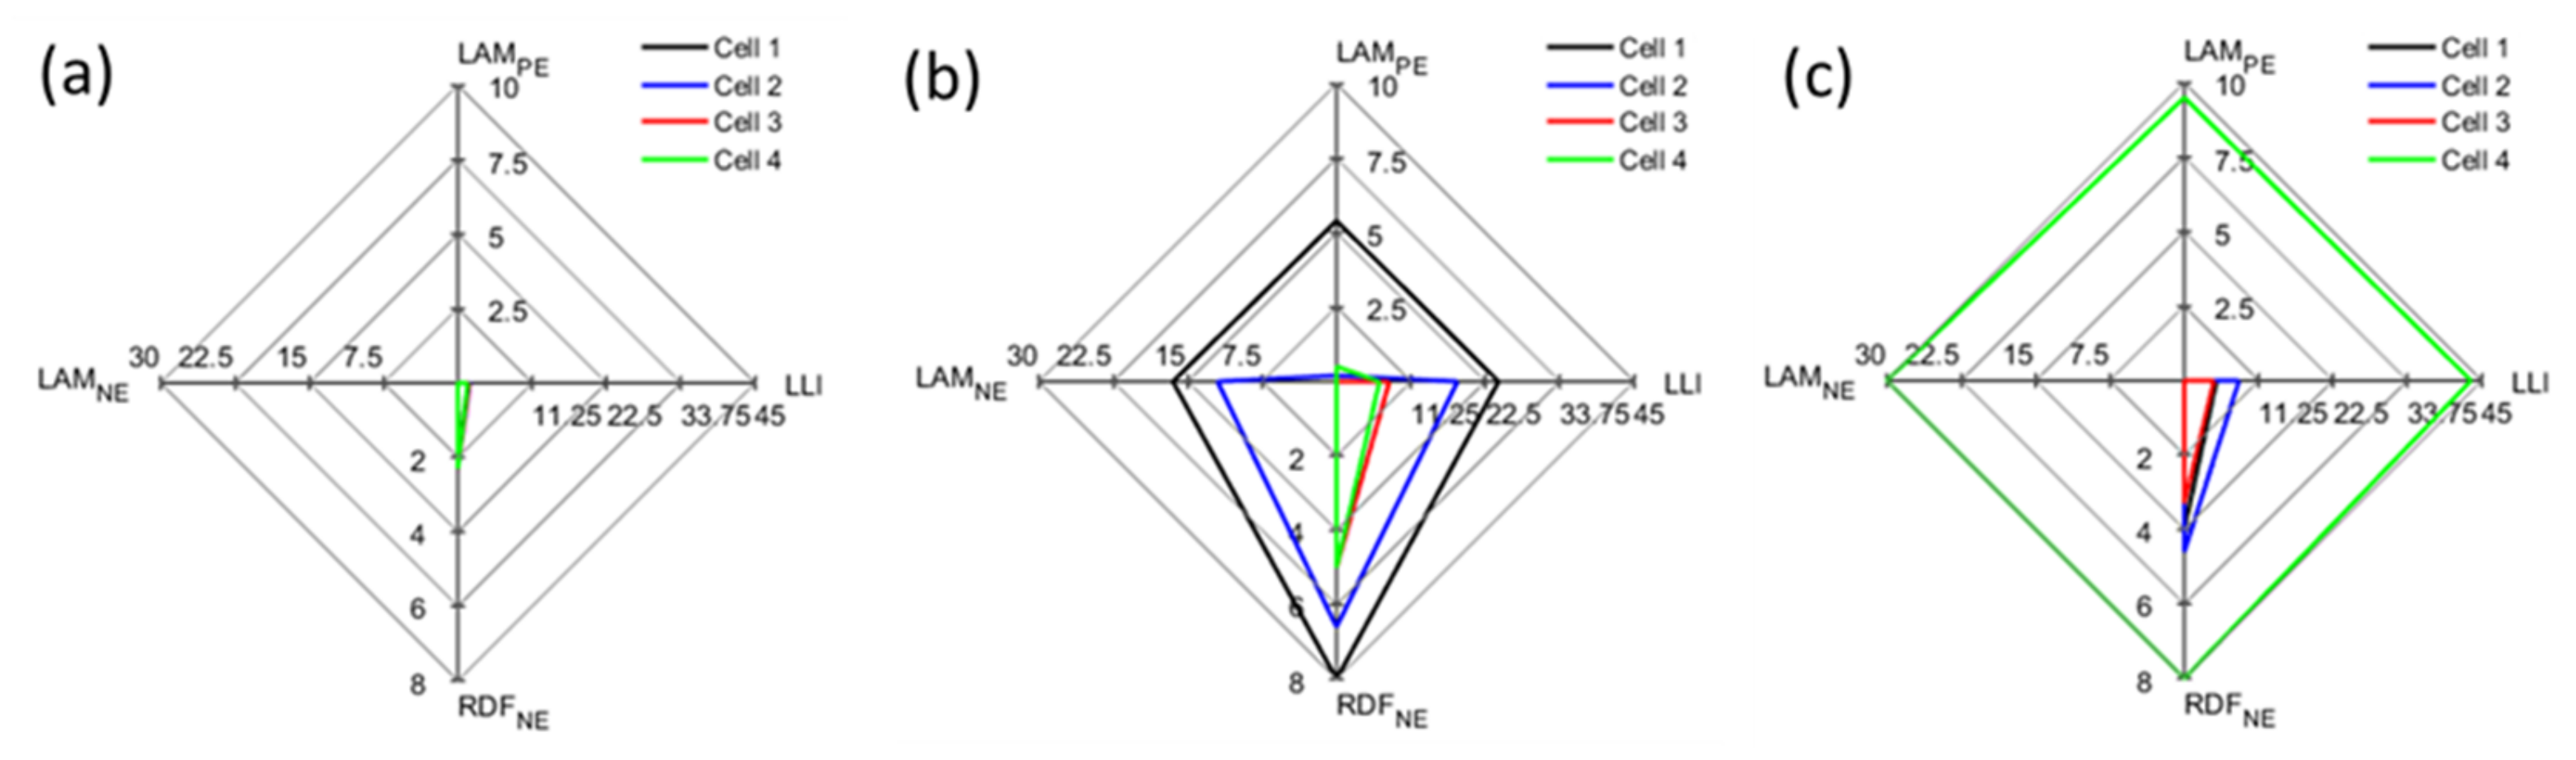
3.4. Validation of Specific Degradation Modes from Impedance Diagnostic Early Warning

In order to investigate what triggers the accelerated capacity fading at low temperature, the emulated cell presented in Figure 2 and the corresponding half-cell data for the positive electrode (PE) and the negative electrode (NE), are used to simulate the impact of different degradation modes on the cell voltage signature and capacity loss. Figure 10 presents the degradation tables for the emulated cell. It showcases the impact of up to 50% of loss of lithium inventory (LLI), loss of active materials on delithiated positive electrode (LAMdePE), loss of active material on lithiated positive electrode (LAMliPE), loss of active material of delithiated negative electrode (LAMdeNE), loss of active material lithiated negative electrode (LAMliNE), the rate degradation factors of the positive and negative electrodes (RDFPE, RDFNE). According to the equations in [20]; LLI is simulated by increasing the SOC offset between the PE and the NE and LAMs are simulated by adjusting the loading ratio between the NE and the PE. The RDF, which represents the impact of up to 10-fold changes in the electrode kinetics for the PE the NE respectively, is emulated by using the voltage response of the cell at a higher rate and an adjusted polarization [35]. Any capacity loss induced by the RDF simulation was taken into account as LAM. Finally, Figure 10h displays the capacity loss associated with the first main modes of degradation (Figure 10a–e). All the individual degradation mechanisms with the exception of LAMdeNE induced a capacity loss proportional to the amount of degradation. For LAMdeNE, there is a delay of 10% before the capacity loss occurs. This is because the loading ratio is superior to one which implies a slight excess of graphite compared to the PE.

4. Discussion

In order to characterize the degradation of the cells and validate EIS observations, reference performance tests (RPTs) were undertaken after long-term cycling at 25 °C and 0 °C and compared to the initial RPT1 measurement. Incremental capacity curves associated with the three packs cycled at 25 °C, 0 °C with cell voltage cutoff and 0 °C with pack voltage cutoff are showcased in Figure 11a–c, respectively. In Figure 11, dashed lines refer to the initial RPT1 before cycling and full lines to the final ones RPT2 after cycling. Only minimal degradation (~1.5%) is observed for the cells within the pack cycled at 25 °C (Figure 11a). A slight reduction in the incremental capacity peak height was observed for peaks A and C. Moreover, the arch position (D) shifts towards higher potentials. Changes are similar for each of the four cells within the pack. This suggests that a common degradation mechanism with minimal aging spreads uniformly amongst each of the four cells in the 4S pack. These results are typically observed in similar commercial cells cycled under non-abusive conditions [20].
Low temperature charge/discharge operation has a detrimental effect on battery performance as shown previously by the rapid capacity fade in Figure 6. The incremental capacity curves in Figure 11b,c offer insight into the changes in the voltage response of the cells occurring during abusive 0 °C charging and discharging. The detrimental effects of low temperature cycling are clearly seen in the full lines in Figure 11b where significant peak height reductions and dramatic peak shifts towards higher voltages are observed notably for peaks A and C. They are much more pronounced than those observed at 25 °C and indicate severe degradation of the electrodes. Additionally, the arch also shifts more towards higher potential and its intensity increases. To the contrary of the 25 °C condition, not all the cells showcased the same voltage variations. Therefore it seems that cell degradation is inhomogeneous at lower temperatures. Similar results have also recently appeared in the literature [36].
Individual cell degradation is provided in Table 2 for cells cycled at 25 °C and 0 °C. The largest changes in the incremental response after low temperature cycling are observed for cells which also showed the greatest cell impedance increases in Figure 8. For the 4S pack cycled at 0 °C with 2.75 V cell cutoff, Cell 1 shows 25% degradation (Figure 11b and Table 2) which corresponds to a significant increase in the impedance response (Figure 8b, Cell 1). Revisiting Figure 5b we see overcharge abuse to Cell 1 by the 50th cycle and Cell 2 at the 30th cycle. The degree of degradation is similar for Cell 2, 19%. The worst condition occurs for low temperature cycling with pack voltage cut-off. In this condition, the weakest cell, Cell 4, is driven further and further into overcharge and overdischarge condition, ultimately leading to 44.5% capacity degradation. Only modest degradation was seen in Cells 1, 2 and 3 for this condition. While the pack voltage never dropped below the recommended cut-off voltage, 11.0 V, the health of the inferior cell was influenced and decreased by the neighboring cells.
In order to evaluate the origins of degraded cell performance a thorough examination of cell incremental capacity was performed. Full details of this analytical method are provided in the following references [24,25]. Each curve in Figure 10 represents a unique degradation mechanism typically observed for lithium-ion cells with degraded capacity as discussed in Section 3.4. From Figure 10 and Figure 11 it is possible to extract all the necessary information to diagnose the cells from the IC curves. First, looking at changes in the intensity at 4.1 V (E), LAMPE can be calculated. Indeed, from Figure 10, it can be seen that the only degradation affecting this intensity, without changing the shape of the peak (Figure 10d) is LAMPE. Also, it can be concluded that in all cases, the loss of capacity was induced by LLI. As explained in [25,35], capacity loss induced by LLI and LAMs are not additive and only the highest is actually inducing capacity loss. In this case, the calculated LAMs are much lower than the observed capacity loss. Moreover, as explained above and from the shape of the IC curves, LAMdeNE is not inducing any capacity loss. Therefore, LLI must be inducing all the capacity loss and it can therefore be quantified. Changes in arch intensity (D) can only be attributed to a decrease of the kinetics of the NE, Figure 10g, this decrease can therefore also be easily quantified. The final parameter to quantify is LAMdeNE. It cannot be directly quantified from the IC curves because no independent feature is identifiable. The overall appearance of the IC curve upon simulation of different amount of LAMdeNE was used to quantify the last parameter until a proper fit was found. This includes matching the change in potential of the arch D when possible; some examples of the obtained fits are presented in Figure 12. The results of the quantification, i.e., the parameters used for the simulation in Figure 12, are presented in Figure 13. For the pack cycled at 25 °C (Figure 13a), all four cells degraded the same way with between 1.5% and 1.8% LLI associated with a rate degradation between 2 to 2.3 between RPT1 and RPT2. For the packs cycled at 0 °C with cell cutoff, LLI was of 6.5 and 8% for Cells 3 and 4, the least affected, and up to 18.3 and 24.5% for Cells 2 and 1, respectively. RDF was of 5 for the least affected cells and 6.6-8 for the more affected cells. The more affected cells also experienced LAMNE (16.5 and 12% for Cells 2 and 1, respectively) and LAMPE for Cell 1 (5.4%).
Finally, for the pack cycled at 0 °C with pack cutoff, the least affected cells experienced LLI in the 4–8% range and a RDF between 3 and 5 whereas the worst affected cell experienced more than 43% LLI, 30% LAMNE, 10% LAMPE and an RDF of 8. Overall, all cells experienced some LLI and some RDF to some degree, with more degradation at 0 °C. The more affected cells were the only one with some LAM on the PE and the NE.
In order to identify why Cells 1 and 2 for the pack with cell cutoffs and Cell 4 for the pack with pack cutoffs failed, it is necessary to investigate further the cycling data. As already discussed, Cells 1 and 2 only started overcharging at cycle 30 and above and Cell 4 from cycle 20. Additionally, Cell 4 started to overdischarge from cycle 10 (voltage below 2.5 V). In order to determine what factors are responsible for the inhomogeneous aging, the IC curves during cycling are studied (Figure 14). It is especially interesting to investigate the first 15 cycles where no overcharge nor overdischarge conditions are recorded on any cells and where the cells underwent the same cycling conditions and thus should have degraded in a similar fashion. From this analysis it can be seen that for the pack with cell cutoff, Figure 14a, Cell 1 degrades faster than Cell 3 but in a similar fashion. Indeed, the IC signature of cycle 7 for Cell 1 is the same than of cycle 10 for Cell 3. The same can be said for cycles 14 and 20 for Cells 1 and 3, respectively. This implies that under similar cycling conditions (same temperature, current, resistance and cutoffs), Cell 1 degrades similarly to Cell 3 but twice as fast. The same can be said for Cell 4 compared to Cell 1 in the pack cutoff experiment. The origin of this accelerated degradation cannot be linked to the experiment and must then be intrinsic to these cells.
A spread of capacity loss for cells cycled under the same condition at room temperature in the 25% range was already reported in the literature [37,38]. This is much lower than the 100% reported here so there may be an impact of temperature. Performing the same analysis on all the remaining cells showcases that differences in degradation pace to the slowest degrading cell were between 11% and 120%. The overcharge from cycle 30 onwards must then be responsible for the higher pace of LLI and for the LAMs observed at RPT2 for Cells 1 and 3 of the pack with cell cutoff. The overdischarge also has impact since Cell 4 of the second pack degraded must faster than Cells 1 and 3 of the other low temperature pack after cycle 20.

5. Conclusions

The results clearly suggest a significant performance loss with low temperature cycling for 4S packs, particularly when pack voltage is used for charge/discharge cutoffs. The utility of the single-point impedance diagnostic applied to a 4S pack cycled as 0 °C has been validated to identify internal cell faults within the strand. This technique provides an increased capability to monitor the state-of-health and stability of lithium-ion batteries cycled at low temperature. The primary conclusions of this work pertaining to the utility of the single-point diagnostic are as follows: (i) a current amplitude perturbation of 0.52 A is sufficient to produce high signal-to-noise impedance response when applied across the 4S pack; (ii) the previously identified single-point state-of-health frequency (fSOH = 316 Hz) for the cell type under test provides the least variance in impedance response from 0–100% SOC and over the temperature range, −10 °C to 60 °C; (iii) the imaginary component of the impedance response at fSOH is temperature dependent and can be expressed through a simple exponential equation; (iv) the single-point technique applied to the 4S pack is able to identify cell faults within the strand during 0 °C cycling; and (v) a state-of-health map is generated with temperature specificity which can be enhanced to incorporate operational risk boundaries that trigger an early warning alert of a potential cell failure. The secondary conclusions of this work pertaining to identification of cell performance loss and degradation mechanisms associated with 0 °C cycling are as follows: (vi) analysis of individual cell impedance shows the most significant increases in impedance are observed for Cell 4 in the 4S pack with pack voltage cutoff; (vii) modest impedance is observed for Cells 1 and 2 in the pack with cell voltage cutoff; (viii) a common degradation mechanism was observed throughout Cells 1–4 cycled at 25 °C; and (ix) severe degradation of Cells 1 and 2 for cell voltage cutoff and Cell 4 for pack voltage cutoff is induced by a significant loss of lithium inventory.
The lack of cell level control within the pack gives rise to severe degradation of a weak cell within as shown in Figure 8c Cell 4 and identified as an early fault detectable in the SOH Map in Figure 9. Since the 4S pack never decreases in pack voltage below the acceptable 11.0 V cutoff, simple voltage monitor and controls will not identify a potential hazard within the pack. The application of a simple, single-point impedance-based diagnostic helps to identify the onset of cell degradation as an early warning to the user to remove the damaged cells from service, eliminating a potential safety hazard. Battery management systems which rely on pack voltage control alone for charge/discharge terminations can compromise cell stability; where the SOH of the weakest cell is further compromised with repeated cycling, especially at low temperature. Maintaining acceptable voltage limits at the cell-level is critical but not necessarily practical. The application of the single-point impedance diagnostic can be applied successfully at the pack-level even during abusive low temperature cycling to root out cell-level faults. The ability of the single-point diagnostic measurement to identify cell-level degradation and decreased SOH through pack-level monitoring supports its utility for comprehensive battery management applications.

Author Contributions

All authors contributed towards this publication. Corey T. Love and Matthieu Dubarry wrote the manuscript. Corey T. Love, Matthieu Dubarry, Tatyana Reshetenko, Arnaud Devie and Neil Spinner all performed experiments and contributed towards data analysis. Karen E. Swider-Lyons and Richard Rocheleau facilitated the collaboration between NRL and HNEI.

Conflicts of Interest

The authors declare no conflict of interest.

Abbreviations

4Sfour cells in series
CCconstant current
CC-CVconstant current-constant voltage
DCdirect current
DMCdimethyl carbonate
ECethylene carbonate
EISelectrochemical impedance spectroscopy
fSOHstate-of-health frequency
HNEIHawaii Natural Energy Institute
ICincremental capacity
ICCTinitial conditioning and characterization testing
LAMdeNEloss of active material on delithiated negative electrode
LAMdePEloss of active material on delithiated positive electrode
LAMliNEloss of active material on lithiated negative electrode
LAMliPEloss of active material on lithiated positive electrode
LLIloss of lithium inventory
MIST-BTSmodular one-channel signal treatment-battery testing system
NEnegative electrode
NRLU.S. Naval Research Laboratory
OCVopen circuit voltage
PEpositive electrode
PTFEpolytetrafluorethylene
RDFNErate degradation factor negative electrode
RDFPErate degradation factor positive electrode
RPTreference performance test
SEIsolid electrolyte interphase
SOHstate-of-health
SOCstate-of-charge
VCvinylene carbonate
Zimagimaginary impedance
|Z|magimpedance magnitude
Zrealreal impedance

References

  1. Lu, L.; Han, X.; Li, J.; Hua, J.; Ouyang, M. A review on the key issues for lithium-ion battery management in electric vehicles. J. Power Sources 2013, 226, 272–288. [Google Scholar] [CrossRef]
  2. Zhang, J.; Lee, J. A review on prognostics and health monitoring of Li-ion battery. J. Power Sources 2011, 196, 6007–6014. [Google Scholar] [CrossRef]
  3. Love, C.T.; Virji, M.B.; Rocheleau, R.E.; Swider-Lyons, K.E. State-of-health monitoring of 18650 4S packs with a single-point impedance diagnostic. J. Power Sources 2014, 266, 512–519. [Google Scholar] [CrossRef]
  4. Barré, A.; Deguilhem, B.; Grolleau, S.; Gérard, M.; Suard, F.; Riu, D. A review on lithium-ion battery ageing mechanisms and estimations for automotive applications. J. Power Sources 2013, 241, 680–689. [Google Scholar] [CrossRef]
  5. Dubarry, M.; Vuillaume, N.; Liaw, B.Y. Origins and accommodation of cell variations in Li-ion battery pack modeling. Int. J. Energy Res. 2010, 34, 216–231. [Google Scholar] [CrossRef]
  6. Gao, Z.; Chin, C.S.; Woo, W.L.; Jia, J. Integrated Equivalent Circuit and Thermal Model for Simulation of Temperature-Dependent LiFePO4 Battery in Actual Embedded Application. Energies 2017, 10, 85. [Google Scholar] [CrossRef]
  7. Takeno, K.; Ichimura, M.; Takano, K.; Yamaki, J.; Okada, S. Quick testing of batteries in lithium-ion battery packs with impedance-measuring technology. J. Power Sources 2004, 128, 67–75. [Google Scholar] [CrossRef]
  8. Love, C.T.; Swider-Lyons, K. Impedance Diagnostic for Overcharged Lithium-Ion Batteries. Electrochem. Solid State Lett. 2012, 15, A53–A56. [Google Scholar] [CrossRef]
  9. Senyshyn, A.; Mühlbauer, M.J.; Dolotko, O.; Ehrenberg, H. Low-temperature performance of Li-ion batteries: The behavior of lithiated graphite. J. Power Sources 2015, 282, 235–240. [Google Scholar] [CrossRef]
  10. Huang, C.K.; Sakamoto, J.S.; Wolfenstine, J.; Surampudi, S. The Limits of Low-Temperature Performance of Li-Ion Cells. J. Electrochem. Soc. 2000, 147, 2893–2896. [Google Scholar] [CrossRef]
  11. Love, C.T.; Baturina, O.A.; Swider-Lyons, K.E. Observation of Lithium Dendrites at Ambient Temperature and Below. ECS Electrochem. Lett. 2015, 4, A24–A27. [Google Scholar] [CrossRef]
  12. Li, Z.; Li, Z.; Huang, J.; Liaw, B.Y.; Metzler, V.; Zhang, J. A review of lithium deposition in lithium-ion and lithium metal secondary batteries. J. Power Sources 2014, 254, 168–182. [Google Scholar] [CrossRef]
  13. Vetter, J.; Novák, P.; Wagner, M.R.; Veit, C.; Möller, K.C.; Besenhard, J.O.; Winter, M.; Wohlfahrt-Mehrens, M.; Vogler, C.; Hammouche, A. Ageing mechanisms in lithium-ion batteries. J. Power Sources 2005, 147, 269–281. [Google Scholar] [CrossRef]
  14. Jaguemont, J.; Boulon, L.; Dubé, Y. A comprehensive review of lithium-ion batteries used in hybrid and electric vehicles at cold temperatures. Appl. Energy 2016, 164, 99–114. [Google Scholar] [CrossRef]
  15. Zhang, S.S.; Xu, K.; Jow, T.R. The low temperature performance of Li-ion batteries. J. Power Sources 2003, 115, 137–140. [Google Scholar] [CrossRef]
  16. Panchal, S.; Dincer, I.; Agelin-Chaab, M.; Fowler, M.; Fraser, R. Uneven temperature and voltage distributions due to rapid discharge rates and different boundary conditions for series-connected LiFePO4 batteries. Int. Commun. Heat Mass Transf. 2017, 81, 210–217. [Google Scholar] [CrossRef]
  17. Panchal, S.; Mathew, M.; Fraser, R.; Fowler, M. Electrochemical thermal modeling and experimental measurements of 18650 cylindrical lithium-ion battery during discharge cycle for an EV. Appl. Therm. Eng. 2018, 135, 123–132. [Google Scholar] [CrossRef]
  18. Bandhauer, T.M.; Garimella, S.; Fuller, T.F. A Critical Review of Thermal Issues in Lithium-Ion Batteries. J. Electrochem. Soc. 2011, 158, R1–R25. [Google Scholar] [CrossRef]
  19. Bloom, I.; Jansen, A.N.; Abraham, D.P.; Knuth, J.; Jones, S.A.; Battaglia, V.S.; Henriksen, G.L. Differential voltage analyses of high-power, lithium-ion cells: 1. Technique and application. J. Power Sources 2005, 139, 295–303. [Google Scholar] [CrossRef]
  20. Dubarry, M.; Svoboda, V.; Hwu, R.; Liaw, B.Y. Incremental Capacity Analysis and Close-to-Equilibrium OCV Measurements to Quantify Capacity Fade in Commercial Rechargeable Lithium Batteries. Electrochem. Solid-State Lett. 2006, 9, A454–A457. [Google Scholar] [CrossRef]
  21. Spinner, N.S.; Love, C.T.; Rose-Pehrsson, S.L.; Tuttle, S.G. Expanding the Operational Limits of the Single-Point Impedance Diagnostic for Internal Temperature Monitoring of Lithium-ion Batteries. Electrochim. Acta 2015, 174, 488–493. [Google Scholar] [CrossRef]
  22. Williard, N.; Sood, B.; Osterman, M.; Pecht, M. Disassembly methodology for conducting failure analysis on lithium-ion batteries. J. Mater. Sci. Mater. Electron. 2011, 22, 1616. [Google Scholar] [CrossRef]
  23. Waldmann, T.; Iturrondobeitia, A.; Kasper, M.; Ghanbari, N.; Aguesse, F.; Bekaert, E.; Daniel, L.; Genies, S.; Gordon, I.J.; Löble, M.W. Review—Post-Mortem Analysis of Aged Lithium-Ion Batteries: Disassembly Methodology and Physico-Chemical Analysis Techniques. J. Electrochem. Soc. 2016, 163, A2149–A2164. [Google Scholar] [CrossRef]
  24. Alawa Central. Available online: https://www.soest.hawaii.edu/HNEI/alawa/ (accessed on 3 April 2018).
  25. Dubarry, M.; Truchot, C.; Liaw, B.Y. Synthesize battery degradation modes via a diagnostic and prognostic model. J. Power Sources 2012, 219, 204–216. [Google Scholar] [CrossRef]
  26. Devie, A.; Dubarry, M. Durability and Reliability of Electric Vehicle Batteries under Electric Utility Grid Operations. Part 1: Cell-to-Cell Variations and Preliminary Testing. Batteries 2016, 2, 28. [Google Scholar] [CrossRef]
  27. Spinner, N.; Love, C.T. Coupling Imepadance and Temperature of 18650 Li-ion Cells; U.S Naval Research Laboratory: Washington, DC, USA, 2015; unpublished result. [Google Scholar]
  28. Beelen, H.P.G.J.; Raijmakers, L.H.J.; Donkers, M.C.F.; Notten, P.H.L.; Bergveld, H.J. A comparison and accuracy analysis of impedance-based temperature estimation methods for Li-ion batteries. Appl. Energy 2016, 175, 128–140. [Google Scholar] [CrossRef] [Green Version]
  29. Friesen, A.; Horsthemke, F.; Mönnighoff, X.; Brunklaus, G.; Krafft, R.; Börner, M.; Risthaus, T.; Winter, M.; Schappacher, F.M. Impact of cycling at low temperatures on the safety behavior of 18650-type lithium ion cells: Combined study of mechanical and thermal abuse testing accompanied by post-mortem analysis. J. Power Sources 2016, 334, 1–11. [Google Scholar] [CrossRef]
  30. Li, Q.; Lu, D.; Zheng, J.; Jiao, S.; Luo, L.; Wang, C.M.; Xu, K.; Zhang, J.G.; Xu, W. Li+-Desolvation Dictating Lithium-Ion Battery’s Low-Temperature Performances. ACS Appl. Mater. Interfaces 2017, 9, 42761–42768. [Google Scholar] [CrossRef] [PubMed]
  31. Christensen, J.; Newman, J. Effect of Anode Film Resistance on the Charge/Discharge Capacity of a Lithium-Ion Battery. J. Electrochem. Soc. 2003, 150, A1416–A1420. [Google Scholar] [CrossRef]
  32. Smart, M.C.; Ratnakumar, B.V.; Surampudi, S.; Wang, Y.; Zhang, X.; Greenbaum, S.G.; Hightower, A.; Ahn, C.C.; Fultz, B. Irreversible Capacities of Graphite in Low-Temperature Electrolytes for Lithium-Ion Batteries. J. Electrochem. Soc. 1999, 146, 3963–3969. [Google Scholar] [CrossRef]
  33. Zhuo, Z.; Lu, P.; Delacourt, C.; Qiao, R.; Xu, K.; Pan, F.; Harris, S.J.; Yang, W. Breathing and oscillating growth of solid-electrolyte-interphase upon electrochemical cycling. Chem. Commun. 2018, 54, 814–817. [Google Scholar] [CrossRef] [PubMed]
  34. Zhang, S.S.; Xu, K.; Jow, T.R. Electrochemical impedance study on the low temperature of Li-ion batteries. Electrochim.Acta 2004, 49, 1057–1061. [Google Scholar] [CrossRef]
  35. Dubarry, M.; Baure, G.; Devie, A. Durability and Reliability of EV Batteries under Electric Utility Grid Operations: Path Dependence of Battery Degradation. J. Electrochem. Soc. 2018, 165, A773–A783. [Google Scholar] [CrossRef]
  36. Ouyang, M.; Chu, Z.; Lu, L.; Li, J.; Han, X.; Feng, X.; Liu, G. Low temperature aging mechanism identification and lithium deposition in a large format lithium iron phosphate battery for different charge profiles. J. Power Sources 2015, 286, 309–320. [Google Scholar] [CrossRef]
  37. Rohr, S.; Müller, S.; Baumann, M.; Kerler, M.; Ebert, F.; Kaden, D.; Lienkamp, M. Quantifying Uncertainties in Reusing Lithium-Ion Batteries from Electric Vehicles. Procedia Manuf. 2017, 8, 603–610. [Google Scholar] [CrossRef]
  38. Baumhöfer, T.; Brühl, M.; Rothgang, S.; Sauer, D.U. Production caused variation in capacity aging trend and correlation to initial cell performance. J. Power Sources 2014, 247, 332–338. [Google Scholar] [CrossRef]
Figure 1. Cell-to-cell variations summary showing the distribution of resistance, rate capability and capacity ration on a 3D scale. Outliers were defined as any value with a deviation above 3 times the standard deviation compared to the average value. Cells 5, 6 and 15 were not used to produce 4S battery packs.
Energies 11 00834 g001
Figure 2. (a) Voltage vs. state-of-charge curves for the positive electrode in half cell configuration at rates ranging from C/40 to C/1 in charge and discharge; (b) RPT1 cell emulation using the positive electrode data and stock graphite from [26].
Energies 11 00834 g002
Figure 3. Representative EIS responses to various current amplitude perturbations for cells at 50% SOC (discharged 1.3 Ah) at (a) 25 °C and (b) 0 °C shown between 1000–100 Hz. Representative average impedance and variance (shown as error bars) for EIS collected at 10% DOD increments from 100–10% at temperatures (c) 25 °C and (d) 0 °C. Close inspection of the impedance shows a minimum variance in both real and imaginary components at 316 Hz identified by yellow circles in (c,d).
Energies 11 00834 g003
Figure 4. Temperature effects on the real and imaginary components of the impedance at fSOH. An empirical relationship is given for imaginary impedance, −Zimag, as a function of temperature.
Energies 11 00834 g004
Figure 5. Individual cell charge and discharge data within the 4S packs for 1st, 10th, 30th & 50th cycles at three conditions: (a) 25 °C; (b) 0 °C with 2.75 V individual cell cutoff and (c) 0 °C with 11.0 V pack voltage cutoff.
Energies 11 00834 g005
Figure 6. Battery pack capacity loss at 25 °C and 0 °C with discharge cutoffs when the first cell reaches 2.75 V and when the pack reaches a voltage of 11.0 V.
Energies 11 00834 g006
Figure 7. Pack-level impedance of 4S packs at (a) 25 °C and (b) 0 °C with discharge cutoffs when the first cell reaches 2.75 V and (c) when the pack discharge voltage reaches 11.0 V after 1st, 10th, 30th, & 50th discharge cycles. Yellow circles identify the impedance at 316 Hz during the 1st cycle.
Energies 11 00834 g007
Figure 8. Radar plots showing progression of real (Zreal) and imaginary (−Zimag) impedance at fSOH = 316 Hz Cells 1–4 within 4S packs after the 1st, 10th, 30th and 50th discharge cycles at (a) 25 °C; (b) 0 °C with discharge cutoffs when the first cell reaches 2.75 V and (c) 0 °C when the pack reached a voltage of 11.0 V.
Energies 11 00834 g008
Figure 9. SOH map generated from single-point impedance responses at fSOH = 316 Hz for 4S packs cycled at 25 °C, 0 °C with 2.75 V cell cutoff (light blue circles) and 0 °C with 11.0 V pack cutoff (dark blue circles) after 1st, 10th, 30th and 50th discharge cycles, where the cycle number is denoted inside the circles. The acceptable impedance variance range (<3×) is shown in green, 4× in orange and 5× in red. The empirical relationship between impedance response and temperature at fSOH is shown by the black dashed line.
Energies 11 00834 g009
Figure 10. Degradation table for the selected cell with the IC curves associated with up to 50% of (a) LLI; (b) LAMdePE; (c) LAMliPE; (d) LAMdeNE; and (e) LAMliNE. IC curves associated with up to 10× kinetic hindrance for (f) RDFPE and (g) RDFNE and (h) Capacity loss associated with (ae). Thick solid line represents the initial signature, thin solid line the final signature and dashed line the intermediates.
Energies 11 00834 g010
Figure 11. Incremental capacity curves for cells prior to cycling (solid lines for RPT 1) and post cycling (dashed lines for RPT 2) at (a) 25 °C, (b) 0 °C with cell voltage cut-off and (c) 0 °C with pack voltage cut-off.
Energies 11 00834 g011
Figure 12. Examples of simulation results compared to experimental one for RPT1 and RPT2 for Cell 1 at 25 °C, Cell 1 of the pack cycled at 0 °C with cell cutoff and Cells 3 and 4 for the pack cycled at 0 °C with pack cutoff.
Energies 11 00834 g012
Figure 13. Radar plots showing the different degradation mechanisms for Cells 1 to 4 in (a) the 4S pack at 25 °C; (b) the 4S pack at 0 °C with cell cutoff and (c) the 4S pack at 0 °C with pack cutoff.
Energies 11 00834 g013
Figure 14. IC curves evolution for selected cycles for (a) Cells 1 and 3 for the pack with cell cutoff and (b) Cells 1 and 4 for the pack with pack cutoffs.
Energies 11 00834 g014
Table 1. Cell-to-cell variation summary.
Rate CapabilityResistance (without Outliers)Capacity Ration
99.35 (±0.13%)71 mΩ (±3.8%)2.657 (±0.51%)
Table 2. Capacity loss (%) for cells within 4S pack after 50 charge/discharge cycles.
Cells # in 4S Pack25 °C 2.75 V Cell Cutoff0 °C 2.75 V Cell Cutoff0 °C 11.0 V Pack Cutoff
Cell1~1.525.03.5
Cell 2~1.519.08.0
Cell 3~1.57.54.0
Cell 4~1.56.544.5

