1. Introduction
Buildings account for up to 40% of the energy consumption in the European Union (EU) [
1,
2] and are responsible for a large portion of the harmful emissions to the environment. To change this situation, several countries including the EU are proposing regulations to reduce the primary energy consumption in buildings. The European Performance of Buildings Directive (EPBD 2010/21/EU) requires new public buildings to be nearly Zero Energy Buildings (nZEBs) by 2018 and by 2020 for all new buildings. Achieving this goal implies a large use of renewables on-site combined with energy saving measures [
3].
In Spain, order FOM/1635/2013 of 10 September updates the Spanish Building Standard on energy efficiency in buildings implementing both the EPBD and the Directive 2009/28/EC of the European Parliament and of the Council of 23 April 2009 on the promotion of the use of energy from renewable sources [
3]. This standard establishes a first step leading to the objective of nZEB in Spain [
4].
Over the last years, close to 15% of European electricity has been supplied by cogeneration. By 2050, electricity from cogeneration is expected to account for 26% of total electricity generation in the European Union. Co-generated electricity from renewable energy sources will contribute to the increase in these figures [
5].
The rise in fuel and energy prices, concerns on security of supply and global competition make evident that Europe must shift to a more energy efficient future [
6]. The alternative of Combined Heat Power, either cogeneration or tri-generation, provides electricity together with useful heating or heating/cooling, thus improving the overall efficiency and reducing harmful CO
2 emissions [
7,
8].
In the EU, the spread of renewable energy technologies is a priority, in order to meet the target of 20% overall energy consumption from renewables energies, that could be increased up to 66% by 2030 and 100% by 2050, according to the European Renewable Energy Council 2012 (EREC) [
9]. The development of projects where renewable technologies are integrated in buildings is a thus essential [
10,
11].
Consequently, more efficient Heat Ventilation and Air Conditional (HVAC) equipment and better designs for the building envelope are constantly being developed to consume less energy to achieve comfort indoors and improve the overall satisfaction levels of users [
12,
13]. Bioclimatic building design, optimal insulation, passive ventilation and other strategies and technologies can achieve the reduction in the energy demand beyond 50%. The final target are near Zero Energy and near Zero Carbon (CO
2) emissions buildings [
14].
There exist some research on the current literature focusing on the energy analysis of nZEB buildings. For the residential sector, Tsalikis and Martinopoulos [
15] demonstrate that photovoltaics alone can fulfil the annual electricity demand with a payback period shorter than seven years. Concerning the impact of ventilation heating loads on the nZEB requirements, Guillen-Lambea and Rodriguez-Soria [
16] develop a comprehensive analysis of existing ventilation rules. As a result, southern region of Spain arises among the few ones where heating and cooling demands of nZEB can be covered without resorting to exhaust air heat recovery. Chastas et al. [
17] develop an analysis of the embodied energy of a residential building in Greece with a heated area of 123.75 m
2. Their results show that this approach of the primary energy balance can overcome the limitations of the current European Legislation in what concerns Life Cycle Analysis (LCA) and embodied energy, emissions and environmental impact.
Some further research focus on buildings that belong to the tertiary sector. As stressed by Zhou et al. [
18], most of these papers about nZEBs are simulation and theoretical approaches. Their study on an existing office building in China derives a total energy consumption of 75.9 kWh/m
2 (316 MWh for the whole building), being the power generated through a photovoltaic plant only 106 MWh. A renovated building made of offices and laboratories for educational and research purposes in Cyprus requires 62.9 kWh/m
2 a year in the operational phase, although the design phase foresaw 64.4 kWh/m
2 a year [
19]. Concerning public university buildings, Ferrari and Beccali [
20] propose the retrofitting of a building located at the University Campus of the
Politecnico di Milano (Italy). Simulation shows that the best option is to improve the building envelope together with the following systems: A photovoltaic plant of 300 m
2 on the roofs and facades, a mechanical ventilation system with heat recovery, a groundwater heat pump and dimmed artificial lighting with occupation and daylight sensors. According to their results, this retrofitting would achieve a reduction in the annual primary energy consumption to a minimum of 8.6 kWh/m
2. The next step beyond nZEBs is to achieve “Net” Zero Energy Buildings. The first building of this type built in Germany is the office building UBA 2019, in Berlin, for which design values, simulation through Energy-Plus and measured indicators for the first year of operation are available [
21]. In this case, the primary energy demand measured is 96 kWh/m
2 a year, close to the expected value in the design phase.
Different building labels and certifications are available as voluntary standards, which fulfil the limitations of the current national building codes concerning the requirements for energy efficiency in buildings [
22]. Among them stands the internationally recognized LEED (Leadership in Energy and Environmental Design), introduced by the US Green Building Council (USGBC) [
23].
This paper develops and analyzes the energy efficiency balance, through three indicators, of an existing nZEB located in the city of Valladolid, Spain, with 98 points in the LEED certification. A simulation was carried out using the DesignBuilder version 5 software (DesignBuilder Software Ltd., London, UK) for the local weather files.
The objective of this work is to develop an in-depth energy analysis through the indicators obtained, to serve as reference for comparison with the current requirements in the European regulations and with further public nZEB aimed at educational and/or research purposes. Additionally, it will provide answers about whether the nZEB design actually achieves a comfortable indoor climate and, otherwise, what additional measures need to be taken [
24]. In this way, it will be possible to analyze and verify energy efficiency and design, in order to propose new energy-saving interventions [
25,
26]. To accomplish this purpose, the article is structured as follows: First, the target nZEB is described in
Section 2; then, the methodology is described in
Section 3.
Section 4 presents the calculus of the indicators and discusses the results obtained, and the main results are gathered in the conclusions. Validation of the model is provided as
Supplementary Materials.
2. Description of the Case Study nZEB Building Nearly Zero CO2 Emissions
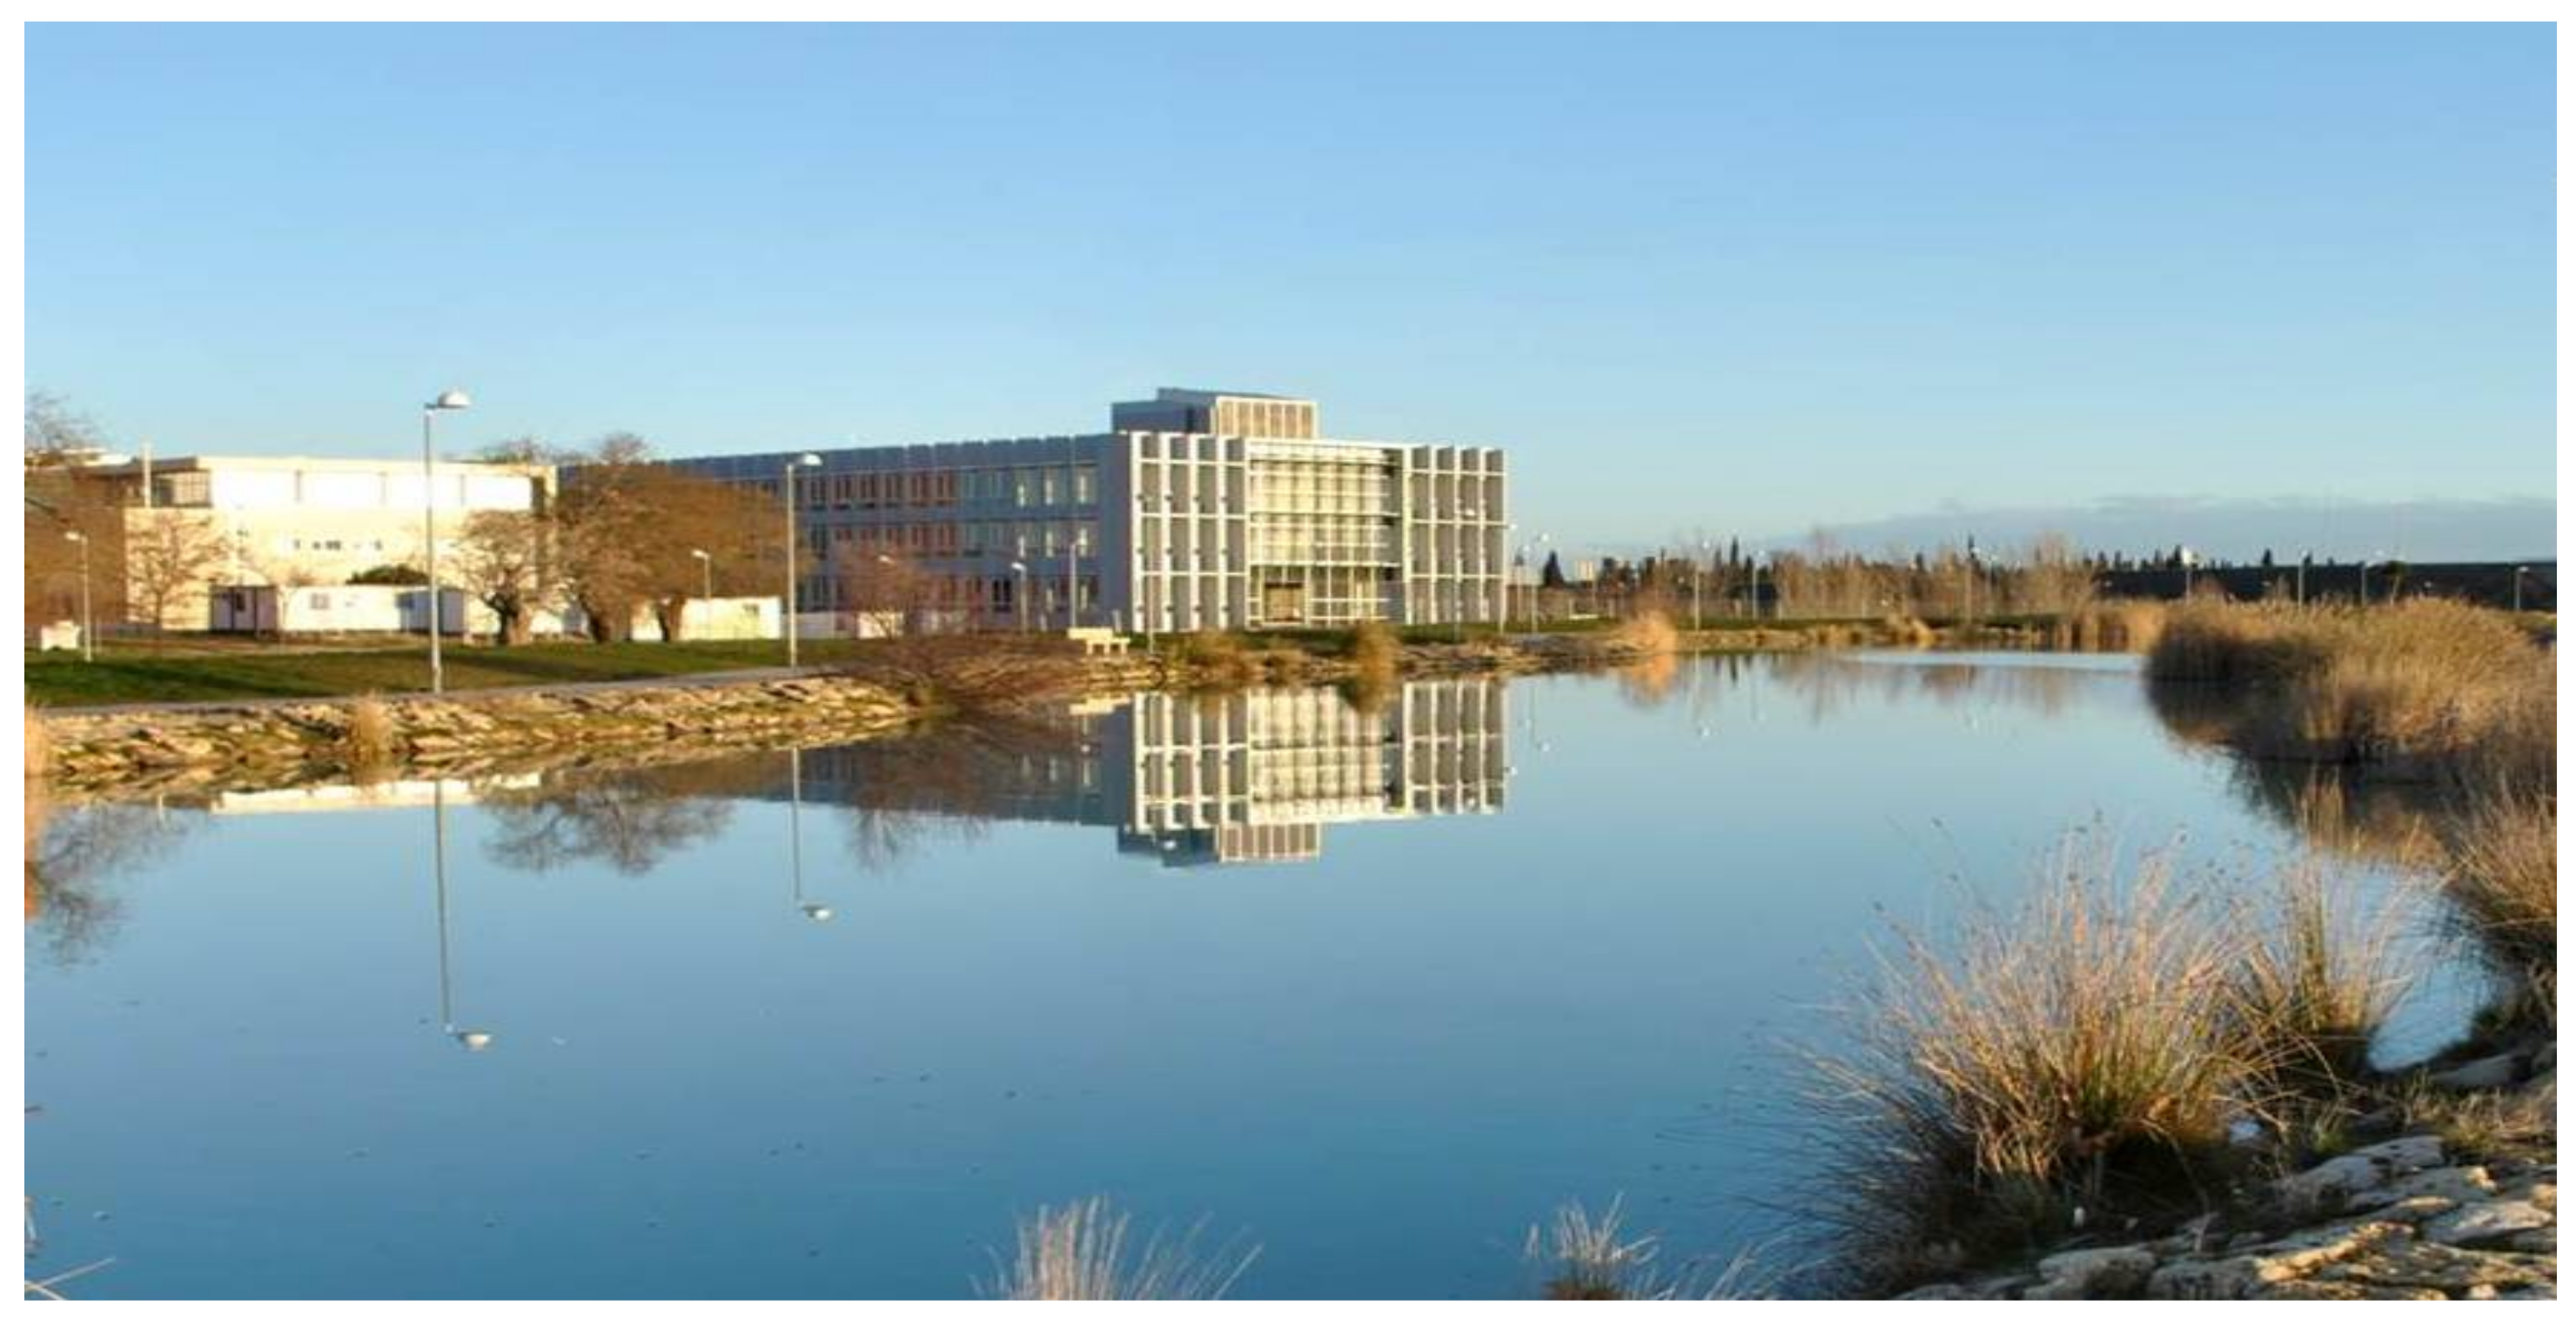
This paper analyses the case of a nZEB building known as “LUCIA” at the University of Valladolid, in Valladolid, Spain (
Figure 1). The building has a total surface area of 7500 m
2 and is certified as a near Zero Energy Building. It is composed mainly of laboratories, research areas and spin-offs. The building is occupied from 8 a.m. to 10 p.m. from Monday to Friday.
Valladolid (Spain), is a city with Csb climate (temperate climate with dry, warm summers), according to the latest Köppen–Geiger classification [
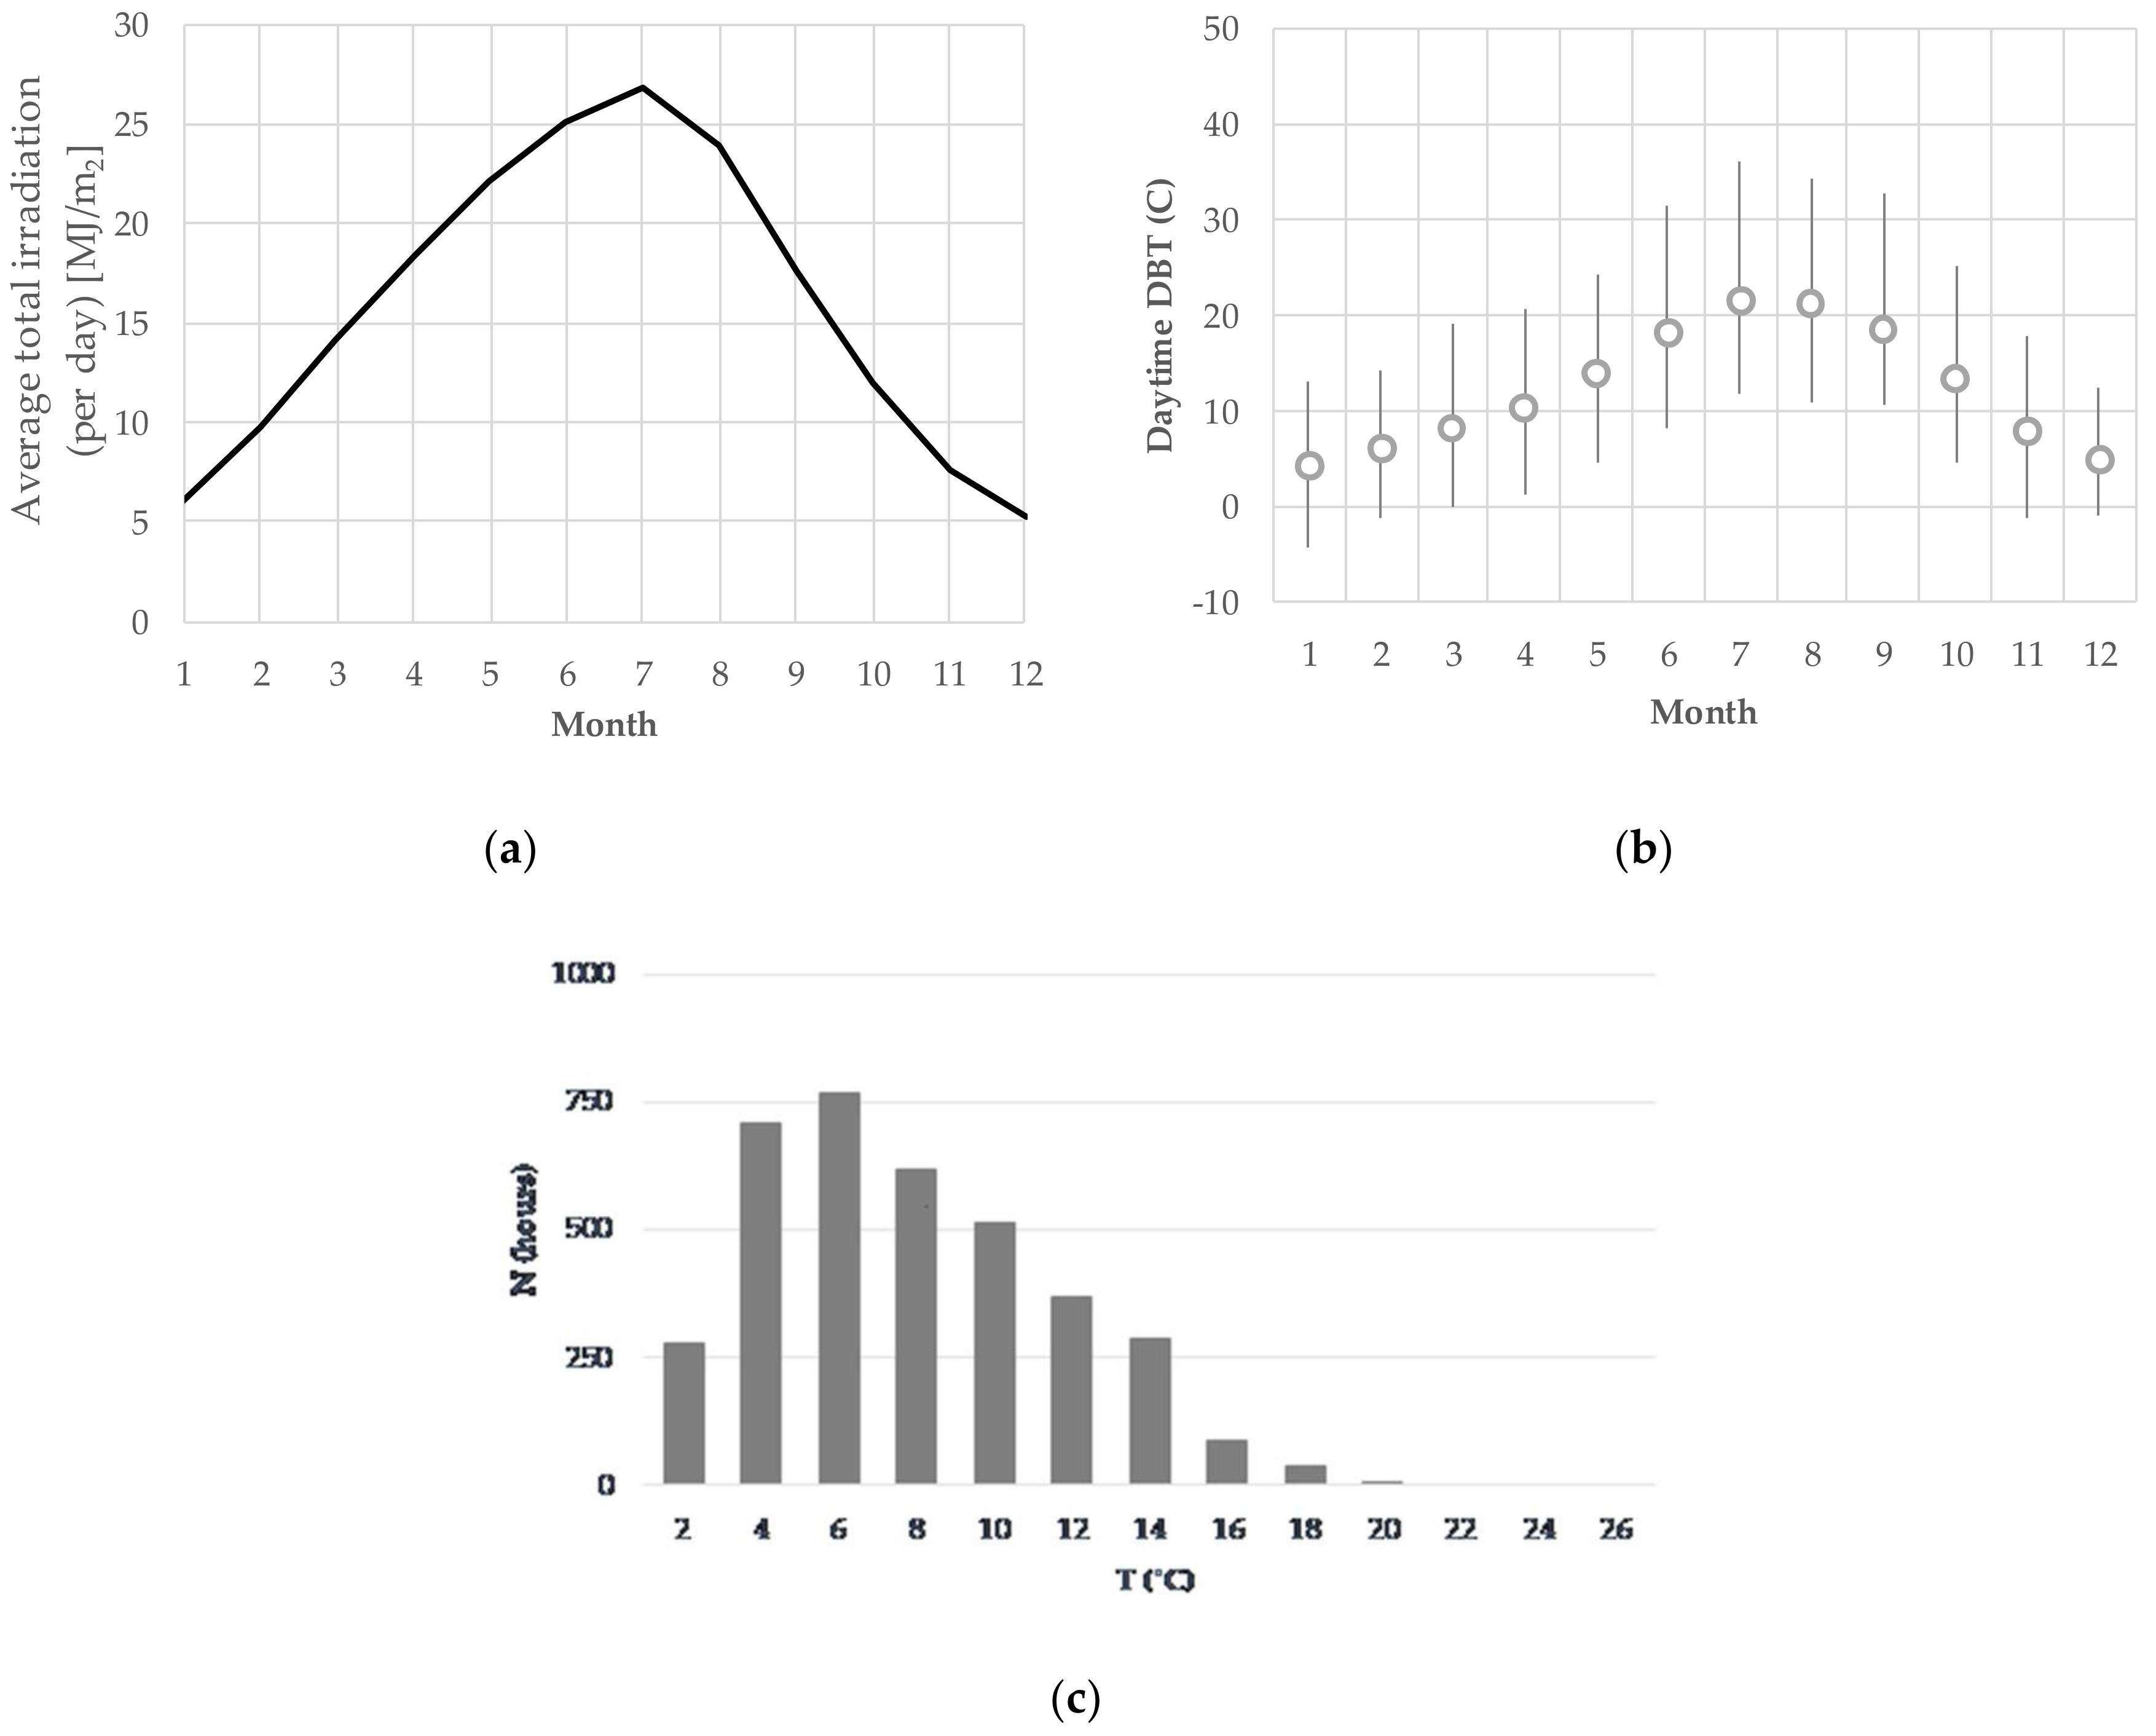
27]. To study the applicability of different energy efficient strategies in buildings, there are particular climate parameters of interest. Concerning the use of photovoltaics, solar irradiation is the key issue, although operating temperature determines their performance.
Figure 2a gives an idea of the available irradiation in Valladolid: As expected, it is a dry summer climate, hence with high irradiation during summer months. Moreover, there are no particular rainy seasons.
With regard to the control of the Air Handling Unit (AHU), operation of either the EAHE or the economizer depends on the possibilities of free cooling. Although control is made on an enthalpy basis, humidity is not a relevant issue in this climate, as
Figure 2c illustrates through the bin data of the difference between dry bulb and wet bulb temperatures.
Figure 2b shows the daily maximum, minimum and average dry bulb temperatures (DBT) for a typical day of each month. It clearly shows that this climate is characterized by high DBT oscillations during typical summer days, which highlights a high potential of free-cooling for cooling period [
28].
LUCIA is recognized as one of the leading and emblematic nZEB buildings in the whole World, with the one of the highest LEED certification possible, with 98 points. This is currently the highest score not only in Europe but also in the Northern hemisphere and the second highest LEED PLATINUM score worldwide, only beaten by the PIXEL building in Australia [
23].
The building is being under continuous monitoring and control of different energy parameters of the boiler, the tri-generation plant, the chiller, the absorption unit and the sanitary hot water (power, flow and accumulated energy). By means of the ModBus protocol, heating, ventilation and air-conditioning energy consumption is also being monitored by pulse counters. There are over 97 main analyzers installed throughout the building to assess the area’s active energy, reactive energy, phase voltage and frequency via the ModBus protocol [
29]. Thus, it is possible to monitor the use of energy and comfort for each area.
The building has been planned through a bioclimatic design, including strategies such as windows facing south to enhance solar gains in winter with shadowing elements for sun control in summer, Earth-Air Heat Exchanger (EAHE) and heat recovery for reducing ventilation loads. The building was designed with plastered internal insulated walls with a thermal transmittance of 0.157 W/m
2·K, and very high thermal inertia, which reduces the impact of external temperature changes on the building. To minimize the environmental and life-cycle impact of the building, it is built with certified low-carbon materials. The building also provides straightforward solutions for the architectonic integration of photovoltaic solar panels on the walls and roof of the building. The photovoltaic system on the roof is installed at the top of the two stairwells of the building, as a skylight. A biomass fueled combined heat and power (CHP) system has been installed, along with high-efficiency heating, ventilation and air-conditioning systems and absorption cooling.
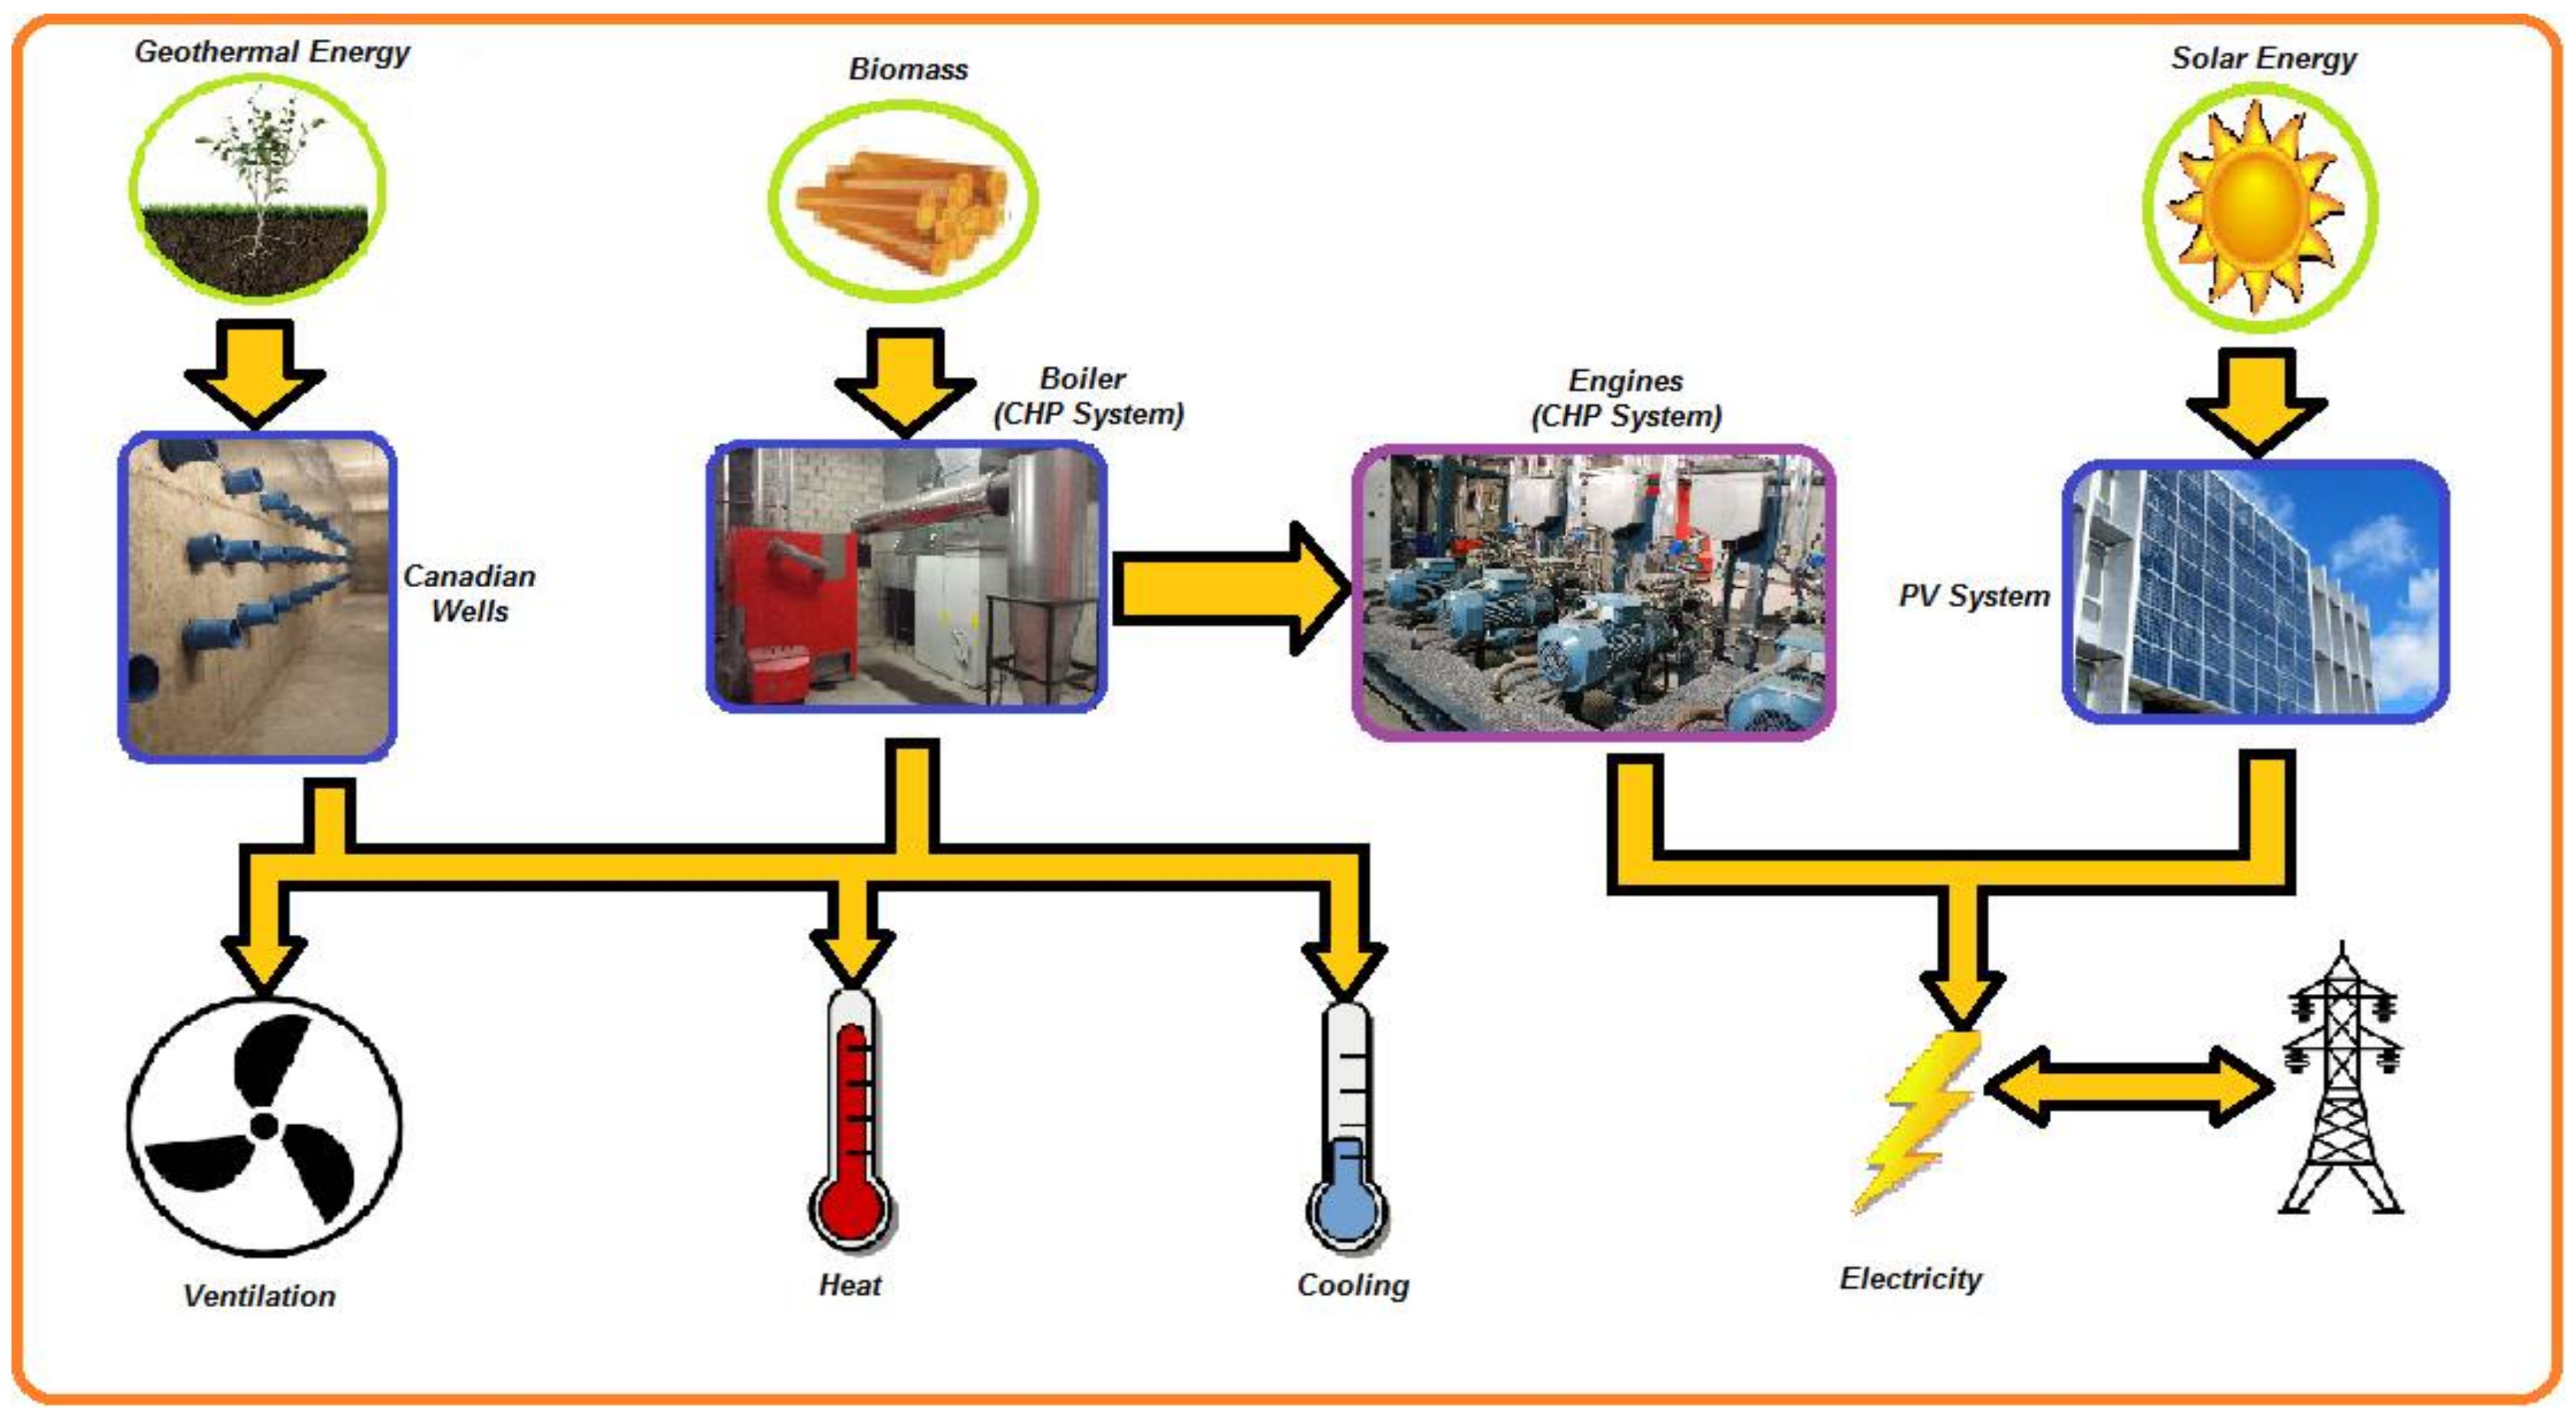
Figure 3 shows the renewable energy generation systems used in the building. Natural lighting is favored through the use of tubular skylights. Artificial lighting is controlled by the use of high-efficiency lights together with dimming and occupancy control. Building lighting includes T5 electronic ballasts with Digital Directional Lighting Interface (DALI), incorporated into the suspended ceiling, and is designed in accordance with the current lighting standards [
30].
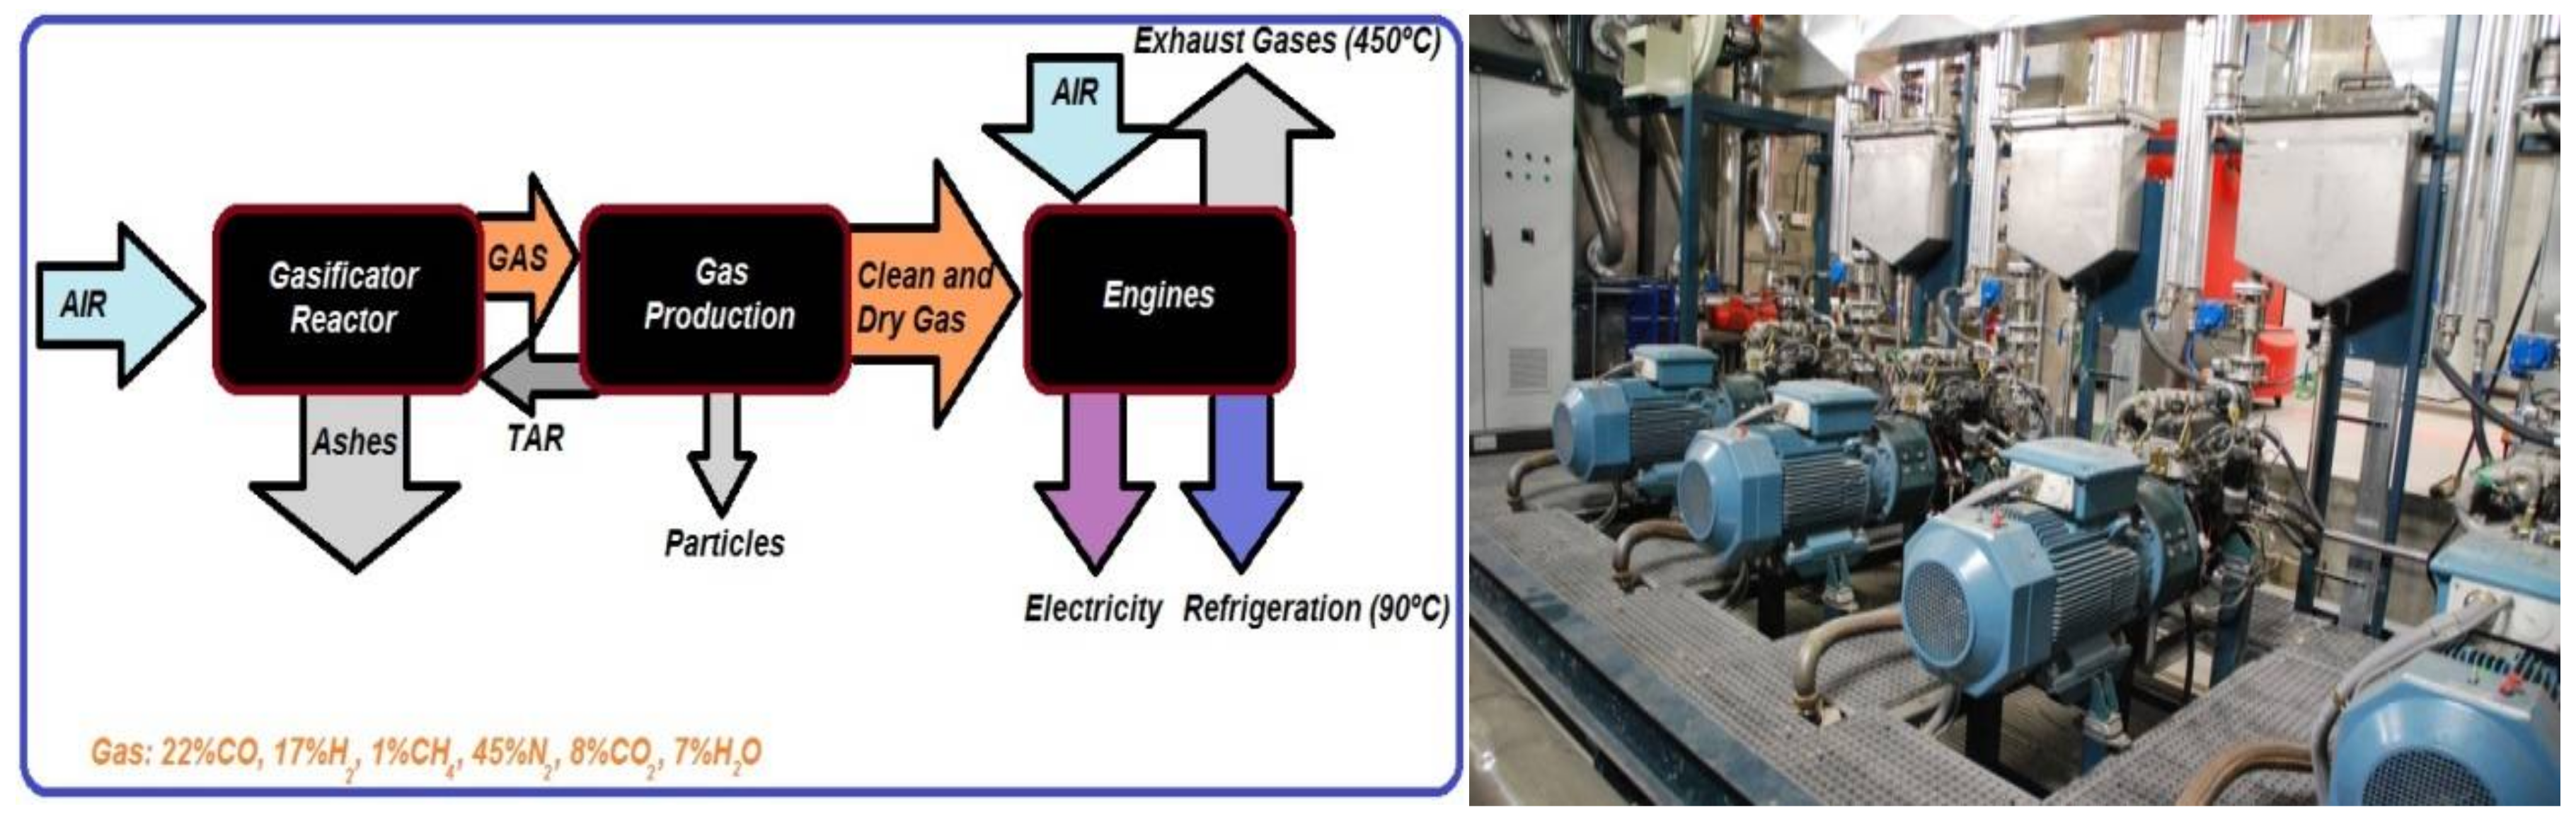
The combined heat and power system is fed by biomass which undergoes a gasification process. Gas is then introduced into five rectified internal combustion engines (
Figure 4). The system generates electricity and produces thermal energy, either heating or cooling. Additionally, there are two standard biomass boilers as auxiliary heating systems, for use only when the building’s heating demand exceeds the main primary power output (
Figure 5). The production of electric energy in the LUCIA nZEB is based on 100% photovoltaic generation and the cogeneration system. The entire system is grid-connected.
This building operates in conjunction with heat recovery units, achieving a heat recovery from HVAC System by 61%; the remaining percentage is provided by a biomass boiler from wood chips, common fuel in the area where the building is situated. This CHP boiler has a nominal output of 329 kW and an efficiency of 0.88. The air conditioning system consists of a 100% external constant flow system that provides heating and cooling coupled with the ventilation system. The heat is managed by four-pipe fans spread throughout the building.
Free-cooling, heat recovery and earth-air heat exchangers are strategies implemented in the building to improve energy efficiency in ventilation.
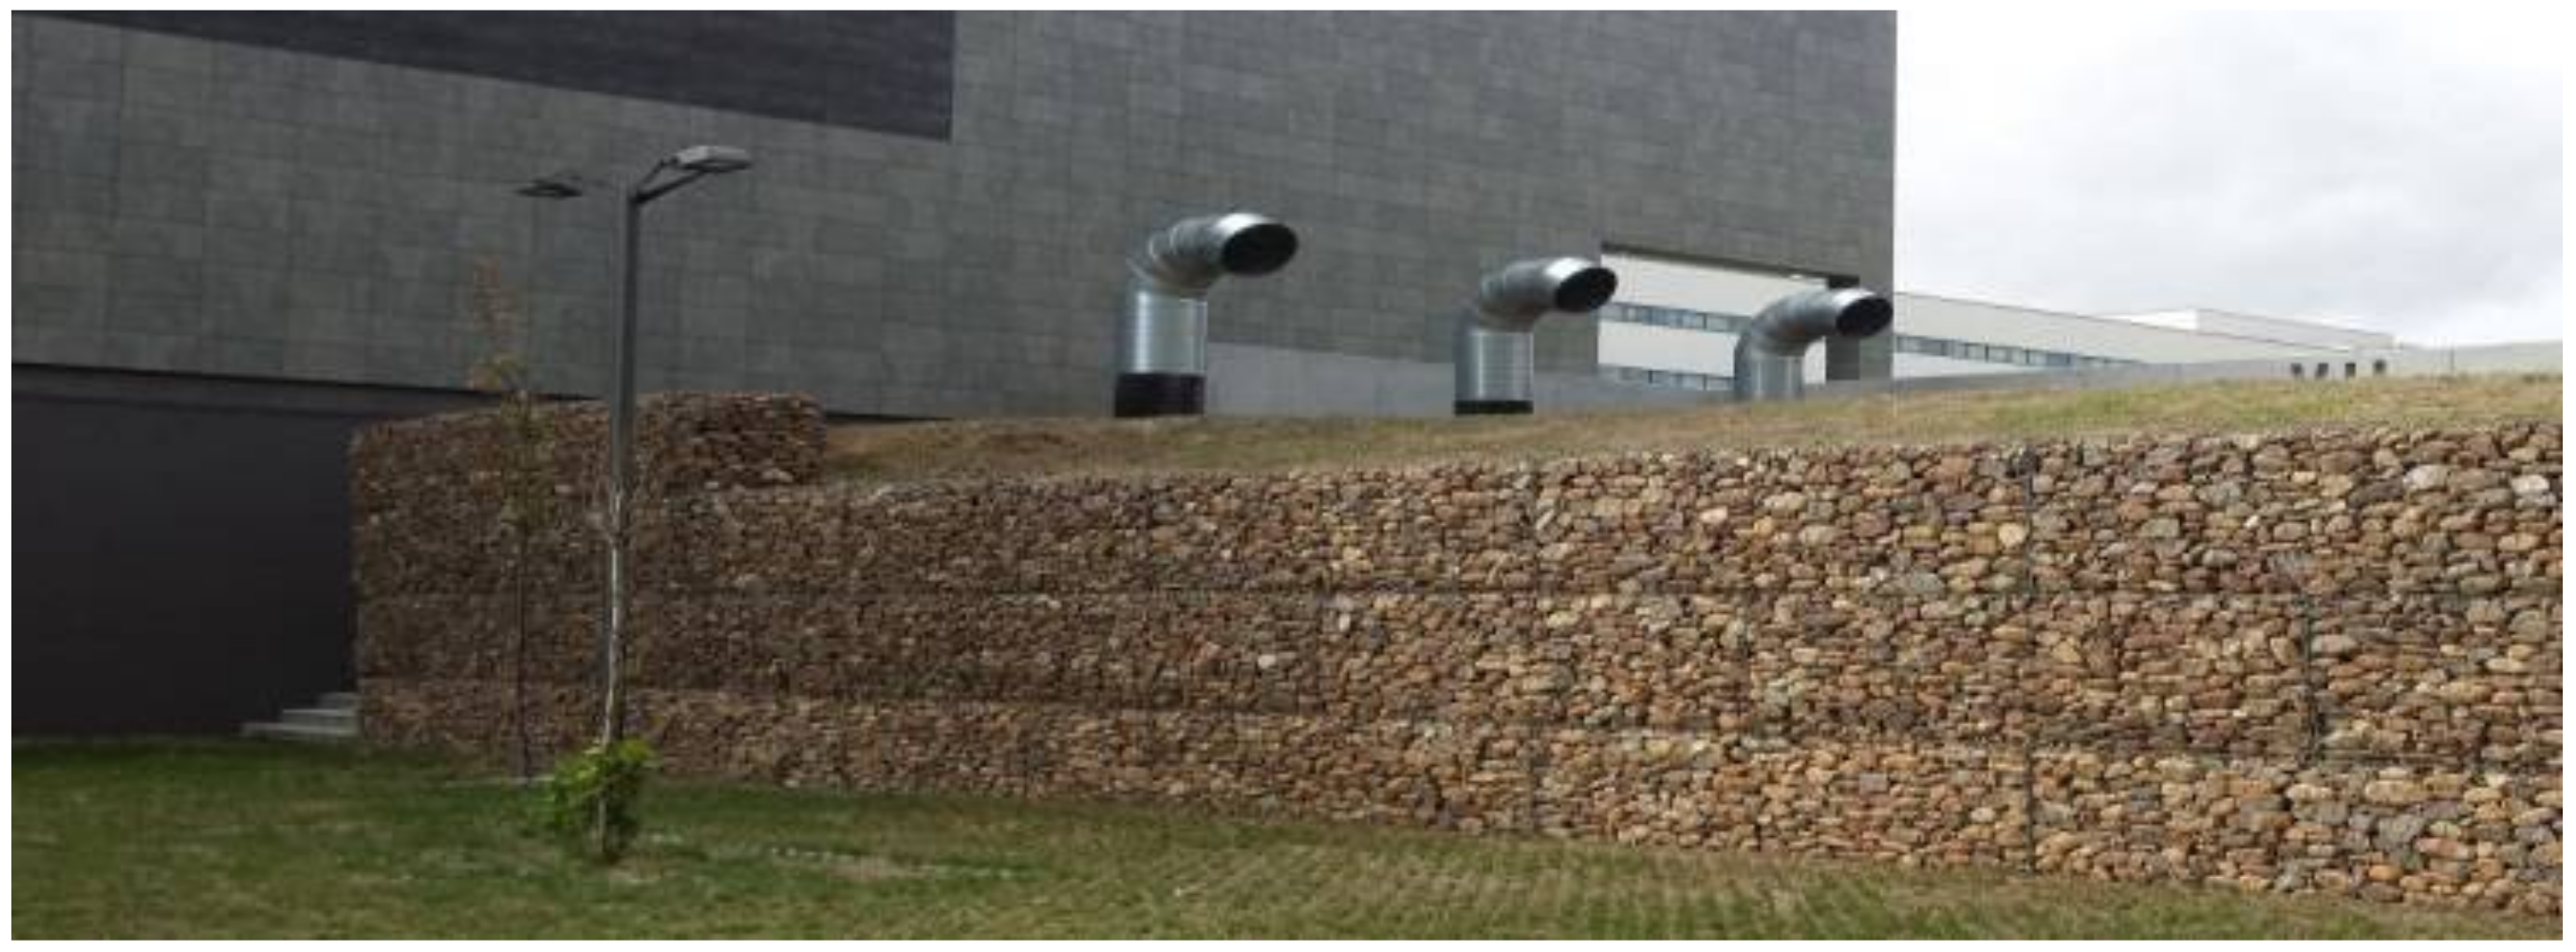
Figure 6 shows a view of the Canadian geothermal well ventilation system of the LUCIA. The building’s ventilation system enable operation or by-pass of the Canadian wells and the heat recovery system besides implementing free cooling or not. In short, the possible ventilation operation modes are: with Canadian wells and heat recovery, with no Canadian wells and heat recovery, or mere free cooling (where neither Canadian wells nor heat recovery systems are operating). The geothermal energy system is enthalpy-controlled through a SCADA (Supervisory Control and Data Acquisition), seeking to recover the most energy and contribute to increase the efficiency of the system. The Canadian well system, with an approximate flow rate of 15,000 m
3/h, provides heating close to 162,000 kWh/year and a cooling supply of 150,740 kWh/year. By analyzing the savings in CO
2 emissions, this means 13,380 kg of CO
2 per year for the free heating mode and 7650 kg of CO
2 per year for the free cooling mode.
An absorption cycle supplies cooling to the building. It has an energy efficiency ratio (EER) of 0.7 and a power of 176 kW. As an auxiliary system, the building is equipped with a conventional air cooling system with a power of 232.7 kW and an EER of 3.3. A cooling tower with two fan speeds dissipates waste heat generated by the absorption system. The flow rate of the fans and the external ventilation system reaches 15,000 m3/h. Depending on the season, the indoor climate is controlled by either constant or variable airflow.
The energy analysis of these energy efficiency measures implemented in the target building will serve to assess whether to apply the same strategies to further constructions. The savings obtained through each independent measure are also studied. In this way, a full tracking of the building’s energy production and biofuel consumption can verify the status of almost zero CO
2 emissions and estimate the excess energy produced or, otherwise, the additional energy required to satisfy demand.
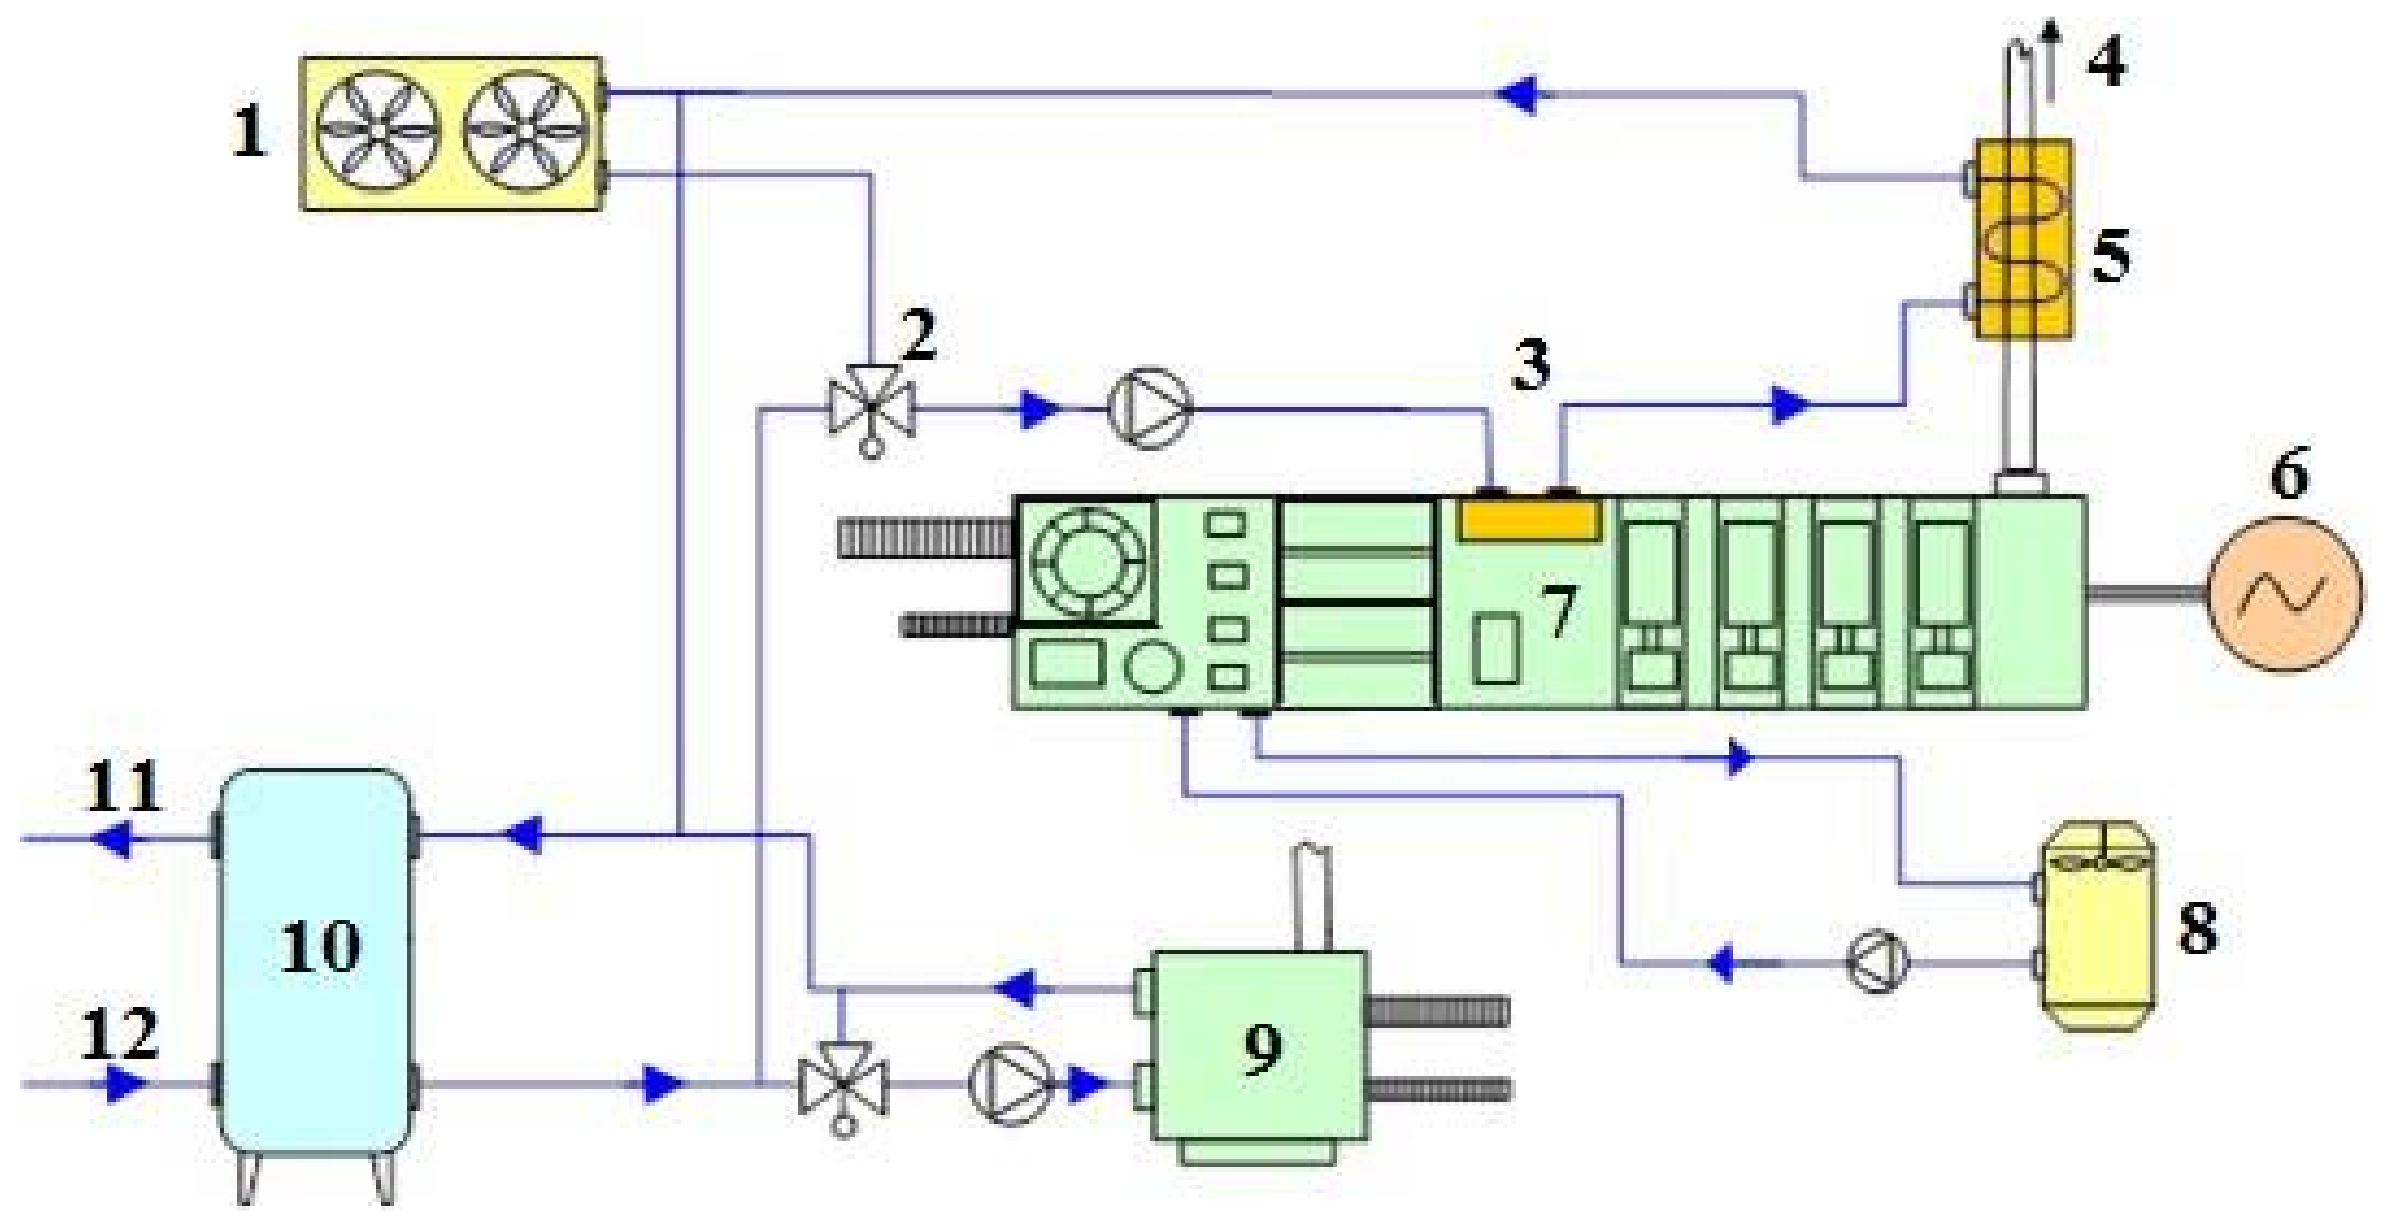
Figure 7 shows the flow diagram of the building’s energy processes.
3. Methodology
The LUCIA building has been modelled on DesignBuilder. Monitoring of actual consumption is in progress. The consumptions registered by monitoring of the different energy systems, through the SCADA are used to calibrate the DesignBuilder simulation file, and the model is run with the Typical Meteorological Year (TMY) data for Valladolid. There was full access to weather data of Valladolid through the database available in the Spanish Building Standard [
4]. Building simulation with typical local meteorological data offers stability, without significant variations between different years, providing a representative energy balance. The use of a typical meteorological record of the TMY will therefore allow us to focus on comfort measures and the possibility of carrying out a much more detailed study, excluding atypical values in meteorological conditions. Due to the minimal variation caused between the local year 2017 weather parameters used in the calibration and the typical local year weather used in the simulation, existing discrepancies are acceptable.
The climatic data have been implemented and have been previously verified with the actual data, as shown in the study within the
supplementary materials. Then, all the equipment and energy systems have been introduced into the simulation program. Once this process has been carried out, the results have been obtained. The results of the thermal and electrical energy consumption were analyzed. To reduce the error obtained in these values, the working hours have been adjusted to the real working hours, in addition to adjusting to the real operating conditions of the systems. The model validation process has been adjusted to the 3% error, regulating and specifying the hours of operation of the building, making the simulation of the building work within the actual hours (detailed information is provided as
Supplementary Materials of the present article).
The interest of the simulation is based on:
First of all, the use of the internationally recognized dynamic simulation tool, duly calibrated with the actual measurements with an error of less than 3%, allows us to model the global and partial process of the building and the HVAC systems
It also succeeds in standardizing and normalizing the nZEB building so that it can be compared with other buildings
It is a flexible tool for analyzing individual energy processes and their contribution to the overall picture, as well as the sensitivity of the parameters in energy consumption
It is a tool with great potential in the energy optimization of the building
It provides more information in the energy analysis because it is impossible due to economic cost to monitor all the parameters of the building
It serves the ultimate purpose of the paper:
- ○
Energy balance of nZEB
- ○
Indicators.
Through dynamic simulation of the building, many parameters are taken into account, including the thermal capacity or building inertia of the building envelope, heat flow, solar gains and ventilation, among others. The software runs the combined analysis of all these factors several times an hour. Thus, it is possible to study in detail the evolution of any further parameter throughout the year, such as the indoor relative humidity, the dry bulb temperature or the heating loads of a particular zone and, consequently, to obtain the different energy indicators required for the study.
The workflow consists in, first, developing the model in 3D and introducing all physical parameters related to the building envelope, operating mode, heating and cooling systems, ventilation, water heating and lighting. The climate file defines the outdoor conditions of the place of interest. The calculation engine uses this data to perform an annual simulation of the thermal and energy performance of the building. Contrary to simpler programs, such as the energy certification tools widely used in Spain, dynamic simulation generates hourly results for all outputs, which can include energy demand, indoor temperatures, humidity, surface temperatures, comfort levels and so on [
31,
32].
DesignBuilder v.5, which is the dynamic simulation program used in this paper is well-known worldwide and it offers a powerful tool to perform energy simulations with the renowned engine of EnergyPlus, which is one of the most recognized and widely used tools for analyzing multi-zone systems [
33]. EnergyPlus is a thermal and energy simulation program of buildings that has been developed and updated over decades by the Department of Energy of the United States of America [
34].
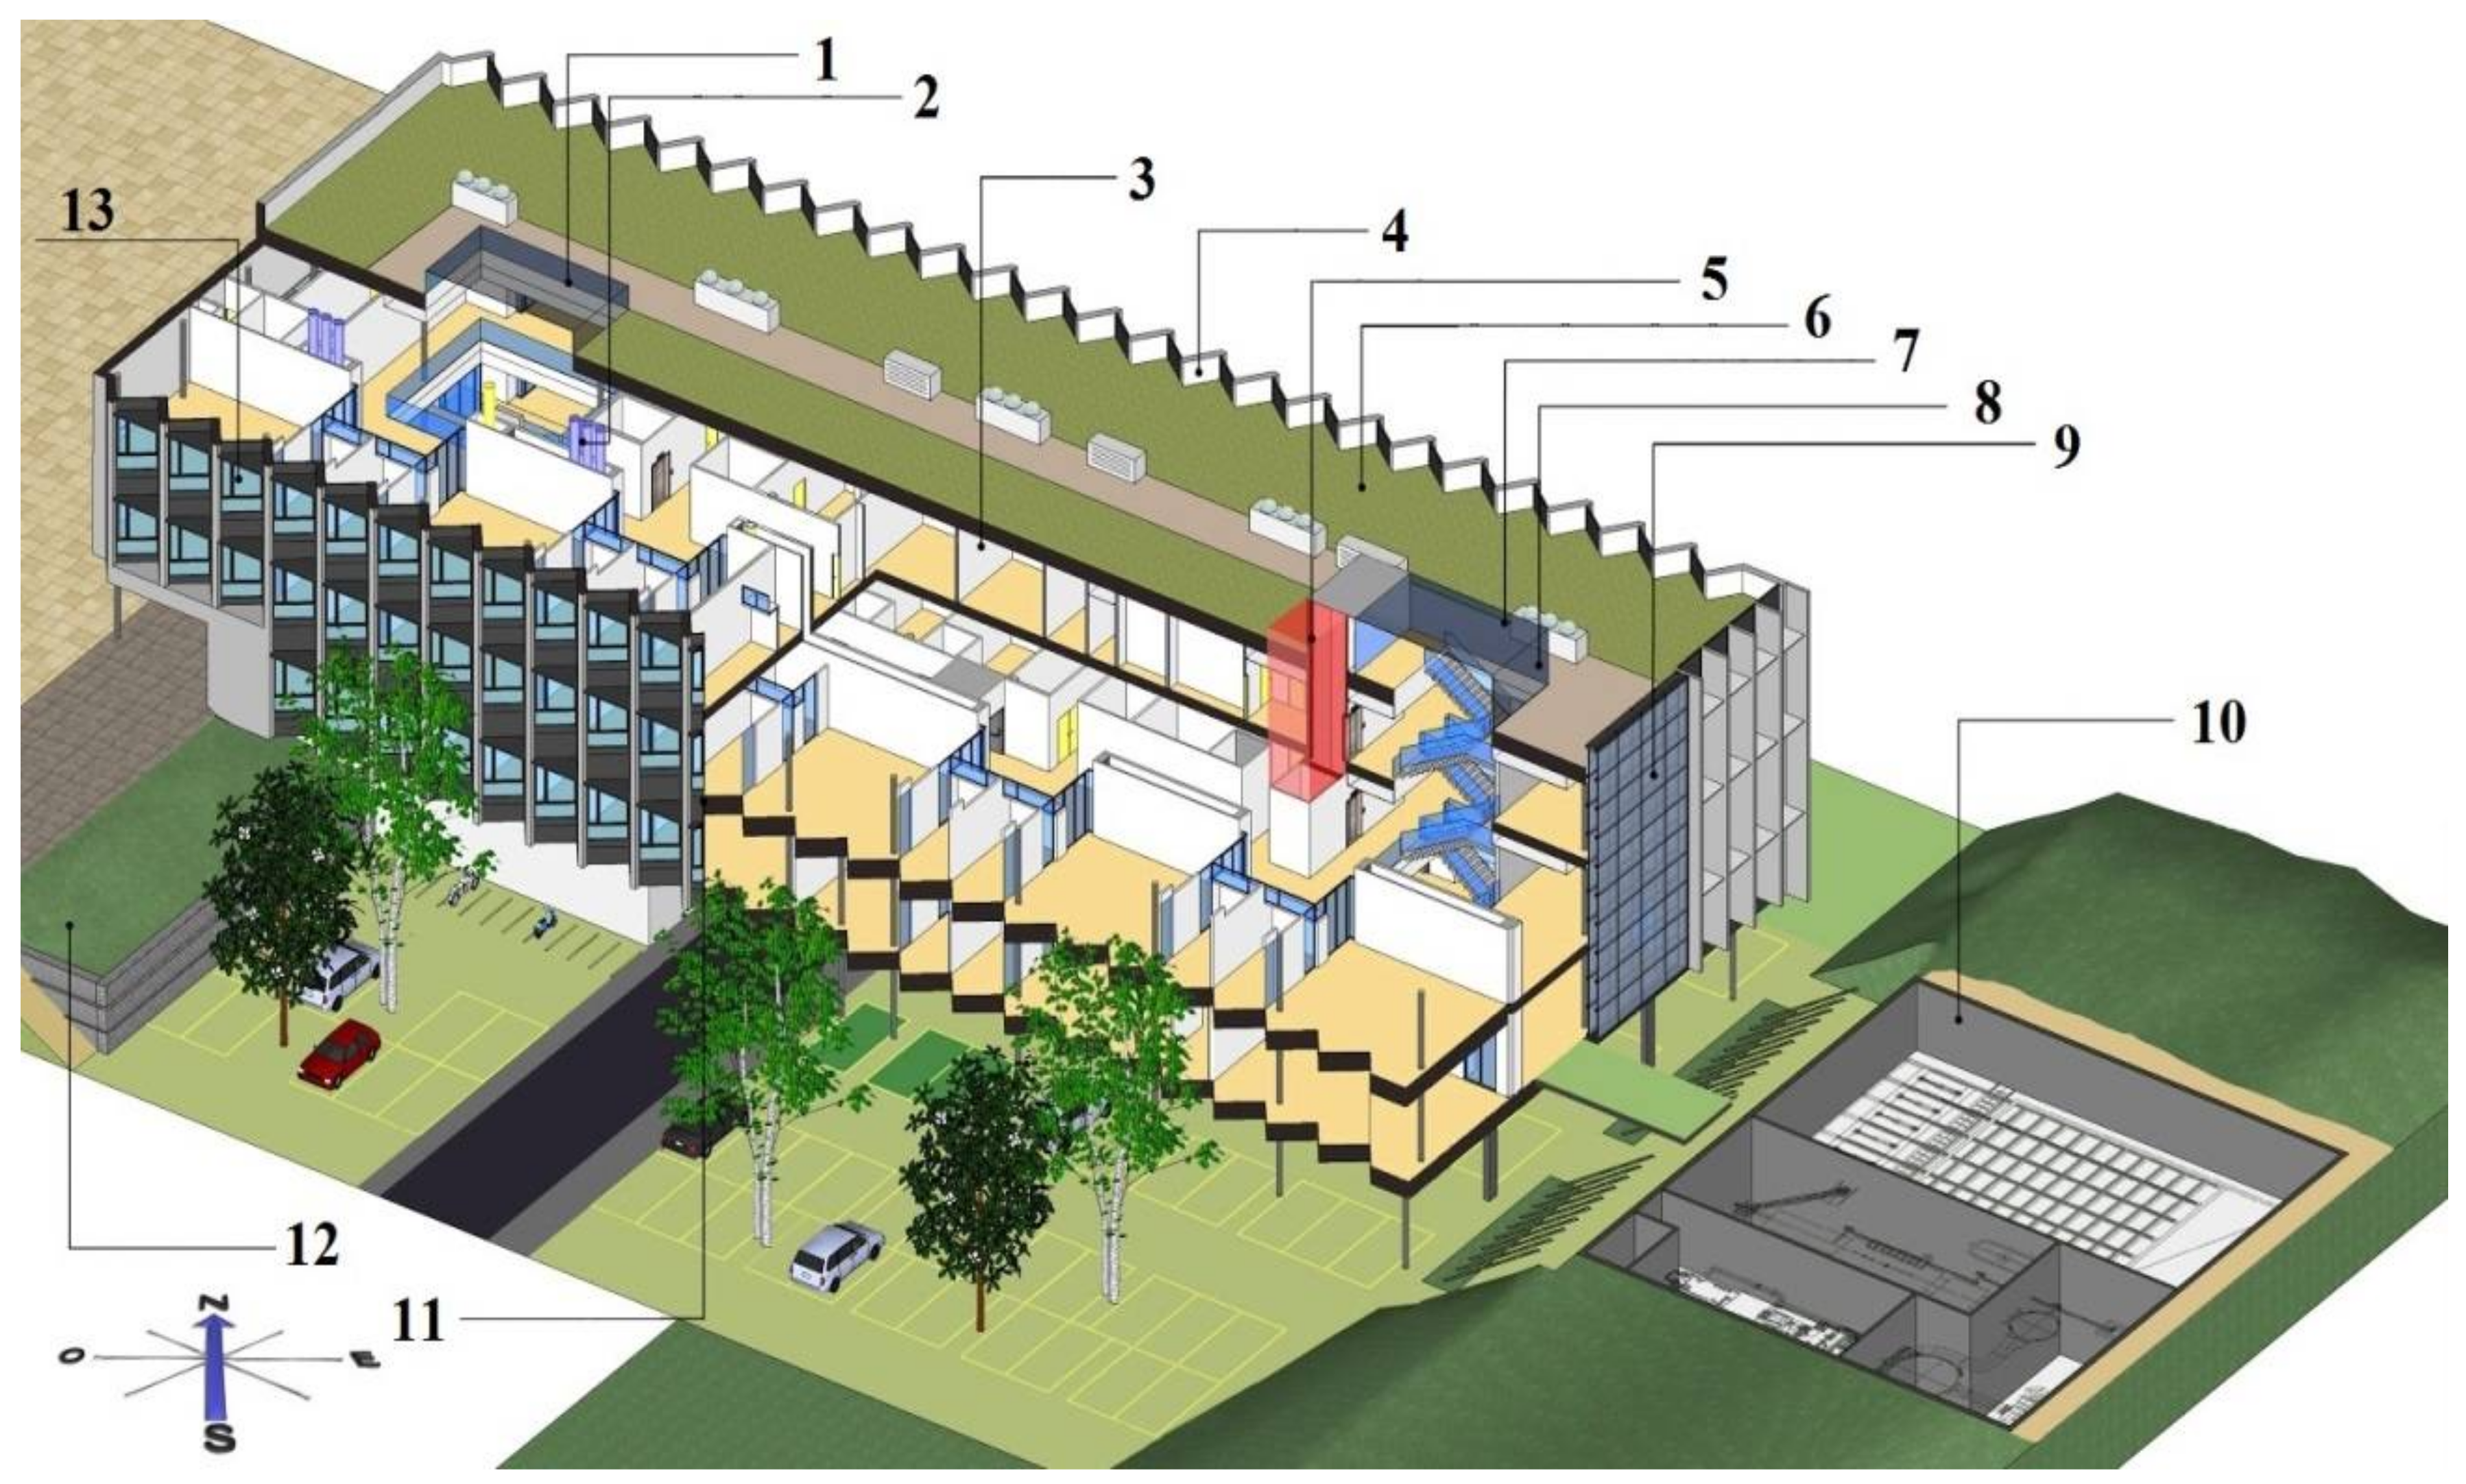
Figure 8 illustrates the 3D model of the building. The model was introduced in DesignBuilder in AutoCAD format, supplied by the Architecture Technical Unit of the University of Valladolid.
From the dynamic simulation of the nZEB LUCIA using the EnergyPlus software, three different indicators have been calculated, following the methodology proposed by the EU to define a nZEB.
The first indicator, the energy consumption ratio per m2 and per year , corresponds to the energy use for heating, cooling, Domestic Hot Water (DHW), lighting and ventilation, as well as the heat and electricity from the CHP system by biomass. The electricity generated by the PV system and fed into the grid has also been calculated, as well as the heat recovery by the geothermal system. The values obtained let us develop an energy balance for the whole nZEB LUCIA.
The second indicator calculated, the Primary Energy indicator, defines the value of the primary renewable energy of the nZEB LUCIA. Through both indicators, we can sketch an overview of the building energy production and consumption and compare it with the maximum and minimum values proposed by the EU.
Finally, the third indicator, called Renewable Energy Ratio (RER) has been calculated, which determines the rate of contribution of renewable energies in the nZEB LUCIA building.
Quality checks were also carried out to ensure that the provided model and the actual building characteristics match [
35,
36]. A more detailed description is provided as
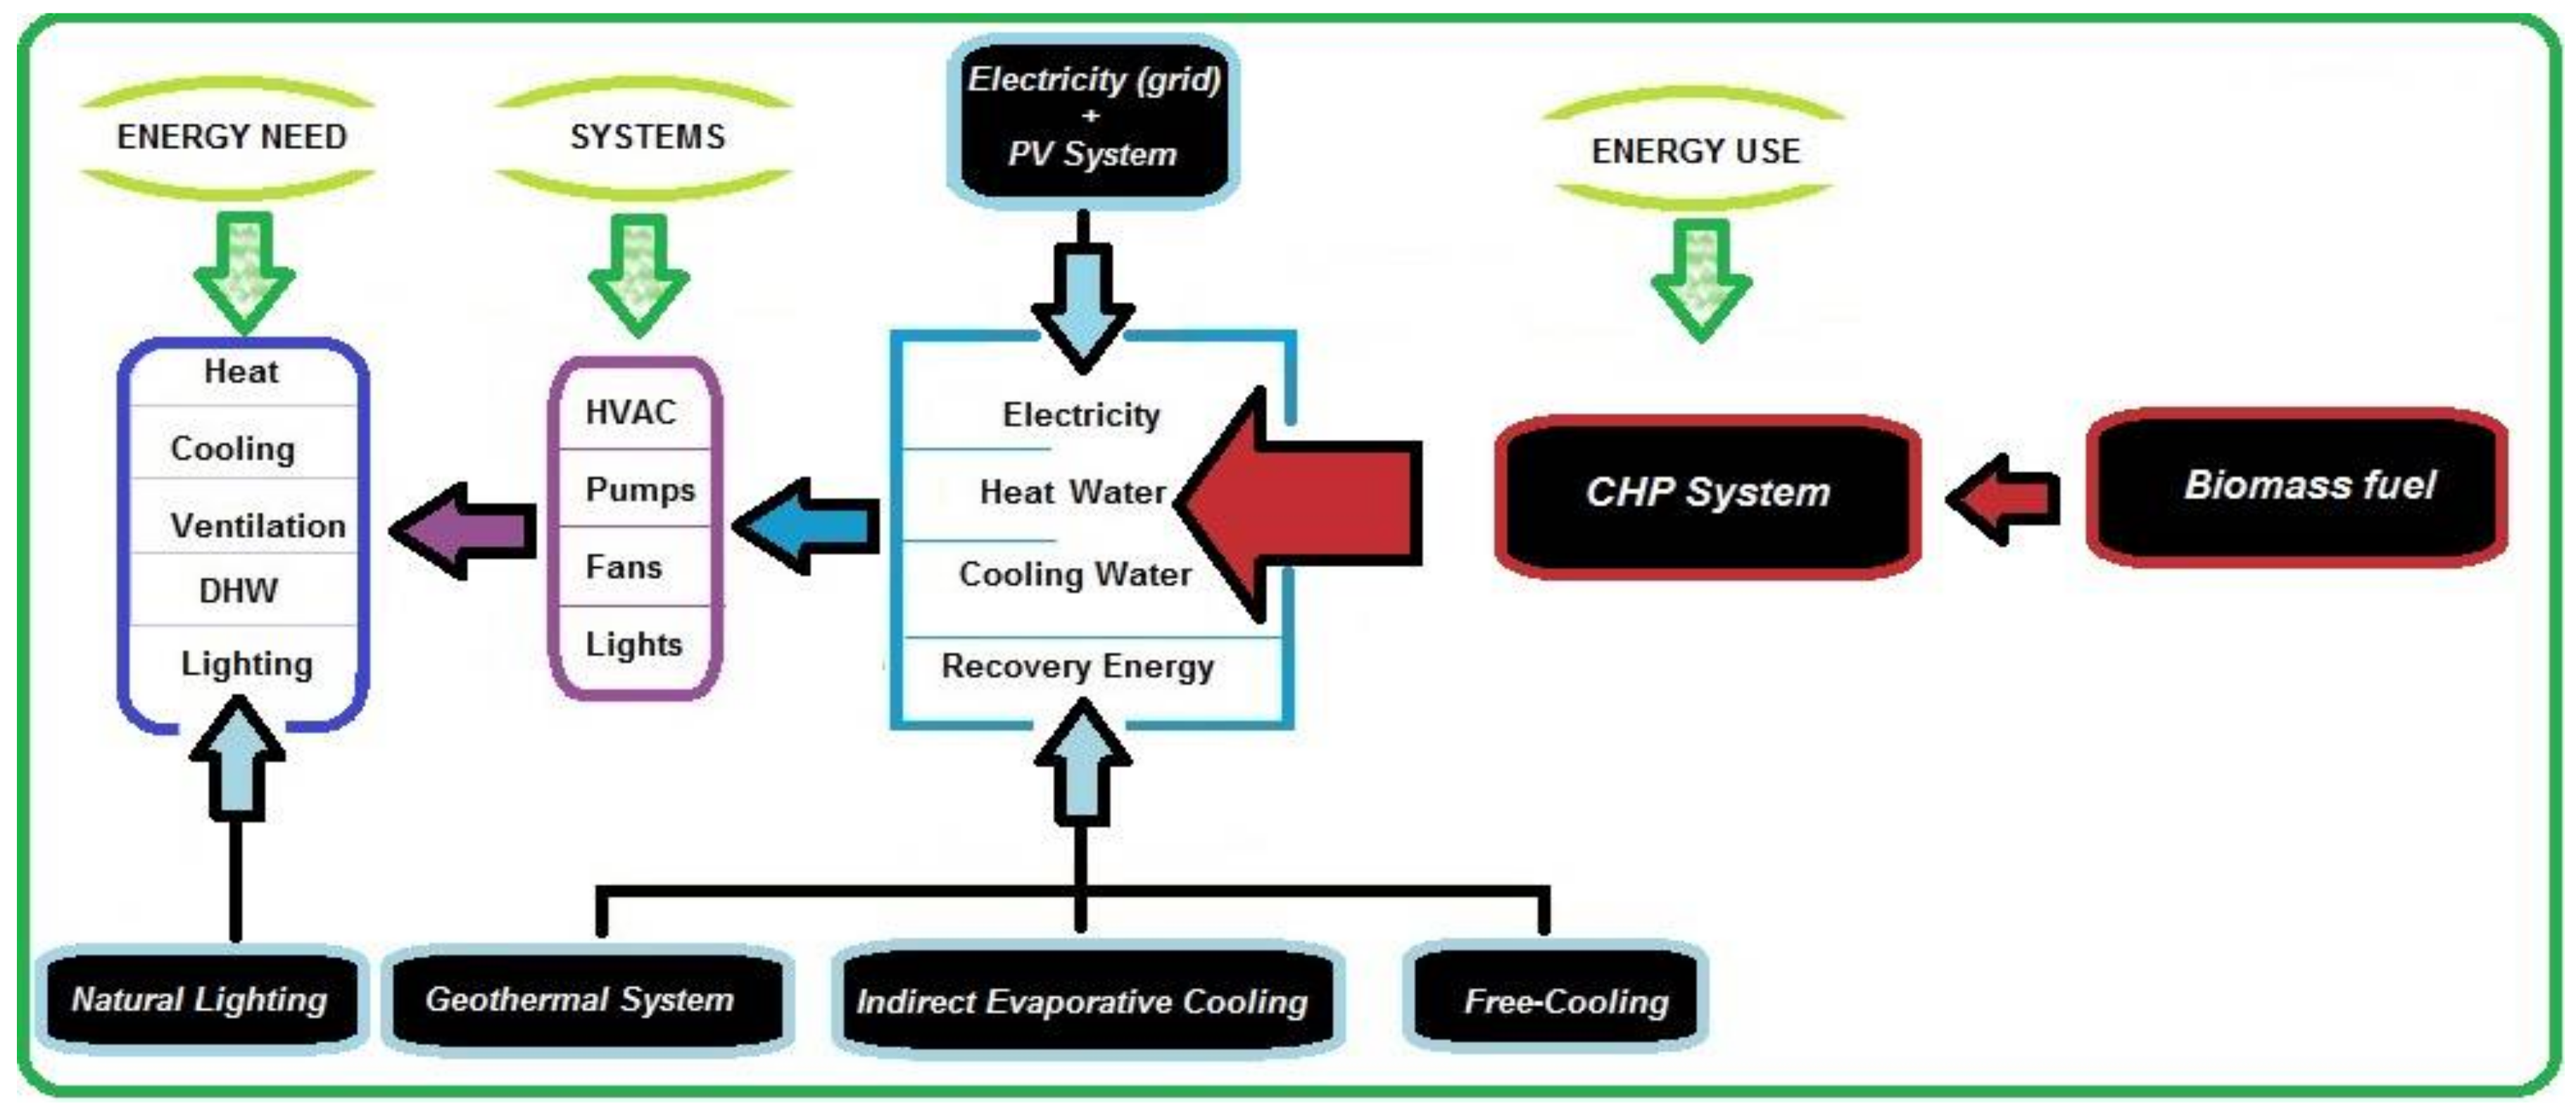
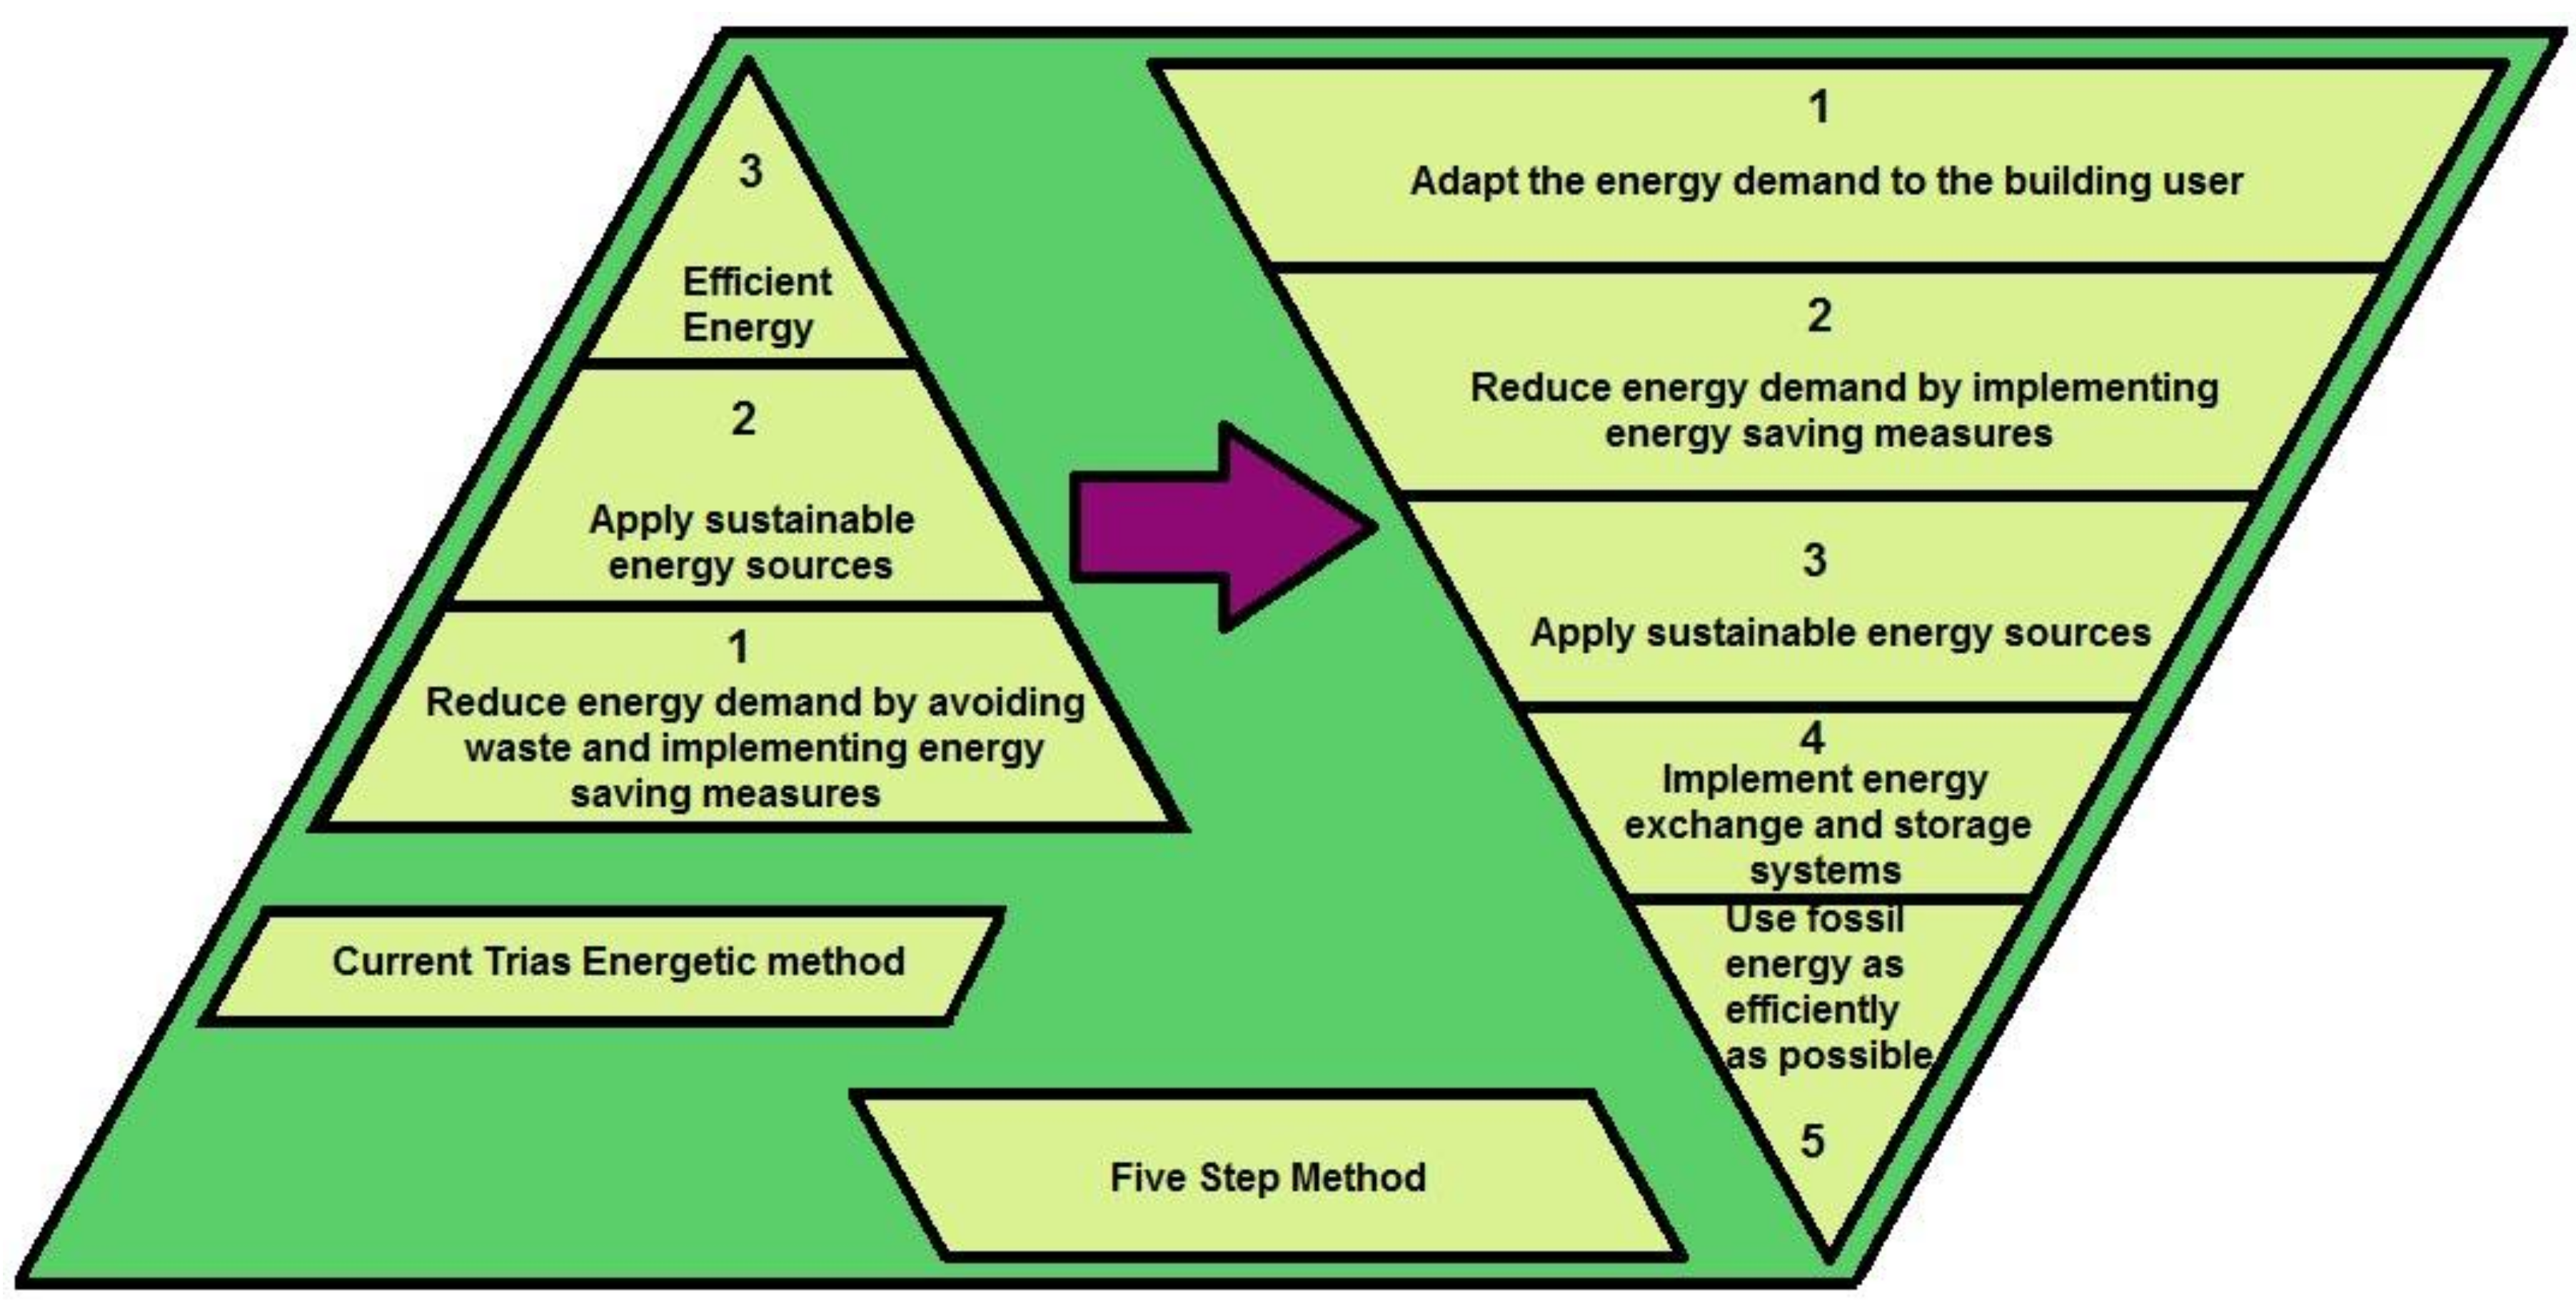
supplementary materials of this paper. The model is developed from a structural and an energy approach. A scheme of the energy model of a nZEB is shown in the
Figure 9. This model must base on a Current Trias Energetic method to be implemented through the strategies proposed in the Five Step Method, with the objective of reducing demand and increasing energy efficiency [
37].
4. Analysis and Results
4.1. Energy Use and Energy Consumption Ratio
In the design and analysis of a nZEB building, it is necessary to approach the different issues presented and gathered in the thematic sections of the database for a nZEB:
General Information
Geometrical data
Building envelope
Building Space Heating System
Space Cooling System
District Hot Water System (DHW)
Storage
Ventilation
Lighting and Appliances
Rechargeable Energy Storage System (RES)
Energy Calculated Data
Energy Monitored Data
Conversion factors
Economic evaluation
Sustainable and green features
References.
Once the model is validated, DesignBuilder is run to simulate the building’s energy performance.
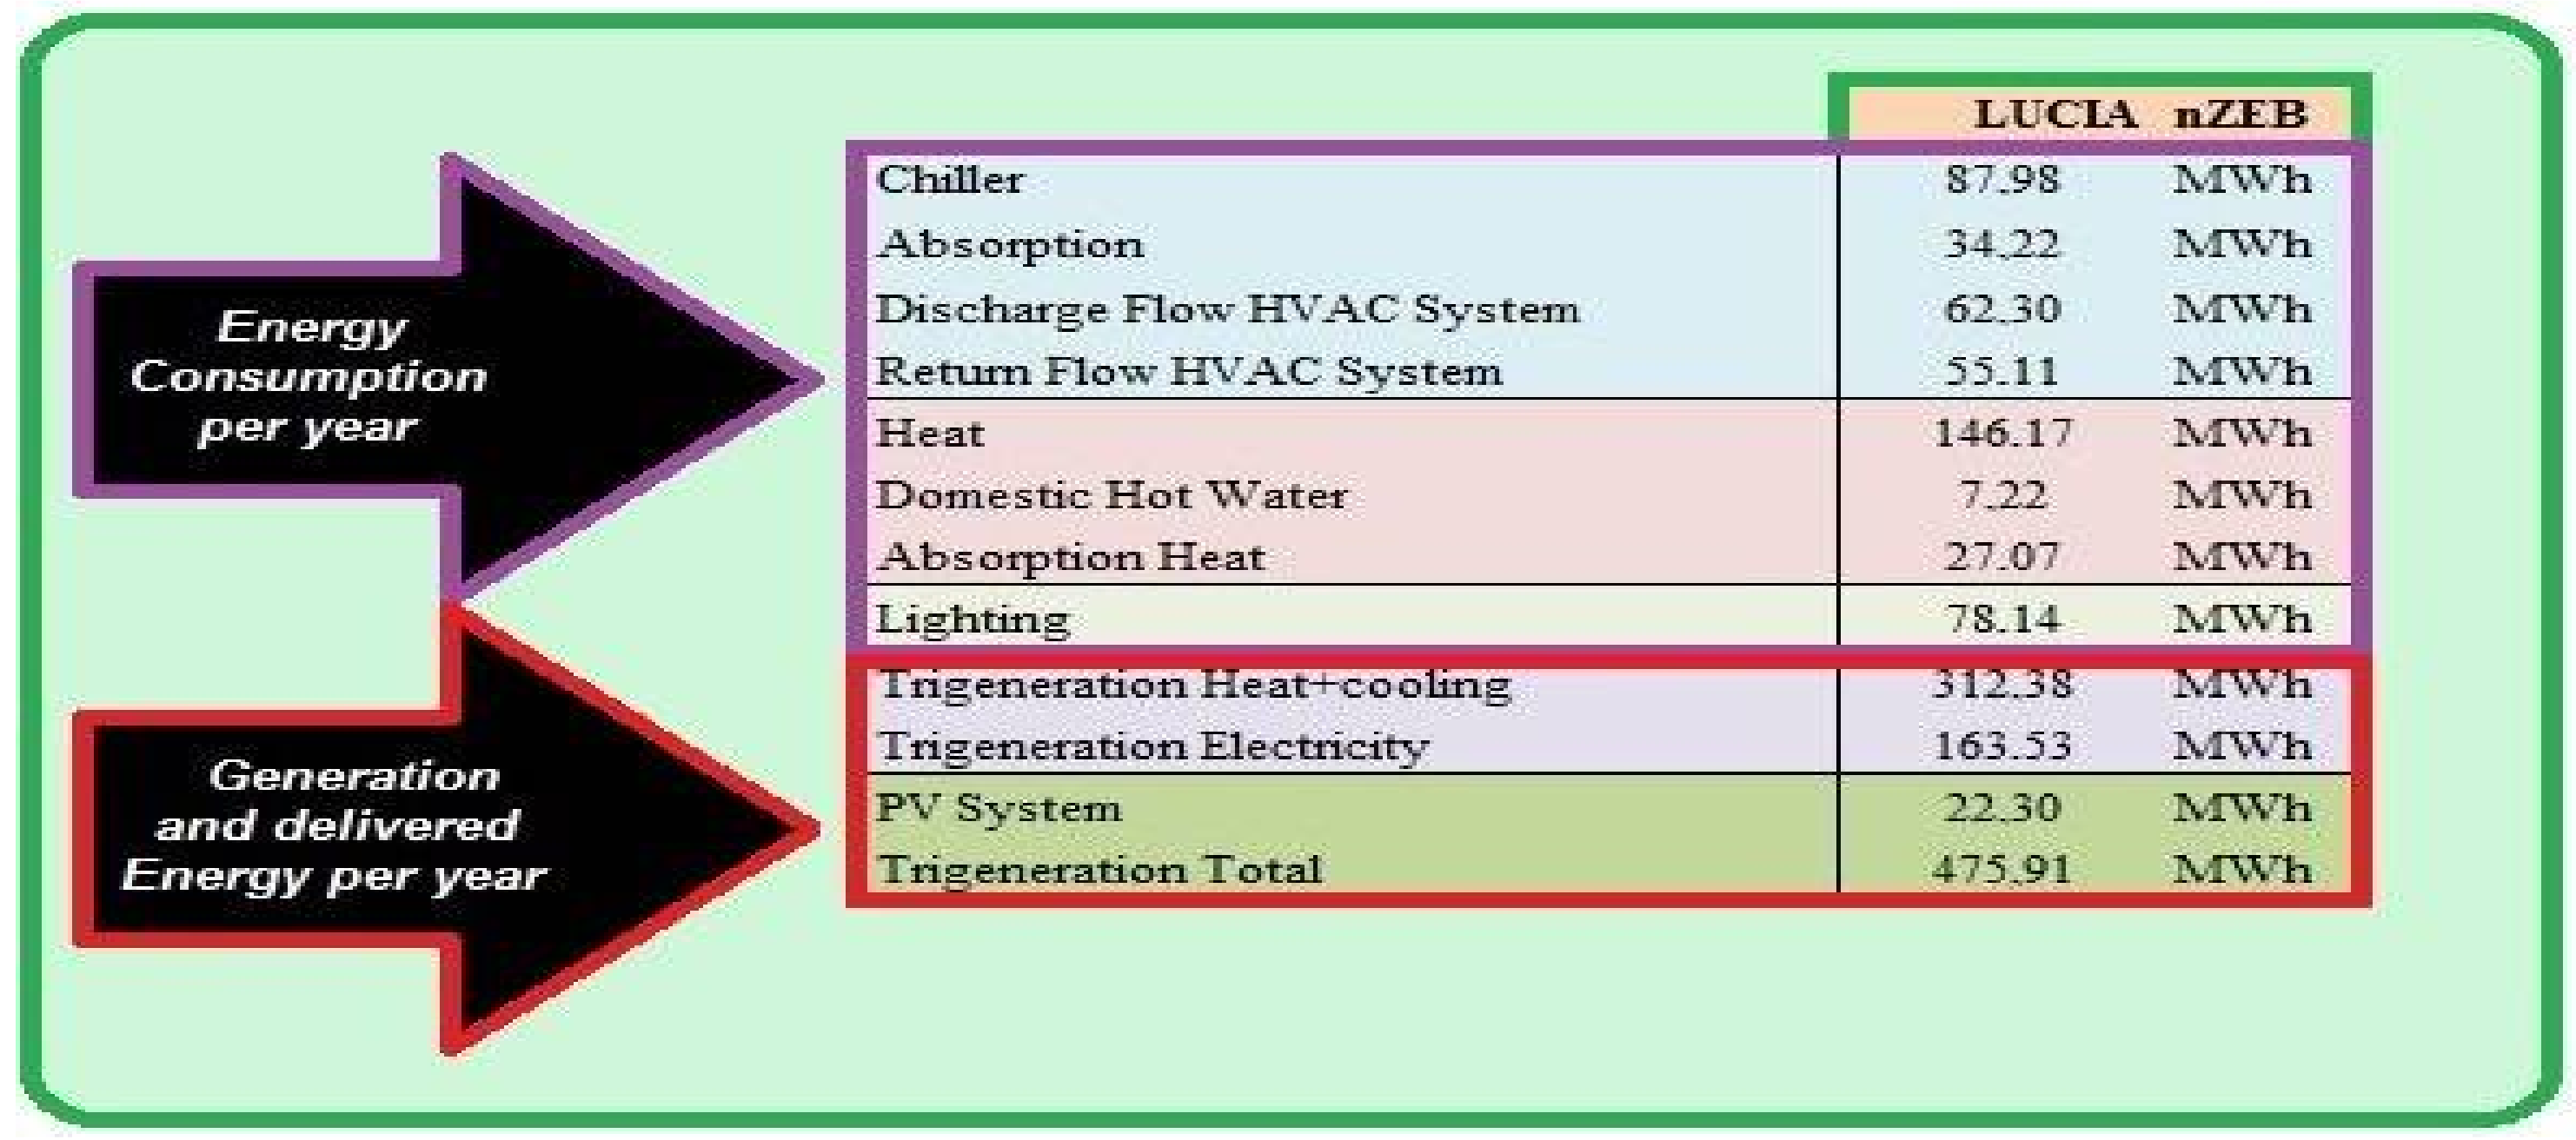
Figure 10 shows the breakdown of the building’s energy consumption, divided into heating, cooling, hot water and lighting, as well as the energy generation by the biomass tri-generation system and the photovoltaic system. The separation of consumption in flow, discharge and return, is due to the mode of operation of the building, which is always over-pressured to avoid outdoor pollutants.
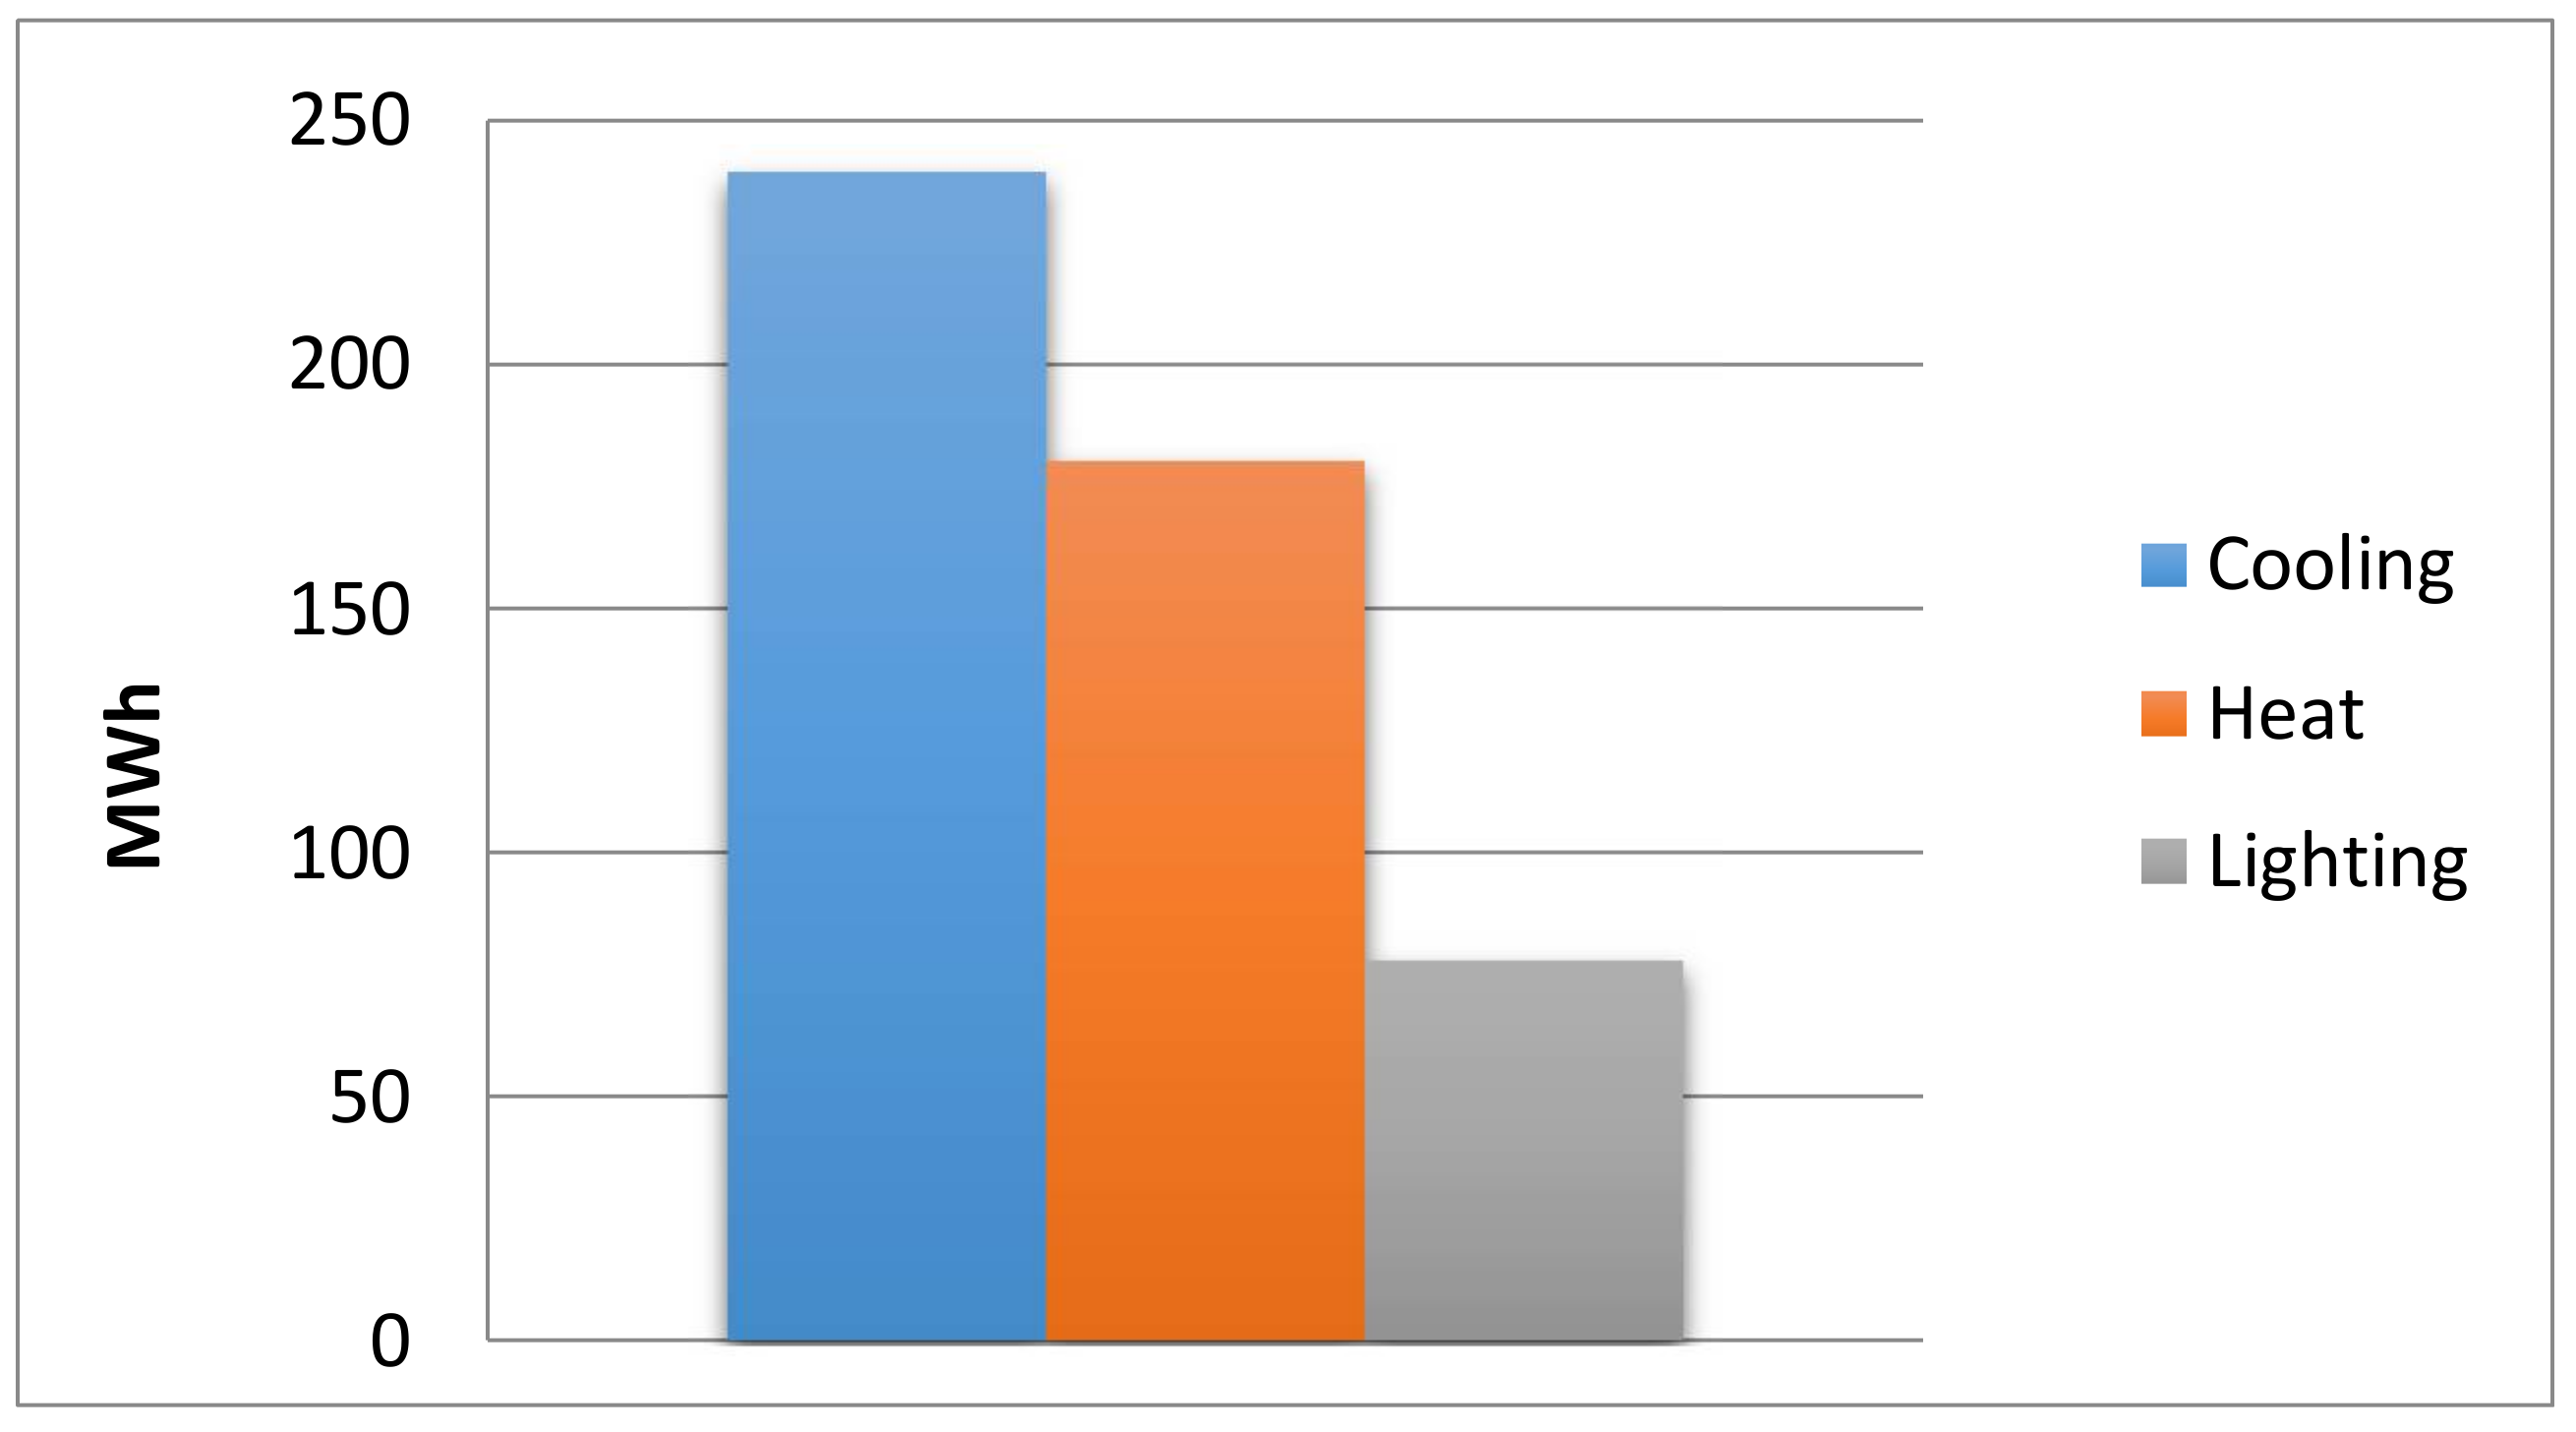
Energy consumption by sector of LUCIA nZEB is shown in
Figure 11. The main energy consumptions per year are due to cooling 48%, followed by heating (36%) and lighting (16%).
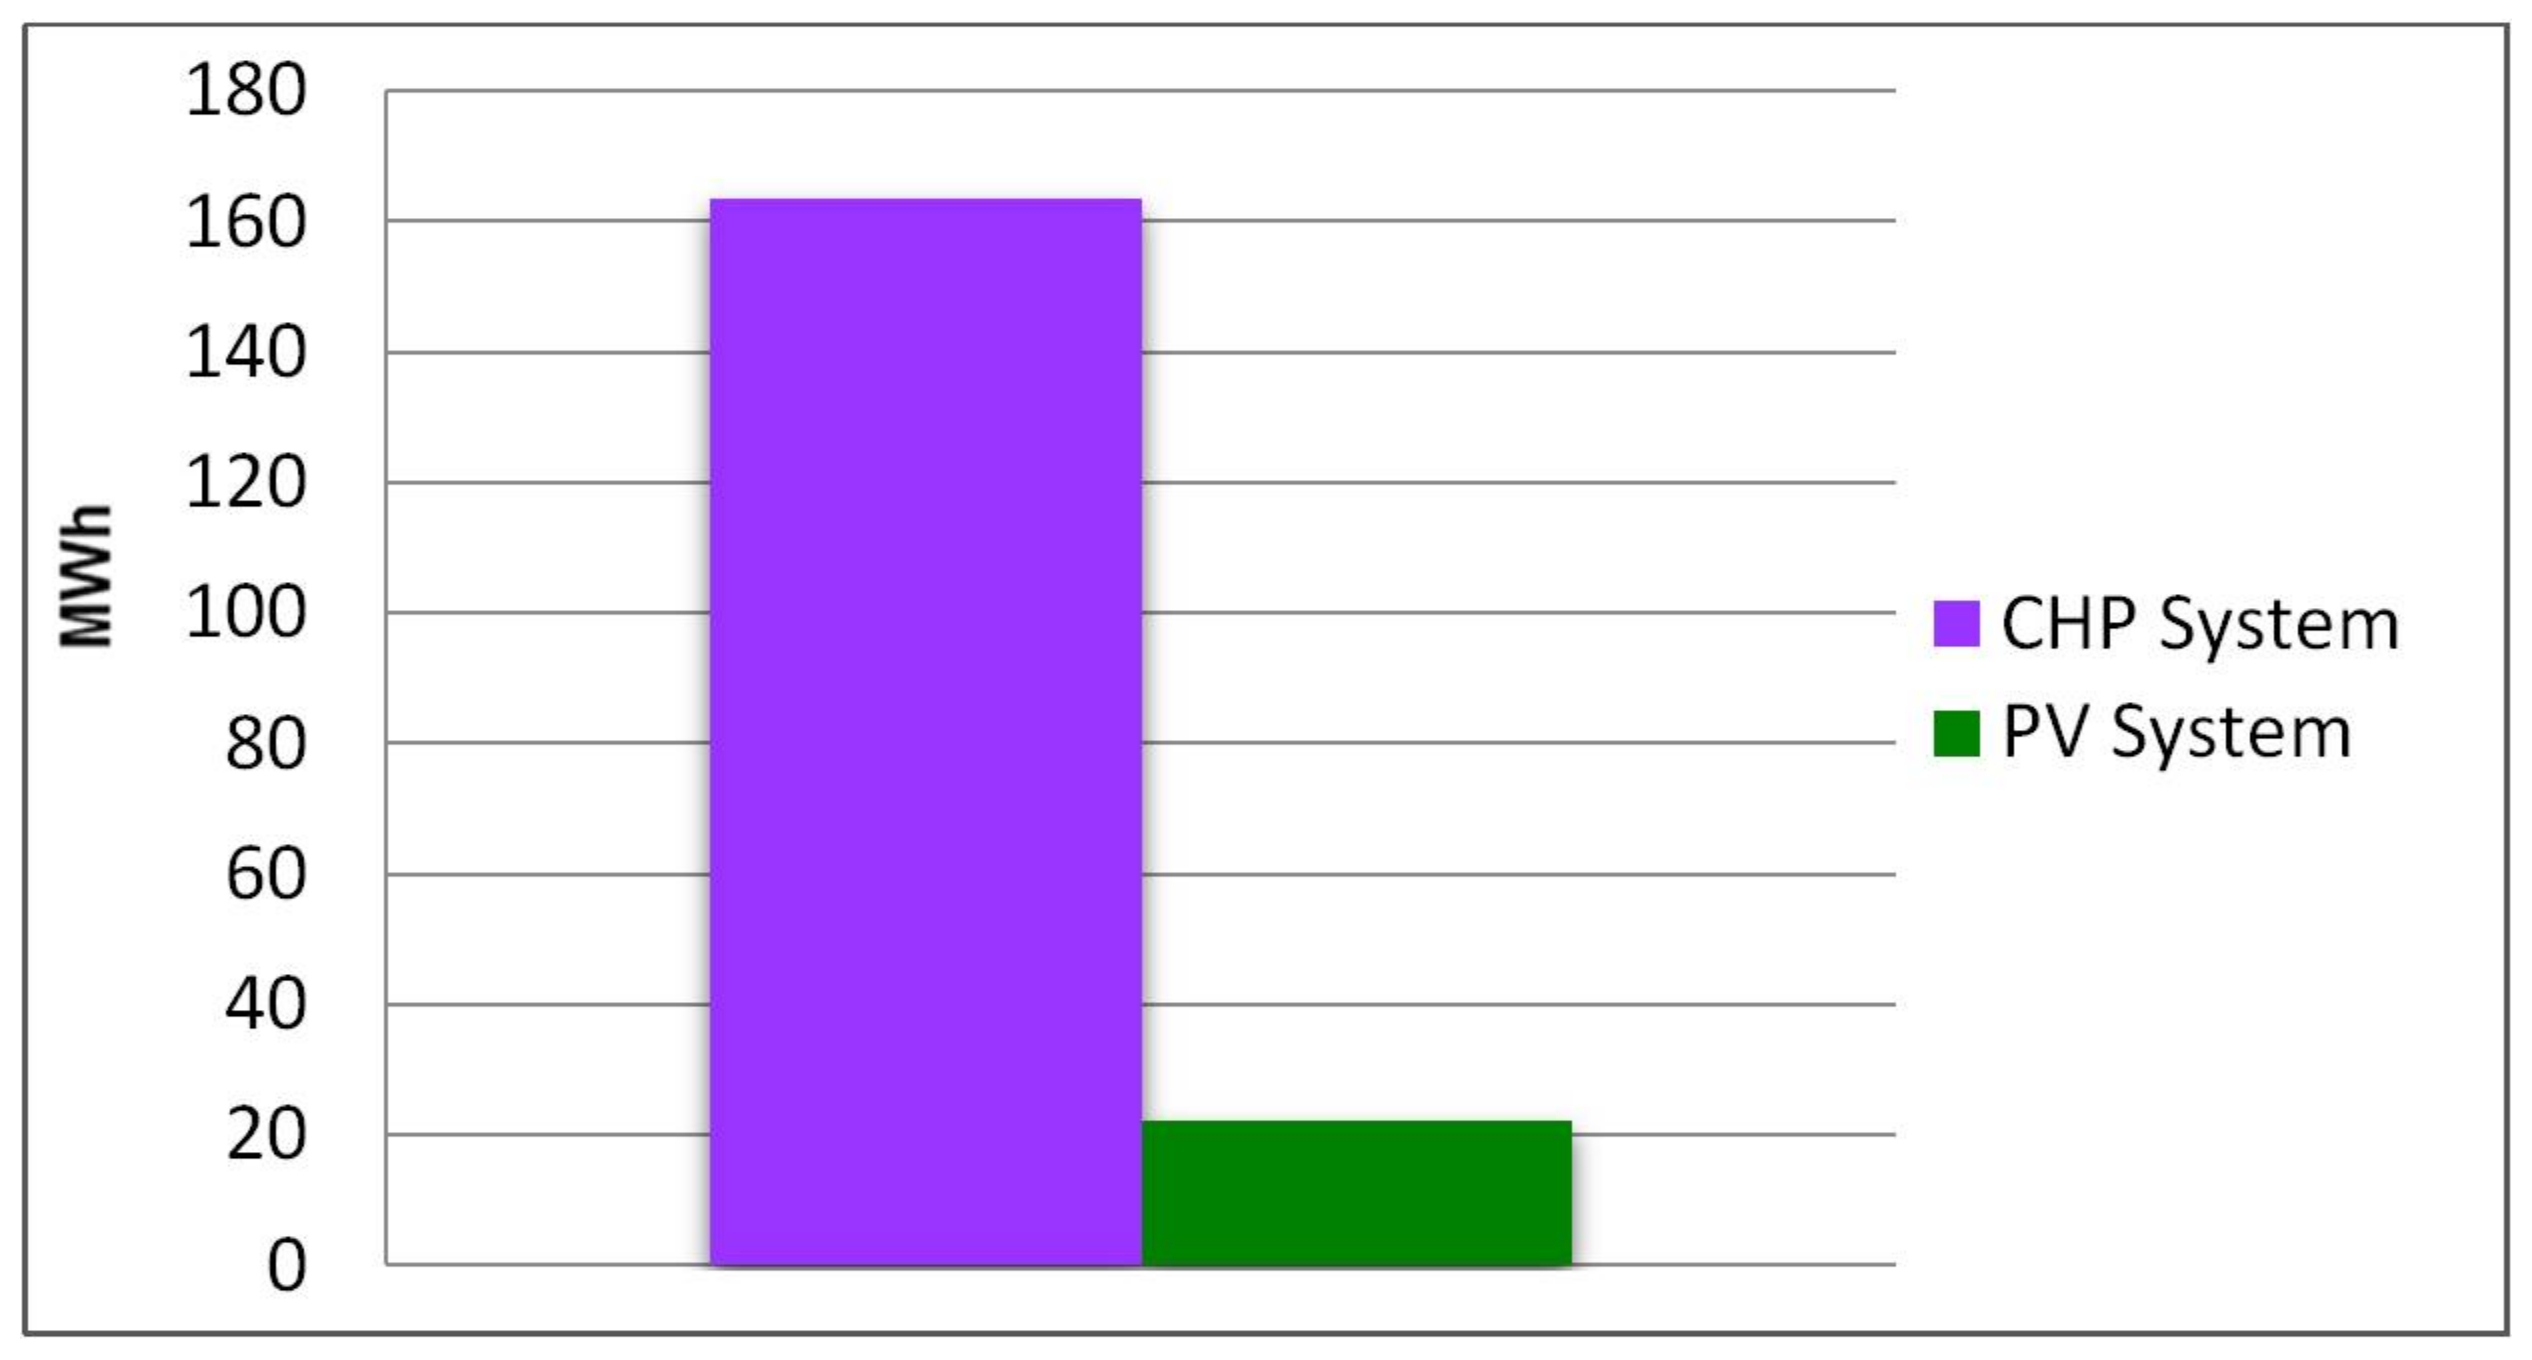
The electric energy use that feeds LUCIA nZEB is produced by the two autonomous systems described previously: photovoltaic (PV) and cogeneration (CHP). This building is designed to operate mainly with electricity generated from tri-generation. It is observed in this analysis that 88% of the building’s electrical generation is supported by the tri-generation system, compared to 12% generated from the PV (
Figure 12).
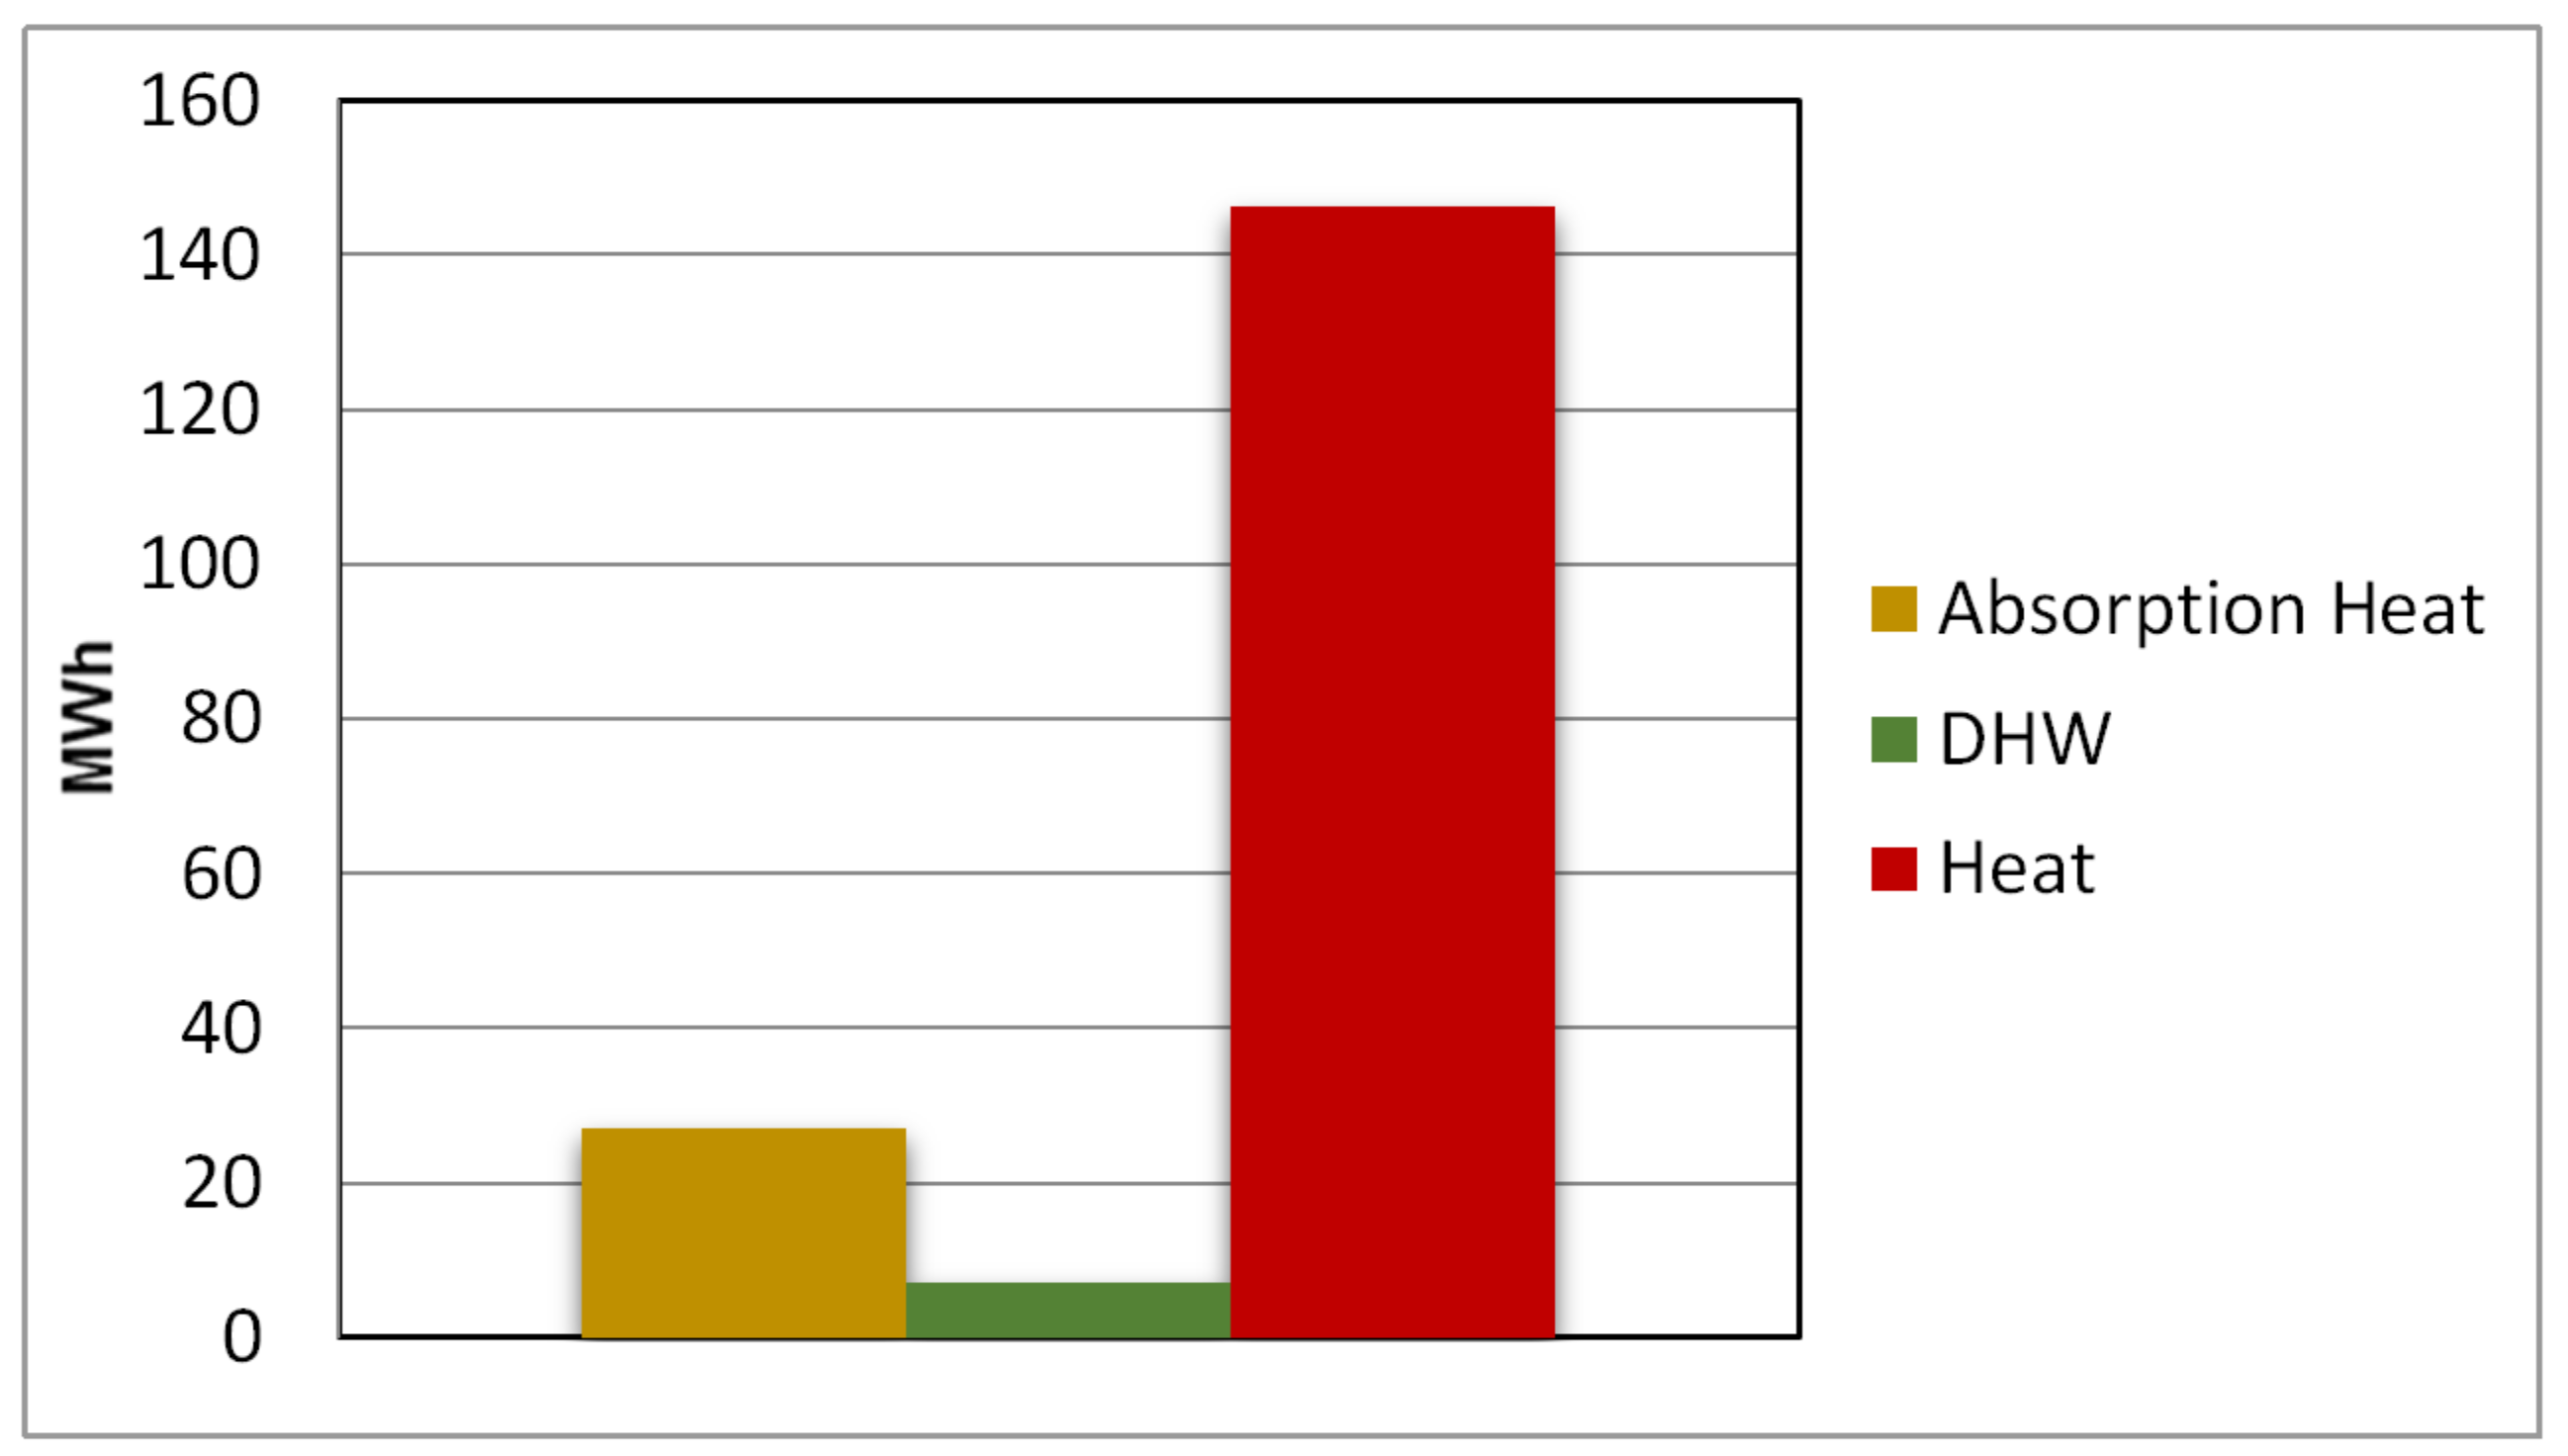
The heat produced by the tri-generation system through the biomass fuel has three uses: the first is the supply of DHW, which accounts for 4% of the total heating consumption. This building does not have a great demand for hot water, as it is used mainly for office and laboratory activities, where the demand for DHW is minimal. About 15% of heating demand is used for absorption cooling, especially during summer, while the remaining 81% is applied for indoor heating of the building (
Figure 13).
As can be observed in
Figure 13, almost all of the heat produced by the CHP system is required for heating the building. This percentage depends on the season, as the need for heating will decrease in summer; actually, most of the thermal energy during this period is used for absorption cooling.
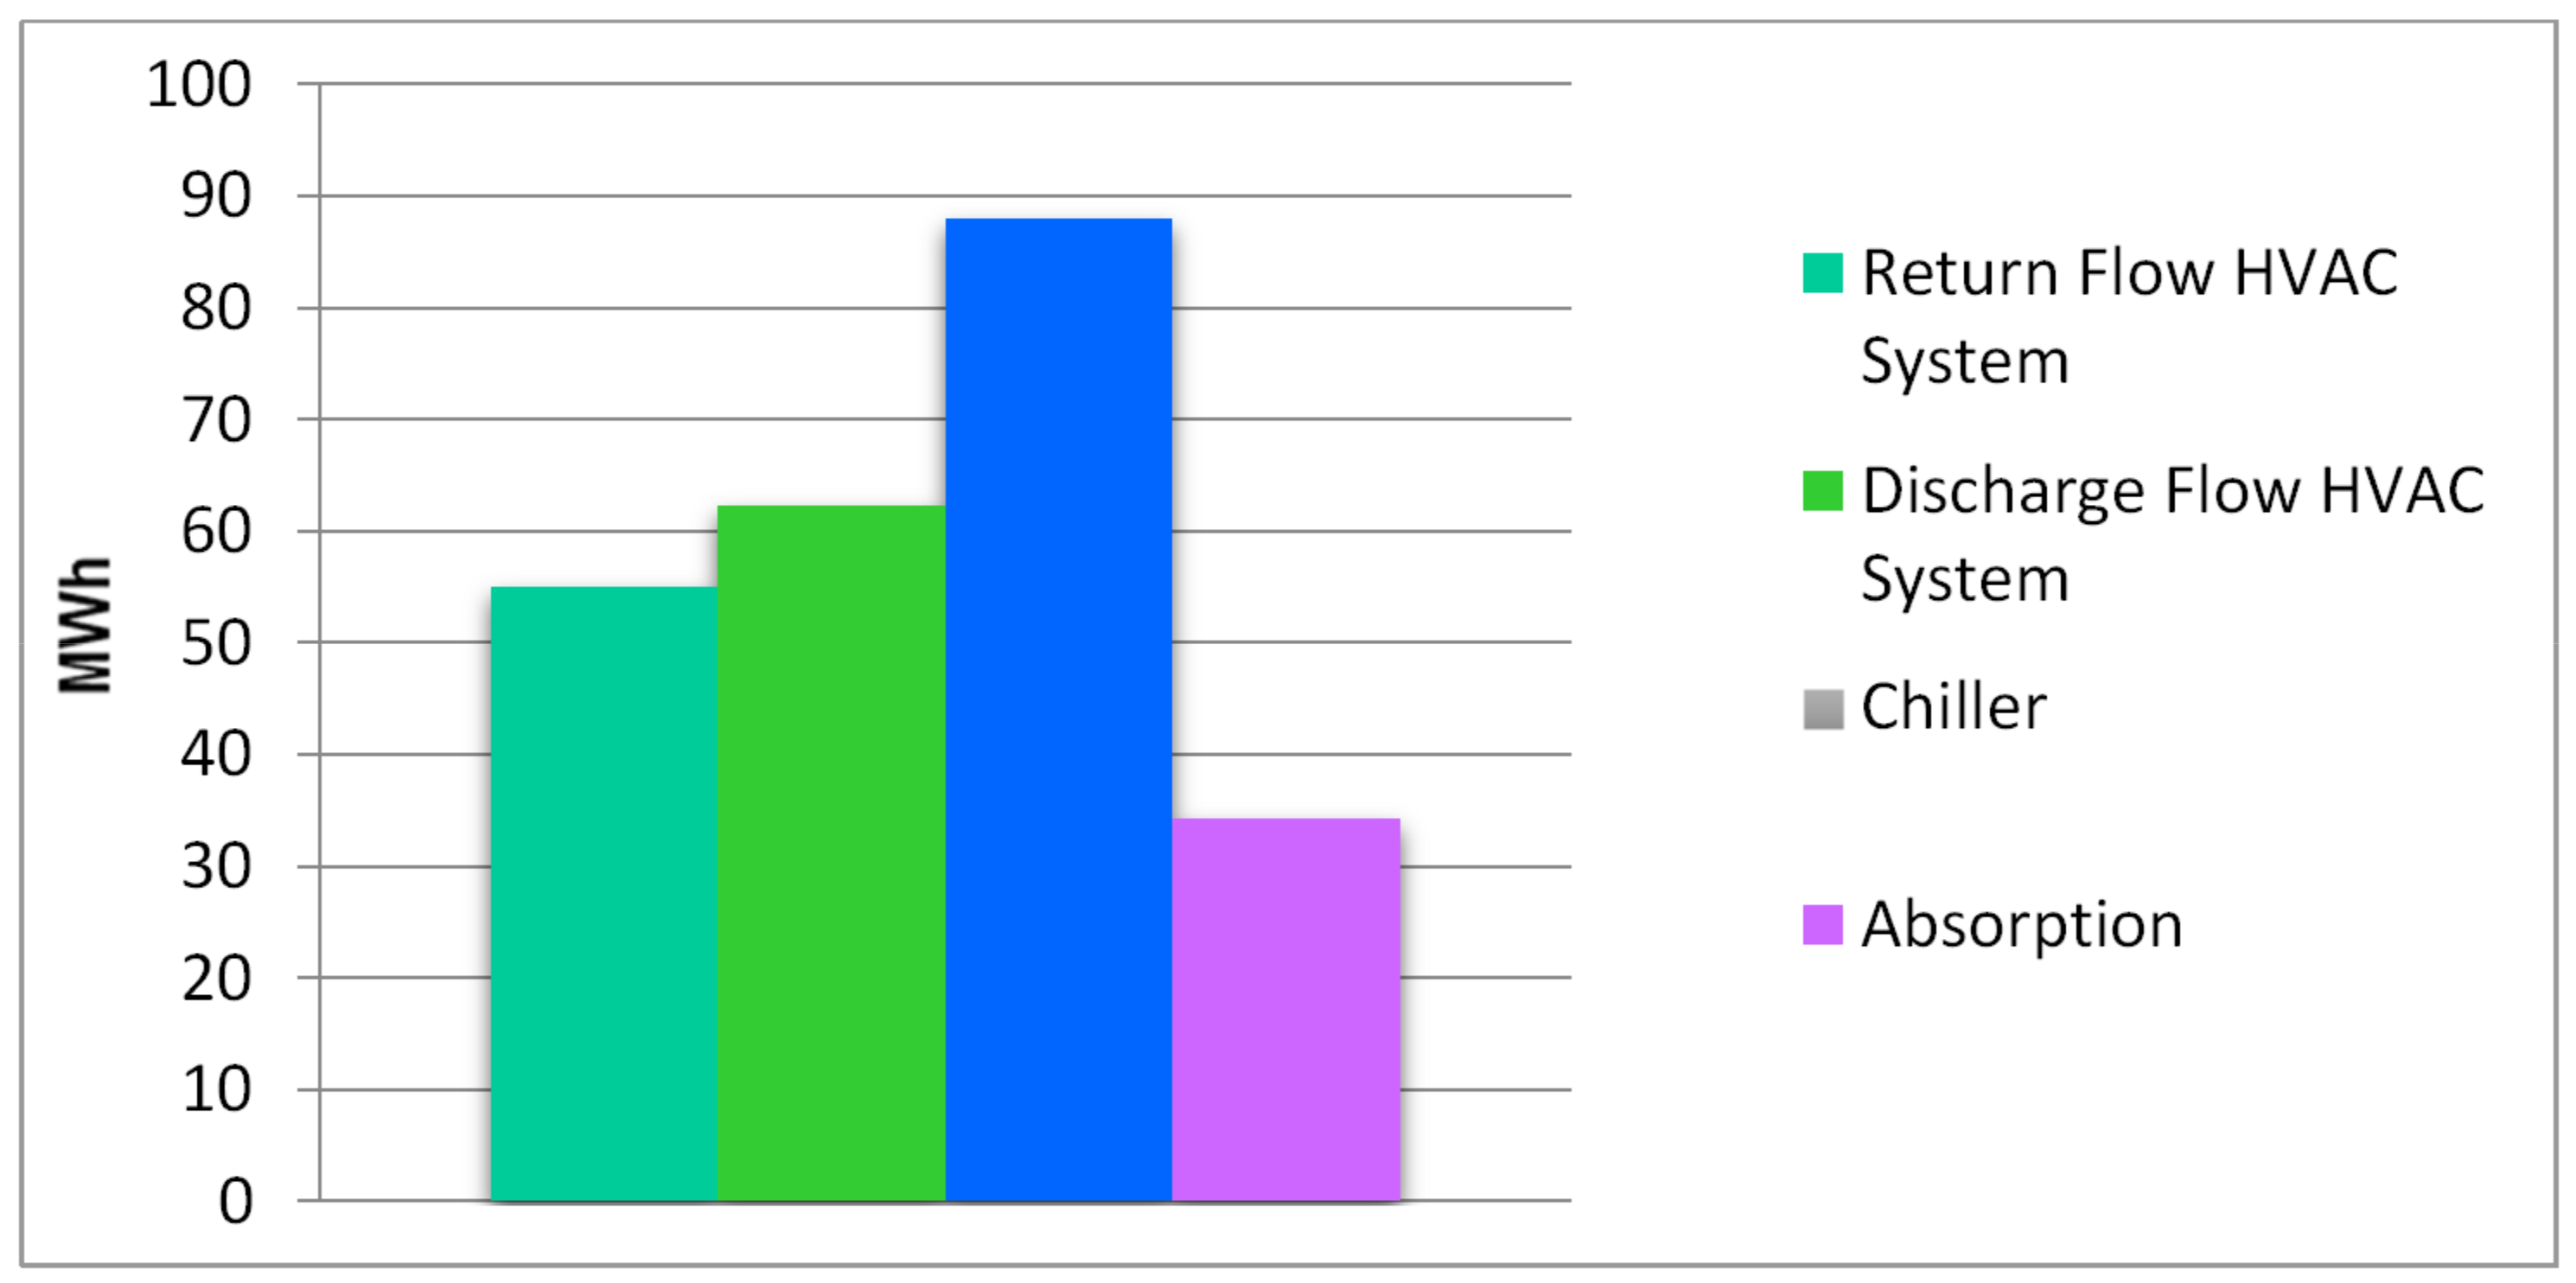
Regarding to space cooling, energy consumed by the different cooling systems is shown in
Figure 14. The chiller consumes up to 37%, while the absorption system accounts for 14% of the total energy consumed for cooling. The remaining 49% of energy consumption for cooling is almost balanced between the discharge flow and return flow HVAC system, which includes energy consumption for all fans, pumps, and the Air Handling Unit (AHU). The small difference in energy consumption between discharge and return is due to the building overpressure, where infiltration is reduced to a minimal level (
Figure 14).
Energy use and generation per year at LUCIA nZEB is shown in
Table 1.
Table 2 shows the energy use, delivered electricity generation and energy from different energy systems at LUCIA nZEB per year. These figures derive from the simulation of the building with DesignBuilder.
4.2. Energy Balance of LUCIA nZEB
The definition of a nZEB shall be based on delivered and exported energy according to EPBD recast and pr.EN15603 [
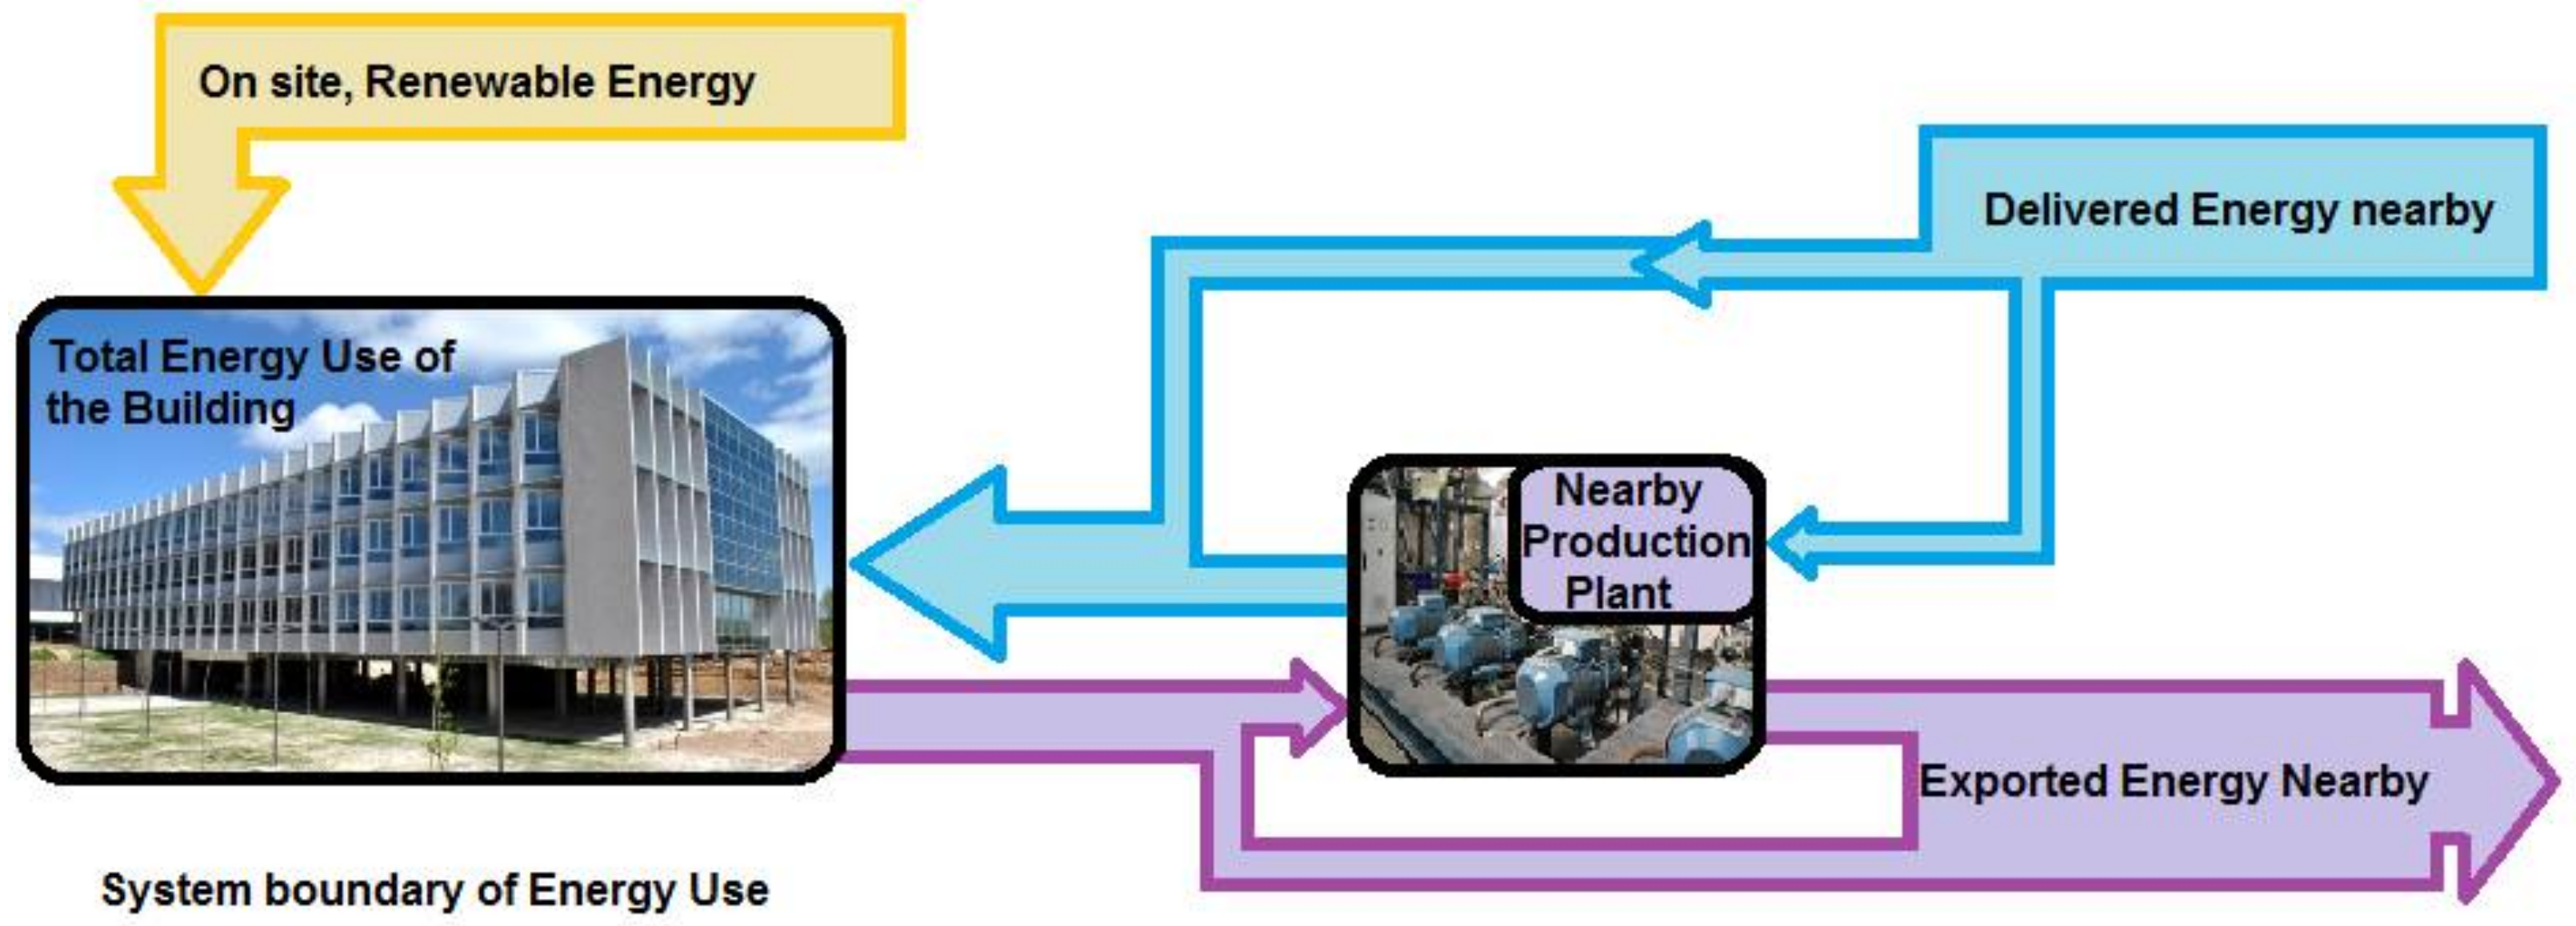
3]. The basic energy balance of the delivered and exported energy and system boundaries for the primary and renewable energy calculations are shown in
Figure 15. According to EPBD recast, all components of the energy use are mandatory except the energy use of appliances (households, elevators and outlets) which may or may not be included. In the former case, energy use in the buildings includes energy used for heating, cooling, ventilation, hot water, lighting and appliances.
To calculate delivered and exported energy nearby, the energy flows of energy production plant contractually linked to the building are to be added or subtracted to the delivered and exported energy flows on site.
In the nZEB LUCIA building, an energy balance of the Energy Consumption Ratio
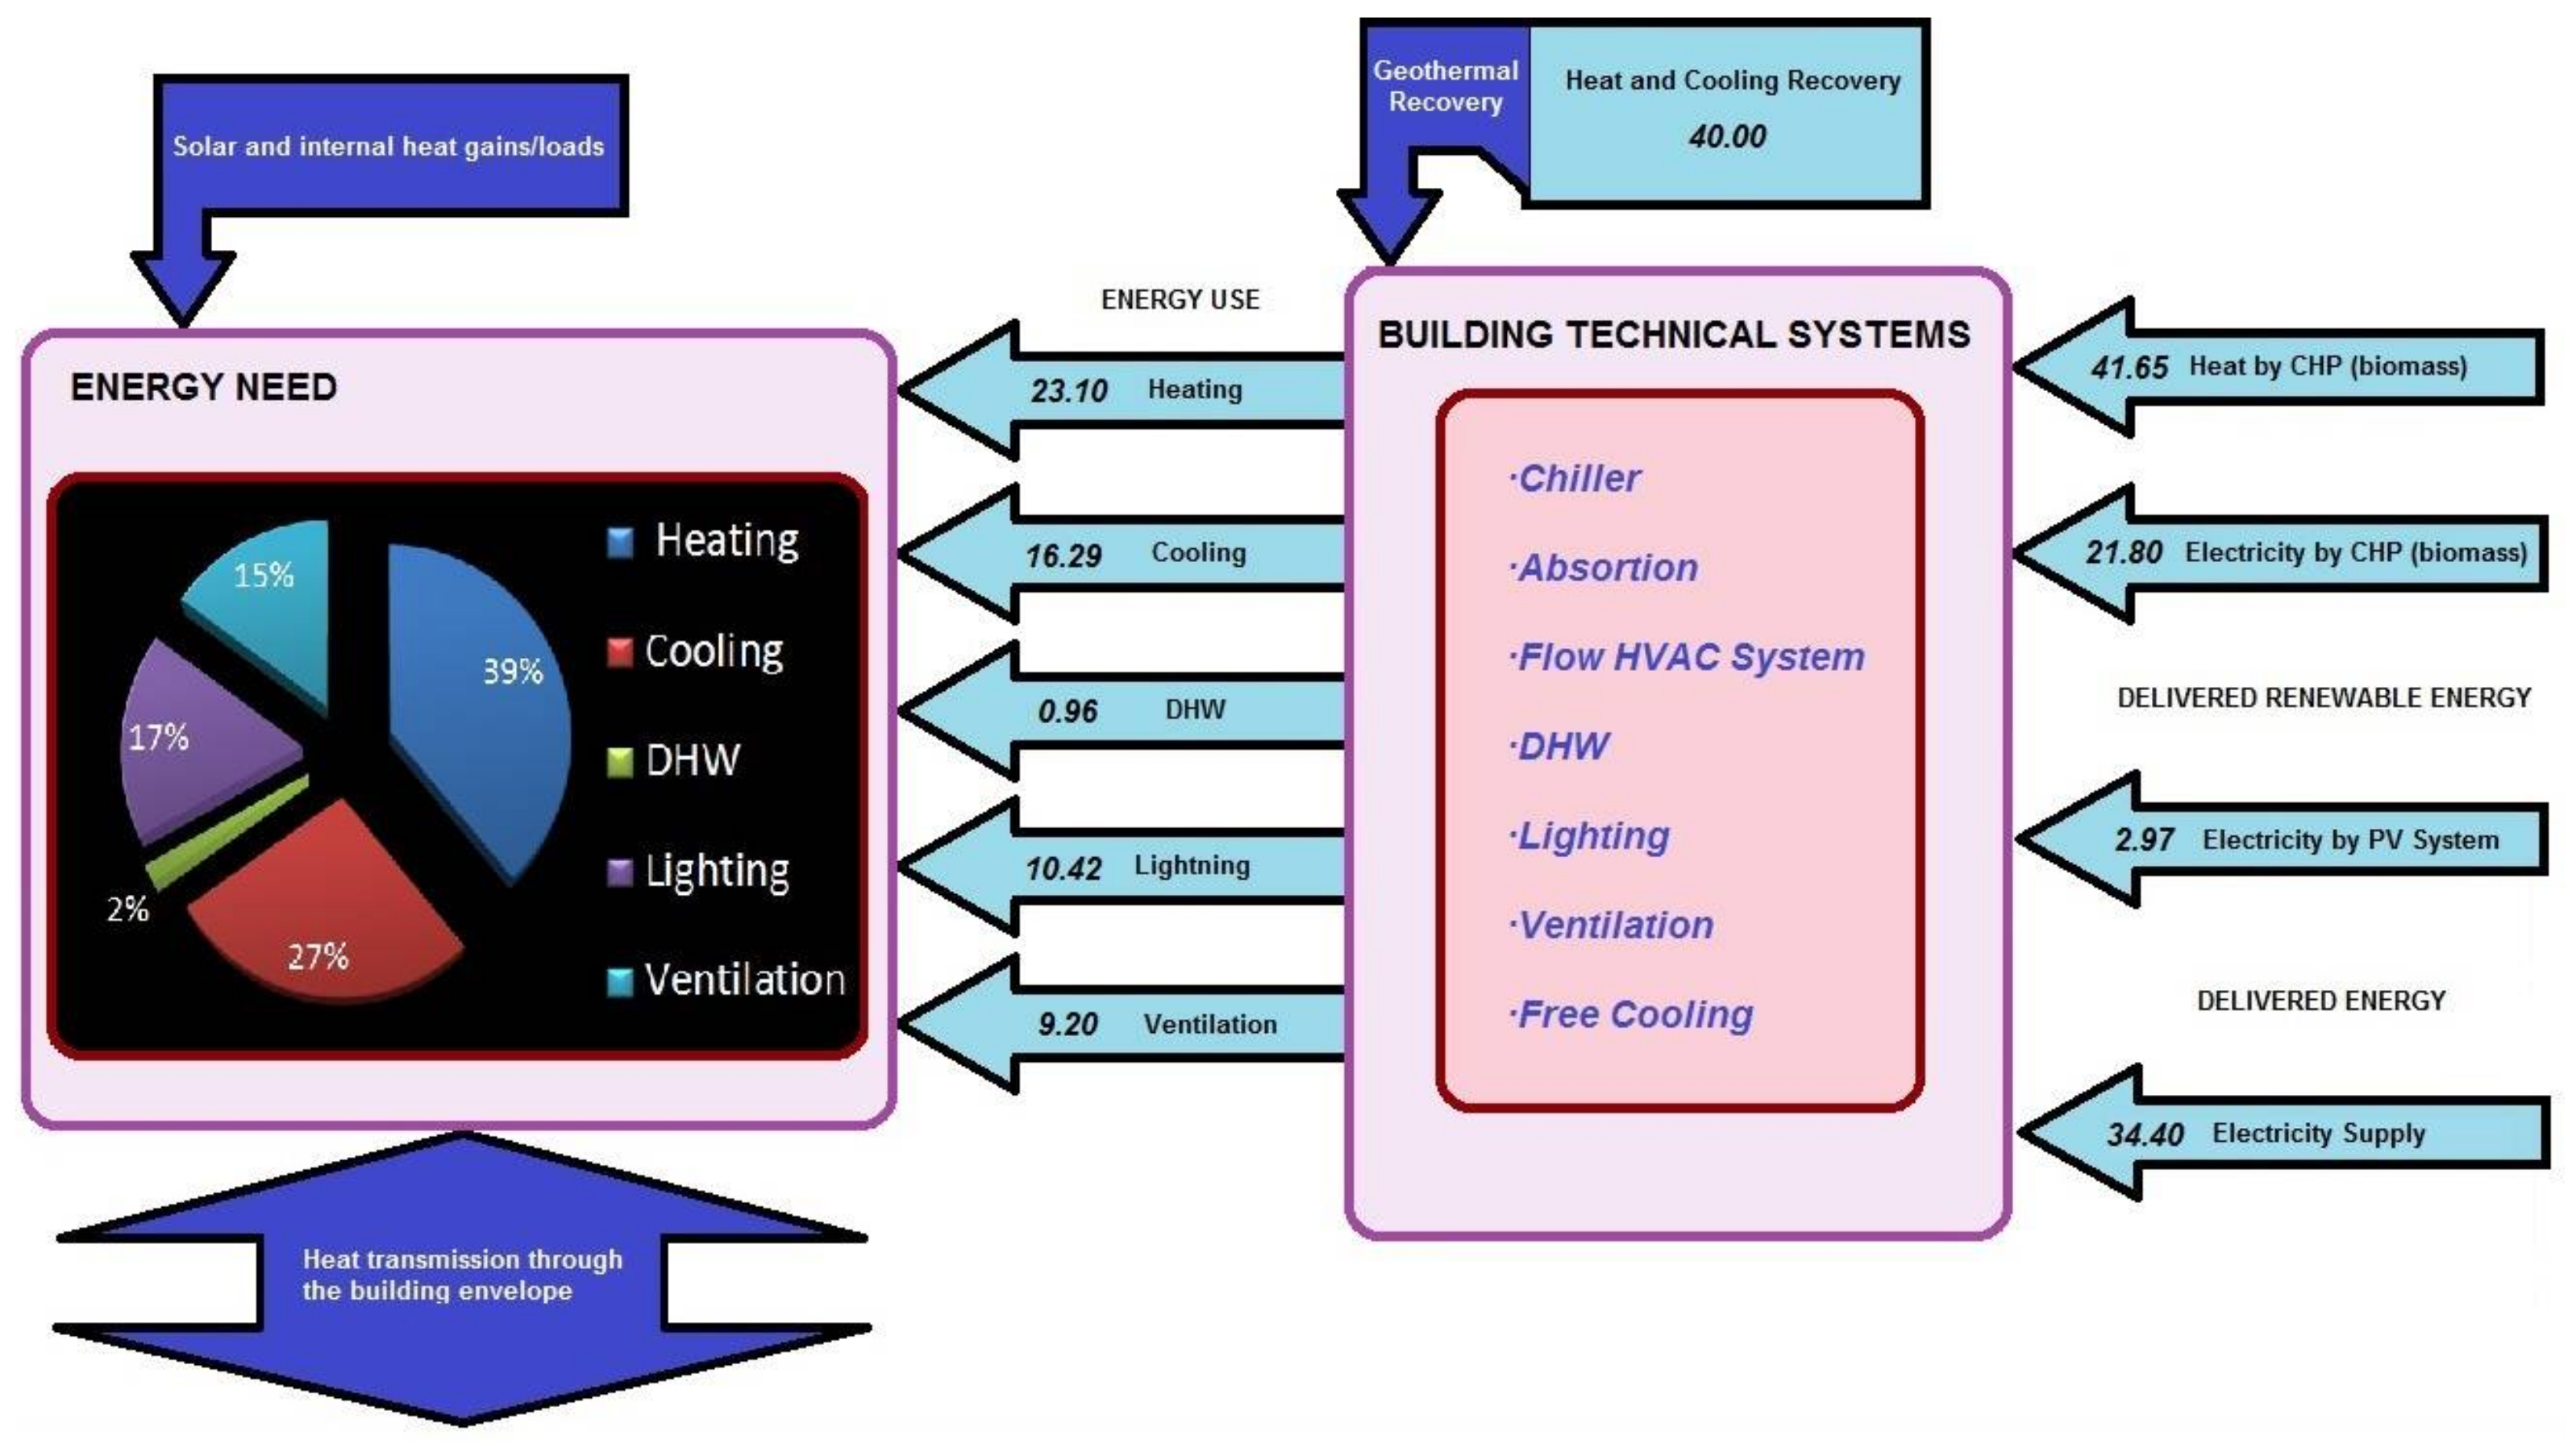
, related to the renewable energy delivered to the building by the biomass-fed CHP system has been obtained, comprising heat, electricity and the energy delivered to the grid. The nZEB LUCIA has technical systems as shown in
Figure 16, where the energy use of heating, cooling, DHW, lighting and ventilation has been calculated. Further renewable energy resources available are the Canadian wells (EAHE) and the PV system. Finally, the energy need of nZEB LUCIA is represented as a percentage.
Figure 16 shows the energy balance per year of LUCIA nZEB.
4.3. Primary Energy Indicator
The Primary Energy Indicator sums up all delivered and exported energy (electricity, district heat and cooling, fuels) into a single indicator. It is calculated from delivered and exported energy considering a primary energy factor defined at a national level, as given by Equation (1):
where:
: Primary energy indicator (kWh/m2·y)
: Non-renewable primary energy (kWh/y)
: Delivered energy on site or nearby (kWh/y) for energy carrier
: Non-renewable primary energy factor of the delivered energy compensated by the exported energy for energy carrier , which is by default equal to the factor of the delivered energy, if not defined otherwise at a national level
: Non-renewable primary energy factor for the delivered energy carrier
: Exported energy on site or nearby (kWh/y) or energy carrier
: Useful area (m2).
The performance level of “nearly” zero energy is subject to national decision, taking into account the following: the reasonably achievable level of primary energy use, how much percentage of the primary energy is covered by renewable sources, the available financial incentives for renewable energy or energy efficiency measures, and the cost implications and level of success of the definition.
The nearly Zero Energy Building (nZEB), is defined at a national level by a technically and reasonably achievable national energy use of >0 kWh/m2 yearly, without exceeding the national limit value of non-renewable primary energy. It can thus be achieved with a combination of best practice energy efficiency measures and renewable energy technologies which may or may not be cost optimal.
Spain has not established this limit yet, but there is already a draft document for the new Spanish Building Standard, where the basis for the determination of nZEB is discussed. However, in December 2016, the Ministry of Development published a document to update the methodology to evaluate high efficient buildings. This document suggested some thresholds based on the ones defined in the Commission Recommendation (EU) 2016/1318 in July 2016 [
3].
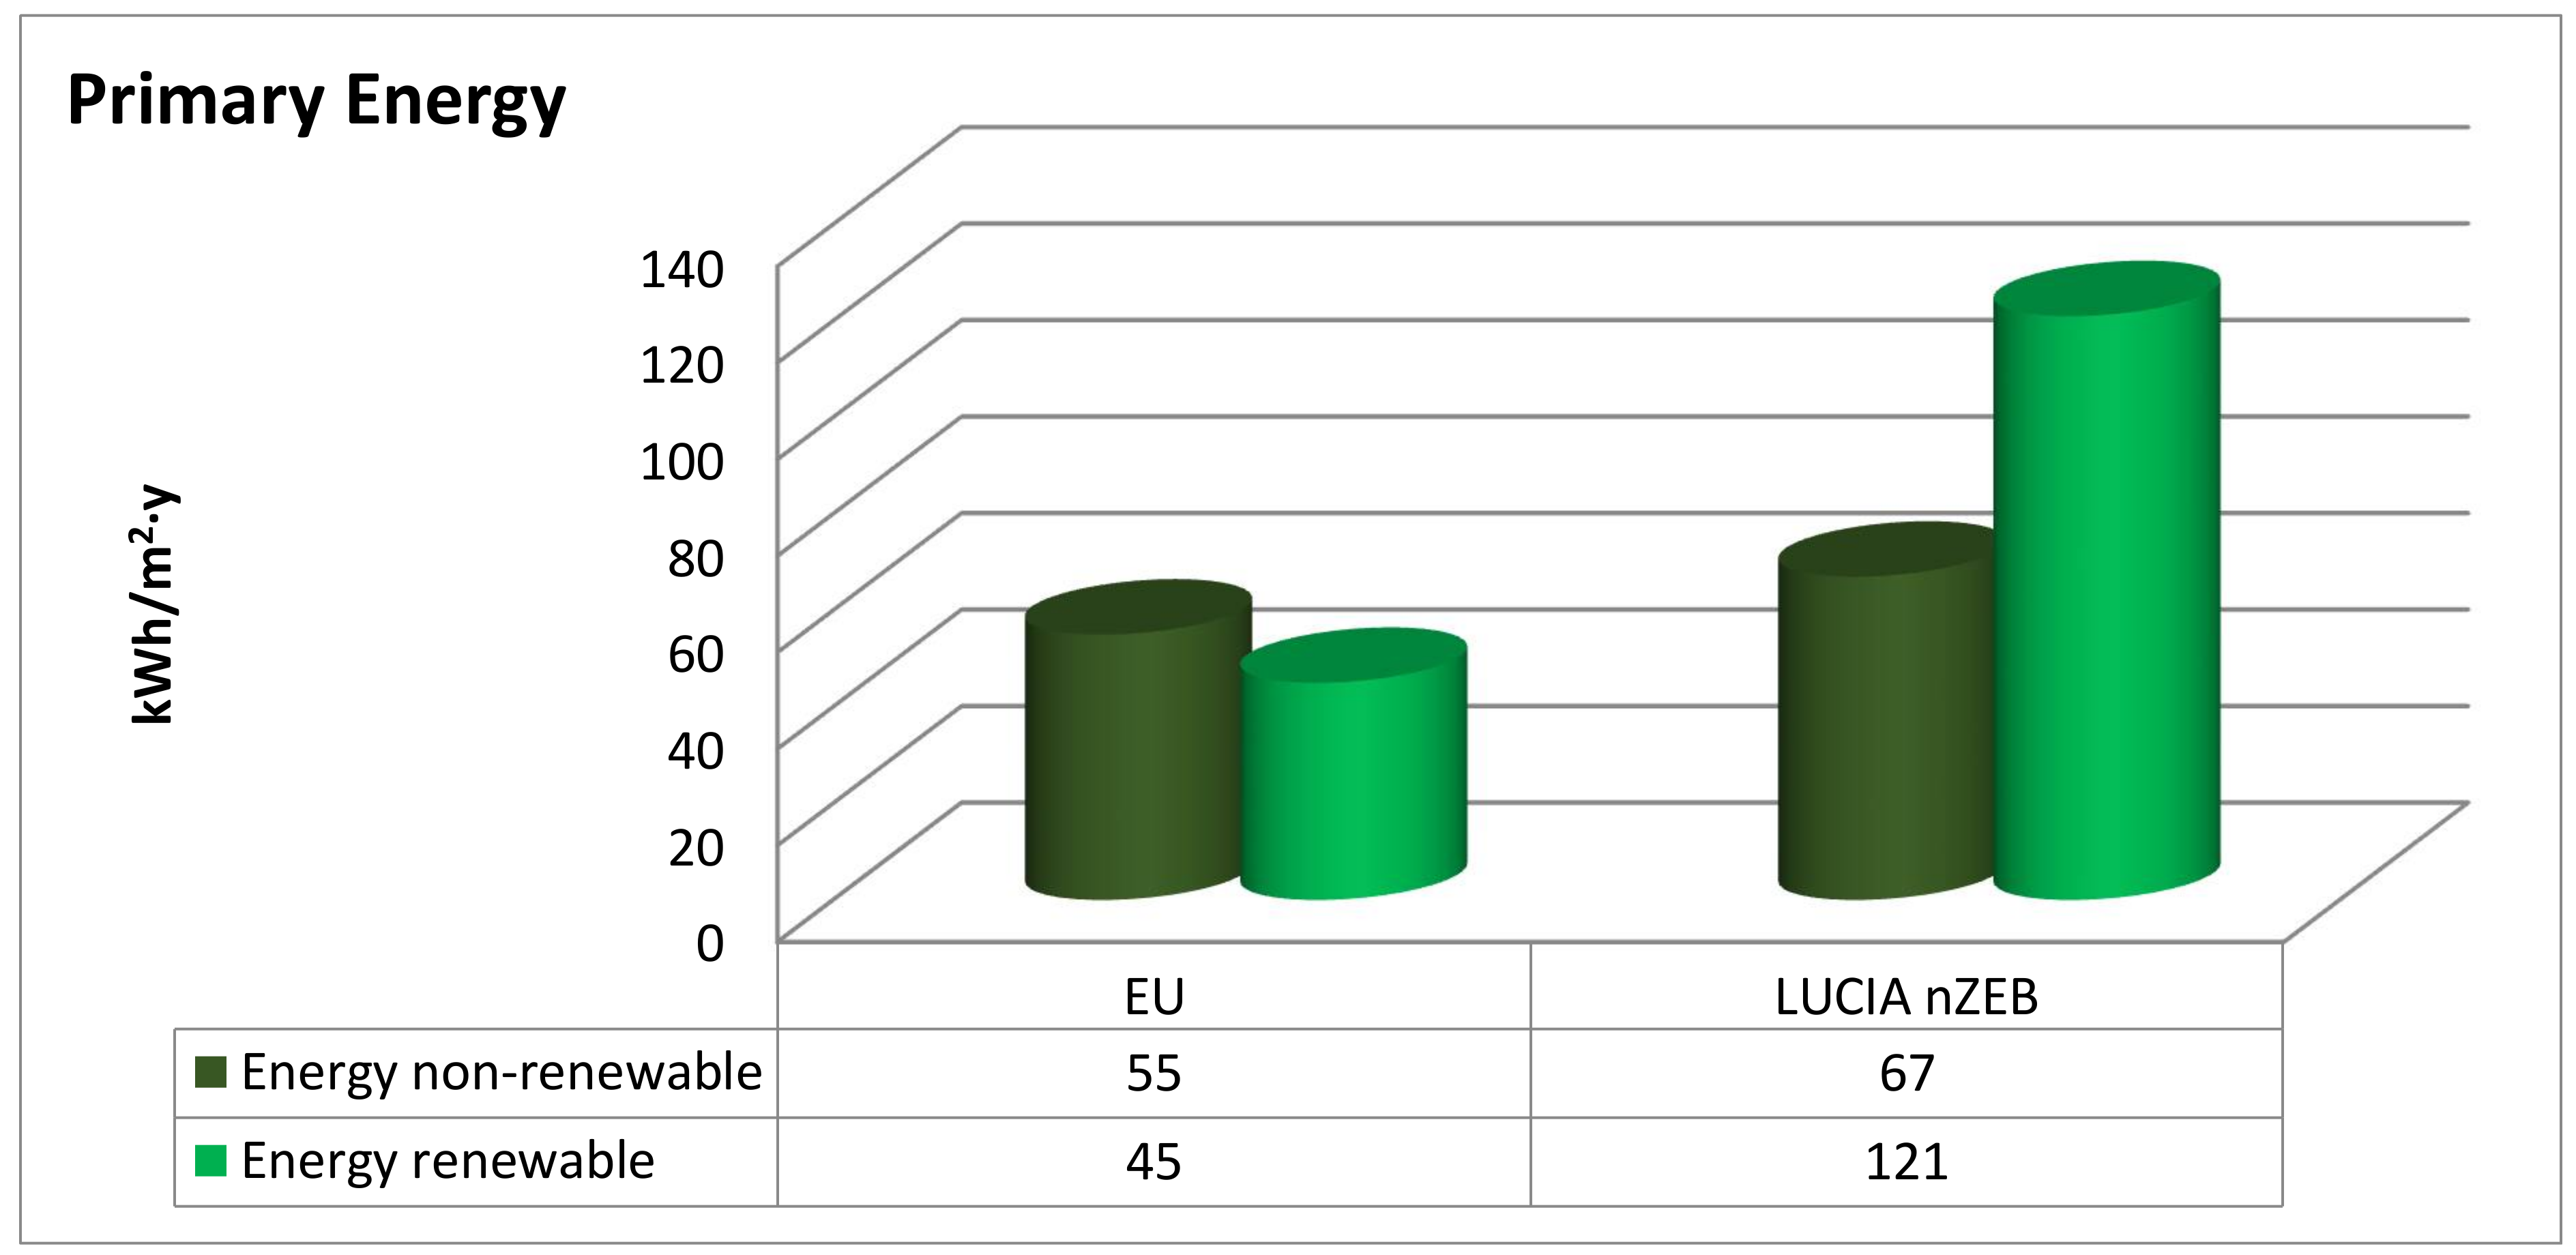
For Valladolid, characterized by a continental weather, these maximum thresholds are 85 to 100 kWh/m
2·y of total primary energy consumption for commercial and office buildings. Within this limit, the maximum threshold for the non-renewable contribution is in the range of 45 to 55 kWh/m
2·y and the renewable contribution to the primary energy should be above 45 kWh/m
2·y (
Figure 17).
To evaluate the fulfilment of the maximum thresholds for the total primary energy, the primary energy intensity is calculated for the building. The method to determine it is procedure defined in the overarching standard of the EPBD: the total primary energy is calculated as the heat by biomass consumption multiplied by its primary energy factor and the heat recovered by the EAHE, added to the multiplication of the primary energy factor for the electricity and the difference between the electricity final consumption and the PV solar production. In the case of Spain, these primary energy factors are defined in the Spanish Standard for Thermal Systems [
38].
Table 3 summarizes the primary energy factors for each energy source.
In Spain, the non-renewable conversion factor
for the electricity is currently 1.954 and 1 for biomass (
Table 3); then, for the LUCIA nZEB, where there is no energy exported yet, the primary energy indicator is:
Figure 17 shows the primary energy comparative between the European Union Directive premises and nZEB LUCIA.
This is due to the primary factors defined for Spain, which include a relatively high percentage (17%) of renewable energies from the grid. If we calculate the percentage of RES contribution to primary energy on-site for the LUCIA building, we obtain a maximum value of 120.66 kWh/m
2·y, which is almost within the range of 45% to 52% established by the Spanish Buildings Standards.
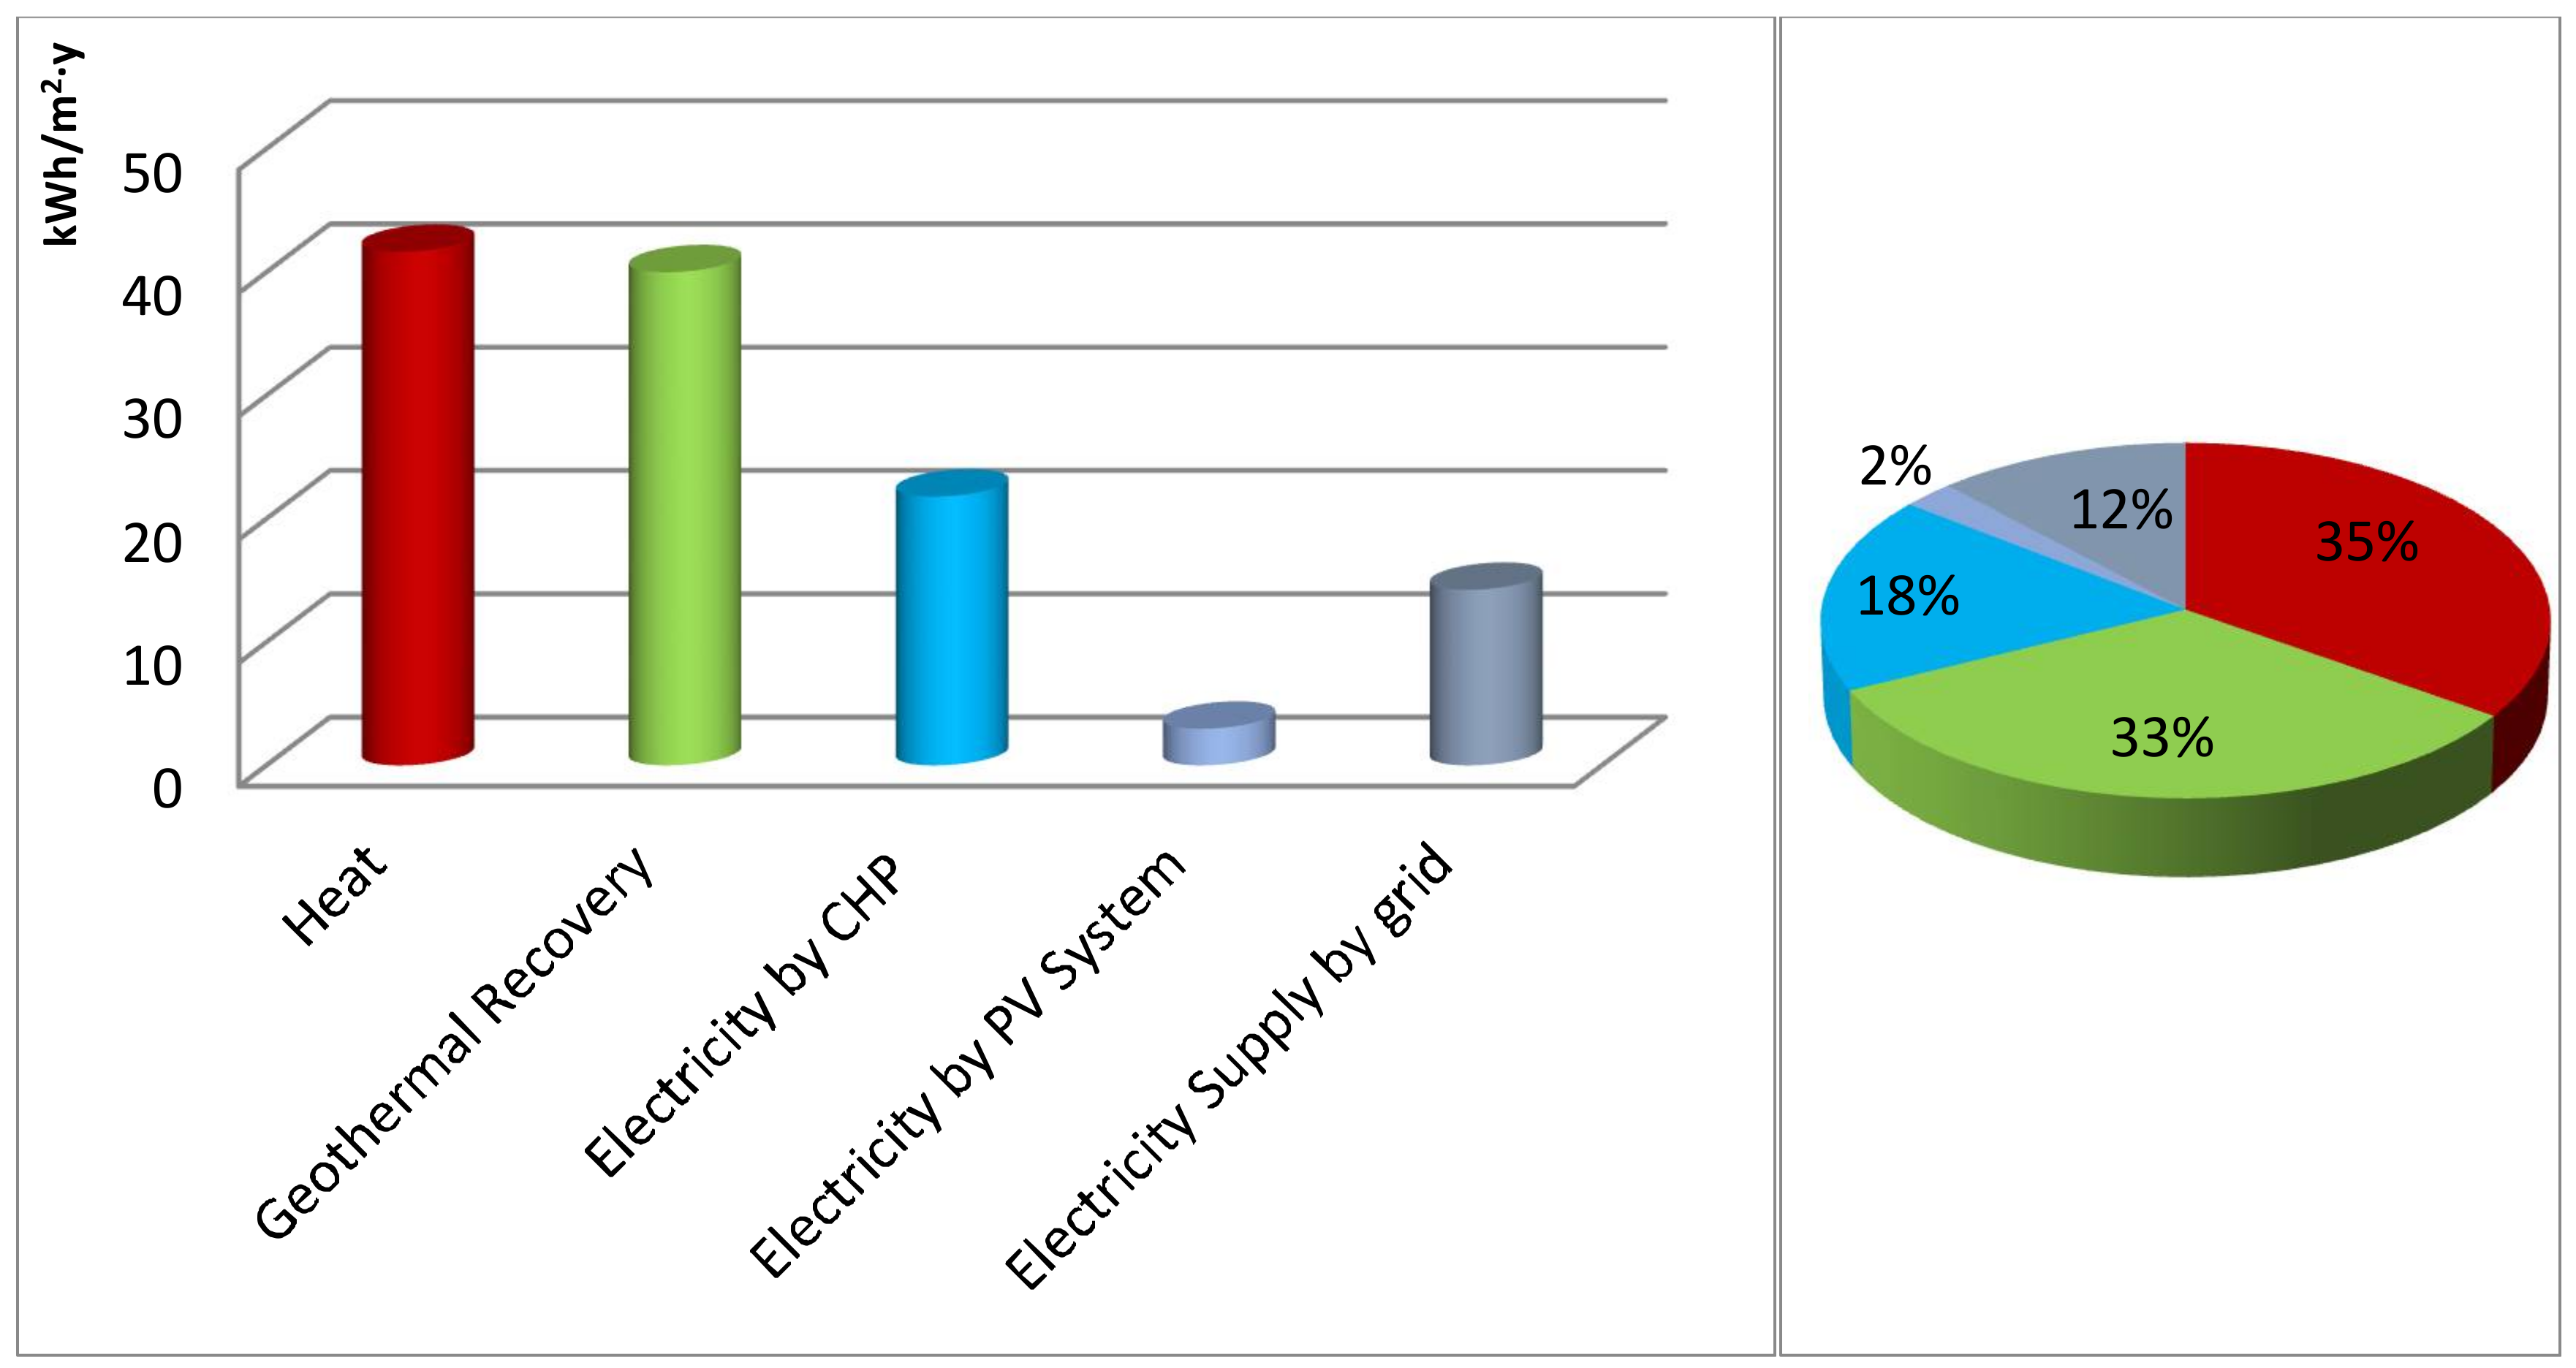
Figure 18 shows the global balance of primary renewable energy for the target building.
The set of detailed system boundaries for delivered and exported energy calculation are extended from the assessment boundary of EN15603. As stated in the EPBD recast, the positive influence of renewable energy produced on site is taken into account so that it reduces the amount of delivered energy needed and may be exported when exceeding the building demand [
3].
4.4. Renewable Energy Ratio (RERp) Calculation
In order to calculate the share of renewable energy use through the Renewable Energy Ratio (RERp), all renewable energy sources must be comprehended. A ratio is obtained between the total energy consumption of the building and the total primary energy, with the energy exported and supplied offsetting each other. These may include solar thermal, solar PV, wind and hydro-electricity, renewable energy captured from ambient heat sources by heat pumps and free cooling, renewable fuels and off site renewable energy. Ambient heat sources for heat pumps and free cooling are to be included to the renewable energy use system boundary in RERp calculation.
The renewable energy ratio is calculated relative to the whole energy use in the building, in terms of total primary energy. It is taken into account that exported energy compensates delivered energy. By default, it is considered that the exported energy compensates the grid mix or, in the case of thermal energy, the district heating or cooling network mix. For on-site and nearby renewable energy, the total primary energy factor is 1.0, whereas the non-renewable primary energy factor is 0.
Total primary energy based
RERp equation is the following (Equation (4)):
where:
: Renewable energy ratio based on the total primary energy
: Renewable energy produced on site or nearby for energy carrier , (kWh/y)
: Total primary energy factor for the delivered energy carrier
: Total primary energy factor of the delivered energy compensated by the exported energy for energy carrier
: Non-renewable primary energy factor for the delivered energy carrier
: Delivered energy on site or nearby (kWh/y) for energy carrier
: Exported energy on site or nearby (kWh/y) for energy carrier .
In order to calculate the
for the LUCIA building,
is considered for electricity and
for the biomass and the energy delivered to the building, heat and electricity, which are both renewable (as given in
Table 3).
Therefore, the third indicator, the Renewable Energy Ratio, RERp, is 0.66 for the LUCIA nZEB, a value which is estimated as a quite good result for a nZEB.
5. Conclusions
This paper describes one of the buildings at the university campus of Valladolid (Spain), called LUCIA, which is one of the best nZEB projects in the World, according to the LEED certification (98 points, second highest LEED Platinum rating worldwide). The aim of this study was to analyse the energy performance of the building through the three energy indicators defined by the EPBD in order to obtain an energy balance and compare non-renewable and renewable energies.
To carry out this analysis, a model of the LUCIA building has been simulated using DesignBuilder software version 5, using the TMY data provided by the Spanish Building Standard.
The results disagregate the use of energy as non-renewable electricity from the electricity grid, which accounts for 17% of renewable energies in Spain, and renewable energy that is delivered in situ to the building as electricity and heat through biomass cogeneration.
In order to obtain the first indicator, the energy consumption per year and m2 and the energy balance have been calculated for the HVAC system, cooling tower, ventilation, lighting, electricity production, CHP, PV system, DHW system and heat recovery. Despite the data obtained by monitoring, due to the flexible tool for analyzing individual energy processes and their contribution to the overall picture, we use the data generated by DesignBuilder V5, trying to obtain a standard balance of the values. Discrepancies between simulation and monitoring data were analysed, and they are minimal. The second and third indicators calculated are the Primary Energy Indicator and the Renewable Energy Ratio (RER). The main conclusions that derive from the analysis of these indicators are:
Dynamic simulation by Design Building V5 and obtaining the first energy consumption indicator per m2 and year, for renewable and non-renewable energies
The value of the second primary energy indicator in LUCIA nZEB, 67 kWh/m2·y, is slightly higher than that recommended by the EU, 55 kWh/m2·y. This is because this indicator is highly influenced by the national energy factors. It is thus recommended to develop a deeper analysis on this issue rather than limiting it to the calculus of this second indicator
The renewable energy generation reaches 121 kWh/m2·y, compared to the 45 kWh/m2·y recommended by the EU. Consequently, the target building goes beyond the expected performance in terms of renewable energies
The third indicator, the Renewable Energy Ratio, RERp, is 0.66. This implies that the rate of renewable energy used in the building is above the standard.
The methodology presented can be followed to assess the energy performance of further nZEB. The degree of compliance with the proposed requirements for nZEB is the overarching standard of EPBD. This methodology is applied to the LUCIA building of the University of Valladolid, a former Spanish University more than 790 years old, located in a continental climate.

 ,
, 


