Draining Water from Aircraft Fuel Using Nitrogen Enriched Air

Department of Mechanical Aerospace and Engineering, University of Strathclyde, 75 Montrose, Glasgow G11XJ, UK
*
Author to whom correspondence should be addressed.
Energies 2018, 11(4), 908; https://doi.org/10.3390/en11040908
Submission received: 2 February 2018
/
Revised: 3 April 2018
/
Accepted: 9 April 2018
/
Published: 12 April 2018
Abstract
:This paper concerns a computational study of the process of removing water from an aircraft’s fuel tank by pumping nitrogen enriched air (NEA) from the bottom of the tank. This is an important procedure for the smooth, efficient, and safe operation of the aircraft’s engine. Due to the low partial pressure of water in the pumped NEA, it absorbs water from the fuel. The water-laden bubbles enter the ullage, the empty space above the fuel, and escape into the environment. The effects of the number of NEA inlets and the NEA mass flow rate on the timescale of the NEA pumping were investigated using Computational Fluid Dynamics. The results reveal that the absorption of water by the NEA bubbles is low and is not affected by the number of the inlets used. Yet, the water content in the fuel decreases fast during the procedure, which is the desired outcome. We show that this is due to the relatively dry NEA entering the ullage and displacing the moist air, thus reducing the partial pressure of water at the fuel/ullage interface. This shift from equilibrium conditions forces water to evaporate from the fuel’s entire surface. Furthermore, the amount of water migrating from the fuel directly into the ullage is significantly greater than that absorbed by the rising bubbles. In turn, the rate of decrease of the water content in the ullage is determined by the total NEA mass flow rate and this is the dominant contributor to the draining time, with the number of NEA nozzles playing a minor role. We confirmed this by pumping NEA directly into the ullage, where we observe a significant decrease of water even when the NEA is not pumped through the fuel. We also show that doubling the mass flow rate halves the draining time. When considering the capability of most modern aircraft to pump NEA through the fuel as part of their inerting system, the proposed method for removing water is particularly attractive, requiring very little (if at all) design modification.

1. Introduction
A major consideration in the design of aircraft fuel tanks is the purity of the fuel. The first line of defence is the sumps, which are regions at the bottom of fuel tanks that collect debris and water that settles from the fuel. Sumps are drained during the on-ground routine maintenance before flights to relieve the fuel tank of any gathered contaminants. Fuel systems also contain strainers and filters that prevent large pieces of debris and finer sediment, respectively, from entering the engine.
Jet fuel can dissolve a small amount of water, which often enters the fuel tank from the ullage, which is the empty vapour space at the top of the tank. Dissolved water is not considered to be a contaminant [1], and it is vaporised during combustion [2]. However, during temperature and pressure fluctuations, the water can separate from the solution forming a water-in-fuel emulsion: small water droplets suspended in the fuel. Separated water is considered to be a contaminant [3], and it can cause a number of problems [4]. Water that is drawn into the fuel system can interrupt the smooth and efficient operation of the engines [5]. Furthermore, if the temperature drops below a threshold, the free and entrapped water will start forming ice, which can then attach onto the fuel lines and strainers introducing blockages [6]. Removing this ice often requires towing the aircraft into a warm hangar to drain the water, a procedure that is both time-consuming and costly, with additional power requirements. In addition, water also promotes the growth of bacteria, which can also block the filters [7].
Due to the relatively greater density of water, these droplets gradually move down towards the sump forming a separate layer that can easily be removed from the system, while the aircraft is grounded. However, the time of this settling process, as determined by the water and fuel density, viscosity, and size of the water droplets [8,9,10], can range from minutes to weeks [4]. Such unpredictable and possible lengthy timescales are practically unacceptable.
The main protocol for reducing the amount of water that is entering the fuel is to refuel the aircraft as soon as possible after each flight [5]. This reduces the size of the ullage, and, therefore, the amount of water vapour that can be dissolved into the fuel. This method, however, is unreliable, as the fuel can also get contaminated with water during production and transport [4].
Methods for speeding up the settling of water droplets include the use of demulsifiers that can be used to promote the coalescence of the water droplets [11]. As the size of the droplets increases, the emulsion becomes unstable and it breaks down into free water. While such methods are acceptable for crude oils, demulsifier-added fuel does not conform to the standards of the aviation industry. Instead, recent studies have proposed the use of non-polluting, hydrophilic materials, such as polymers and natural resins, to absorb and rid the fuel tank of water [12,13,14]. However, further research is required prior to using the above methods to fuel tanks.
The present study concerns a computational fluid dynamics (CFD) investigation of an alternative method for draining dissolved water from jet fuel (Figure 1). The method involves pumping nitrogen enriched air (NEA) through the fuel tank [15]. The idea is that, due to the absence of water in the NEA bubbles (i.e., low partial pressure of water), they will absorb water from the fuel tank. The bubbles will then enter the ullage and will exit the system through the ventilation system removing the water from the fuel tank. The proposed method is particularly attractive considering that most modern aircraft are already capable of pumping NEA through the fuel as part of their inerting system [16,17,18,19]. The overall aim of the present study is to optimise the draining process so that it completely removes water from the fuel in under fifteen minutes, approximately the time needed to refuel an aircraft.
2. Methodology
2.1. Governing Multiphase Equations
The NEA procedure involves multiphase fuel/air flows; hence, the governing equations and fundamental models that are used in this study are briefly discussed in this section.
Multiphase models can be grouped into two general categories: interface tracking and dispersed models. Interface tracking methods resolve individual phases, which exclusively occupy separate regions in the domain, thus forming distinct interfaces between the phases. While interface tracking methods are relatively accurate, keeping track of every interface can be computationally demanding, particularly if the physical problem involves a uniformly dispersed emulsion, where a large number of interfaces must be tracked. Dispersed multiphase models do not track the interface. Instead, they track the volume fraction of each phase reducing the computational expense.
This study does not investigate the topological details of each phase, but mainly the averaged quantities, such as the volume fraction of water in fuel. Similarly to previous studies concerning fuel/vapour interactions [20,21], the Eulerian–Eulerian method, which treats phases as interpenetrating continua, has been employed. The computations have been carried out using the open-source CFD library OpenFOAM 5.0. A brief description of the method is given below.
For a phase labelled q, the mass equation is given by [22,23]:
where is the volume fraction; is the density; the velocity; and is the rate of mass transfer between phase , for which the equation is solved, and the rest of the phases, labelled . The sum of the volume fractions of all phases must equal to one.
The momentum equation is given by:
where is the stress tensor, and it is calculated under the assumption that both phases are Newtonian. The dynamic viscosity for air and fuel is and , respectively. Furthermore, is the gravitational acceleration; are forces due to lift; is the inertial force due to the virtual mass of the phase , which is set as 0.5; and, is a single pressure field, which is shared amongst all of the phases. is a force between phases responsible for the exchange of momentum between them (see Section 2.4).
The energy equation for each phase is given by:
where is the heat flux, is the intensity of heat exchange between phases and (see Section 2.5); and, is the enthalpy of mixing. The operation is the dyadic product between the tensors and .
The present simulations contain various species, i.e., the different constituents that make up each phase, which advect along with their corresponding phase, but diffuse based on any concentration gradients within the phase. The species transport equation is given by:
where is the mass fraction of species in phase ; is the mass flux due to diffusion, as given by Fick’s law; and, is the mass transfer of the species in phase to the species in phase . Here, we model the interphase species mass transfer using Henry’s law (see Equation (6)).
A forward Euler scheme was used to advance the numerical solution in time. The fluxed were discretised by a second-order upwind scheme in conjunction with the van Leer limiter.
2.2. Droplet Dynamics
Although dispersed methods, such as the Eulerian–Eulerian multiphase method, do not resolve the interface between the two phases, they still assume that the dispersed phase forms bubbles at sub-grid scales. These bubbles, whose size affects the dynamics of the system, are explicitly modelled. In the present case, where the vapour is dispersed in the liquid phase, we assume that the vapour forms spherical bubbles that expand isothermally with pressure. This expansion is based on a bubble diameter corresponding to a reference value of the pressure . The diameter is then given by:
When the liquid is dispersed in the air, we assume droplets of a constant diameter equal to . Variable-sized bubbles can be described by a probability distribution function [23,24]. However, in the present case, the liquid is almost never dispersed in the vapour (with the exception of the very occasional splashing), hence, assuming that the bubble size remains the same is not expected to affect the calculation of integral quantities in the flow.
2.3. Mass Exchange
In the present multiphase system, mass exchange between phases occurs through the dissolution of species into and out of each phase. The rate of mass transfer, , of the species in the dispersed phase to the species in the bulk phase , is given by:
where is a mass exchange coefficient; is the interfacial area between the two phases; is the mass concentration of species in phase ; and, , is the mass concentration of species in phase q, in which the system remains in equilibrium.
For the calculation of the equilibrium mass concentration, the Henry’s law is used:
where is the dimensionless Henry’s constant that describes the solubility of the dispersed phase in the primary phase for a certain temperature and pressure. For the solubility of water in decane, . The relatively low value reflects the low solubility of water in jet fuel.
Note that Henry’s law is an empirical model, which is particularly accurate at small concentrations. Should the focus of the investigation be the solvent, then the Raoult’s law would be more appropriate [25].
Finally, the mass exchange coefficient is given by:
2.4. Momentum Exchange
As it was mentioned in Section 2.1, phases interact with each other through an interphase force, given by:
where is the interphase momentum exchange coefficient. Assuming that the dispersed phase, e.g., gas in liquid, forms droplets or bubbles inside the main fluid, is given by:
where is a drag function and is the relaxation time, defined as:
and:
is the Reynolds number; and is a drag coefficient. A number of different drag coefficients have been proposed [26]; in the present study, the Schiller and Naumann drag coefficient was employed [27]:
The Reynolds number, Re, for a phase , dispersed in a phase , is given by:
2.5. Heat Exchange
The heat transfer between two phases is given by:
where is the heat transfer coefficient defined as:
and is the Nusselt number defined according to Ranz and Marshall [28]:
where is the Prandtl number that takes values 0.7 and 2 for the gas and liquid, respectively.
2.6. Computational Domain
The fuel tank of an aircraft is an array of interconnected bays that is maintained at atmospheric pressure through a valve. To understand the basic physical processes without the loss of generality, a single, rectangular bay has been modelled. The dimensions of the bay in the x, y, and z directions are , , and , respectively (Figure 2). The tank is filled with fuel up to a height of (red colour in Figure 2), occupying a volume of . The remaining part of the tank, the ullage, is filled with air (blue colour in Figure 2).
A pressure valve is located at the right-hand side plane, which is used to regulate the ullage to atmospheric pressure (black colour in Figure 2). The NEA is pumped from inlets that are located at the bottom plane. Two main cases are considered: one with a single inlet and one with four inlets (see two bottom planes in Figure 2). The single inlet is located at the middle of the plane. The four inlets are arranged equally spaced along a line in the x-direction. The two cases are discussed in more detail in Section 2.8.
To reduce the grid-related uncertainty, we carried out the simulations on three different grids and the details are provided in Section 2.9.
2.7. Initial and Boundary Conditions
At the beginning of the simulation, the volume fraction of fuel, is:
and the volume fraction of the air, , is:
forming the distinct regions of the fuel and ullage.
The fuel is modelled as an incompressible fluid with a density of , while the air is modelled as a compressible fluid, treated thermodynamically as an ideal gas, with an initial density of . The pressure is initialised as at the top of the tank and it is hydrostatically adjusted. The initial velocity field is uniformly set to zero.
The mass fractions of the fuel, air and NEA are given in Table 1. The fuel is modelled as a solution primarily containing decane, with traces of oxygen, nitrogen, and water. The air in the ullage contains oxygen, nitrogen, and it is saturated with water. The inflowing NEA is also air, i.e., we use the exact same phase as the air in the ullage, but it is completely dry, containing a 5% of combustible oxygen.
The no-slip boundary condition was applied on the fuel tank’s walls. The gradient of pressure, volume fraction of phases, and the mass fraction of species on the walls were set equal to zero.
2.8. NEA Inlets
The inlets are modelled as squares of side length 0.0254 m. The number of NEA inlets is a parameter of interest to this investigation, since increasing the number of bubble columns increases the NEA surface area that is in contact with the fuel. Since the migration of water between two phases occurs at their interface, we initially assumed that increasing the number of inlets would reduce the draining time.
Two sets of cases were considered (see also Figure 2): one with a single inlet located at the center of the bottom plane of the fuel tank, and one with four inlets with their nozzles being aligned along the x-direction. The mass flow rate was retained the same at for both cases. The inlet velocity was set to 0.5 m/s for the single inlet and 0.125 m/s for the four inlets. The simulations have been performed in the framework of implicit large eddy simulations [29], thus no turbulence model has been used. The simulations are considered to be under-resolved with respect to small scales; however, further investigation of the effects of small scales on the present results is required. This is a subject to future work.
The four inlets are placed in-line relatively away from the walls of the tank aiming to facilitate flow circulation. Note that the inlets position can alter the flow circulation and different inlet configurations can result in different draining times. The aim of this paper is not to find the optimum inlets configuration; yet, some discussion with regards to this point is provided in Section 3 and Section 4.
Two different mass flow rates were investigated for the single inlet case: (as per above) and .
2.9. Grid Convergence
Computations were performed using three grids, , , and , where the grid was refined by a factor of two in each direction. The root mean square (RMS) error of mass fraction with respect to the solution on the fine grid is presented in Table 2. The analysis was carried out for the case with the higher mass flow rate, i.e., .
The best balance between accuracy and computational cost is achieved by the grid .
2.10. Validation
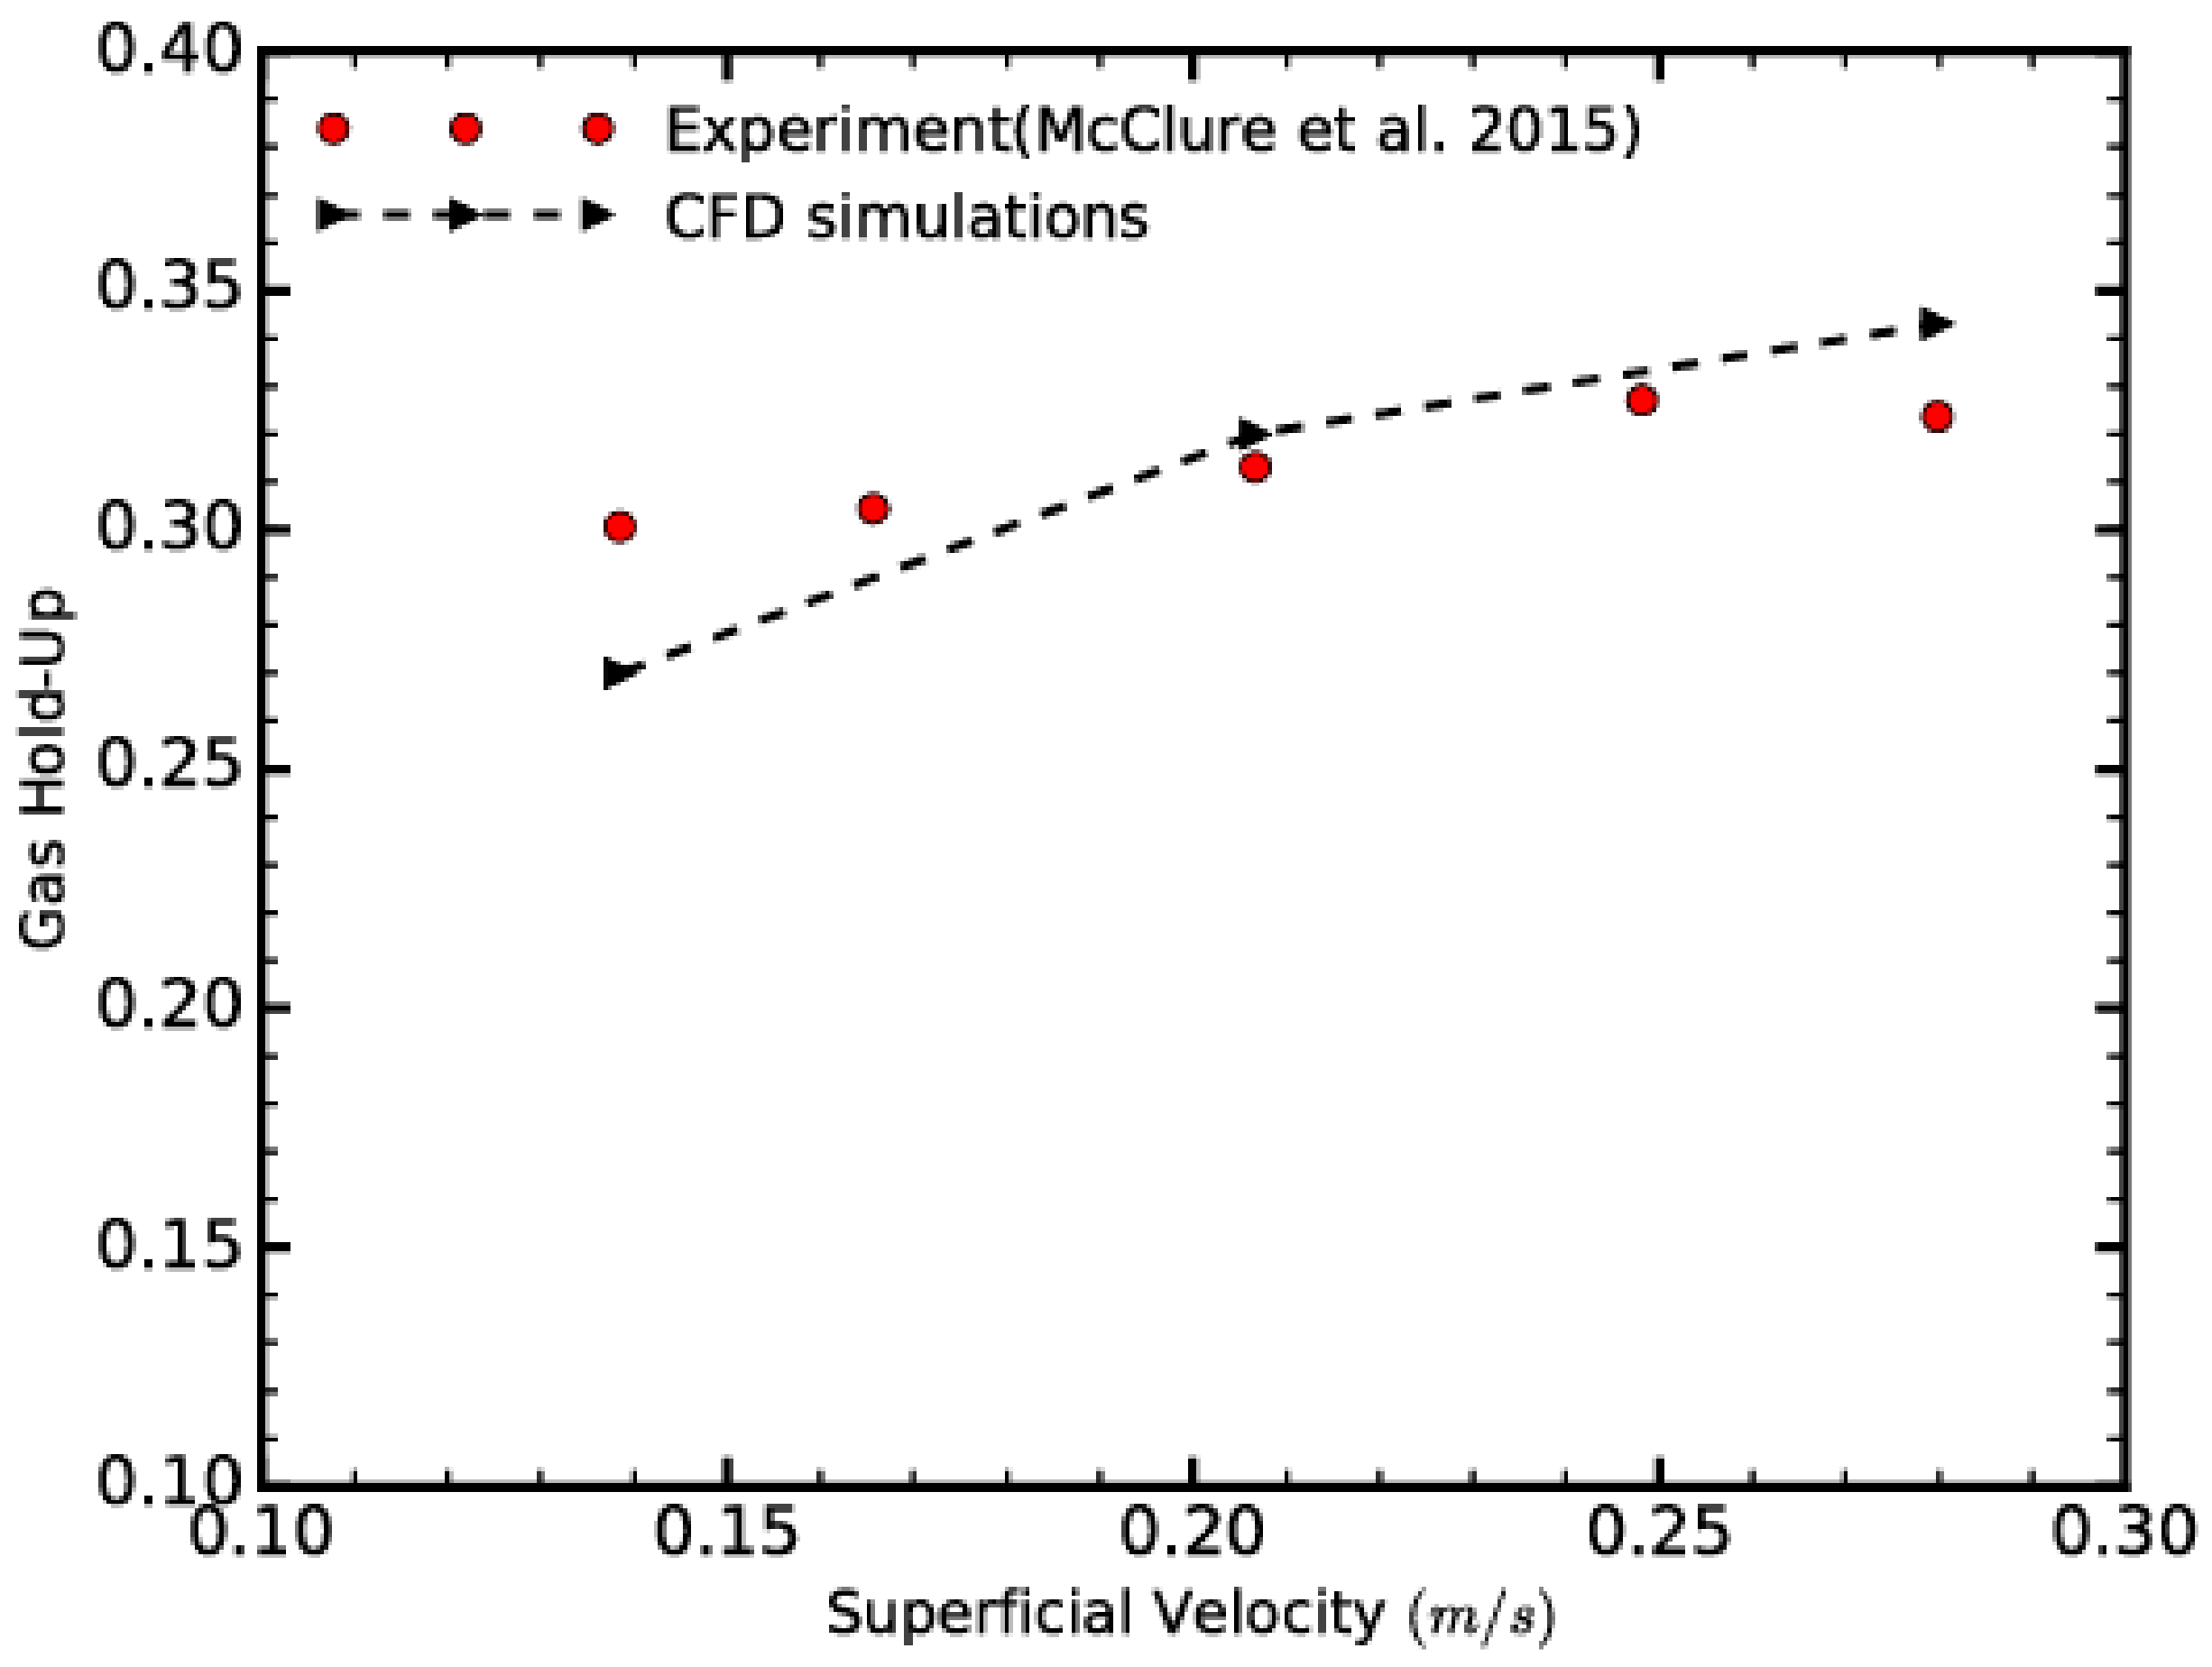
To the best of the authors’ knowledge, there is no published experimental or computational data for the process in question. Therefore, an experiment of air being pumped through water in a bubble column was considered to be a validation case [30]. The experiment was modeled and simulated for the time of 120 s, and the numerical and experimental results for the gas hold-up in the water were compared (Figure 3). The numerical error is within 10% error of the experimental results.
3. Results
The water vapour that is absorbed by the rising NEA is shown in Figure 4 for the different inlet cases. As time progresses, we observe a lower concentration of water vapour in the NEA, thus the total concentration of water in the fuel is reduced. On average, the amount of water absorbed by each column is the same.
Note that, similar to the air in the ullage, the NEA bubbles should be able to absorb approximately 2.8 wt % water vapour. This is approximately three orders of magnitude greater than the mass fraction that was observed in the rising NEA of both the single inlet and four inlet cases. Therefore, the rising bubbles are far from being saturated with water.
The circulation of the water in the fuel is due to advection and diffusion effects. As the NEA removes water, regions of low water concentration are formed around the bubble columns. This concentration gradient forces water to move towards the column to uniformly spread its mass across the volume. The case with four inlets offers an advantage over the single inlet, as water in the fuel has to migrate over shorter distances to reach one of the four columns.
Dissolved water advects with the fuel. Therefore, information on the fuel circulation provides information on how the water is mixed across the fuel tank. Figure 5 and Figure 6 show the formation of large circulation regions with the vortices being tangent to the NEA columns, and a vorticity that is normal to the y-axis. As the flow process further develops, the vortices become more disordered.
Due to the higher velocity at the inlet in the single-inlet case, the fuel also has a higher velocity that is close to the rising bubbles when compared to the four-inlet case. However, away from the centre of the tank, the velocity quickly diminishes (Figure 5). In the four-inlet case, the flow velocity is more consistent across the tank (Figure 6).
To further investigate the fuel circulation, we consider the contour lines of the z-component of vorticity on two xy planes in the middle (z = 0.45 m) and back (z = 0.05 m) of the tank (Figure 7). As with the velocity profiles, the slice at the center shows that the vorticity in the single inlet case is high only next to the bubble column, while the vorticity in the four-inlet case is consistently high across a much larger part of the plane. Further away from the bubble columns, the vorticity is generally reduced, and the two cases behave similarly.
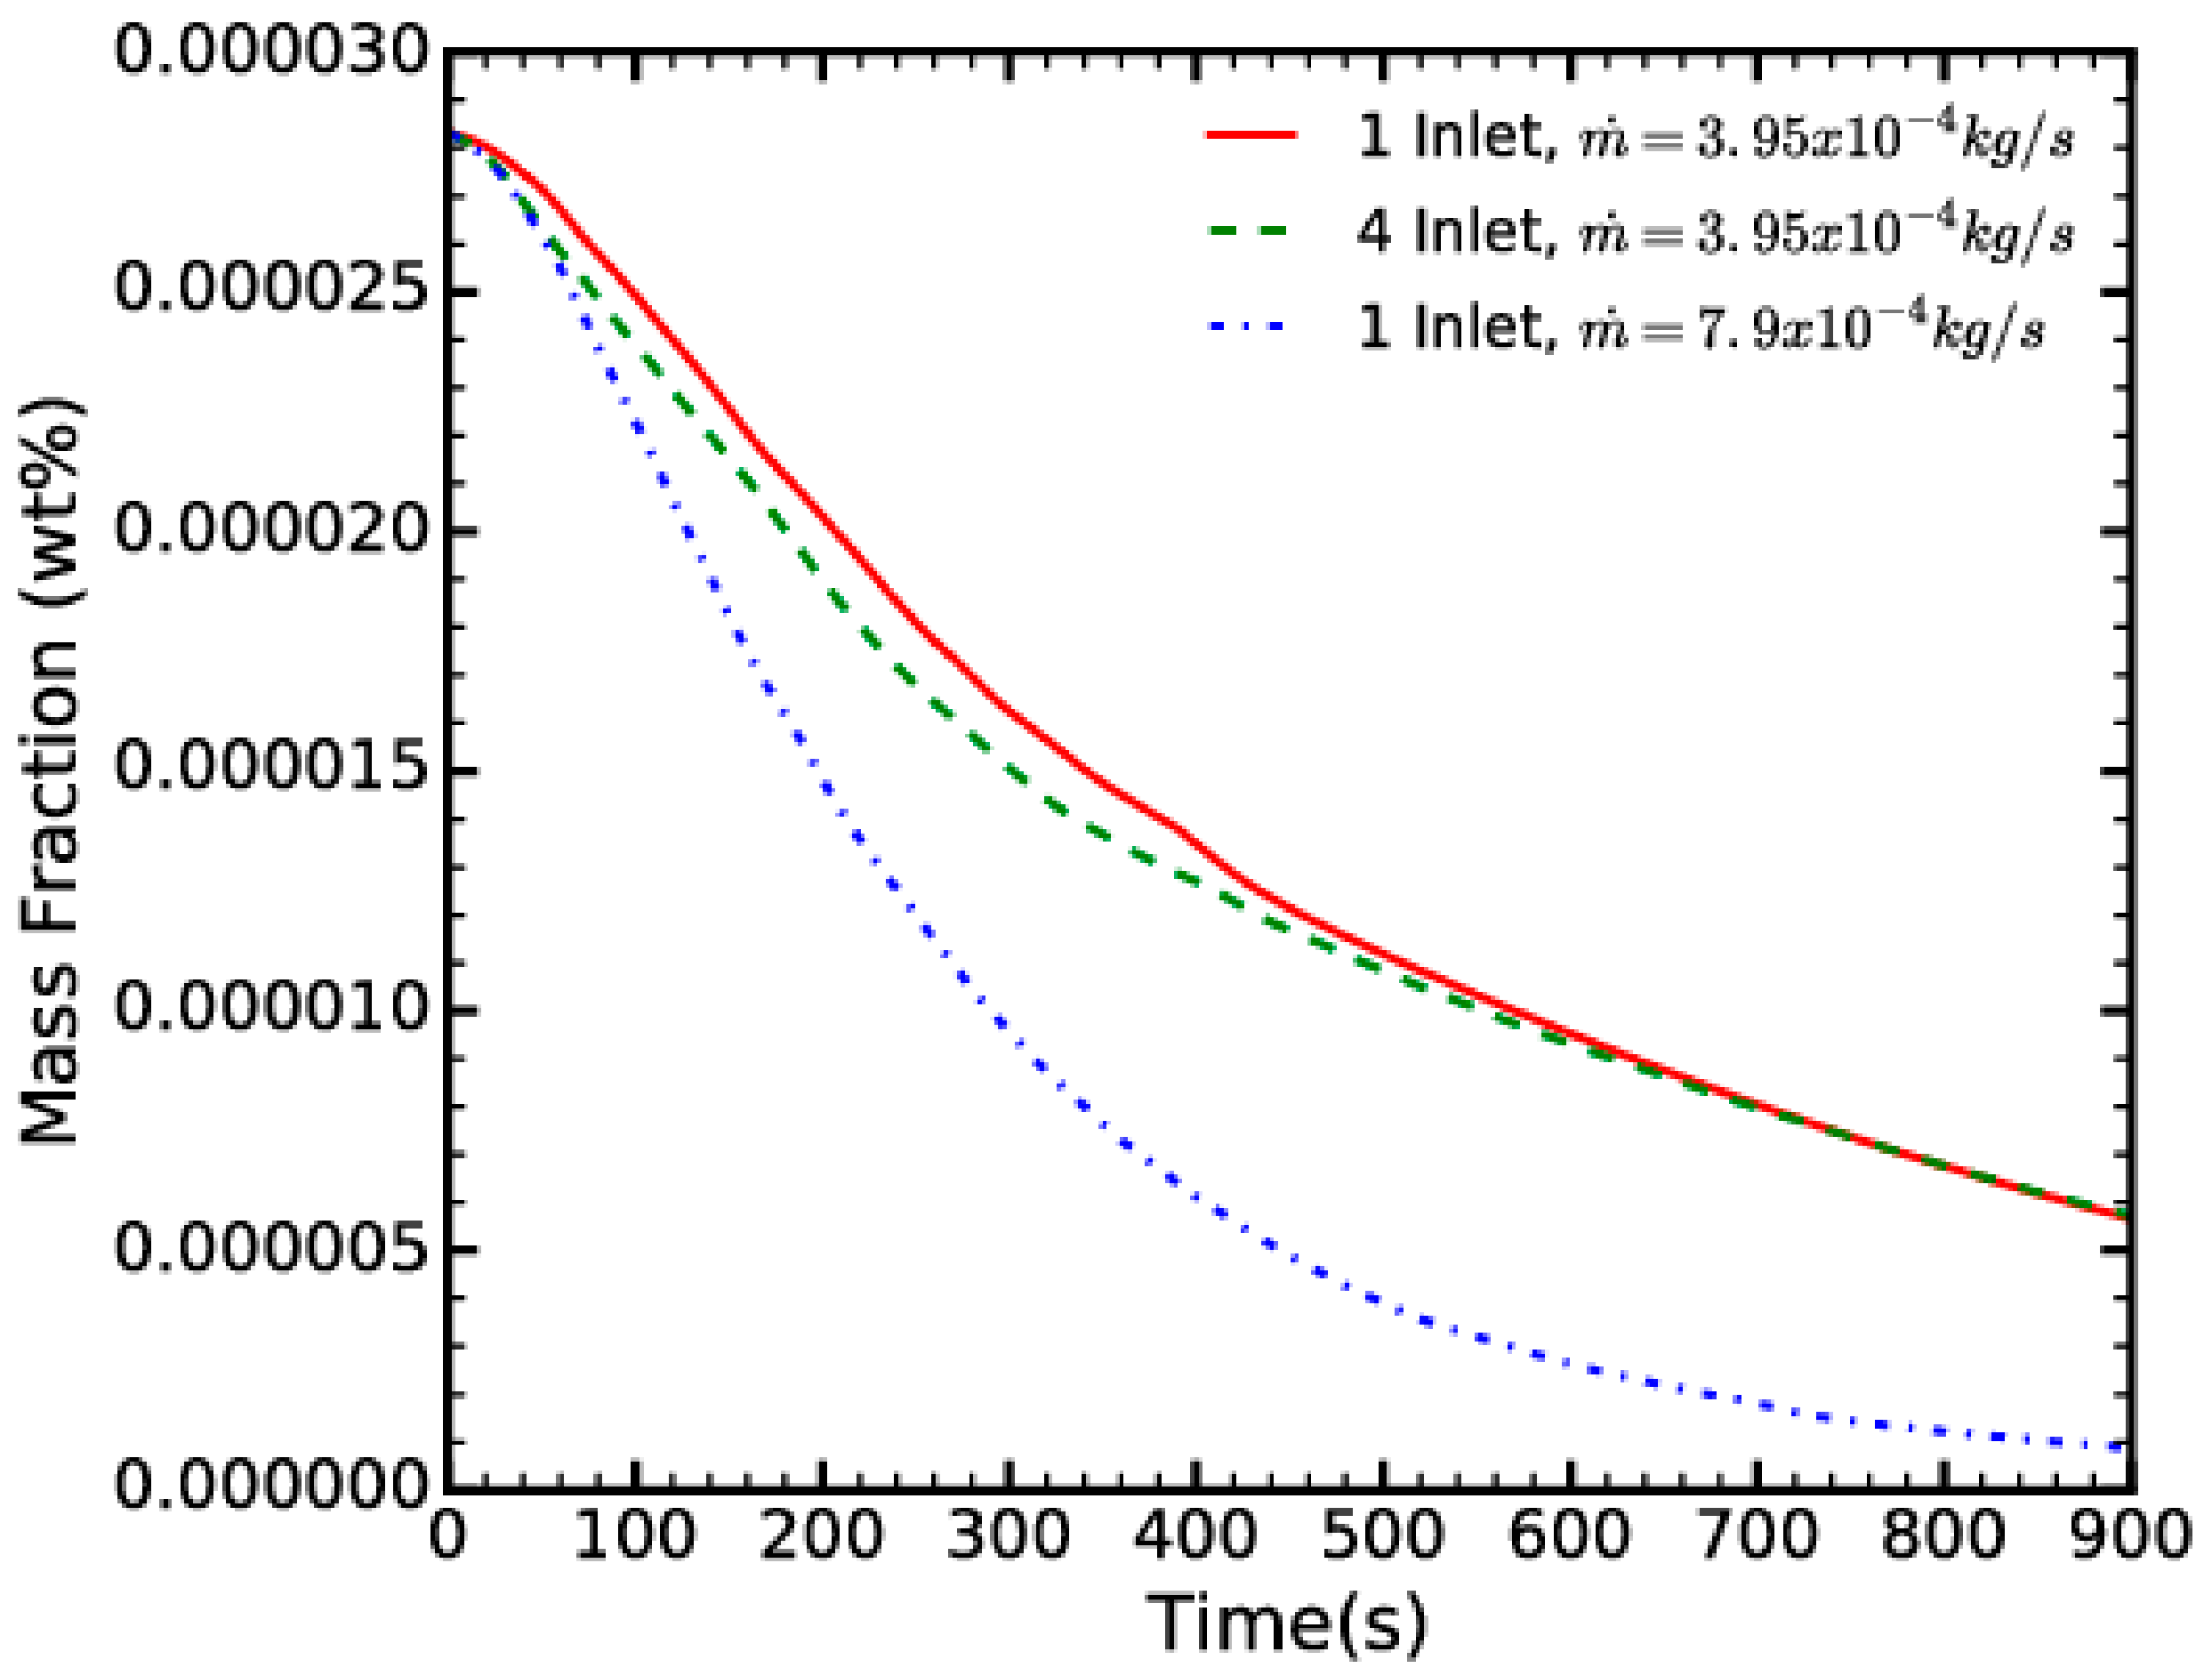
To quantitatively evaluate the effects of the single and four inlets in draining the fuel, the time evolution of the concentration of dissolved water in the fuel was examined (Figure 8). The rate of decrease of the four-inlet case is marginally greater during the first 400 s, and the results for the two curves are similar after 600 s, and eventually converge to the same value 0.0005 wt %, at 900 s.
The overall similar performance of the two cases is explained below. Firstly, we note that the concentration of water vapour in the ullage also decreases (Figure 9). This is due to the relatively dry NEA bubbles that are entering the ullage, and displacing the moist air out of the tank. As the concentration, and, therefore, the partial pressure of water in the ullage decreases, water evaporates from the entire surface of the fuel. This evaporation directly into the ullage is more efficient than the absorption of water by the ascending NEA bubbles, thus making it the major contributor to the dehydration of the fuel. Furthermore, the rate of decrease of water vapour in the ullage does not depend on the number of inlets, but only on the total mass flow rate.
To verify our theory, we have also used ullage washing, where the NEA enters the fuel tank directly into the ullage (Figure 8). The water content in the fuel still decreased significantly, without the gas traversing through the liquid at all. After 900 s, ullage washing reduced the dissolved water by approximately 15% less than when we pump NEA from the bottom of the fuel tank. We attribute this difference to the circulation, initiated by the flow of NEA through the fuel, which speeds up the migration of water to the fuel surface.
The results of Figure 10 provide a visual confirmation. The concentration of water in the ullage is reduced in time. This decrease is particularly evident in the region of the inlets, where the NEA enters the ullage. Had the rising NEA bubbles saturate with water, as initially expected, the mass of water vapour in the ullage would have remained unchanged. An arbitrarily chosen slice near the back of the fuel tank also shows a reduction of water vapour in the ullage, albeit slightly less than the decrease of the central slice.
The change of water concentration in the ullage away from equilibrium should be mitigated by the migration of water from the fuel into the ullage. This process can be qualitatively observed by the lowering of water mass directly under the fuel/ullage interface; this is true for both the central and rear slices, and for both a single inlet and four inlets.
Initially, the fuel in the four-inlet case has slightly less water at equivalent times (compare left and right columns in Figure 10). This observation is in agreement with Figure 8. We speculate that the initially greater decrease of water occurring in the four-inlet case is due to the NEA entering the ullage over a greater surface area, thus lowering the concentration at a greater portion at the fuel/ullage interface. In the single-inlet, the NEA from the column that is reaching the top needs some time to expand across an equivalent area. Since the migration of water between the phases occurs at the interface, the four inlets will offer an advantage. As the water concentration in the fuel is reduced, so does the concentration difference between the ullage and fuel, and the mass flux of water at the interface. As a result, the spreading time of the NEA in the ullage in the single-inlet case becomes increasingly insignificant.
The fact that evaporation occurs from the entire fuel surface has an important consequence: the most important factor in draining the fuel of dissolved water is the total NEA mass flow. If the rising NEA absorbs more water, then the water concentration in the ullage will not decrease quickly and less water will cross the fuel/ullage interface. A lower absorption of water in the rising NEA bubbles will be compensated by the greater evaporation across the fuel/ullage interface.
To investigate how the draining time correlates to the mass flow rate, a case of a single inlet and a mass flow rate of , i.e., twice the value of the preceding cases, was investigated. The vorticity that is close to the inlet is much greater than the equivalent case with half the mass flow rate (Figure 11). Yet the vorticity further back is relatively similar to both other cases. Increasing the mass flow rate by a factor of two reduced the draining time by approximately half, i.e., the higher mass flow rate required over 400 s to remove the same amount of water that the lower mass flow rate removed in 900 s (Figure 12).
Here, we have only considered the removal of dissolved water, and not the water-in-fuel emulsions. However, pumping NEA through the fuel after refueling can remove water from the solution, which could otherwise form emulsions. We also believe that this method should be able to remove or break down emulsions. The circulation of the fuel that is caused by the NEA should mix and dissolve the bubbles into the fuel and the draining process would continue as per our results. Yet, as we have shown, the number of inlets influences the fuel circulation. Thus, we speculate that the above the number of inlets will have a pronounced effect on removing emulsions. The position of the inlets also affects the flow field [31], and therefore the efficiency of this method in draining water.
It would also be interesting to investigate if the NEA can remove contaminants that have settled at the bottom of the tank. In theory, this should be possible, as the NEA would eventually mix the settled contaminants back into the fuel. We speculate, however, that this would happen at larger timescales and it would also depend on the number and position of the inlets. Note that settled contaminants are not a problem, however, as they can easily be removed during routine on-ground maintenance.
Overall, pumping NEA through the fuel seems to be an effective way to dehydrate fuel. The availability of NEA pumps as part of the inerting system of modern aircraft makes this approach particularly attractive, as no major design modifications are required. While this investigation revolved around pumping NEA on-ground, the process can be performed at any point during the operation of the aircraft.
4. Conclusions
A multiphase CFD model was employed to investigate the pumping of NEA to dehydrate an aircraft’s fuel. The main conclusions from this paper are drawn below:
- (1)
- The rising NEA bubbles absorb a small amount of water from the fuel and remain relatively dry compared to the moist air in the ullage. Therefore, when the NEA enters the ullage it decreases its water content.
- (2)
- Water is released from the fuel’s entire surface, due to the low partial pressure of water in the ullage. The mass of water exchanged directly between the fuel and ullage is much higher than the water that is absorbed by the rising NEA bubbles.
- (3)
- For a constant mass flow rate, the number of NEA inlets does not significantly affect the timescale of the process.
- (4)
- The main contributor to the dehydration of the fuel is the total mass flow rate: increasing the mass flow rate by a factor of two, i.e., halving the time for NEA pumping.
- (5)
- Removing the dissolved water reduces the formation of water-in-fuel emulsions. We also speculate that entrained water bubbles will be mixed and dissolved in the fuel due to the circulation that is caused by the flow of NEA. Thus, the pumping of NEA will also be able to remove the separated water. Since fuel circulation depends on the number and the position of the inlets, these would be important factors to consider when dealing with emulsions.
Most modern aircraft have NEA-pumping capabilities as part of their inerting system. Therefore, the method that is investigated in this paper can be considered as an inexpensive, safe, and easily tested approach for draining water from the fuel tank.
Author Contributions
Michael Frank and Dimitris Drikakis prepared the CFD model, ran the simulations, post processed the results and prepared the manuscript.
Conflicts of Interest
The authors declare no conflict of interest.
References
- Edwards, T.; Stricker, J.; Harrison, W., III. Coordinating Support of Fuels and Lubricant Research and Development (R&D) 2; Coordinating Research Council, Inc.: Alpharetta, GA, USA, 2004. [Google Scholar]
- Hemighaus, G.; Boval, T.; Bacha, J.; Barnes, F.; Franklin, M.; Gibbs, L.; Hogue, N.; Jones, J.; Lesnini, D.; Lind, J. Aviation Fuels Technical Review; Chevron Corporation: San Ramon, CA, USA, 2006. [Google Scholar]
- Goodger, E. Transport Fuels and Technology-Mobility for the Millennium; Landfill Press: Norwich, UK, 2000. [Google Scholar]
- Baena-Zambrana, S.; Repetto, S.; Lawson, C.P.; Lam, J.-W. Behaviour of water in jet fuel—A literature review. Prog. Aerosp. Sci. 2013, 60, 35–44. [Google Scholar] [CrossRef] [Green Version]
- Federal Aviation Administration, United States Department of Transportation. Aviation Maintenance Technician Handbook-Airframe; United States Department of Transportation: Washington, DC, USA, 2012.
- Sleight, P.; Carter, R. Report on the Accident to BOEING 777-236ER, G-YMMM, at LONDON Heathrow Airport on 17 January 2008; Air Accidents Investigation Branch: Aldershot, UK, 2010. [Google Scholar]
- Tsanaktsidis, C.G.; Christidis, S.G.; Favvas, E.P. A novel method for improving the physicochemical properties of diesel and jet fuel using polyaspartate polymer additives. Fuel 2013, 104, 155–162. [Google Scholar] [CrossRef]
- Krawczyk, M.A.; Wasan, D.T.; Shetty, C. Chemical demulsification of petroleum emulsions using oil-soluble demulsifiers. Ind. Eng. Chem. Res. 1991, 30, 367–375. [Google Scholar] [CrossRef]
- Smith, M. Aviation Fuels; G. T. Foulis & Co Ltd., Henley-on-Thames: Oxfordshire, UK, 1970. [Google Scholar]
- Bitten, J.F. Coalescence of water droplets on single fibers. J. Colloid Interface Sci. 1970, 33, 265–271. [Google Scholar] [CrossRef]
- Matar, S.; Hatch, L.F. Chemistry of Petrochemical Processes; Gulf Professional Publishing: Houston, TX, USA, 2001. [Google Scholar]
- Tsanaktsidis, C.; Christidis, S.; Tzilantonis, G. Use of bioorganic compounds for reducing the moisture content of diesel fuel to reduce the icing effect. Chem. Technol. Fuels Oils 2010, 46, 211–212. [Google Scholar] [CrossRef]
- Tsanaktsidis, C.G.; Favvas, E.P.; Scaltsoyiannes, A.A.; Christidis, S.G.; Katsidi, E.X.; Scaltsoyiannes, A.V. Natural resins and their application in antifouling fuel technology: Part I: Improving the physicochemical properties of diesel fuel using natural resin polymer as a removable additive. Fuel Process. Technol. 2013, 114, 135–143. [Google Scholar] [CrossRef]
- Tsanaktsidis, C.G.; Favvas, E.P.; Tzilantonis, G.T.; Christidis, S.G.; Katsidi, E.C.; Scaltsoyiannes, A.V. Water removal from biodiesel/diesel blends and jet fuel using natural resin as dehydration agent. Can. J. Chem. Eng. 2015, 93, 1812–1818. [Google Scholar] [CrossRef]
- Terada, Y.; Lawson, C.P.; Shahneh, A.Z. Analytical investigation into the effects of nitrogen enriched air bubbles to improve aircraft fuel system water management. Proc. Inst. Mech. Eng. Part G J. Aerosp. Eng. 2017. [Google Scholar] [CrossRef]
- Burns, M.; Cavage, W.M. Inerting of a Vented Aircraft Fuel Tank Test Article with Nitrogen-Enriched Air; FAA William J. Hughes Technical Center, Atlantic City International Airport: Egg Harbor Township, NJ, USA, 2001.
- Cavage, W.M.; Bowman, T. Modeling In-Flight Inert Gas Distribution in a 747 Center Wing Fuel Tank. In Proceedings of the 35th AIAA Fluid Dynamics Conference and Exhibit, Toronto, ON, Canada, 6–9 June 2005. [Google Scholar]
- Burns, M.; Cavage, W.; Morrison, R.; Summer, S. Evaluation of Fuel Tank Flammability and the FAA Inerting System on the NASA 747 SCA; U.S. Department of Transportation, Federal Aviation Administration, Office of Aviation Research: Washington, DC, USA, 2004.
- Cai, Y.; Bu, X.; Lin, G.; Sun, B.; Zeng, Y.; Li, Z. Experimental study of an aircraft fuel tank inerting system. Chin. J. Aeronaut. 2015, 28, 394–402. [Google Scholar] [CrossRef]
- Battistoni, M.; Grimaldi, C.N. Numerical analysis of injector flow and spray characteristics from diesel injectors using fossil and biodiesel fuels. Appl. Energy 2012, 97, 656–666. [Google Scholar] [CrossRef]
- Vujanovic, M.; Petranovic, Z.; Edelbauer, W.; Baleta, J.; Duic, N. Numerical modelling of diesel spray using the Eulerian multiphase approach. Energy Convers. Manag. 2015, 104, 160–169. [Google Scholar] [CrossRef] [Green Version]
- Harlow, F.H.; Amsden, A.A. Numerical calculation of multiphase fluid flow. J. Comput. Phys. 1975, 17, 19–52. [Google Scholar] [CrossRef]
- Ishii, M.; Hibiki, T. Thermo-Fluid Dynamic of Two-Phase Flow; Springer Science & Business Media: New York, NY, USA, 2010. [Google Scholar]
- Sato, Y.; Sekoguchi, K. Liquid velocity distribution in two-phase bubble flow. Int. J. Multiph. Flow 1975, 2, 79–95. [Google Scholar] [CrossRef]
- Guggenheim, E. The theoretical basis of Raoult’s law. Trans. Faraday Soc. 1937, 33, 151–156. [Google Scholar] [CrossRef]
- Karimi, M.; Akdogan, G.; Dellimore, K.H.; Bradshaw, S.M. Comparison of different drag coefficient correlations in the CFD modelling of a laboratory-scale Rushton-turbine flotation tank. In Proceedings of the Ninth International Conference on CFD in the Minerals and Process Industries, Melbourne, Australia, 10–12 December 2012. [Google Scholar]
- Schiller, L.; Naumann, Z. A drag coefficient correlation. Z. Ver. Dtsch. Ing. 1935, 77, 318–320. [Google Scholar]
- Ranz, W.; Marshall, W. Evaporation from drops. Chem. Eng. Prog. 1952, 48, 141–146. [Google Scholar]
- Drikakis, D.; Hahn, M.; Mosedale, A.; Thornber, B. Large eddy simulation using high-resolution and high-order methods. Philos. Trans. R. Soc. Lond. A Math. Phys. Eng. Sci. 2009, 367, 2985–2997. [Google Scholar] [CrossRef] [PubMed] [Green Version]
- McClure, D.D.; Kavanagh, J.M.; Fletcher, D.F.; Barton, G.W. Oxygen transfer in bubble columns at industrially relevant superficial velocities: Experimental work and CFD modelling. Chem. Eng. J. 2015, 180, 138–146. [Google Scholar] [CrossRef]
- Pfleger, D.; Gomes, S.; Gilbert, N.; Wagner, H.-G. Hydrodynamic simulations of laboratory scale bubble columns fundamental studies of the Eulerian–Eulerian modelling approach. Chem. Eng. Sci. 1999, 54, 5091–5099. [Google Scholar] [CrossRef]
Figure 1.
Schematic of the nitrogen enriched air (NEA) pumping process. NEA is pumped from the bottom of the fuel tank. The dry NEA absorbs water from the fuel and ullage, and exits the system through a pressure valve.
Figure 1.
Schematic of the nitrogen enriched air (NEA) pumping process. NEA is pumped from the bottom of the fuel tank. The dry NEA absorbs water from the fuel and ullage, and exits the system through a pressure valve.

Figure 2.
Schematic representation of the fuel tank mesh. The region initially containing fuel is coloured in red while the ullage is coloured in blue. The black rectangle on the upper right side of the surface is the pressure valve of the system. The two rectangles below show the bottom plane for the one-inlet (left) and four-inlet (right) cases.

Figure 3.
Hold-up of air in water in a bubble column for different superficial velocities. Comparison of the present calculations with the experiments of [31].
Figure 3.
Hold-up of air in water in a bubble column for different superficial velocities. Comparison of the present calculations with the experiments of [31].

Figure 4.
The water vapour absorbed by the rising NEA in slices of the fuel (ullage is excluded) in the xy plane at the center of the tank, for a single-inlet (left) and four-inlets (right). Four different times are shown. The total mass flow in the two systems is the same ( kg/s). Note that the figure shows only the water that has vapourized into the NEA/air. Since the concentration of NEA in the fuel away from the columns is approximately zero, the concentration of water vapour is also zero.

Figure 5.
Stream traces of the fuel for a single inlet at three different times. The left column shows a perspective view of the fuel tank and the right column shows a view along width of the tank.
Figure 5.
Stream traces of the fuel for a single inlet at three different times. The left column shows a perspective view of the fuel tank and the right column shows a view along width of the tank.
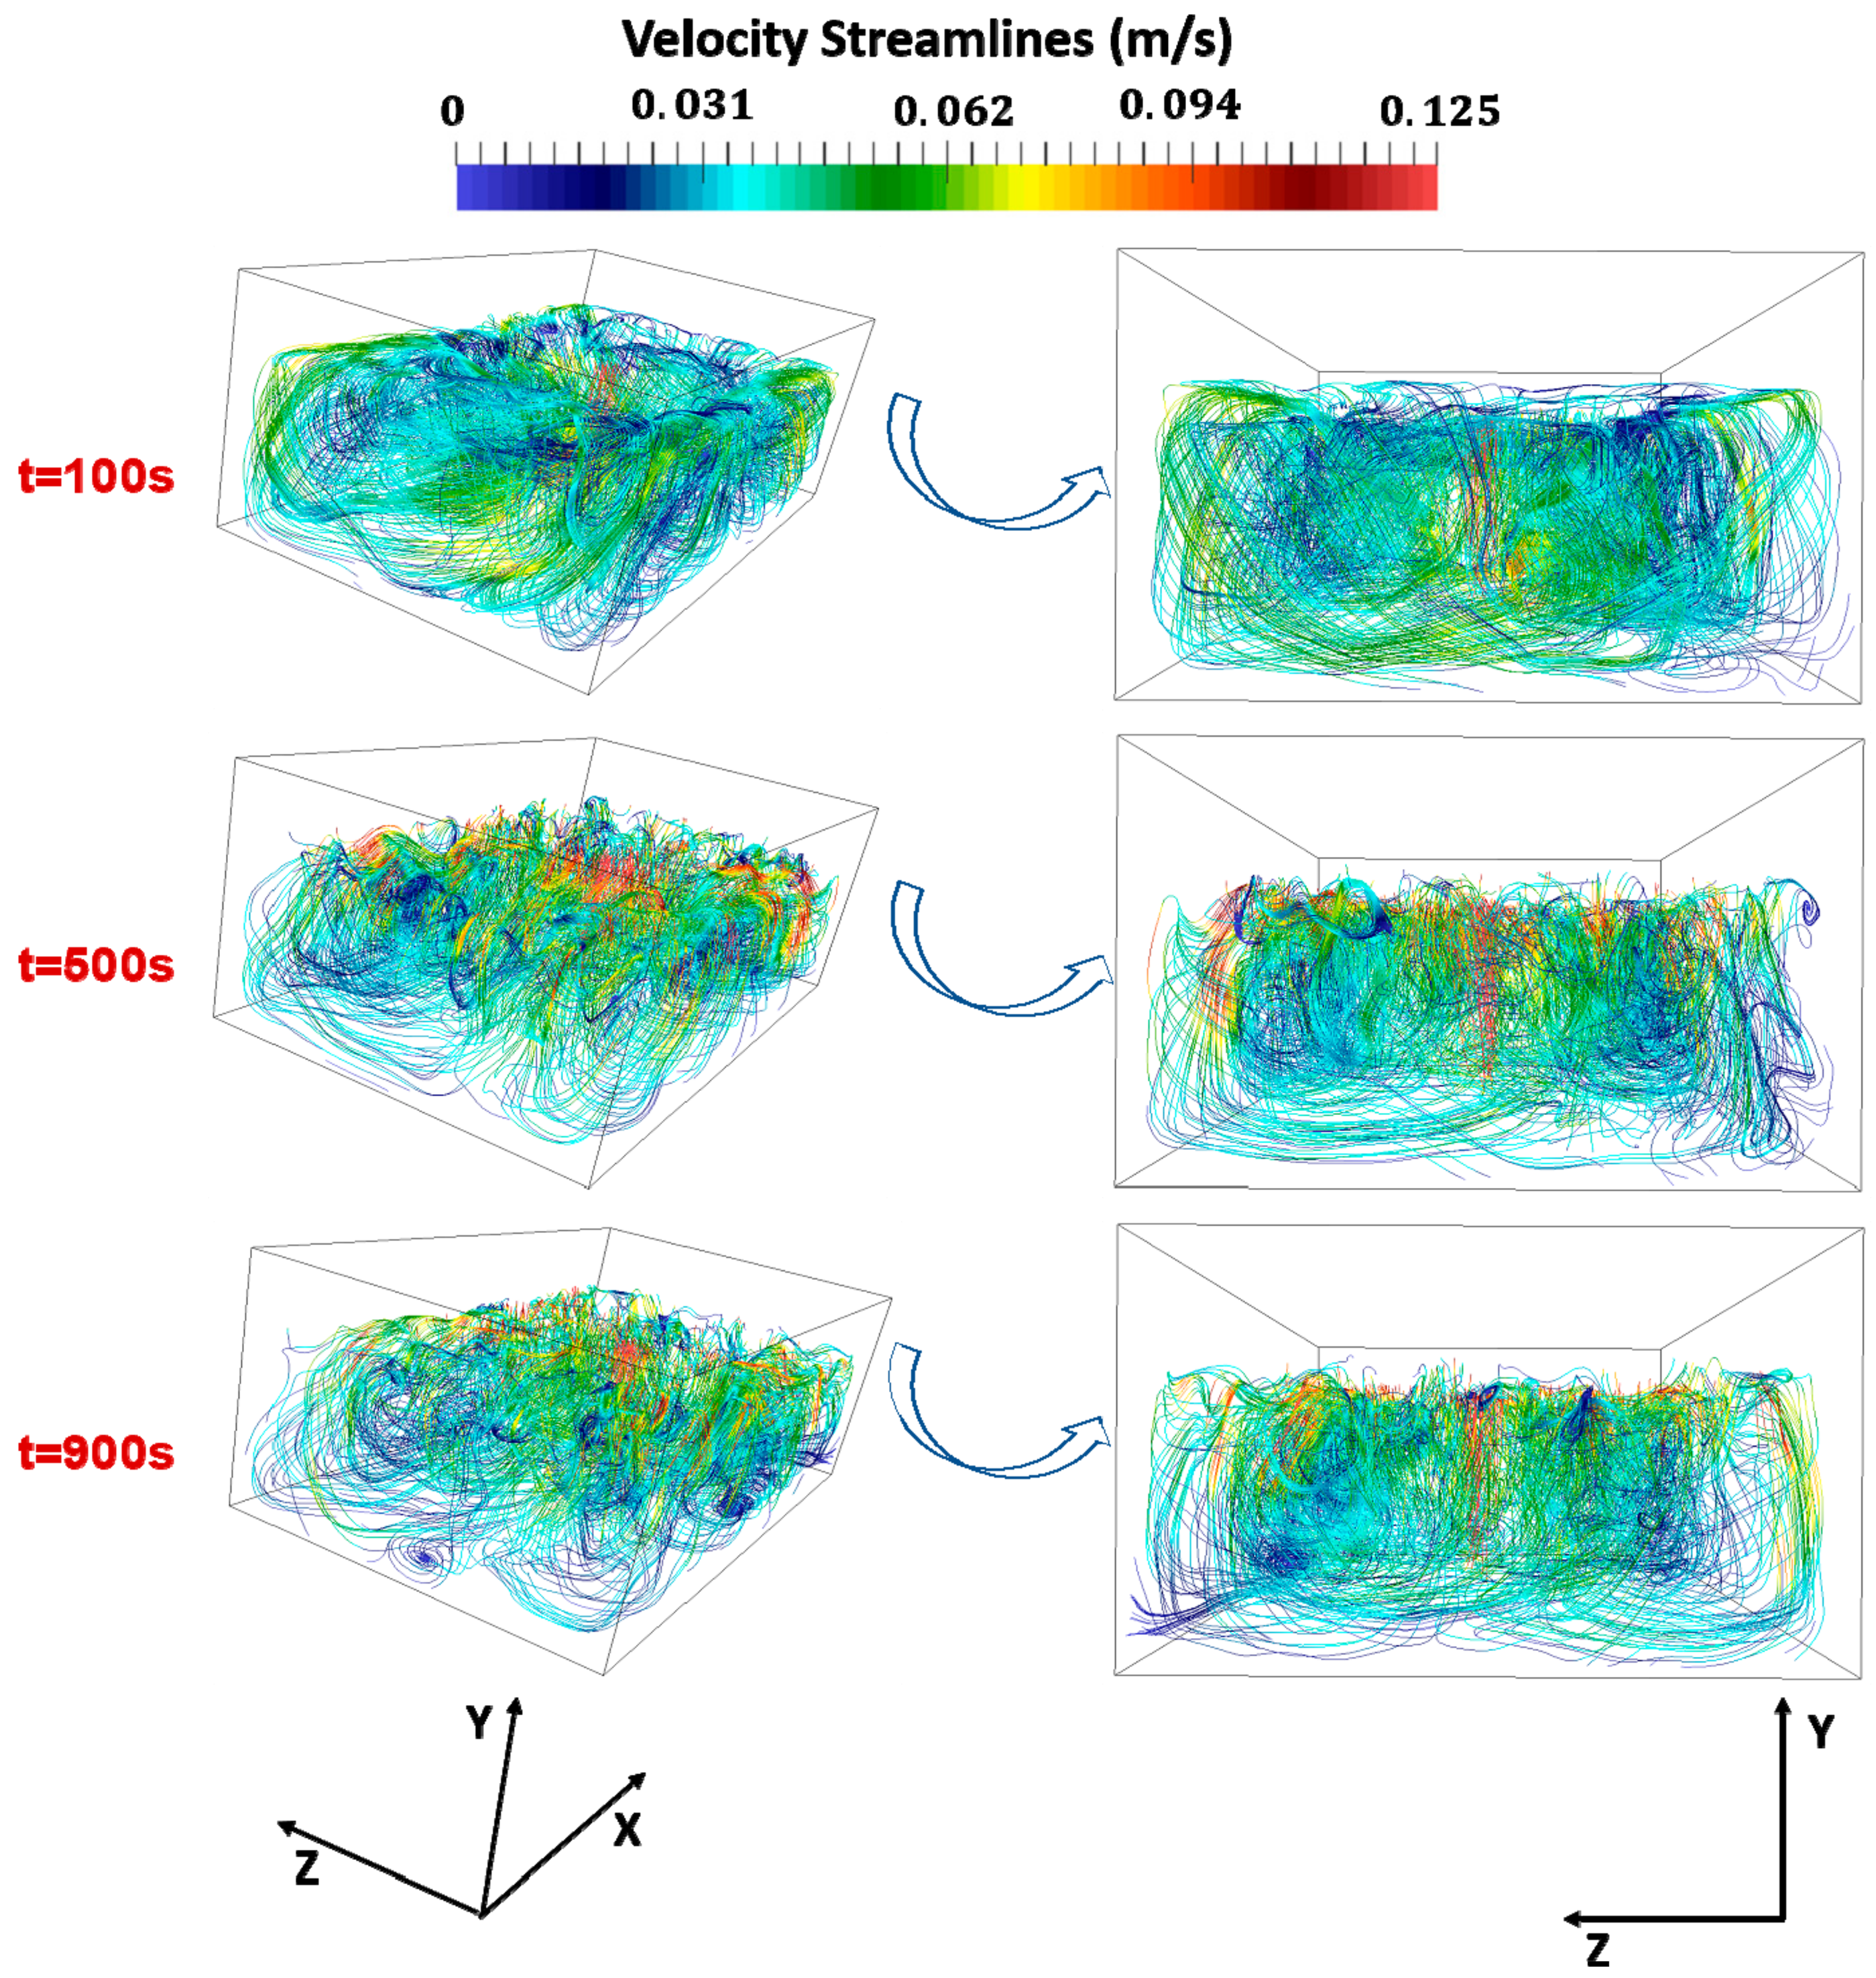
Figure 6.
Stream traces of the fuel for the four inlet case at three different times. The left column shows a perspective view of the fuel tank and the right column shows a view along the width of the tank.
Figure 6.
Stream traces of the fuel for the four inlet case at three different times. The left column shows a perspective view of the fuel tank and the right column shows a view along the width of the tank.
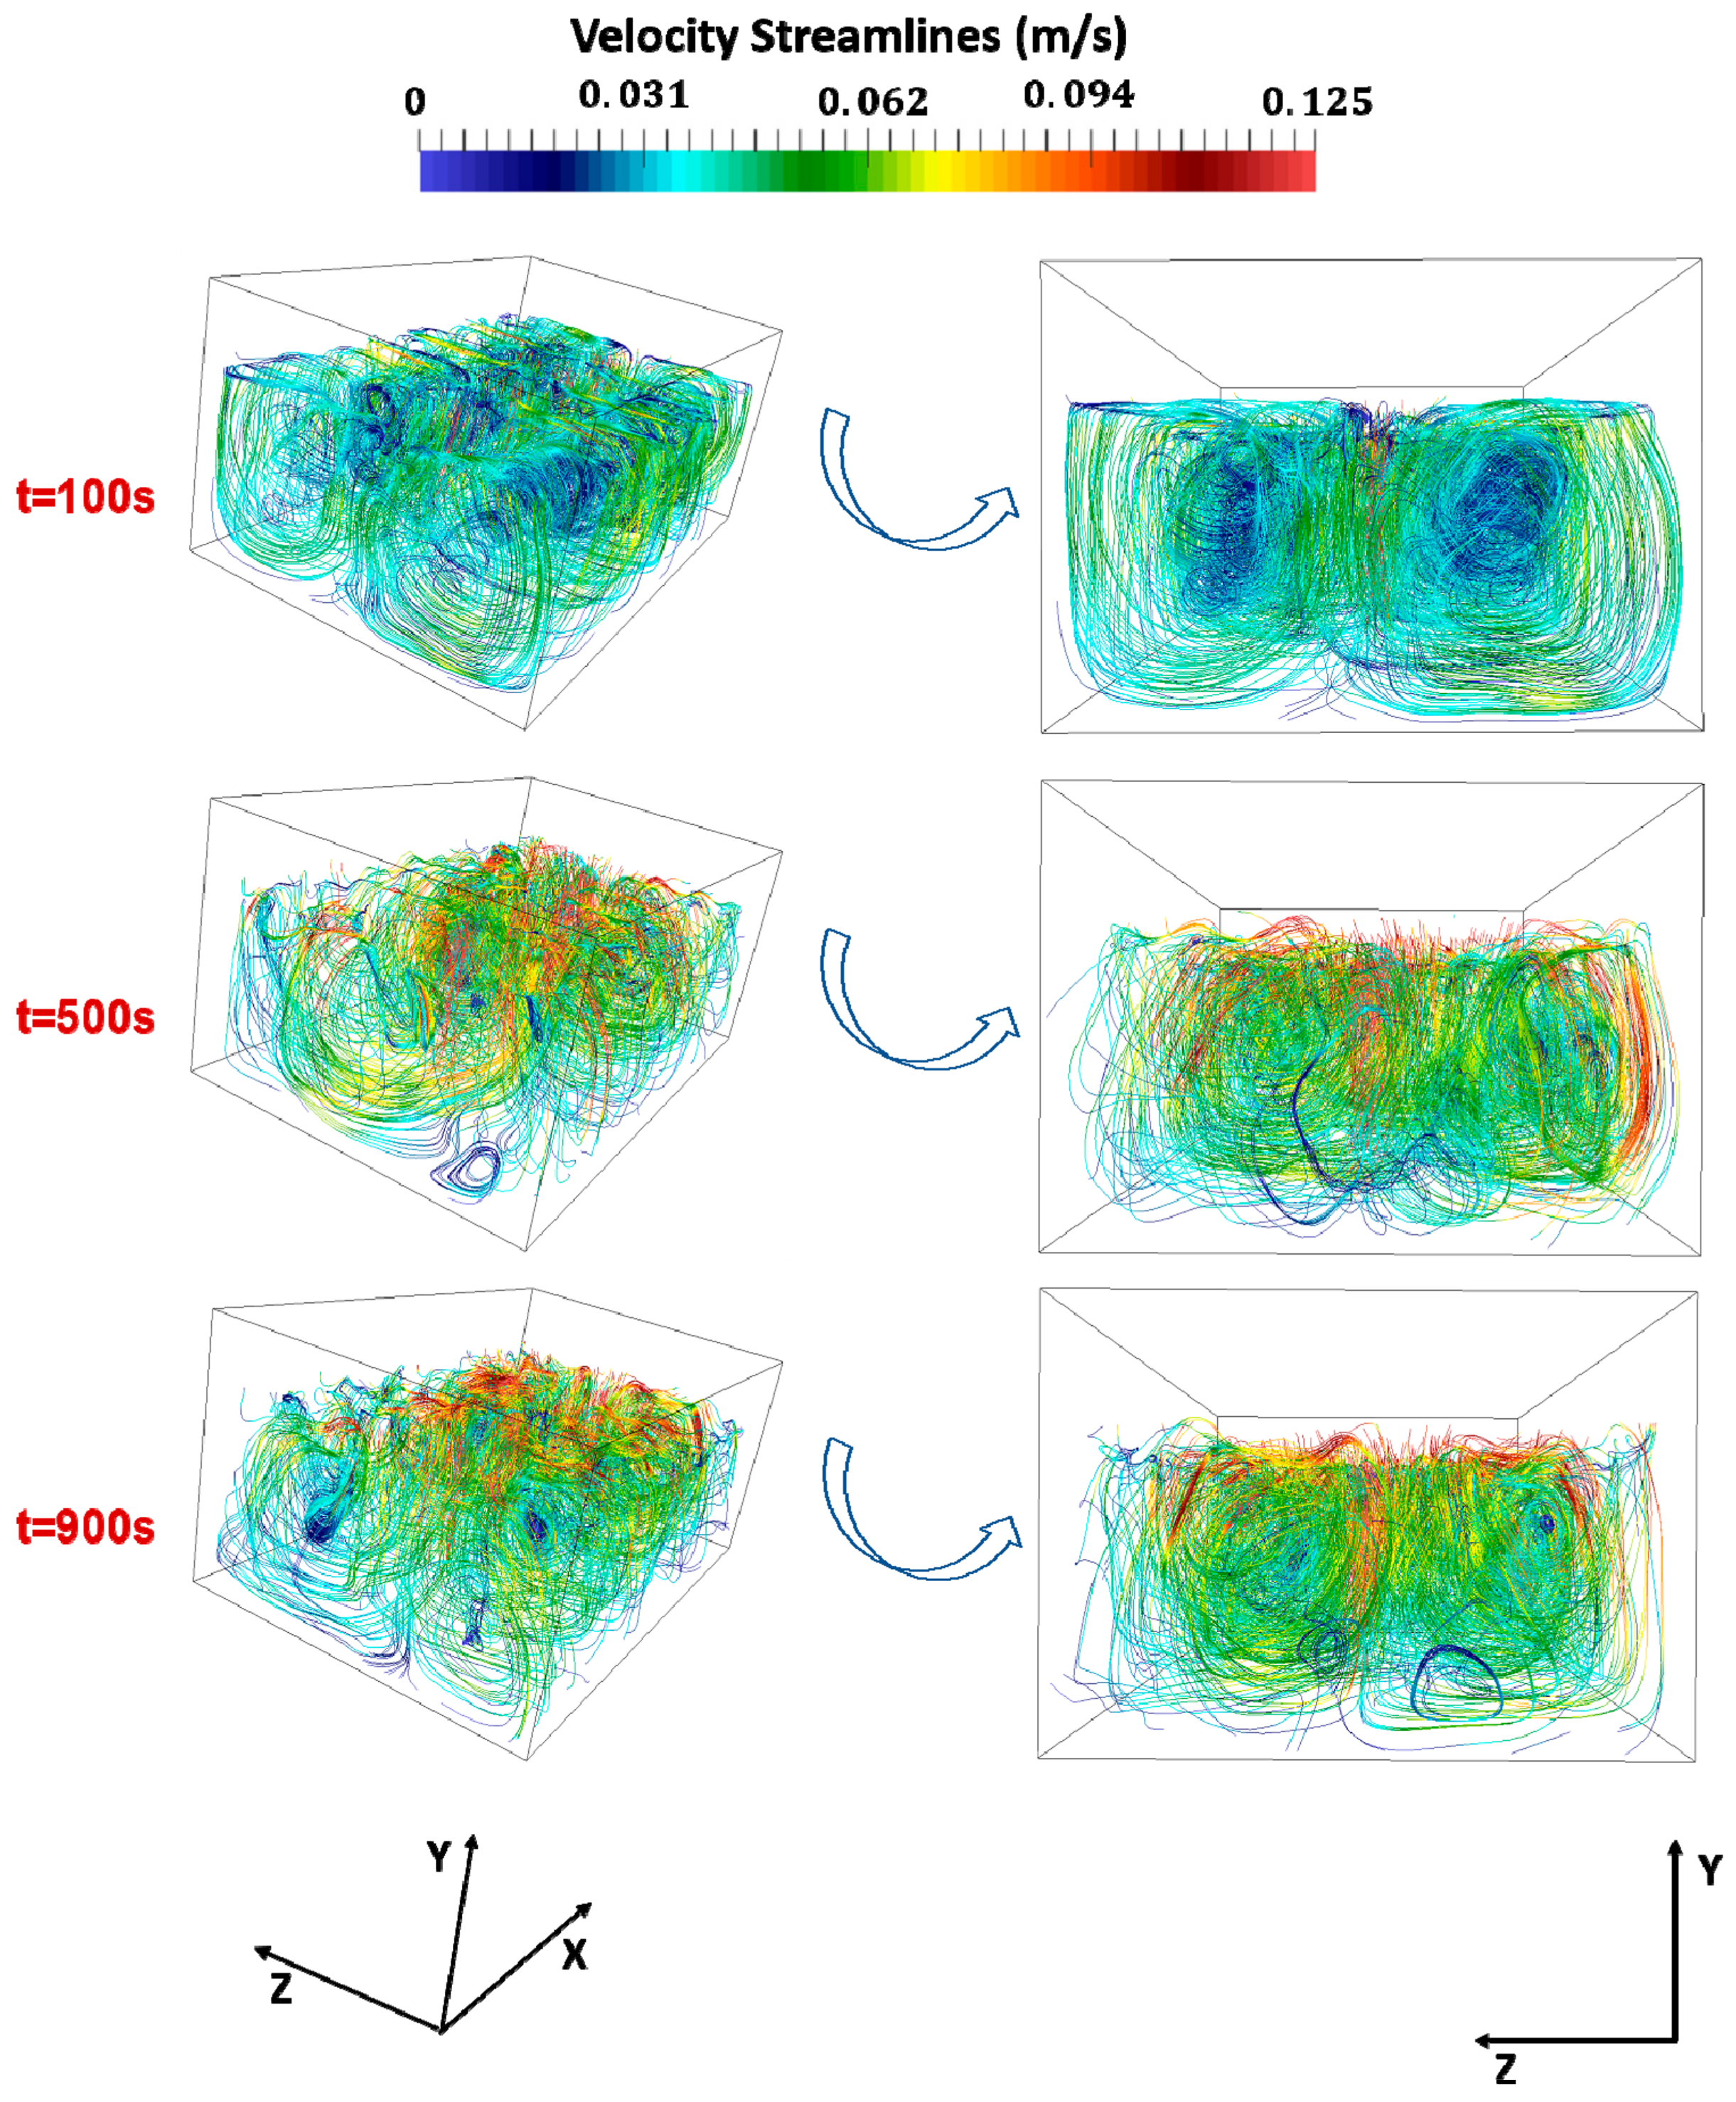
Figure 7.
The component of the vorticity in the z direction on two planes: one at the centre of the tank, i.e., (left column) and one at the back of the tank, i.e., (right column), for the cases with one and four inlets. Contour lines for a selected number of vorticity values are shown on the plots.
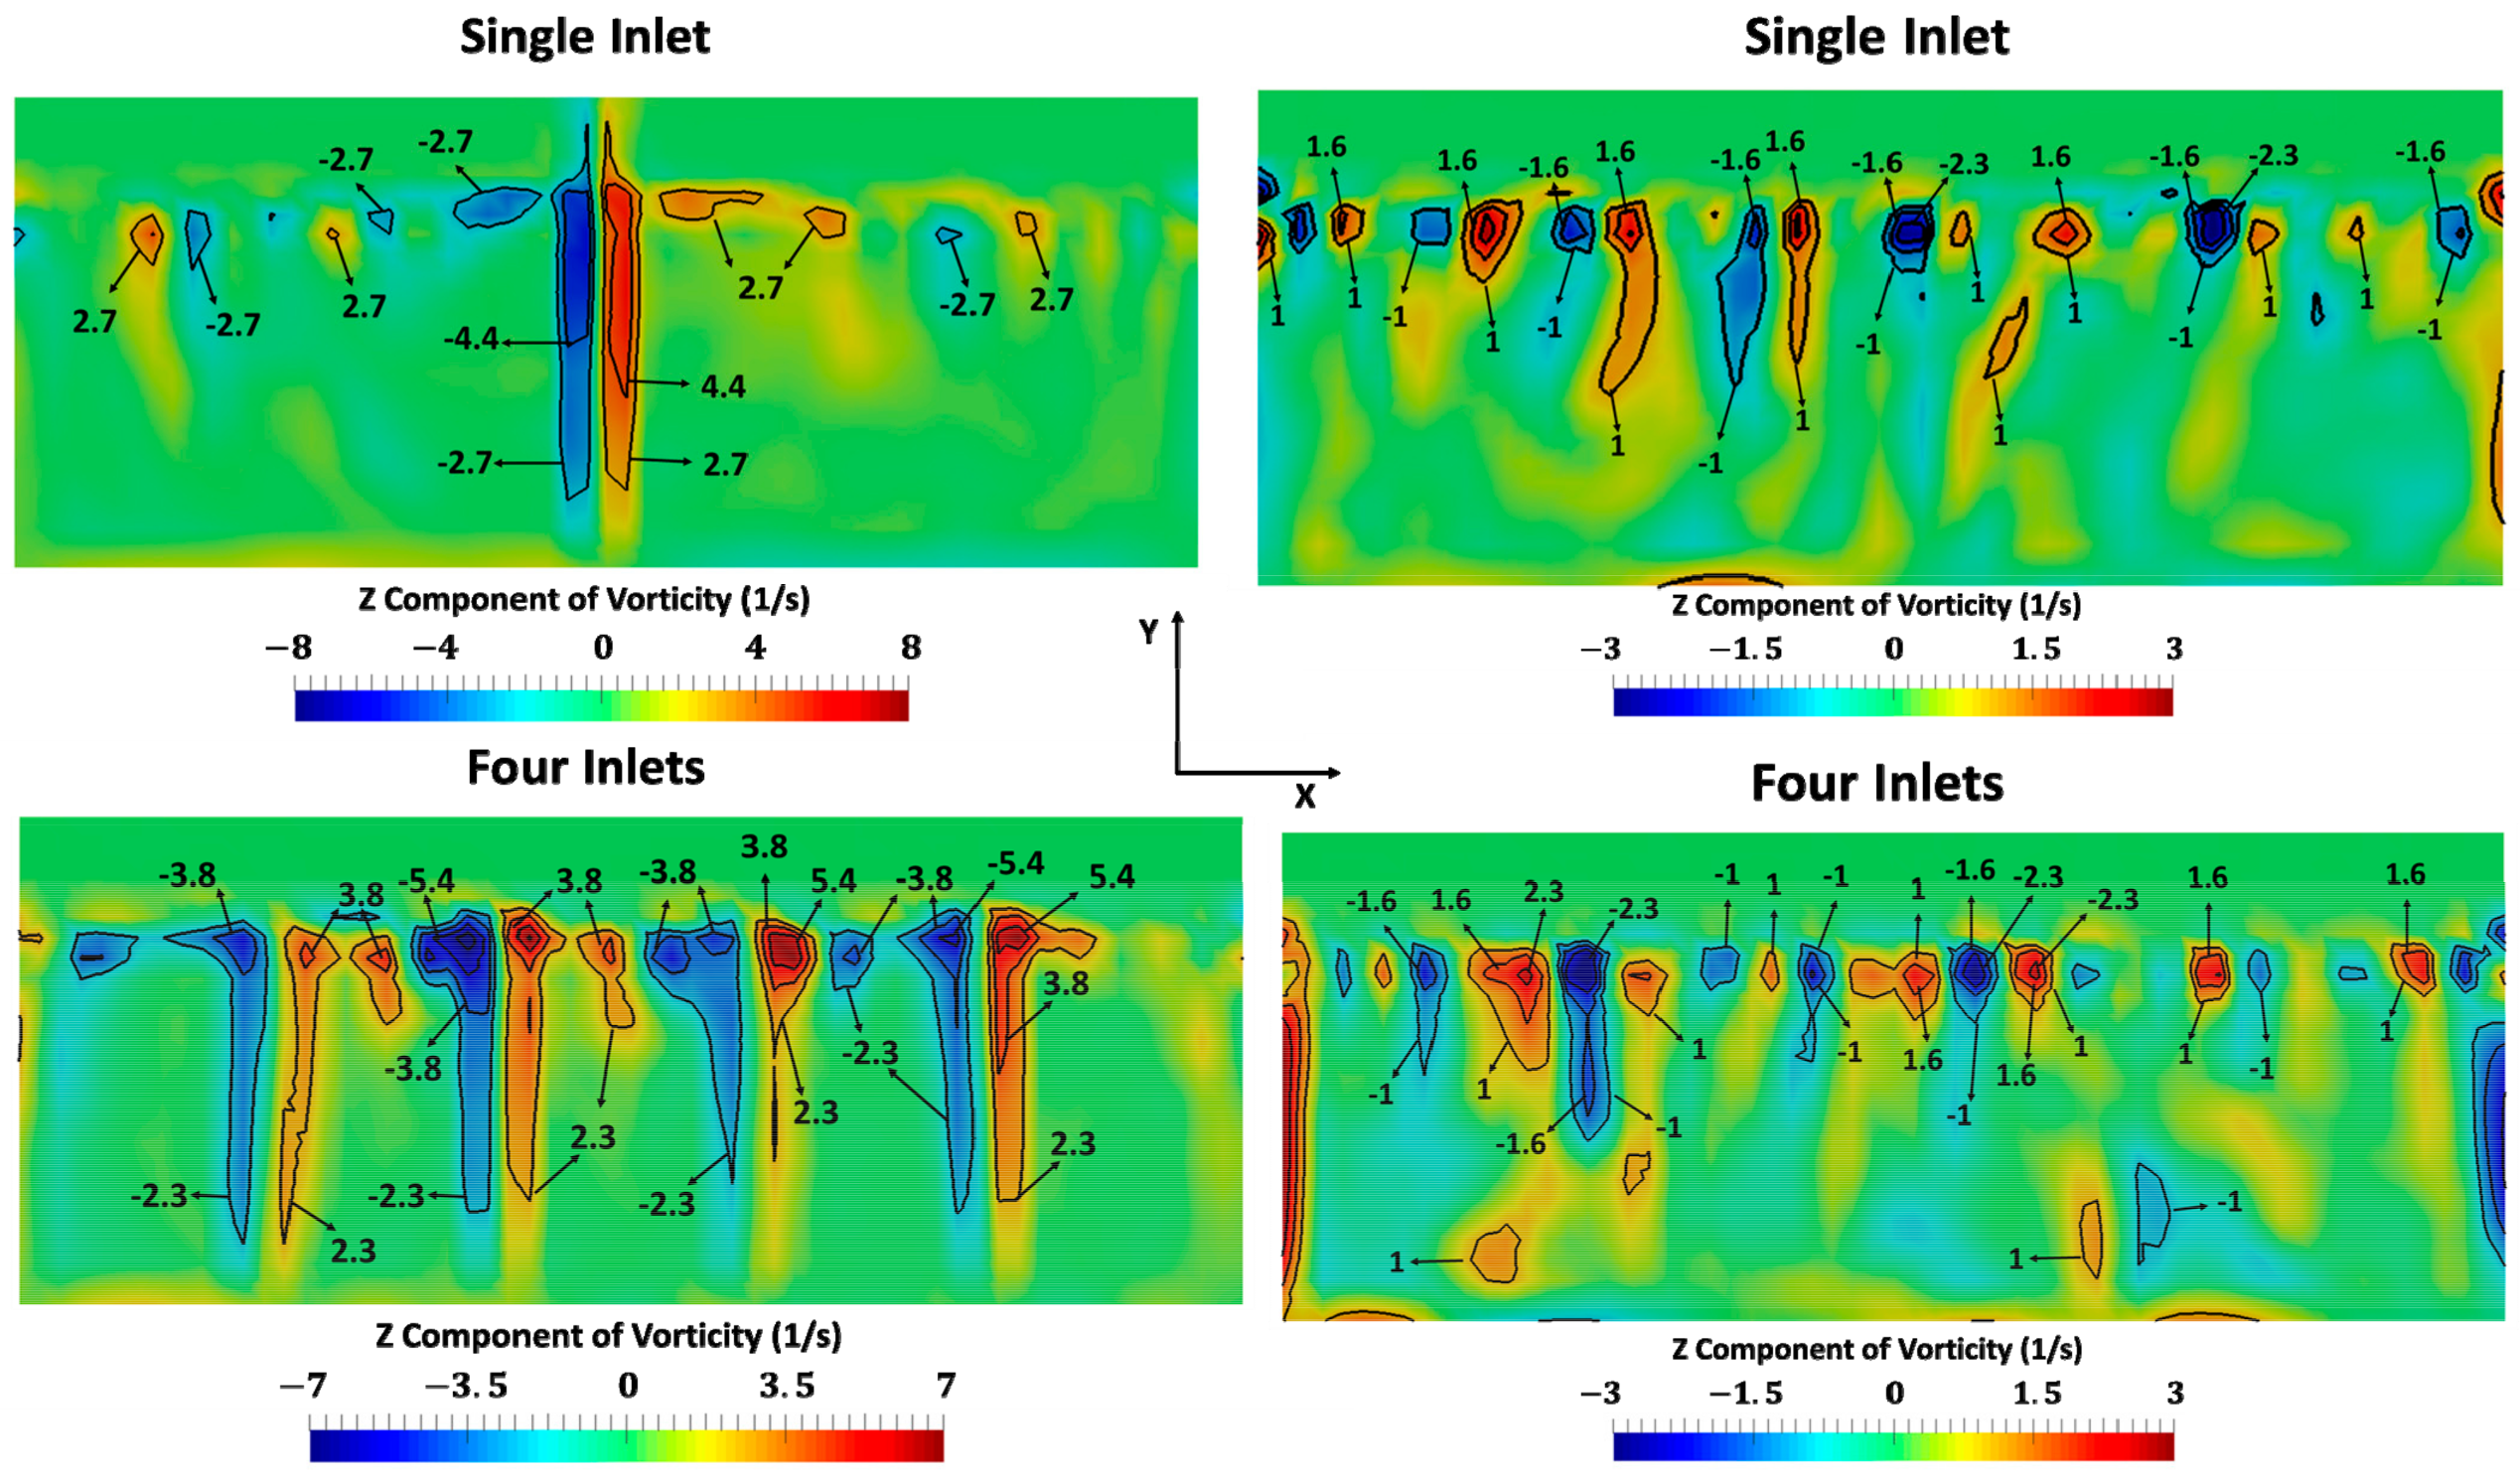
Figure 8.
Time evolution of the mass fraction of water in the fuel for the single-inlet and four-inlet cases, as well as a case where NEA is pumped directly into the ullage (ullage washing). The inlet velocity of the three cases is adjusted accordingly so that the mass flow rate remains the same.
Figure 8.
Time evolution of the mass fraction of water in the fuel for the single-inlet and four-inlet cases, as well as a case where NEA is pumped directly into the ullage (ullage washing). The inlet velocity of the three cases is adjusted accordingly so that the mass flow rate remains the same.

Figure 9.
Time evolution of the mass fraction of water in the ullage for the single-inlet and four-inlet cases. The inlet velocity of the two cases is adjusted accordingly so that the mass flow rate remains the same.
Figure 9.
Time evolution of the mass fraction of water in the ullage for the single-inlet and four-inlet cases. The inlet velocity of the two cases is adjusted accordingly so that the mass flow rate remains the same.
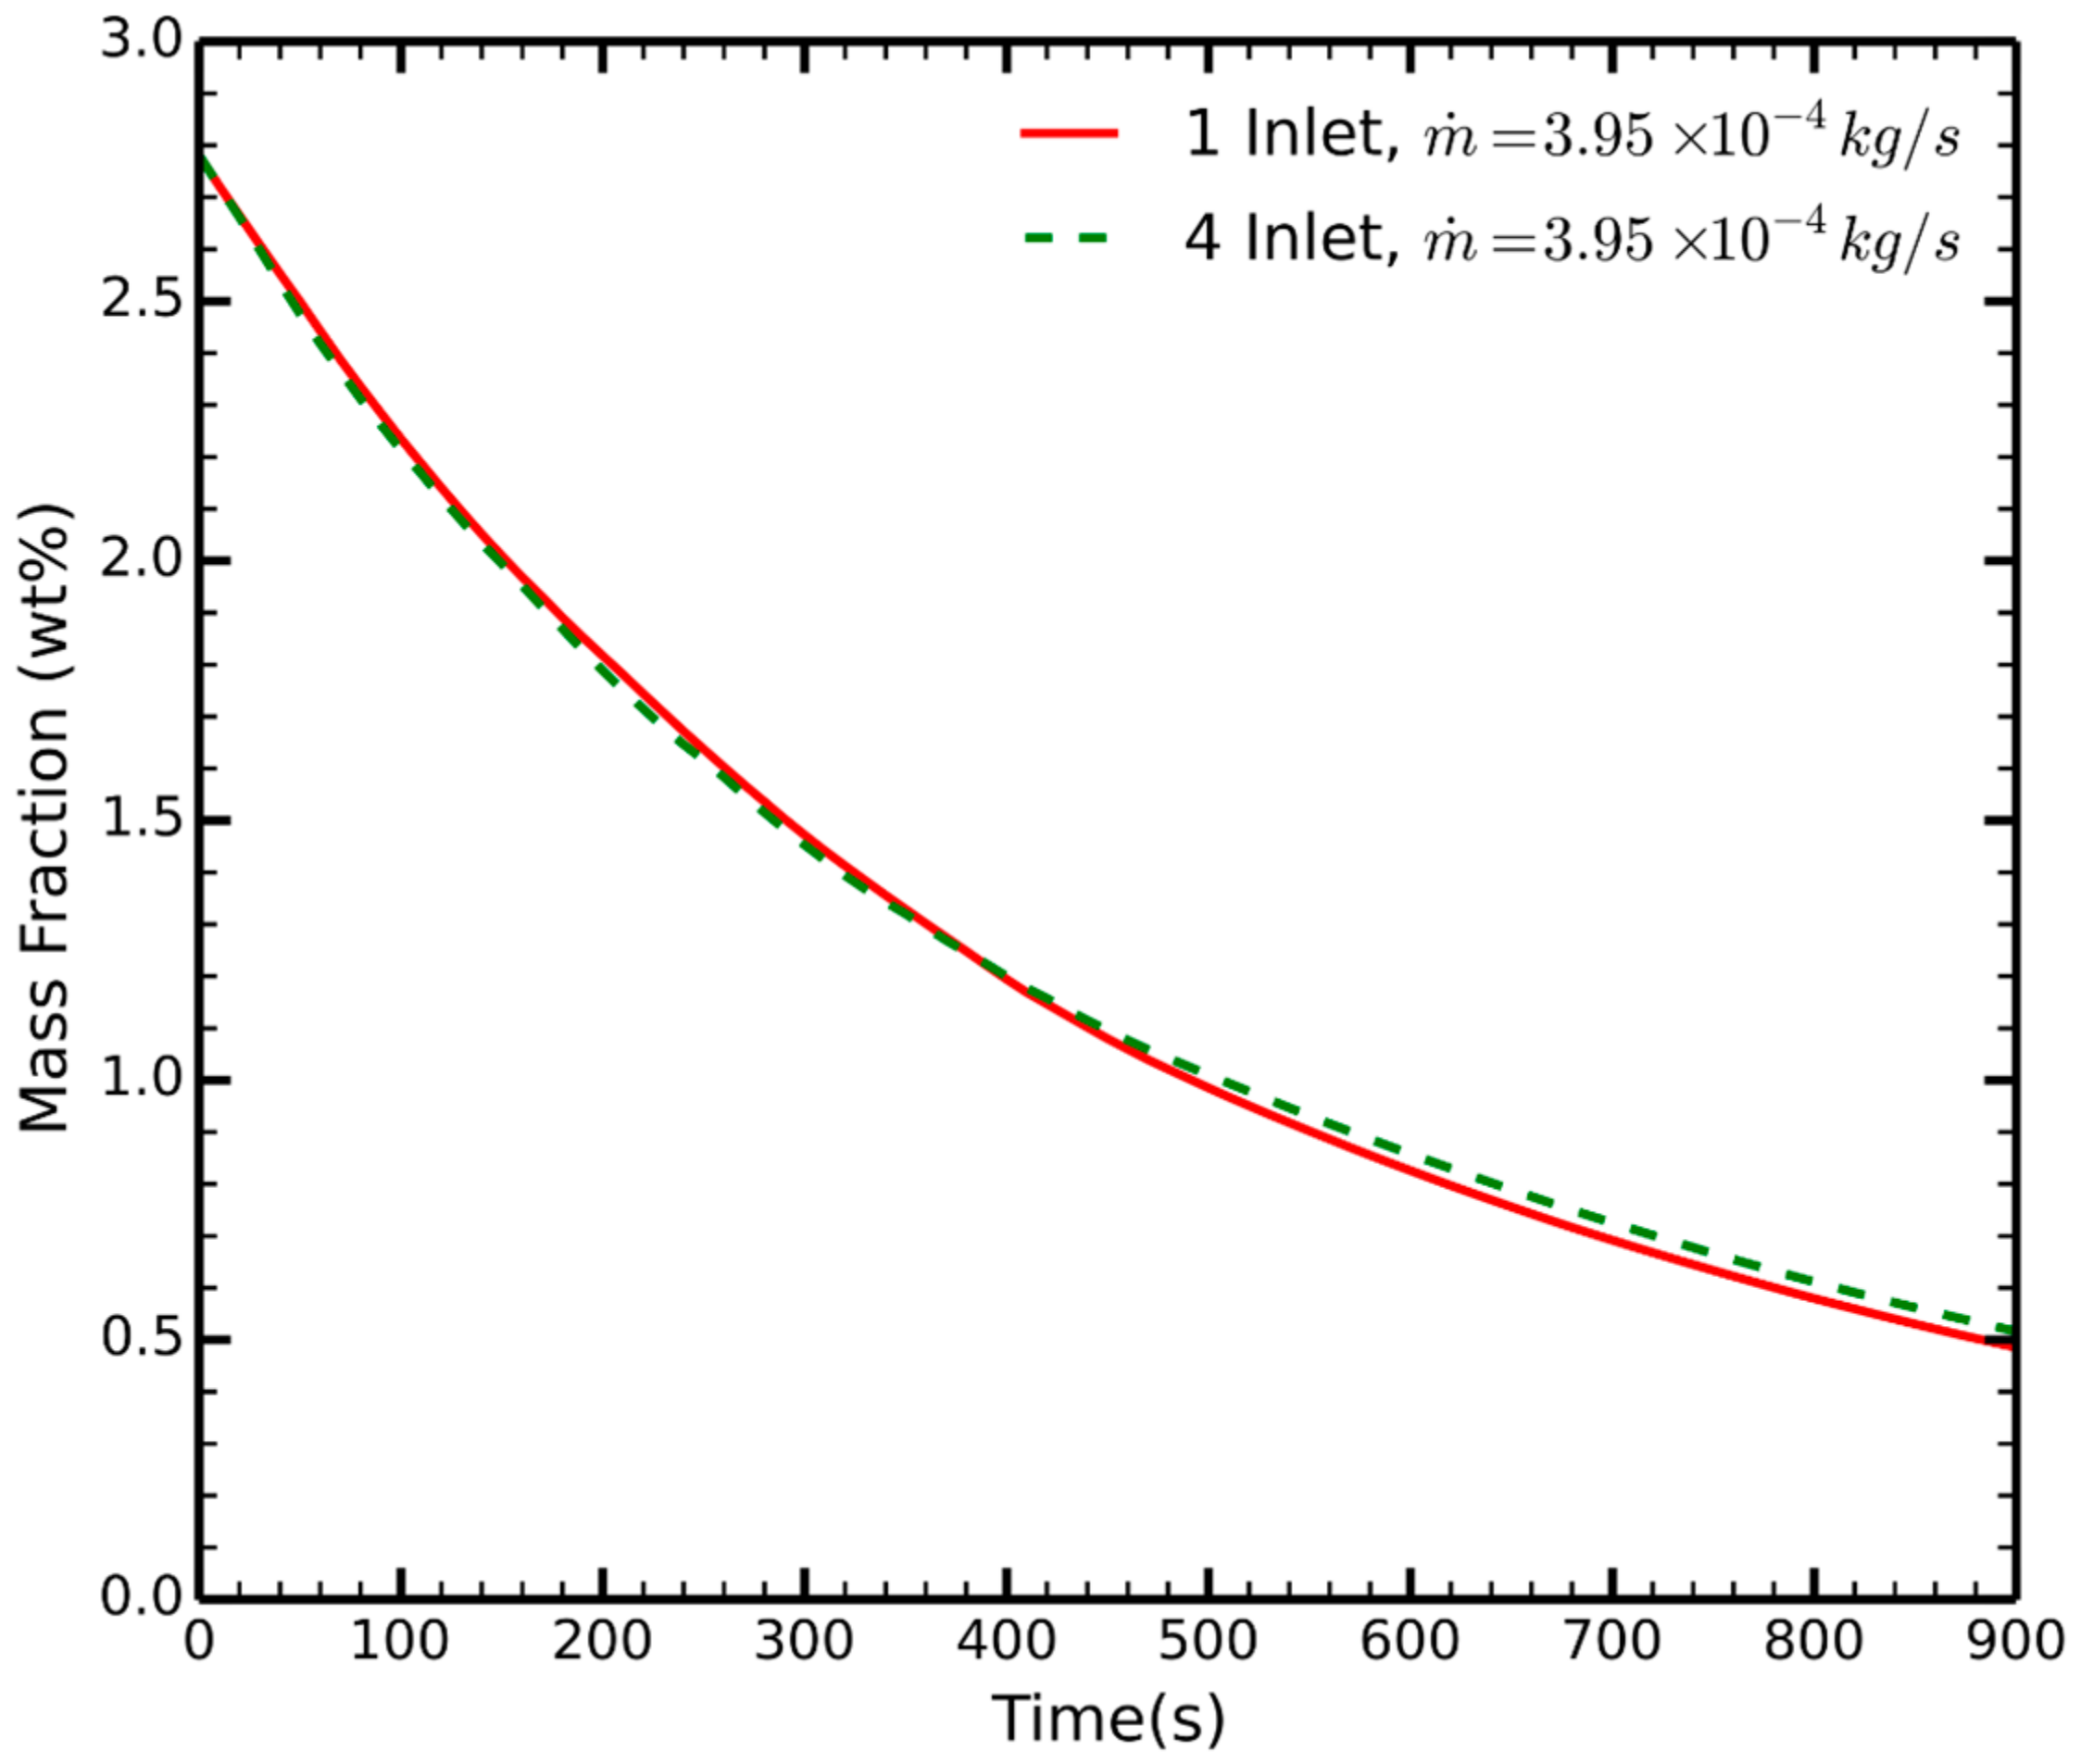
Figure 10.
Molar concentration at two slices of the fuel tank at two different times. The bottom half of the figure shows the plane at . The upper half of the figure shows the plane at .
Figure 10.
Molar concentration at two slices of the fuel tank at two different times. The bottom half of the figure shows the plane at . The upper half of the figure shows the plane at .

Figure 11.
The component of the vorticity in the z direction on two planes for the case with a mass flow rate of . (a) plane at the centre of the tank, i.e., ; (b) plane at the back of the tank, i.e., .
Figure 11.
The component of the vorticity in the z direction on two planes for the case with a mass flow rate of . (a) plane at the centre of the tank, i.e., ; (b) plane at the back of the tank, i.e., .
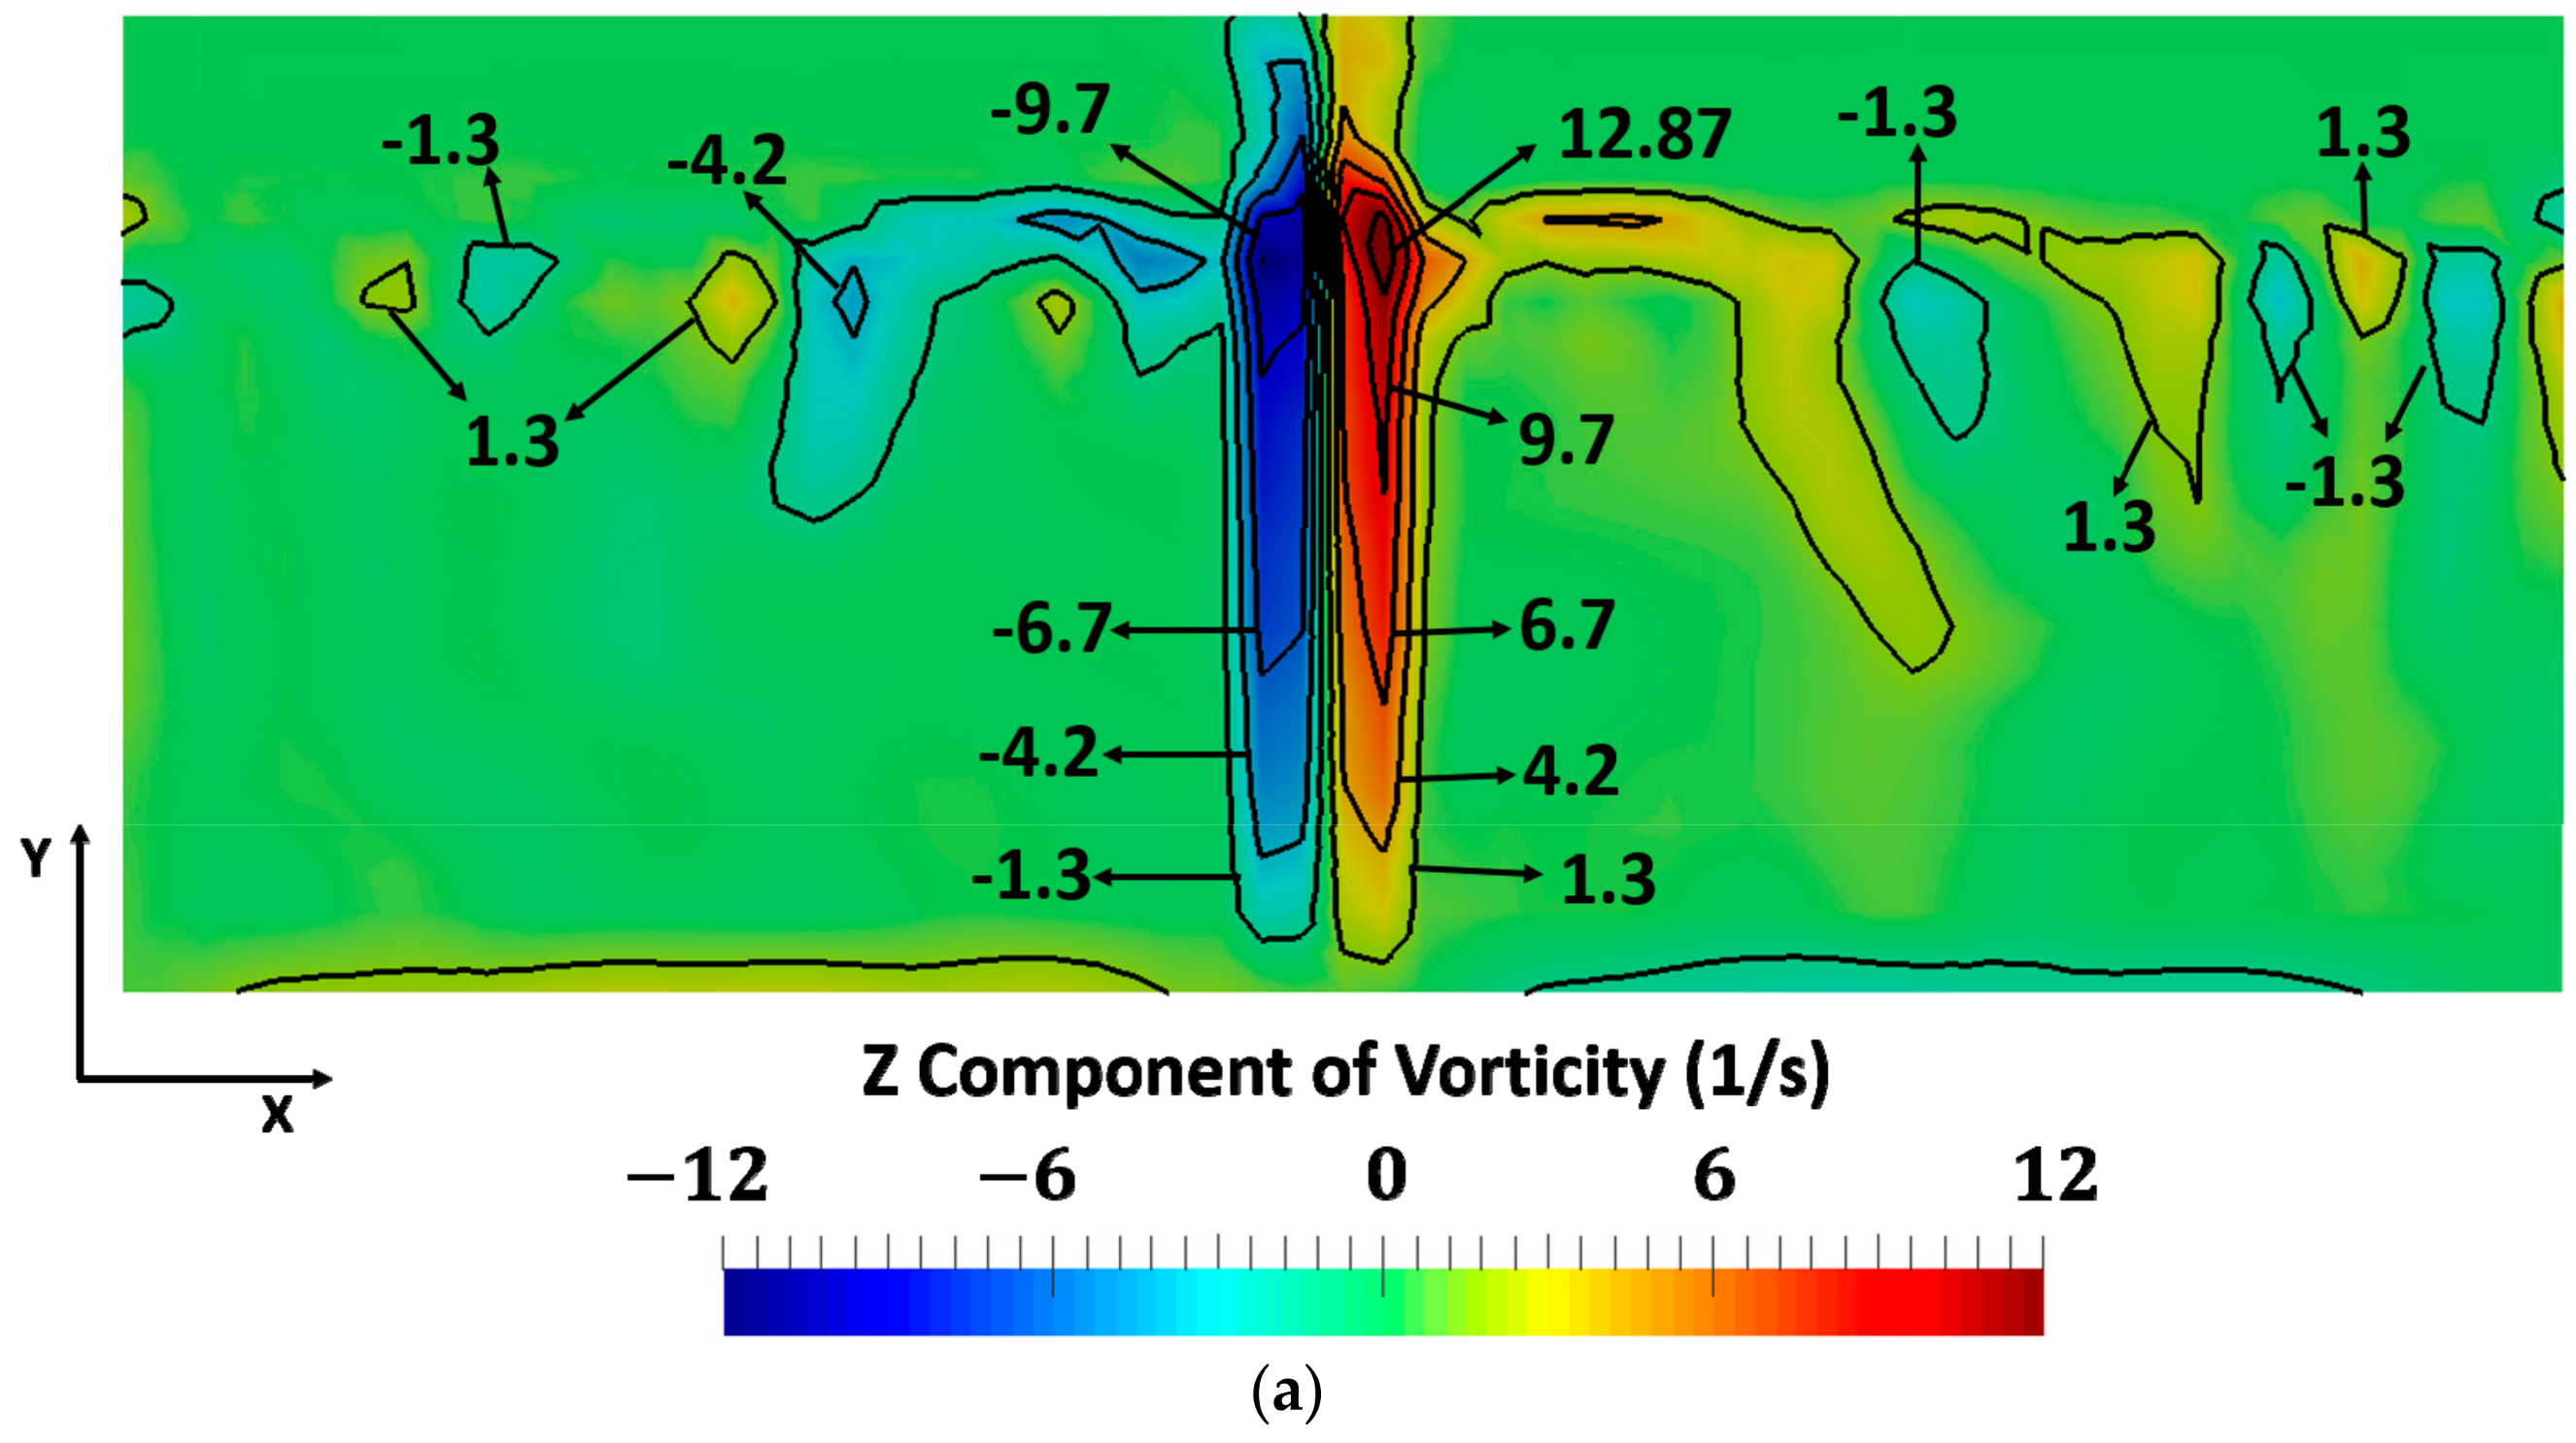

Figure 12.
Time evolution of the mass fraction of water in the fuel for the single-inlet and four-inlets with a mass flow rate of , and a single-inlet case with the mass flow rate increased by a factor of two.
Figure 12.
Time evolution of the mass fraction of water in the fuel for the single-inlet and four-inlets with a mass flow rate of , and a single-inlet case with the mass flow rate increased by a factor of two.

Table 1.
Mass fraction of the components of the fuel, air and NEA.
| Component | Fuel (wt %) | Air (wt %) | NEA (wt %) |
|---|---|---|---|
| Decane | 0 | 0 | |
| Nitrogen | 75.4 | 95 | |
| Oxygen | 21.6 | 5 | |
| Water | 2.778 | 0 |
Table 2.
The root mean square (RMS) error of the mass fraction on the coarse and medium grid with respect to the solution on the fine grid.
Table 2.
The root mean square (RMS) error of the mass fraction on the coarse and medium grid with respect to the solution on the fine grid.
| Grid | Number of Cells | RMS |
|---|---|---|
| 6480 | ||
| 51,840 |
© 2018 by the authors. Licensee MDPI, Basel, Switzerland. This article is an open access article distributed under the terms and conditions of the Creative Commons Attribution (CC BY) license (http://creativecommons.org/licenses/by/4.0/).
Share and Cite
MDPI and ACS Style
Frank, M.; Drikakis, D. Draining Water from Aircraft Fuel Using Nitrogen Enriched Air. Energies 2018, 11, 908. https://doi.org/10.3390/en11040908
AMA Style
Frank M, Drikakis D. Draining Water from Aircraft Fuel Using Nitrogen Enriched Air. Energies. 2018; 11(4):908. https://doi.org/10.3390/en11040908
Chicago/Turabian StyleFrank, Michael, and Dimitris Drikakis. 2018. "Draining Water from Aircraft Fuel Using Nitrogen Enriched Air" Energies 11, no. 4: 908. https://doi.org/10.3390/en11040908
Note that from the first issue of 2016, this journal uses article numbers instead of page numbers. See further details here.