The Periodic Characteristics of China’s Economic Carbon Intensity Change and the Impacts of Economic Transformation

Institute of Energy, Environment and Economy, Tsinghua University, Beijing 10084, China
*
Author to whom correspondence should be addressed.
Energies 2018, 11(4), 961; https://doi.org/10.3390/en11040961
Submission received: 10 February 2018
/
Revised: 23 March 2018
/
Accepted: 12 April 2018
/
Published: 17 April 2018
Abstract
:Understanding the pathway of carbon emissions is an important basis for establishing a national climate strategy. In this paper, the change in China’s economic carbon intensity since its accession to the World Trade Organization has been analyzed with a time series decomposition analysis method. Four phases with distinctive features are defined, and the significant fluctuations in China’s economic carbon intensity after 2001 are explained in detail. From the phase-average perspective, the contributions of major factors to the economic carbon intensity change have evolved steadily, instead of through highly volatile change on a yearly basis, and the gradual changes have been caused mainly by the development of the industrial sectors. Induced by the new normal in economic development, the change of China’s economic carbon intensity has entered a new phase driven by multiple factors with economic structural improvement being the most important contributor, as well as the continuingly, though decreasingly, important factor of energy efficiency.
1. Introduction
Fast-growing economies now account for the majority of the newly added carbon emissions worldwide, and their achievement in emissions control will have a significant impact on attaining the 2 °C, or even 1.5 °C, global target in abating global warming [1,2].
China is the largest emitter of carbon emissions in the world currently. In terms of economic development, China’s economy has enjoyed a rapid, two-digit growth rate since its accession to the World Trade Organization (WTO) at the end of 2001 [3]. This rapid growth benefited largely from the boom of foreign direct investment (FDI) and explosive industrialization, which has made China one of the major exporting countries in the world [4,5]. However, rapid industrialization has also caused some negative effects at the international level, such as the decrease in average global productivity [6] and environmental damage, as well as the energy consumption and carbon emission boom at the domestic level [7,8,9].
In general, China and other fast-growing economies have shown their serious concerns that carbon emission control might hinder their economic development [10,11]. In the process of rapid economic development, China mainly adopts measures to promote energy conservation and energy efficiency to balance the conflict between economic growth and carbon emission growth [12]. The improvement of energy efficiency has also become the main driver of the decline of China’s economic carbon intensity (energy-related CO2 emission per unit of GDP) since the energy strategy adjustment in the end of 2004 [9,13]. However, the Chinese government still partly relies on the administrative controls to achieve energy conservation targets. Nevertheless, these administrative measurements were not only considered to be inefficient, but also to be interfering with economic development [12,14,15].
Analyzing the carbon emission pathway is an important basis to set or improve energy and climate change strategy. Currently, China is still experiencing an increase in carbon emissions due to its medium-to-high speed economic growth, but the country has pledged to reduce its economic carbon intensity by 60–65% by 2030 based on 2005 levels and to reach its peak of CO2 emissions around 2030 [16]. Numerous studies have been conducted to analyze the pathway of China’s carbon emissions, including detailed disaggregation into different regions and sectors [17,18,19,20,21,22,23,24,25,26]. However, the analysis of the impact of China’s economic development on its carbon emission pathway is still limited. Existing studies employ both econometric and decomposition methods (structural decomposition analysis (SDA) and index decomposition analysis (IDA)), while both failed to recognize the periodic characteristics of China’s carbon emissions caused by economic development [1,17,18,19,20,21,22,23,24,25,26,27,28,29,30,31,32,33,34,35,36,37,38,39,40,41,42]. As shown in Table 1, most of the 27 studies that we have reviewed focused mainly on the overall trend of China’s carbon emissions statically during a certain period. Only two events have been identified to have caused changes in China’s carbon emission pathways, namely the reform and opening up of 1978 and China’s accession to the World Trade Organization(WTO) in 2001 [19,21]. In the research on China’s emission pathways after 2001, either no phases have been defined or the phases have been defined according to China’s five-year plan periods [22,28,34,36]. That means connections between the carbon emission pathway and economic development have not been effectively established. Some existing research on the change in China’s emissions after 2001 has revealed the significant volatility of the contributions of major factors to this change, but discussions have been limited to specific contributing factors and have not touched upon the periodic characteristics of China’s emissions [17,18,19,20,21,22,23,24,25].
Perhaps more importantly, based on the experiences of Organization for Economic Co-operation and Development (OECD) countries, major external shocks (such as the international oil crisis in the 1980s) could significantly change the trend of national economic development, energy consumption, and carbon emissions [43]. Since the international financial crisis in 2008, the global economy has changed dramatically. In order to promote economic recovery and ensure social stability, the Chinese government put forward an ambitious economic stimulus package of four trillion Yuan RMB at the end of 2008 and implemented it over the next two years [43]. This resulted in a temporary takeoff of China’s economy in 2010, but the impact of the package lasted only until 2011. In of 2012, China’s economic growth rate once again dropped below the level before the stimulus [3]. In addition, since 2010, the major FDI inflow has not been in the manufacturing sector, but rather in the service sector [44]. Thus, the structure of the Chinese economy has changed tremendously, with the commercial and service sector accounting for 42.8% of the economic structure in 2008 and rising rapidly to 50.2% in 2015 [3].
In this case, although some recent IDA decomposition analyses have illustrated that the weak international demand caused by the international financial crisis affected China’s export trade and mitigated China’s carbon emissions to a large extent in 2012 [31,32,33,34,35,36,37,38,39,40,41,42], few further conclusions on or evidence of the change in China’s carbon emission pathway have been reported as a result of time series decomposition analysis [17,18,19,20,21,22,23,24,25]. This implies that the existing research is still limited to the level of qualitative political and economic analysis [43,45,46], because they fail to fully recognize the significant change in China’s emission pathway caused by economic transformation.
To illustrate the latest characteristics of China’s carbon emission pathway during the economic transformation phase, a decomposition analysis has been conducted on China’s economic carbon intensity with the two-level logarithmic mean Divisia index (LMDI) method. Compared with existing studies, this article mainly focuses on the periodic characteristics of China’s carbon emission pathway and its gradual change between different phases so as to explore the relationship between China’s carbon emission pathway and its economic development. By doing so, we can identify the transformation impact not only from its latest performance but also from historical trends, which could confirm and improve our understanding of the latest characteristics in emission change.
The remainder of this article is organized as follows: Section 2 introduces the methodology and the data used in this study. Section 3 introduces the decomposition results from an overall and sub-factor perspective and highlights their relationships with the actual changes of each factor. Section 4 analyzes the periodic characteristics of China’s economic carbon intensity and their evolution since China joined the WTO. Section 5 provides a brief discussion.
2. Methodology
Econometric analysis and decomposition analysis are common tools for analyzing carbon emission pathways. Econometric analysis mainly focuses on the overall trend of carbon emissions over a relatively long period of time, but it is limited in analyzing short-term characteristics especially when the research object continues to change with high frequency, such as China’s carbon emission pathway after joining the WTO. Decomposition method, which can be subdivided into structural decomposition analysis (SDA) and index decomposition analysis (IDA), is a mathematical method with high accuracy, though limited in decomposition factors’ selection. To be specific, the SDA method, which is based on the input–output table, could be used to analyze the characteristics of emissions from both the demand side, including import and export and household consumptions, and the production side [20]. Nevertheless, due to the low updating frequency of China’s input–output table, the SDA method cannot reflect the annual trend and, therefore, can only be used for cross-section analysis. While, the IDA method is mainly used to analyze carbon emissions from the production side, its advantage is that the panel data can be used to conduct time series decomposition analysis with non-residual results. However, the LMDI decomposition method based on KAYA identity generally considers an even more limited number of factors, such as GDP, energy intensity (energy efficiency and economic structure), and energy structure [17,18,19,20,21,22,23,24,25].
As this research focuses not only on the overall trend of China’s carbon emission pathway but also on the characteristics of different stages LMDI decomposition analysis in the IDA method is used to involve panel data for analysis. Since first used in 2003 [47], the LMDI method has been the most popular of the current IDA decomposition analyses, and more than two-thirds of studies have chosen this method [18]. LMDI studies vary from each other in their selections of decomposition targets (total emissions or emissions intensity), time period, and decomposition level because of their different research purposes, but there are not significant technical differences between the studies.
Specifically, the methodology adopted in this study is adapted from existing research [34]. Different from most existing studies, this study includes carbon emissions from household energy consumption. In order to accurately assess the impact of changes in the household sector (in addition to the commercial and service sector), where electricity accounts for the major proportion of energy use, the direct carbon emissions of energy conversion industries are regarded as the indirect carbon emissions of actual energy consumers. An amount of emissions is assigned to each customer according to the proportion of the sectoral secondary energy use in overall domestic use. This adjustment also makes the study more focused on the impact of economic development or consumption pattern change on economic carbon intensity, rather than simply analyzing the emission reduction from the production side or the real emitting sectors. It should be noted that in this study, we have considered the revision of historical energy consumption data by China’s statistical authority in 2014, which has made our result differ from those of earlier studies.
In order to highlight the periodic characteristics of China’s carbon emission pathway, we have chosen to decompose the intensity, instead of the total amount, of carbon emissions. The decomposing factors include all three major categories—energy efficiency (EF), sectoral structure (SS) and energy structure (ES)—in addition to GDP. As there is no panel data about sub-sectoral added value in China’s official statistics currently, our sectoral decomposition only goes to the agricultural sector (AGR), the industrial sector—except for construction—(IND), the construction sector (CON), and the commercial and service sector (SER), without further detailed decomposition.
The energy-related CO2 emissions considered in this study consist of both the energy-related CO2 emissions on the production side and the household energy-related CO2 emissions , as shown in Equation (1):
Among them, the energy-related CO2 emissions of the production side can be further subdivided into CO2 emissions from the agricultural sector, the industrial sector (excluding the construction sector), the construction sector, and the commercial and service sector, as shown in Equation (2):
Divide Equations (1) and (2) by GDP to transform it into intensity, and we can get Equation (3):
where I refers to China’s economic carbon intensity and and refer to household energy-related emissions per GDP and the share of various sectors in China’s economic carbon intensity, respectively.
Learned from KAYA identity, energy-related CO2 emissions (EC) can be expressed as the product of GDP, the energy consumption per unit of GDP , and CO2 emissions per unit of energy consumption , which is expressed in Equation (4). Similarly, energy-related CO2 emissions in various sectors can also be expressed as the product of the sectoral added value , energy consumption per unit of added value , and the CO2 emissions per unit of energy consumption in Equation (5):
By building the simultaneous Equations (3) and (4), the share of each sector in China’s economic carbon intensity can be transformed into Equations (6) and (7) by KAYA inequality:
where refers to the sum of each sector’s share in China’s economic carbon intensity; refers to household energy-related CO2 emissions per unit of GDP; refers to sectoral added value over national GDP, which represents the share of various sectors in the national sectoral structure (); refers to various sectors’ energy consumption per unit of added value, which represents the energy efficiency of a sector (); and refers to carbon emissions per unit of energy consumption in a sector, which also represents the energy structure of a sector ().
Each sector represented by Equation (6) can be decomposed by LMDI method. Assuming the base year is 0, and for any time t from the base year (t > 0), the contribution of each sector to the change in the national economic carbon intensity compared with the base year can be written as:
In which:
where represents the contribution of a sector to the change in the national economic carbon intensity at time t compared with that at time 0; represents the contribution of the change in the share of a sector in the sectoral structure to the change in the national economic carbon intensity at time t compared with that at time 0; represents the contribution of the change in a sector’s energy efficiency to the change in the national economic carbon intensity at time t compared with that at time 0; and represents the contribution of the change in a sector’s energy structure to the change in the national economic carbon intensity at time t compared with that at time 0.
Sum up the decomposition results of each sector, and we can get the following:
The carbon intensity of the household sector is as follows:
All calculations involved in this study have been discounted at the constant prices for 2001. The data for the heating value, oxidation rate, and carbon content, which are used to calculate emission factors, are from Guidance for Greenhouse Gas (GHG) Emissions Accounting and Reporting issued by the Chinese government [48]. The rest of the statistics used in this study are from the China Energy Statistical Yearbook and the China Statistical Yearbook directly [3,49,50]. It is also assumed that the factors above and the carbon oxidation rates remain constant in the period of time selected in this study. It should be noted that in this study, the employed energy consumption data of the years 2000, 2005, 2010, 2012, 2013, and 2014 are the latest data as revised by China’s statistical authority, while the energy consumption data of the years 2001–2004, 2006–2009, and 2011 are modified based on the annual rate of change in old data.
3. Decomposition Results
3.1. Overall Effect
During 2001–2014, China’s GDP grew at an average annual rate of 11.6%, while after 2012, the GDP growth rate gradually dropped to 6–7% [3]. During the same period, the total energy-related CO2 emissions and the economic energy intensity demonstrated two opposite trends. Total carbon emissions kept rising during 2001–2014, with an average annual increasing rate of 5.3% and a total increase of 184.7% over 13 years. As for economic energy intensity, it had been declining except for a short but sharp increase in 2002–2003. China’s economic carbon intensity dropped to 216.25 MtCO2/Trillion Yuan in 2014 from 315.45 MtCO2/Trillion Yuan in 2001, with a decrease of 34.1%, equivalent to a cumulative reduction of 5561.74 million tons of CO2.
Although economic carbon intensity had declined, the dramatic growth of GDP had made China’s total carbon emissions increase rapidly. Such a growth accounted for the different changing trends of total carbon emissions and economic carbon intensity. In general, the contribution of the GDP increase to China’s total carbon emissions was in the range of 120–220% (taking the actual increase in the total carbon emissions during the research period as 100%) according to various decomposition studies on China’s total carbon emissions. The phenomenon indicates that economic development has always been a dominant factor in China’s total carbon emissions [18,19,20,21,22,23,24,26,27,29].
Nevertheless, in terms of economic carbon intensity, energy efficiency improvement became the dominant factor in the decrease in economic carbon intensity, with a contribution rate as high as 69.7% (taking the actual decrease in economic carbon intensity as 100%) during 2001–2014. This contribution is much higher than those of the sectoral structure (12.9%), energy structure (3.0%), and household energy consumption (14.4%). According to most of the existing decomposition studies on China’s total carbon emissions and economic carbon intensity, the contribution of energy efficiency improvement to changes in carbon emissions or economic carbon intensity was more than twice that of any other factor except for economic development [18,19,20,21,22,23,24,26,27,29,37], which is consistent with our conclusion.
From the sector-specific perspective, the industrial sector was the core sector affecting the change in China’s economic carbon intensity. The contributions of all industrial sector-related factors (industrial energy efficiency, industrial added value to GDP, and industrial energy structure) to the decrease in economic carbon intensity in 2001–2014 amounted to 61.8%. The overall contributions of the agriculture sector, the construction sector, and the commercial and service sector were 10.7%, 1.1%, and 12.0%, respectively.
Among all 13 fundamental decomposition factors, industrial energy efficiency was the most notable single factor contributing to the decrease in economic carbon intensity, accounting for 46.3%. The contributions of all construction-related factors were less than 2%, and the division of sectors in this study should account for the smaller contribution. The contribution of each factor to China’s economic carbon intensity change is shown in Table 2 and Table 3.
3.2. Energy Efficiency Effect
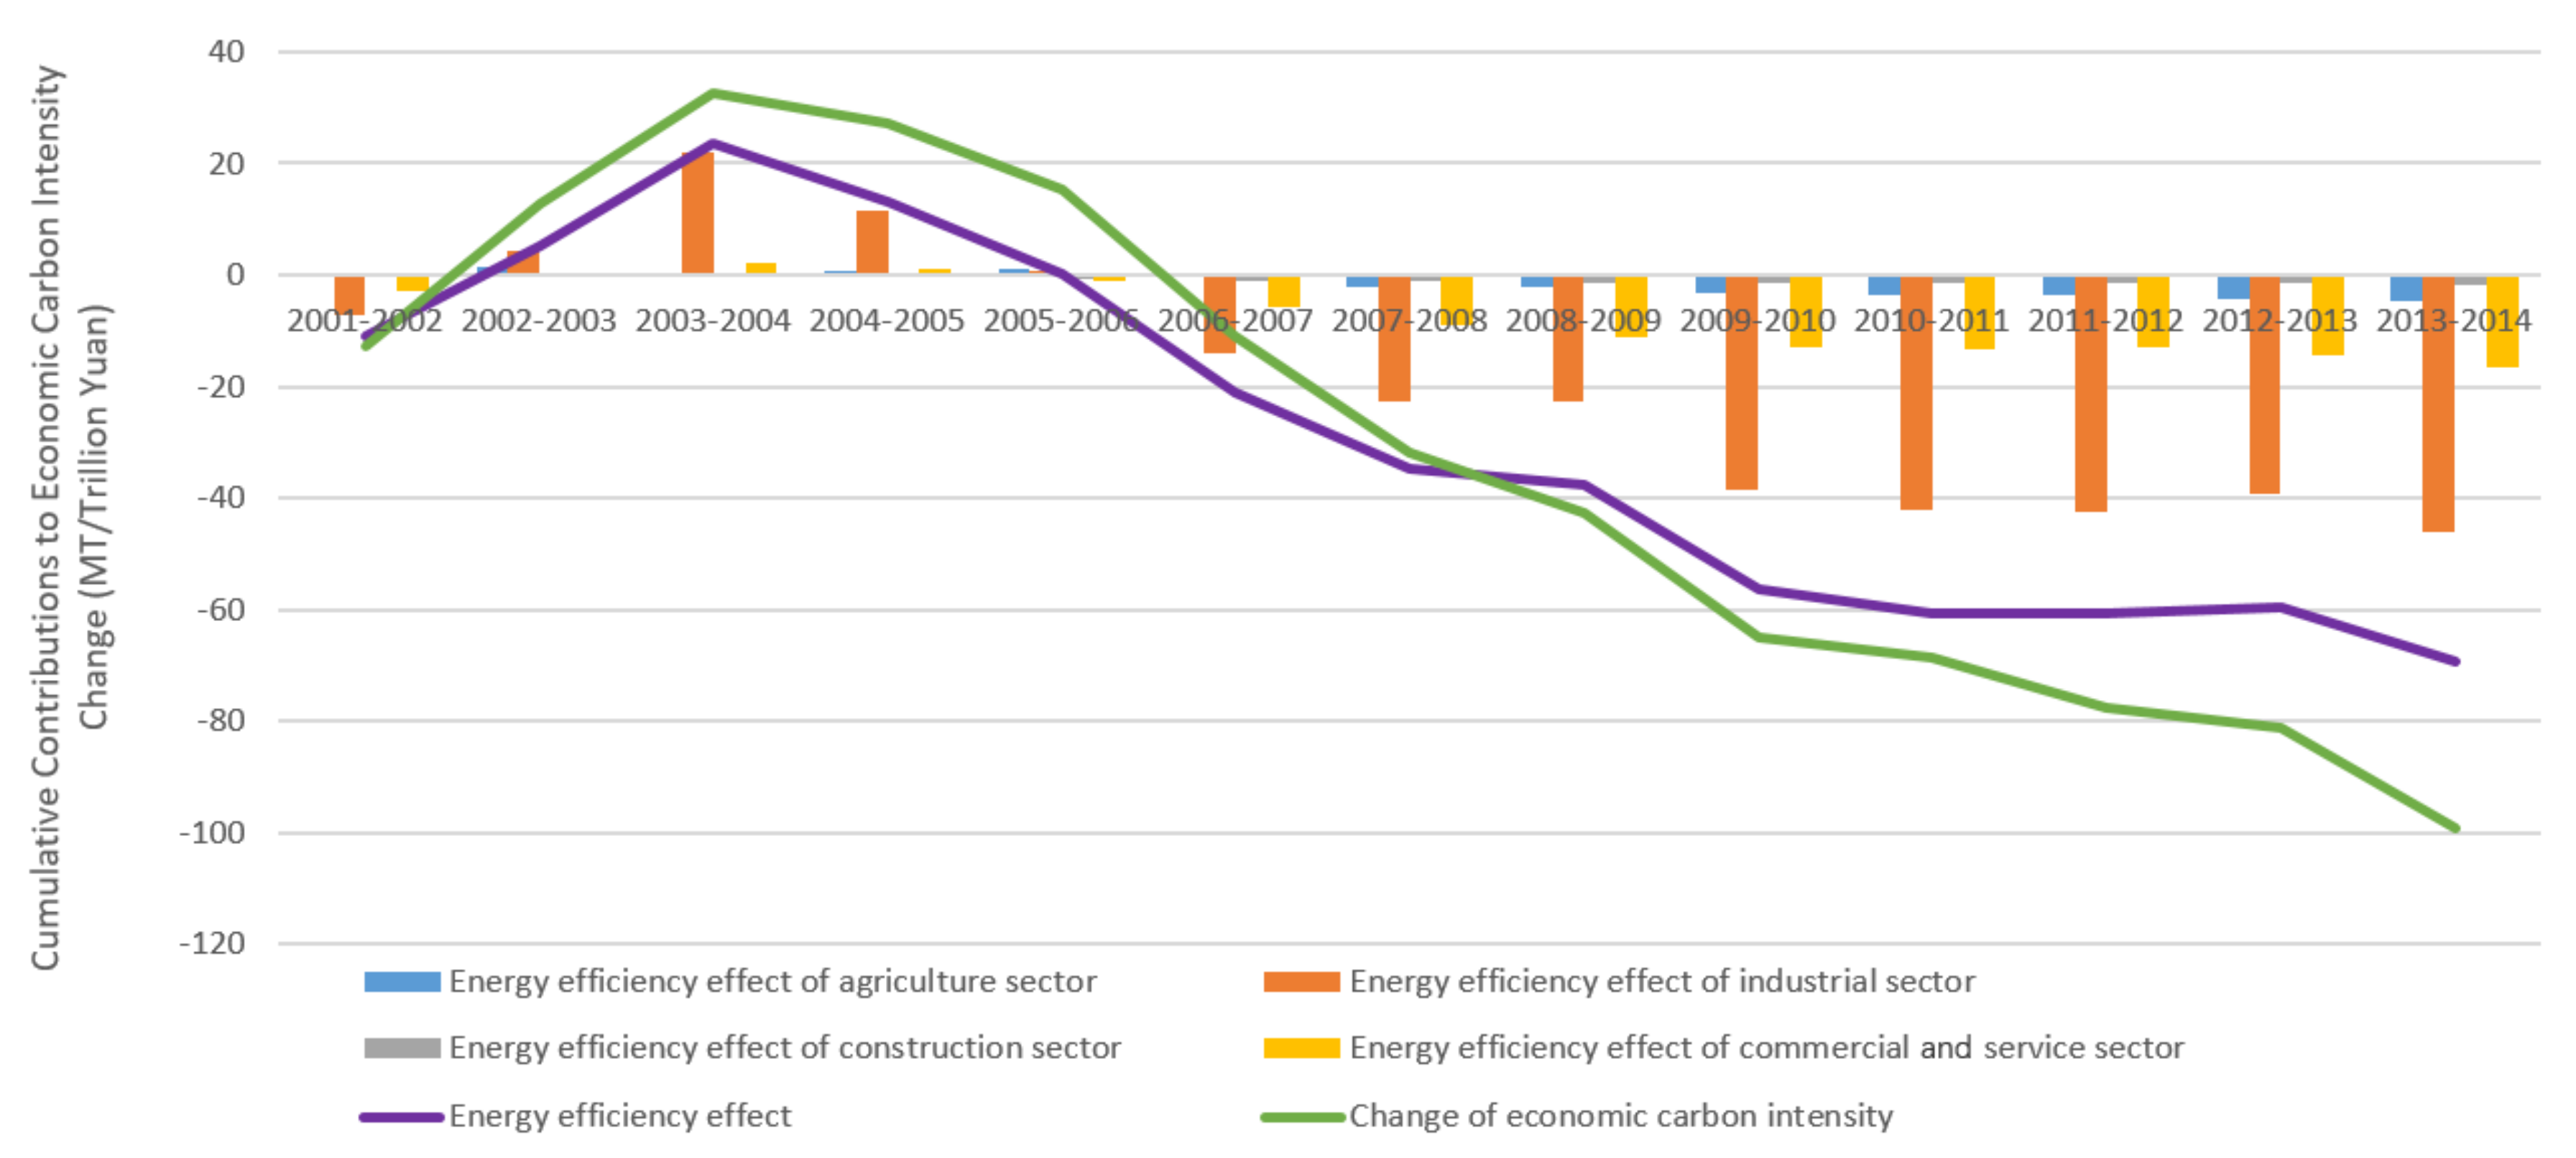
From 2001 to 2014, as shown in Figure 1 and Figure 2, the contribution of energy efficiency to the change in China’s economic carbon intensity ranged from −21.199 to +18.315 MT/Trillion Yuan (negative value represents the decrease in economic carbon intensity), presenting significant volatility embodied in the following aspects. Firstly, a rapid decrease in energy efficiency promoted the increase in economic carbon intensity in 2003–2004. Secondly, China has re-entered into the process of rapidly lowering economic carbon intensity led by the upsurge of energy efficiency since 2005. Thirdly, the contribution of energy efficiency suddenly dropped in 2009, influenced by the international financial crisis, but it recovered dramatically and reached its peak (absolute value) in 2010. Fourthly, the contribution of energy efficiency was again weakened after 2011, even exerting a negative effect on the decrease in economic carbon intensity in 2013.
In terms of sectors, the decomposition results show that the contributions of energy efficiency of the industrial sector (excluding the construction sector), the construction sector, and the commercial and service sector to the decrease in economic carbon intensity showed very high synchronization and consistency during 2001–2014. In addition, the change in China’s economic carbon intensity is generally consistent with the change om contributions of energy efficiency in all sectors except the agriculture sector.
To quantify the degree of the synchronization and consistency, a correlation analysis was used to examine and strengthen the findings. The results show that the Pearson correlation coefficients between any two factors of the energy efficiency of industrial sector (excluding the construction sector), the energy efficiency of the construction sector, the energy efficiency of the commercial and service sectors, energy efficiency as a whole, and the change in China’s economic carbon intensity are all above 0.6, and some are even as high as 0.9, as shown in Table 4.
3.3. Sectoral Effect
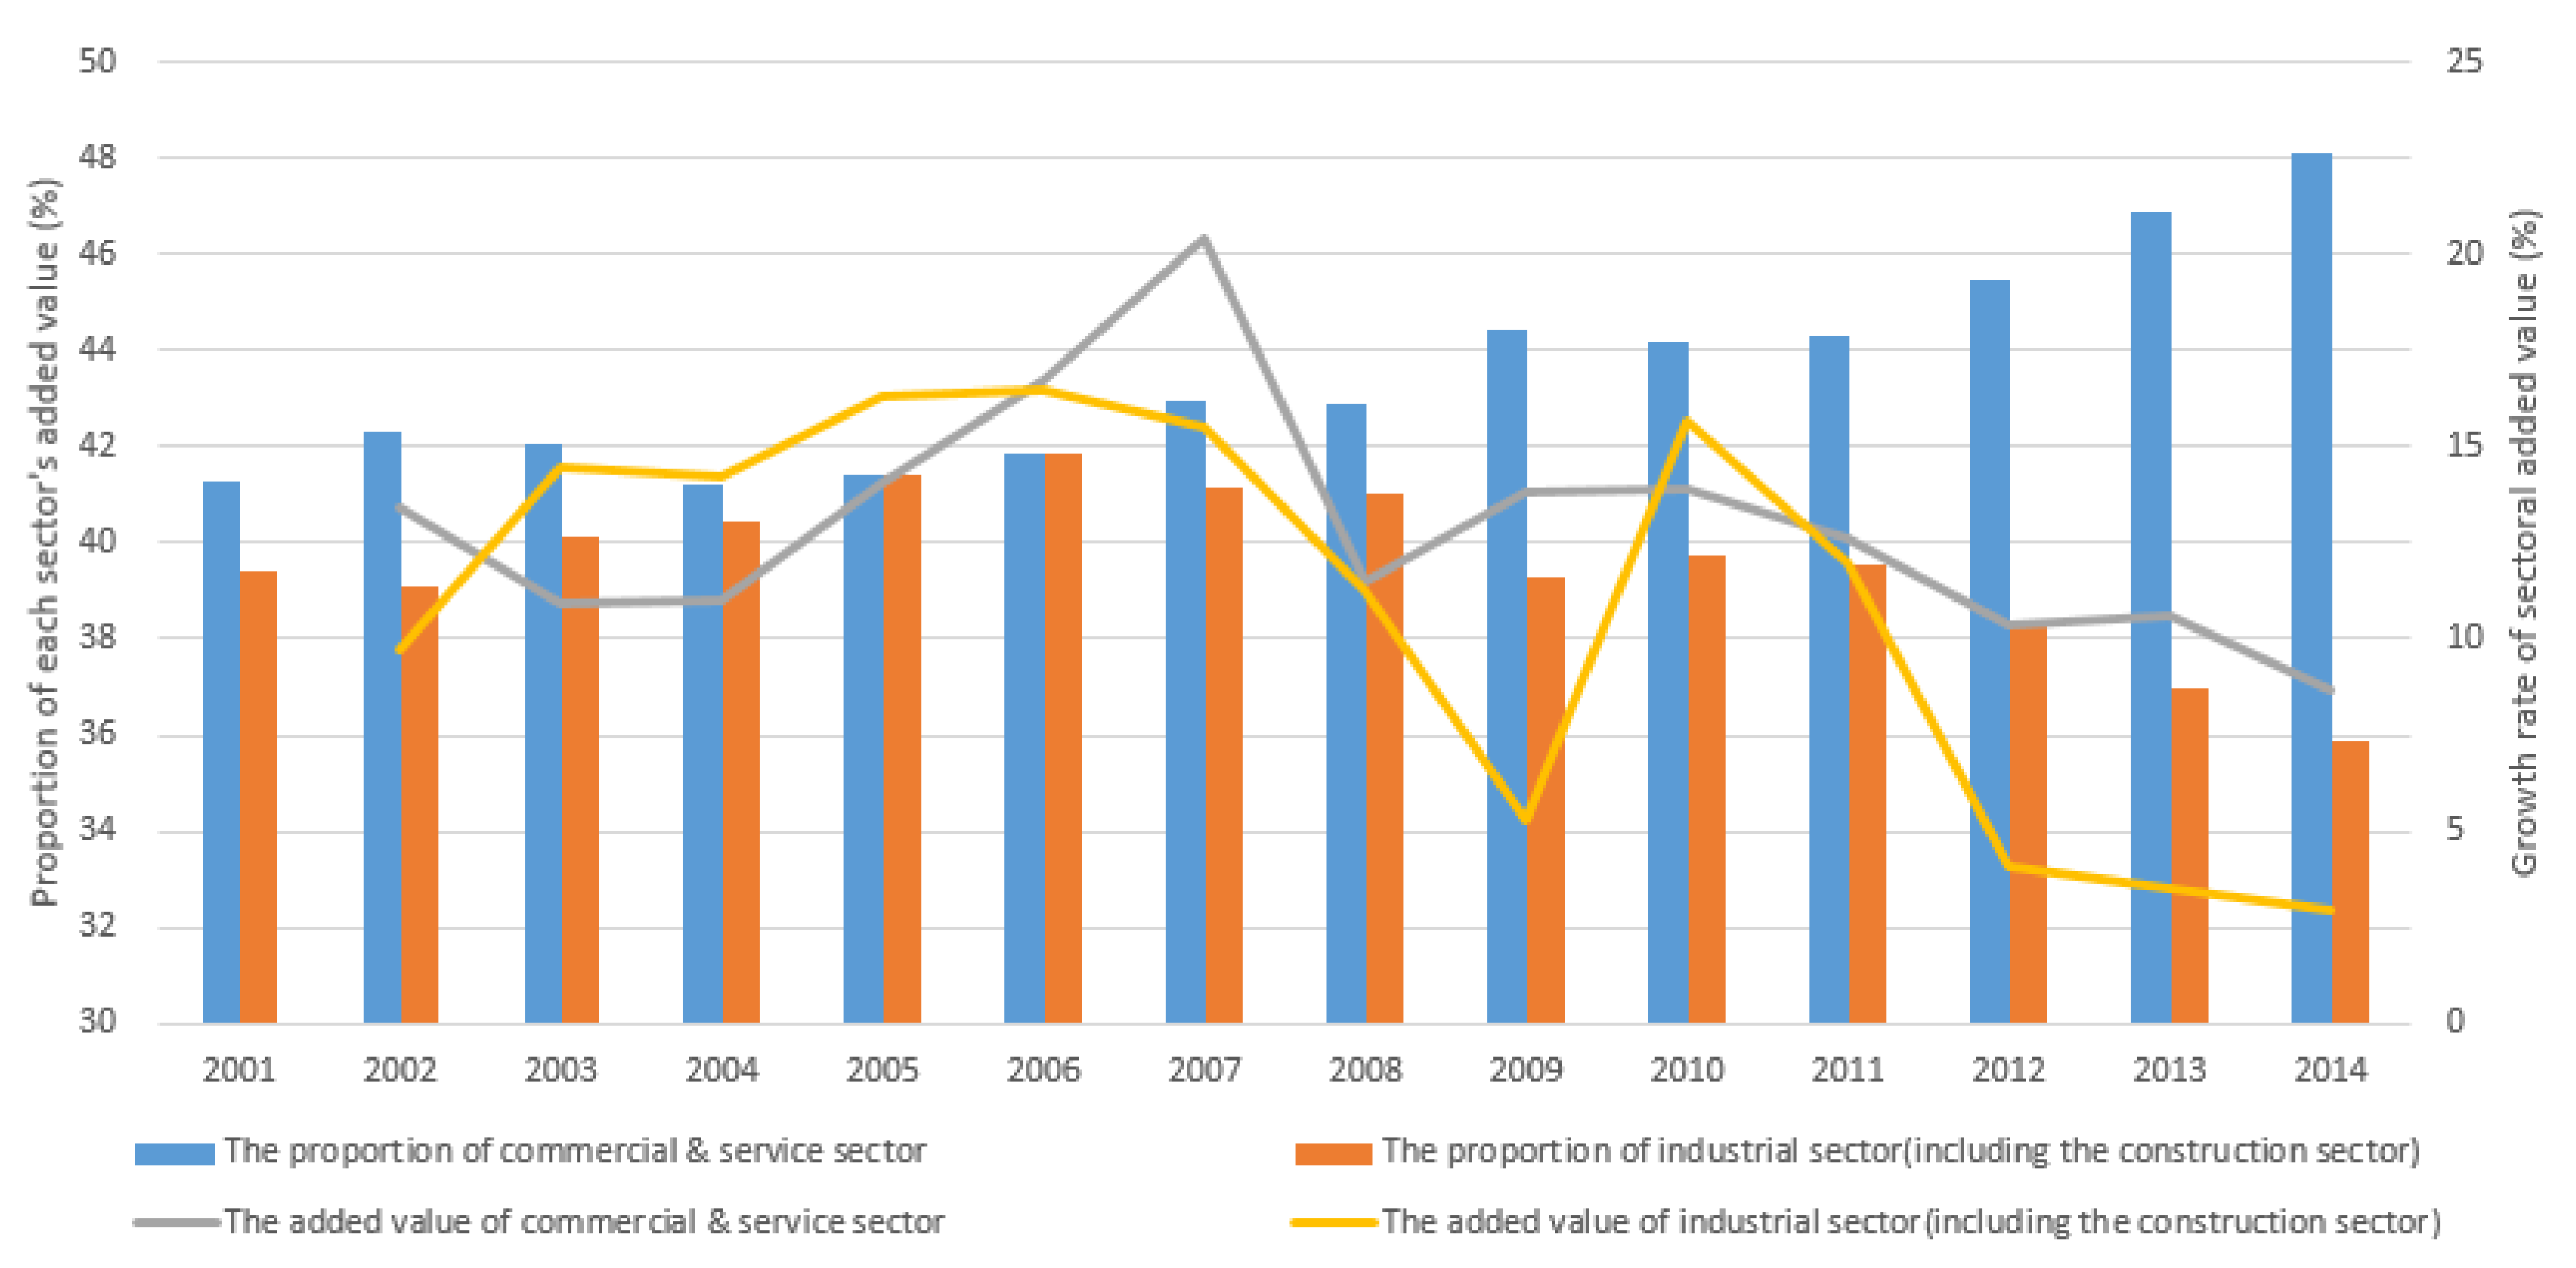
China’s sectoral structure change has undergone two phases in the new century, as shown in Figure 3. Firstly, since China’s accession to the WTO in 2001, a new round of rapid industrial development, especially in the heavy industry, which is characterized by export and capital expansion, led to a rapid increase in the industrial proportion in the sectoral structure after 2002. From 2002 to 2006, the proportion of the industrial sector (including the construction industry) increased from 44.7% to 47.3% but failed to grow further as international demand declined in 2007. Secondly, affected by the international financial crisis and China’s domestic economic transformation, the proportion of China’s service sector in the sectoral structure increased rapidly from 42.9% in 2008 to 48.1% in 2014, while the share of the industrial sector dropped to 42.7%. Yet, there was no significant change in the share of industries during 2009 to 2011, which was closely related to the massive economic stimulus that China has implemented in 2009.
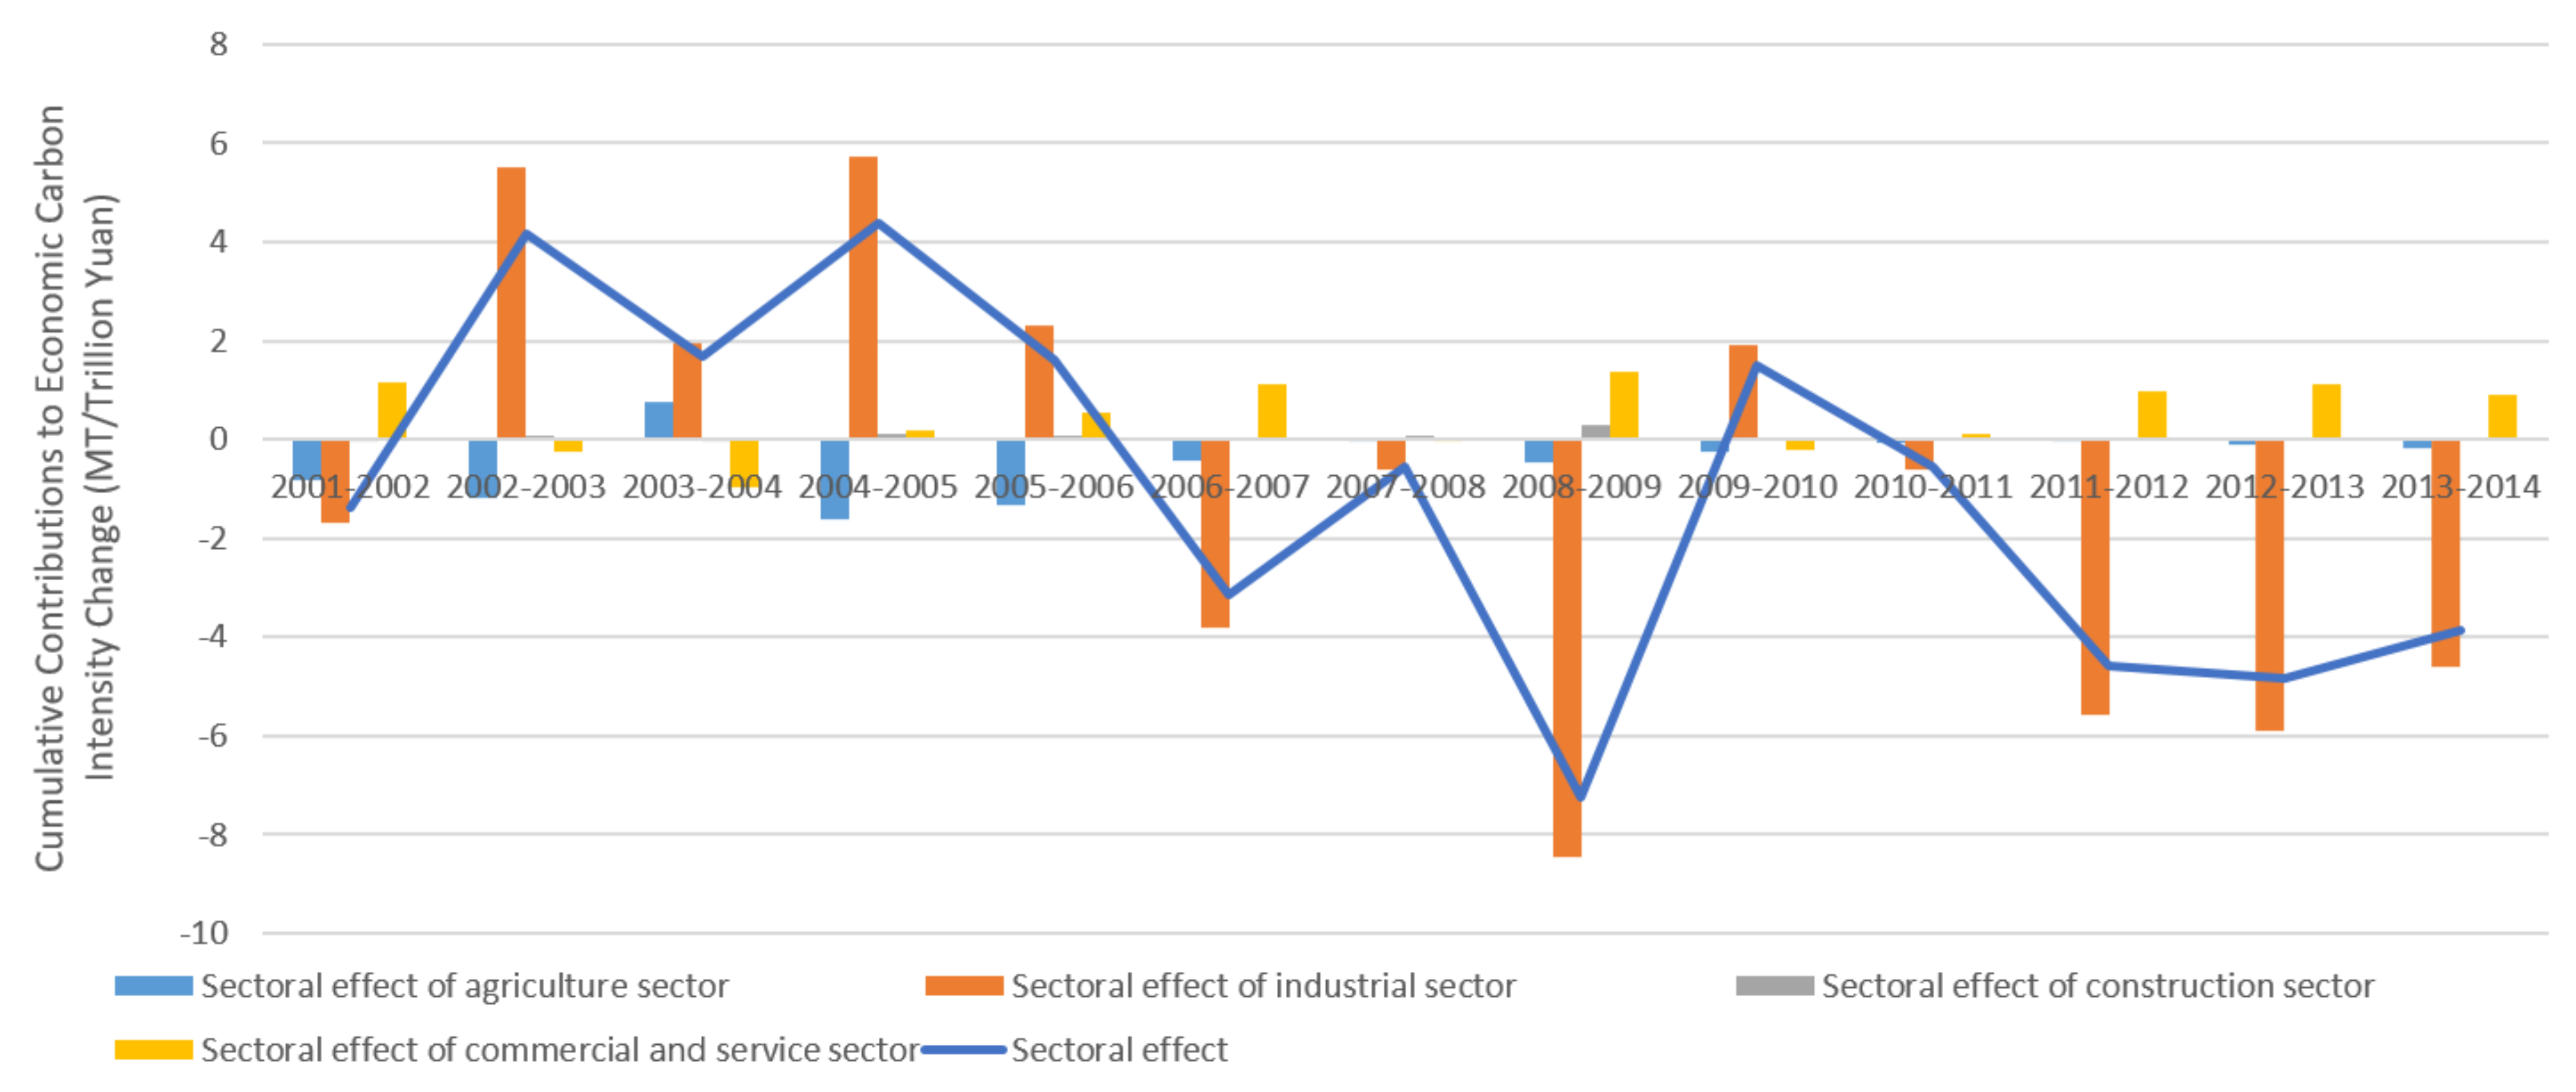
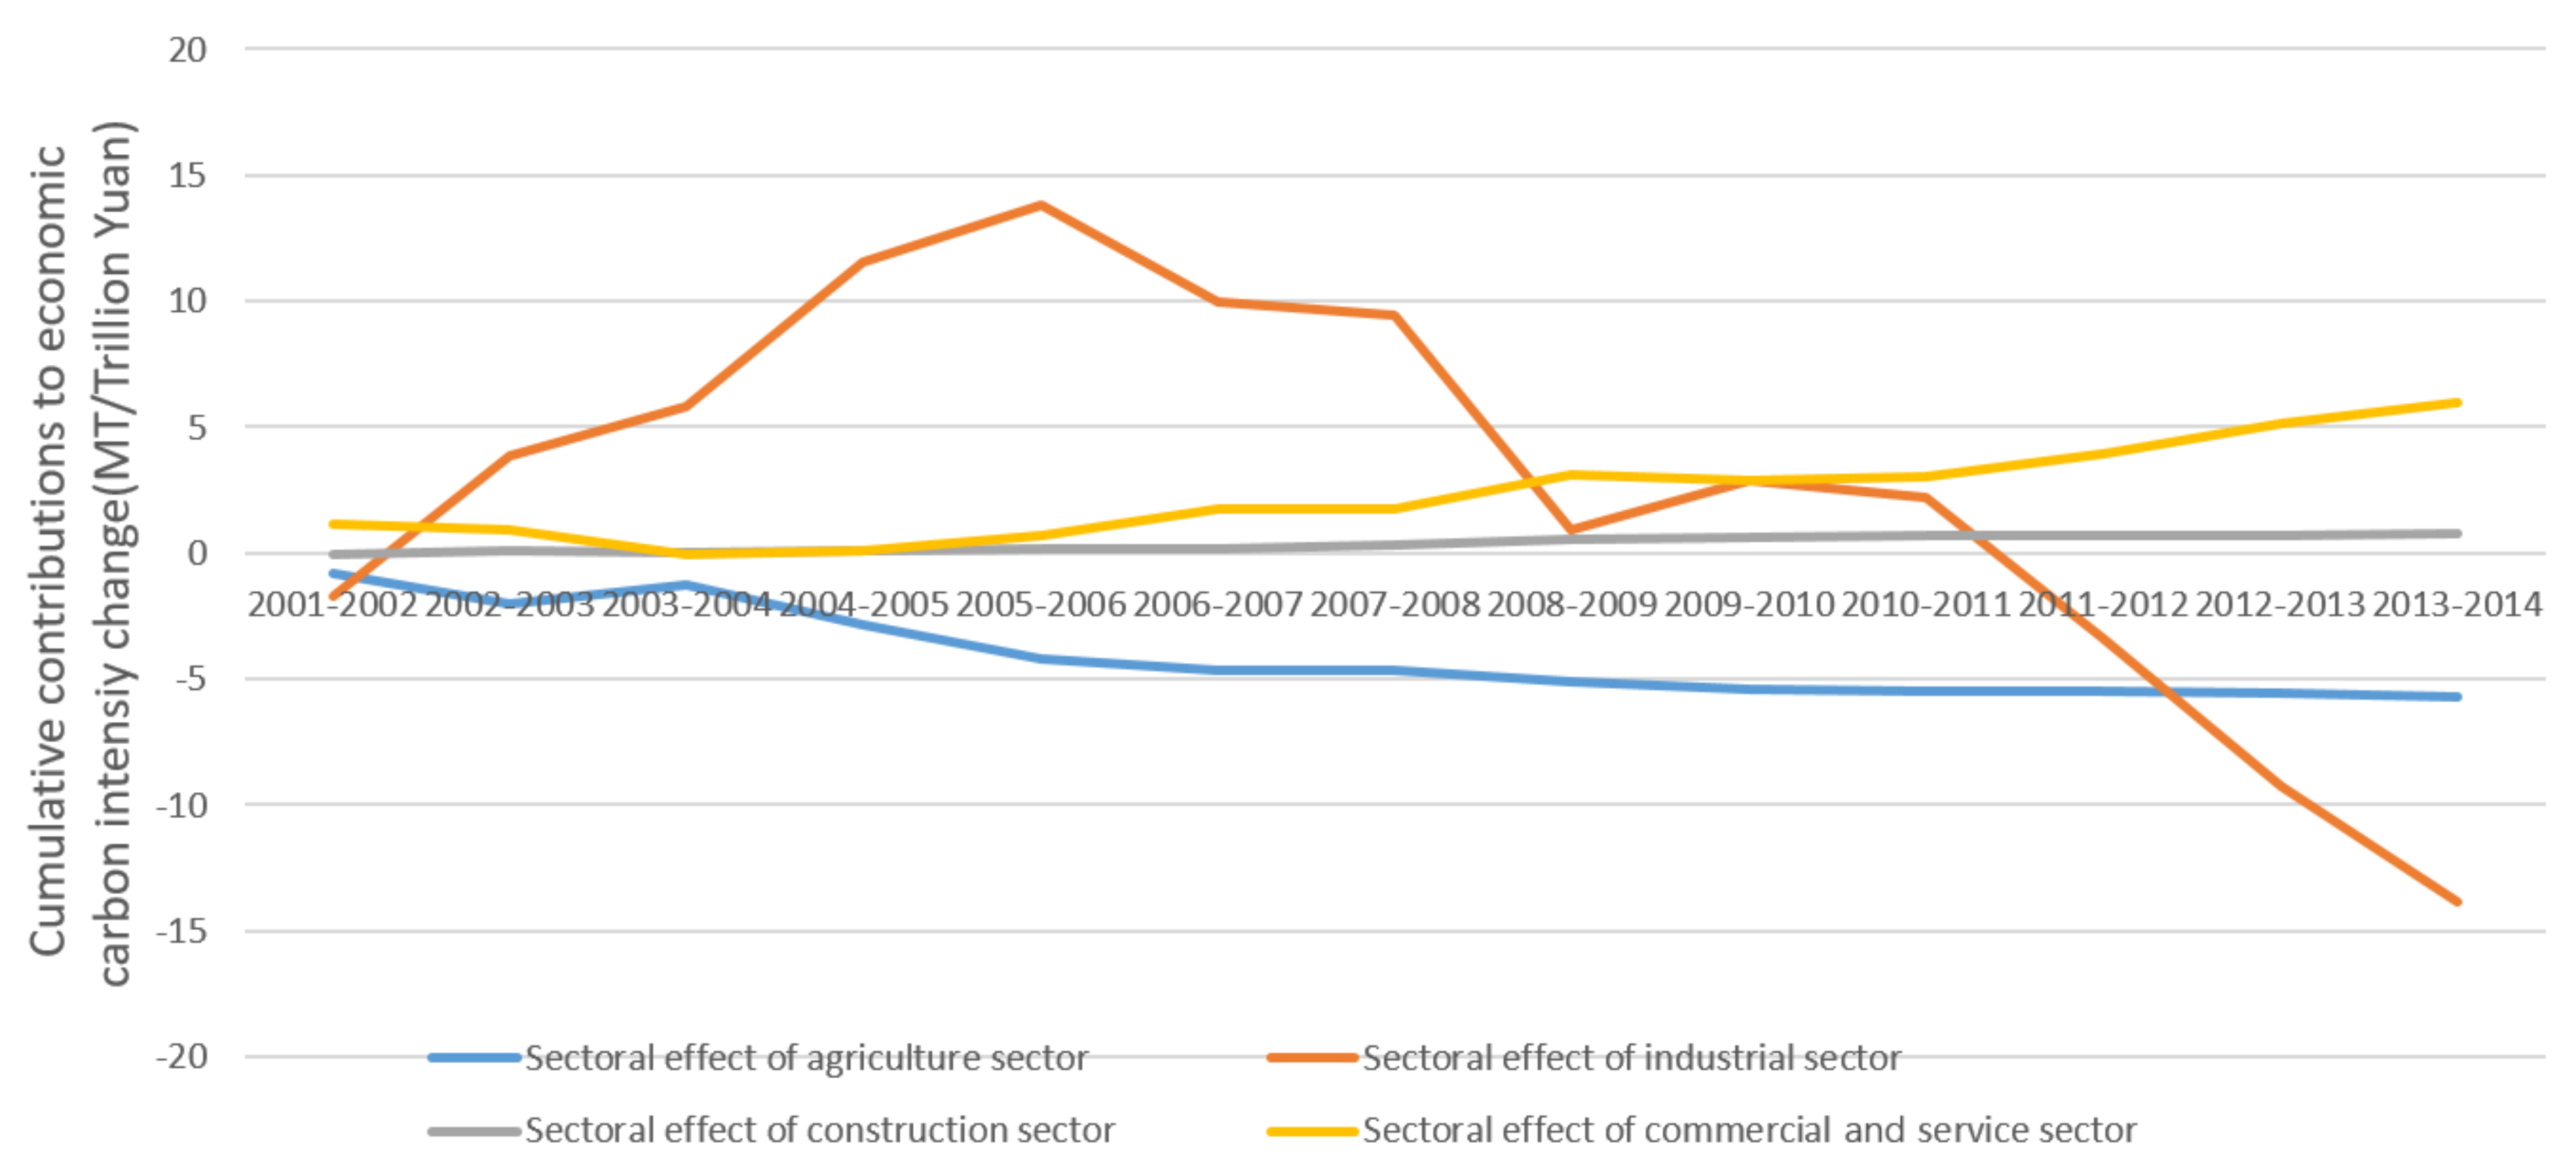
The contribution of the sectoral structure change to the decrease in economic carbon intensity stems from the difference in the industrial economic carbon intensity of the different sectors, with a higher share of low-carbon industries and a lower overall national carbon intensity. As the decomposition results show, the contribution of economic structure change to the decrease in economic carbon intensity mainly originated from the proportional change of the industrial sector in the sectoral structure. The specific changing process was highly consistent with the change in the share of the industrial sector, rising rapidly from 2002 to 2006, then falling quickly, only to recover slightly in 2010–2011. Moreover, before 2006, the proportional change in the agricultural sector exerted a great impact on the decrease in economic carbon intensity, but the annual contribution of that sector has declined dramatically since 2007. The contributions of the proportional change in the commercial and service sector and the construction sector showed a relatively stable trend, which only showed differences during 2003–2004 and 2010–2011 under the influence of the rising share of the industrial sector, as shown in Figure 4 and Figure 5.
3.4. Energy Structure Effect
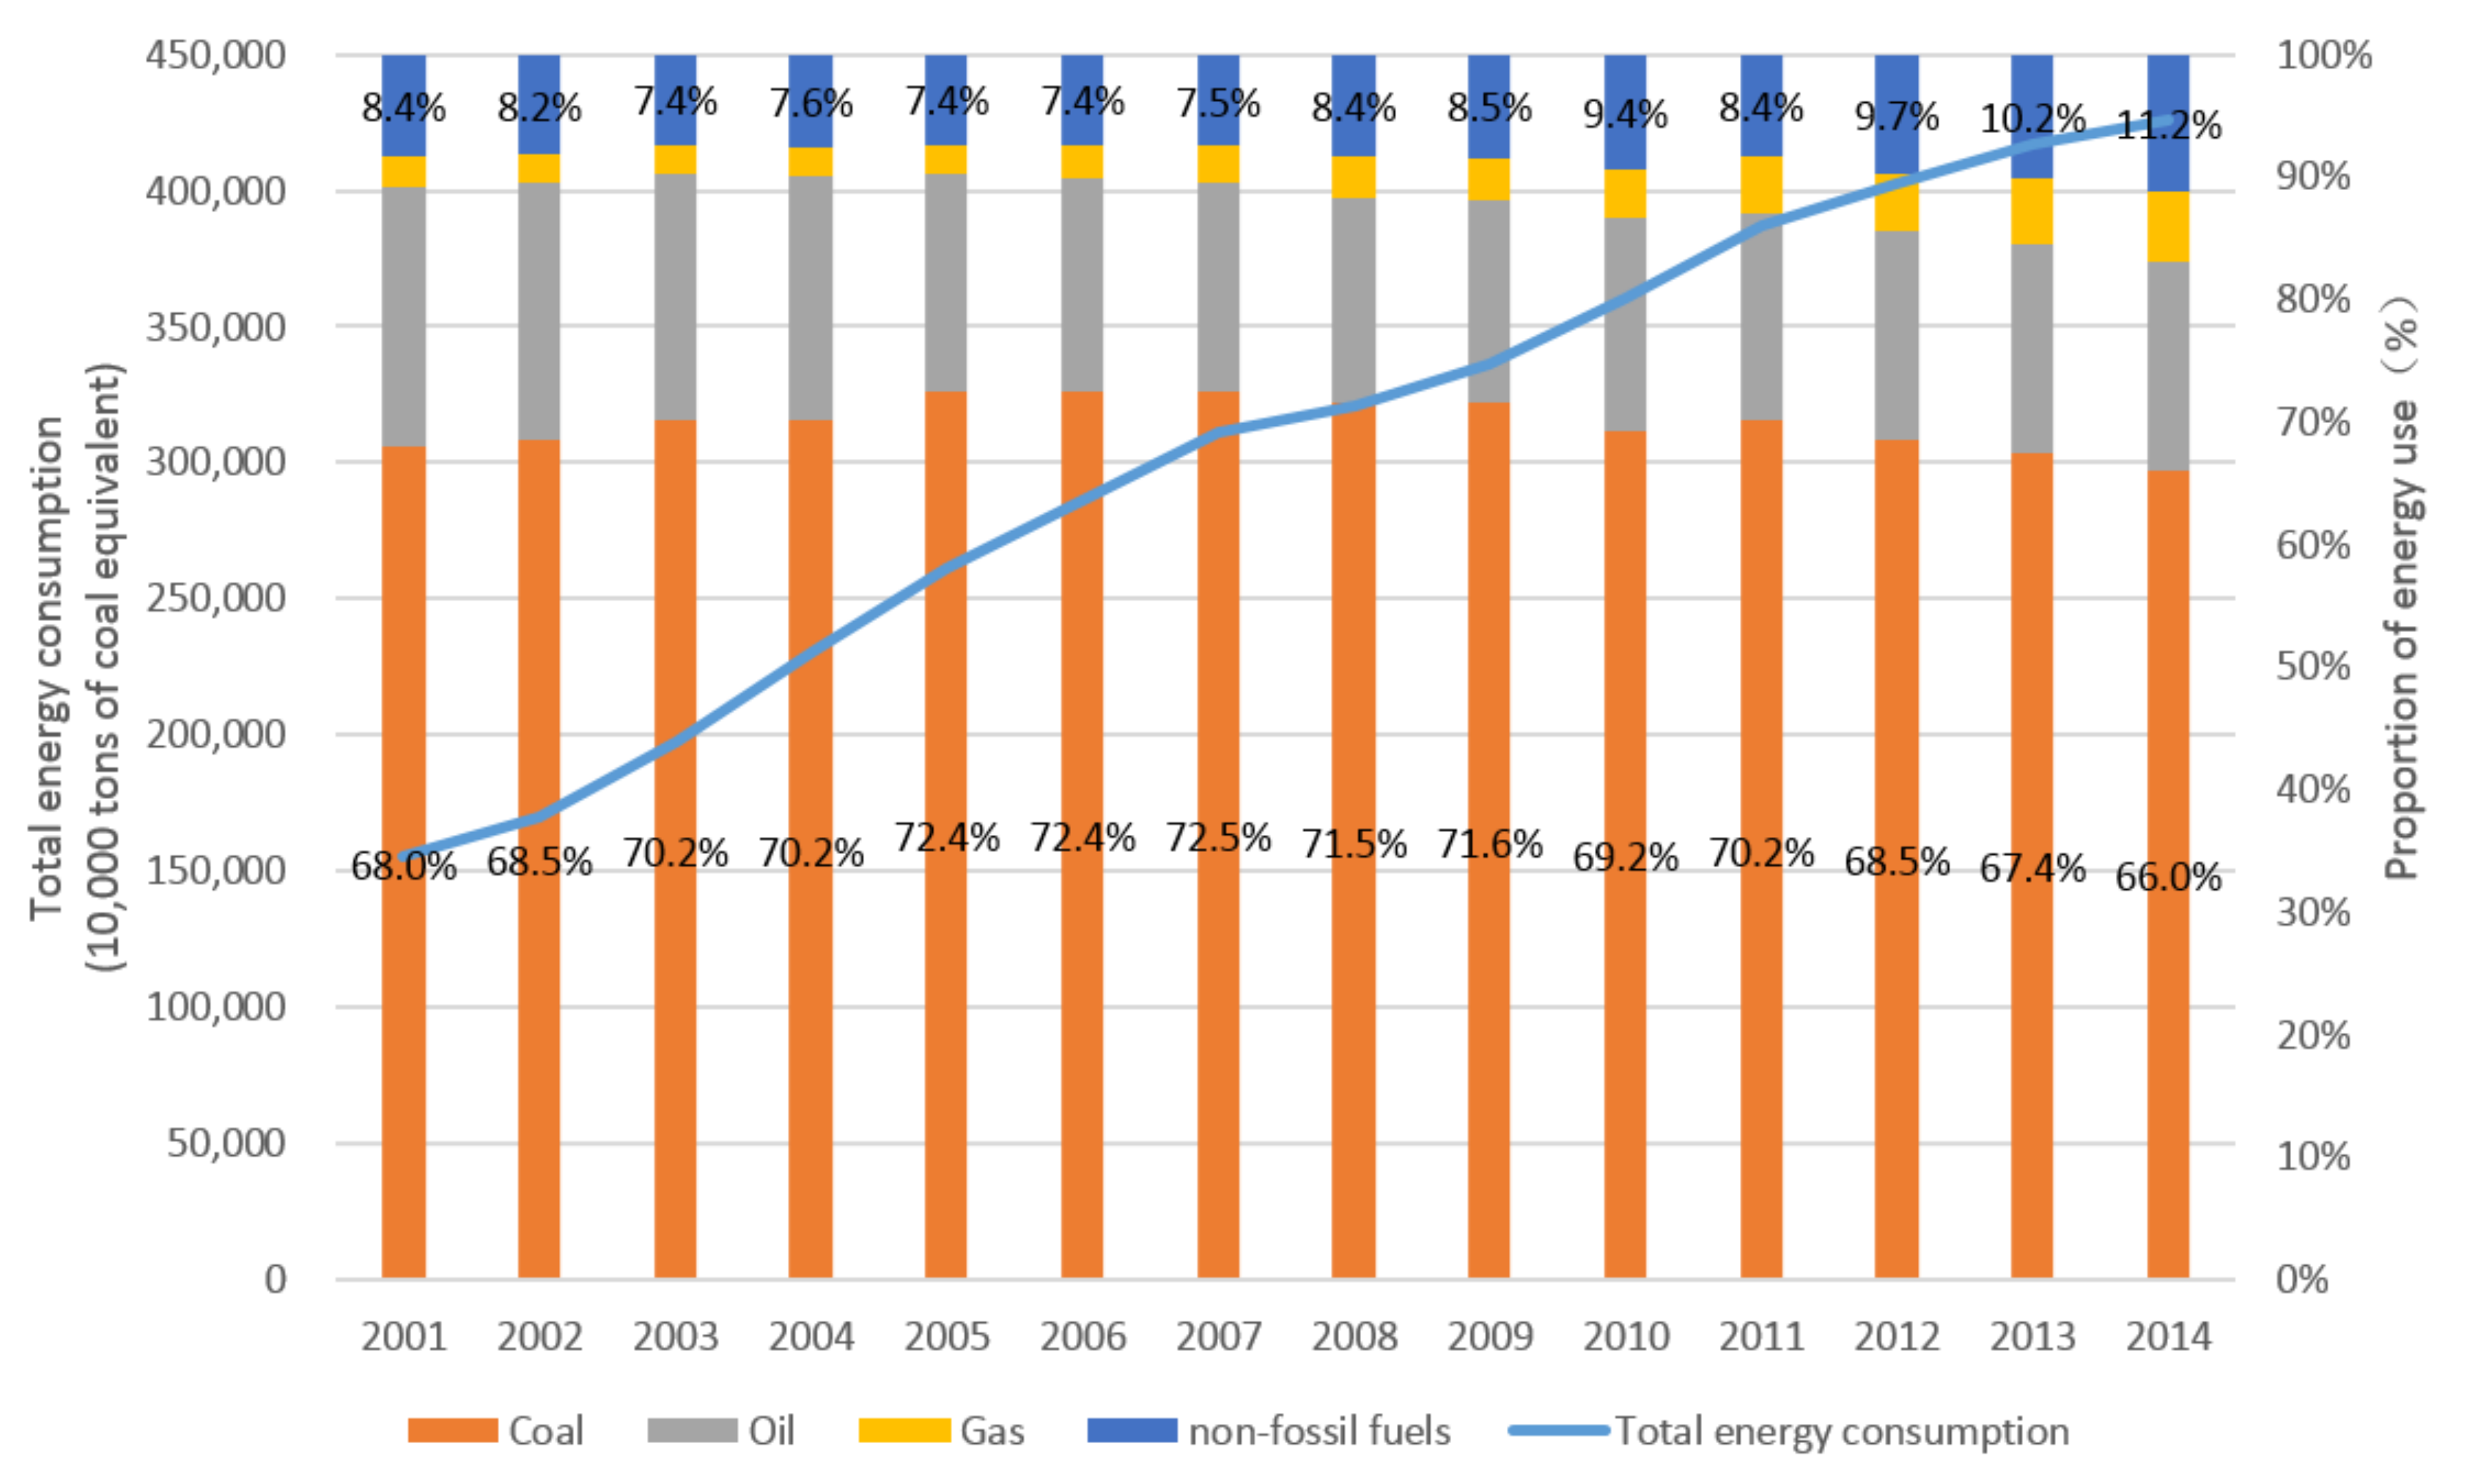
During 2001 to 2014, China’s total energy consumption grew rapidly at an average annual rate of 8.05% [3,50]. As shown in Figure 6, the change in energy structure can be divided into two stages: the carbonization phase in 2001–2007 caused by the increasing proportion of coal consumption and the de-carbonization phase in 2008–2014 affected by the increasing proportion of renewable energy consumption.
The proportion of coal consumption in China’s primary energy consumption increased rapidly from 68% in 2001 to 72.5% in 2007 and then gradually dropped to 66% in 2014. The share of non-fossil fuels dropped from 8% in 2001 to 7.4% in 2006, as the consumption of fossil fuels grew quickly along with the rapid development of the industrial sector, while it gradually increased to 11.16% in 2014. The share of oil and natural gas consumption in China’s primary energy consumption had continued steadily changing. Oil consumption dropped from 21% in 2001 to about 17% in 2014, and natural gas rose sharply from 2.3% in 2001 to 5.7% in 2014.
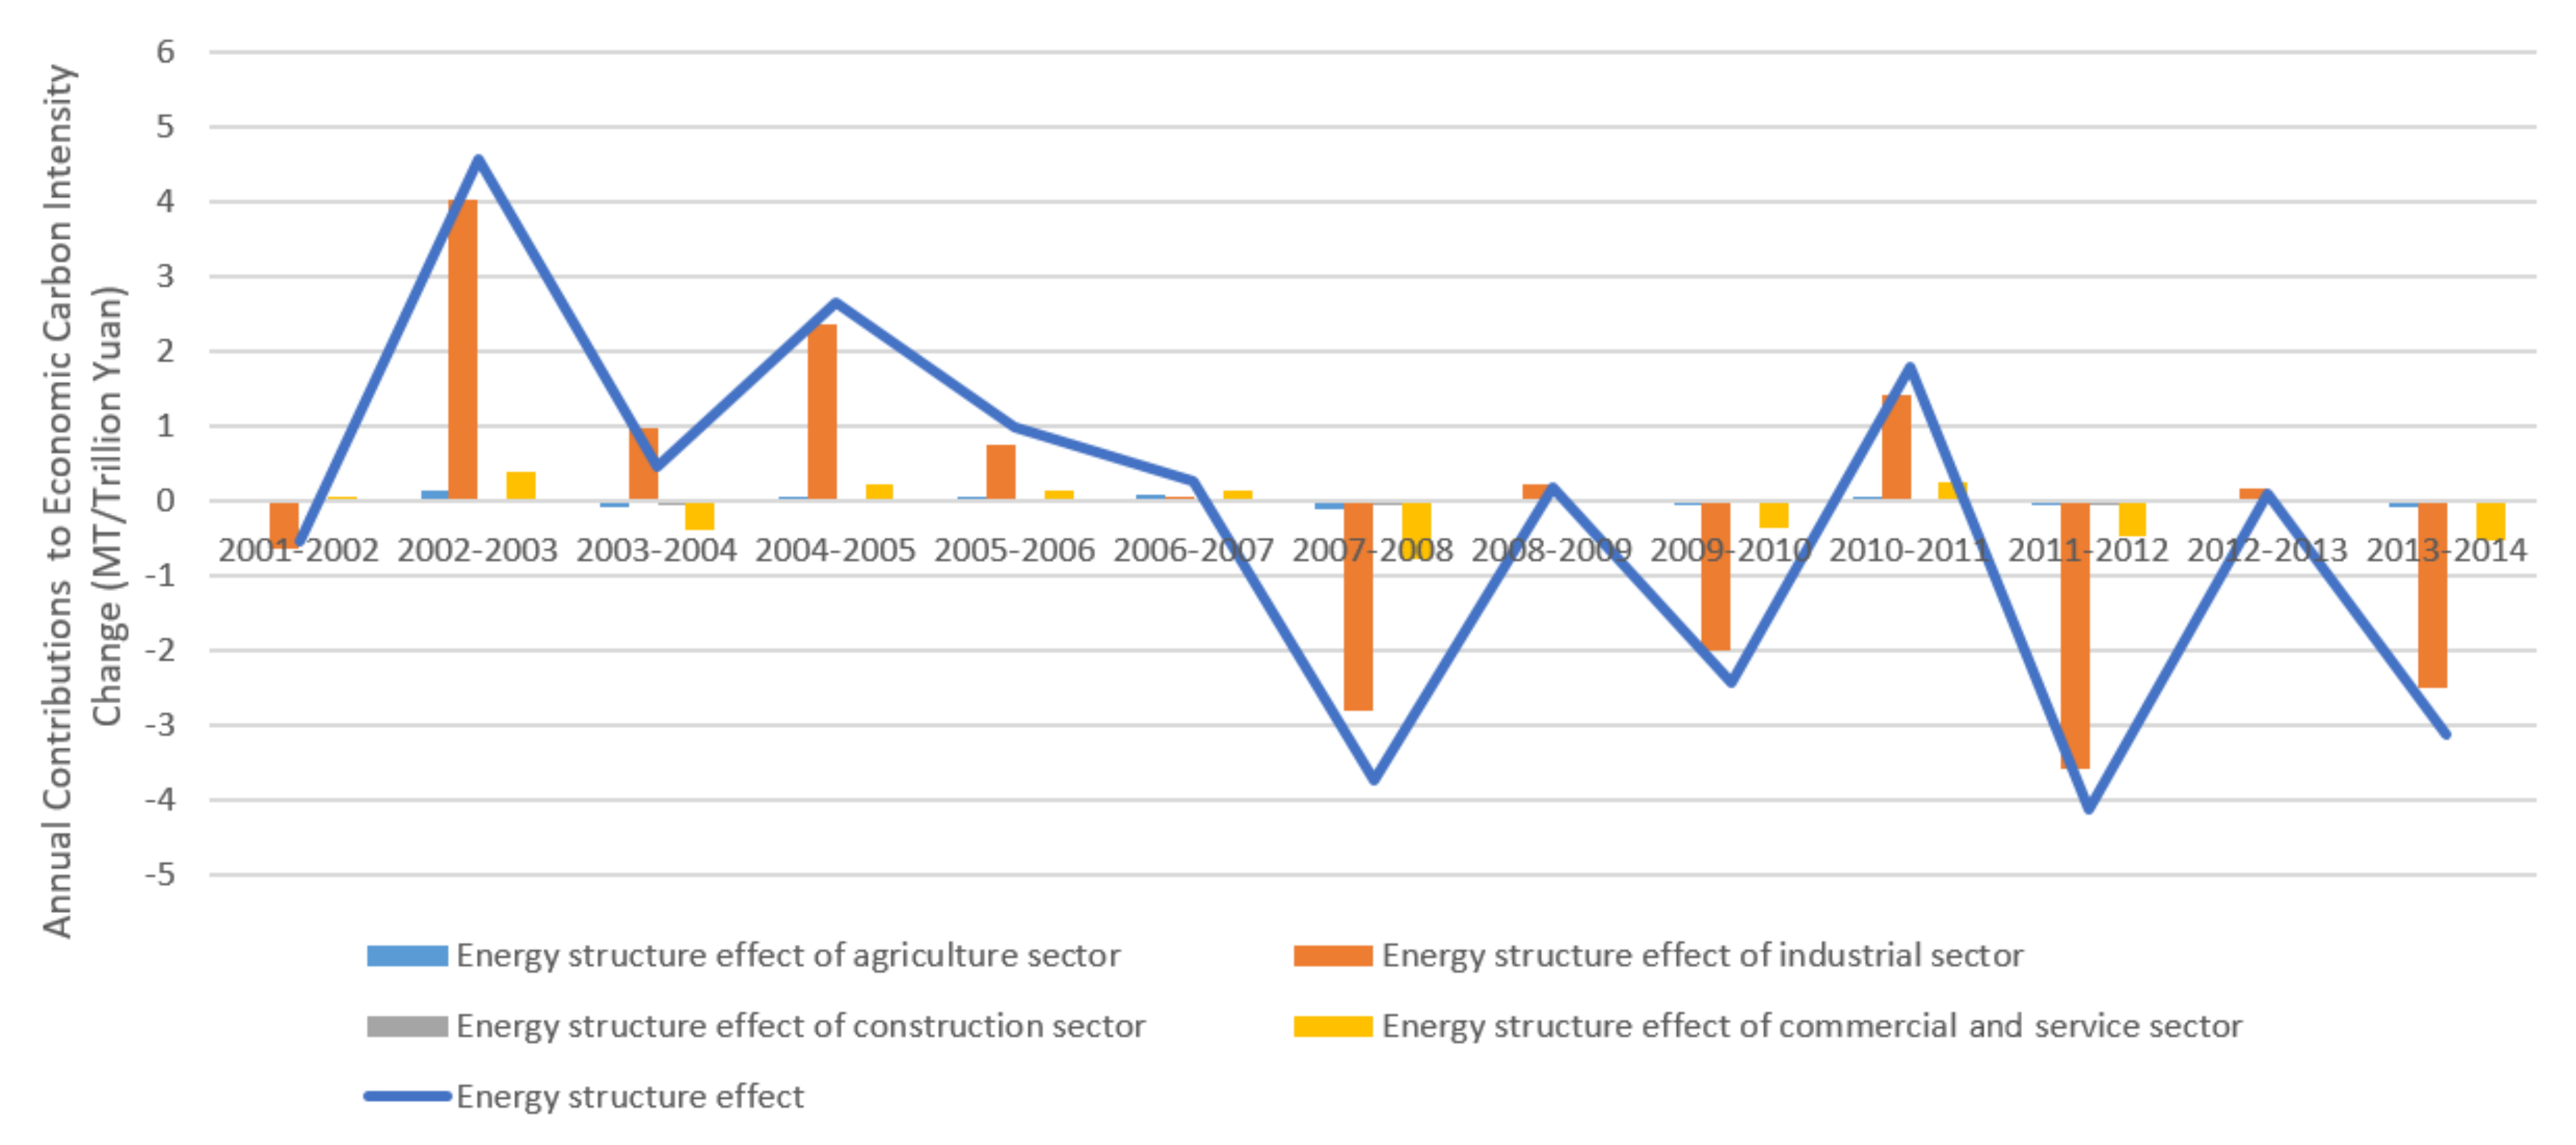
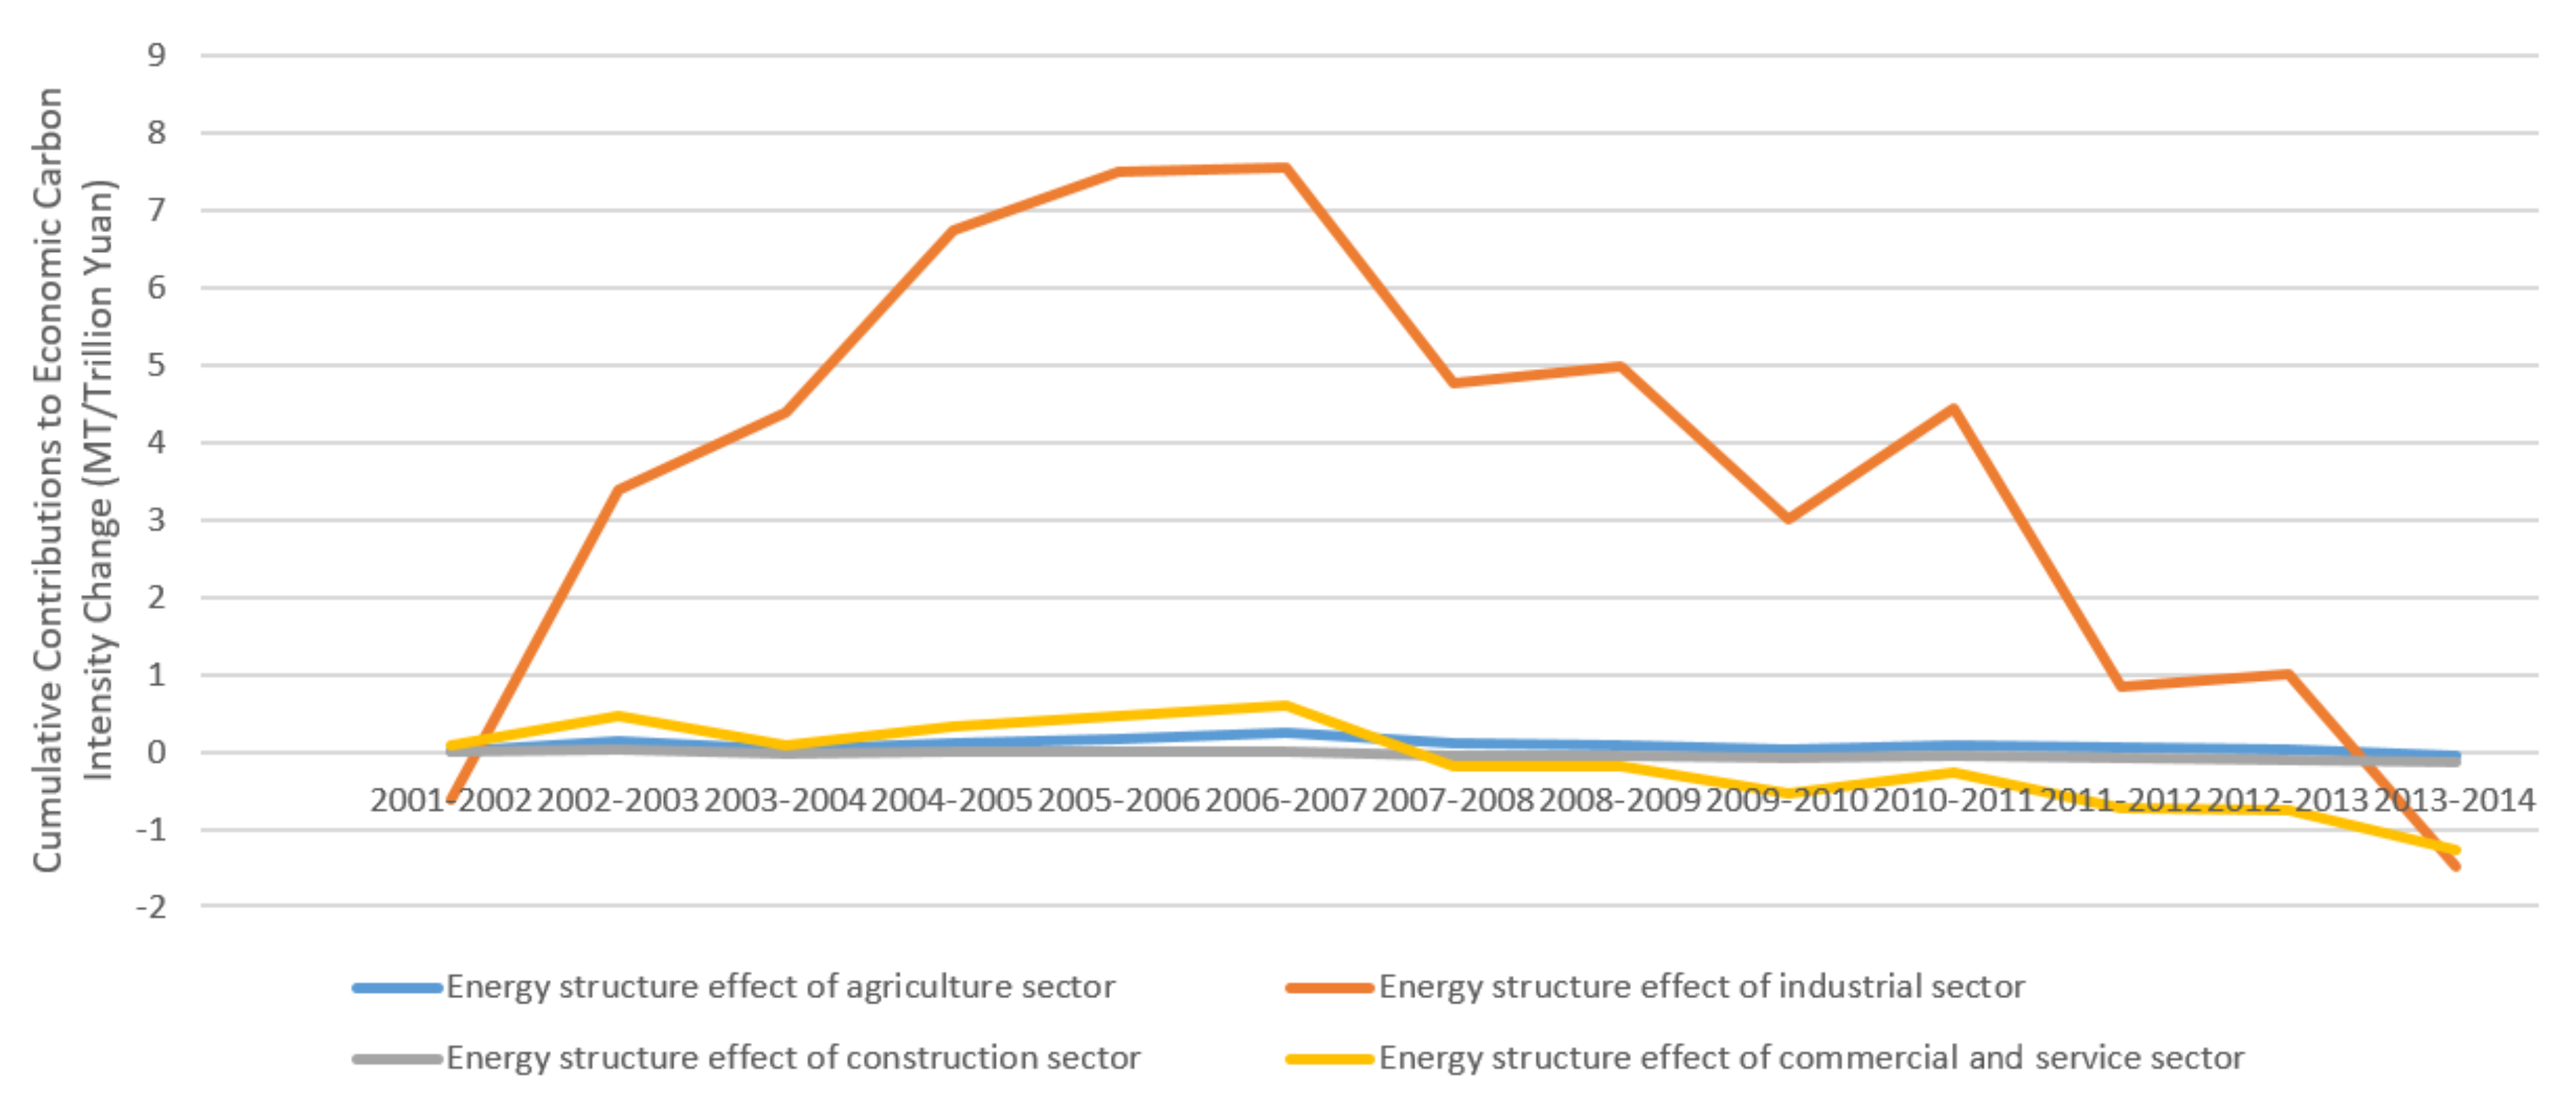
In terms of the contribution of the energy structure to the decrease in economic carbon intensity, the improvement of the industrial energy structure was still the core factor. As shown in Figure 7 and Figure 8, although the overall contribution of the energy structure was not significant in 2001–2014, the main reason was that the negative effect of energy efficiency on the declining economic carbon intensity in 2001–2007 largely offset the positive effect in 2008–2014. Even if the cumulative contribution of the energy structure peaked in 2007, it showed no fundamental increase in 2006. Therefore, it is assumed that the rapidly growing industrial sector before 2006 also influenced the contribution of the energy structure to the decrease in economic carbon intensity.
3.5. Household Energy Consumption Effect
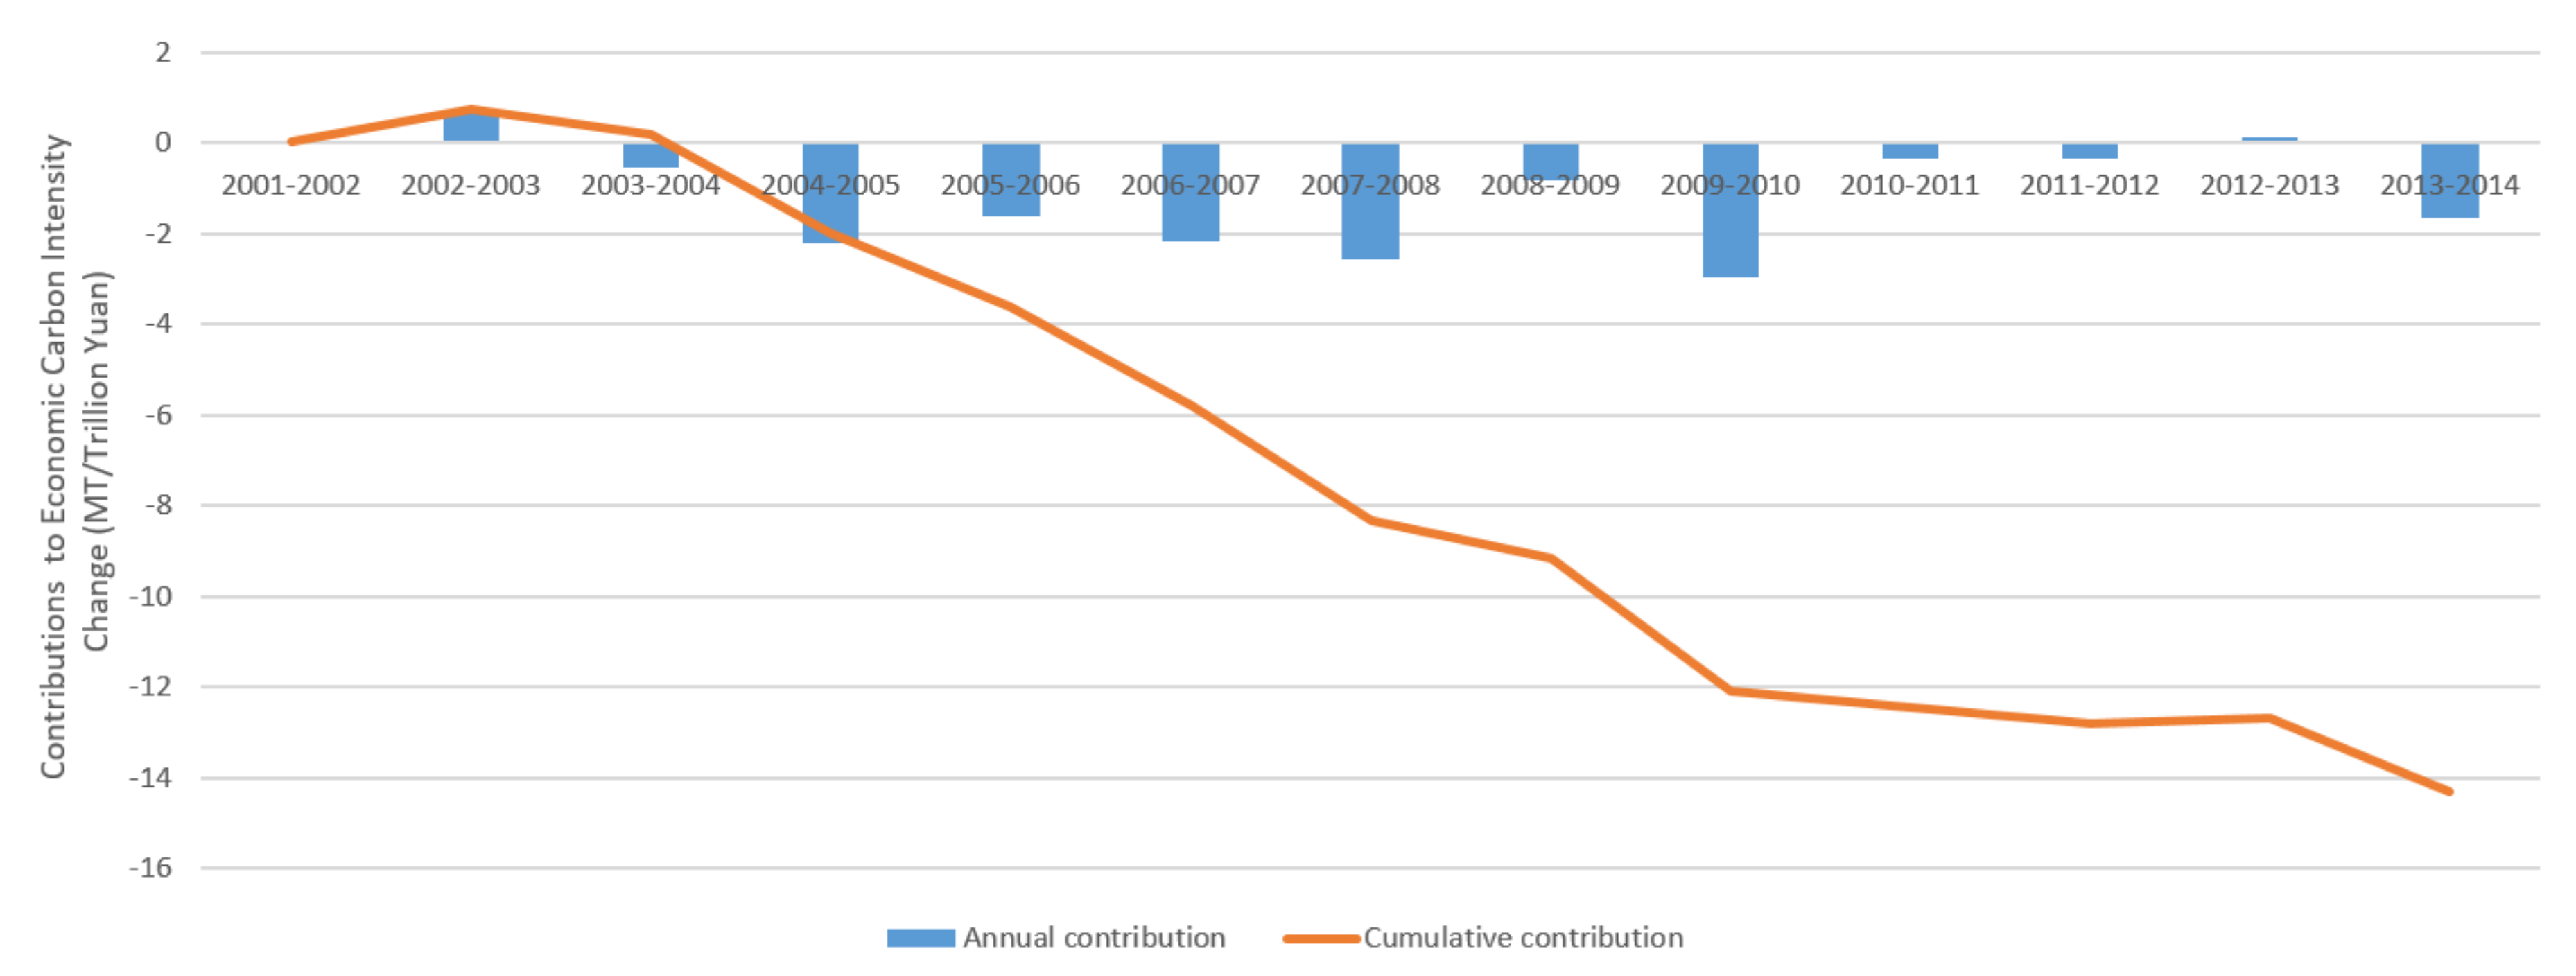
Compared with most LMDI studies, which considered the carbon emission only from the production side, we also consider the carbon emission from household energy consumption in this study. During 2001–2014, 9.86–12.1% of energy-related carbon emissions resulted from household energy consumption, which decreased initially and then went up.
Compared with other driving factors, in most years, the contribution of the household sector to the economic carbon intensity decrease was relatively stable, exerting a positive effect on the economic carbon intensity decrease. Therefore, the cumulative contribution of the household sector exceeded that of the economic structure and energy structure during 2001–2014, as shown in Figure 9.
4. The Periodic Characteristics of China’s Carbon Emissions
4.1. The Stage Division of China’s Change in Economic Carbon Intensity Since Its Accession to the World Trade Organization
Based on the decomposition results, the contributions of the major driving factors, including energy efficiency, sectoral structure, and energy structure, to the decrease in China’s economic carbon intensity showed great volatility during 2001–2014. Meanwhile, the fluctuations of the contributions were synchronized with several major economic events in the process of economic development in the new century.
First, China’s accession to the WTO at the end of 2001 stimulated the fast growth of China’s export-oriented industry. China was thus consequently faced with rapid ascents in total energy consumption, as well as fast growth of the share of the industrial sector in the sectoral structure and the proportion of coal use in the energy structure after 2003 [1,43]. As shown from the decomposition results, all the decomposition factors (energy efficiency, the sectoral structure, the energy structure, and household consumption) exerted noticeable negative effects on the decrease in China’s economic carbon intensity since 2003. The negative impact of the sectoral structure and the energy structure, however, lasted until 2006–2007, while the contribution of energy efficiency has suddenly turned positive since 2005. According to an existing study, the sudden change in the contributions of energy efficiency is largely due to the adjustment of the energy strategy at the end of 2004 [12]. Our result also supports this argument by tracking down those turning points in all sectors during the same year.
Second, hit by the international financial crisis in 2008, China’s economic growth rate dropped by about 3% compared with that in 2007 [3]. In order to promote economic recovery while ensuring social stability, the Chinese government put forward an ambitious economic stimulus package of four trillion Yuan RMB at the end of 2008, which brought about a temporary economic increase during 2010–2011 [3,43]. In terms of economic carbon intensity, there appeared unusual changes, which were chartered by the high frequency and the large range of changes in the contributions of industrial energy efficiency and the share of the industrial sector in the sectoral structure to the decline of economic carbon intensity in 2009 and 2010. Among the changes, the contribution of industrial energy efficiency decreased from 8.75383 MT/Trillion Yuan in 2008 to approximately 0 level (0.01032 MT/Trillion Yuan) in 2009 and then increased to 15.7662 MT/Trillion Yuan in 2010 at its peak between 2001 and 2014. Conversely, the contribution of the industrial sector proportion rose sharply to a peak of 8.46697 MT/Trillion Yuan in 2009 from approximately 0 level (0.5954 MT/Trillion Yuan) in 2008, but exerted a negative effect on the decline in economic carbon intensity (−1.910638 MT/Trillion Yuan).
Third, as the impact of the stimulus package gradually faded away, since 2012, China’s economic growth rate has slipped to 6–7% from more than 10% [3,43], while the development of export-oriented industrial sector was severely suppressed, and a serious overcapacity emerged [51]. In terms of economic carbon intensity, the contribution of industrial energy efficiency on the decline in economic carbon intensity has largely decreased since 2012, even exerting a negative effect in 2013, which weakened the contribution of energy efficiency, the traditionally dominant factor. Since 2012, the contribution of shares of the industrial and service sectors in the sectoral structure to the decline in economic carbon intensity maintained stability with a relatively small volatility.
Thus, based on the major economic events addressed above, we can divide the process of change in China’s economic carbon intensity into three different phases after China’s accession to the WTO: 2003–2008, 2009–2011, and 2012–2014. Given the dominant position of energy efficiency in the economic carbon intensity, the contribution of which has decreased significantly since 2005, we can further divide the period of 2003–2008 into 2003–2004 and 2005–2008. It should be noted that the year right after the accession to WTO, 2002, is included in the previous stage, before the economic surge, because in terms of the changes in economic carbon intensity, the change in the sectoral structure led by the accession to WTO appeared in 2003.
4.2. Characteristics and Differences of Various Carbon Emission Phases
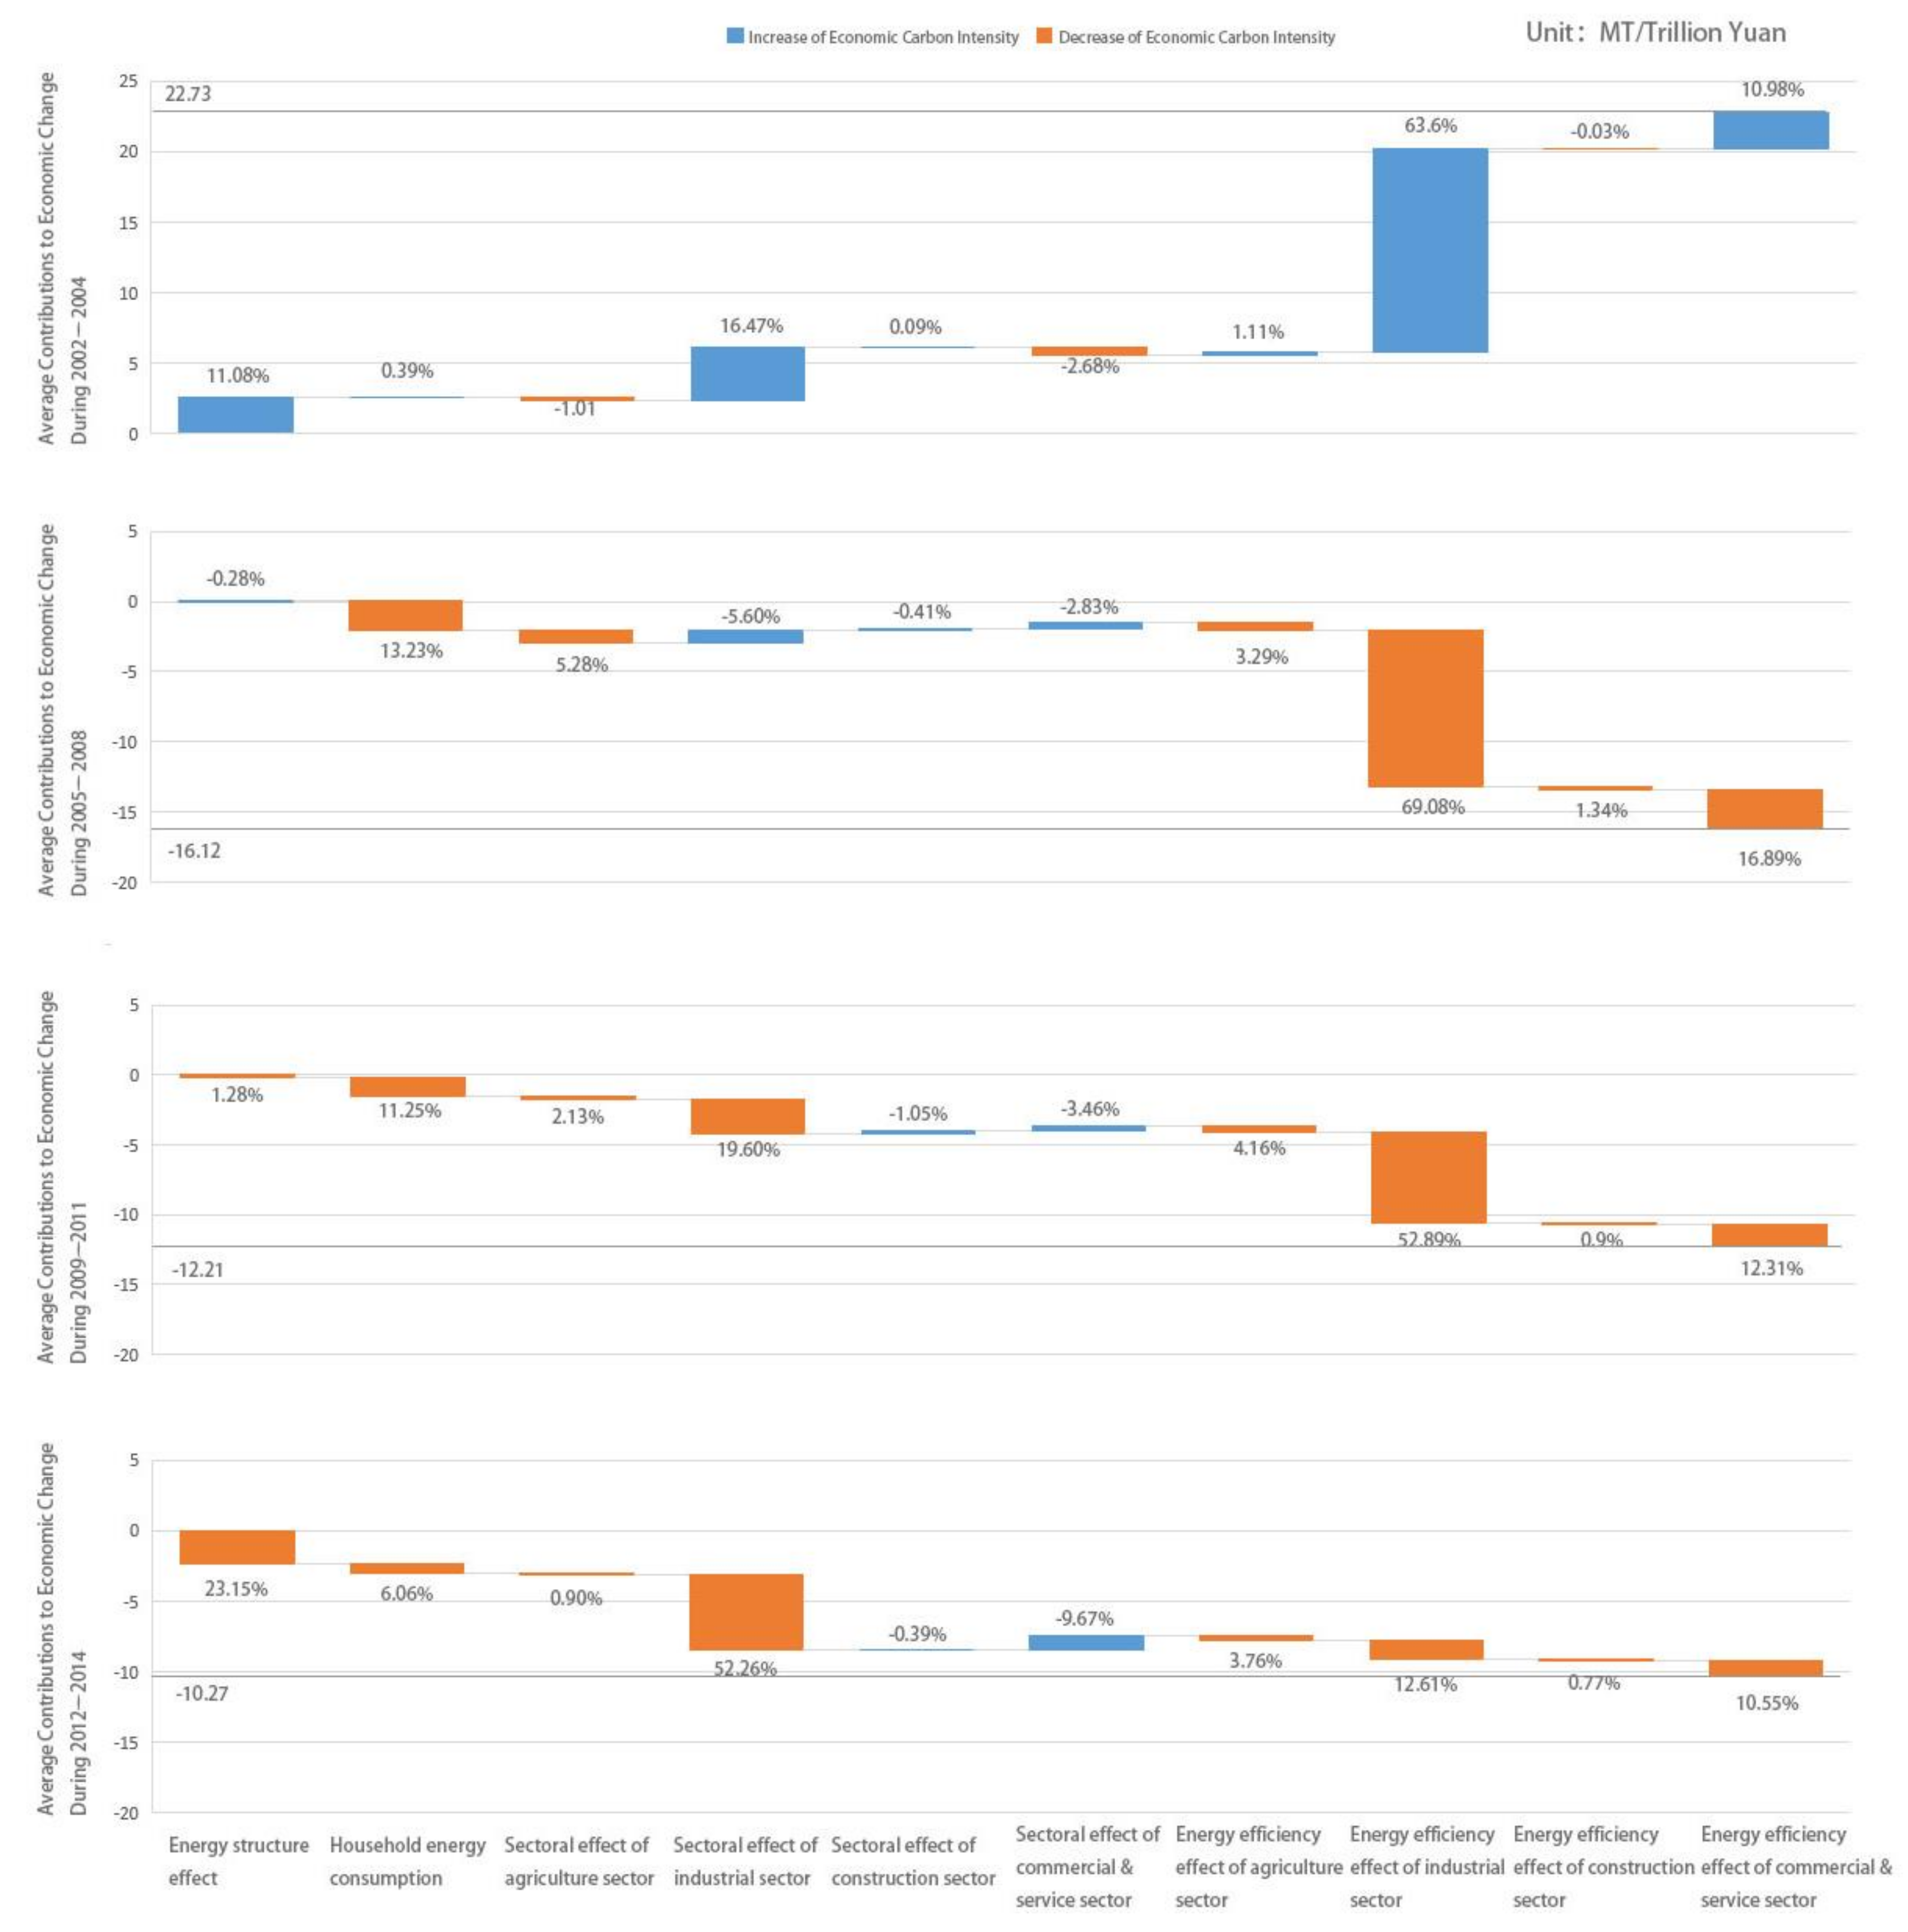
Considering the relationship between the volatility of the contributions of the major driving factors to the decline in China’s economic carbon intensity and the major economic events of the new century, the divisions of 2003–2004, 2005–2008, 2009–2011, and 2012–2014 not only possess strong, practical significance but could also smooth the volatility of the economic carbon intensity change to a great extent, so that the phase characteristics of China’s carbon intensity change can be seen more clearly, as shown in Figure 10.
The period of 2003–2004 was a period when the influence of China’s accession to the WTO stood out intensively. Compared with 2002, when the impact was not obvious, nearly all the major decomposition factors exerted a negative effect on the economic carbon intensity of China, which is the main characteristic of this phase. This caused a rapid growth of China’s carbon intensity in 2003–2004 at an average annual rate of 22.37 MT/Trillion Yuan (7.2% per year). The contributions of energy efficiency, the sectoral structure, the energy structure, and household consumption to the growth in China’s carbon intensity were 75.7%, 12.9%, 11.1%, and 0.4% respectively. The deterioration of overall national energy efficiency was the core reason for the increase in economic carbon intensity at this phase, which highlighted the environmental damage caused by fast industrialization.
The phase from 2005 to 2008 was a period when the industrial sector reached its peak after the growth period of the industrial boom after China joined the WTO. The contributions of energy efficiency and household consumption to the decrease in economic carbon intensity turned positive during this period, which is the main characteristic of this phase. It also enabled China’s economic carbon intensity to achieve a steady decline of 16.12 MT/Trillion Yuan per year and an average annual drop of 4.6%, even with a slightly increasing proportion of the industrial sector in the sectoral structure and coal in the energy structure. The contributions of energy efficiency, the sectoral structure, the energy structure, and household consumption to the decline in economic carbon intensity accounted for 90.6%, −3.6%, −0.3%, and 13.2%, respectively. Compared with the previous phase, energy efficiency still remained dominant, but shifted to the reverse direction. Thus, a balance between economic development and energy consumption/carbon emission was achieved during the process of industrialization.
The phase from 2009 to 2011 was a period when the Chinese government hedged against the international financial crisis with the massive economic stimulus package. The contributions of the major decomposition factors to China’s economic carbon intensity decrease showed swift and intense changes annually, which is the main feature of this stage. From the perspective of the stage average, however, most factors except the sectoral structure showed a relatively steady change. This was not expected because the international financial crisis exerted great impacts on China’s economic development. Such a finding may indicate that the short-term economic stimulus had effectively offset the impact of the international financial crisis on the Chinese economy and had guaranteed the continuity of economic development. During this period, China’s economic carbon intensity decreased by an average of 12.21 MT/Trillion Yuan at 4.3% annually, with only a slight decrease in terms of the changing rate. The contributions of energy efficiency, the sectoral structure, the energy structure, and household consumption to the decline in economic carbon intensity were 70.3%, 17.2%, 1.3%, and 11.2% respectively. Although energy efficiency was still the dominant factor, its contribution of had reduced in terms of both absolute value and proportion.
The phase from 2012 to 2014 was a period when the function of the massive economic stimulus package subsided, and the weak international demand gradually appeared. During this period, the average annual decline in China’s economic carbon intensity narrowed down to 10.27 MT/Trillion Yuan, with an annual decreasing rate of 4.2%. The absolute change in economic carbon intensity decreased obviously compared with the phases above, but the decreasing rate was approximately equal to the previous stage. The contributions of energy efficiency, the sectoral structure, the energy structure, and household consumption to the decline of economic carbon intensity were 27.7%, 43.1%, 23.2%, and 6.1% respectively. There appeared a new pattern of economic carbon intensity driven by multi-factors jointly. From the perspective of sectoral division, although the sectoral structure had replaced energy efficiency as the dominant factor, the industrial sector was still the core sector affecting China’s economic carbon intensity, because the increasing contribution of the proportion change in the industrial sector had offset the decreasing contribution of industrial energy efficiency improvement to the economic carbon intensity at this stage. Therefore, the recession of the industrial sector was the main reason for the change in China’s economic carbon intensity at this stage, and the structural effect will become important in achieving the committed mitigation targets.
4.3. Analysis of China’s GHG Emission Pathway in Different Phases
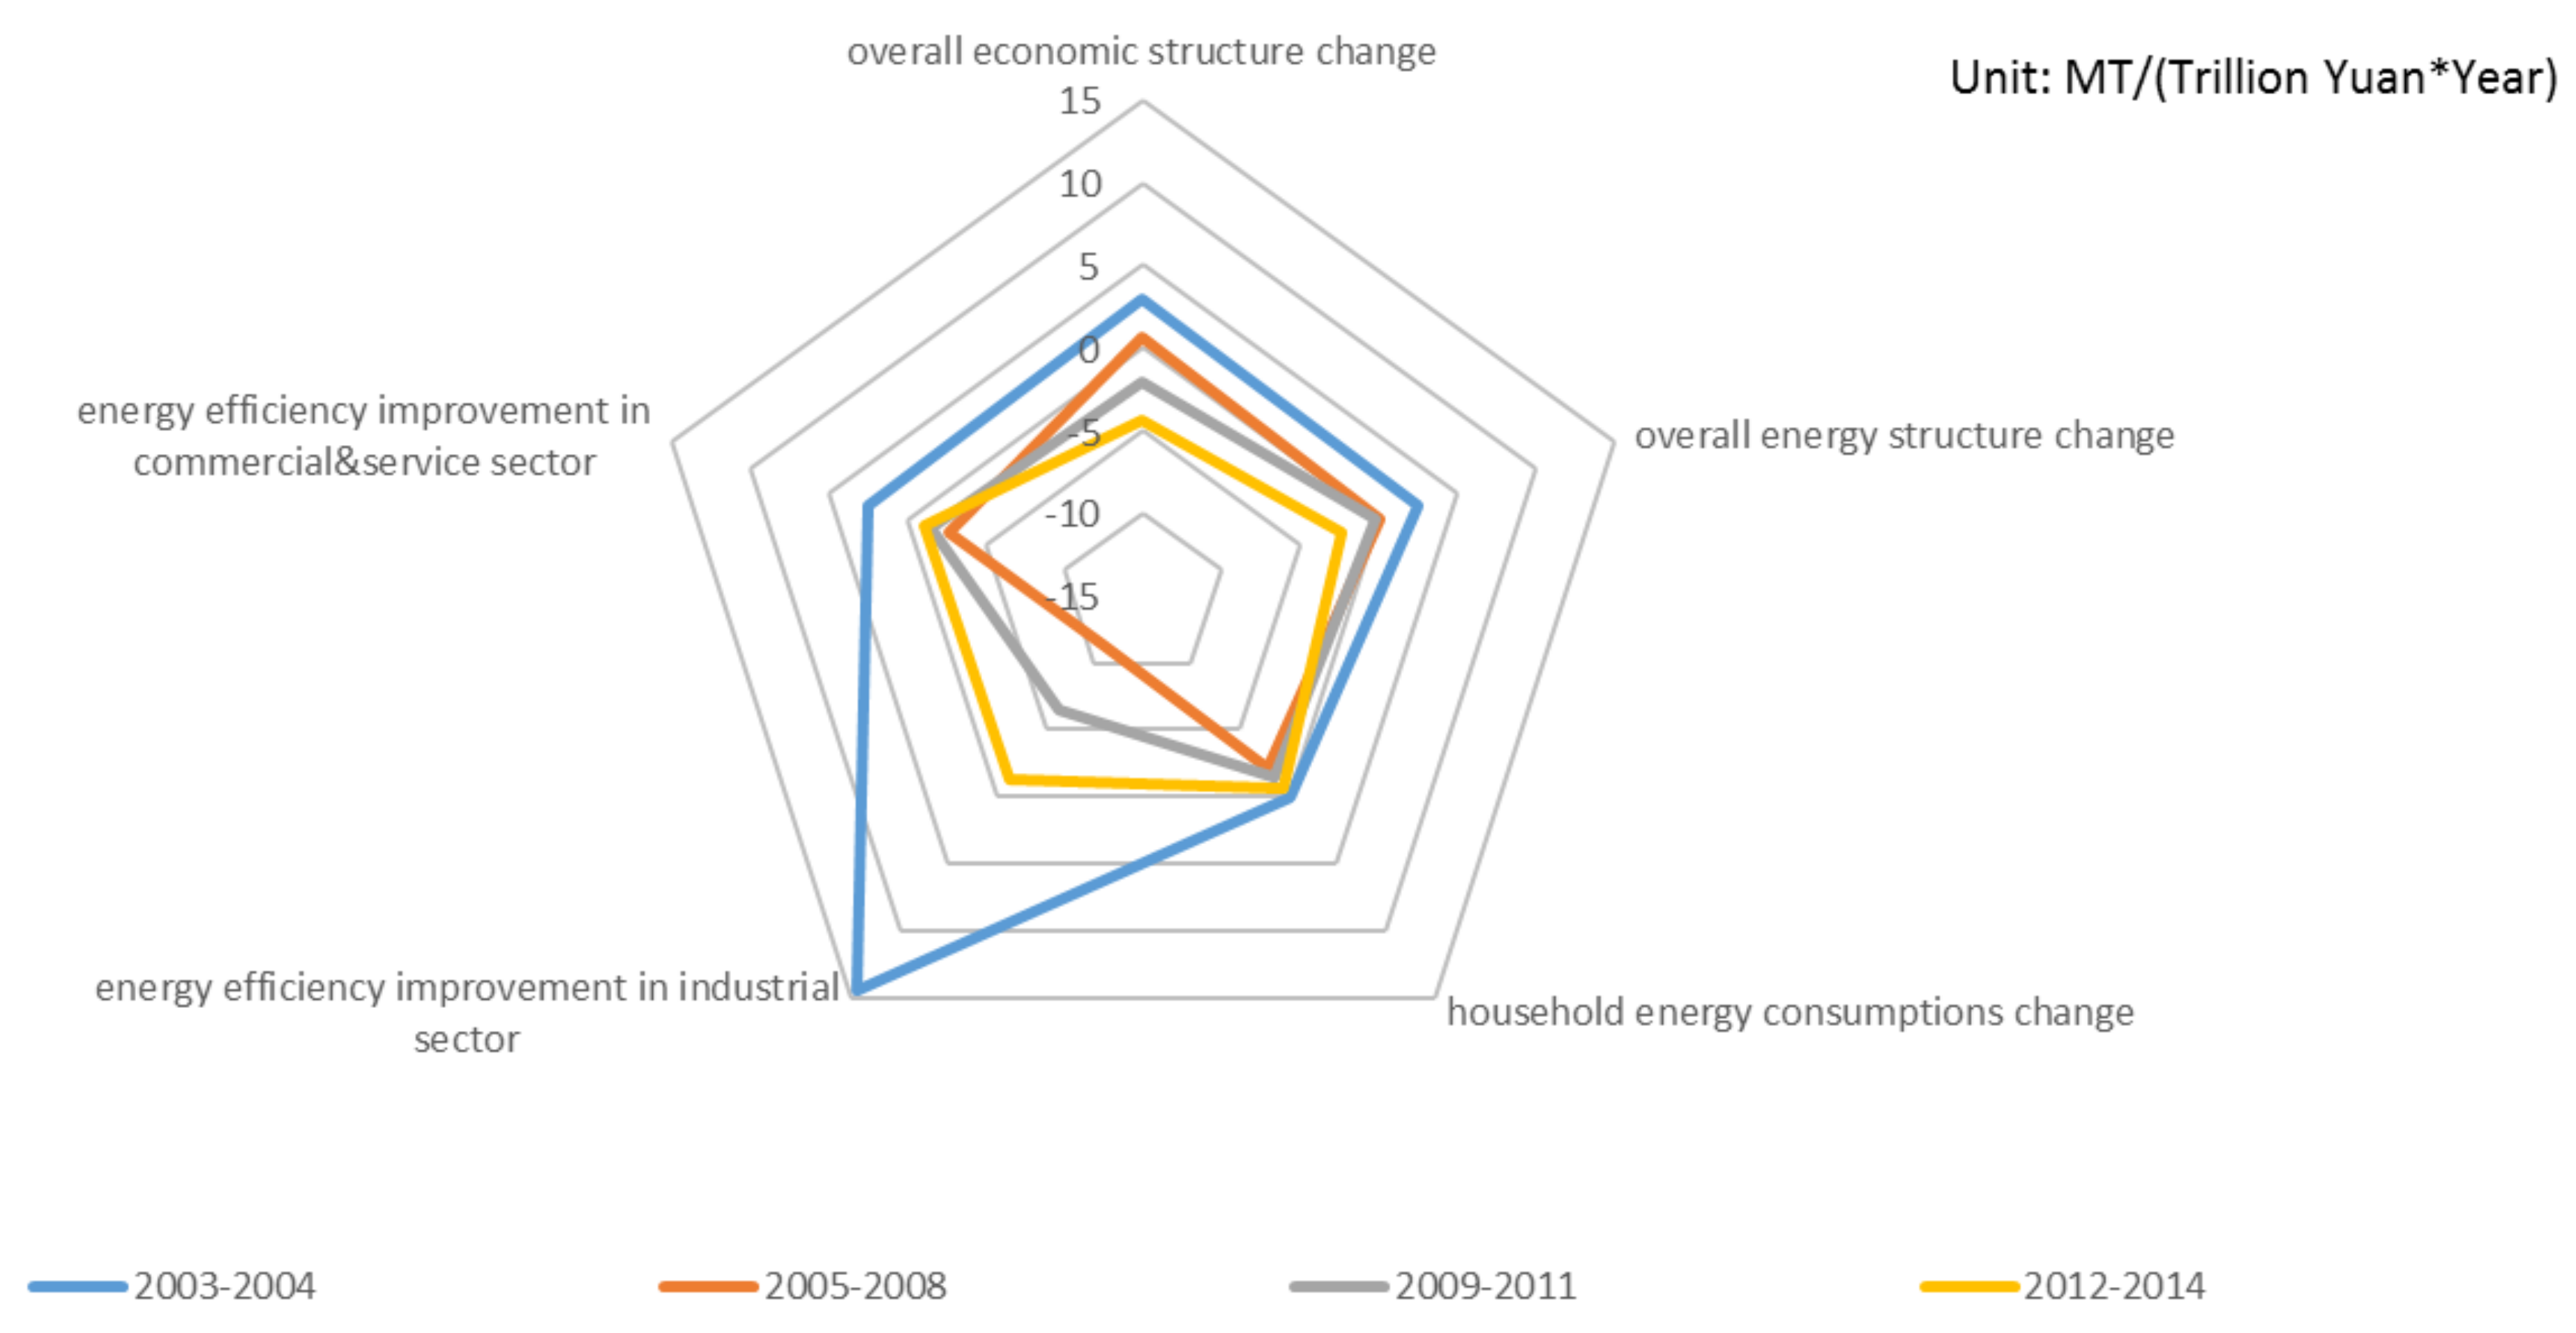
The four-phases division helps to deeply understand the changes in the pathway of China’s carbon emissions since its accession to the WTO. Figure 11 shows the evolution of China’s economic carbon intensity from a periodic perspective. The decomposition factors we have examined mainly include the overall change in the sectoral structure, the energy structure, and household energy consumption, as well as energy efficiency in the industrial sector and commercial and service sector. This paper analyzes the impacts of all these factors on the decrease in China’s economic carbon intensity (as negative value indicates that this factor contributes to the decrease in economic carbon intensity). The five factors above are selected as other factors show less significant contributions and that there is an inherent relationship within the contributions of the proportional changes in different sectors, which should not be differentiated.
There are two trends regarding the five influencing factors. First, the contributions of energy efficiency in the industrial and commercial and service sectors and household energy consumption to the decline in economic carbon intensity were negative in the first stage, but turned positive in the second stage, affected by the energy strategy adjustment, with gradual reducing contributions. This reflects a quick but gradual decreasing effect of energy efficiency improvement and household energy conservation. Second, the contributions of the sectoral structure and the energy structure were also negative in the first stage, but monotonically increased over time. It is indicated that China’s sectoral structure and energy structure underwent a gradual shift from high carbonization to de-carbonization after China joined the WTO.
Both trends can be explained by the actual development process of China’s export-oriented industrial sector, which underwent a rapid growth after China’s accession to the WTO and then was restrained by the international financial crisis and weak international demand. The difference lies in that energy efficiency and household energy consumption played a greater role under advantageous industrial conditions, while the contributions of the sectoral structure and the energy structure to the economic carbon intensity decrease gradually followed industrial development obstacles. Thus, although the overall contribution of the improvement of energy efficiency to the decrease in China’s economic carbon intensity is greater, it is no longer the dominant factor during the current economic transition process as its actual contribution is decreasing gradually.
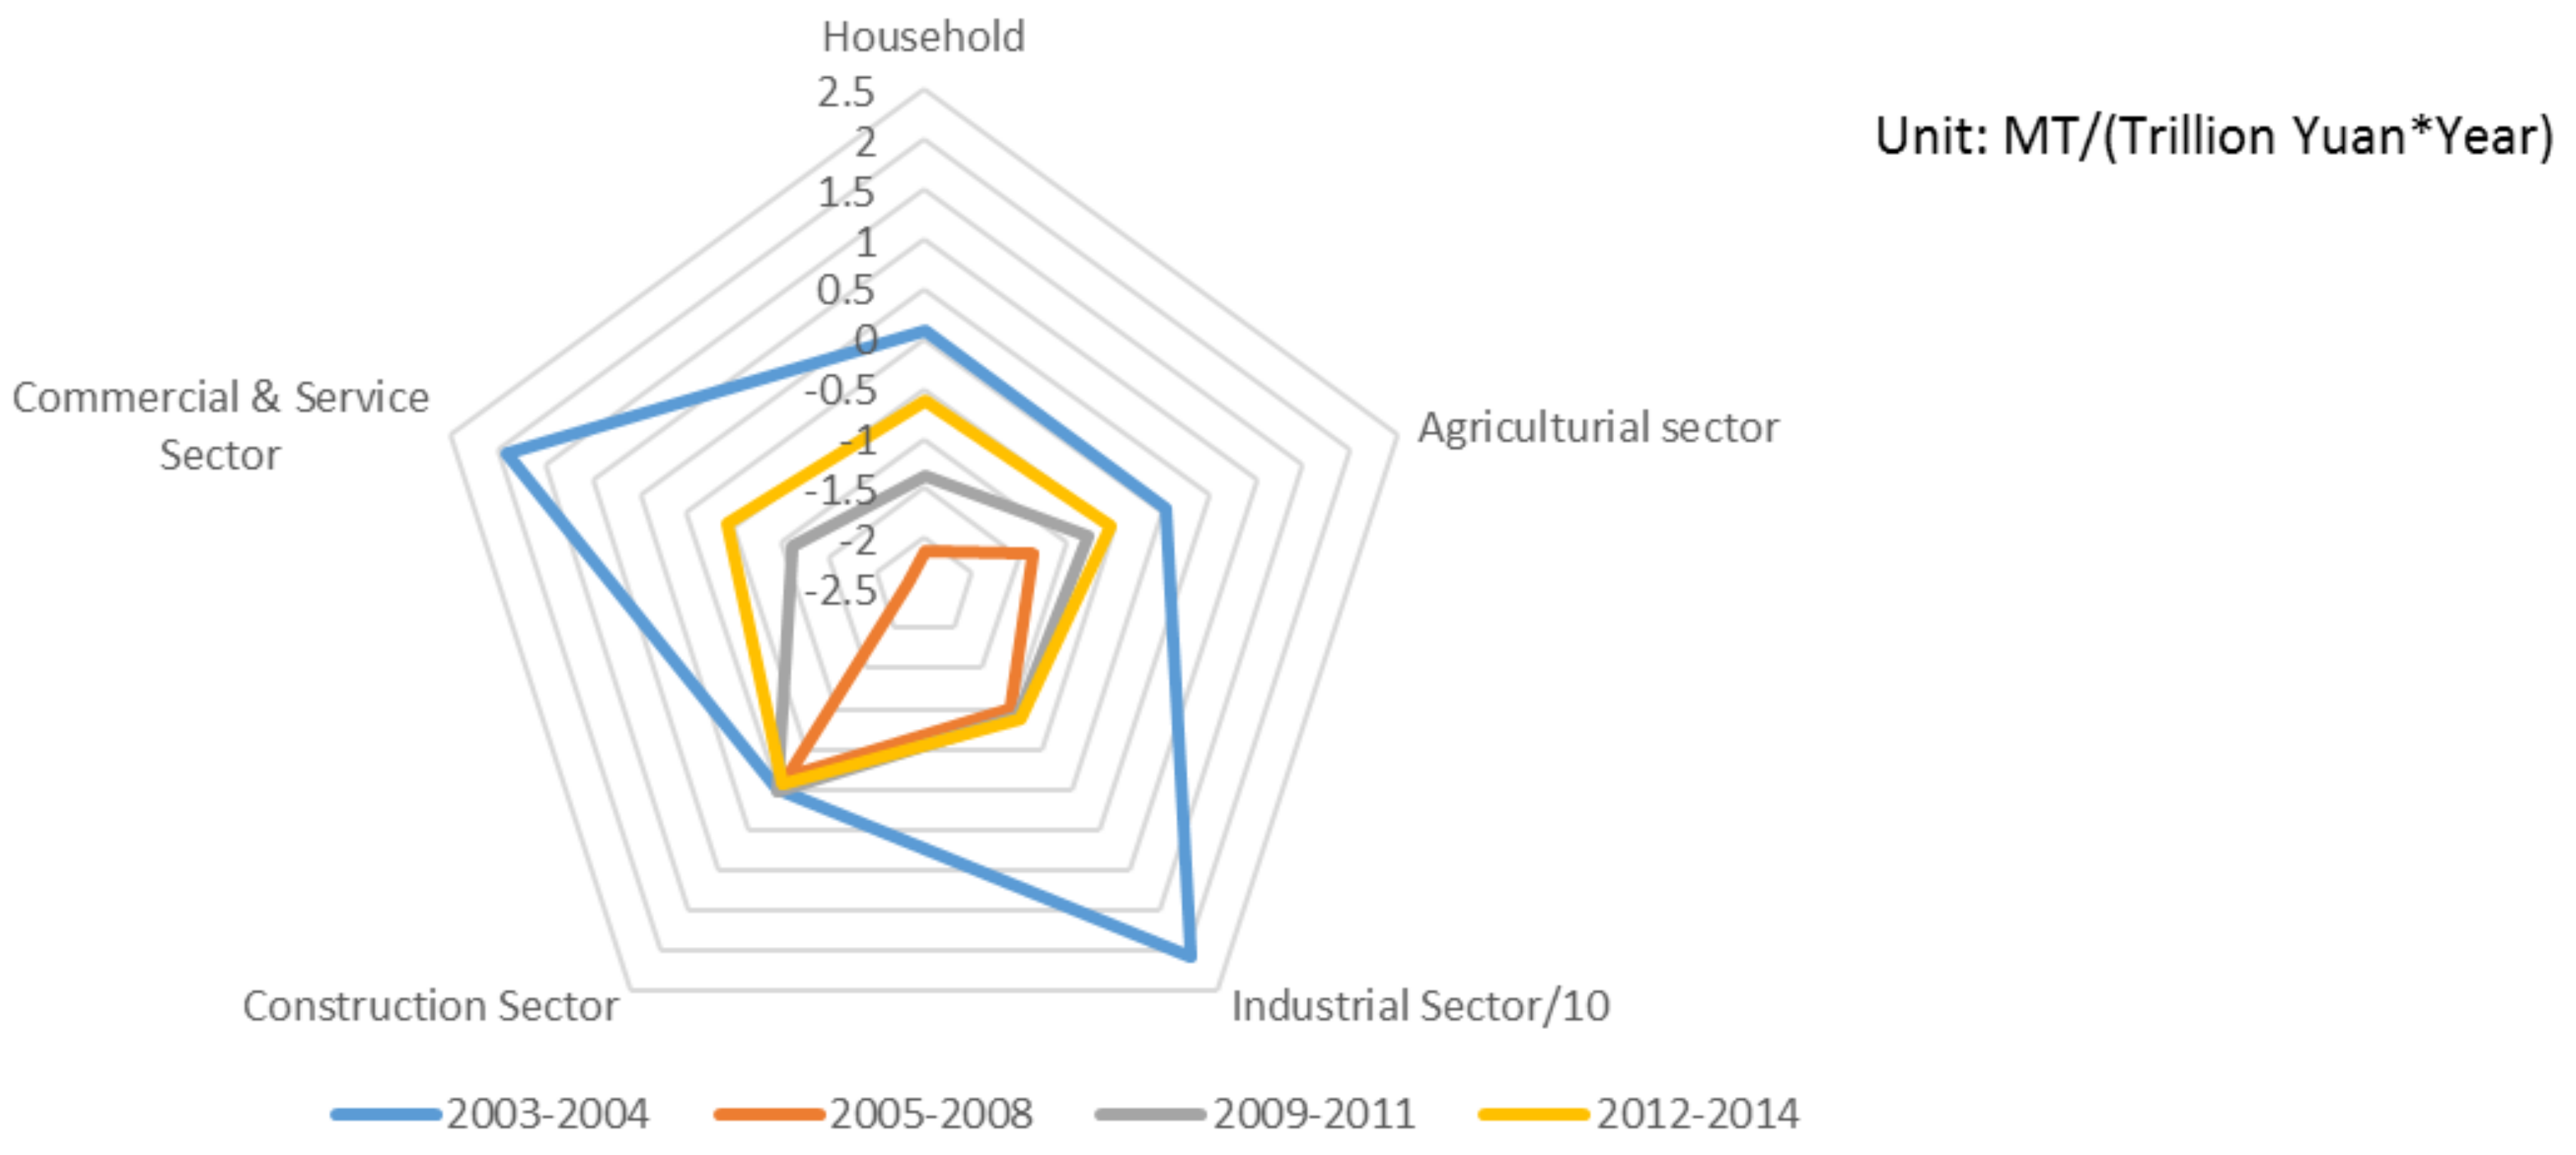
It is worth mentioning that although the contribution ratios of the various driving factors change rapidly over time, China’s economic carbon intensity maintained a relatively stable annual decline rate from 4.6% (2005–2008) to 4.3% (2009–2011) to 4.2% (2012–2104) in the last three phases, with a slight decrease. This indicates that the contributions of the sectoral structure and the energy structure have already made up for the impact of the declining contribution of energy efficiency to the decrease in China’s economic carbon intensity during economic transformation. Judging from the evolution of the contributions of the different sectors to the changes in China’s economic carbon intensity as shown in Figure 12 (in order to make the various sectors’ contributions comparable, we have reduced the industrial sector’s contribution to one-tenth of the actual value in the figure), the contributions of all sectors to the decline in China’s economic carbon intensity had been negative in the first phase, but shifted to positive in the second phase with the decline rate gradually dropping down. The reason lies in the fact that the change in the contribution of energy efficiency to the economic carbon intensity decline in all sectors enjoyed a high similarity, and it makes greater contribution compared with other factors in all sectors.
5. Conclusions
Since joining in the WTO at the end of 2001, China has experienced a rapid growth in economic development and energy consumption and carbon emissions. Existing studies point out that the improvement of energy efficiency offsets the growth of emissions at a large scale even if the total amount of CO2 emissions is still growing [17,18,19,20,21,22,23,24,25,26,27,28,29,30,31,32,33,34,35,36,37,38,39,40,41,42]. But, there is a limited understanding of the impact of economic transformation on China’s carbon emission pathway, because the time-series analysis fails to identify a significant change in the pattern of the emission pathway during the period of transformation.
This paper uses LMDI method to decompose the driving factors of the changes in China’s economic carbon intensity during 2001–2014. According to the decomposition results and the economic development nodes, this paper divides the changes in China’s economic carbon intensity into different phases and analyzes the periodic characteristics, which makes it possible to identify the latest characteristics of China’s emission pathway, not only from the latest performance but also from the gradual changes in pattern in the rapid growth period since joining the WTO.
From the perspective of the phase average, on the one hand, the pathway of China’s carbon emissions shows distinct characteristics at each phase (with no more than a four-year duration for each period). On the other hand, the contributions of the major factors to the economic carbon intensity change have evolved steadily, instead of through highly volatile change on a yearly basis. This indicates that a dynamic perspective should always be kept in understanding China’s carbon emission (or emission intensity) pathway, rather than analyzing the overall or static trend over a relatively long period.
In terms of the driving factors, the improvement of energy efficiency played a crucial role in the decrease in China’s economic carbon intensity, while the further potential of this factor is limited by the upgrading of China’s industrial structure and changes in modes of development. Induced by the new normal in economic development, the change in China’s economic carbon intensity has entered a new phase driven by multiple factors with economic structural improvement being the most important contributor, besides the continuingly, while decreasingly, important factor of energy efficiency.
It is worth noting that the shift of the dominant factor in the change in carbon emissions is caused mainly by the characteristics of the development of the industrial sector. The industrial sector has been the most important sector in the control of China’s carbon emissions during 2001–2014, consistently contributing over 80% to change in economic carbon intensity. It is not only reflected in the increase in economic carbon intensity caused by the rapid industrial development after China joined the WTO, but also in the decline of the economic carbon intensity caused by the restrained industrial development during the post-international financial crisis period.
Based on the periodic characteristics of China’s carbon emissions, it can be argued that the latest characteristic of the emission pathway is simply a result of China’s further development after its integration into the process of globalization. The early stage of China’s fast development is characterized by fast industrialization. During the industrialization, the industrial sector enjoyed rapid growth and benefited from the large scale of foreign direct investment [43,46]. In this case, promoting energy efficiency became the most crucial approach in balancing economic growth and energy consumption/carbon emission control.
With the further development of the industrial sector, serious overcapacity has appeared in the traditional industries that have gained rapid growth in the early stages of industrialization [35,52]. Because the international financial crisis reduced the external demand [31,32] and the domestic competitive advantages, such as demographic dividend, are gradually lowered [53,54], China’s industrial growth has gradually decreased. Foreign direct investment has shifted to the commercial and service sector [44]. China’s industrialization has entered a new stage. However, from the perspective of periodic changes in the carbon emission pathway, the international financial crisis and China’s large-scale economic stimulus have not significantly impacted the long-term trend of gradual changes in contributions of economic structure/energy efficiency to the economic carbon intensity change since industrialization in the early stage. The latest characteristic of China’s economic carbon intensity pathway is exactly the latest manifestation of gradual changes.
At present, China’s commercial and service sector appears to be in rapid growth, which bears some resemblance to the explosive growth of Chinese industry in 2003–2004. Because the emission intensity of the commercial and service sector is much lower than that of the traditional industry, China has achieved significant structural reduction of emissions in the short term, on the way to reaching the committed target of mitigation. However, it should also be recognized that with the rapid development of the commercial and service sector, it will play a more prominent role in reducing China’s economic carbon intensity. One of the strengths of the Chinese government at this stage, as opposed to the developed world’s controls on highly developed industries, is to adopt low-carbon development directly before the growth of new industries, in order to minimize the potential resistance and economic losses brought by implementing more comprehensive carbon control measures in the future.
Other developing countries, which are now attempting to integrate into the process of globalization, may also experience a similar developmental process as China. The experience of China indicates that increasing energy efficiency during the period of rapid industrial development is the key factor in avoiding the constraints of insufficient energy supplies on economic development and in achieving a balance between the control of carbon emissions and economic development. Thus, other fast-growing developing countries may focus on the improvement of energy efficiency to control carbon emissions at the early stage of industrialization and implement more comprehensive reduction measures until their economic development has reached a certain level.
Acknowledgments
We acknowledge the support provided by project 2017YFA0605304 of the National Key Research and Development Program on Global Change (financed by Ministry of Science and Technology of China) and the project 71690243 (financed by National Natural Science Foundation of China).
Author Contributions
P.Z. and M.D. conceived of and designed the research; P.Z. and G.Y. performed and verified the calculations; P.Z. and G.Y. analyzed the data and the results; P.Z., M.D., and G.Y. wrote the main manuscript text; G.Y. and P.Z. prepared the figures. Led by M.D., all authors reviewed the manuscript.
Conflicts of Interest
The authors declare no conflict of interest.
References
- Guan, D.; Klasen, S.; Hubacek, K.; Feng, K.; Liu, Z.; He, K.; Geng, Y.; Zhang, Q. Determinants of stagnating carbon intensity in China. Nat. Clim. Chang. 2014, 4, 1017–1023. [Google Scholar] [CrossRef]
- International Energy Agency. World Energy Outlook Special Report: Energy and Climate Change. Available online: http://www.iea.org/publications/freepublications/publication/weo-2015-special-report-2015-energy-and-climate-change.html (accessed on 31 January 2018).
- National Bureau of Statistics PR China. China Statistical Yearbook 2015; China Statistics Press: Beijing, China, 2016.
- Doytch, N.; Uctum, M. Does the worldwide shift of FDI from manufacturing to services accelerate economic growth? A GMM estimation study. J. Int. Money Financ. 2011, 30, 410–427. [Google Scholar] [CrossRef]
- Hsieh, C.; Ossa, R. A global view of productivity growth in China. J. Int. Econ. 2016, 102, 209–224. [Google Scholar] [CrossRef]
- Inklaar, R.; Diewert, W.E. Measuring industry productivity and cross-country convergence. J. Econ. 2016, 191, 426–433. [Google Scholar] [CrossRef]
- Doytch, N.; Narayan, S. Does FDI influence renewable energy consumption? An analysis of sectoral FDI impact on renewable and non-renewable industrial energy consumption. Energy Econ. 2016, 54, 291–301. [Google Scholar] [CrossRef]
- Doytch, N.; Uctum, M. Globalization and the environmental impact of sectoral FDI. Econ. Syst. 2016, 40, 582–594. [Google Scholar] [CrossRef]
- Zhou, X.; Zhang, J.; Li, J. Industrial structural transformation and carbon dioxide emissions in China. Energy Policy 2013, 57, 43–51. [Google Scholar] [CrossRef]
- Zhang, Z. How far can developing country commitments go in an immediate post-2012 climate regime? Energy Policy 2009, 37, 1753–1757. [Google Scholar] [CrossRef]
- Rong, F. Understanding developing country stances on post-2012 climate change negotiations: Comparative analysis of Brazil, China, India, Mexico, and South Africa. Energy Policy 2010, 38, 4582–4591. [Google Scholar] [CrossRef]
- Gilley, B. Authoritarian environmentalism and China’s response to climate change. Environ. Politics 2012, 21, 287–307. [Google Scholar] [CrossRef]
- Wang, W.; Xie, H.; Jiang, T.; Zhang, D.; Xie, X. Measuring the Total-Factor Carbon Emission Performance of Industrial Land Use in China Based on the Global Directional Distance Function and Non-Radial Luenberger Productivity Index. Sustainability 2016, 8, 336. [Google Scholar] [CrossRef]
- Zhang, L. Correcting the uneven burden sharing of emission reduction across provinces in China. Energy Econ. 2017, 64, 335–345. [Google Scholar] [CrossRef]
- Hou, J.; Teo, T.S.H.; Zhou, F.; Lim, M.K.; Chen, H. Does industrial green transformation successfully facilitate a decrease in carbon intensity in China? An environmental regulation perspective. J. Clean. Prod. 2018, 184, 1060–1071. [Google Scholar] [CrossRef]
- National Development and Reform Commission (NDRC). China’s Intended Nationally Determined Contribution: Enhanced Actions on Climate Change. Available online: http://www.sdpc.gov.cn/xwzx/xwfb/201506/t20150630_710204.html (accessed on 31 January 2018).
- Wang, Z.; Shi, C.; Li, Q.; Wang, G. Impact of Heavy Industrialization on the Carbon Emissions: An Empirical Study of China. Energy Procedia 2011, 5, 2610–2616. [Google Scholar] [CrossRef]
- Qi, T.; Weng, Y.; Zhang, X.; He, J. An analysis of the driving factors of energy-related CO2 emission reduction in China from 2005 to 2013. Energy Econ. 2016, 60, 15–22. [Google Scholar] [CrossRef]
- Liu, L.; Fan, Y.; Wu, G.; Wei, Y. Using LMDI method to analyze the change of China’s industrial CO2 emissions from final fuel use: An empirical analysis. Energy Policy 2007, 35, 5892–5900. [Google Scholar] [CrossRef]
- Xu, S.; He, Z.; Long, R. Factors that influence carbon emissions due to energy consumption in China: Decomposition analysis using LMDI. Appl. Energy 2014, 127, 182–193. [Google Scholar] [CrossRef]
- Wang, C.; Chen, J.; Zou, J. Decomposition of energy-related CO2 emission in China: 1957–2000. Energy 2005, 30, 73–83. [Google Scholar] [CrossRef]
- Li, W.; Shen, Y.; Zhang, H. A Factor Decomposition on China’s Carbon Emission from 1997 to 2012 Based on IPAT-LMDI Model. Math. Probl. Eng. 2015, 2015, 1–14. [Google Scholar] [CrossRef]
- Li, W.; Sun, S.; Li, H. Decomposing the decoupling relationship between energy-related CO2 emissions and economic growth in China. Nat. Hazards 2015, 79, 977–997. [Google Scholar] [CrossRef]
- Wang, G.; Chen, X.; Zhang, Z.; Niu, C. Influencing Factors of Energy-Related CO2 Emissions in China: A Decomposition Analysis. Sustainability 2015, 7, 14408–14426. [Google Scholar] [CrossRef]
- Chen, L.; Yang, Z. A spatio-temporal decomposition analysis of energy-related CO2 emission growth in China. J. Clean. Prod. 2015, 103, 49–60. [Google Scholar] [CrossRef]
- Xu, J.; Fan, Y.; Yu, S. Energy conservation and CO2 emission reduction in China’s 11th Five-Year Plan: A performance evaluation. Energy Econ. 2014, 46, 348–359. [Google Scholar] [CrossRef]
- Zhang, M.; Bai, C.; Zhou, M. Decomposition analysis for assessing the progress in decoupling relationship between coal consumption and economic growth in China. Resour. Conserv. Recycl. 2016, 129, 454–462. [Google Scholar] [CrossRef]
- Tang, X.; Jin, Y.; McLellan, B.C.; Wang, J.; Li, S. China’s coal consumption declining—Impermanent or permanent? Resour. Conserv. Recycl. 2016, 129, 307–313. [Google Scholar] [CrossRef]
- Zhang, Y.; Da, Y. The decomposition of energy-related carbon emission and its decoupling with economic growth in China. Renew. Sustain. Energy Rev. 2015, 41, 1255–1266. [Google Scholar] [CrossRef]
- Gu, A.; Lv, Z. Effects of Economic Structure Change on Carbon Emission of China: Analysis Based on IO-SDA Model. China Popul. Resour. Environ. 2016, 3, 37–45. [Google Scholar]
- Mi, Z.; Meng, J.; Guan, D.; Shan, Y.; Liu, Z.; Wang, Y.; Feng, K.; Wei, Y. Pattern changes in determinants of Chinese emissions. Environ. Res. Lett. 2017, 12, 74003. [Google Scholar] [CrossRef]
- Mi, Z.; Meng, J.; Guan, D.; Shan, Y.; Song, M.; Wei, Y.; Liu, Z.; Hubacek, K. Chinese CO2 emission flows have reversed since the global financial crisis. Nat. Commun. 2017, 8, 1712. [Google Scholar] [CrossRef] [PubMed]
- Wu, Y.; Zhang, W. The driving factors behind coal demand in China from 1997 to 2012: An empirical study of input-output structural decomposition analysis. Energy Policy 2016, 95, 126–134. [Google Scholar] [CrossRef]
- Xu, X.; Zhao, T.; Liu, N.; Kang, J. Changes of energy-related GHG emissions in China: An empirical analysis from sectoral perspective. Appl. Energy 2014, 132, 298–307. [Google Scholar] [CrossRef]
- Tan, Z.; Li, L.; Wang, J.; Wng, J. Examing the driving forces for improving China’s CO2 emission intensity using the decomposing method. Appl. Energy 2011, 88, 4496–7804. [Google Scholar] [CrossRef]
- Lin, J.; Liu, Y.; Hu, Y.; Cui, S.; Zhao, S. Factor decomposition of Chinese GHG emission intensity based on the Logarithmic Mean Divisia Index method. Carbon Manag. 2014, 5, 579–586. [Google Scholar] [CrossRef]
- Li, W.; Ou, Q. Decomposition of China’s Carbon Emissions Intensity from 1995 to 2010: An Extended Kaya Identity. Math. Probl. Eng. 2013, 2013, 1–7. [Google Scholar] [CrossRef]
- Fan, Y. Analyzing impact factors of CO2 emissions using the STIRPAT MOEDL. Environ. Impact Assess. Rev. 2006, 26, 377–395. [Google Scholar] [CrossRef]
- Wang, S.; Li, Q.; Fang, C.; Zhou, C. The relationship between economic growth, energy consumption, and CO2 emissions: Empirical evidence from China. Sci. Total Environ. 2016, 542, 360–371. [Google Scholar] [CrossRef] [PubMed]
- Chen, Q.; Su, L.; Ru, X. Carbon Emission and GDP: Causality Relationship in 6 Developed Countries. Ecol. Econ. 2010, 4, 52–55. [Google Scholar]
- Han, Y.; Lu, Y. The Relationship between Economic Growth and Environmental Quality: An Empirical Test on the Environmental Kuznets Curve of CO2. Econ. Theory Manag. 2009, 3, 5–11. [Google Scholar]
- Alam, M.M.; Murad, M.W.; Noman, A.H.M.; Ozturk, I. Relationships among carbon emissions, economic growth, energy consumption and population growth: Testing Environmental Kuznets Curve hypothesis for Brazil, China, India and Indonesia. Ecol. Indic. 2016, 70, 466–479. [Google Scholar] [CrossRef]
- Grubb, M.; Sha, F.; Spencer, T.; Agnolucci, P. A review of Chinese CO2 emission projections to 2030: The role of economic structure and policy. Clim. Policy 2015, 15 (Suppl. S1), S7–S39. [Google Scholar] [CrossRef]
- Salim, R.; Yao, Y.; Chen, G.; Zhang, L. Can foreign direct investment harness energy consumption in China? A time series investigation. Energy Econ. 2017, 66, 43–53. [Google Scholar] [CrossRef]
- Green, F.; Stern, N. China’s changing economy: Implications for its carbon dioxide emissions. Clim. Policy 2017, 4, 423–442. [Google Scholar] [CrossRef] [Green Version]
- Hilton, I.; Kerr, O. The Paris Agreement: China’s ‘New Normal’ role in international climate negotiations. Clim. Policy 2017, 1, 48–58. [Google Scholar] [CrossRef]
- Ang, B.W. Decomposition analysis for policymaking in energy. Energy Policy 2004, 32, 1131–1139. [Google Scholar] [CrossRef]
- National Development and Reform Commission (NDRC). Notice on the Issuance of the First Batch of GHG Accounting Methods and Reporting Guidelines for Enterprises in 10 Sectors (Trial). Available online: http://www.gov.cn/zwgk/2013-11/04/content_2520743.htm (accessed on 31 January 2018).
- National Bureau of Statistics PR China. China Energy Statistical Yearbook 2013; China Statistics Press: Beijing, China, 2014.
- National Bureau of Statistics PR China. China Energy Statistical Yearbook 2015; China Statistics Press: Beijing, China, 2016.
- Wang, N.; Chang, Y. The evolution of low-carbon development strategies in China. Energy 2014, 68, 61–70. [Google Scholar] [CrossRef]
- China State Council. Opinions of the State Council on Resolving the Contradiction of Serious Overcapacity. Available online: http://www.gov.cn/zhengce/content/2013-10/18/content_4854.htm (accessed on 31 January 2018).
- Cai, F. Demographic transition, demographic dividend, and Lewis turning point in China. China Econ. J. 2010, 2, 107–119. [Google Scholar] [CrossRef]
- Cai, F. China’s Economic Growth Prospects: From Demographic Dividend to Reform Dividend; Edward Elgar Publishing: Northampton, MA, USA, 2016. [Google Scholar]
Figure 1.
The Annual Contributions of Various Sectors’ Energy Efficiency to Economic Carbon Intensity Change.
Figure 1.
The Annual Contributions of Various Sectors’ Energy Efficiency to Economic Carbon Intensity Change.

Figure 2.
The Cumulative Contributions of Various Sectors’ Energy Efficiency to Economic Carbon Intensity Change.
Figure 2.
The Cumulative Contributions of Various Sectors’ Energy Efficiency to Economic Carbon Intensity Change.

Figure 3.
The Change of China’s Economic Structure from 2001 to 2014 [3].
Figure 3.
The Change of China’s Economic Structure from 2001 to 2014 [3].

Figure 4.
Annual Contributions of the Sectoral Structure Change to the Economic Carbon Intensity Change.
Figure 4.
Annual Contributions of the Sectoral Structure Change to the Economic Carbon Intensity Change.

Figure 5.
Cumulative Contributions of the Sectoral Structure Change to the Economic Carbon Intensity Change.
Figure 5.
Cumulative Contributions of the Sectoral Structure Change to the Economic Carbon Intensity Change.


Figure 7.
Annual Contributions of Various Sectors’ Energy Structure to the Economic Carbon Intensity Change.
Figure 7.
Annual Contributions of Various Sectors’ Energy Structure to the Economic Carbon Intensity Change.

Figure 8.
Cumulative Contributions of Various Sectors’ Energy Structure to the Economic Carbon Intensity Change.
Figure 8.
Cumulative Contributions of Various Sectors’ Energy Structure to the Economic Carbon Intensity Change.

Figure 9.
The Contribution of Household Energy Consumption to the Economic Carbon Intensity Decline.
Figure 9.
The Contribution of Household Energy Consumption to the Economic Carbon Intensity Decline.

Figure 10.
The characteristics and differences of various carbon emission phases.

Figure 11.
The Average Phase Contributions of Driving Factors to China’s Economic Carbon Intensity Change.
Figure 11.
The Average Phase Contributions of Driving Factors to China’s Economic Carbon Intensity Change.

Figure 12.
The Average Phase Contributions of Various Sectors to China’s Economic Carbon Intensity Changes.
Figure 12.
The Average Phase Contributions of Various Sectors to China’s Economic Carbon Intensity Changes.


Table 1.
Literature Review on Emission Pathway Analysis [1,17,18,19,20,21,22,23,24,25,26,27,28,29,30,31,32,33,34,35,36,37,38,39,40,41,42].
| Category | Publications | Indicator Type | Method | Decomposition Level | Whether the Economic Phase/Stage Is Identified | Time Period |
|---|---|---|---|---|---|---|
| Research on Single Country Decomposition | Wang et al. (2011) | Quantity (CO2, heavy industry only) | Econometrics | Factors and sectors | No | 1978–2008 |
| Qi et al. (2016) | Quantity (CO2) | LMDI | Factors and sectors | No | 2005–2014 | |
| Liu et al. (2007) | Quantity (CO2, industry only) | LMDI | Factors and sectors | Yes (period divided by joining WTO) | 1998–2002; 2003–2005 | |
| S.C. Xu et al. (2014) | Quantity (CO2) | LMDI | Factors, sectors, and regions | No | 1995–2011 | |
| Wang et al. (2005) | Quantity (CO2) | LMDI | Factors | Yes (period divided by Reform and Opening) | 1957–1980;1981–2000 | |
| Li et al. (2015b) | Quantity (CO2) | LMDI | Factors and sectors | No | 1996–2012 | |
| Wang et al. (2015) | Quantity (CO2) | LMDI | Factors and sectors | No | 1996–2012 | |
| Li et al. (2015a) | Quantity (CO2) | LMDI | Factors and sectors | Yes (period divided by each Chinese five-year plan) | 1997–2012 | |
| Chen and Yang (2015) | Quantity (CO2) | LMDI | Factors, sectors, and regions | No | 1995–2011 | |
| J.H. Xu et al. (2014) | Quantity (CO2) | LMDI | Factors and sectors | No | 2005–2010 | |
| Guan et al. (2014) | Quantity (CO2) | M-E index | Factors and regions | Yes (2002 as starting year) | 2002–2009 | |
| Zhang et al. (2016) | Quantity (Coal) | LMDI | Factors | No | 1991–2003 | |
| Tang et al. (2018) | Quantity (Coal) | LMDI | Factors and sectors | Yes (period divided by each Chinese five-year plan) | 1997–2014 | |
| Zhang and Da (2015) | Quantity (CO2) & Intensity (CO2) | LMDI | Factors and sectors | No | 1996–2010 | |
| Gu and Lv (2016) | Quantity (CO2) | SDA | Factors and sectors | No | 1992/1997/2002/2007/2010 | |
| Mi et al. (2017a) | Quantity (CO2) | SDA | Factors and sectors | Yes (Analyzing the impact of 2008 financial crisis) | 2005/2007/2010/2012 | |
| Mi et al. (2017b) | Quantity (CO2) | SDA | Factors and sectors | Yes (Analyzing the impact of 2008 financial crisis) | 2007/2010/2012 | |
| Wu and Zhang (2016) | Quantity (CO2) | SDA | Factors and sectors | No | 1997/2002/2007/2012 | |
| X. Xu et al. (2014) | Intensity (CO2) | LMDI | Factors and sectors | Yes (period divided by each Chinese five-year plan) | 1996–2011 | |
| Tan et al. (2011) | Intensity (CO2) | LMDI | Factors, sectors and regions | No | 1998–2008 | |
| Lin et al. (2014) | Intensity (CO2) | LMDI | Factors and sectors | Yes (period divided by each Chinese five-year plan) | 1996–2010 | |
| Li and Ou (2013) | Intensity (CO2) | LMDI | Factors and sectors | No | 1995–2010 | |
| Economic Stage Analysis | Fan (2006) | Quantity (CO2) | Econometrics | Factors: different nations | No | 1975–2000 |
| Wang et al. (2016) | Quantity (CO2) | Econometrics | Factors: different nations | No | 1990–2012 | |
| Chen et al. (2010) | Quantity (CO2) | Econometrics | Factors: historical change in 6 nations | No | 1900s–2005 | |
| Han and Lu (2009) | Quantity (CO2) | Econometrics | Factors: different nations | No | 1980–2003 | |
| Alam et al. (2016) | Intensity (CO2) | Econometrics | Factors: different nations | No | 1971–2012 |
Note: logarithmic mean Divisia index (LMDI), Marshall-Edgeworth index (M-E index) and structural decomposition analysis (SDA).
Table 2.
Annual Contributions of Selected Primary Factors (Unit: MT/Trillion Yuan).
| Factors | 2001–2002 | 2002–2003 | 2003–2004 | 2004–2005 | 2005–2006 | 2006–2007 | 2007–2008 | 2008–2009 | 2009–2010 | 2010–2011 | 2011–2012 | 2012–2013 | 2013–2014 | Sum |
|---|---|---|---|---|---|---|---|---|---|---|---|---|---|---|
| SSagr | −0.81623 | −1.20372 | 0.74529 | −1.60643 | −1.33287 | −0.43618 | −0.03061 | −0.45788 | −0.24193 | −0.07947 | −0.00437 | −0.09831 | −0.17543 | −5.73813 |
| SSind | −1.69174 | 5.525319 | 1.963803 | 5.717241 | 2.308661 | −3.82177 | −0.5954 | −8.46697 | 1.910638 | −0.62327 | −5.59543 | −5.8899 | −4.61841 | −13.8772 |
| SScon | −0.02364 | 0.08941 | −0.04909 | 0.094425 | 0.074708 | 0.002236 | 0.091893 | 0.29355 | 0.042805 | 0.046861 | 0.043924 | 0.020183 | 0.054638 | 0.7819 |
| SSser | 1.137483 | −0.23957 | −0.9802 | 0.187573 | 0.558958 | 1.113242 | −0.03353 | 1.375133 | −0.20654 | 0.098938 | 0.960472 | 1.134866 | 0.884663 | 5.991497 |
| EFagr | −0.50738 | 1.94719 | −1.44353 | 0.784438 | 0.304517 | −1.35143 | −1.86051 | −0.19001 | −0.92393 | −0.41027 | 0.069671 | −0.70717 | −0.51977 | −4.80818 |
| EFind | −7.04822 | 11.45319 | 17.45878 | −10.1997 | −10.8247 | −14.7718 | −8.75383 | −0.01032 | −15.7662 | −3.59779 | −0.53456 | 3.205554 | −6.55798 | −45.9476 |
| EFcon | −0.28988 | −0.08634 | 0.074954 | −0.13636 | −0.14602 | −0.32028 | −0.25912 | −0.20108 | −0.12048 | −0.00829 | −0.0607 | −0.00352 | −0.17315 | −1.73026 |
| EFser | −2.96609 | 2.766373 | 2.224508 | −0.88873 | −2.27936 | −4.75551 | −2.97224 | −2.40915 | −1.83868 | −0.26158 | 0.498728 | −1.39064 | −2.35869 | −16.6311 |
| ESagr | −0.005 | 0.138794 | −0.09301 | 0.061363 | 0.058958 | 0.077238 | −0.11919 | −0.03615 | −0.05642 | 0.064583 | −0.03942 | −0.03135 | −0.06773 | −0.04735 |
| ESind | −0.62684 | 4.021569 | 0.988805 | 2.359813 | 0.755826 | 0.058597 | −2.79355 | 0.226184 | −1.98501 | 1.421973 | −3.57952 | 0.159389 | −2.49447 | −1.48724 |
| EScon | 0.010569 | 0.019459 | −0.04568 | 0.005439 | 0.017725 | −0.00017 | −0.04862 | −0.01042 | −0.02406 | 0.032316 | −0.04224 | −0.012 | −0.03228 | −0.12997 |
| ESser | 0.070744 | 0.40189 | −0.39324 | 0.239342 | 0.144896 | 0.130478 | −0.7702 | −0.00287 | −0.36404 | 0.266501 | −0.45786 | −0.02573 | −0.51211 | −1.2722 |
| HH | 0.037882 | 0.725949 | −0.54975 | −2.20941 | −1.61005 | −2.16653 | −2.54782 | −0.83045 | −2.95094 | −0.33975 | −0.35752 | 0.126553 | −1.63513 | −14.307 |
| Sum | −12.7183 | 25.55952 | 19.90163 | −5.59098 | −11.9688 | −26.2419 | −20.6927 | −10.7204 | −22.5248 | −3.38925 | −9.09882 | −3.51209 | −18.2058 | −99.2028 |
Note: Negative value represents the factor contributing to the decrease in economic carbon intensity; SS, EF, and ES refer to sectoral effect, energy efficiency effect, and energy structure effect, respectively; agr, ind, con, ser, and HH refer to agricultural sector, industrial sector (except for construction), construction sector, commercial and service sector, and household, respectively.
Table 3.
Contributions of Each Factor or Sector (Unit: MT/Trillion Yuan).
| Factors | 2001–2002 | 2002–2003 | 2003–2004 | 2004–2005 | 2005–2006 | 2006–2007 | 2007–2008 | 2008–2009 | 2009–2010 | 2010–2011 | 2011–2012 | 2012–2013 | 2013–2014 | Sum |
|---|---|---|---|---|---|---|---|---|---|---|---|---|---|---|
| SS | −1.39413 | 4.171439 | 1.679802 | 4.392813 | 1.609461 | −3.14247 | −0.56764 | −7.25617 | 1.504971 | −0.55695 | −4.5954 | −4.83316 | −3.85453 | −12.842 |
| (%) | 10.96% | 16.32% | 8.44% | −78.57% | −13.45% | 11.98% | 2.74% | 67.69% | −6.68% | 16.43% | 50.51% | 137.62% | 21.17% | 12.95% |
| EF | −10.8116 | 16.08042 | 18.31472 | −10.4403 | −12.9456 | −21.199 | −13.8457 | −2.81056 | −18.6493 | −4.27792 | −0.02686 | 1.104216 | −9.60959 | −69.1171 |
| (%) | 85.01% | 62.91% | 92.03% | 186.74% | 108.16% | 80.78% | 66.91% | 26.22% | 82.79% | 126.22% | 0.30% | −31.44% | 52.78% | 69.67% |
| ES | −0.55052 | 4.581713 | 0.456864 | 2.665958 | 0.977405 | 0.266139 | −3.73157 | 0.176745 | −2.42953 | 1.785373 | −4.11904 | 0.090309 | −3.10659 | −2.93676 |
| (%) | 4.33% | 17.93% | 2.30% | −47.68% | −8.17% | −1.01% | 18.03% | −1.65% | 10.79% | −52.68% | 45.27% | −2.57% | 17.06% | 2.96% |
| HH | 0.037882 | 0.725949 | −0.54975 | −2.20941 | −1.61005 | −2.16653 | −2.54782 | −0.83045 | −2.95094 | −0.33975 | −0.35752 | 0.126553 | −1.63513 | −14.307 |
| (%) | −0.30% | 2.84% | −2.76% | 39.52% | 13.45% | 8.26% | 12.31% | 7.75% | 13.10% | 10.02% | 3.93% | −3.60% | 8.98% | 14.42% |
| AGR | −1.32861 | 0.882261 | −0.79125 | −0.76063 | −0.96939 | −1.71038 | −2.01031 | −0.68404 | −1.22228 | −0.42516 | 0.025888 | −0.83684 | −0.76293 | −10.5937 |
| (%) | 10.45% | 3.45% | −3.98% | 13.60% | 8.10% | 6.52% | 9.72% | 6.38% | 5.43% | 12.54% | −0.28% | 23.83% | 4.19% | 10.68% |
| IND | −9.36679 | 21.00008 | 20.41139 | −2.12263 | −7.76025 | −18.5349 | −12.1428 | −8.25111 | −15.8406 | −2.79909 | −9.70951 | −2.52496 | −13.6709 | −61.3121 |
| (%) | 73.65% | 82.16% | 102.56% | 37.97% | 64.84% | 70.63% | 58.68% | 76.97% | 70.33% | 82.59% | 106.71% | 71.89% | 75.09% | 61.80% |
| CON | −0.30295 | 0.022535 | −0.01982 | −0.0365 | −0.05359 | −0.31822 | −0.21585 | 0.082053 | −0.10174 | 0.070889 | −0.05901 | 0.004664 | −0.15079 | −1.07833 |
| (%) | 2.38% | 0.09% | −0.10% | 0.65% | 0.45% | 1.21% | 1.04% | −0.77% | 0.45% | −2.09% | 0.65% | −0.13% | 0.83% | 1.09% |
| SER | −1.75786 | 2.928696 | 0.851065 | −0.46182 | −1.5755 | −3.51179 | −3.77597 | −1.03688 | −2.40926 | 0.103863 | 1.001337 | −0.28151 | −1.98613 | −11.9118 |
| (%) | 13.82% | 11.46% | 4.28% | 8.26% | 13.16% | 13.38% | 18.25% | 9.67% | 10.70% | −3.06% | −11.01% | 8.02% | 10.91% | 12.01% |
Note: Negative absolute value represents the factor contributing to the decrease in economic carbon intensity; SS, EF, and ES refer to sectoral effect, energy efficiency effect, energy structure effect, respectively; AGR, IND, CON, SER, and HH refer to agricultural sector, industrial sector (except for construction), construction sector, commercial and service sector, and household, respectively.
Table 4.
Pearson Correlation Coefficient among Energy Efficiency Contributions in Each Sector.
| Factors | EFagr | EFind | EFcon | EFser | EF | EC/GDP |
|---|---|---|---|---|---|---|
| EFagr | 1 | - | - | - | - | - |
| EFind | 0.2174 | 1 | - | - | - | - |
| EFcon | 0.1660 | 0.6740 ** | 1 | - | - | - |
| EFser | 0.4888 | 0.8103 ** | 0.8038 ** | 1 | - | - |
| EF | 0.3501 | 0.9860 ** | 0.7173 ** | 0.8887 ** | 1 | - |
| Econimic carbon Intensity | 0.4991 | 0.8974 ** | 0.6810 ** | 0.9093 ** | 0.9434 ** | 1 |
Note: ** means that the Pearson correlation coefficient is greater than 0.5; EF refers to energy efficiency effect; agr, ind, con, and ser refer to agricultural sector, industrial sector (except for construction), construction sector, commercial and service sector, respectively.
© 2018 by the authors. Licensee MDPI, Basel, Switzerland. This article is an open access article distributed under the terms and conditions of the Creative Commons Attribution (CC BY) license (http://creativecommons.org/licenses/by/4.0/).
Share and Cite
MDPI and ACS Style
Zhang, P.; Duan, M.; Yin, G. The Periodic Characteristics of China’s Economic Carbon Intensity Change and the Impacts of Economic Transformation. Energies 2018, 11, 961. https://doi.org/10.3390/en11040961
AMA Style
Zhang P, Duan M, Yin G. The Periodic Characteristics of China’s Economic Carbon Intensity Change and the Impacts of Economic Transformation. Energies. 2018; 11(4):961. https://doi.org/10.3390/en11040961
Chicago/Turabian StyleZhang, Peng, Maosheng Duan, and Guangzhi Yin. 2018. "The Periodic Characteristics of China’s Economic Carbon Intensity Change and the Impacts of Economic Transformation" Energies 11, no. 4: 961. https://doi.org/10.3390/en11040961
Note that from the first issue of 2016, this journal uses article numbers instead of page numbers. See further details here.