Optimal Design of a Band Pass Filter and an Algorithm for Series Arc Detection


1
Physical Engineering Division, National Forensic Service, Daegu 39872, Korea
2
Department of Electrical and Electronics Engineering, Korea Maritime and Ocean University, Busan 49112, Korea
*
Author to whom correspondence should be addressed.
Energies 2018, 11(4), 992; https://doi.org/10.3390/en11040992
Submission received: 26 March 2018
/
Revised: 14 April 2018
/
Accepted: 18 April 2018
/
Published: 19 April 2018
(This article belongs to the Section F: Electrical Engineering)
Abstract
:Detection and analysis of series arcs is significantly meaningful for preventing arc-caused electrical fires in advance. However, the improvement of arc detection sensitivity and the discrimination of arc conditions are still challenges when developing an arc fault detector. In this paper, arc signals in various loads with three major incomplete connection states were detected and further analyzed using the discrete wavelet transform. It was verified that the db13 was the optimal mother wavelet to analyze the arc pulses and the decomposed signals in the detail components of D5, D6, D7, and D8 were related with arc phenomena. Therefore, a band pass filter with a frequency from 2.4 to 39 kHz was designed, which can extract arc signals while eliminating the AC mains current and noise generated in loads. By investigating the arc signal energy as well as the arc pulse counts that were important parameters of arc occurrence, an arc diagnosis algorithm was developed based on LabVIEW program for electrical fire prevention.
1. Introduction
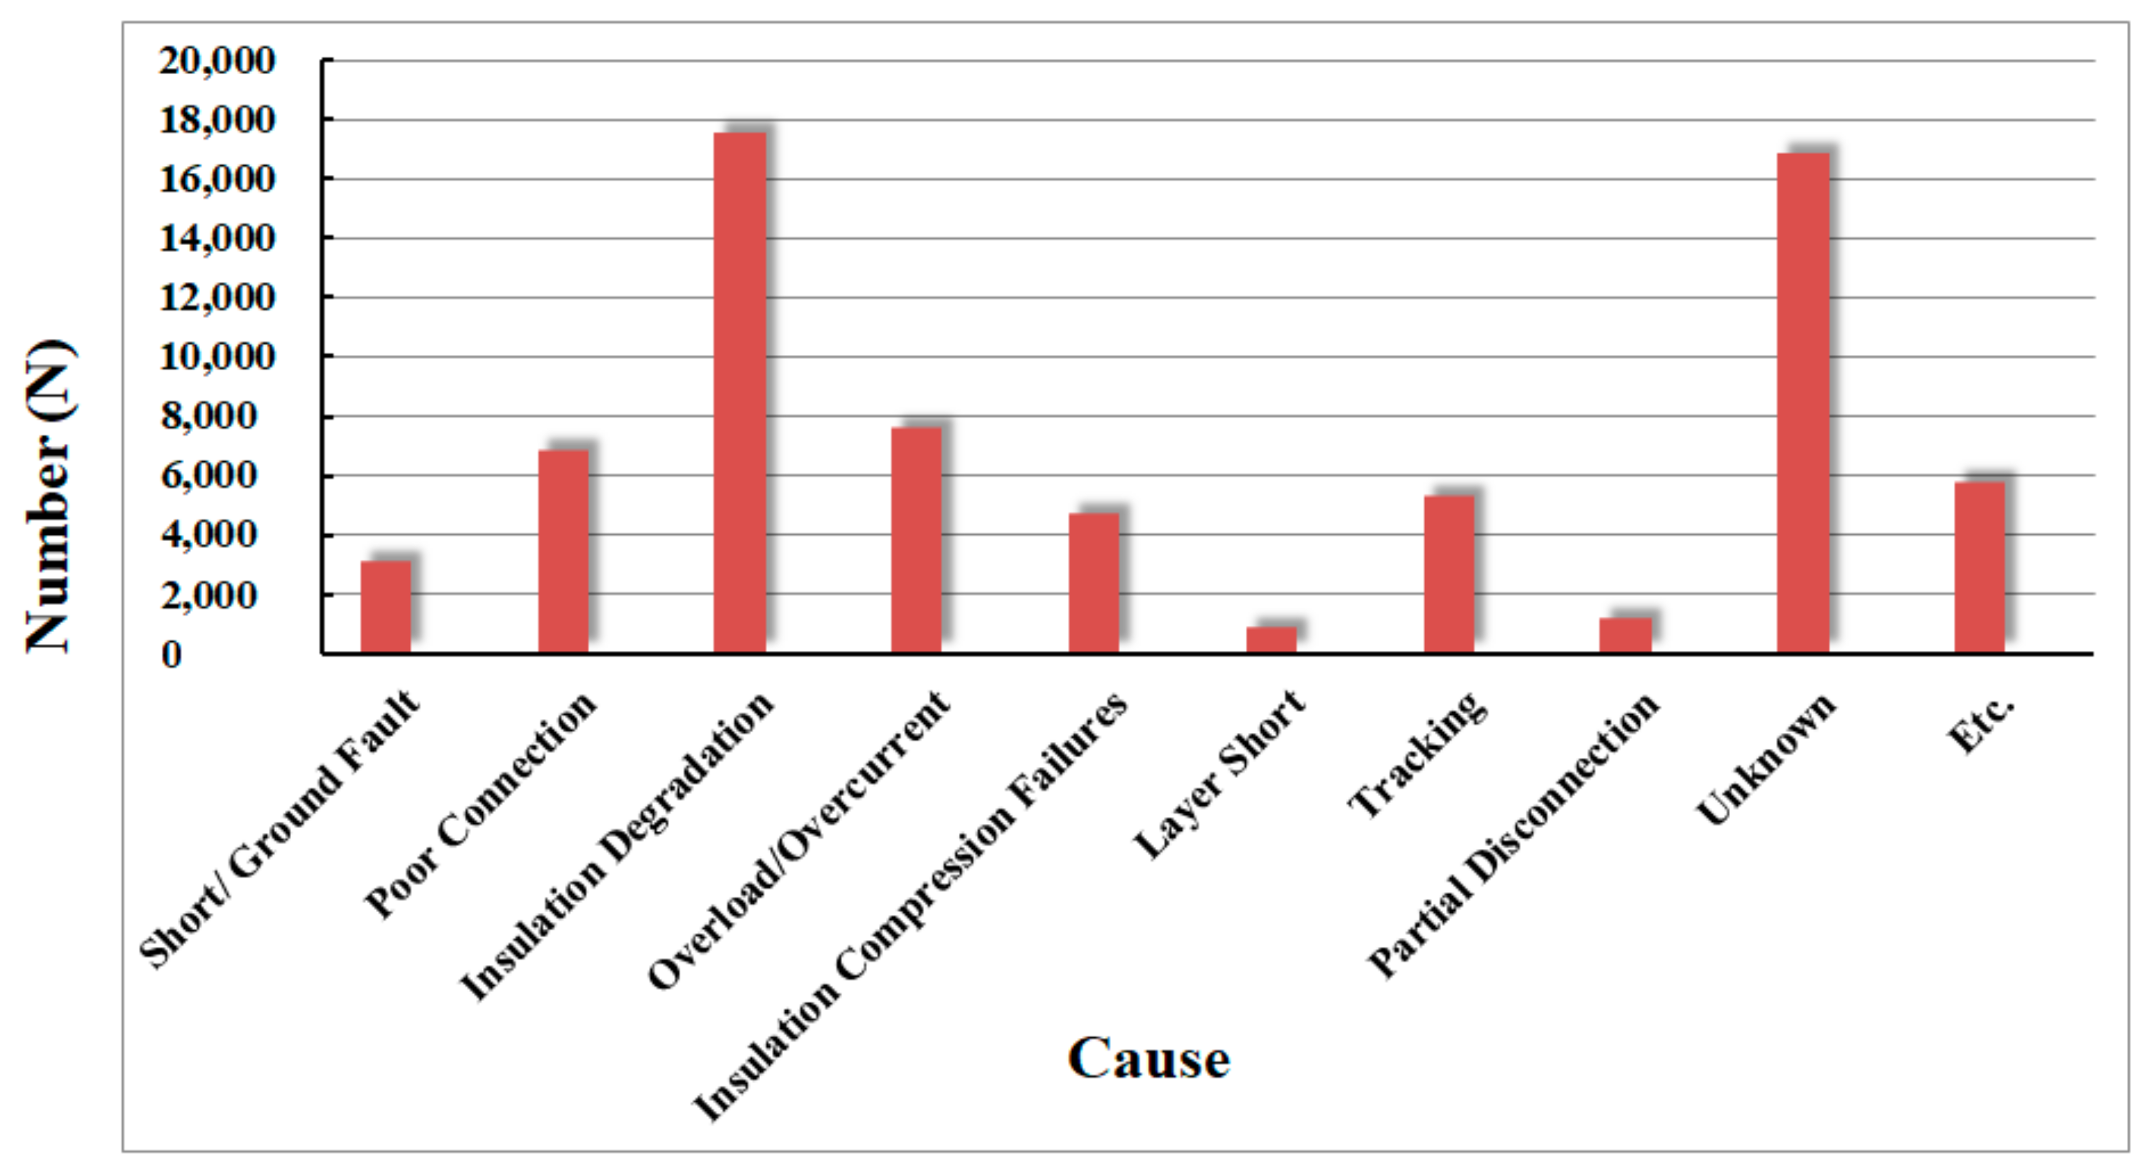
According to the Korea National Fire Data System, more than 40,000 fire accidents happened every year from 2010 to 2016, causing enormous financial losses and human injuries and deaths. Electrical fires, which account for more than 37% of the total fire accidents, are a serious hazard for residential areas and buildings and should be prevented in advance. Figure 1 shows the causes of electrical fire. It can be seen that about 42% of the electrical fires are caused by poor connections, degraded or compressed insulation, and partial connection, which can be attributed to the series arcing [1,2].
Although the existing methods of fuses, leakage current circuit breakers, and molded case circuit breakers are installed in circuits for over current and electric shock protection, they fail to eliminate arcing. To be specific, a fuse melts its metal wires when too much current flows through it, whereas it does not operate when an arc of low amplitude occurs. A leakage current circuit breaker works based on the unbalanced current between the line and neutral current and is intended to avoid electric shocks. A molded case circuit breaker can open an over current; however, arcing is not in the operational range of the time-current characteristics of a circuit breaker [3,4]. The arc fault circuit interrupter described in the Underwriters Laboratories (UL) 1699 and the arc fault detection devices described in the International Electrotechnical Commission (IEC) 62606 are introduced to mitigate the effects of arc [5,6,7]. They operate to de-energize the circuit when an arc fault is detected. However, discrimination of the arc condition is still a challenge for development an arc fault detector [8].
Therefore, in this paper, to improve arc detection sensitivity and to prevent arc-caused fires in advance, an optimal series arc detection filter was designed based on the analysis of arc characteristics by discrete wavelet transform (DWT). Further, an arc diagnosis algorithm was developed by analyzing the filtered arc signal energy and arc pulse count.
2. Series Arc and Its Characteristics
An arc is a luminous discharge of electricity across an insulating medium, usually accompanied by the partial volatilization of the electrodes [5,6,8]. Owning to the current flowing in the circuit and the high temperature, arcing is one of the main causes of electrical fires. As shown in Figure 2, there are three types of arc faults according to the following path of arc current: series arc, parallel arc, and ground arc, among which the series arc occurs the most frequently [3,9,10,11,12]. The series arc is in series with a load as illustrated in Figure 2. Since the energy level of arc current is too low, owing to the existence of arc impedance and load impedance, the fault circuit cannot be tripped by the circuit breaker or fuse.
Figure 3 shows fire accidents investigated by the National Forensic Service, all of which were caused by series arcs. It was also confirmed that the series arc faults in a circuit occur due to partial disconnection between cords, loose connection between cord and terminal, and loose connection between outlet and plug. Most of the existing studies about series arcs use the carbon graphite–copper electrode specified in UL 1699 and IEC 62606 to generate the arc signal [5,6,8]. It is an ideal condition, under which the magnitude of arc current is much higher than that of the actual series arc and can be easily detected. In this paper, the actual series arc faults, including cord-cord, cord-terminal, and outlet-plug, were used to generate the arc signal and to analyze the characteristics of series arcs that cause fires.
Typical current waveforms of series arcs in a resistive load and a switched-mode power supply (SMPS) load are shown in Figure 4. Near the zero-crossing point, the arc extinguishes due to the insufficient voltage to sustain discharge and ignites again after the voltage recovers, resulting in the appearance of a shoulder in every half cycle. There are also rising edges just after the shoulders. In addition, high frequency components can be seen on the current waveform. These features are usually used to distinguish an arc condition or a normal condition of the circuit.
3. Experiment and Analysis
3.1. Experimental Setup
Figure 5 shows the experimental setup. An arc generator and a load are connected in series with the 220 V AC mains. The arc generator is designed according to UL 6199. Electrodes as cord-cord, cord-terminal, and outlet-plug are used to simulate the actual incomplete connections that cause electrical fires in an indoor wiring system. A resistive load, a SMPS load, and a motor load were used for experiments. The series arc current is detected using a high frequency current transformer (HFCT, Pearson Electronics Inc., Palo Alto, CA, USA) with a frequency range of 1 Hz–20 MHz. Signals are acquired using a digital storage oscilloscope (DSO, YOKOGAWA, DL9140, Tokyo, Japan) with a sampling rate of 5 GS/s and a bandwidth of 1 GHz, and using a data acquisition (DAQ, National Instrument, USB-5133, Austin, TX, USA) unit with a sampling rate of 100 MS/s and a bandwidth of 50 MHz. DWT analysis and arc diagnosis algorithm are developed based on LabVIEW program.
3.2. Analysis of Series Arcs Using Discrete Wavelet Transform
Wavelet transform (WT) is an advanced signal processing technique that is able to analyze a signal in the time and frequency domains simultaneously. There are two types of WT, the continuous wavelet transform (CWT) with excessive computation and the discrete wavelet transform (DWT) based on the multi-resolution analysis (MRA) [13,14,15,16,17]. In this study, the DWT is used to analyze the arc current signal. In the MRA, a mother wavelet is used to decompose the input signal into a specific level (N) by corresponding low and high pass filters, generating the detail (D) and approximation (A) components. The results of MRA are the detail coefficients at each level (D1, D2, ···, Dn) and the approximation coefficients at the highest level (An) [18,19,20].
3.2.1. Optimal Mother Wavelet Selection
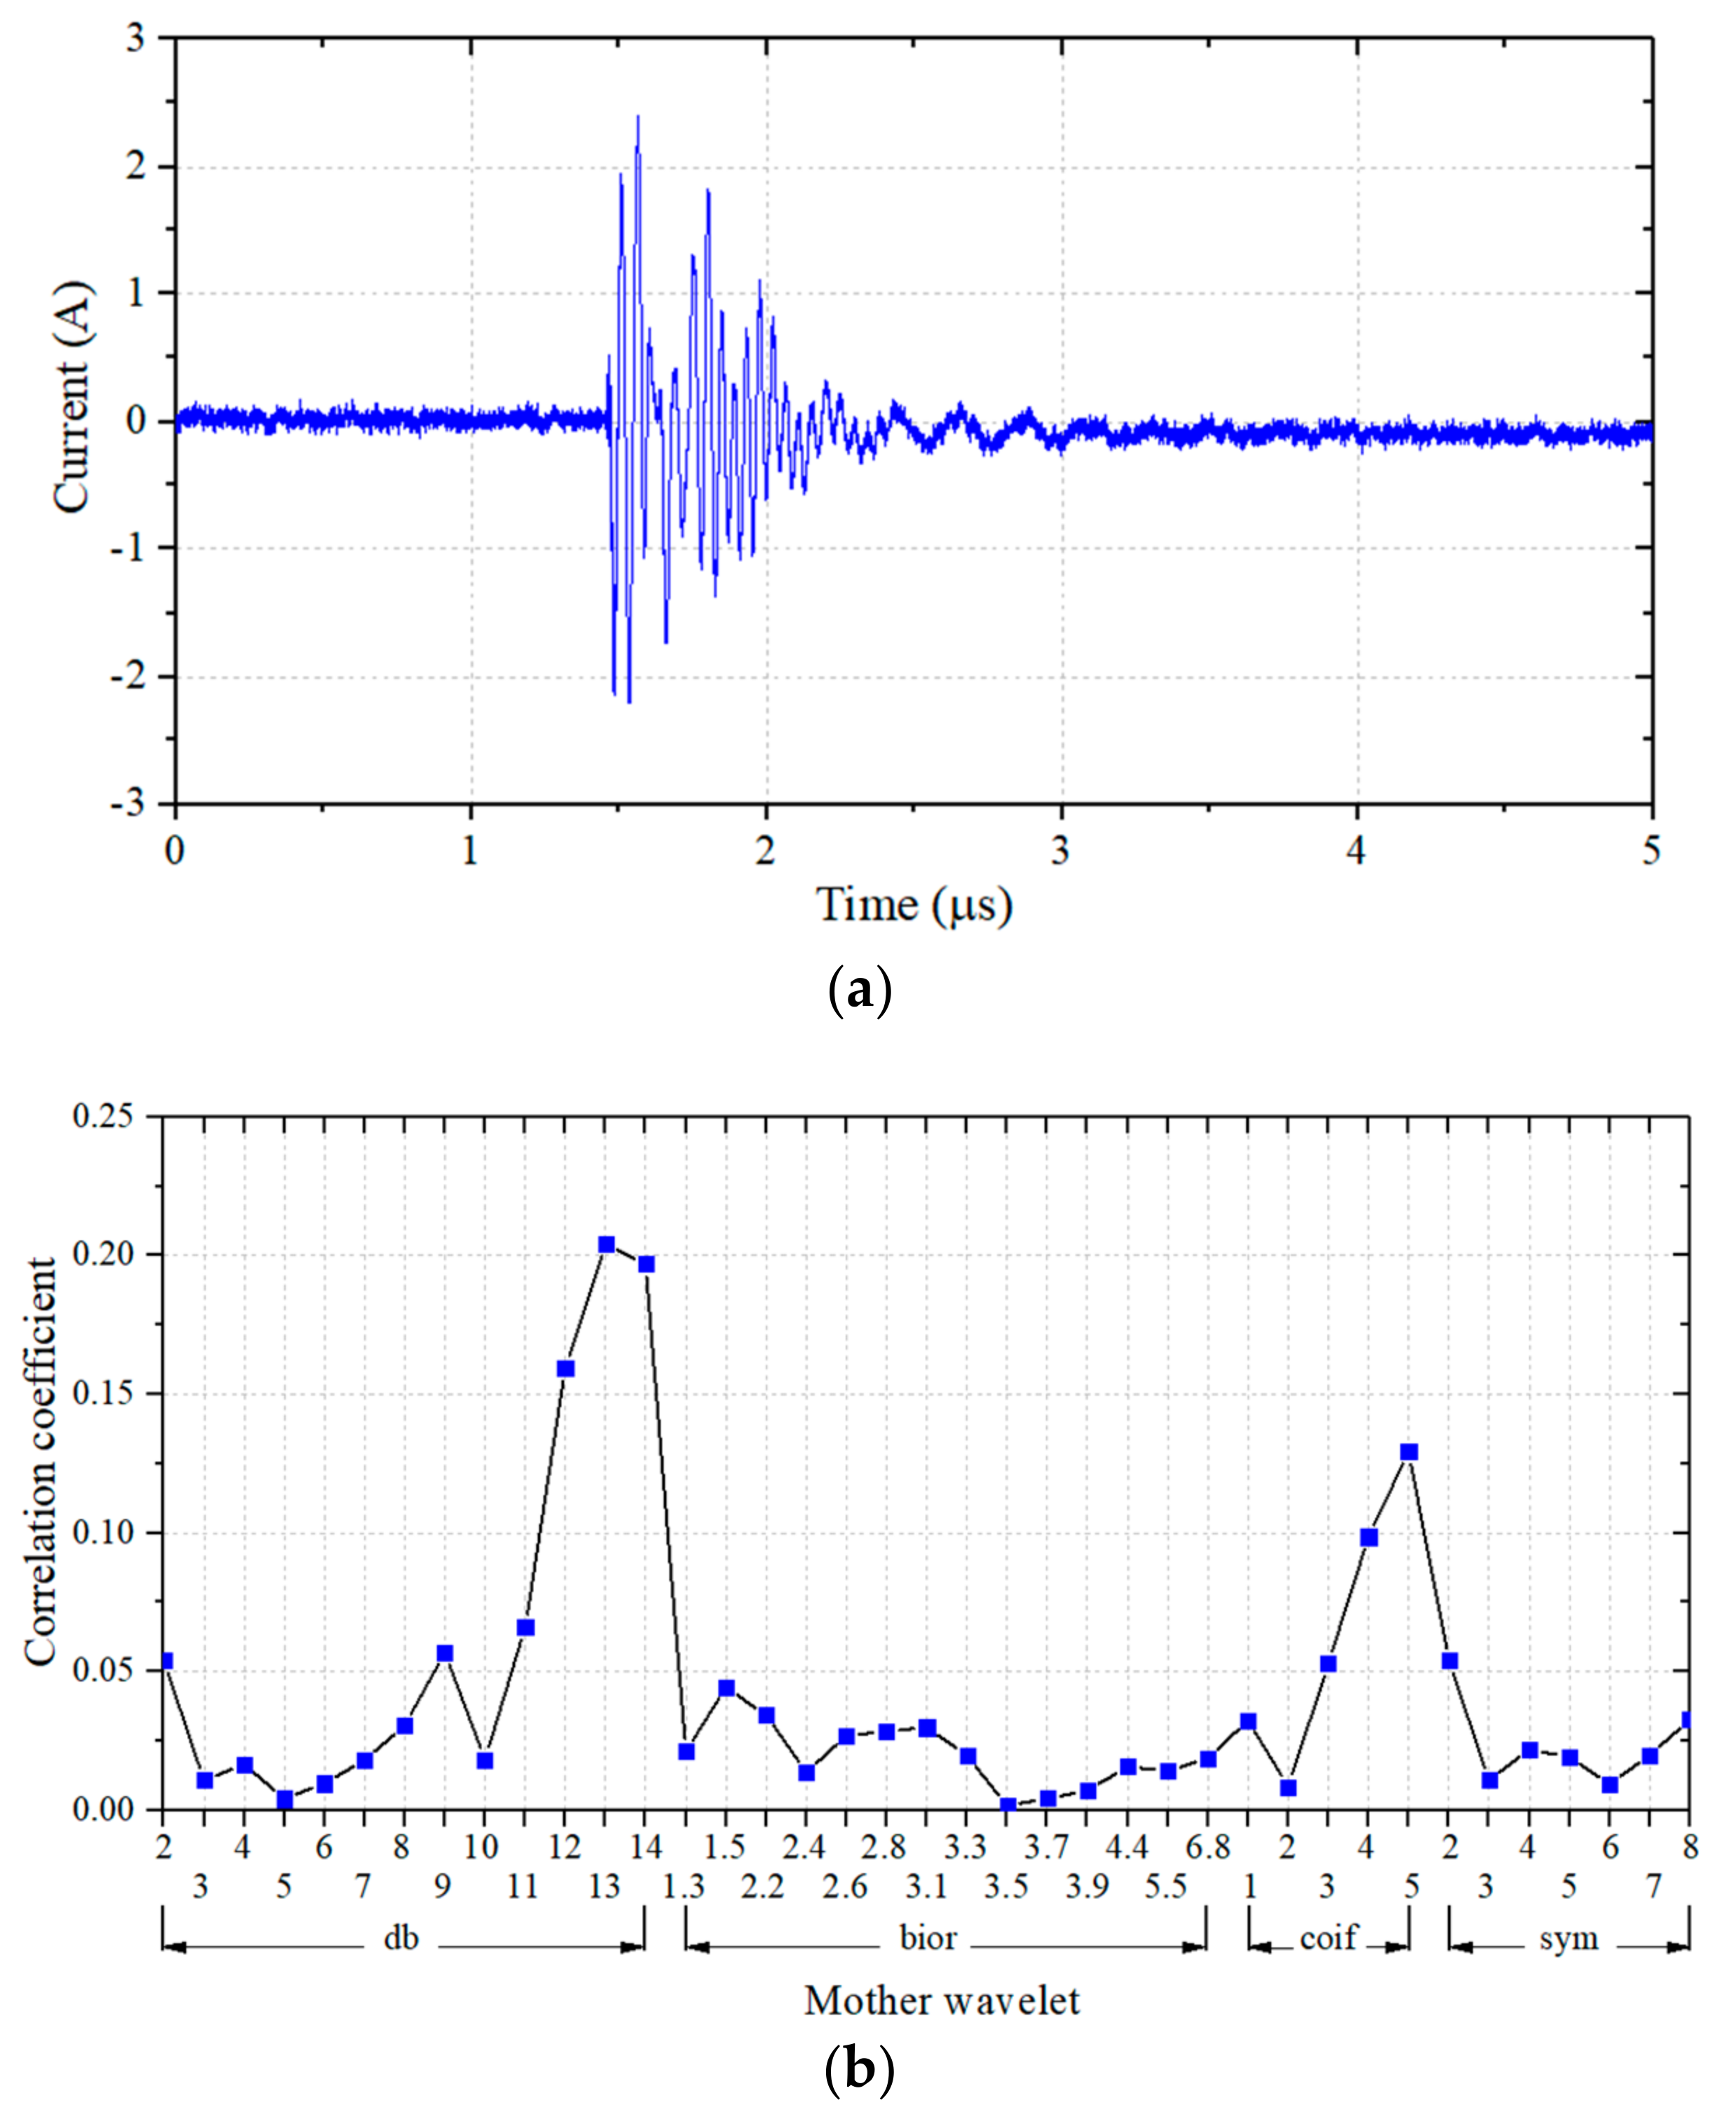
To select the optimal mother wavelet, the correlation coefficient was used to calculate the similarity between various wavelets and arc current pulses in resistive, SMPS, and motor loads with cord-cord, cord-terminal, and outlet-plug faults. The value of the correlation coefficient is between 0 and 1. A higher correlation coefficient value indicates the greater similarity between the mother wavelet and the pulse.
An arc current pulse in the resistive load with a cord-cord fault is shown in Figure 6a, and its correlation coefficients with Daubechies (db), Biorthogonal (bior), Coiflet (coit), and Symlet (sym) wavelet is shown in Figure 6b. It can be seen that the db13 shows the highest similarity with the arc current pulse. Further analysis of arc current pulses in other loads with different faults is shown in Table 1. Except for the pulses in the SMPS load with cord-cord fault and the motor load with outlet-plug fault, whose optimal selections are db12 and db14, respectively, the wavelet db13 shows the highest similarity with arc current pulses. Therefore, the db13 was selected as the optimal mother wavelet for universal analysis.
3.2.2. Multi-Resolution Analysis
After selecting the optimal mother wavelet, the arc current signals in 6 sinusoidal cycles were decomposed using the MRA method to analyze the signal frequency range. As illustrated in Figure 7, the input signal is down-sampled by a low pass filter and a high pass filter at level 1 and is decomposed into the approximation component A1 and the detail component D1. The approximate component is then down-sampled by filters at the next level until reaching the highest level. Finally, the arc current signal is decomposed into D1, D2, ···, D8, and A8. As the current signal was detected with a sampling rate (fs) of 1.25 MS/s, the highest frequency of input signal is 625 kHz. The frequency range of the down-sampled approximation (FA,n) and detail (FD,n) component can be given by
where n is a level variable and is from 1 to decomposition level (N) [21,22]. From Figure 7, most of the arc-related signals corresponding to the shoulder are distributed in detail components D6, D7, and D8, whereas D1–D5 reflect the noise and the approximation component A8 presents the mains current. A summary of arc signal distribution in the decomposed components using the same sampling rate and decomposition method is shown in Table 2. Depending on the load type, arc-related signals are distributed in D6–D8 in the resistive and motor load and are distributed in D5–D7 in the SMPS load. A typical example of decomposition of an arc current signal in SMPS load with cord-cord fault is shown in Figure 8. Therefore, a proper arc detection filter should have a frequency range from 2.4 to 39 kHz.
3.3. Design of a Series Arc Detection Filter
Based on the decomposition of arc current signals using the MRA method, a band pass filter (BPF) with frequency of 2.4–39 kHz was designed. Figure 9 shows the circuit diagram and frequency response of arc detection filter, which passes through the arc signal and attenuates the mains current by −38 dB. The BPF was connected with HFCT and its output was transmitted to the DAQ for further analysis.
3.4. Analysis of Signal Energy
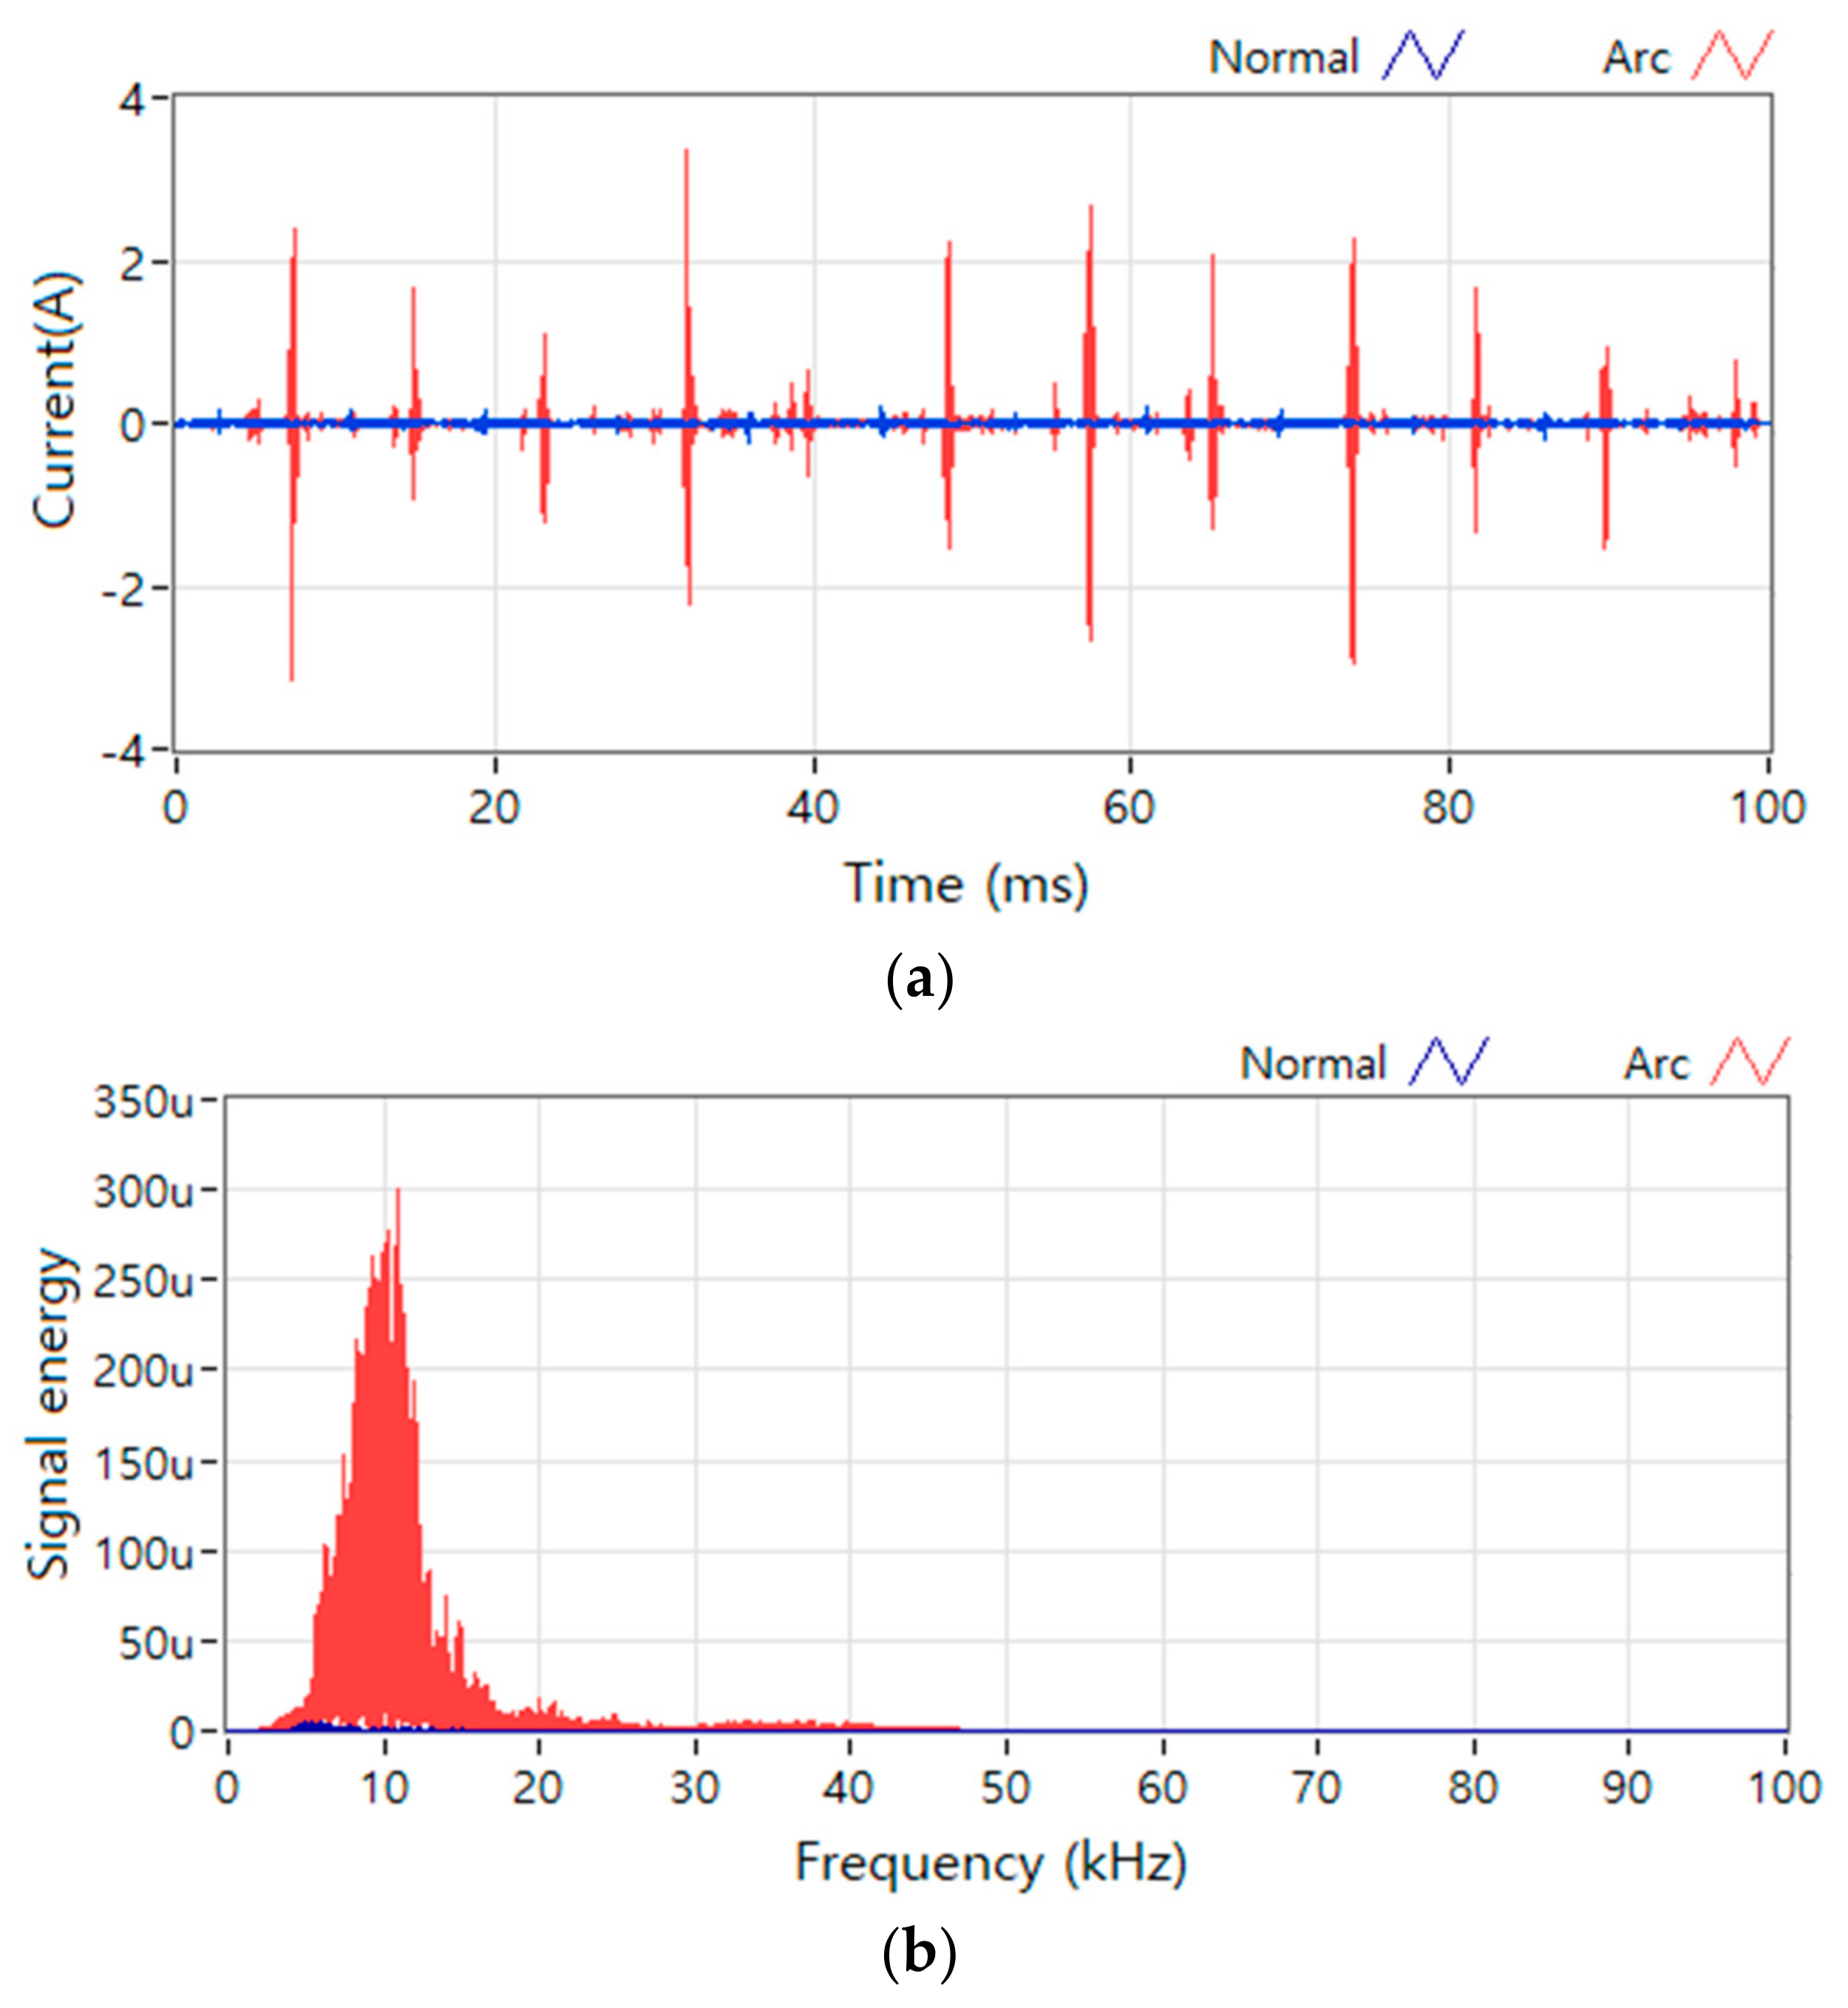
To distinguish the arc condition and normal condition and to attenuate the mains current and noise, the output signals of BPF were compared. As shown in Figure 10, Figure 11 and Figure 12, the sinusoidal mains current is totally attenuated by the BPF, whereas the arc signal is well detected. There is also a great increase in the power frequency, which means that the signal energy can be an indicator of arc occurrence.
The signal energy of a given signal s(t) is defined as
where K is the signal record length and i is a length variable. The signal energy of normal and arc condition in the resistive load are 8.41 and 284.41, and are 42.11 and 3861.02 in the SMPS load, respectively. In the motor load, the signal energy of normal condition is 0.07 and that of arc condition is 6.80. Therefore, the signal energy can be used for distinguishing the normal and arc condition.
4. Arc Diagnosis Algorithm
4.1. Development of the Algorithm
The AC mains current and noise of load can be well eliminated by the BPF and the signal energy can be used for distinguishing the normal and arc condition. However, transient overvoltage and switching may be mistaken as an arc signal as they cause an increase in signal energy. Such disturbances can be solved by observing the signal pulse count. To be specific, transient overvoltage or switching sure occurs only once, whereas the arc signal appears intermittently with pulse count more than 2.
Based on the analysis of arc pulse count and arc signal energy, an arc diagnosis algorithm was developed. Figure 13 shows the flowchart and block diagram of the proposed algorithm. The algorithm operated as follows:
- Detection of an arc signal in a 100 ms period using the HFCT and the BPF.
- Count the pulse number Ni.
- Calculate the signal energy Ei.
- If the pulse number is >2, and the signal energy is 30 times the initial period (E0), an arc alarm operates.
4.2. Case Studies
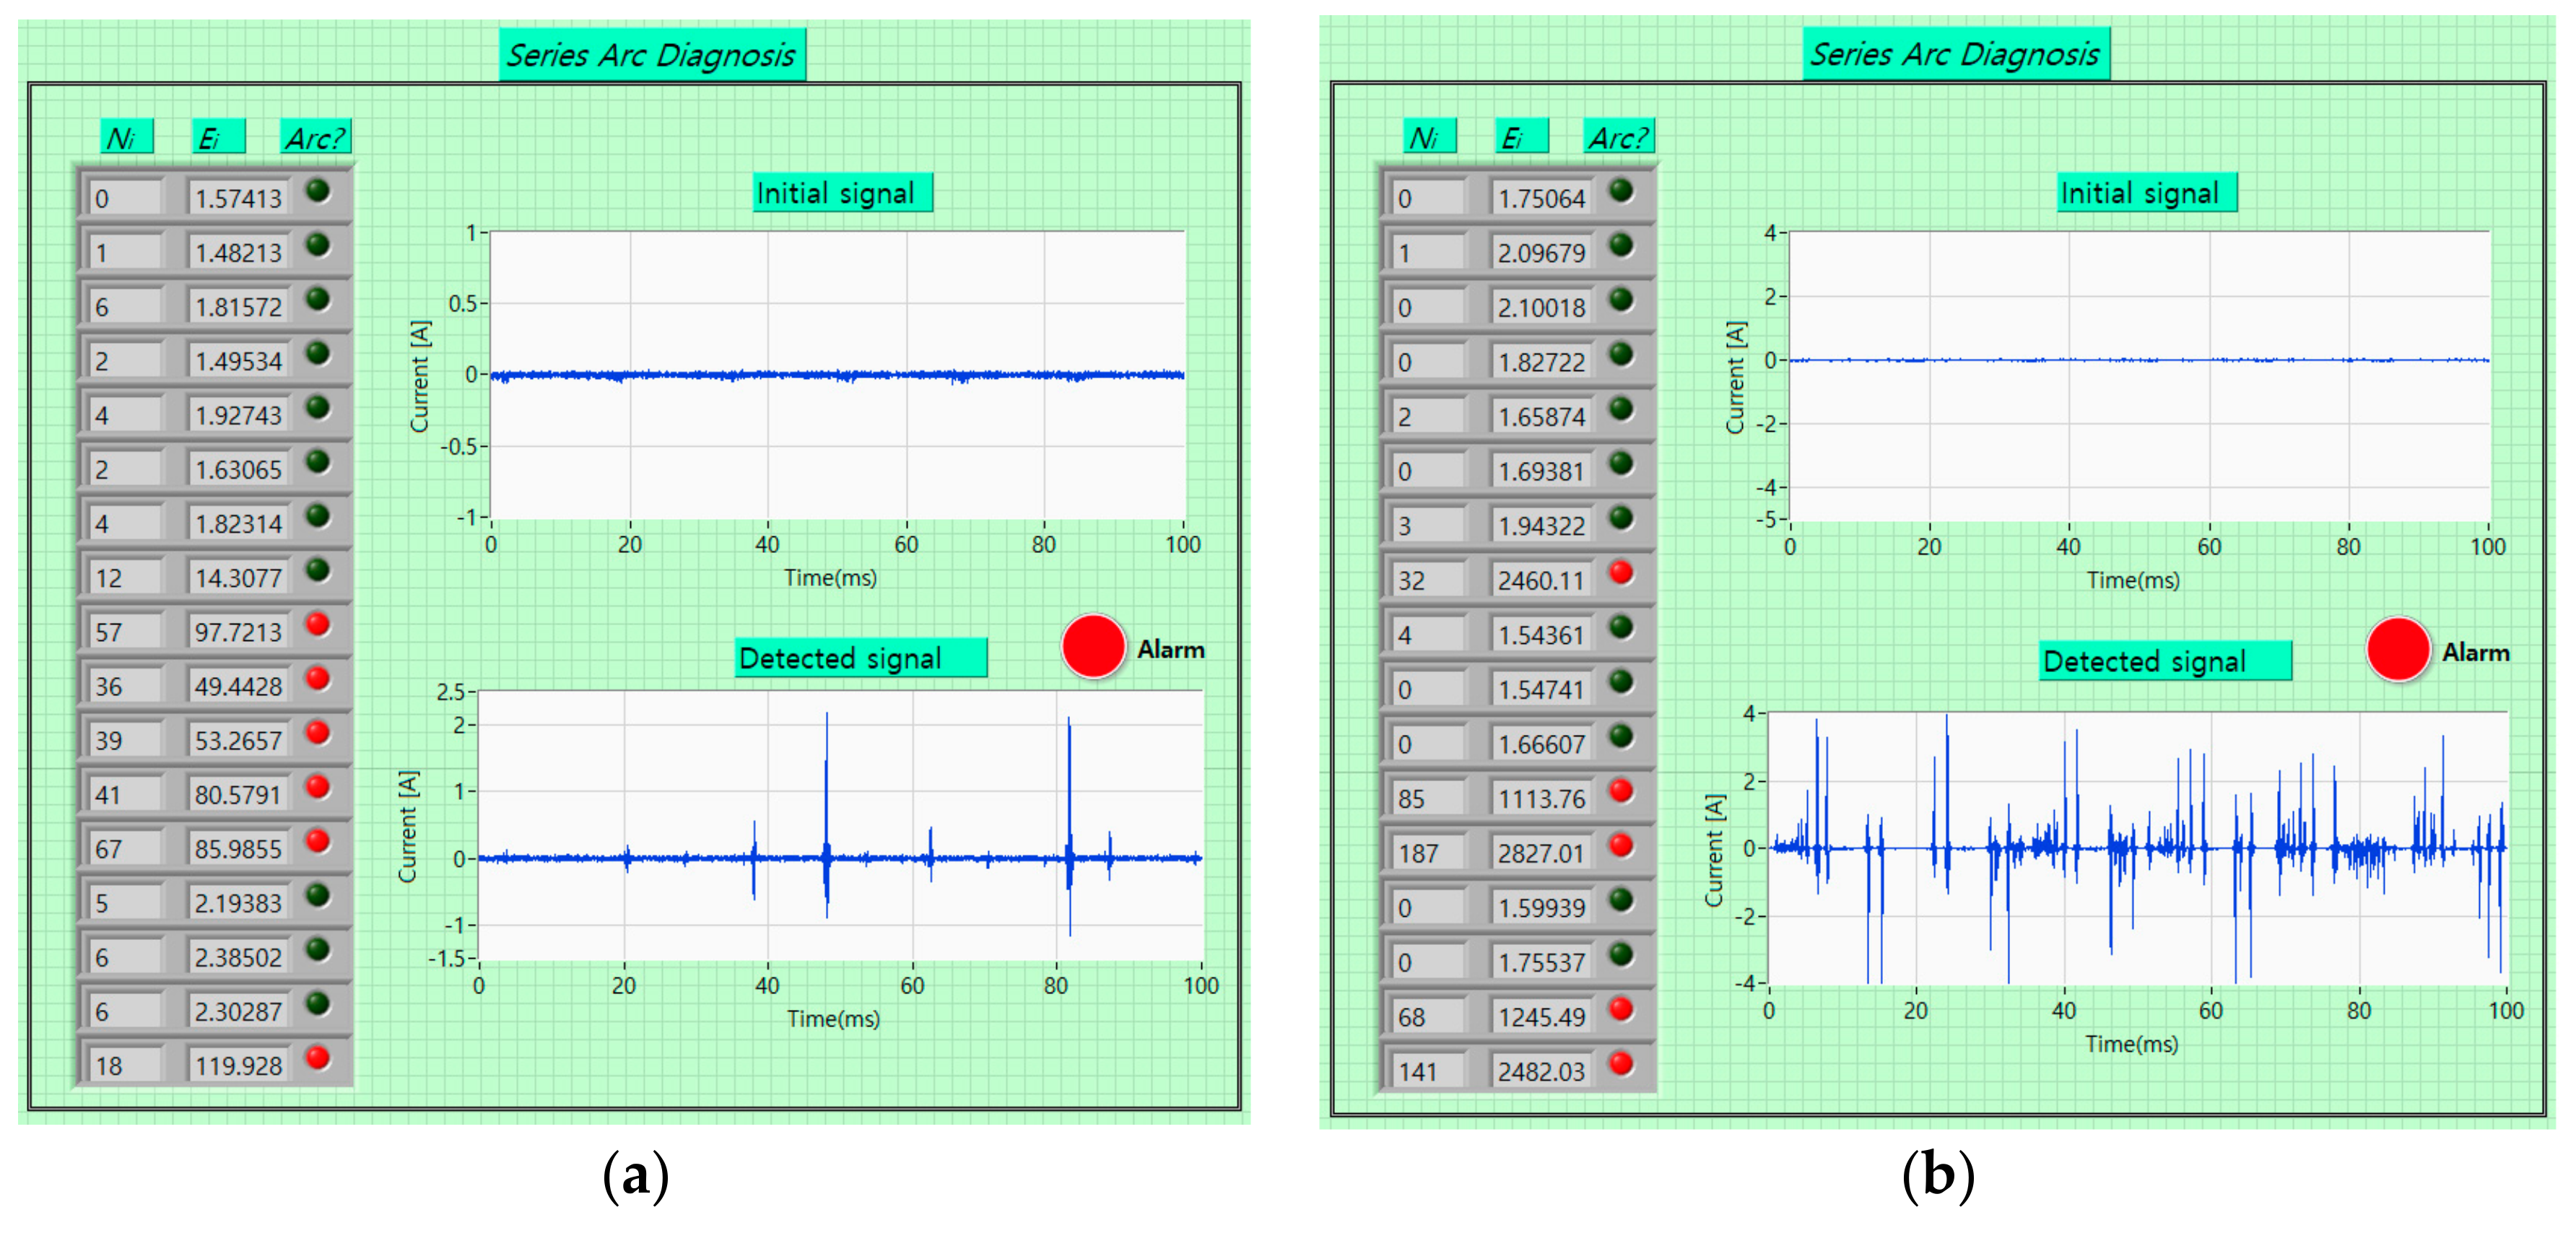
To verify the validity of the proposed algorithm, case studies were carried out to detect arc signal in different loads with faults. Examples of its application in the resistive and SMPS load are shown in Figure 14. As shown in Figure 14a, the initial signal energy in the resistive load is 1.57, as the detected signal has energy over 47.1 and the pulse count is over 2, the alarm warns. In the SMPS load in Figure 14b, initial energy of normal signal is 1.75, the alarm operates only when the energy of the detected signal is higher 52.5 and the arc pulse count is more than 2. It was also confirmed that the proposed algorithm identified arcs accurately in other situations.
5. Conclusions
In this paper, series arc signals in resistive, SMPS, and motor loads with cord-cord, cord-terminal, and outlet-plug faults were detected and analyzed by DWT. After calculating the correlation coefficients between the single arc pulses and wavelets, the optimal mother wavelet used for decomposing arc signals was selected as db13. The arc signals were then decomposed using MRA. From the results, arc signals were distributed in the detail components D5, D6, D7, and D8, corresponding to the frequency range of 2.4–39 kHz, based on which the optimal arc detection filter was designed and fabricated. By investigating the filtered signal, it was confirmed that the signal energy of an arc condition was more than 30 times of that of normal condition and that arcing occurred at least twice in 6 sinusoidal cycles. Therefore, the arc diagnosis algorithm was developed by analyzing the arc signal energy and the pulse count, and has potential for preventing electrical fires.
Author Contributions
Hong-Keun Ji and Guoming Wang conceived and designed the experiments and algorithm; Hong-Keun Ji and Woo-Hyun Kim performed the experiments; Hong-Keun Ji and Gyung-Suk Kil analyzed the data; Gyung-Suk Kil was the supervisor of this work and provided the insight and technical expertise to improve the quality of this paper; Hong-Keun Ji and Guoming Wang wrote the paper.
Conflicts of Interest
The authors declare no conflict of interest.
References
- National Fire Data System. Available online: http://www.nfds.go.kr/fr_base_0001.jsf (accessed on 30 November 2017).
- John, J.S. Condition for series arcing phenomena in PVC Wiring. IEEE Trans. Compon. Packag. Manuf. 2007, 30, 532–537. [Google Scholar] [CrossRef]
- George, D.G.; Gary, W.S. The arc-fault circuit interrupter: An emerging product. IEEE Trans. Ind. Appl. 1998, 34, 928–933. [Google Scholar] [CrossRef]
- Moon, W.S.; Kim, J.C.; Jo, A.; Bang, S.B.; Koh, W.S. Ignition characteristics of residential series arc faults in 220-V HIV wires. IEEE Trans. Ind. Appl. 2015, 51, 2054–2059. [Google Scholar] [CrossRef]
- Underwriters Laboratories. UL 1699 Standard for Arc-Fault Circuit-Interrupters, 3rd ed.; UL: Northbrook, IL, USA, 2017. [Google Scholar]
- International Electrotechnical Commission. IEC 62606 General Requirements for Arc Fault Detection Devices, 1st ed.; IEC: Geneva, Switzerland, 2013. [Google Scholar]
- Wu, C.J.; Liu, Y.W. Smart detection technology of series arc fault on low-voltage indoor power lines. Int. J. Electr. Power Energy Syst. 2015, 69, 391–398. [Google Scholar] [CrossRef]
- Yang, K.; Zhang, R.; Yang, J.; Liu, C.; Chen, S.; Zhang, F. A novel arc gault detector for early detection of electrical fires. Sensor 2016, 16, 500. [Google Scholar] [CrossRef] [PubMed]
- Carlos, E.R. Arc Fault Detection and Discrimination Methods. In Proceedings of the IEEE Holm Conference on Electrical Contacts, Pittsburgh, PA, USA, 16–19 September 2007; pp. 115–122. [Google Scholar]
- Lin, Y.H.; Liu, C.W.M.; Chen, C.S. A new PMU-based fault detection/location technique for transmission lines with consideration of arcing fault discrimination-part I: Theory and algorithms. IEEE Trans. Power Deliv. 2006, 19, 1587–1593. [Google Scholar] [CrossRef]
- Naidu, M.; Thomas, J.S.; Suresh, G. Arc fault detection scheme for 42-V automotive DC networks using current shunt. IEEE Trans. Power Electron. 2006, 21, 633–639. [Google Scholar] [CrossRef]
- George, D.G.; Kon, W.; Robert, F.D. More about Arc-Fault Circuit interrupter. IEEE Trans. Ind. Appl. 2004, 40, 1006–1011. [Google Scholar] [CrossRef]
- Wang, G.M.; Kim, S.J.; Kil, G.S.; Kim, S.W. Optimization of wavelet and thresholding for partial discharge detection under HVDC. IEEE Trans. Dielectr. Electr. Insul. 2017, 24, 200–208. [Google Scholar] [CrossRef]
- Moula, B.; Mekhaldil, A.; Teguar, M.; Haddad, A. Characteristics of discharge on non-uniformly polluted glass surface using a wavelet transform approach. IEEE Trans. Dielectr. Electr. Insul. 2013, 20, 1457–1466. [Google Scholar] [CrossRef]
- Ucar, F.; Alcin, O.F.; Dandil, B.; Ata, F. Power quality event detection using a fast extreme learning machine. Energies 2018, 11, 145. [Google Scholar] [CrossRef]
- Antonino-Daviu, J.; Riera-Guasp, M.; Roger-Folch, J.; Martinez-Jimenez, F.; Peris, A. Application and optimization of the discrete wavelet transform for the detection of broken rotor bars in induction machines. Appl. Comput. Harmon. Anal. 2006, 21, 268–279. [Google Scholar] [CrossRef]
- Hernandez, J.C.; Antonino-Daviu, J.; Martinez-Jimenez, F.; Peris, A. Comparison of different wavelet families for broken bar detection in induction motors. In Proceedings of the 2015 IEEE International Conference on Industrial Technology (ICIT), Seville, Spain, 17–19 March 2015; pp. 3220–3225. [Google Scholar] [CrossRef]
- Chang, H.H.; Linh, N.W. Statistical feature extraction for fault locations in nonintrusive fault detection of low voltage distribution systems. Energies 2017, 10, 611. [Google Scholar] [CrossRef]
- Xu, Z.; Tang, J.; Sun, C. Application of complex wavelet transform to suppress white noise in GIS UHF PD Signals. IEEE Trans. Power Deliv. 2007, 22, 1498–1504. [Google Scholar] [CrossRef]
- Wang, G.M.; Kil, G.S.; Ji, H.G.; Lee, J.H. Disturbance elimination for partial discharge detection in the spacer of gas-insulated switchgears. Energies 2017, 10, 1762. [Google Scholar] [CrossRef]
- Imoru, O.; Bhaskar, M.A.; Jimoh, A.A.-G.; Hamam, Y. Diagnosis of stator shorted-turn faults in induction machines using discrete wavelet transform. Afr. J. Sci. Technol. Innov. Dev. 2017, 9, 349–355. [Google Scholar] [CrossRef]
- Gritli, Y.; Lee, S.B.; Filippetti, F.; Zarri, L. Advanced diagnosis of outer cage damage in doublesquirrel-cage induction motors under time-varying conditions based on wavelet analysis. IEEE Trans. Ind. Appl. 2014, 50, 1791–1800. [Google Scholar] [CrossRef]
Figure 1.
Cause of electrical fires in South Korea in 2010–2016. (Data from Korea National Fire Data System.)
Figure 1.
Cause of electrical fires in South Korea in 2010–2016. (Data from Korea National Fire Data System.)

Figure 2.
Types of arc faults. (a) series arc; (b) parallel arc; (c) ground arc.

Figure 3.
Fire accidents caused by series arc. (a) Cord-cord; (b) cord-terminal; (c,d) outlet-plug.

Figure 4.
Typical current waveforms of a series arc. (a) Resistive load; (b) switched-mode power supply (SMPS) load.
Figure 4.
Typical current waveforms of a series arc. (a) Resistive load; (b) switched-mode power supply (SMPS) load.

Figure 5.
Experimental setup.

Figure 6.
Correlation coefficient between arc current pulse in the resistive load with cord-cord fault and various wavelets. (a) An example of arc current pulse; (b) result of correlation coefficient calculation.
Figure 6.
Correlation coefficient between arc current pulse in the resistive load with cord-cord fault and various wavelets. (a) An example of arc current pulse; (b) result of correlation coefficient calculation.

Figure 7.
Decomposition of arc current signal in the resistive load with cord-cord fault.

Figure 8.
Decomposition of arc current signal in the SMPS load with cord-cord fault.

Figure 9.
Arc detection filter. (a) Circuit diagram; (b) frequency response.

Figure 10.
Output signal of the band pass filter (BPF) in the resistive load. (a) Time domain signal; (b) power spectrum.
Figure 10.
Output signal of the band pass filter (BPF) in the resistive load. (a) Time domain signal; (b) power spectrum.

Figure 11.
Output signal of the BPF in the SMPS load. (a) Time domain signal; (b) power spectrum.

Figure 12.
Output signal of the BPF in the motor load. (a) Time domain signal; (b) power spectrum.

Figure 13.
Development of an arc diagnosis algorithm. (a) Flowchart; (b) block diagram.

Figure 14.
Application of the proposed algorithm. (a) In the resistive load; (b) in the SMPS load.


Table 1.
Results of optimal mother wavelet selection.
| Load | Series Arc Fault | Optimal Mother Wavelet | Correlation Valve |
|---|---|---|---|
| Resistive load | Cord-cord | db13 | 0.204 |
| Cord-terminal | db13 | 0.291 | |
| Outlet-plug | db13 | 0.227 | |
| SMPS | Cord-cord | db12 | 0.181 |
| Cord-terminal | db13 | 0.232 | |
| Outlet-plug | db13 | 0.236 | |
| Motor | Cord-cord | db13 | 0.247 |
| Cord-terminal | db13 | 0.258 | |
| Outlet-plug | db14 | 0.204 |
Table 2.
Distribution of arc signal in the decomposed components.
| Load | Series Arc Fault | Arc Signal Distribution | Frequency Range (kHz) |
|---|---|---|---|
| Resistive load | Cord-cord | D6, D7, D8 | 2.4–19.5 |
| Cord-terminal | D6, D7, D8 | ||
| Outlet-plug | D6, D7, D8 | ||
| SMPS | Cord-cord | D5, D6, D7 | 4.8–39 |
| Cord-terminal | D5, D6, D7 | ||
| Outlet-plug | D5, D6, D7 | ||
| Motor | Cord-cord | D6, D7, D8 | 2.4–19.5 |
| Cord-terminal | D6, D7, D8 | ||
| Outlet-plug | D6, D7, D8 |
© 2018 by the authors. Licensee MDPI, Basel, Switzerland. This article is an open access article distributed under the terms and conditions of the Creative Commons Attribution (CC BY) license (http://creativecommons.org/licenses/by/4.0/).
Share and Cite
MDPI and ACS Style
Ji, H.-K.; Wang, G.; Kim, W.-H.; Kil, G.-S. Optimal Design of a Band Pass Filter and an Algorithm for Series Arc Detection. Energies 2018, 11, 992. https://doi.org/10.3390/en11040992
AMA Style
Ji H-K, Wang G, Kim W-H, Kil G-S. Optimal Design of a Band Pass Filter and an Algorithm for Series Arc Detection. Energies. 2018; 11(4):992. https://doi.org/10.3390/en11040992
Chicago/Turabian StyleJi, Hong-Keun, Guoming Wang, Woo-Hyun Kim, and Gyung-Suk Kil. 2018. "Optimal Design of a Band Pass Filter and an Algorithm for Series Arc Detection" Energies 11, no. 4: 992. https://doi.org/10.3390/en11040992
Note that from the first issue of 2016, this journal uses article numbers instead of page numbers. See further details here.