Fostering Renewables into the Cold Chain: How Photovoltaics Affect Design and Performance of Refrigerated Automated Warehouses


Polytechnic Department of Engineering and Architecture, University of Udine, 33100 Udine, Italy
*
Author to whom correspondence should be addressed.
Energies 2018, 11(5), 1029; https://doi.org/10.3390/en11051029
Submission received: 20 February 2018
/
Revised: 6 April 2018
/
Accepted: 19 April 2018
/
Published: 24 April 2018
(This article belongs to the Special Issue Energy Efficiency in the Supply Chains and Logistics)
Abstract
:In the industrial food supply chain, cold storage is one of the most important processes where there is a huge but still unused potential for employing renewable energy technologies. This paper analyses how the integration of rooftop photovoltaics affects the design and performance of refrigerated automated warehouses, which are becoming the preferred choice for frozen food storage facilities. The problem is modelled and solved by means of Constraint Programming. Results for the reference case in north-eastern Italy show that photovoltaic installation can lead to both yearly total cost and energy savings. Simulations highlight how design and performance of the refrigerated automated warehouse strictly depend on supply chain decision variables. PV integration offers supply chain managers more opportunities to act on the storage temperature and the incoming product temperatures strictly related to upstream and downstream stages of the whole cold chain. Attention should be paid to system throughput, which presents an intermediate range for which the design optimization of volume and surfaces reduces the convenience of PV integration. Simulations on facility locations reveal how different climate conditions affect the economic and environmental performance of the refrigerated warehouse, as well as country specific carbon intensity and energy price.
1. Introduction
The evolution of supply chains towards sustainability requires the adoption of design and management solutions able to capture the triple bottom line concept [1], thus leading to long-term economic, environmental, and social benefits. Energy saving, both in terms of energy efficiency and reduction of fossil fuel consumption, becomes one of the most significant performances to be achieved within a sustainable perspective [2].
The United Nations’ Sustainable Energy for All (SE4All) initiative is grounded on three interlinked global objectives to be achieved by 2030: (1) ensuring universal access to modern energy services; (2) doubling the global rate of improvement in energy efficiency; and (3) doubling the share of renewables in the global energy mix. As highlighted by IRENA [3] synergies between the energy efficiency and renewable energy objectives of SE4All can be found. Most forms of renewable power generation offer efficiency gains which are superior to those from fossil fuel and nuclear power generation technologies. Furthermore, decentralized renewables and energy efficiency can be combined through various demand-response, smart-grid, and intermediate energy storage systems, so that a cost-efficient integration of renewable energy sources into power systems is achieved by lowering and shifting peak loads [4]. The quantitative assessment involving the eight countries which cover half of the global energy use has shown that implementing energy efficiency measures and renewable energy options at the same time contributes significantly to increase the renewable energy share in the total final energy consumption and to accelerate the rate of annual energy intensity improvements with a 5–10% decrease by 2030 [3]. It is possible to conclude that energy efficiency measures allow the share of renewables to be increased and that renewable technologies can be considered to be one of the possible measures for improving energy efficiency [5].
Therefore, the penetration of renewable energy sources (RES) into supply chains combined with energy-efficient design and management of facilities can significantly contribute to their sustainability and ultimately to the SE4All global objectives.
As underlined by Fikiin et al. [6], cold chains possess a huge but still unused potential for employing renewable energy technologies. Industrial food refrigeration represents a major energy consumer on a global scale, since approximately 40% of food products require refrigeration [7], but it is considered a comparatively conservative sector because of its high reliance on fossil fuels (79% according to [8]). Cold storage, in particular, has been recognized as one of the most important processes in the UK cold chain in terms of energy saving potential [9]. As underlined by [10] in their recent review on food supply chain modelling, temperature-controlled sustainable storage is a crucial element to enhance sustainability of the whole chain and deserves further optimization efforts. RES integration in refrigerated food storage facilities, due to capture of a large portion of virtually free energy, can provide cost-efficient means for reducing electricity requirements from the grid, and/or shifting refrigeration loads from peak to low consumption periods, thus contributing to the overall balance of the power supply system, minimizing the environmental footprint of the refrigerated warehouses, and enhancing their economic competitiveness [6].
On the other hand, automated warehouses have been recognized as energy efficient facilities [11]. Since they can store inventory more densely, especially with recent multiple depth lanes served by autonomous satellites, and exploit vertical space better than traditional ones, lower energy is required to cool, light, and ventilate the storage space.
In this research, in situ photovoltaic power generation (PV) is coupled with efficient refrigerated automated storage and retrieval systems (R-AS/RSs) by installing PV panels on the roof. The aim is analyzing how the introduction of this renewable energy source can affect the design and performance of an automated storage facility within a cold chain. Refrigerated warehouses have even stronger interfaces with their supply chain than ambient storage facilities due to temperature control to be assured along the whole cold chain. A virtuous decision-making cycle towards sustainability can be activated as depicted in [12], where the storage facility is designed and/or managed departing from input decided at supply chain level, but in turn a feedback of achievable performance is reported to the supply chain manager that can revise decisions on the whole logistic network accordingly. Therefore, we wonder how PV introduction modifies the configuration of the warehouse in terms of rack structure and building surfaces and which energy savings can be achieved affecting its economic and environmental performance.
2. A Framework for PV, R-AS/RS, and Cold Chain Interactions
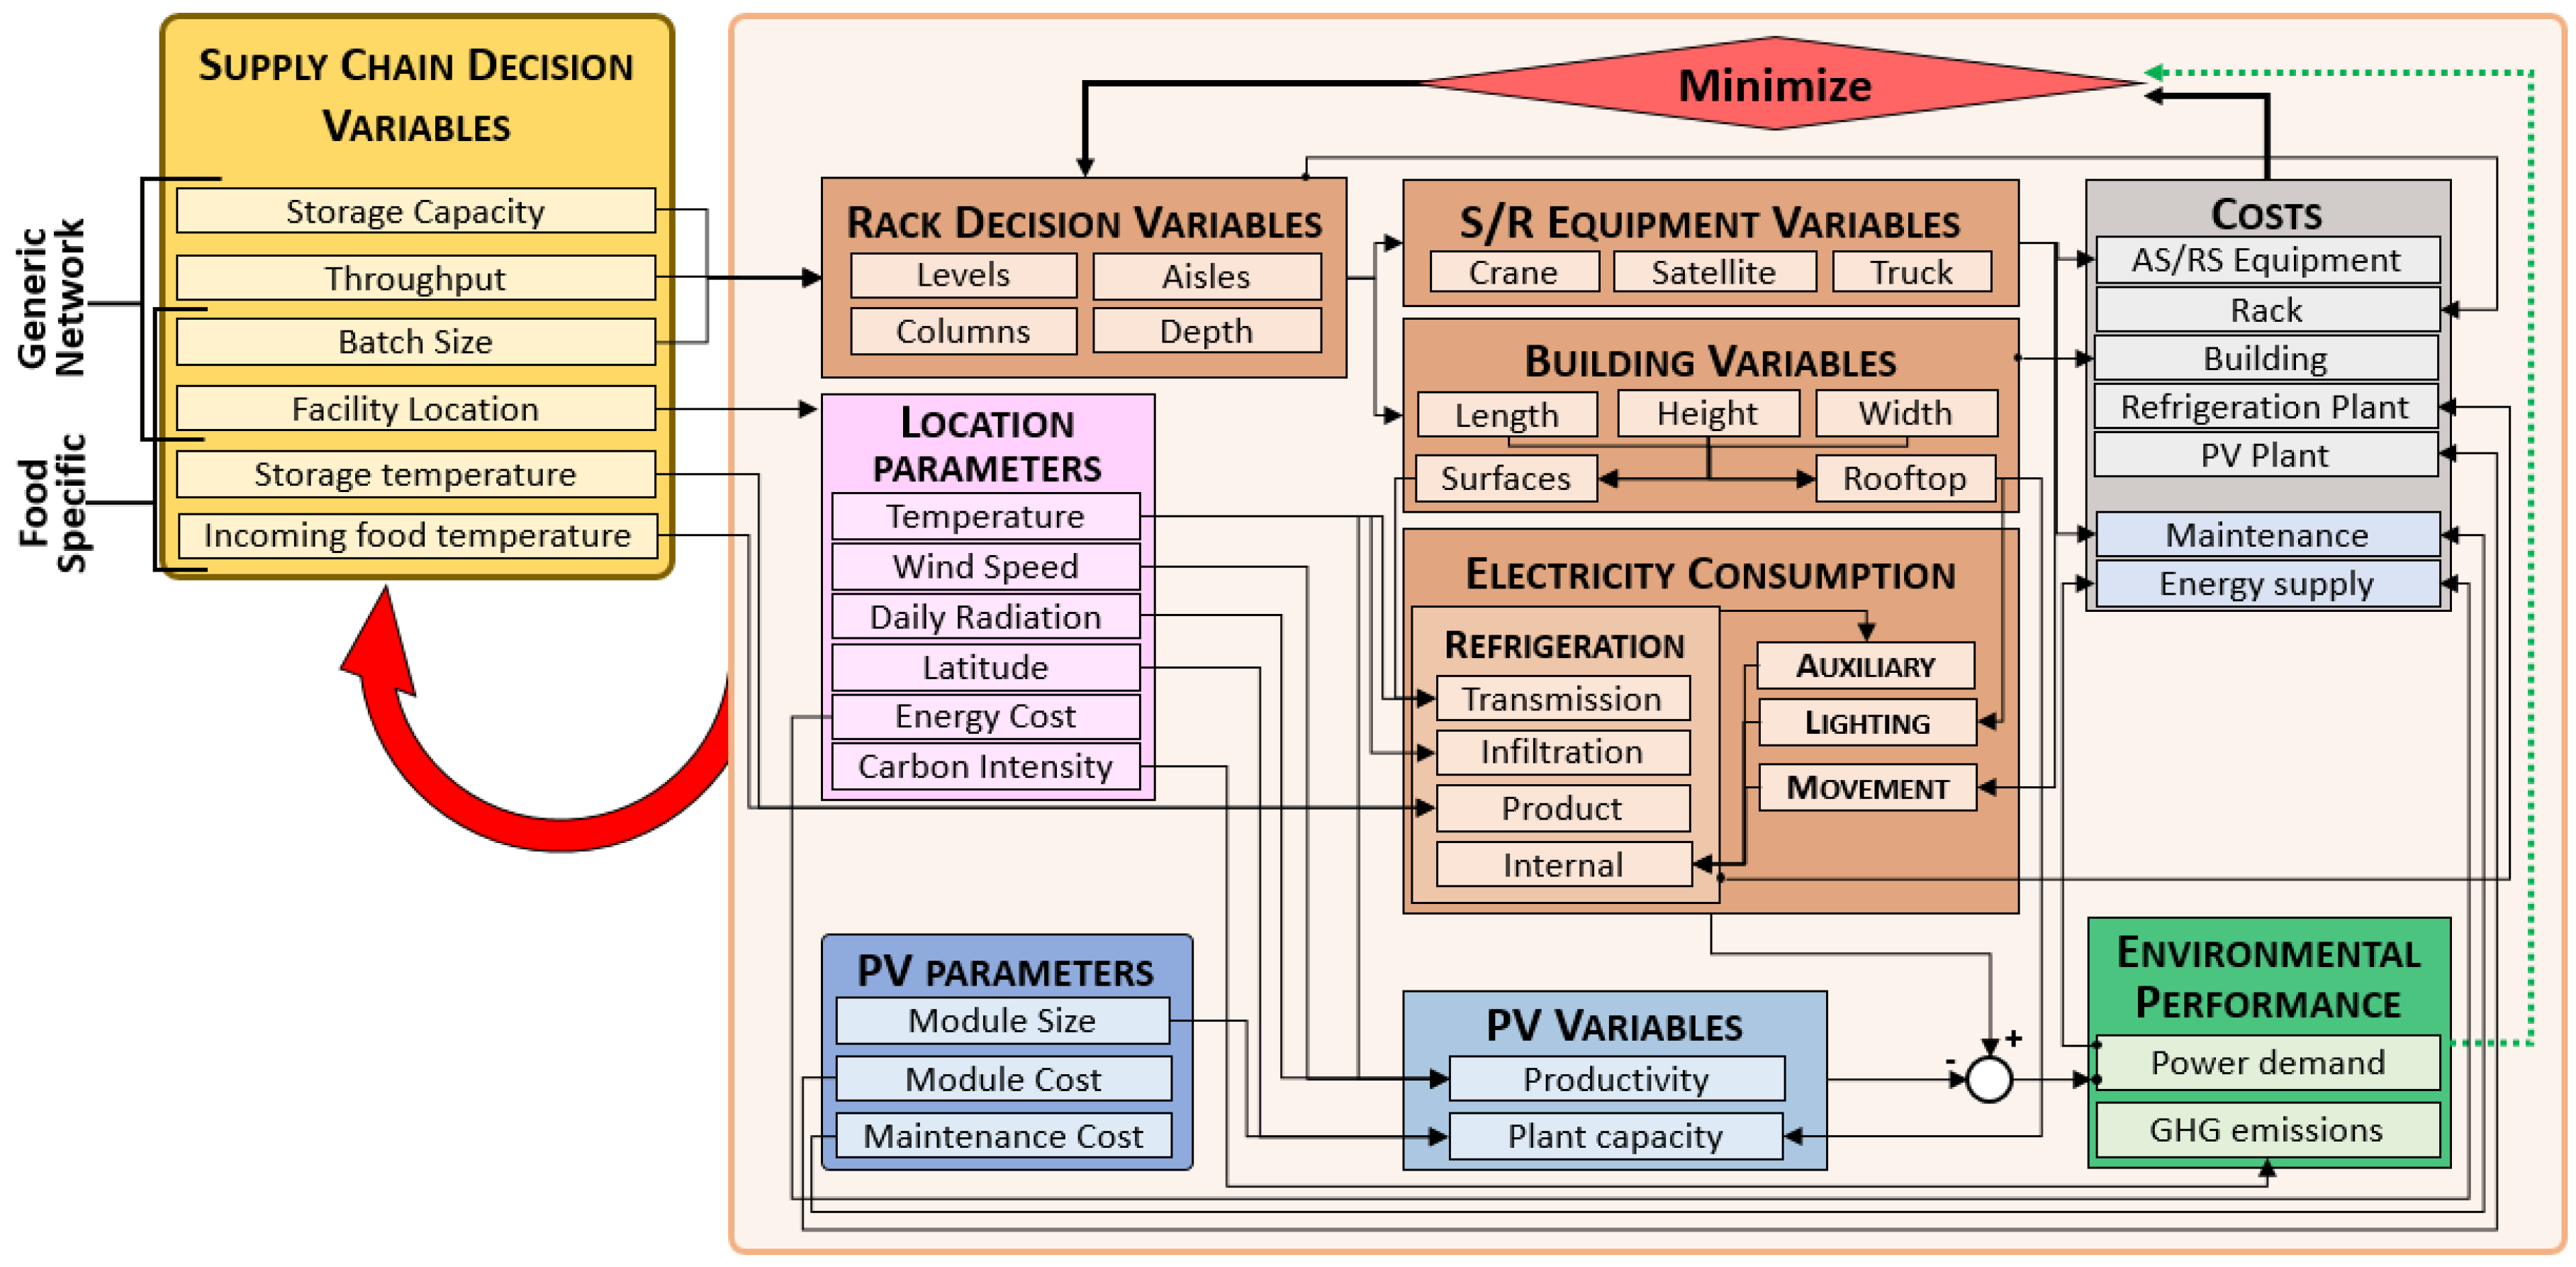
When designing a sustainable R-AS/RS, most inputs are defined at supply chain level (see the yellow block in Figure 1). Some are typical of all logistic networks. Examples are storage capacity and required throughput, which impact on the rack structure and selected crane, since enough unit loads should be hosted and cycle times for storage and retrieval operations should meet the desired pace. Others deserve particular attention in the food supply chain, such as replenishment batch size, which should be defined not only based on the selected supply and inventory policy, but also on temperature control [13]. Batch size impacts in particular on the lane depth of a R-AS/RS served by autonomous satellites, which should be a common divisor of the replenishment lot to assign the whole lane to the same product and avoid additional operations to retrieve unit loads in intermediate positions. It is worthwhile underlining how storage capacity, throughput, and batch size should reflect also the lean aptitude of a given cold chain. Facility location affects not only land and transport costs, but also the refrigeration ones, since outdoor temperature impacts on transmission loads through surfaces of facilities and trucks, and ultimately on the food temperature during the various stages of the logistic network. Finally, some decisions are typical of the cold chain, such as the temperature to be maintained in the refrigerated cell, which affects product loads, infiltration, and transmission. The temperature of incoming products, which depends on temperature control during previous stages of the cold chain, affects the portion of refrigeration load related to decrease food temperature to meet the cell one (see [14]).
PV capacity and productivity (see the light blue block in Figure 1) depend on outdoor temperature, wind, solar radiation, and latitude (see the following Section 3.2.3), which are characteristic of a given location. The number of PV panels that can be installed on the roof of the warehouse depends on the available surface (other than on location latitude which affects panels distance), therefore on building shape and size: the more the available area, the more solar energy can be converted into electric power. To capture free solar energy, horizontal space should be expanded, while efficient R-AS/RSs tend to exploit vertical space thanks to cranes and to compact storage by adopting deep lanes served by autonomous satellites. Therefore, a trade-off can arise when introducing PV in the design phase of a R-AS/RS and should be properly investigated.
Once the R-AS/RS integrated with rooftop PV has been designed to foster its sustainability, its performances can be used, in turn, by the supply chain manager to modify the attributes of the storage stages in supply chain models, thus introducing renewables as a further chance for greening the whole cold chain in a virtuous cycle.
3. The Design Optimization Model for R-AS/RS with PV
Rooftop photovoltaic power generation for self-consumption has been largely studied for residential buildings (see [15] for a review), while they have been extended to commercial ones recently [16]. Most recent studies analyze PV integration with Battery Energy Storage Systems (BESS) (e.g., [16,17,18,19,20,21]).
Regarding specifically rooftop PV installation on refrigerated warehouses, very few studies have been developed, basing on the consideration that PV power generation follows the same pattern of refrigeration requirements, i.e., higher in warm daily periods, lower in cold ones. In particular, in [4] a refrigerated warehouse combined with PV generation is analyzed in a smart grid setting, maximizing profits of sold PV energy minus the cost of electricity withdrawn from the grid under different electricity tariff structures. In [22] a cold store in India is sized for complete self-sufficiency; the power required for running the vapor compression refrigeration system is met by the power generated by photovoltaic panels.
In our model, a R-AS/RS equipped with rooftop PV for frozen products is designed to fully exploit self-consumption without BESS, since PV power generation is expected to cover only a portion of energy requirements at so low temperatures and the decreasing pattern of feed-in tariff makes not convenient selling to the grid.
Constraint Programming (CP) has been chosen to model and solve the PV integrated R-AS/RS design problem. The unlimited type of relations among the variables that can be adopted to describe the required objective and the desired properties of the solutions represents the main advantage of CP [23]. Constraint-based systems are usually easier to modify and maintain than other methodologies, such as genetic algorithms, simulated annealing and tabu search, because the modelling phase is separated from the solving one. This feature allows the main structure of the model to be preserved while easily adding or removing constraints. The requirement translation of different stakeholders, such as component suppliers and facilities managers, is easily achieved thanks to this flexibility. The Comet package has been used to develop the model since it provides an object-oriented language with many control and modelling abstractions [24]. In addition, Comet package embeds the best search strategies and algorithms developed by the CP research community.
The domain of each decision variable is properly fixed to allow the identification of the optimal system configuration by generating and processing a finite number of potential configurations of the system. For example, the supply order quantities of stored items are considered for the selection of the set of possible values for lane depth. In multiple deep racks, in facts, selectivity enhancement and extra picking operations avoidance are achieved by assigning the same item to a whole lane per level and therefore only sub-multiples of order quantities can be taken into account for lane depth domain. The air coolers cover radius sets the limits on maximum horizontal development, while the system height is limited by proper air circulation. Similarly, PV modules are limited by potential roof surfaces.
Similarly to [25], the existing gap between actual practice and theoretical models has been reduced by employing actual suppliers’ catalogues and design procedures for the selection of frames and beams for rack structure. Specific energy models of the AS/RS are introduced to assign the appropriate energy demand to each feasible solution to be considered by the objective function, as described in the following Section 3.1. PV power generation has been modelled as described in detail in the following Section 3.2.
To model the interaction between refrigeration requirements and PV power generation properly, a multi-period approach has been adopted, by dividing the reference year into time windows, each associated with specific climate characteristics (e.g., outdoor temperature, solar radiation) affecting power consumption and/or PV production. In this case, the trade-off between model accuracy, data collection and processing effort has been solved in favor of a more pronounced hourly specification in comparison to both the previous R-AS/RS model by [12] with day and night division per month only (i.e., 24 periods per year), and wide-spread multi-period models for district heating (e.g., [26] with 56 periods per year). In the proposed model, the average hourly data of each month have been considered in order to catch system behavior in different conditions during a day (e.g., nightly versus sunny hours) and within a year (e.g., summer versus winter months), thus leading to 288 periods.
As common to most optimization models adopted for sustainable supply chains (see [10,27] for recent reviews) the objective function to be minimized is the yearly total cost, which comprehends investment and operational costs (see the grey block in Figure 1). Investment costs include the land and the building, the rack, the cranes and satellites, and the refrigeration equipment (usually an ammonia vapor compression plant [28]). To differentiate the components in terms of expected capital lifetime, their investment costs have been related to one year by a proper annuity factor. Energy supply and maintenance are considered to be the main operational costs. However, to consider a greener perspective, the model allows the designer to select a minimum net energy consumption approach (i.e., energy withdrawal from the grid after consuming all PV generated energy, see the green arrow in Figure 1). In this way, solutions involving the economic dimension of sustainability can be compared to those focused mainly on the environmental one, thus offering local institutions a tool to assess suitable measures to foster solutions matching their policy for sustainability.
3.1. Refrigerated Automated Warehouse Energy Model
According to [14], the energy consumption for refrigeration is given by the sum of the transmission, infiltration, product, and internal loads. Transmission load through the cold cell surfaces is function of outdoor and indoor temperatures for a given level of insulation. Infiltration load is related to doors opening and closing; it depends mainly on outdoor and indoor air densities and enthalpies (and therefore on the related temperatures), and the system throughput, which determines the rate of opening/closing the cell doors to store/retrieve incoming/outcoming unit loads. Product load arises to bring the food to the desired conservation temperature and it is function of cell and incoming product temperatures. The internal load is related to power dissipation in the cold cell mainly by movement equipment, fans, and lighting. The former contribution, in particular, has been estimated as heat dissipation of the mean energy per cycle required by the crane, the satellite, and the truck, depending on machine specifications and rack configuration, as explained by the related energy models in the followings. Mean energy per cycle is then multiplied by the required system throughput to determine the total dissipated heat within the cell.
Refrigeration loads for the 288 time windows of the year have been calculated following ASHRAE (the American Society of Heating, Refrigerating and Air-Conditioning Engineers) guidelines; a detailed translation of load equations into the related CP constraints can be found in [12]. If multiple cells should be considered to reflect different temperature conditions required into the same storage facility, then the model can be applied to dimension each cell with the proper rack structure, movement equipment, and energy requirements basing on supply chain input related to the specific cell products. Conjoint design of the whole warehouse is achieved combining different cells by introducing model constraints on common surfaces and sizing the PV plant on the resulting total roof area covering the whole warehouse.
In an AS/RS, the crane energy consumption is affected by the rack horizontal and vertical development. Specifications of crane motors (one per axis) and crane structure depend on rack dimensions. In particular, the rack dimension that mostly affects such specifications is the storage height, with investment costs growing progressively with it. Also, demand distribution and storage assignment policy impact the energy consumption [29].
This study adopts the energy model detailed in [30], in which the acceleration/deceleration phases of the AS/RS machine are modelled by means of a trapezoidal speed profile as suggested by [31]. To resemble new generation crane behavior, meaning that shifts along the two axes end at the same time, the maximum speed and the acceleration time are recalculated for each location to be reached.
The evidence from discussion with local manufacturers and from suppliers’ catalogues has been considered to stratify the range of possible levels in a R-AS/RS with the aim of properly assign a crane to each possible rack configuration generated by the solver, as reported in [12]. To reduce computational times, the greatest potential rack for each of the four rack classes induced by stratification has been generated. The time and energy related to the storage/retrieval phases for every location within this potential rack have been pre-calculated by applying the above mentioned time and energy model, so that the average cycle time and energy to be associated to the AS/RS machine can be easily computed by mediating on the actual columns and levels selected by the solver for each feasible solution (see [32] for a detailed description of the methodology).
As concerns energy consumption and time for movements within a lane, a simpler model has been adopted, since remote-controlled battery charged satellites are characterized by a lower complexity than an AS/RS crane. To calculate the average cycle time, different speed values have been applied for movements with load on and off board, respectively, when covering the required shift length within the lane. The acceleration/deceleration, pick up/drop off operations, and positioning of the satellite have been considered by adding a fixed-time component. By multiplying power and time value, the evaluation of satellite energy requirement can be finally obtained.
3.2. Photovoltaic Plant and Power Generation Model
In the following subsections, a detailed description of the PV plant and power generation model is provided.
3.2.1. Input Data
The required data to calculate the photovoltaic field production have been downloaded from the CMSAF database of the Photovoltaic Geographical Information System (PVGIS) developed by the Joint Research Centre of the European Commission [33]. In particular, the following data have been retrieved from the PVGIS database for the analyzed sites:
- Optimal tilt angle βo, which is the inclination angle of the PV module that gives the highest energy output for the whole year. Its calculation is based on the plant location latitude Φ;
- In-plane irradiance G on a surface facing south (i.e., azimuth angle α = 0°) and having an inclination angle equal to βo;
- Ambient Temperature Tamb;
- Wind speed v.
The mean daily irradiance, temperature, and wind speed are calculated for each hour during the day of a given month, averaging over all available days of that month during the multi-year horizon considered by PVGIS database. In this way, their specific values for all the 288 hourly periods of the proposed optimization model have been assessed.
3.2.2. Photovoltaic Field Geometry
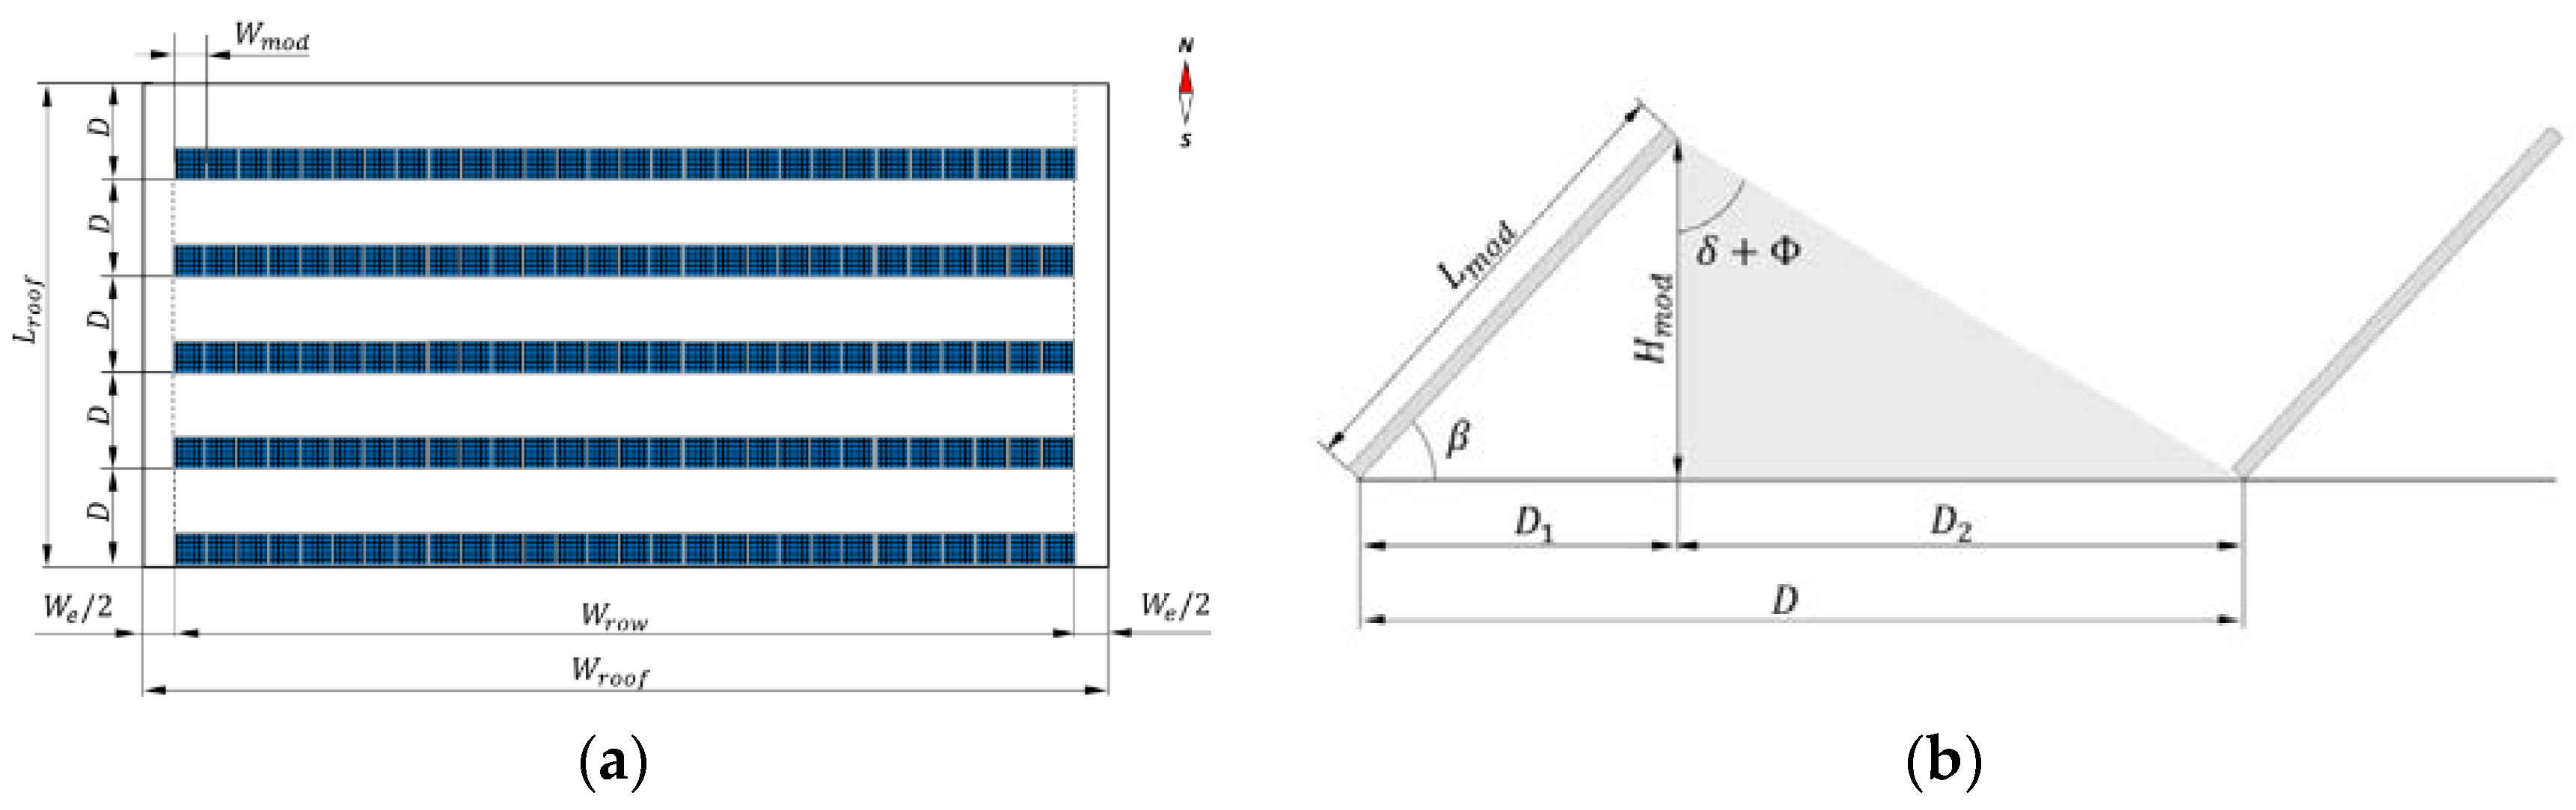
The PV field is installed on a horizontal surface (i.e., the warehouse rooftop) and consists of PV rows each with PV modules (see Figure 2a). The distance between any two consecutive PV rows (see Figure 2a) is calculated so that the shadow of a PV row does not cover the following PV row during the winter solstice (i.e., the day when the sun hits its lowest elevation), as in Equation (1).
where is the module length, is the declination at the winter solstice (i.e., 23.45°) and is the latitude of the location (see Figure 2b). The number of PV modules per row , the number of PV rows and the total number of PV modules are calculated according to Equations (2)–(4), respectively.
where is the width of the PV module, is the width of the warehouse roof and is the space to be left at the edges of the roof for installation issues (see Figure 2a).
3.2.3. Energy Production
The nominal power of the PV plant at standard test condition depends on the nominal power of the PV module and the total number of PV installed modules as in Equation (5).
The energy conversion efficiency of the PV modules depends on several different external influences, among which the temperature of the module and the solar irradiance are particularly important [34]. The PV module temperature depends on the ambient temperature, on the solar irradiance and on the local wind speed. According to [35], PV module temperature can be calculated as in the following Equation (6).
where is the average ambient temperature, the in-plane global irradiance, the average wind speed retrieved from the PVGIS database; is a coefficient describing the effect of the radiation on the module temperature, while describes the cooling by the wind. In [36] the coefficients and of several PV modules have been evaluated experimentally for different types of PV technology. In this paper, the crystalline silicon PV technology has been considered, leading to set = 26.9 W/(K∙m²) and = 6.20 W∙s/(K∙m).
The effect of the PV module temperature and the in-plane global irradiance on the power output of the PV plant can be calculated as in Equation (7), which is based on the methodology reported in [34].
where is the productivity factor of the PV plant, which can be expressed as in Equation (8) and takes into account the system losses related to mismatching, AC/DC conversion, wiring and ageing. JRC recommends using a value of 0.14 for [33].
where the normalized in-plane irradiance and module temperature are given in Equations (9) and (10). The standard test conditions (STC) of the PV module are the in-plane irradiance = 1000 W/m2 and the module temperature = 25 °C.
The coefficients to are determined experimentally; in this study, the coefficients assessed in [37] have been used and reported in Table 1.
The above relations have been translated into the following CP constraint (see Equation (11)), which sets the PV power generation in each i-th period of the optimization model. Model variables are reported in bold face to be differentiated from input parameters. All the coefficients described in the above Equations (1)–(10), which vary from period to period on the basis of ambient conditions, have been pre-processed and summarized into a unique input parameter for each of the 288 time windows of the model. Such parameters are grounded on experimental values reported in the above cited literature, since no data on real installations were available.
4. Results
The proposed optimization model has been applied to the design of a R-AS/RS for frozen palletized food to be maintained at −23 °C, located in the province of Pordenone in north-eastern Italy (latitude 45.8°, longitude 8.6°). The required storage capacity is 4800 unit loads (on standard ISO1 pallets) with a throughput of 45 units/h.
In the following Section 4.1 results of coupling the R-AS/RS with a PV system for the reference case are assessed, when the objective function to be minimized is the yearly total cost of the facility. In Section 4.2 the minimization of energy withdrawal from the national grid is, instead, discussed. Finally, in Section 4.3 the impact of supply chain decision variables on configuration and performance of the R-AS/RS is derived, to trigger a virtuous cycle towards the sustainability of the whole cold chain.
4.1. The Reference Case: Minimising Yearly Total Cost
Table 3 reports the design characteristics and performance of the optimal configuration that minimizes the yearly total cost of the refrigerated warehouse with and without a PV plant. The introduction of the PV system does not affect rack configuration of the R-AS/RS. The same number of columns, levels, aisles, and lane depth are selected. The trade-off between increasing the available PV surface to enhance power generation and compacting the storage volume is highly affected by the high investment cost of vertical elements (rack frames and cranes, especially), leading to the same vertical height and one aisle in both configurations. The introduction of the PV plant affects positively the yearly cost, which is reduced by 1.3%, and allows a reduction of the electricity demand from the grid of 16.4%. Thus, PV adoption increases the sustainability of the refrigerated facility, positively affecting both economic and environmental performance.
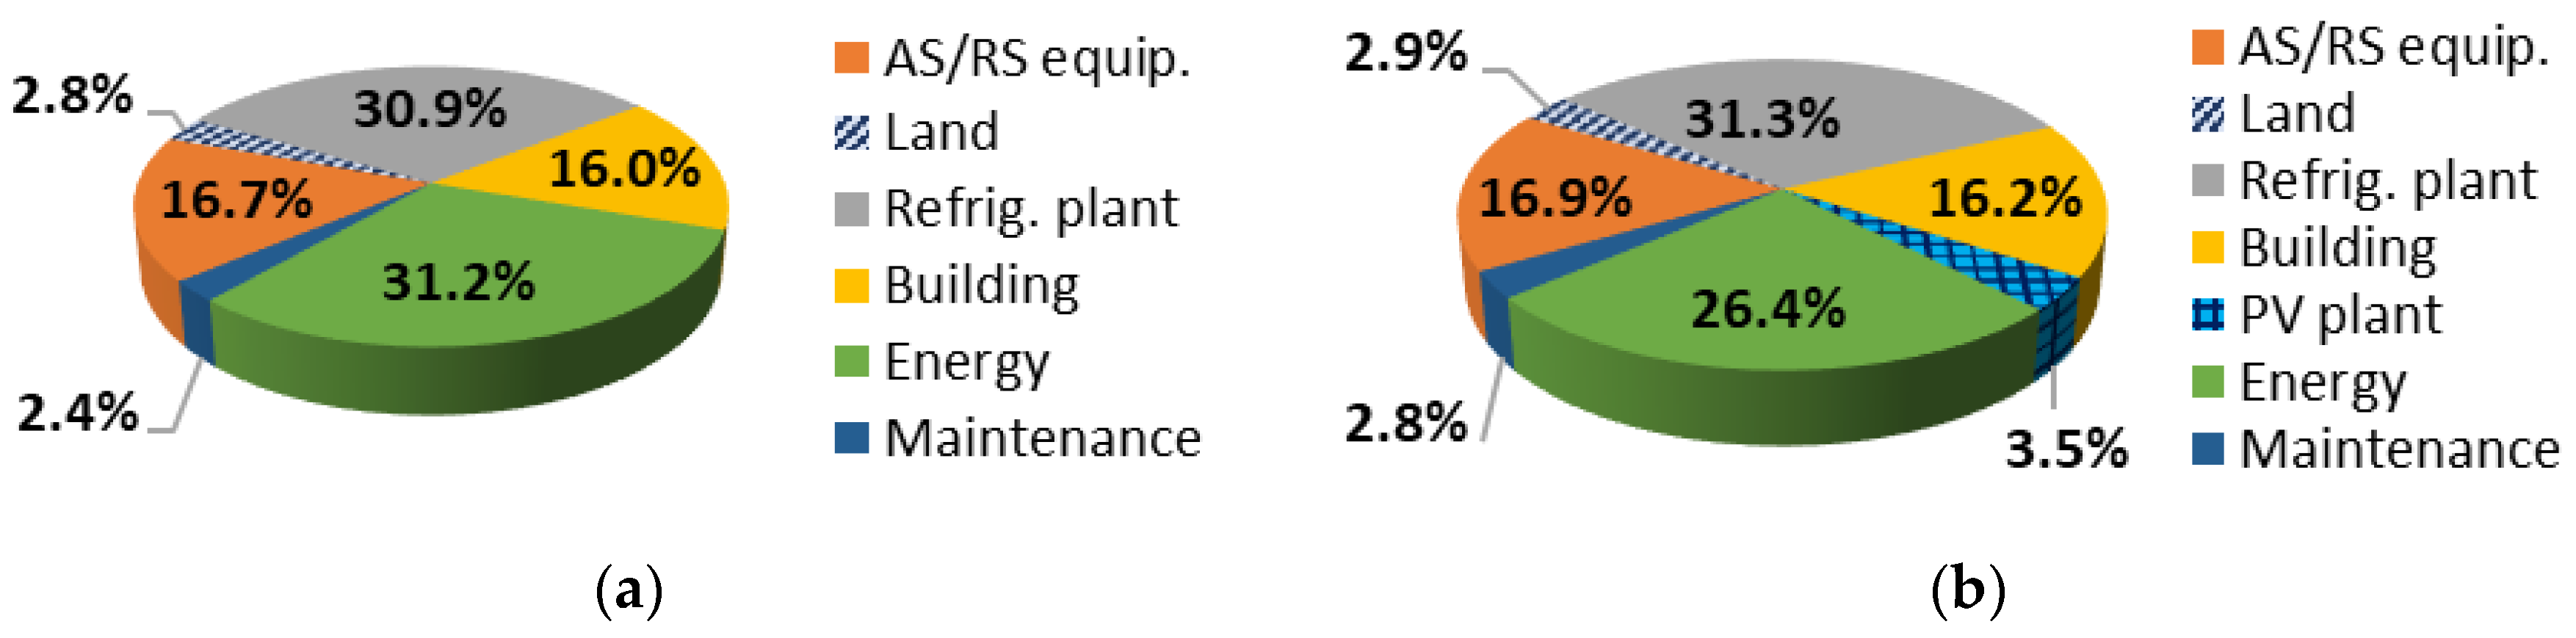
Considering the yearly cost structure of the optimal warehouse configuration without a PV plant reported in Figure 3a, it can be noticed that the energy costs account for 31.2% of yearly total cost, with refrigeration requirements playing the major role (see Figure 4a). The refrigeration plant results to be the most expensive component, accounting for 30.9% of the yearly total cost. The costs of AS/RS (i.e., rack, cranes, and satellites) and building are similar, being 16.7% and 16% of the yearly total cost, respectively. Finally, maintenance and land costs play a minor role accounting just for 2.4% and 2.8% of the yearly total cost, respectively.
The impact of the introduction of the PV plant on the yearly total cost can be observed in Figure 3b. It is worth noting that the energy cost is reduced from 31.2 to 26.4%, while the maintenance cost is increased from 2.4 to 2.8%. The cost of the PV plant accounts for 3.5% of the yearly total cost. The remaining costs are slightly increased.
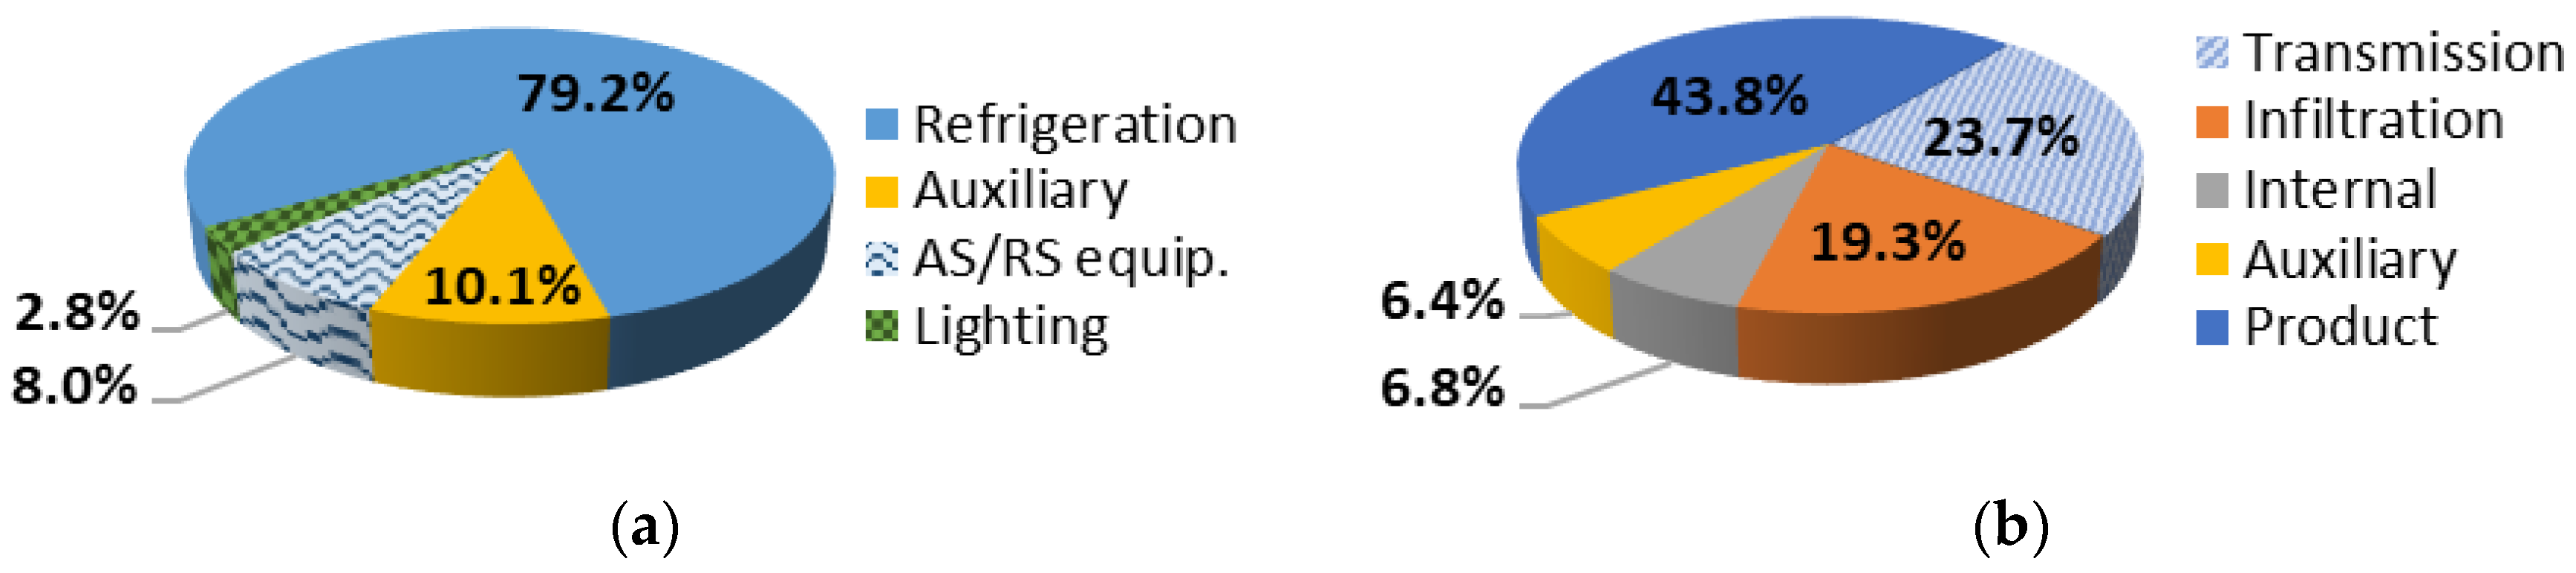
Figure 4a shows the structure of the electricity demand for the optimal solution of the reference case. The refrigeration equipment absorbs 79.2% of the electricity demand, thus representing the most energy intensive component of the refrigerated warehouse. The auxiliary equipment (i.e., fans) and the movement equipment (i.e., cranes, satellites, and trucks) use 10.1% and 8% of the electric energy demand, respectively. Electricity demand of lighting accounts just for 2.8% of the total energy required. The refrigeration load structure is reported in Figure 4b; we can observe that the product cooling covers nearly half refrigeration load, while transmission load and infiltration load represent 23.7% and 19.3%, respectively.
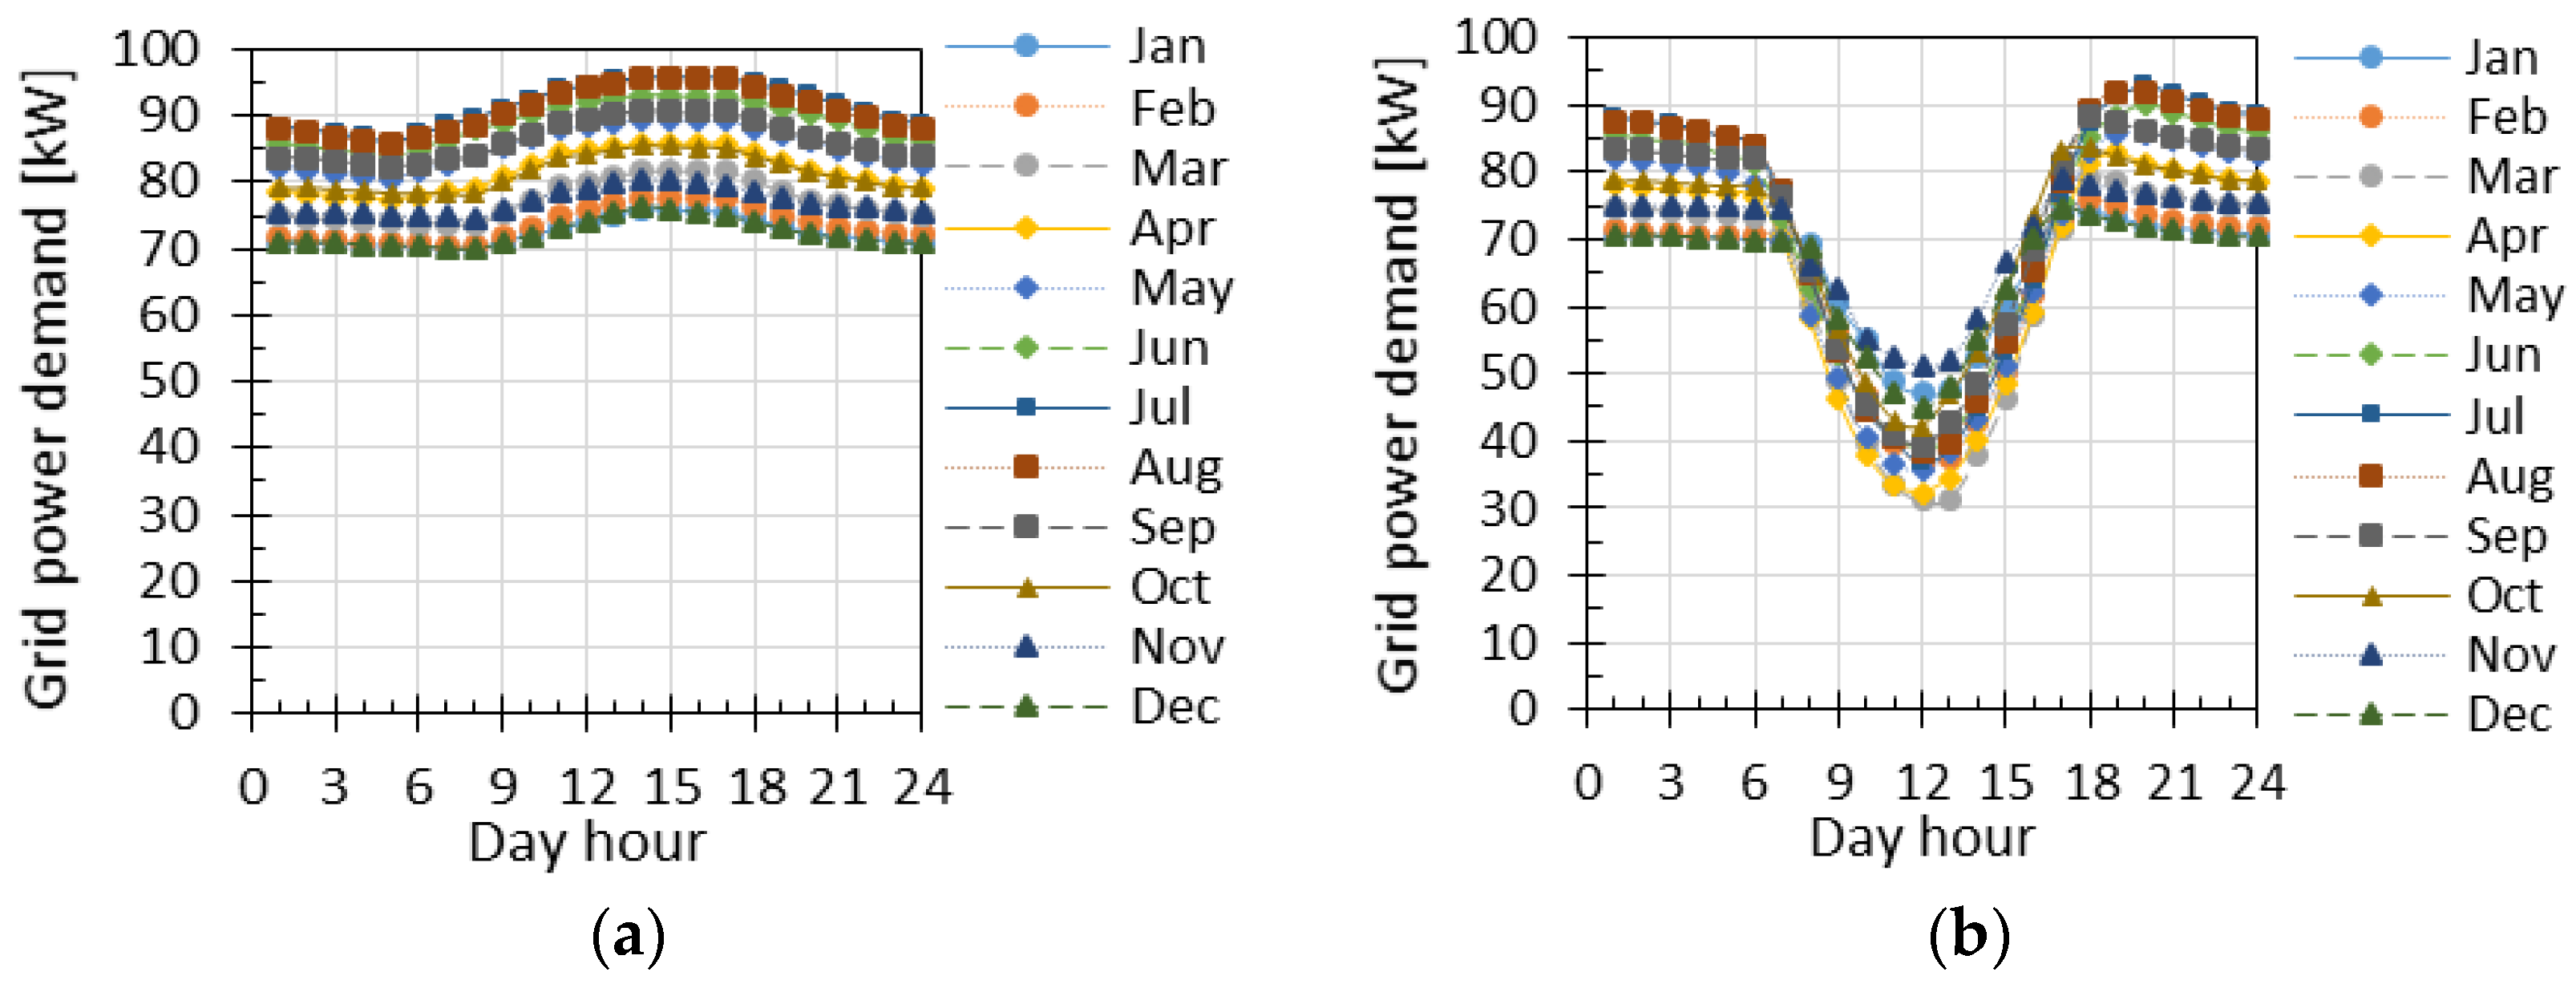
Figure 5a shows the typical daily profile of the grid power demand of each month when the PV is not installed, ranging from a minimum value of 69.9 kW to a maximum value of 95.9 kW. The impact of the PV plant is shown in Figure 5b; the grid power demand is always positive, meaning that the power generated by the PV plant is entirely absorbed by the warehouse. During the peak hours of the summer months (i.e., from 11 a.m. to 1 p.m. local time), the PV plant can reduce the grid power demand up to 66.9%, while during winter months the reduction of energy withdrawal from the grid can achieve 30.7%. These savings can be related to the similar pattern of refrigeration requirements and PV-based power generation, both increasing with high outdoor temperatures and sunny conditions. Therefore, PV generation can cover a significant portion of energy requirements during peak hours, thus positively contributing not only to the facility energy self-sufficiency, but also to grid balance and associated GHG emission reduction. With regards to the overall electric energy withdrawal from the grid, the decrease due to PV installation varies from the minimum value of 8.8%, reached in January, to the maximum value of 20.4%, achieved in July, while the average reduction of grid electricity demand is about 16.4%.
4.2. The Reference Case: Minimizing Energy Demand from the Electric Grid
Table 4 reports the optimal configuration of the R-AS/RS with and without a PV plant, when energy demand from the electric grid is minimized. In this case, the introduction of the PV plant greatly affects the configuration of the refrigerated warehouse. In particular, the number of levels is halved, moving from 10 to 5, while the number of aisles is doubled. When PV is not adopted, vertical space is fully exploited, taking advantage both from crane movements and reduction of lost space refrigeration due to compact rack (maximum depth, one aisle). Since the cost of rack vertical frames and cranes increasing with rack height is not taken into account by the energy-based objective function, the selected configuration presents more levels than the minimum cost one (see Table 4), moving from 6 to 10 levels. The need to enhance PV power generation to counterbalance energy requirements, instead, leads to extend the available surface on the roof for PV panels installation by adopting two aisles (and two cranes), disregarding the related high investment costs. This PV minimum energy solution is characterized by a yearly total cost increase of 11.9% with respect to the R-AS/RS without PV plant, while energy withdrawal from the grid is reduced by 13.1%. In the case of minimum energy consumption, the introduction of PV generation highly affects the environmental performance of the refrigerated facility, but from the economic point of view energy savings are not able to counterbalance the higher investments on AS/RS rack and machines needed to extend roof surface, as in the minimum cost one.
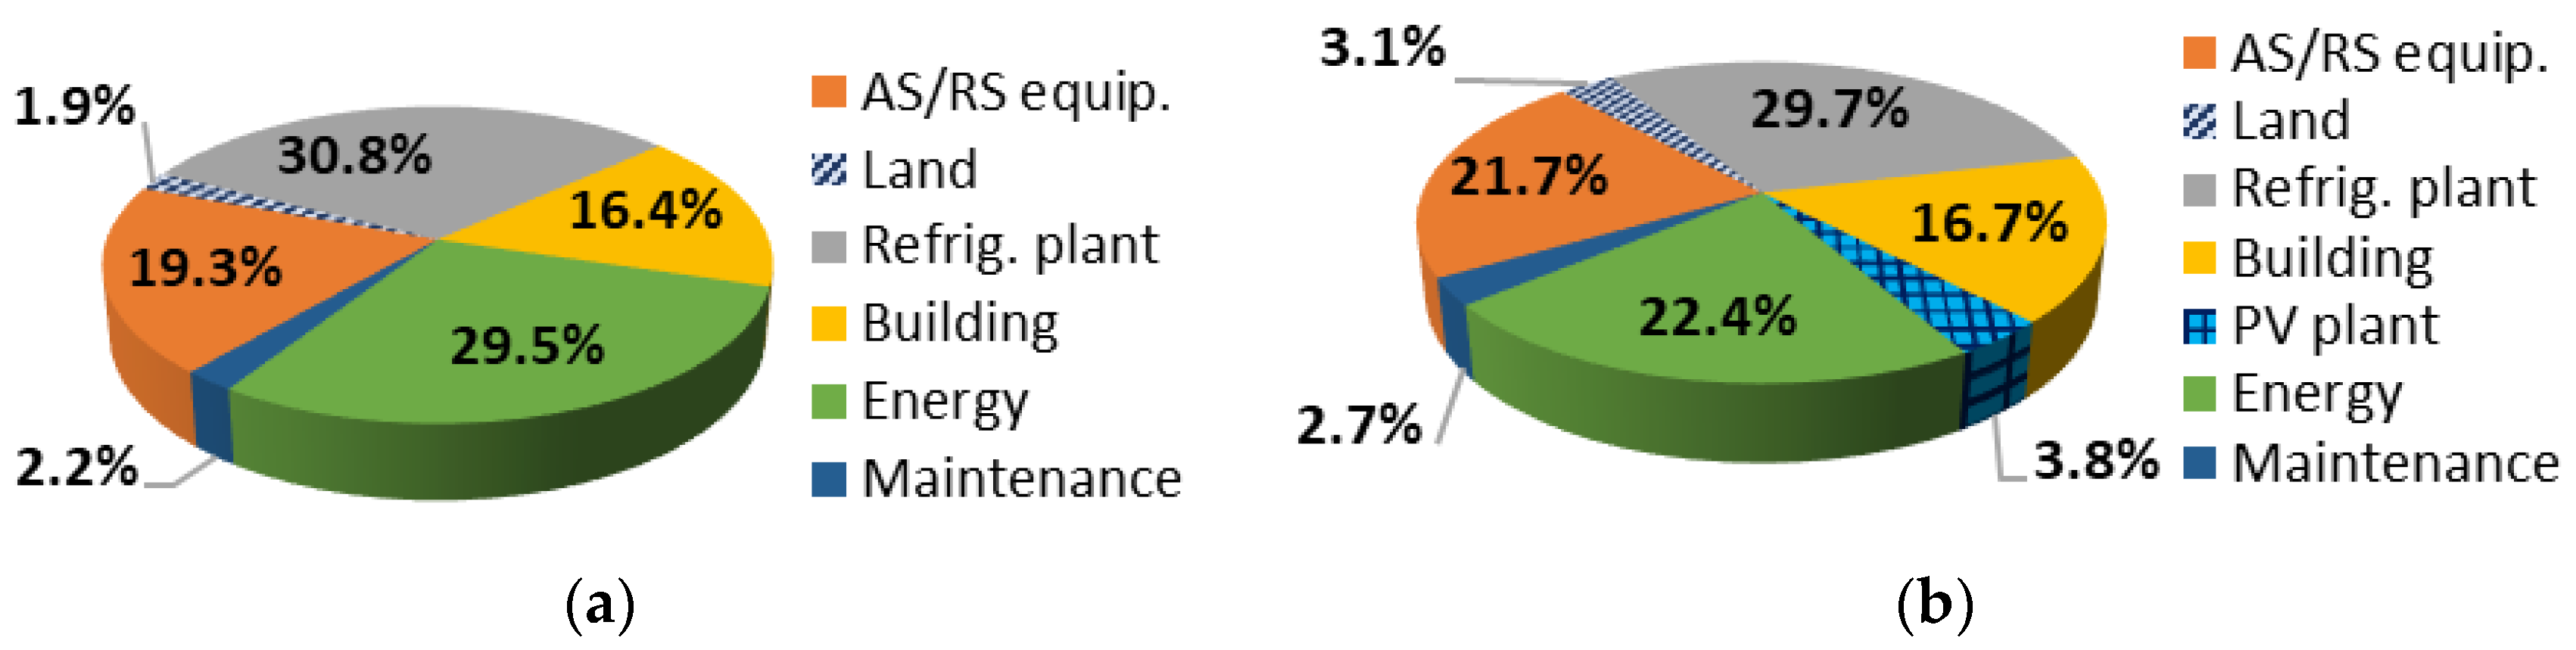
The yearly cost structure of the optimal solution minimizing the grid electricity demand when a PV plant is not installed is shown in Figure 6a. In this case, the energy costs account for 29.5% of yearly total cost, with refrigeration requirements playing the major role (see Figure 6a). The refrigeration plant results to be the most expensive component, accounting for 30.8% of the yearly total cost. Compared to the optimal solution minimizing total costs, in the optimal solution minimizing the grid electricity demand the costs of AS/RS equipment (i.e., cranes, satellites and trucks) and building have a major impact, being respectively 19.3% and 16.4% of the yearly total cost. On the contrary, maintenance and land costs further reduce their impact reaching 2.2% and 1.9% of the yearly total cost, respectively.
The yearly cost structure of the optimal solution minimizing the grid electricity demand when using a PV plant is shown in Figure 6b. In this case, the shares of energy and refrigeration plant costs are reduced to 21.7% and 29.7%, respectively, while the other cost shares are increased. In particular, the impact of the AS/RS equipment costs moves from 19.3 to 21.7% of the yearly total cost. This significant cost increase is mainly due the additional crane required to serve the second aisle.
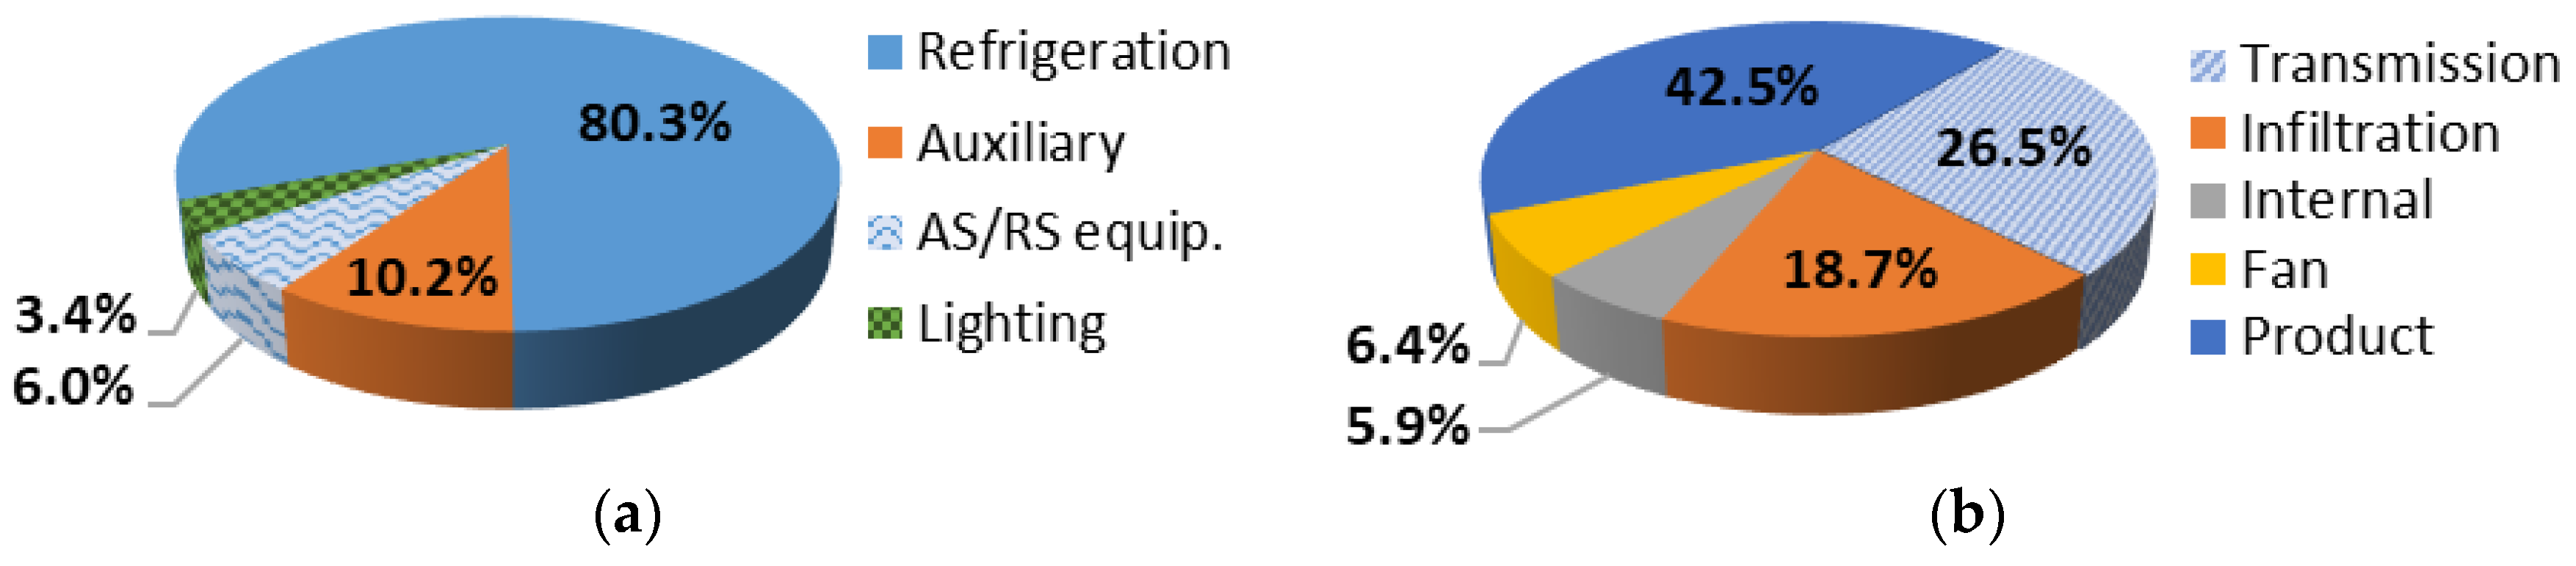
Figure 7a shows the structure of the electricity demand for the optimal solution minimizing grid electricity and using a PV plant. Compared to the optimal solution minimizing total cost and adopting PV power generation, the share of the AS/RS equipment energy is lower, passing from 8% to 6%. The shares of the refrigeration and lighting energy are slightly increased, moving from 79.2% to 80.3% and from 2.8% to 3.4%, respectively. From the structure of the refrigeration load showed in Figure 7b it is worth noting that the share of the transmission load increases from 23.7% of the optimal solution minimizing cost and using PV (see Figure 3b) to 26.5%. This increase in the transmission load is due to the extended surface of heat exchange, which moves from 5412 m2 of the optimal solution minimizing cost to 6239 m2 needed to fully exploit PV generation in the minimum energy configuration one.
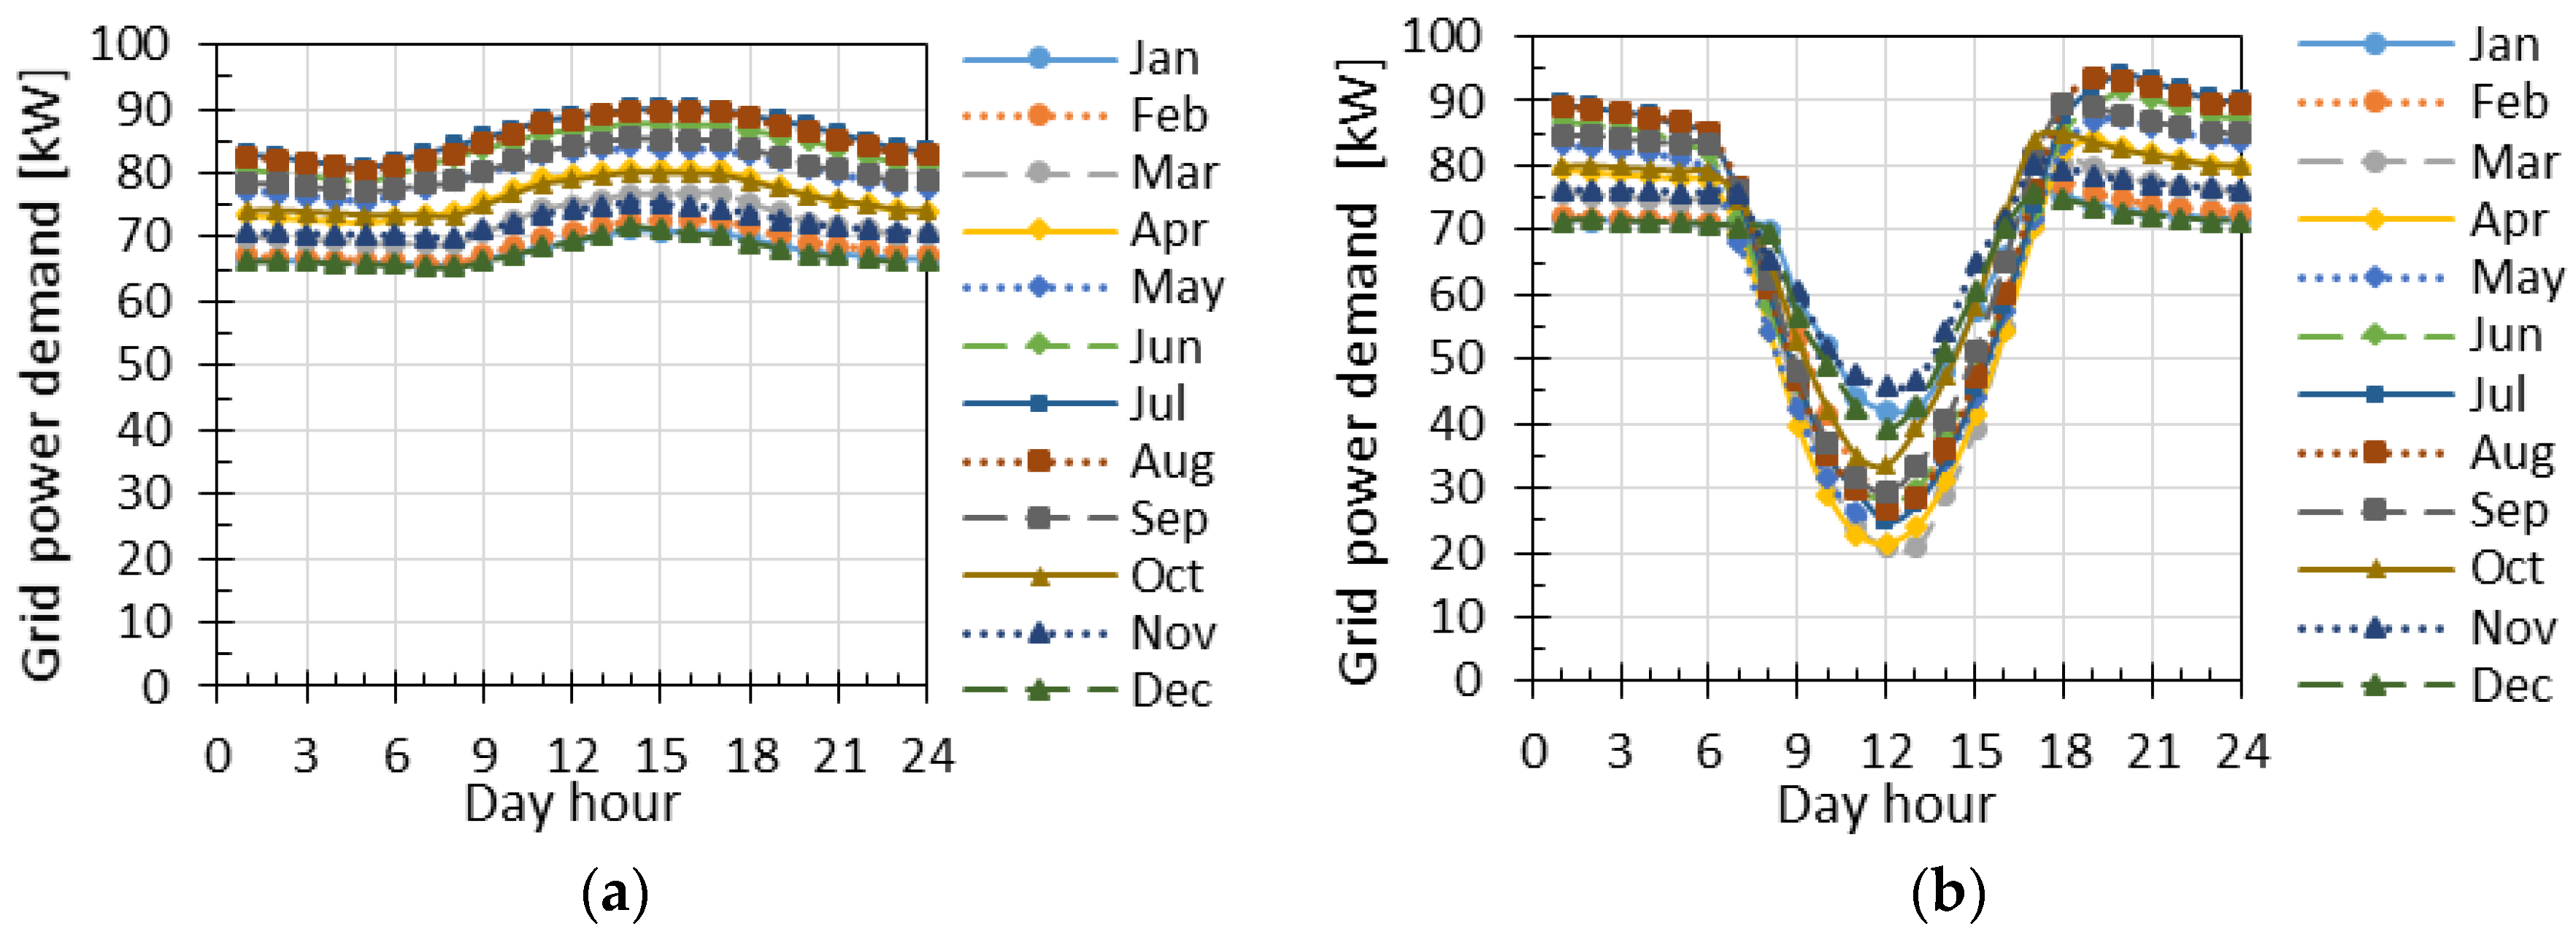
The typical daily profile of the grid power demand of each month of the optimal solution minimizing the grid electricity demand without PV is shown in Figure 8a. In this solution, the minimum and maximum values of the grid power demand range from 65.3 kW to 90.1 kW; these values are slightly lower than the respective values of the optimal solution of minimum yearly total cost without PV adoption.
In Figure 8b grid power demand is always positive, meaning that the electricity produced by the PV plant is entirely absorbed by the warehouse facilities. By comparing the optimal solutions minimizing the grid electricity demand without and with the PV plant, it can be highlighted how PV generation can reduce the grid power demand up to 75% during the peak hours of the spring months and 43% during winter months. With regards to the demand of electric energy from the grid, the reduction associated with the installation of the PV plant varies from a minimum value of 10.7%, reached in January, to a maximum value of 24.7%, achieved in July, with an average value of 13.1% along the year.
Finally, we can conclude that coupling a R-AS/RS with PV power generation by adopting a cost minimization perspective leads to enhance the sustainability of the refrigerated facility embracing both the economic and energy saving dimensions. Introducing PV generation in the cost minimization perspective leads to better performance than just minimizing energy requirements without renewables. Comparing results in column 2 of Table 3 with results in column 1 of Table 4 it can be highlighted a cost reduction of 2.8% and an energy demand decrease of 10.8% gained by the min cost solution with PV installation with respect to the min energy solution without renewables. Thus, fostering renewables into storage phases reveals to be an effective way to enhance overall sustainability of the whole cold chain.
Otherwise, adopting PV from the energy requirements minimization perspective leads to further 2.6% of relative energy savings with respect to the cost minimization configuration (compare column 2 of Table 3 and Table 4) but with a relative yearly total cost increase of 15.1% due to higher investments. However, this cost increase could be sustained by public institutions to achieve SE4All objectives. In this case, the proposed model can be used by policy makers to properly quantify subventions.
4.3. Sensitivity Analysis on the Reference Case: Energy Price Impact
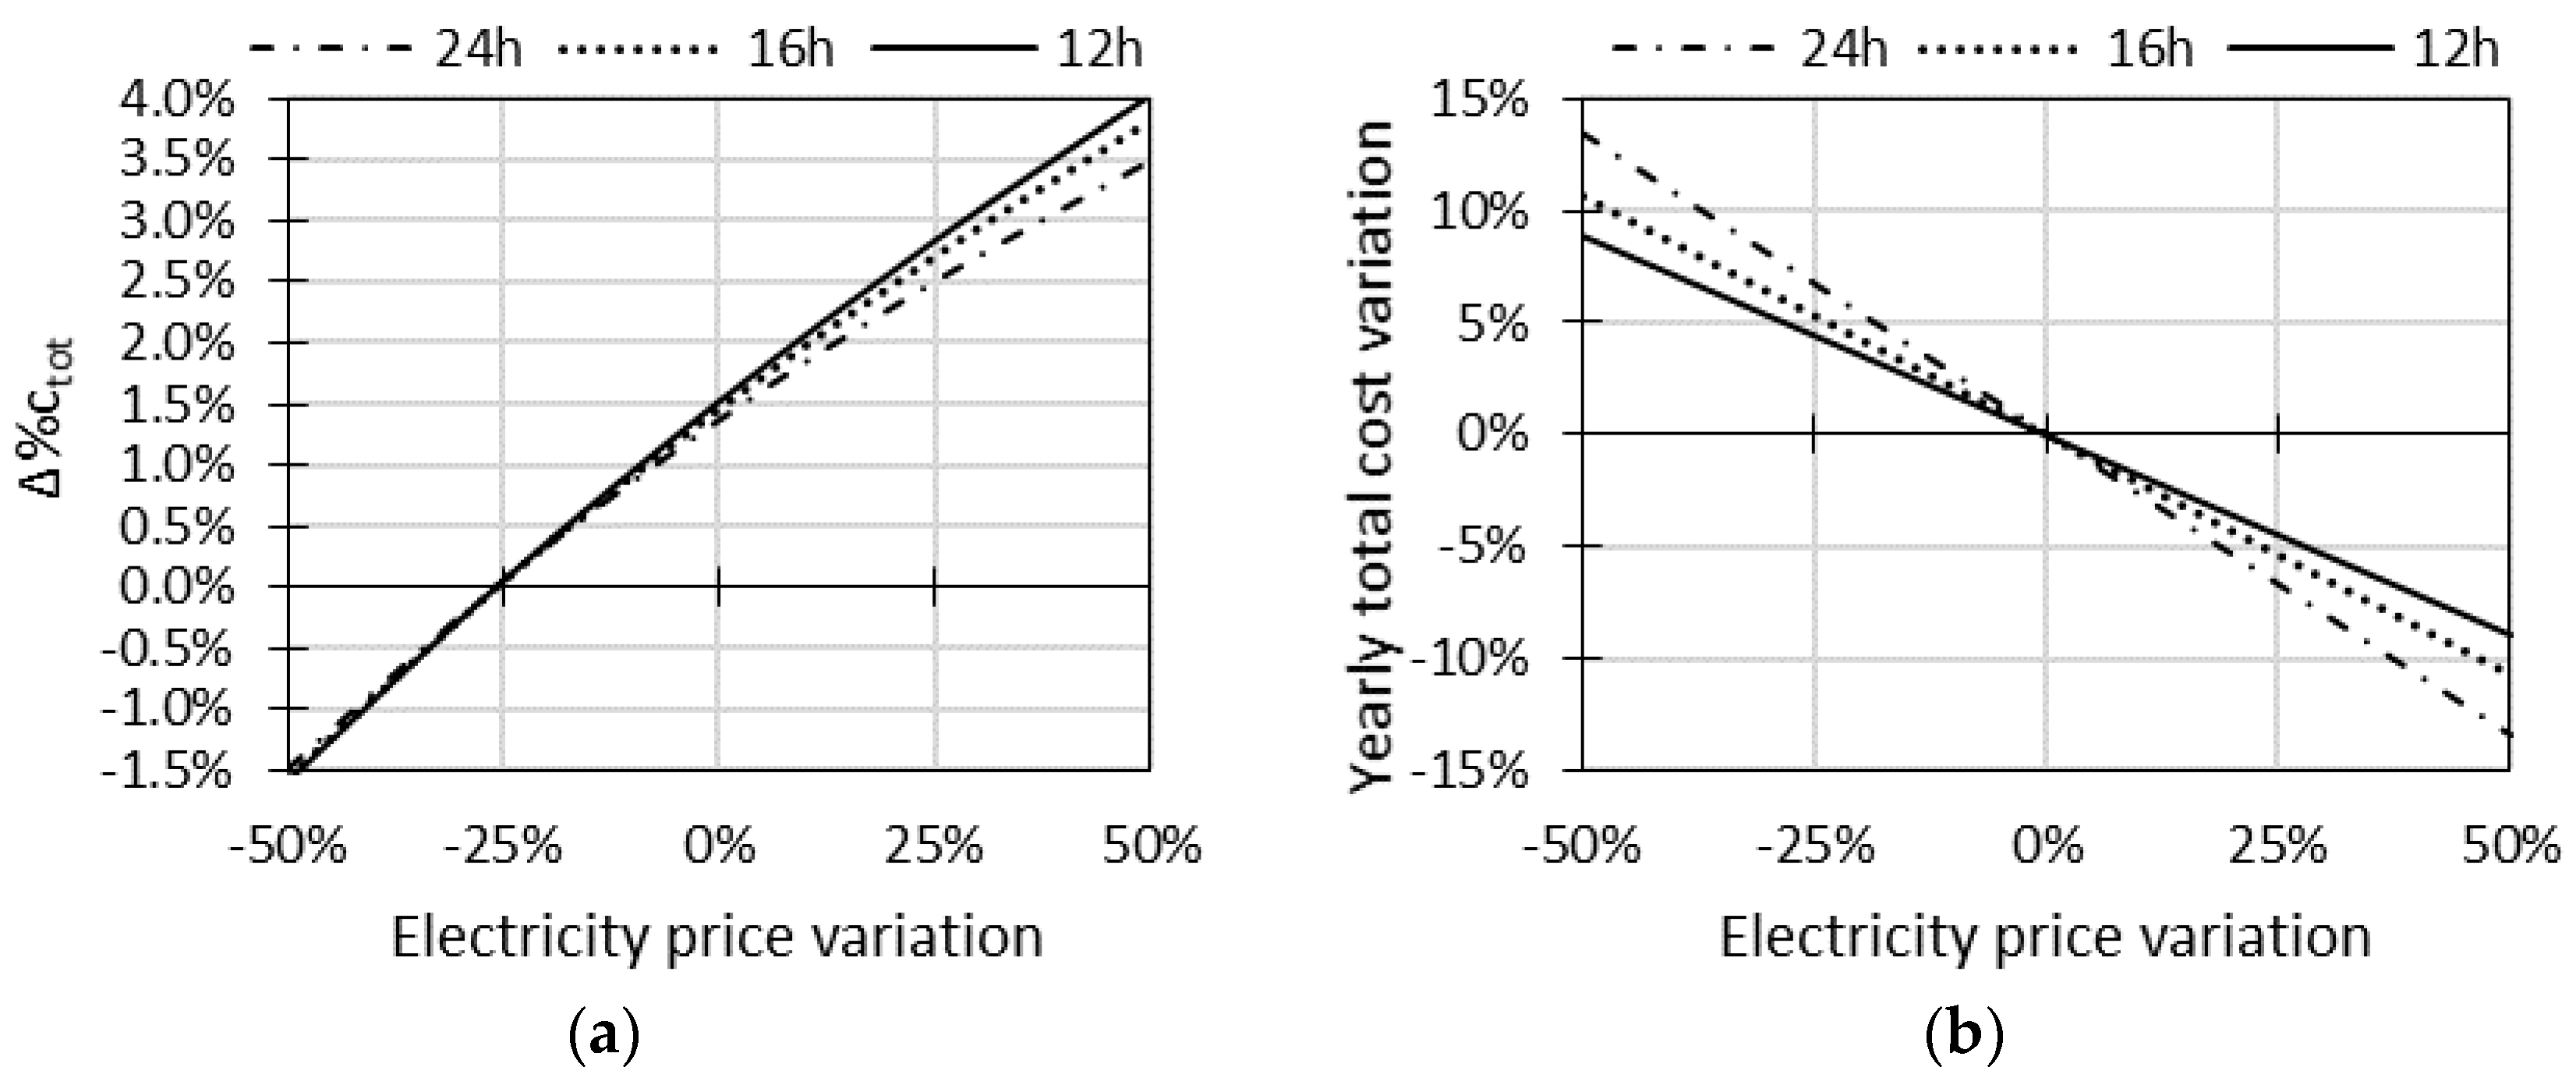
The impact of electricity price on the warehouse costs has been assessed by varying the reference price of 0.148 €/kWh [39] up to ±50% and considering three different operating time windows per day at a constant pace of 45 cycles per hour: 24, 16 and 12 h.
The relative difference between the yearly total cost of a refrigerated warehouse with PV () and one without renewables introduction () is calculated as in Equation (12) and reported in Figure 9a. It is worth noting that when the electricity price variation is about −25% (i.e., 0.111 €/kWh), the economic advantage of installing a PV plant is almost voided. In addition, by reducing the operating hours of the refrigerated warehouse, the difference on yearly total cost becomes more sensible to electricity price variation, since PV power generation covers an increasing proportion of energy requirements.
Figure 9b reports how the yearly total cost of a warehouse with a PV plant varies with the electricity price. It is possible to observe that the yearly total cost has a maximum variation of ±13%, when the warehouse operates 24 h/day, and a minimum variation of ±7%, when the warehouse operates 12 h/day.
In the case of daily hours operating only, in fact, PV integration can significantly reduce energy withdrawal from the grid. When the warehouse operates continuously over the 24 h, instead, nightly requirements cannot be counterbalanced by PV generation.
4.4. Sensitivity Analysis and Discussion on Food Supply Chain Decision Variables
To explore the capability of the proposed optimization model to act as a decision support tool, the impact of food supply chain decision variables on storage facility cost, energy use, and greenhouse gas emissions has been investigated. Since the introduction of a PV plant has been proved to increase the overall sustainability of a refrigerated warehouse when the yearly total cost is selected as the objective function (see Section 4.1), the following simulations regards a PV integrated R-AS/RS with minimum cost optimization and input parameters as in the reference case.
Referring to the framework of Figure 1, supply chain decisions able to impact on the configuration and performance of a R-AS/RS integrated with a PV plant are: (1) the storage temperature; (2) the temperature of incoming products; (3) the system throughput; (4) the batch size; (5) the facility location.
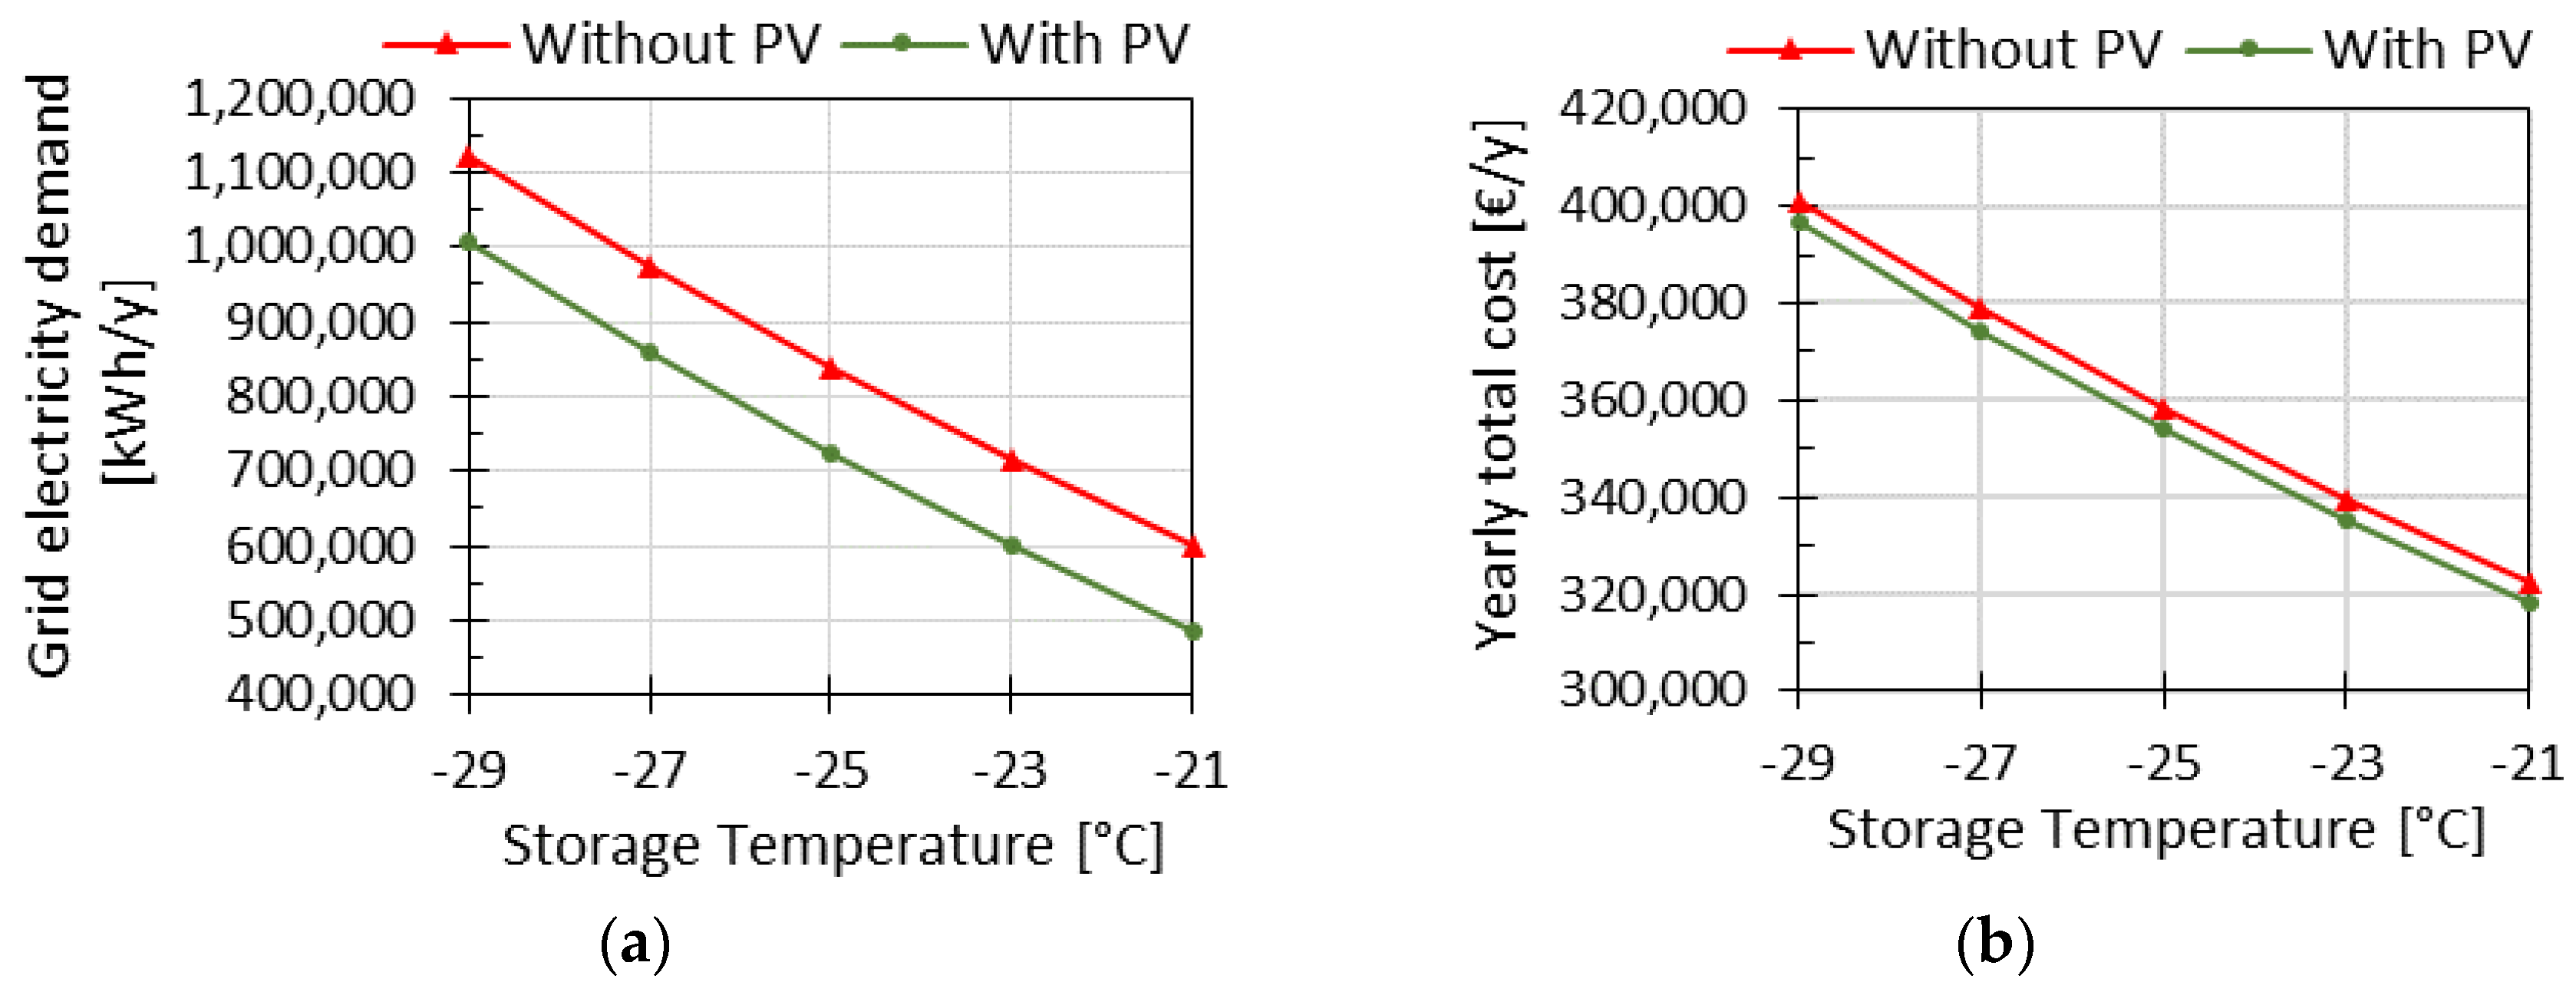
Regarding storage temperature, a sensitivity analysis has been performed by varying from −21 °C to −29 °C with respect to the basic value of −23 °C of the reference case (see the previous Section 4.1). The cell temperature impacts on the main components of the refrigeration load (i.e., transmission, infiltration, and product load) and therefore it is expected to have a significant impact on performance. Results are reported in Figure 10. The electricity consumption (see Figure 10a) increases up to 67.9% with respect to the reference value of −23 °C when a storage temperature of −29 °C is used, while it decreases by −19.1% when reaching −21 °C for a PV integrated facility. The yearly total cost shows a lower but significant sensibility to the storage temperature variation (see Figure 10b), ranging between +18.3% at −29 °C and −5.1% at −21 °C for a PV integrated facility; the R-AS/RS configuration, in fact, is unchanged, but energy costs impact on the yearly total one. If absolute values of a PV integrated R-AS/RS (see green-colored features in Figure 10a,b) are compared to those achieved by a refrigerated warehouse with no renewables introduction (see red-colored features in Figure 10a,b), it can be appreciated how PV adoption contributes to counterbalance energy requirements for severe cell temperatures that can be required to preserve food quality along the whole cold chain, thus offering the supply chain manager more opportunities for an overall optimization than solution not including renewables.
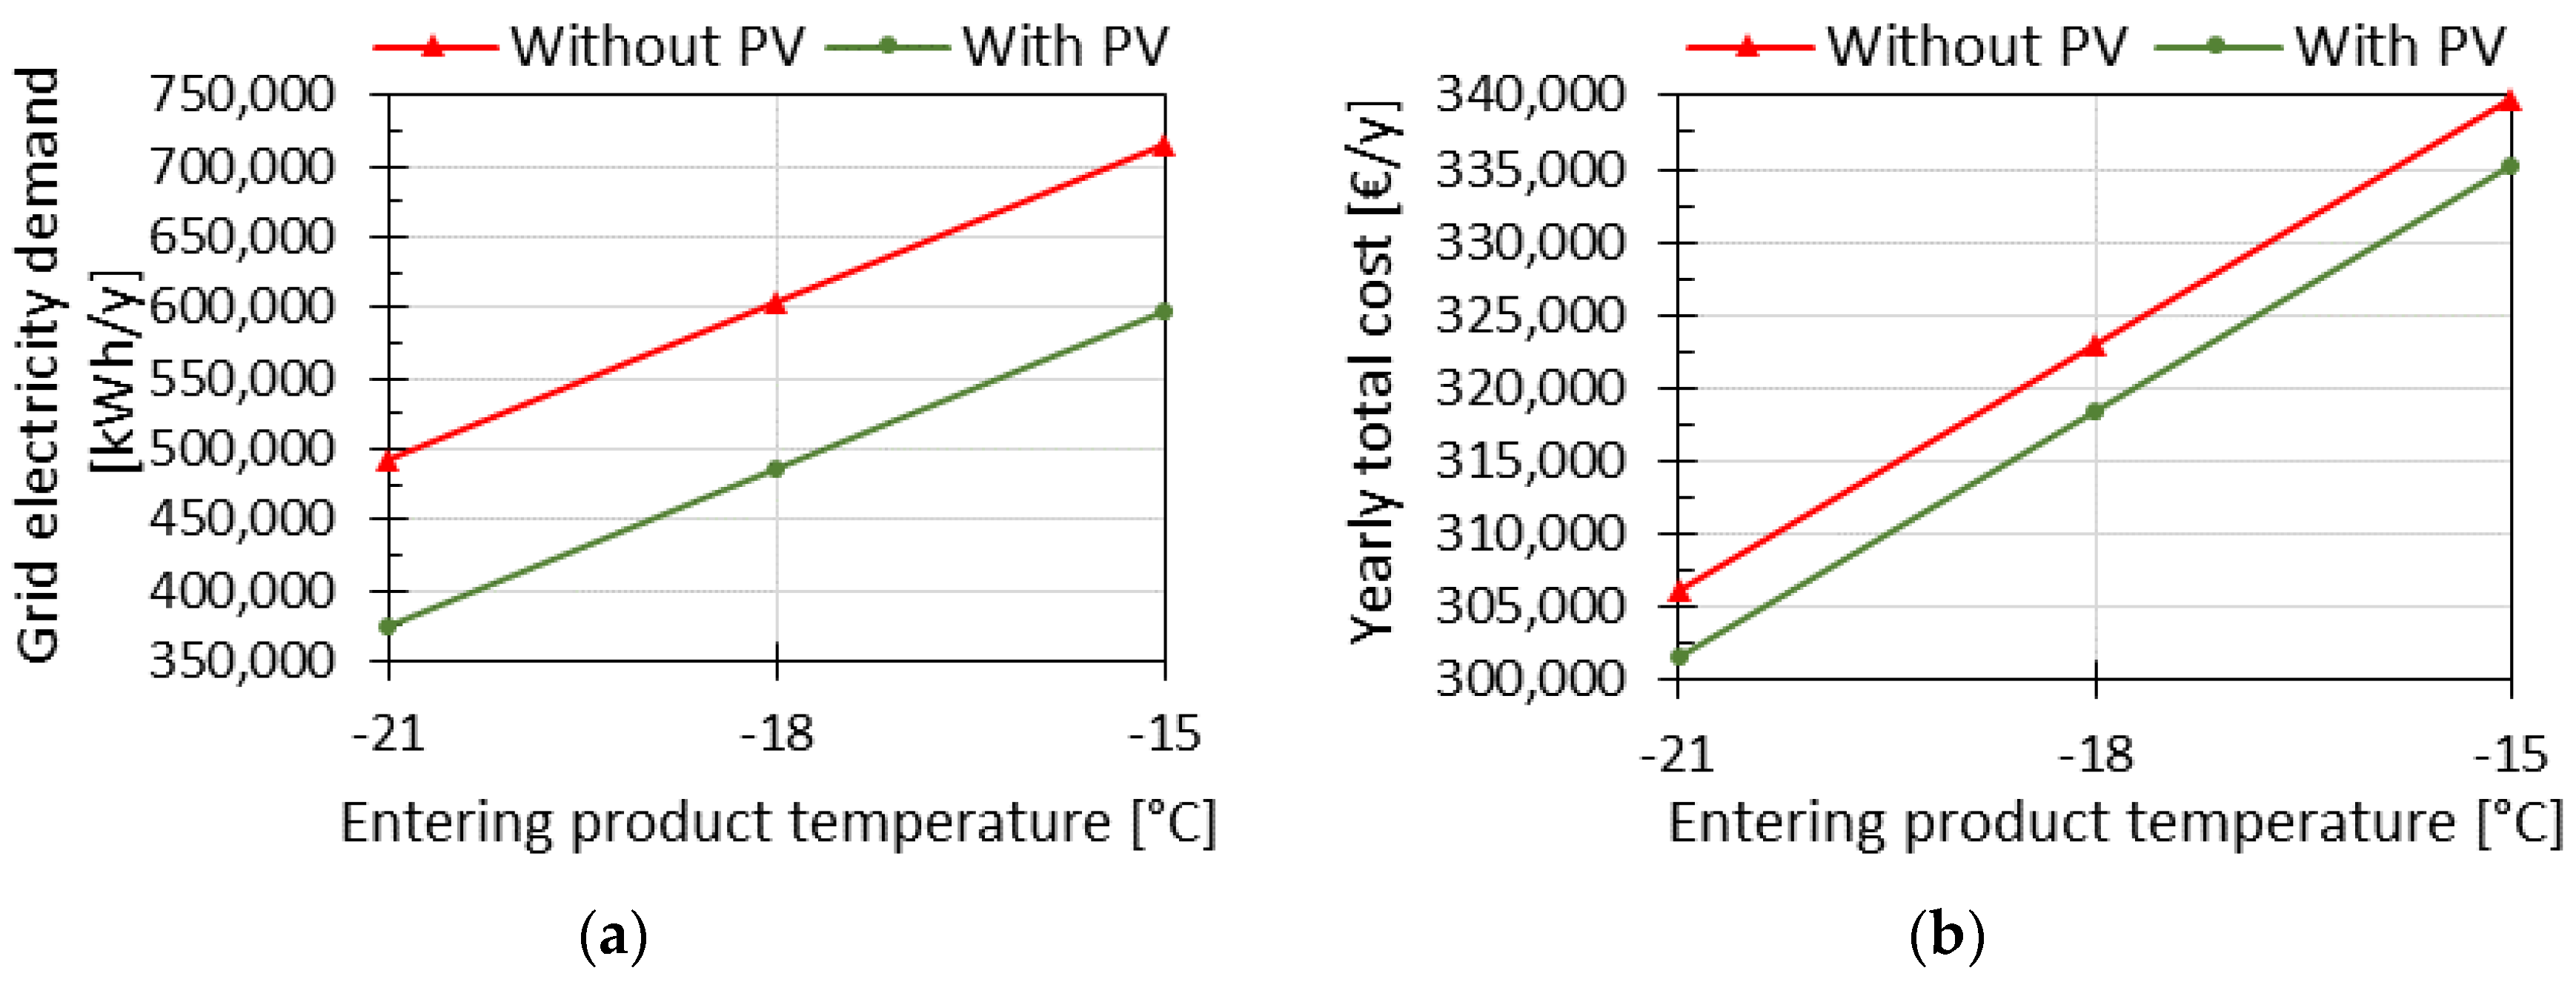
Regarding the temperature of the products entering the refrigerated warehouse, which depends on the upstream stages of the cold chain, the reference value of −15 °C has been lowered to assess possible energy savings. Figure 11a shows that the electricity demand from the grid can be reduced up to 37.3% when products enter a PV integrated storage facility at −21 °C, for a yearly total cost reduction of 10% (Figure 11b). If no PV plant is installed, instead (see red-colored features in Figure 11a,b) any variation at supply chain level required to preserve product quality leads to greater efforts both from economic and environmental perspectives.
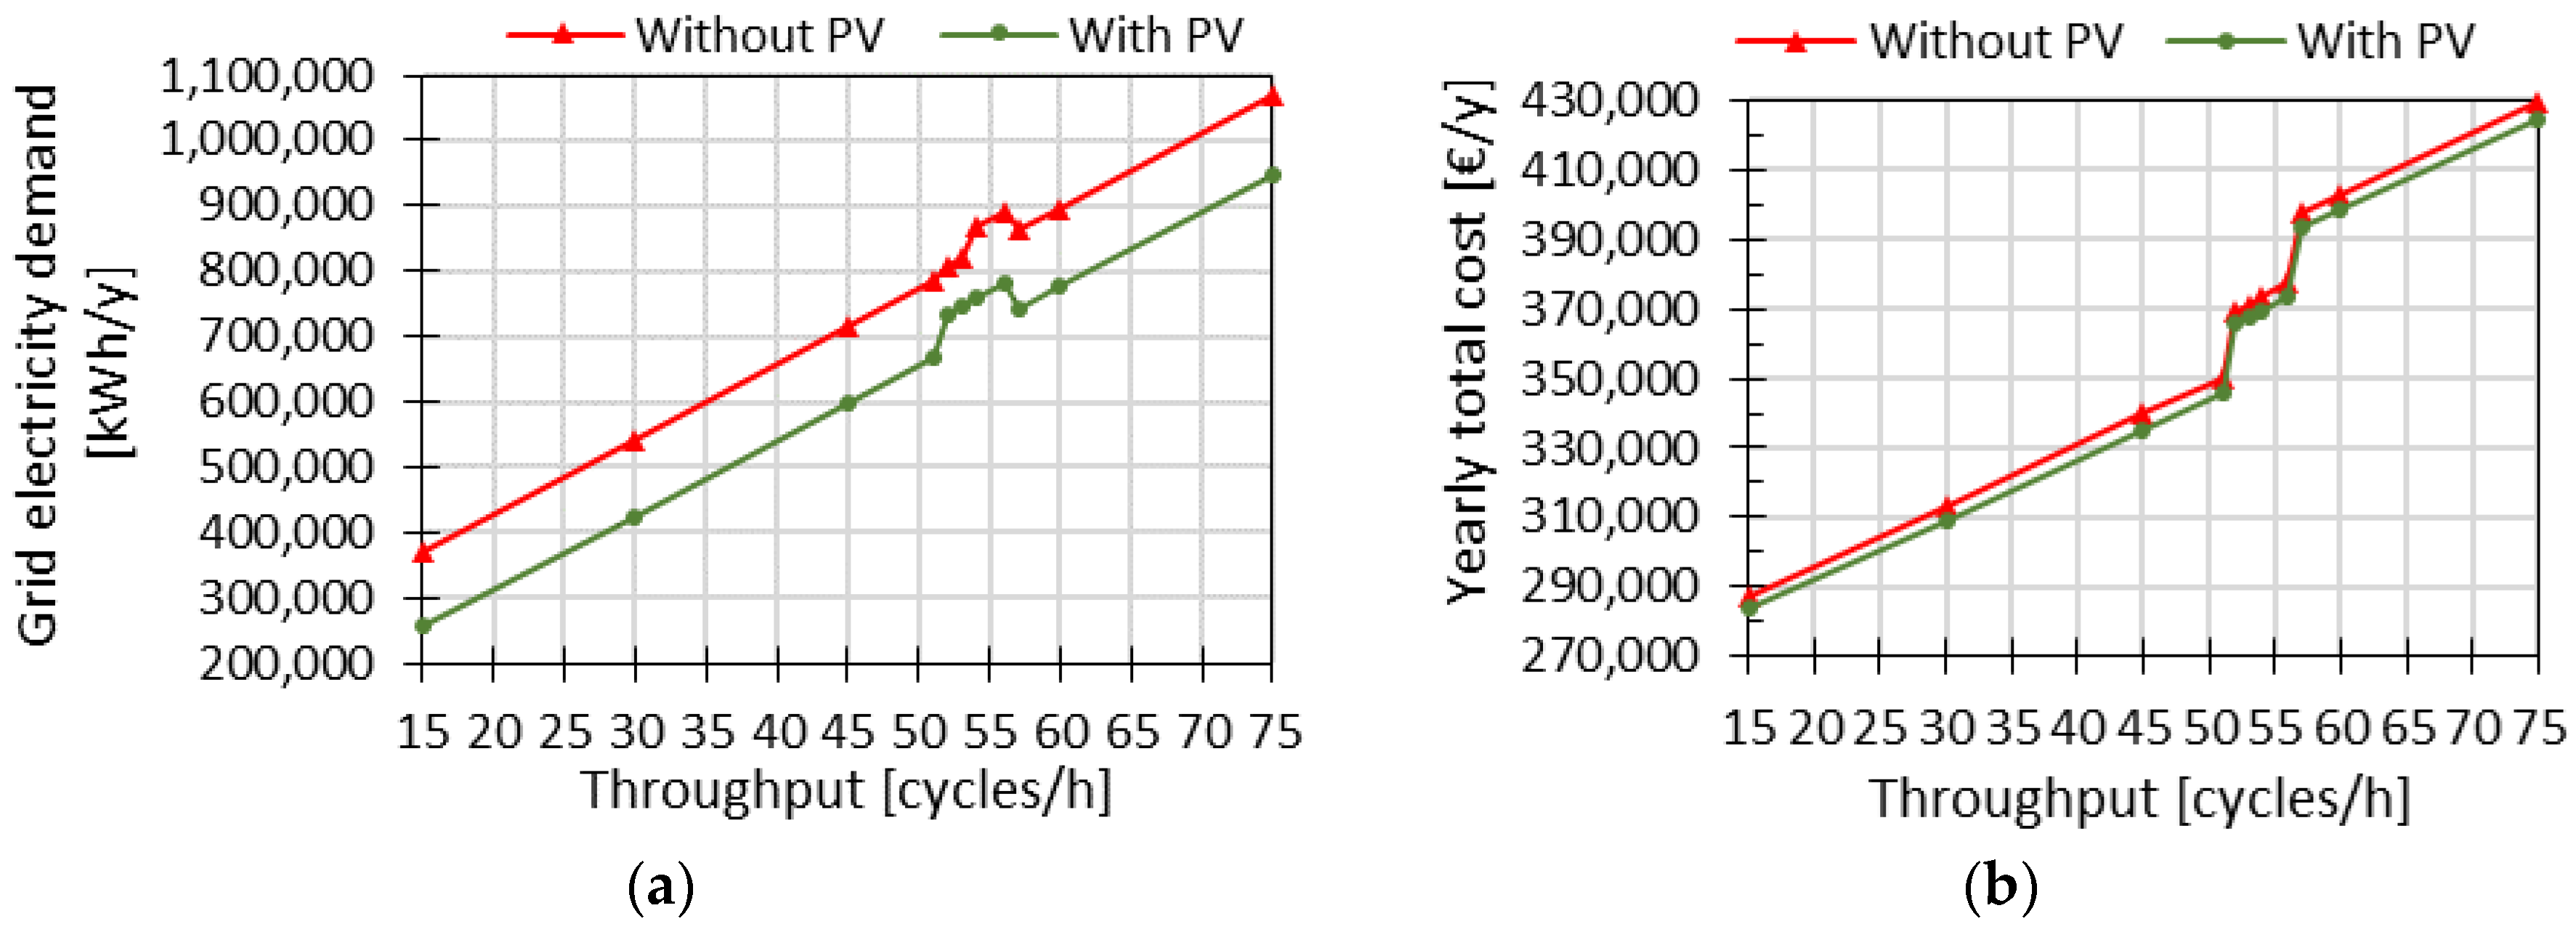
Figure 12a shows how the system throughput affects the grid electricity demand when yearly total cost is minimized, and a PV plant is used. System throughput affects the infiltration load due to the different number of door openings to bring unit loads into the storage space, the product load due to different number of products whose temperature has to be increased to the storage one, and energy requirements for movement equipment (i.e., cranes, satellites, and trucks, with related internal load also). It is worth noting that the variation of the grid electricity demand is not linear but shows a sudden increase between 51 and 52 cycles per hour and then a rapid decrease between 56 and 57 cycles per hour. A similar behavior occurs in the yearly cost shown in Figure 12b, with the difference that the rapid variations lead always to increasing costs. Such patterns can be explained by analyzing the rack configuration of the optimized storage facility reported in Table 5. When varying the system throughput, the CP solver finds basically three warehouse configurations. The first configuration, which ranges from 15 to 51 cycles per hour, is composed by 25 columns, 6 levels, 16 lane depth, and 1 aisle. The second configuration occupies a narrow range (i.e., 52–56 cycles per hour) and presents a major number of columns (i.e., 43) and levels (i.e., 7), while the lane depth is halved; the number of aisles remains the same. Finally, the third configuration, which ranges from 57 to 75, has the same number of columns and levels of the first configuration, but the number of aisles is doubled, while lane depth is halved. These changes in rack configuration should be ascribed to the need of lowering the total cycle time of the AS/RS machine, moving horizontally along the aisle and vertically to reach the desired level, plus the satellite, moving along the lane in depth. When the throughput grows, satellite cycle time is decreased by reducing the lane depth while preserving selectivity for retrieval operations (i.e., halving the lane so that incoming lots can be split into two sublots to be assigned to one lane each), thus leading to a reduced rooftop surface and less PV modules (see the last column in Table 5). The AS/RS cycle time is then adjusted moving towards higher racks until the pace is so stringent to be satisfied only with parallelism by inserting two aisles and two aisle-captive cranes, consequently.
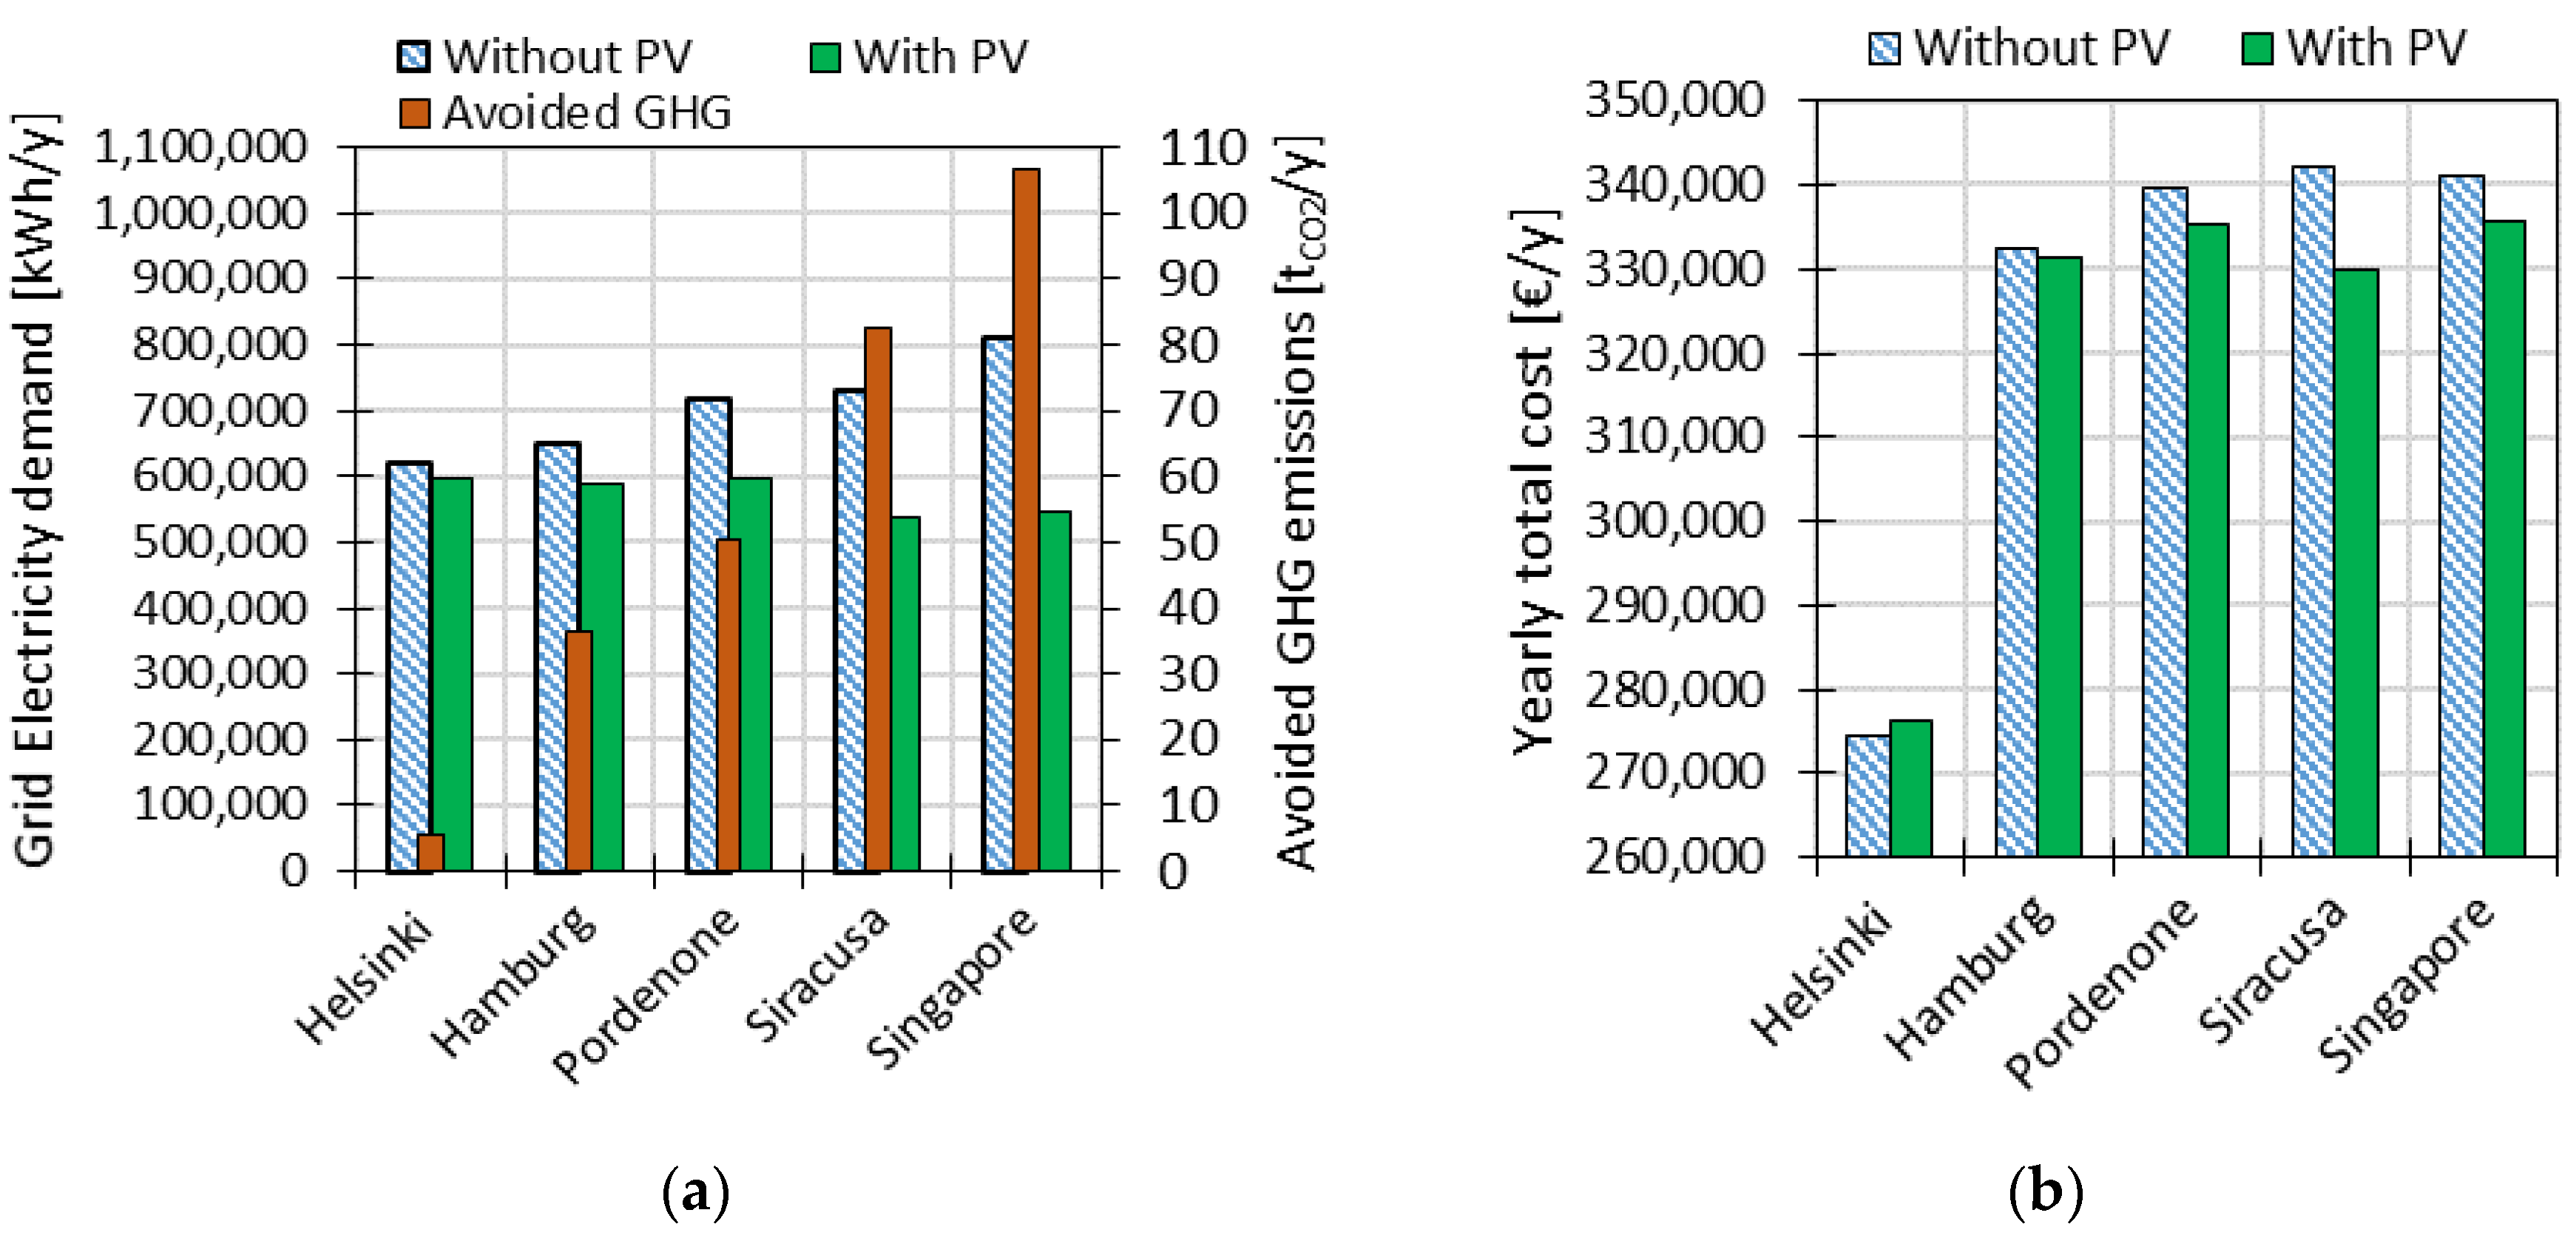
Finally, another important decision variable of the cold supply chain is the location of the refrigerated warehouse. To have a better understanding on how the location affects the warehouse configuration and performance, the optimal solution obtained for the reference site of Pordenone in north-eastern Italy has been compared with the optimal solution of the locations reported in Table 6, which present different climate conditions as well as electricity price and carbon intensities. Specific features of the European cities are provided in [39,40], while Singapore’s carbon intensity and electricity price are provided by the Energy Market Authority of Singapore ([41,42]). Different outdoor temperatures impact on refrigeration load, while the latitude affects radiance and PV panels inclination, thus modifying PV power generation.
The electrical energy demand from the grid for each considered location is reported in Figure 13a when the refrigerated warehouse is integrated with a PV plant (green-colored bars) or not (blue-colored bars). It is possible to observe how the impact of PV integration increases moving from the northernmost city (i.e., Helsinki) to the southernmost ones (i.e., Siracusa and Singapore), which can better exploit PV generation due to higher radiance and sunny hours per day. Figure 13b highlights how the yearly total cost depends not only from the climate conditions of the location as power demand, but also from the related electricity price. Singapore, which presents quite the same cost than Siracusa for a storage facility without PV integration and similar PV generation potential, can benefit less than Siracusa from PV installation due to its lower price for energy withdrawal from the grid. Helsinki, which can rely on a very low price for energy withdrawal from the grid and poor climate conditions for PV generation (low solar irradiance), has no economic benefit for PV integration. In this case, PV installation leads to a higher yearly total cost (see Figure 13b) due to investment costs not sufficiently counterbalanced by energy cost savings. Attention is also deserved by a supply chain manager to avoid GHG emissions, when assessing the environmental impact of the cold chain. Due to different national mixes of energy sources, for similar amount of energy savings from the grid, avoided emissions (see orange bars in Figure 13a) are higher for cities whose power needs are mainly satisfied by fossil fuels (e.g., Hamburg) than those where renewables have high penetration (e.g., Helsinki).
5. Conclusions
Industrial food refrigeration represents a major energy consumer on a global scale and has a huge but still unused potential for employing renewable energy technologies. In particular, cold storage is one of the most important processes within the cold chain in terms of energy saving potential. Thus, analyzing how renewables can modify its design and performance can represent an important step to enhance the sustainability of the whole supply chain.
Since automated storage and retrieval systems are becoming the preferred choice for frozen food storage facilities, this paper analyses how the integration of rooftop photovoltaics affects the design and performance of such a refrigerated automated warehouse. Constraint Programming has been used to model and solve the PV integrated R-AS/RS design problem.
Results for the reference case in north-eastern Italy show that PV installation with a min cost optimization can lead to both reduced yearly total cost (−1.3%) and energy savings withdrawal from the grid (−16.4%), thus embracing the economic and environmental dimensions of sustainability. Further energy savings (+2.6%) with respect to the min cost solution can be gained by sizing the PV-integrated R-AS/RS by min energy optimization) but facing an increasing cost of 15.1%. However, the PV integrated R-AS/RS design and performance strictly depend on supply chain decision variables, so that a virtuous planning cycle can be triggered when attributes for storage facilities derived from the proposed model are included into global supply chain models for sustainability.
In particular, simulations reported in Section 4.4 show how the introduction of rooftop PV power generation can offer the supply chain manager more opportunities for food quality control in the other stages of the cold chain. PV integration, in fact, allows to increase the temperature of incoming products, which depends on upstream stages, and reduce the storage temperature, which can impact on downstream stages, with respect to non-renewable-based solutions while still maintaining good economic and environmental performances.
Concerning the throughput assigned to the storage facility (see Section 4.4), simulations on yearly total cost minimization highlight how there can be an intermediate range for which the design optimization of volume and surfaces reduces the convenience of PV integration. Therefore, attention should be paid to avoiding such transition pace values in order to fully exploit benefits of PV to enhance the cold chain sustainability.
Finally, facility location, which is a major choice at supply chain design level, can significantly impact on PV introduction performance. Climate conditions of different latitudes strongly affect both refrigeration requirements and PV power generation, whose convenience becomes greater for warmer sites. However, for similar energy savings in grid withdrawal achievable by PV installation, economic and environmental benefits rely on national carbon intensity and price of electric energy, growing for higher fossil fuel-based countries (see Figure 13).
The introduction of PV generation in storage facilities leads to both economic and energy saving benefits, while providing more flexibility on designing and controlling the whole cold chain.
Results obtained by the proposed optimization model highlight that a cost-efficient integration of photovoltaics with automated storage facilities is achievable. The obtained 16.4% energy demand reduction with PV installation for a typical automated warehouse within the cold chain can effectively contribute to achieve the 5–10% energy intensity reduction expected by the SE4All goals. Furthermore, combining the integrated PV with various demand-response strategies, smart-grid and intermediate energy storage systems can lead to further energy savings, thus representing a promising future research field to be investigated.
Author Contributions
The authors worked collectively on the manuscript preparation, modification, and review.
Conflicts of Interest
The authors declare no conflict of interest.
References
- Elkington, J. Cannibals with Forks: The Triple Bottom Line of the 21st Century; New Society Publishers: Stoney Creek, ON, Canada, 1998. [Google Scholar]
- Schirone, L.; Pellitteri, F. Energy Policies and Sustainable Management of Energy Sources. Sustainability 2017, 9, 2321. [Google Scholar] [CrossRef]
- Gielen, D.; Saygin, D.; Wagner, N.; Petrichenko, K.; Tsakiris, A. Synergies Between Renewable Energy and Energy Efficiency; a Working Paper Based on Remap 2030; IRENA: Copenaghen, Denmark, 2015; Volume 1. [Google Scholar]
- Verzijlbergh, R.A.; Lukszo, Z. Conceptual model of a cold storage warehouse with PV generation in a smart grid setting. In Proceedings of the 10th IEEE International Conference on Networking, Sensing and Control, Evry, France, 10–12 April 2013; pp. 889–894. [Google Scholar]
- Marchi, B.; Zanoni, S. Supply Chain Management for Improved Energy Efficiency: Review and Opportunities. Energies 2017, 10, 1618. [Google Scholar] [CrossRef]
- Fikiin, K.; Stankov, B.; Evans, J.; Maidment, G.; Foster, A.; Brown, T.; Radcliffe, J.; Youbi-Idrissi, M.; Alford, A.; Varga, L.; et al. Refrigerated warehouses as intelligent hubs to integrate renewable energy in industrial food refrigeration and to enhance power grid sustainability. Trends Food Sci. Technol. 2017, 60, 96–103. [Google Scholar] [CrossRef]
- James, S.J.; James, C. The food cold-chain and climate change. Food Res. Int. 2010, 43, 1944–1956. [Google Scholar] [CrossRef]
- Monforti-Ferrario, F.; Dallemand, J.-F.; Pascua, I.P.; Motola, V.; Banja, M.; Scarlat, N.; Medarac, H.; Castellazzi, L.; Labanca, N.; Bertoldi, P.; et al. Energy Use in the EU Food Sector: State of Play and Opportunities for Improvement; European Commission: Brussels, Belgium, 2015. [Google Scholar]
- James, S.J.; James, C. Improving energy efficiency within the food cold-chain. In Proceedings of the 11th International Congress on Engineering and Food, Athens, Greece, 22–26 May 2011. [Google Scholar]
- Zhu, Z.; Chu, F.; Dolgui, A.; Chu, C.; Zhou, W.; Piramuthu, S. Recent advances and opportunities in sustainable food supply chain: A model-oriented review. Int. J. Prod. Res. 2018, 1–23. [Google Scholar] [CrossRef]
- MHIA Automated Storage Systems Make a Play for Sustainability. AS/RS Quarterly Report. Available online: http://www.mhia.org/industrygroups/as-rs/news (accessed on 15 January 2018).
- Meneghetti, A.; Monti, L. Greening the food supply chain: An optimisation model for sustainable design of refrigerated automated warehouses. Int. J. Prod. Res. 2015, 53, 6567–6587. [Google Scholar] [CrossRef]
- Zanoni, S.; Zavanella, L. Chilled or frozen? Decision strategies for sustainable food supply chains. Int. J. Prod. Econ. 2012, 140, 731–736. [Google Scholar] [CrossRef]
- Owen, T.; Mark, S. Refrigerated-facility loads. In The 2010 ASHRAE Handbook: Refrigeration; ASHRAE: Atlanta, GA, USA, 2010. [Google Scholar]
- Luthander, R.; Widén, J.; Nilsson, D.; Palm, J. Photovoltaic self-consumption in buildings: A review. Appl. Energy 2015, 142, 80–94. [Google Scholar] [CrossRef]
- Merei, G.; Moshövel, J.; Magnor, D.; Sauer, D.U. Optimization of self-consumption and techno-economic analysis of PV-battery systems in commercial applications. Appl. Energy 2016, 168, 171–178. [Google Scholar] [CrossRef]
- Chiaroni, D.; Chiesa, V.; Franzò, S.; Frattini, F. Evaluating battery energy storage systems: An analysis of their adoption with photovoltaic plants in Italy. In Proceedings of the 2016 IEEE 16th International Conference on Environment and Electrical Engineering (EEEIC), Florence, Italy, 7–10 June 2016. [Google Scholar]
- Beck, T.; Kondziella, H.; Huard, G.; Bruckner, T. Assessing the influence of the temporal resolution of electrical load and PV generation profiles on self-consumption and sizing of PV-battery systems. Appl. Energy 2016, 173, 331–342. [Google Scholar] [CrossRef]
- Khalilpour, R.; Vassallo, A. Planning and operation scheduling of PV-battery systems: A novel methodology. Renew. Sustain. Energy Rev. 2016, 53, 194–208. [Google Scholar] [CrossRef]
- Khalilpour, K.R.; Vassallo, A. Technoeconomic parametric analysis of PV-battery systems. Renew. Energy 2016, 97, 757–768. [Google Scholar] [CrossRef]
- Marchi, B.; Zanoni, S.; Pasetti, M. A techno-economic analysis of Li-ion battery energy storage systems in support of PV distributed generation. In Proceedings of the 21st Summer School Francesco Turco, Naples, Italy, 13–15 September 2016; AIDI—Italian Association of Industrial Operations Professors: Naples, Italy, 2016. [Google Scholar]
- Nagaraju, J.; Vikash, K.; Krishna Murthy, M.V. Photovoltaic-powered cold store and its performance. Int. J. Energy Res. 2001, 25, 389–396. [Google Scholar] [CrossRef]
- Rossi, F.; Van Beek, P.; Walsh, T. Handbook of Constraint Programming; Elsevier Science: New York, NY, USA, 2006; ISBN 0444527265. [Google Scholar]
- Van Hentenryck, P.; Laurent, M. Constraint-Based Local Search; MIT Press: Cambridge, MA, USA, 2005. [Google Scholar]
- Meneghetti, A.; Borgo, E.D.; Monti, L. Decision support optimisation models for design of sustainable automated warehouses. Int. J. Shipp. Transp. Logist. 2015, 7, 266. [Google Scholar] [CrossRef]
- Meneghetti, A.; Nardin, G. Enabling industrial symbiosis by a facilities management optimization approach. J. Clean. Prod. 2012, 35, 263–273. [Google Scholar] [CrossRef]
- Seuring, S. A review of modeling approaches for sustainable supply chain management. Decis. Support Syst. 2013, 54, 1513–1520. [Google Scholar] [CrossRef]
- Tassou, S.A.; Lewis, J.S.; Ge, Y.T.; Hadawey, A.; Chaer, I. A review of emerging technologies for food refrigeration applications. Appl. Therm. Eng. 2010, 30, 263–276. [Google Scholar] [CrossRef]
- Meneghetti, A.; Monti, L. Sustainable storage assignment and dwell-point policies for automated storage and retrieval systems. Prod. Plan. Control 2013, 24, 511–520. [Google Scholar] [CrossRef]
- Meneghetti, A.; Monti, L. Multiple-weight unit load storage assignment strategies for energy-efficient automated warehouses. Int. J. Logist. Res. Appl. 2014, 17, 304–322. [Google Scholar] [CrossRef]
- Hwang, H.; Lee, S.B. Travel-time models considering the operating characteristics of the storage and retrieval machine. Int. J. Prod. Res. 1990, 28, 1779–1789. [Google Scholar] [CrossRef]
- Meneghetti, A.; Dal Borgo, E.; Monti, L. Rack shape and energy efficient operations in automated storage and retrieval systems. Int. J. Prod. Res. 2015, 53, 7090–7103. [Google Scholar] [CrossRef]
- European Commission Photovoltaic Geographical Information System. Available online: http://re.jrc.ec.europa.eu/pvg_tools/en/tools.html (accessed on 18 January 2018).
- Huld, T.; Amillo, A. Estimating PV Module Performance over Large Geographical Regions: The Role of Irradiance, Air Temperature, Wind Speed and Solar Spectrum. Energies 2015, 8, 5159–5181. [Google Scholar] [CrossRef] [Green Version]
- Faiman, D. Assessing the outdoor operating temperature of photovoltaic modules. Prog. Photovolt. Res. Appl. 2008, 16, 307–315. [Google Scholar] [CrossRef]
- Koehl, M.; Heck, M.; Wiesmeier, S.; Wirth, J. Modeling of the nominal operating cell temperature based on outdoor weathering. Sol. Energy Mater. Sol. Cells 2011, 95, 1638–1646. [Google Scholar] [CrossRef]
- Huld, T.; Friesen, G.; Skoczek, A.; Kenny, R.P.; Sample, T.; Field, M.; Dunlop, E.D. A power-rating model for crystalline silicon PV modules. Sol. Energy Mater. Sol. Cells 2011, 95, 3359–3369. [Google Scholar] [CrossRef]
- Fu, R.; Feldman, D.J.; Margolis, R.M.; Woodhouse, M.A.; Ardani, K.B. U.S. Solar Photovoltaic System Cost Benchmark: Q1 2017; National Renewable Energy Laboratory: Golden, CO, USA, 2017. [Google Scholar]
- Eurostat Electricity Price Statistics. Available online: http://ec.europa.eu/eurostat/statistics-explained/index.php/Electricity_price_statistics (accessed on 10 February 2018).
- Moro, A.; Lonza, L. Electricity carbon intensity in European Member States: Impacts on GHG emissions of electric vehicles. Transp. Res. Part D Transp. Environ. 2017. [Google Scholar] [CrossRef]
- Singapore’s Energy Market Authority Electricity Grid Emissions Factors and Upstream Fugitive Methane Emission Factor. Available online: https://www.ema.gov.sg/cmsmedia/Publications_and_Statistics/Statistics/18RSU.pdf (accessed on 14 February 2018).
- Singapore’s Energy Market Authority Electricity Tariffs—Industrial Consumers. Available online: Ttps://www.ema.gov.sg/Non_Residential_Programmes_Electricity_Tariffs.aspx (accessed on 14 February 2018).
Figure 1.
A framework for integrating cold chain, photovoltaics, and R-AS/RS design models.

Figure 2.
(a) PV field geometry; (b) PV rows shadows.

Figure 3.
Optimal solution of the reference case: yearly cost structure (a) without and (b) with PV.
Figure 3.
Optimal solution of the reference case: yearly cost structure (a) without and (b) with PV.

Figure 4.
(a) Electricity demand structure and (b) refrigeration load structure of the reference case.
Figure 4.
(a) Electricity demand structure and (b) refrigeration load structure of the reference case.

Figure 5.
(a) Electricity demand structure and (b) refrigeration load structure of the reference case.
Figure 5.
(a) Electricity demand structure and (b) refrigeration load structure of the reference case.

Figure 6.
Optimal solution minimizing grid electricity demand: yearly cost structure (a) without and (b) with PV plant.
Figure 6.
Optimal solution minimizing grid electricity demand: yearly cost structure (a) without and (b) with PV plant.

Figure 7.
(a) Electricity demand structure and (b) refrigeration load structure of the optimal solution using PV plant and minimizing grid electricity demand.
Figure 7.
(a) Electricity demand structure and (b) refrigeration load structure of the optimal solution using PV plant and minimizing grid electricity demand.

Figure 8.
Grid power demand (a) without and (b) with PV plant.

Figure 9.
Sensitivity analysis on electricity price: (a) yearly cost variation of warehouse with PV plant as compared to one without PV installation; (b) yearly cost variation of warehouse with PV plant.
Figure 9.
Sensitivity analysis on electricity price: (a) yearly cost variation of warehouse with PV plant as compared to one without PV installation; (b) yearly cost variation of warehouse with PV plant.

Figure 10.
Sensitivity analysis on storage temperature: (a) electricity withdrawal from the grid and (b) yearly total cost.
Figure 10.
Sensitivity analysis on storage temperature: (a) electricity withdrawal from the grid and (b) yearly total cost.

Figure 11.
Sensitivity analysis on product temperature: (a) electricity withdrawal from the grid and (b) yearly total cost.
Figure 11.
Sensitivity analysis on product temperature: (a) electricity withdrawal from the grid and (b) yearly total cost.

Figure 12.
Sensitivity analysis on system throughput: (a) electricity withdrawal from the grid and (b) yearly total cost.
Figure 12.
Sensitivity analysis on system throughput: (a) electricity withdrawal from the grid and (b) yearly total cost.

Figure 13.
Impact of location on warehouse performance: (a) grid electricity demand and avoided GHG emissions; (b) yearly total cost.
Figure 13.
Impact of location on warehouse performance: (a) grid electricity demand and avoided GHG emissions; (b) yearly total cost.


Table 1.
Value of coefficients to . Source: [37].
Table 1.
Value of coefficients to . Source: [37].
| Coefficient | Value |
|---|---|
| −0.017237 | |
| −0.040465 | |
| −0.004702 | |
| 0.000149 | |
| 0.000170 | |
| 0.000005 |
Table 2.
PV system costs. Source: [38].
Table 2.
PV system costs. Source: [38].
| Investment cost [€/kW] | 1658 | |
| Yearly O&M expenses [€/kW] | 12.75 |
Table 3.
Optimal warehouse configuration with and without PV plant.
| Warehouse Configuration and Performance | Without PV | With PV |
|---|---|---|
| Columns | 25 | 25 |
| Levels | 6 | 6 |
| Lane depth | 16 | 16 |
| Aisle | 1 | 1 |
| Yearly total cost [€/y] | 339,258 | 334,727 |
| Grid electricity demand [kWh/y] | 712,776 | 595,536 |
Table 4.
Main parameters of the optimal warehouse configuration to minimize grid electricity demand.
Table 4.
Main parameters of the optimal warehouse configuration to minimize grid electricity demand.
| Warehouse Configuration and Performance | Without PV | With PV |
|---|---|---|
| Columns | 15 | 15 |
| Levels | 10 | 5 |
| Lane depth | 16 | 16 |
| Aisle | 1 | 2 |
| Yearly total cost [€/y] | 344,725 | 385,725 |
| Grid electricity demand [kWh/y] | 670,132 | 582,580 |
Table 5.
R-AS/RS with PV plant: optimal rack configurations with minimum yearly total cost for different system throughputs.
Table 5.
R-AS/RS with PV plant: optimal rack configurations with minimum yearly total cost for different system throughputs.
| Warehouse Configuration | Warehouse Features | System Throughput [Cycles/h] | ||||||||||
|---|---|---|---|---|---|---|---|---|---|---|---|---|
| 15 | 30 | 45 | 51 | 52 | 53 | 54 | 56 | 57 | 60 | 75 | ||
| Without PV | Columns | 25 | 25 | 25 | 25 | 30 | 30 | 43 | 43 | 25 | 25 | 25 |
| Levels | 6 | 6 | 6 | 6 | 10 | 10 | 7 | 7 | 6 | 6 | 6 | |
| Depth | 16 | 16 | 16 | 16 | 8 | 8 | 8 | 8 | 8 | 8 | 8 | |
| Aisle | 1 | 1 | 1 | 1 | 1 | 1 | 1 | 1 | 2 | 2 | 2 | |
| With PV | Columns | 25 | 25 | 25 | 25 | 43 | 43 | 43 | 43 | 25 | 25 | 25 |
| Levels | 6 | 6 | 6 | 6 | 7 | 7 | 7 | 7 | 6 | 6 | 6 | |
| Depth | 16 | 16 | 16 | 16 | 8 | 8 | 8 | 8 | 8 | 8 | 8 | |
| Aisle | 1 | 1 | 1 | 1 | 1 | 1 | 1 | 1 | 2 | 2 | 2 | |
| PV Modules | 352 | 352 | 352 | 324 | 324 | 324 | 324 | 324 | 363 | 363 | 363 | |
Table 6.
Main features for different locations.
| Location | Climate Type | Latitude | Carbon Intensity [gCO2/kWh] | Ground Temp. [°C] | Electricity Price [€/kWh] |
|---|---|---|---|---|---|
| Pordenone (Italy) | Oceanic | 45.90° | 431 | 13.1 | 0.148 |
| Siracusa (Italy) | Mediterranean | 37.06° | 431 | 18.7 | 0.148 |
| Singapore (Singapore) | Tropical rainforest | 01.27° | 398 | 27.5 | 0.132 |
| Hamburg (Germany) | Oceanic | 53.58° | 615 | 9.6 | 0.152 |
| Helsinki (Finland) | Humid continental | 60.17° | 211 | 6.3 | 0.067 |
© 2018 by the authors. Licensee MDPI, Basel, Switzerland. This article is an open access article distributed under the terms and conditions of the Creative Commons Attribution (CC BY) license (http://creativecommons.org/licenses/by/4.0/).
Share and Cite
MDPI and ACS Style
Meneghetti, A.; Dal Magro, F.; Simeoni, P. Fostering Renewables into the Cold Chain: How Photovoltaics Affect Design and Performance of Refrigerated Automated Warehouses. Energies 2018, 11, 1029. https://doi.org/10.3390/en11051029
AMA Style
Meneghetti A, Dal Magro F, Simeoni P. Fostering Renewables into the Cold Chain: How Photovoltaics Affect Design and Performance of Refrigerated Automated Warehouses. Energies. 2018; 11(5):1029. https://doi.org/10.3390/en11051029
Chicago/Turabian StyleMeneghetti, Antonella, Fabio Dal Magro, and Patrizia Simeoni. 2018. "Fostering Renewables into the Cold Chain: How Photovoltaics Affect Design and Performance of Refrigerated Automated Warehouses" Energies 11, no. 5: 1029. https://doi.org/10.3390/en11051029
Note that from the first issue of 2016, this journal uses article numbers instead of page numbers. See further details here.