Article

Sustainable Management of Oleaginous Trees as a Source for Renewable Energy Supply and Climate Change Mitigation: A Case Study in China

Department of Environmental Science, Aarhus University, Frederiksborgvej 399, DK 4000 Roskilde, Denmark
*
Author to whom correspondence should be addressed.
Energies 2018, 11(5), 1123; https://doi.org/10.3390/en11051123
Submission received: 19 February 2018 / Revised: 25 April 2018 / Accepted: 30 April 2018 / Published: 2 May 2018
(This article belongs to the Section A: Sustainable Energy)

Abstract

:
Forests provide a range of ecosystem services, including bioenergy supply and carbon sequestration, both contributing to significant climate change mitigation. Oleaginous trees have potential to provide bioenergy supplies through biodiesel-producing seed yield as well as contributing to carbon sequestration. This paper aims to show the provisions of bioenergy and carbon savings through forest rotation management and it will investigate the potential of oleaginous forest management in China. We use the land expectation value (LEV) model to calculate the optimal joint values of timber, seed and total carbon savings, including carbon sequestration from forest and carbon reductions through energy substitutions. The results indicate that combining both values of seeds and carbon savings increase the LEV and rotation age (167,611 Yuan/ha, 78 years) compared to sole timber value (26,053 Yuan/ha, 55 years). The optimization of the LEVs and the resulting optimal rotation ages are significantly sensitive to the discounting rate. Annual biodiesel potential production from Pistacia chinensis can take up 1.7% of the national diesel consumption in China. We conclude that China can use improved forest rotation management as an effective means for achieving goals in its low-carbon energy strategy.

1. Introduction

The 2015 Paris Climate Conference resulted in an agreement to keep global warming below 2 °C [1]. China has committed to peaking CO2 emissions by 2030 [2,3]. Curbing large emissions through reductions can conflict with China’s rapid economic growth. There is strong motivation to develop new and alternative energy sources to stay in line with the Paris agreement with minimal impact on economic growth.
Forest-based bioenergy provides an energy supply and contributes to greenhouse gas (GHG) reductions. Initiatives in heavily-forested European Union (EU) countries, like Finland and Sweden [4] provide a model for bioenergy supply and climate change mitigation potential. By 2020, EU forests are projected to supply 200–400 million m3 wood-based biomass for energy per year, providing as much as 5% of the total energy production [5]. Forest products converted to bioenergy include wood residues for the production of biogas by anaerobic digestion [6,7] and production of bioethanol through simultaneous saccharification and fermentation (SSF) methods [8]. Seeds produce biodiesel through esterification processing [9], a viable substitute for traditional diesel used in the transport sector for heavy duty vehicles (HDV). In China, oleaginous trees provide these forest resources.
China’s climate policy includes a prioritized target to increase the nation’s forested areas and forest stock volume by about 4.5 billion cubic meters compared with the 2015 levels [10]. To achieve this, China proposes increasing the portion of non-fossil (renewable and nuclear) energy sources in the consumption of energy mix to approximately 20 percent [10]. The oleaginous tree provides an expedient way to achieve these climate goals and China has excellent potential to successfully grow oleaginous trees. Until 2013, the total area of oleaginous trees was roughly 1.35 million hectares. Projections for 2020 indicate that this area will increase to approximately 4.22 million hectares, hereby increasing the share of oleaginous forest to approximately 1.4% of the total woodland areas (the total woodland area was approximately 300 million hectares in 2013; data source: State Forestry Administration of the People’s Republic of China) [11]. The seeds of oleaginous trees contain a significant amount of oil (30–60%) [11], an ideal raw material for biodiesel production.
The oleaginous seeds are harvested continuously without cropping timber, thus eliminating carbon sequestration [12]. The novelty of this study is that the seed value distributes in a semi-closed and semi-open integral interval (starting from when the trees are matured until the final timber harvest). This is unlike other environmental values, such as water catchment and carbon sequestration, that happen when the forest is first planted [13,14,15,16]. This paper aims to estimate bioenergy utilization values from seeds and carbon savings resulting from optimal forest rotation management of China’s oleaginous trees and to investigate the potential of oleaginous forest management in the nation’s energy supply and carbon savings. For carbon savings, we referred to both forest carbon sequestration and CO2 emission reductions from diesel substitutions.
The analysis is done by calculating the joint land expectation value (LEV) from three forest ecosystem services: timber, seed production and total carbon savings. Estimations of the LEV inform the optimal choice of producing values from timber, seeds and carbon savings by extending traditional forest management models [13,14,15]. We will test the results with different biological and economic assumptions. We will subsequently compare the results with those from harvesting the forest exclusively for timber production with the joint production of timber and forest carbon sequestration as well as the joint production of timber, seeds and carbon savings. The remainder of the paper presents the methods and the data sources used; then illustrates the model calibrations with a thorough analysis of the results and a conclusion to provide future recommendations.

2. Methods and Materials

This paper applies the extended Faustmann [17] and Hartman [18] formulas as the main method. We calculated the value of timber; timber and forest carbon sequestration; timber and seeds, timber, seeds and total carbon savings—to arrive at the LEV for goods and services for each combination.
Figure 1 illustrates that empirical data fits in biological growth models for estimations of the growth of timber volume and seed production [19]. We used the model from Levy et al. [20] to calculate of the amount of carbon sequestration from the trees. We also calculated the CO2 emission reductions by energy substitution [21]. We included these inputs to modify a LEV model, building on the principles from extended Faustmann and Hartman formulas. We estimated the optimal LEVs and corresponding optimal rotation ages, and the nationwide potentials of bioenergy supply and carbon savings.

2.1. Modified LEV Model Considering Values of Seed Production and Carbon Savings

The Faustmann formula [17] is used to establish a methodological framework to analyze optimal forest decisions. The Faustmann formula is based on the theory of net present value (NPV) to estimate the LEV. As the discounting rate can be reflected in the rotation period, the discounted present value assists forest owners to know what the future timber value is worth now. The optimal rotation age is the period in which the marginal yield value equals forest value returns and land value (i.e., the marginal benefit equals the marginal opportunity cost) [14]. The Faustmann formula factors the establishment cost and is based on forest management for even-aged infinite rotations, as shown in Equation (1).
L E V = P t f ( T ) ( 1 + r ) T C 0 1 ( 1 + r ) T
where Pt is the stumpage price and f(T) is the timber volume harvested time T; the increase of Pt and f(T) will increase LEV. T is the rotation age of the forest. C0 is the establishment cost. The increase of establishment cost will decrease the value of LEV. The discounting rate is given by r.
Forests have a variety of ecosystem services beyond timber that can be analysed using the Hartman formula [18], extending the case in the Faustmann formula. The Hartman formula presents the joint timber value and amenity, as shown in Equation (2):
L E V = [ P t f ( T ) ( 1 + r ) T C 0 ] + t = 0 t = T E ( t ) ( 1 + r ) t d t 1 ( 1 + r ) T
The first part of the numerator in Hartman’s equation is the present timber value and the second part is the integral of the flows of the present amenity value [22,23]; the aim of this equation is to find the optimal rotation time T to maximize the LEV. The result of the Hartman [18] formula illustrates that the optimal rotation age will be extended when an amenity value, such as recreation or carbon sequestration, is taken into account. The amenity value E(t) appears from 0 to T.
Seed production is essential for natural regeneration, but some varieties can also be utilized for energy production. Seed production yield varies widely due to geographic and climatic factors, as well as the tree species [24]. Seed production also varies as a result of the age of the forest stands. During a tree’s lifespan, there is a certain age after which it is mature and fertile enough to yield seeds. Unlike timber harvesting, seed harvesting is continuous during a tree’s maturity. When the timber is harvested, the accumulation of the seed production and its value stop simultaneously:
L E V = [ P t f ( T ) ( 1 + r ) T C 0 ] + t = T 1 t = T P s S ( t ) ( 1 + r ) t d t t = T 1 t = T C s ( t ) ( 1 + r ) t d t 1 ( 1 + r ) T
Equation (3) shows the joint production of timber and seeds. The first part of the equation’s numerator is the present timber value. The remaining part represents the accumulated present value of seeds, equaling the accumulated present income minus accumulated present cost from seed harvesting activities. Ps is the seed price and Cs(t) is the seed harvesting cost changing with time t. S(t) is the amount of seed production per year. Assuming that the lifetime of the forest is from 0 to T, there is a specific time-point (T1) in which the tree is mature enough to yield seeds. The seed value appears from T1 until the tree is harvested at time T.
We used the Faustmann and the Hartman formulas in a modified model of the joint value of timber, seeds and carbon savings, expressed below in Equation (4):
L E V = [ P t f ( T ) ( 1 + r ) T C 0 ] + t = T 1 t = T P s S ( t ) ( 1 + r ) t d t t = T 1 t = T C s ( t ) ( 1 + r ) t d t 1 ( 1 + r ) T + t = 0 t = T P c E 1 ( t ) ( 1 + r ) t d t + t = T 1 t = T P c E 2 ( t ) ( 1 + r ) t d t 1 ( 1 + r ) T
The first part of the equation’s numerator above is the present timber value; the second and third parts are the accumulated present seed value starting from time T1. As to the last two parts, Pc is the carbon price. E1(t) is the amount of carbon sequestration starting from the beginning of tree growth, and E2(t) is the amount of CO2 emission reduction due to substituting diesel with biodiesel from the seeds.
The LEV model takes the continuous rotations and discounting rate effect into account. However, it does not represent the ecological aspect of forest management, specifically the relations between land use and forest productivity (ecological rotation) [25]. The ecological relations are complicated and site-specific. Due to the lack of available data, our study does not explicitly consider this part from the LEV model.

2.2. Biolgical Growth of Timber Estimates; Seed Production and Carbon Sequestration Calculations

Biological tree growth has to be estimated as it affects the annual LEV and determines the optimal rotation ages. Sigmoidal curves are generally used to illustrate the biological growth trend. These curves present a slow growth at the initial time, then a rapid exponential growth, and finally a reduced growth when reaching an asymptote value. In this paper, we used two commonly-used sigmoidal functions: logistic [26] and Gompertz [27], to fit the growth curve of the oleaginous trees.
For the functions in Table 1 below, t is the tree age (year); y(t) is collectively referring to the timber volume or seed production at the time t. A, α, β are parameters. A is the upper asymptote or the potential maximum value of this function; α is the biological constant; β represents the growth rate; e is the base of natural logarithm [19]. The difference between the logistic and Gompertz curves is that the latter one is asymmetric while the logistic curve is symmetric [28]. As to the logistic curve, the inflection point on the y-axis occurs at A/2; for the Gompertz curve, this point occurs on the y-axis at A/e [29]. The A in the logistic and Gompertz functions affects the upper asymptote and the value of intersection with y-axis; α and β affect the curve shape and the value of y-axis intersection as well [30].
When considering the estimation of carbon sequestration, it should be noted that trees do not only keep the carbon in the trunk, but also in the branches, leaves and roots. The biomass expansion factor (BEF) and the root-to-shoot ratio (R) are the coefficients to measure forest carbon stock. The BEF is the ratio of the aboveground oven-dry biomass to the oven-dry inventoried volume. R is the ratio of the underground part of the tree to the aboveground biomass [31]. According to these two measuring factors, Levy et al. (2004) [20] used the formula Equations (5) and (6) about the timber volume f(t), wood density (dry mass) θ, BEF, carbon content of the dry mass μ and R to estimate the carbon proportion (CP) [20].
Δ C P = ( C P b C P a ) / Y
C P ( t ) = [ f ( t ) θ B E F μ ] ( 1 + R )
In Equation (5), ΔCP is the annual change of carbon stocks. CPa is the carbon proportion of time a and CPb is the carbon proportion of time b. Y is the number of years between time b and time a:
E 1 ( t ) = C P ( t ) ω = [ f ( t ) θ B E F μ ] ( 1 + R ) ω
Equation (7) explains the carbon sequestration amount stocked in the forest per ha as it is the carbon proportion times the coefficient ω, which is the molecular mass of CO2 divided by the atomic weight of carbon [14]. The values of coefficients are illustrated in Table A1.

2.3. Estimations of Energy Substitution and CO2 Emission Reductions

Biodiesel production amounts depend upon harvested seed weight S(t); the coefficient η represents the amount of seeds per kilogram of biodiesel production. Assuming all the seeds are used for biodiesel production and all the produced biodiesel is used to replace diesel. n is the net calorific value of diesel, and therefore the total energy J that this biodiesel application can save is shown in Equation (8):
J = t = T 1 t = T S ( t ) n η × λ 1
where t = T 1 t = T S ( t ) represents the accumulated weight of the harvested seeds per ha, which is measured in kilograms. The total energy from Equation (8) is measured in the unit of terajoule (TJ) [32]. λ1 is the coefficient to transform kilograms to gigagrams.
Based on the net calorific value, we then calculated the CO2 emission reductions from using biodiesel. The emission factor m represents the kilogram of CO2 per TJ on a net calorific basis of diesel. λ2 is the coefficient to transfer kilogram to tonne (CO2 emission reductions from using biodiesel is measured in the unit of kilogram. Equation (9) divides λ2 in order to make sure the results are presented in tonnes, which is consistent with the units of the results from the calculation of carbon sequestration). Therefore, we assume that biodiesel is carbon neutral [33]. If all the seed production is transformed into biodiesel and all of it is entirely used to replace diesel, the model of calculating the amount of CO2 emission reductions E2(t) per ha is Equation (9):
E 2 ( t ) = J m λ 2
The values of the coefficients can be found in Table A1.

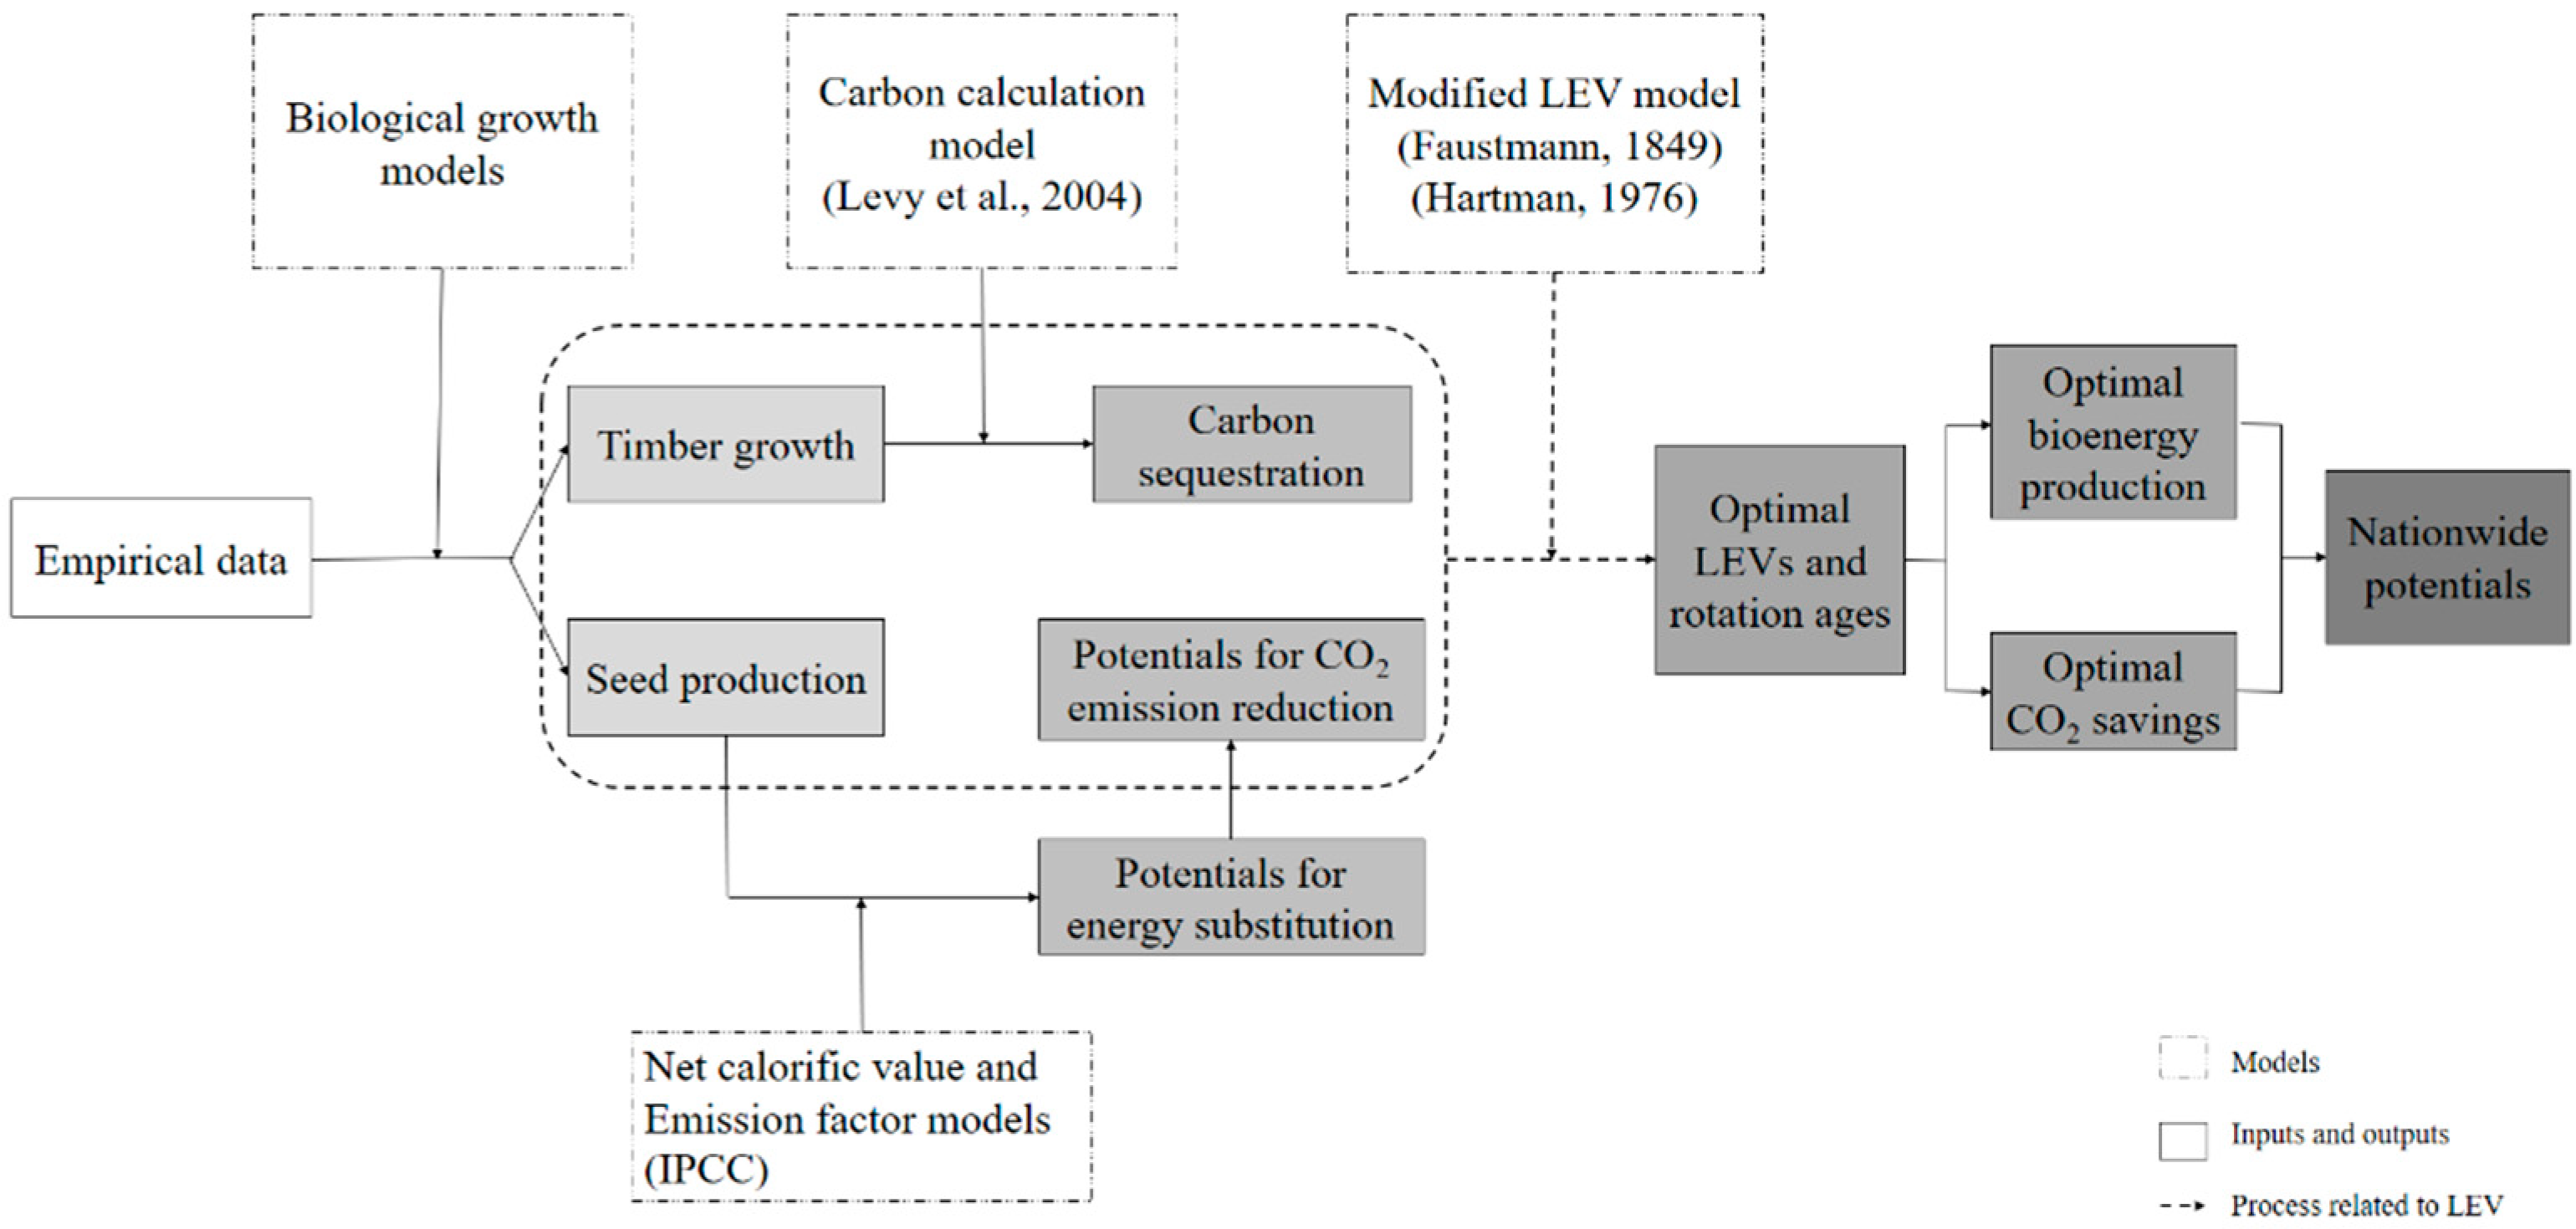
2.4. Model Upscale to the National Level

In order to investigate the nationwide effects of planting Pistacia chinensis and the usage of biodiesel from its seed yield, the potential planting areas Qi of each province in 2020 [11] were applied in Equations (10) and (11), where i stands for 10 different provinces (iI, I = {Anhui, Gansu, Hebei, Henan, Hubei, Shaanxi, Shandong, Shanxi, Yunnan, Zhejiang}.) which have plans for culvating Pistacia chinensis.
N B = [ Q i t = T 1 t = T S ( t ) η × λ 2 ] T
In Equation (10), NB represents the annual potential national biodiesel production from Pistacia chinensis, which is the sum of the annual potential provincial biodiesel production. The last part in the bracket is the amount of biodiesel production (tonne) per ha:
N C = [ Q i ( E 1 ( t ) + E 2 ( t ) ) ] T
In Equation (11), NC stands for the annual potential national carbon savings from Pistacia chinensis, which is the sum of the annual potential provincial carbon savings. E1(t) + E2(t) is the total amount of carbon savings (tonne) per ha.
Furthermore, as to the provinces which have large planned areas of planting Pistacia chinensis, the biodiesel production and forest carbon sequestration can also contribute to the local diesel supply and CO2 emission reductions. We used the following proportion to illustrate these effects:
p D = [ Q i t = T 1 t = T S ( t ) T η × λ 2 ] D i
In Equation (12), pD is the proportion of annual provincial biodiesel production potential from Pistacia chinensis on the annual provincial diesel consumptions. The numerator is the annual potential biodisel production of each province and the denominator is the corresponding annual provincial diesel consumption.
p E = Q i ( E 1 ( t ) + E 2 ( t ) ) T E i
In Equation (13), pE is the annual proportion of the provincial carbon savings potential of Pistacia chinensis on the annual provincial CO2 emissions. The numerator is the annual potential carbon savings of each province and the denominator is the annual corresponding provincial CO2 emissions.

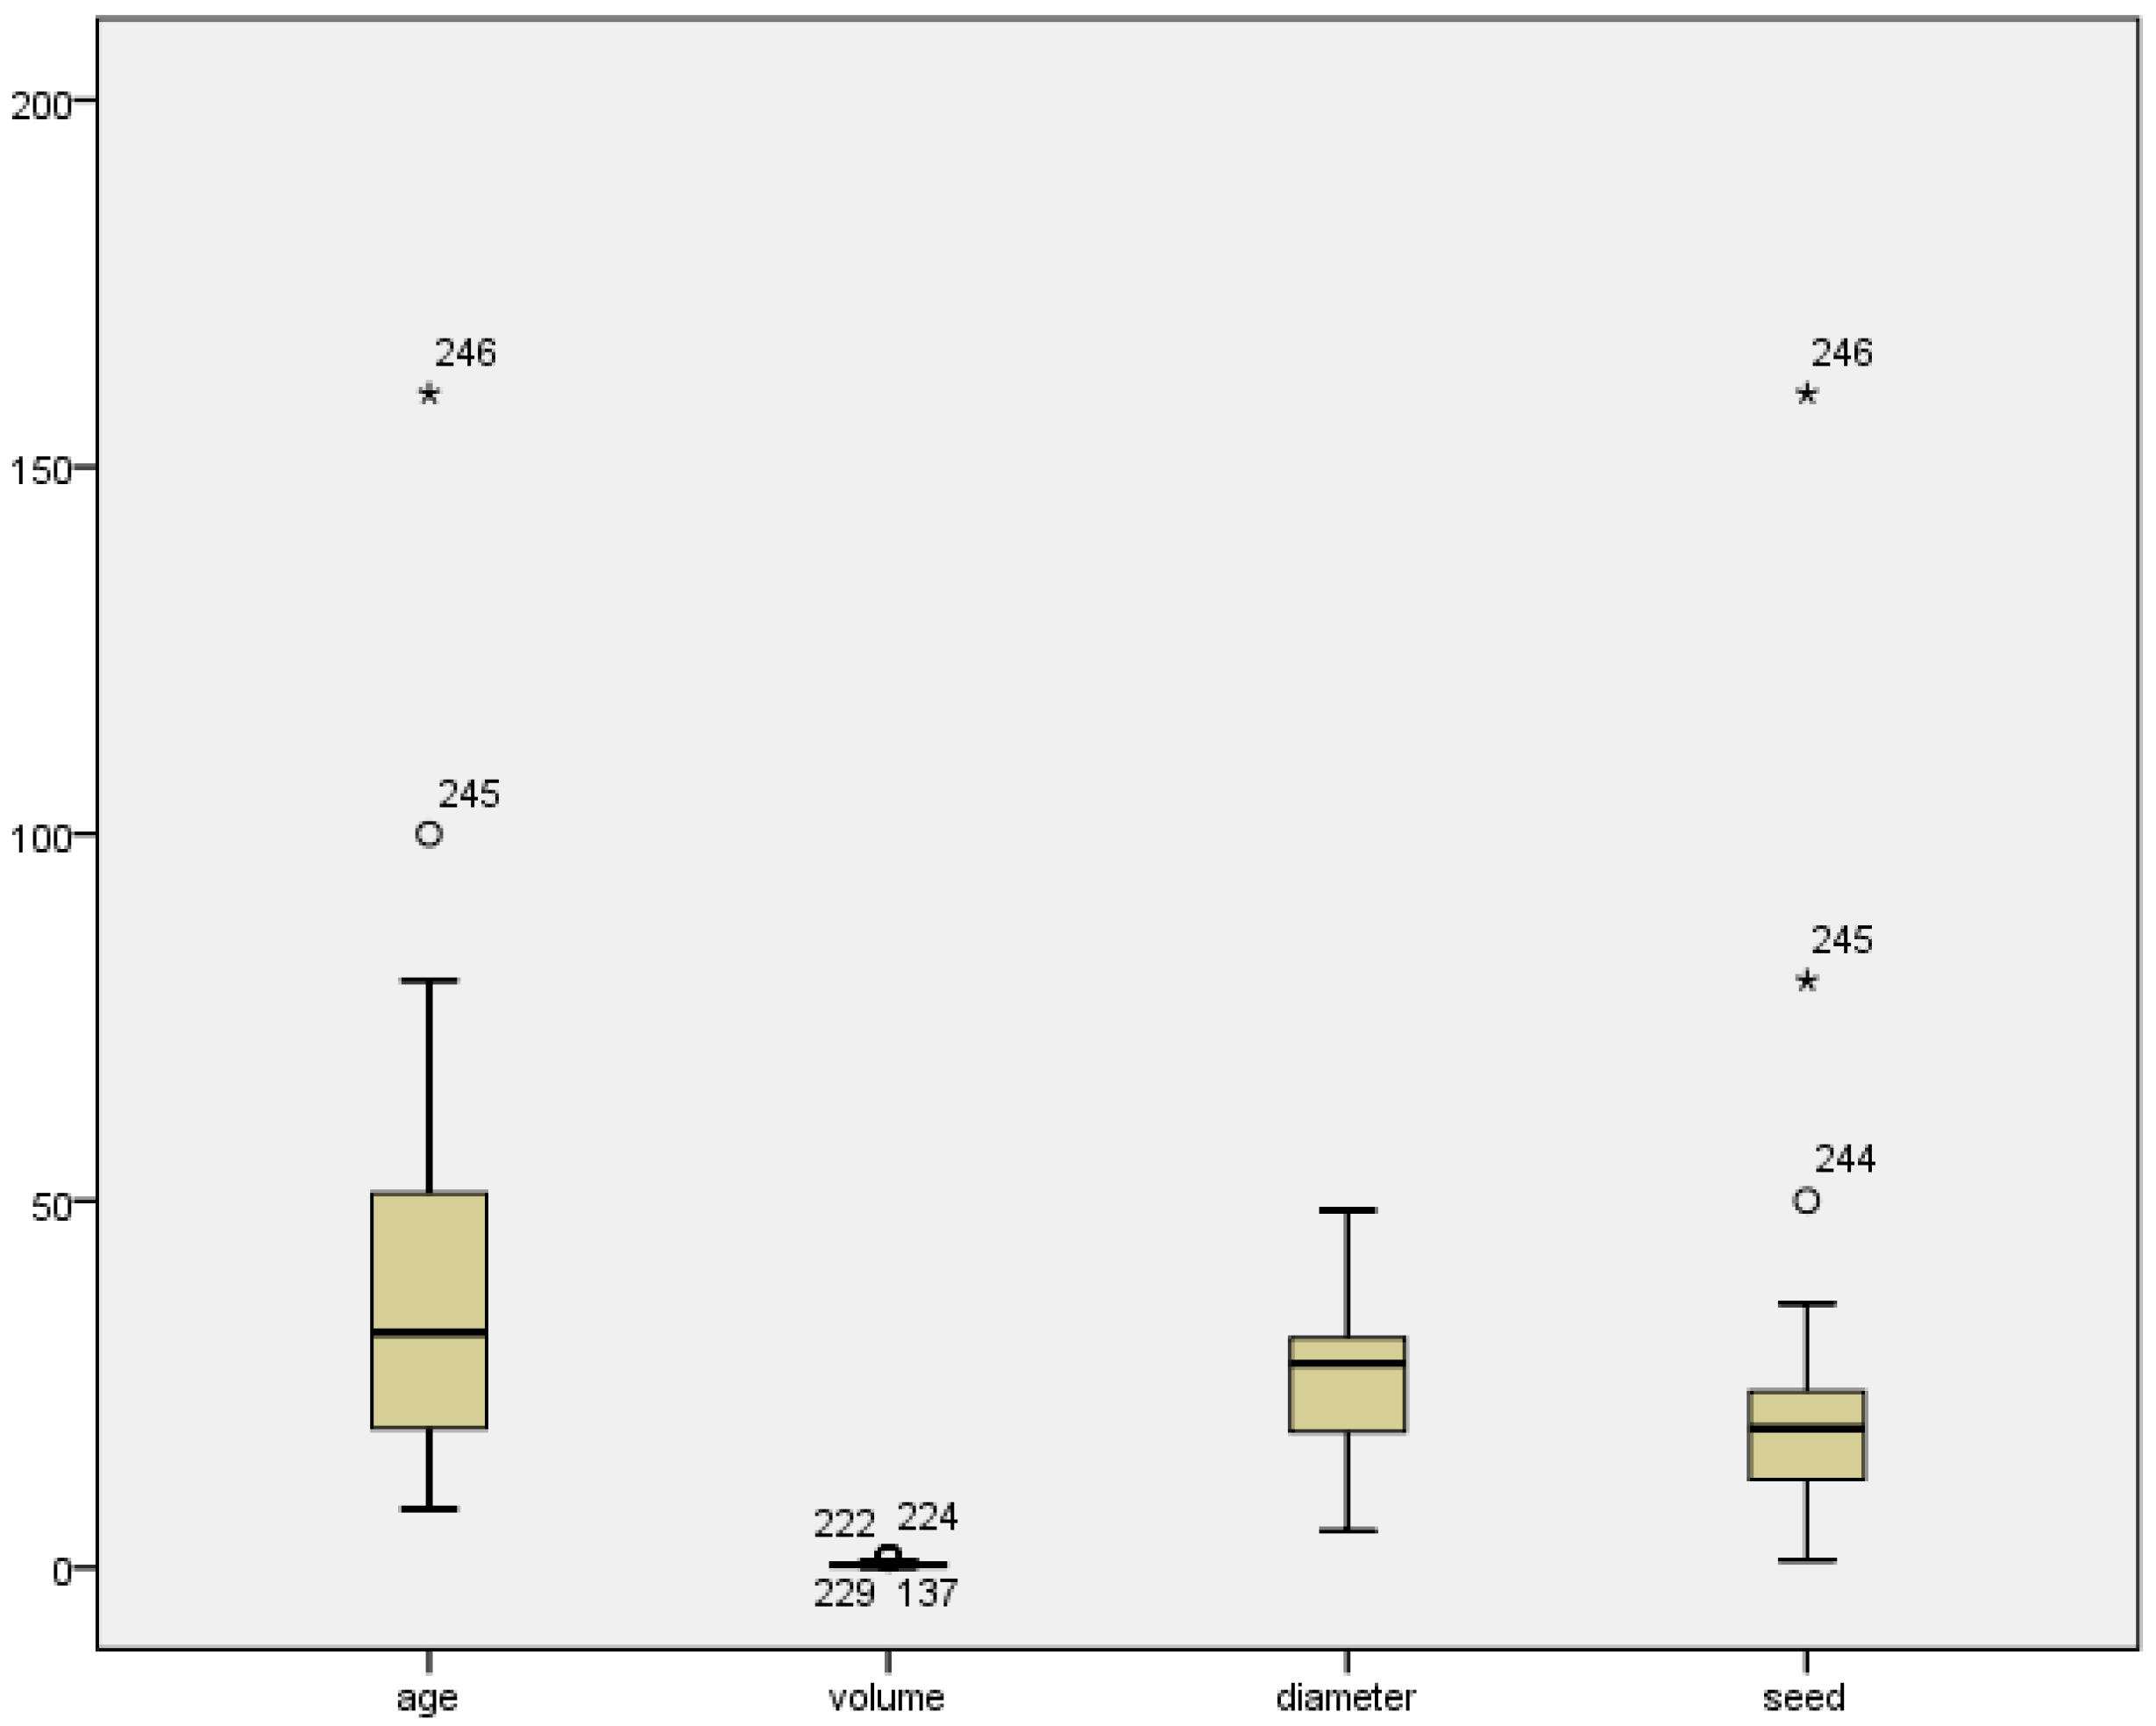
2.5. Data Description and Processing

There are 1554 species of oleaginous trees registered in China and 154 species of them contain more than 40% oil in seeds [34]. Among them, Jatropha curcas, Pistacia chinensis and oil palm can be cultivated in a large scale [11]. We chose to apply the empirical data of Pistacia chinensis because the potential distribution area is very large, mainly comprising from the temperate zone to the subtropical zone of China [35]. Because of its widespread distribution, this tree species is a good example to represent other oleaginous trees in general. In order to achieve primary empirical production data of Pistacia chinensis, not currently available from official statistics or other published sources, we conducted interviews with the principal of the Anyang Forest Ministry, China. These interviews were conducted from May 2017 through September 2017.
In total, we received available data about 236 trees, including growth information of Pistacia chinensis. The dataset is limited, but we assumed that the data represents a variety of trees in terms of age and growing conditions. We eliminated outliers using SPSS 24 (IBM, Armonk, NY, USA, Figure A1 and Figure A2). The regressions are processed by using STATA 14 SE (StataCorp, College Station, TX, USA). Moreover, in order to investigate the national effects of cultivating Pistacia chinensis, the estimated results and other published data were applied in ArcGIS software (Esri, Redlands, CA, USA) to illustrate the potential benefits [11,36,37]. The definitions of all variables are explained in Table A2.

3. Results

The choices of biological factors: parameters about tree growth rate and seed production, as well as the economic factors such as discounting rate, affect the results of LEVs and optimal rotation ages. This section of the paper first presents the results from the parameter estimations of timber volume growth model and seed production model of Pistacia chinensis. Then it presents the LEV and optimal rotation age results in a reference scenario (RS) based on interviews, recent market information, and literature, which is followed by sensitivity analysis of the changes from both market economic factors and seed production factors.

3.1. Results of Model Parameter Estimations

Non-linear regressions are used to estimate how the timber volume growth and seed production develop with the tree’s age, assuming the planted forests are even-aged.

3.1.1. Timber Growth

Table 2 illustrates the nonlinear regression results about the parameters of timber volume growth with two types of S-curves: logistic curve (fL1(t)) and Gompertz curve (fG1(t)). The p-value of AG1 in the Gompertz is not significant. Therefore, in this study, the logistic curve is a better choice for estimating the timber volume growth.

3.1.2. Seed Production

Table 3 below shows the parameter estimations results of the Pistacia chinensis seed production with two types of S-curves. The estimation results from both curves are significant and all the dependent variables can be thoroughly explained by independent variables. Then we compared the estimated results to the real data, and out of the data from 236 trees the highest seed production is 36 kg. Consequently, the Gompertz curve (SG2(t)) is the best choice to estimate the seed production (with the potential maximum seed production AG2 equals 36.14). The definitions of all parameters are explained in Table A2.

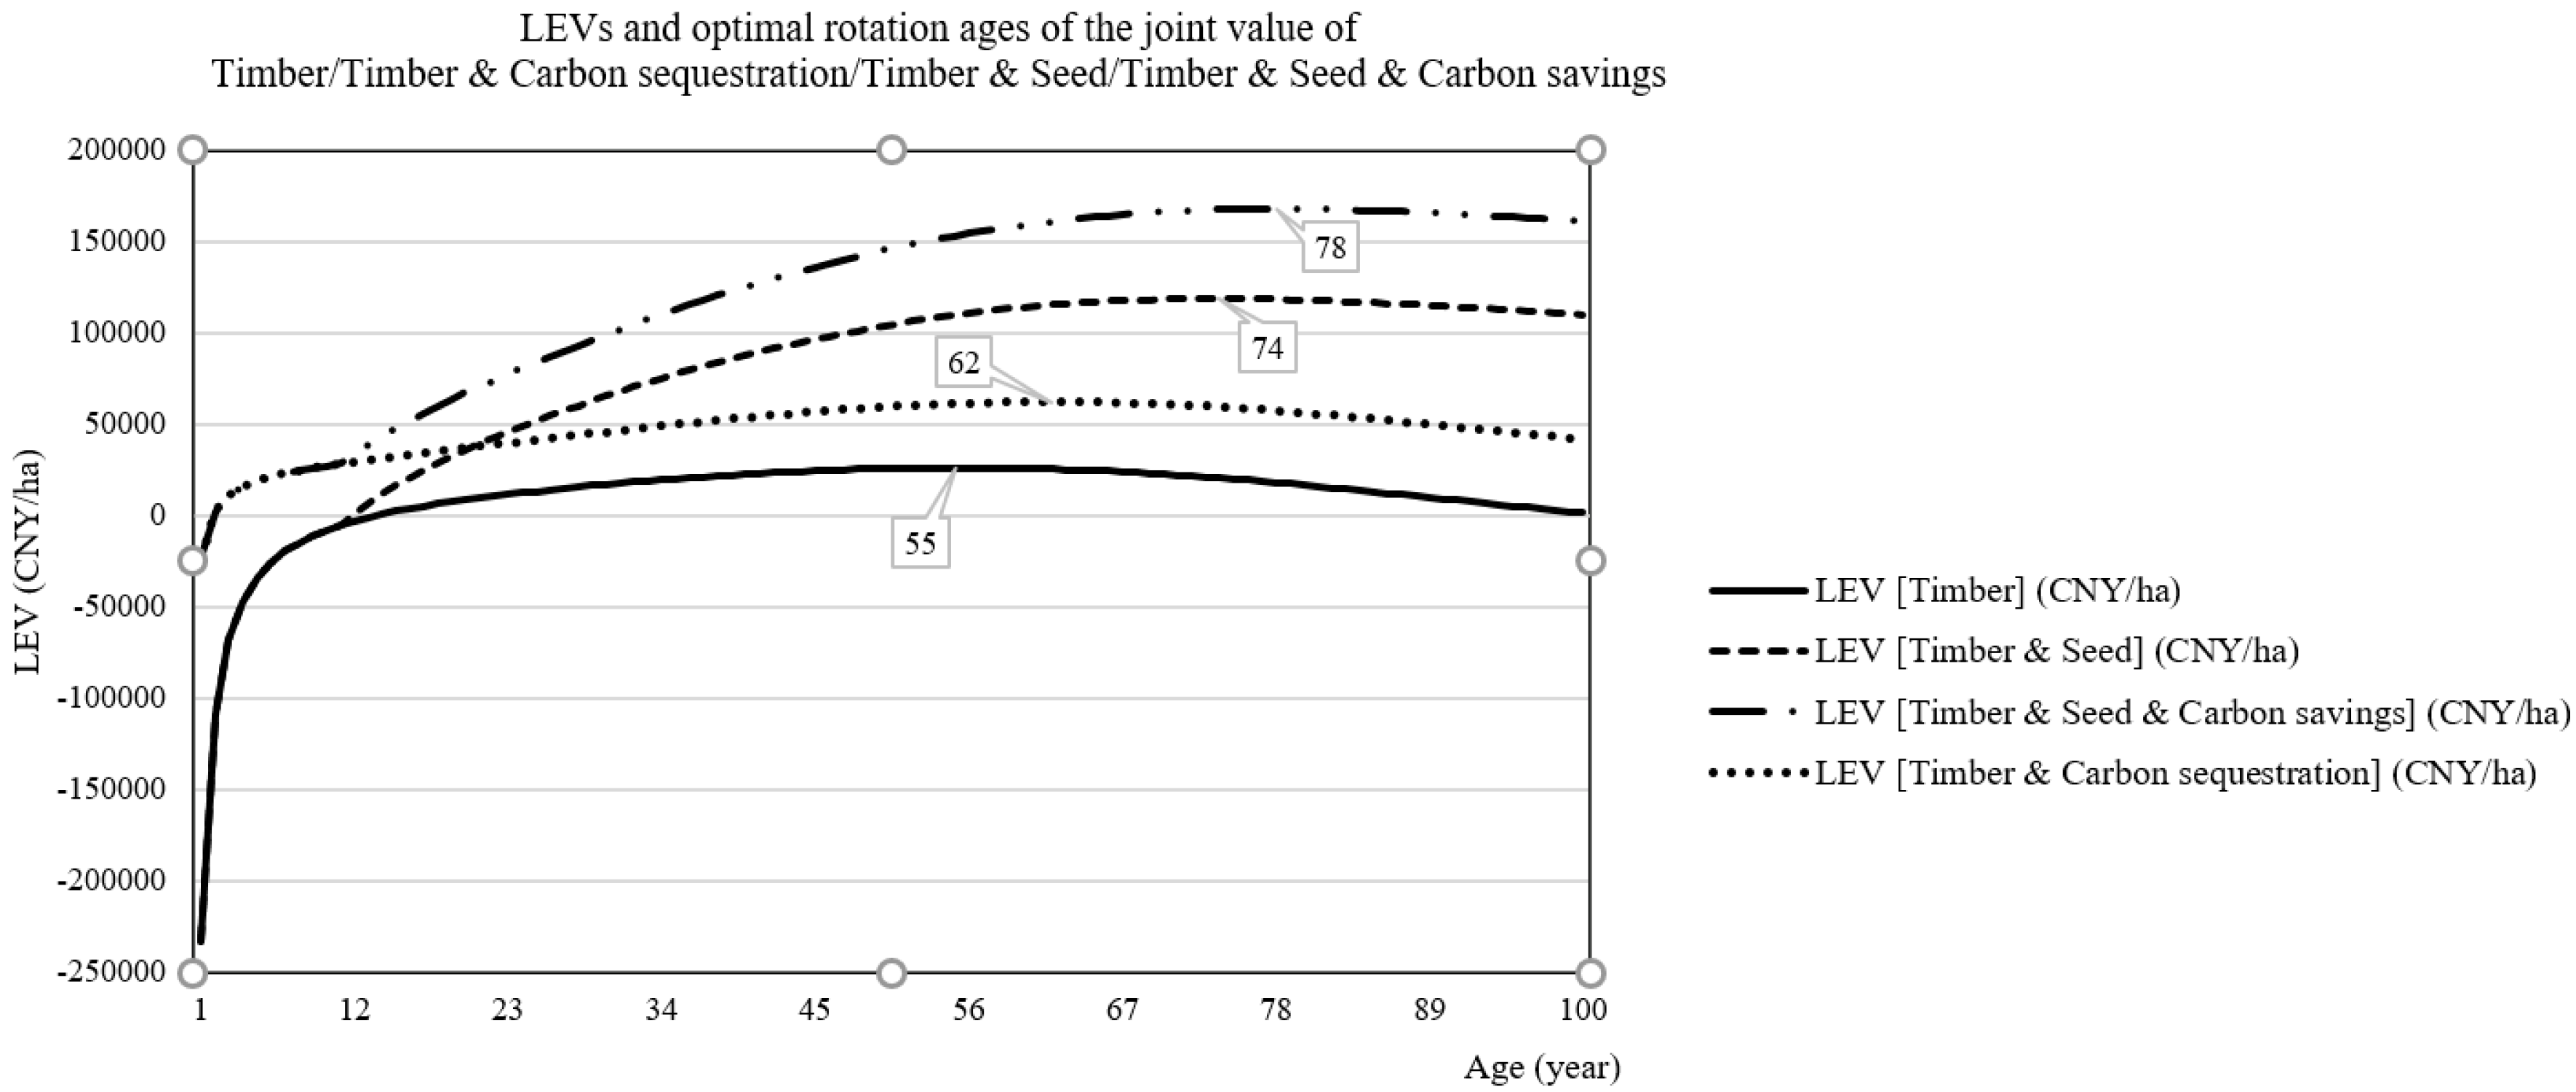
3.2. Results of the Reference Scenario

The results from this scenario are based on interviews, recent market information, literature. The related prices were adjusted according to the consumer price index (CPI) [38,39]. The average stumpage price is 425 CNY/m3 (100 EURO = 782.1 CNY (Bank of China, 30 November 2017); The half of the timber price is the stumpage price, which is applied when logging costs are not considered.) [40,41]; the seed price is 1.5 CNY/kg [11]; and the estimated carbon price is 45 CNY/tonne [42]. The discounting rate is set at 3% [15]. The establishment cost and seed harvesting cost are illustrated in Table A3.
Figure 2 shows the trends of how different LEVs change with time and the corresponding optimal rotation ages. Compared to the LEV of sole timber value, the inclusion of carbon sequestration value will increase the LEV and increase the optimal rotation age to year 62. When the seed value is included, the LEV increases sharply and extends the optimal rotation age to year 74. Likewise, the inclusions of both seed and carbon saving values increase LEV. The joint production of all three ecosystem services extends the optimal rotation age (year 78), but not significantly longer than the one for timber and seed. Thus, when more than one forest ecosystem service is taken into consideration, the LEV will increase and so will the optimal rotation age. Clearly, the seed value has a strong influence on both LEV and optimal rotation ages, therefore playing a significant role in the forest management of oleaginous trees.
The delay of optimal rotation ages also leads to higher amounts of seed production for bioenergy supply and carbon savings. When only timber and carbon sequestration values are considered, the annual carbon amount stored in the forest is 29 tonnes per ha. Regarding the joint values of timber, seed and total carbon savings, the annual saved carbon amount is almost 44 tonnes per ha. This includes 10.5 tonnes CO2 emission reductions from energy substitution and 33.5 tonnes from forest carbon sequestration. This is 50% more than the LEV of timber and carbon sequestration.
Likewise, under this circumstance, the total accumulated seed production reaches up to 636 tonnes per ha, and this means 254 tonnes of biodiesel production, an increase of nine percent compared to the LEV of timber and seed alone. To sum up, the inclusions of values from seed and total carbon savings will increase the LEV and delay the optimal rotation age, leading to higher amounts of potential biodiesel production, thus significantly increasing the total amount of carbon savings.

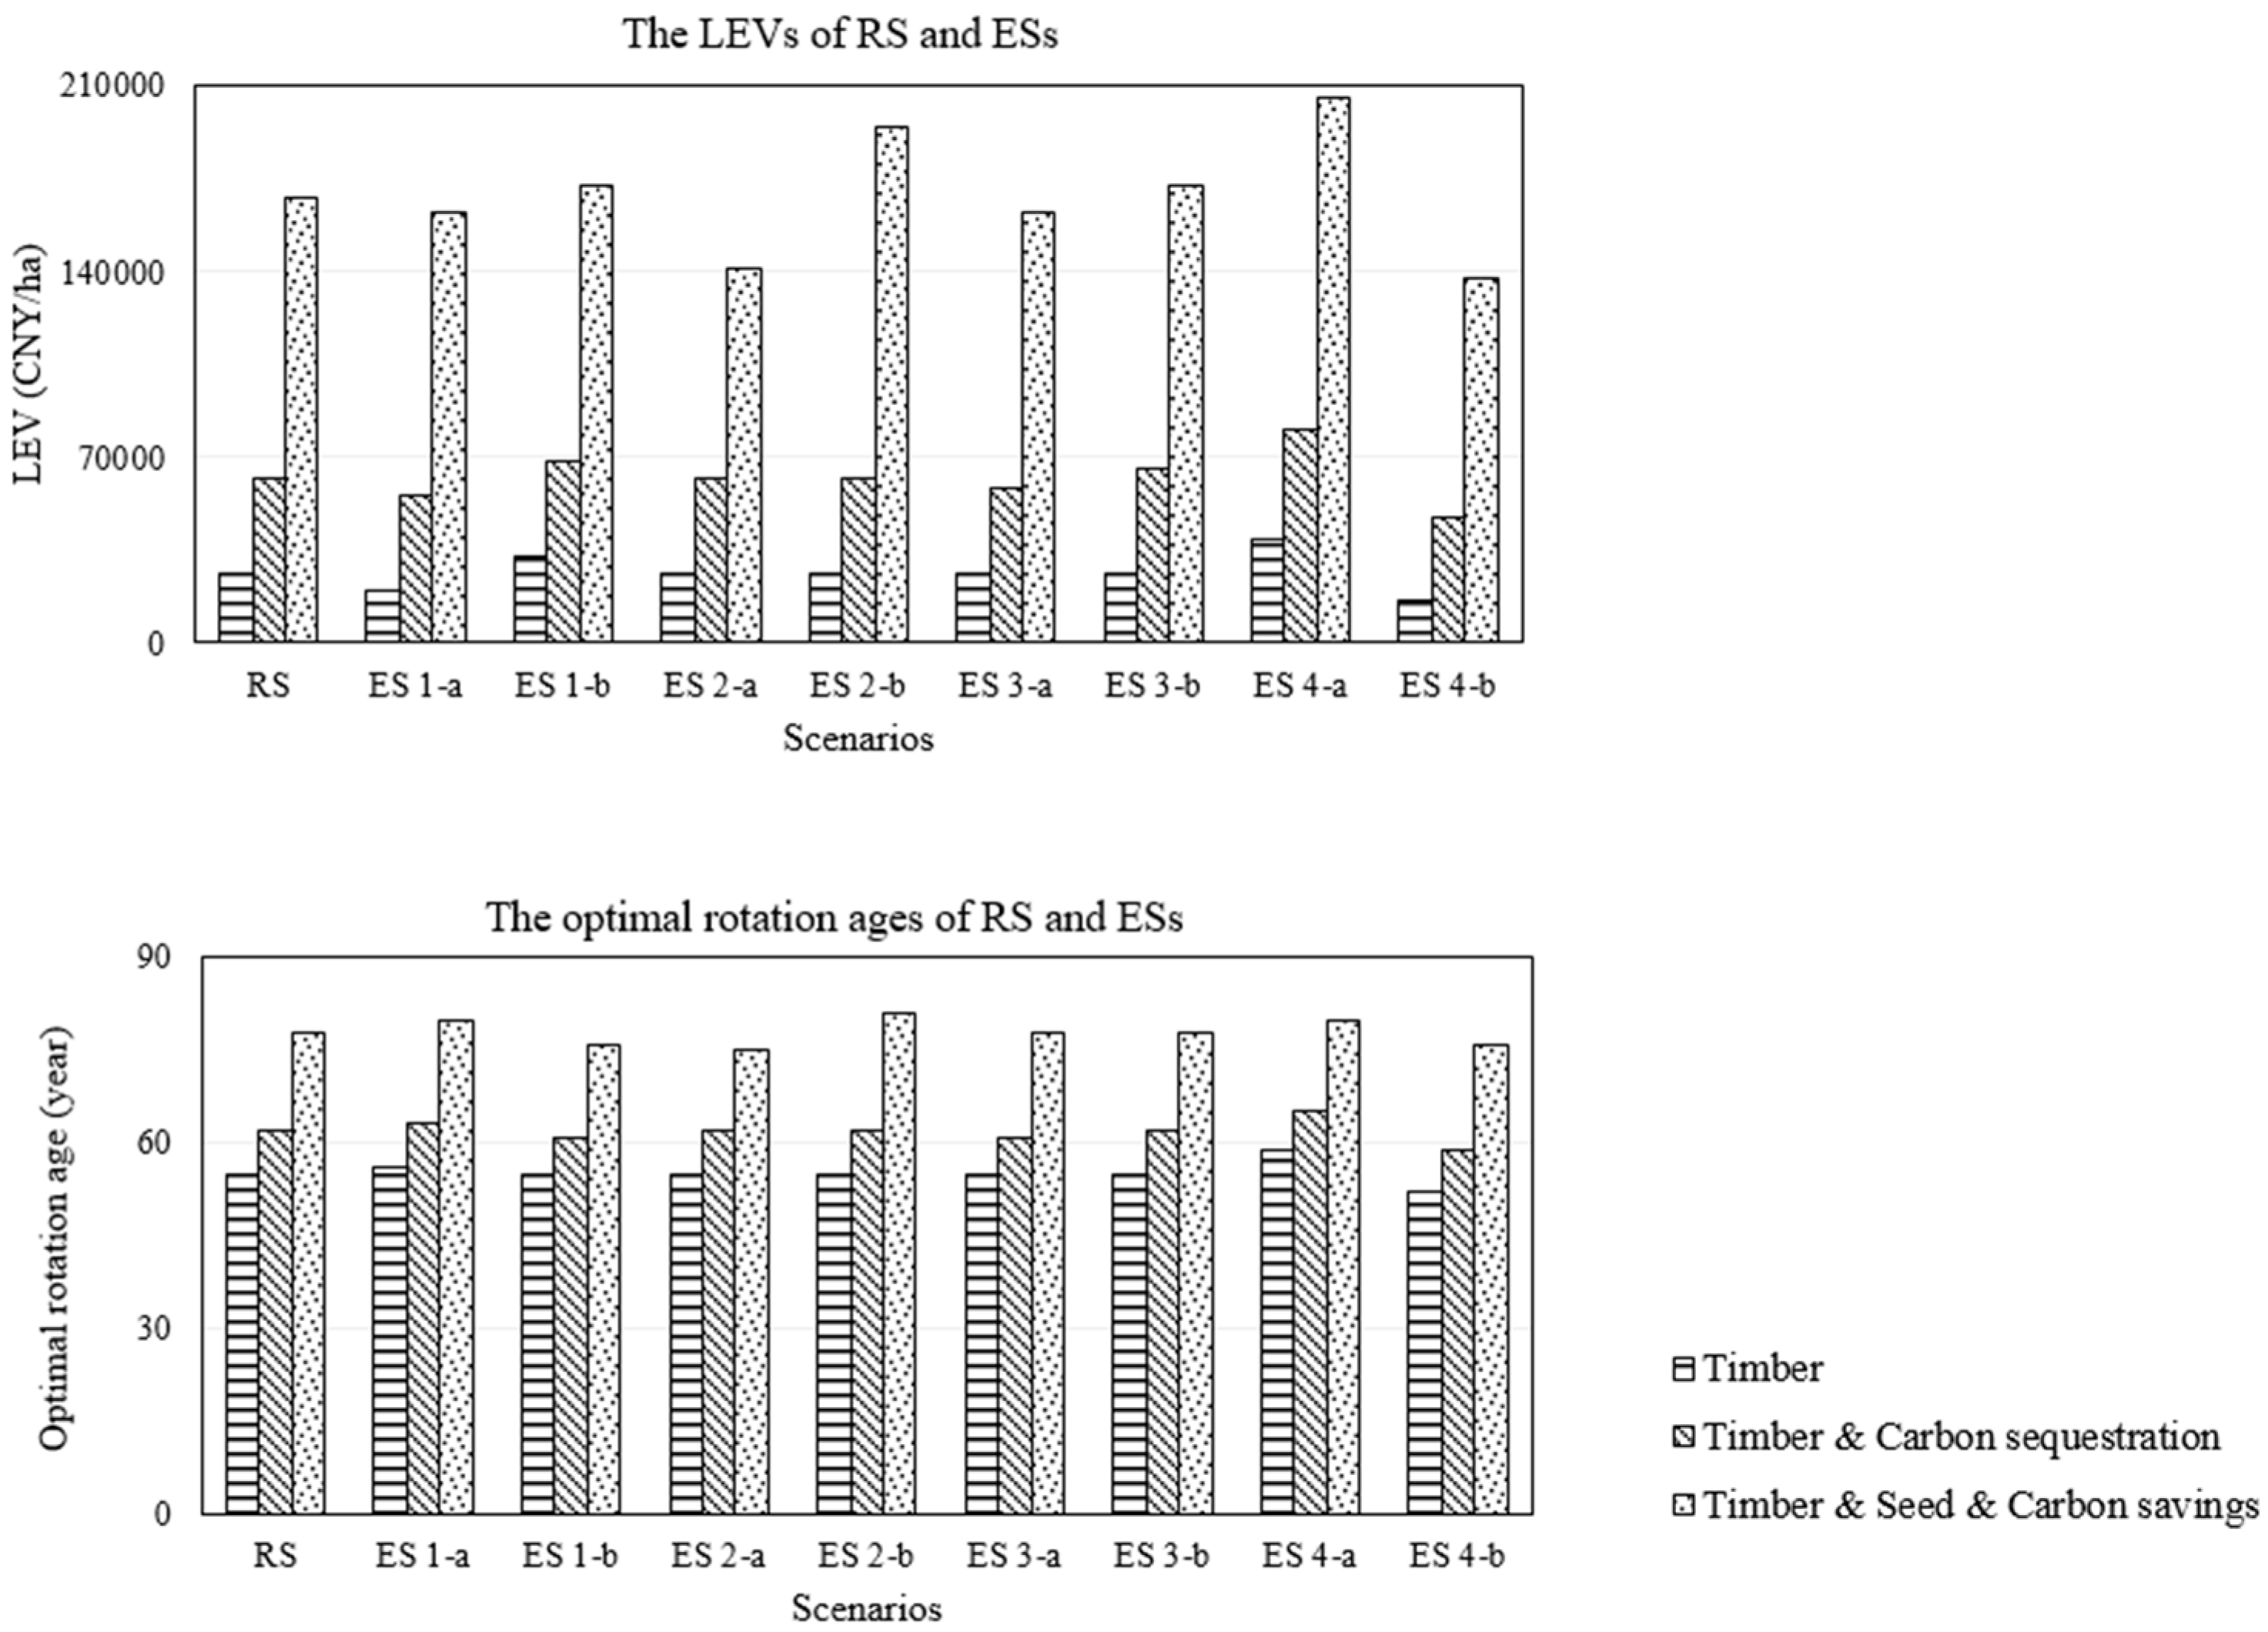
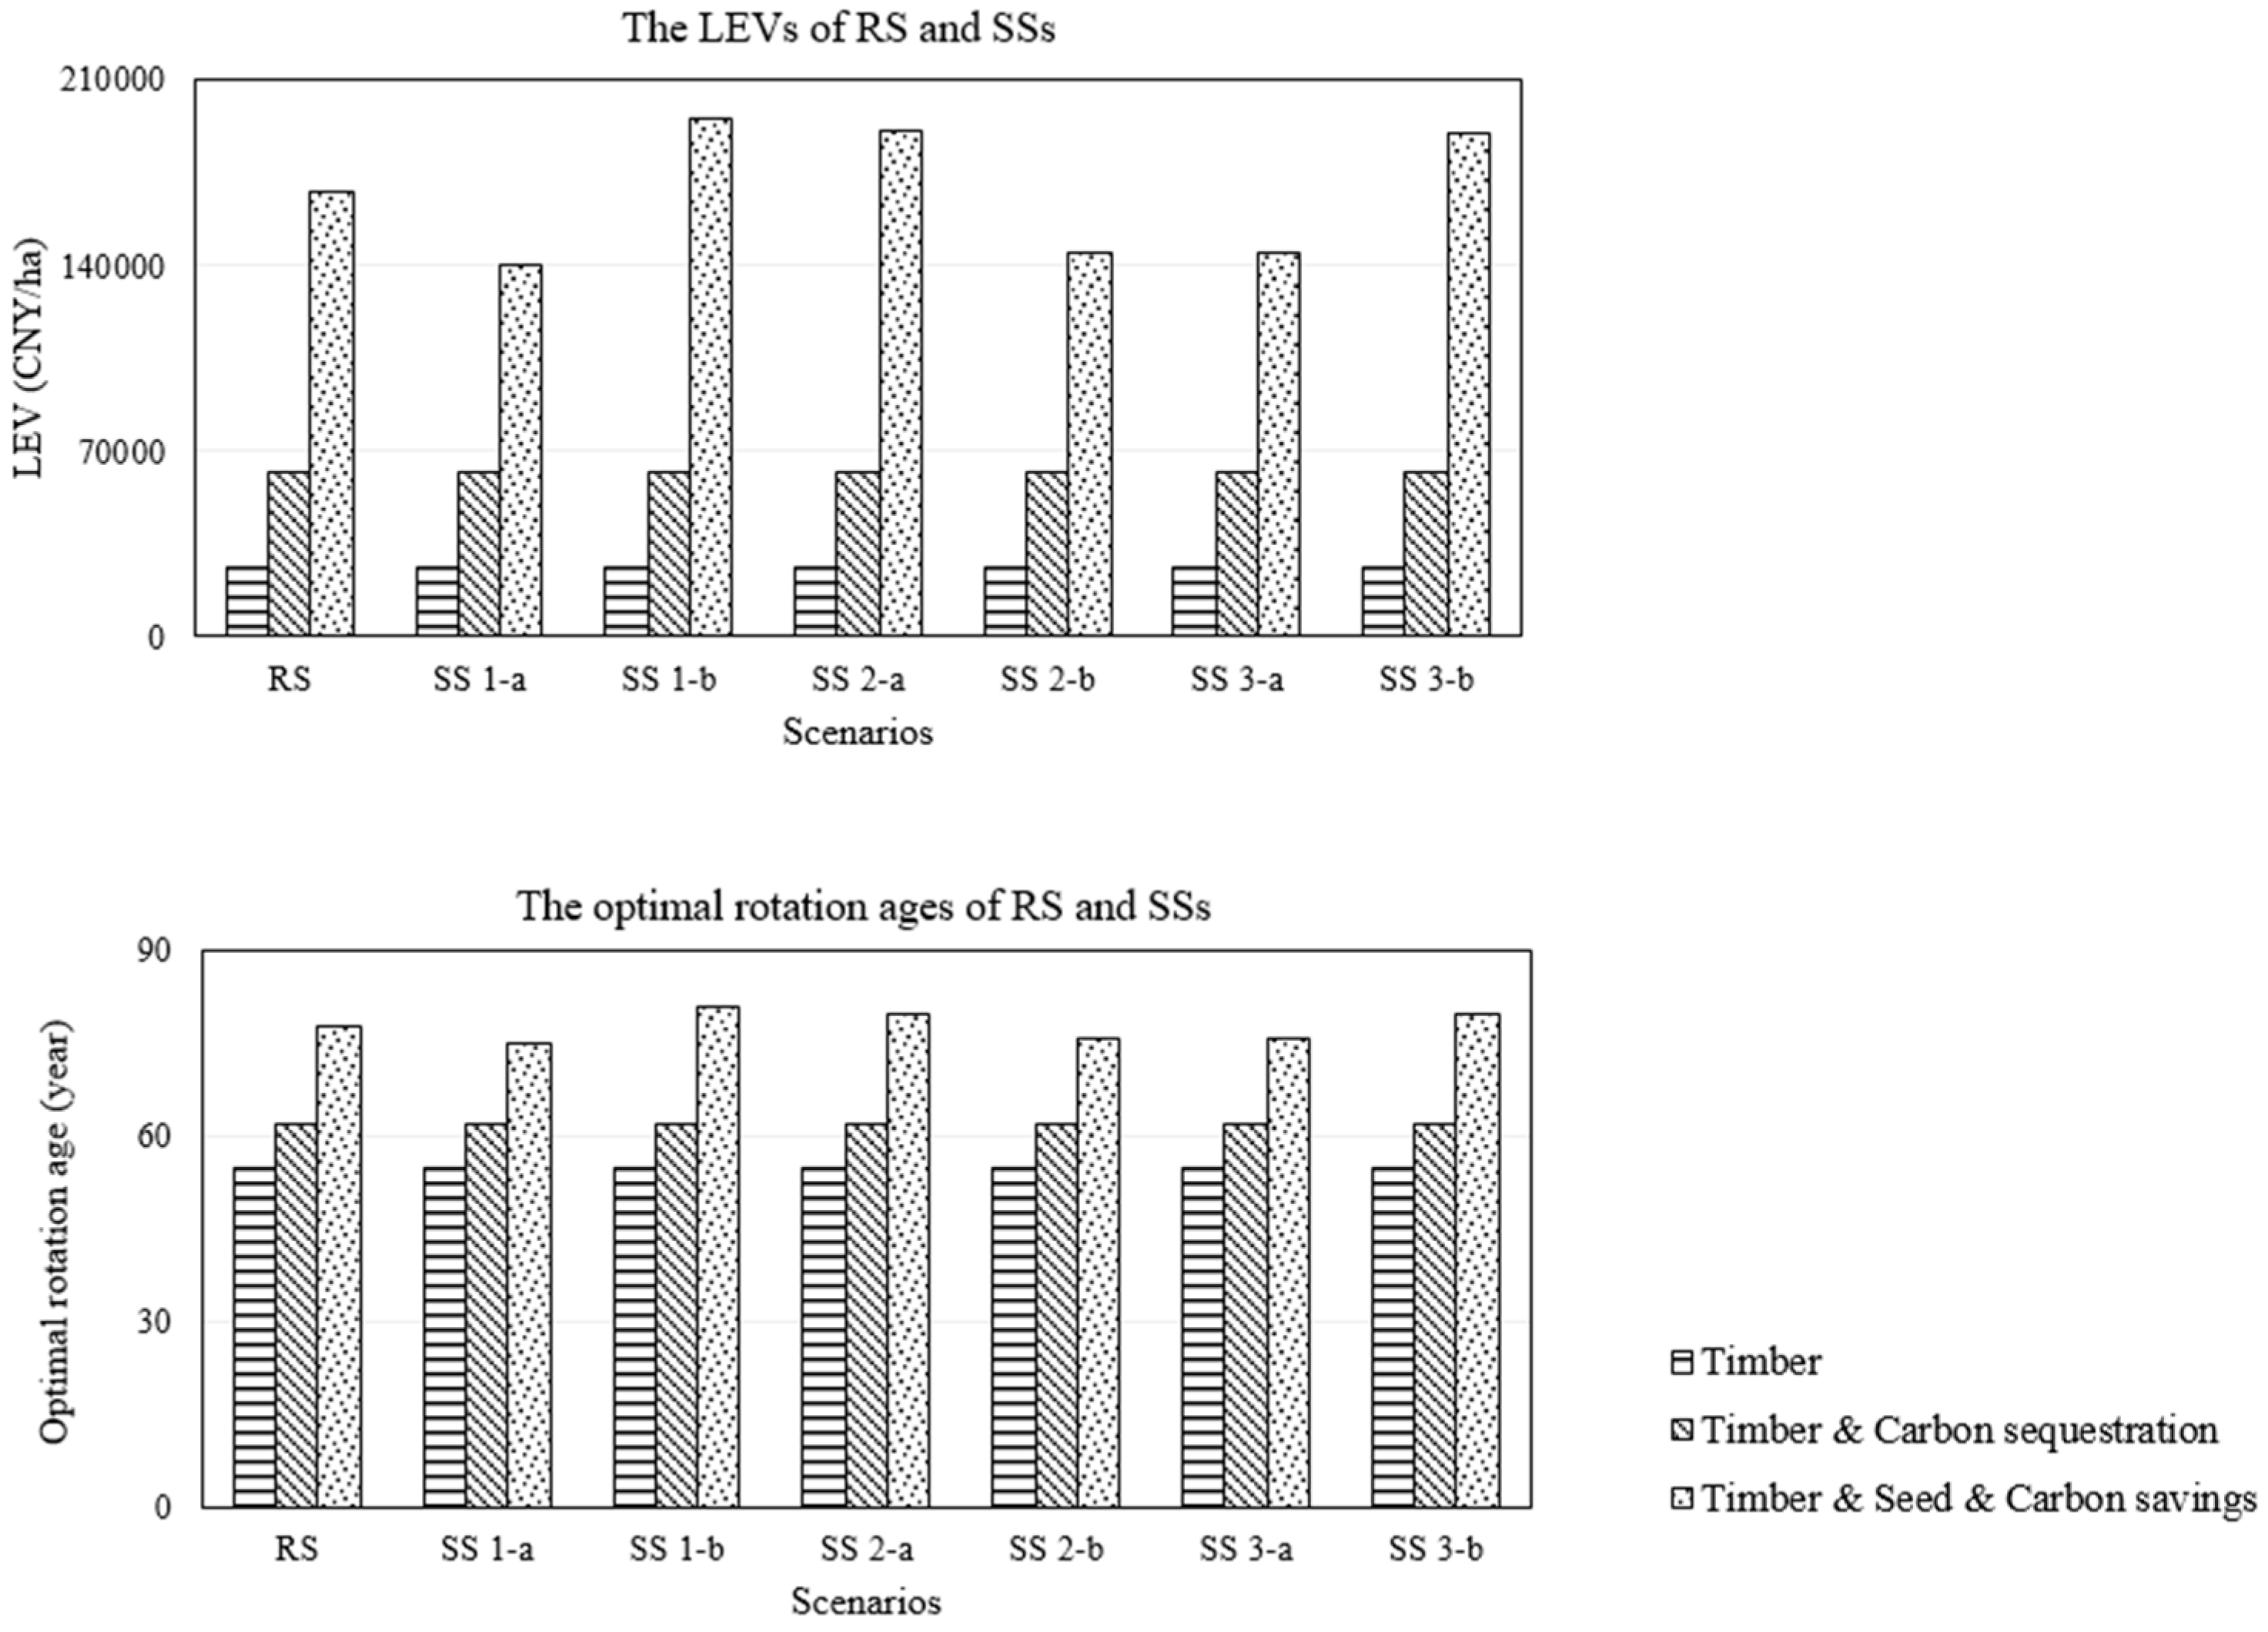
3.3. Results of Sensitivity Analysis

The optimal production of the Pistacia chinensis is impacted through increases in optimal rotation age. LEVs increase when including the ecosystem services of timber, seed, carbon sequestration, and CO2 emission reductions. These factors influence climate change mitigation per ha and over time (optimal rotation age). This part of the paper will use sensitivity analysis to evaluate the impacts of the assumptions on both economic and biological factors on LEVs and optimal rotation ages, in order to identify critical assumptions. Table 4 illustrates each scenario and its corresponding abbreviation and the changed value, the criteria for the parameters’ setting is explained in the Appendix E.

3.3.1. Economic Factors Scenario

This scenario evaluates how economic factors, including market prices and discounting rate, impact LEVs and optimal rotation ages. We determined that these economic factors fluctuate within a 10% range. Figure 3 illustrates the RS, specifically the sensitivity scenarios where economic factors are varied systematically to allow for assessment of how these assumptions affect results. In Figure 3, when other economic parameters stay constant, the increase of stumpage price will subsequently increase the LEVs, thus shortening the optimal rotation ages (ES 1-b). The increase of discounting rate will lead to lower LEVs (ES 4-b), likewise shortening the optimal rotation ages.
The results are consistent across relevant studies [23]. Increases in seed price and carbon price will also increase LEVs (ES 2-b and ES 3-b). Only increasing stumpage price results in shorter optimal rotation ages because the realization of this price requires harvesting. On the contrary, increases in seed price delay optimal rotation ages because early harvesting is not profitable. Increases in carbon price consequently increase the LEVs, but do not affect the optimal rotation ages beyond that of seed production. Compared with the sensitivity on LEVs and optimal rotation ages resulting from changes in market prices (ES 1, ES 2, ES 3), the sensitivity discounting rate changes (ES 4) is much higher. Furthermore, decreasing the discounting rate decidedly raises the LEVs (ES 4-a). When increasing the discounting rate, all the LEVs in the scenario (ES 4-b) drop sharply and are significantly smaller than the LEVs in the RS. Changes in market prices only affect a single value of forest ecosystem services, but changes in discounting rates have impacts on all of the forest ecosystem-service values. Additionally, the discounting rate affects the denominator in the LEV equation, representing the eternity factor of perpetual rotations, further influencing the LEV results.

3.3.2. Seed Production Factors Scenario

The seed production is affected by a series of complex factors, including rainfall, fertility of soil, altitude, and the rate of pest incidence. In this paper, we chose the Gompertz curve to estimate seed production. We changed the 10% value of each biological parameter in the seed production to test the impacts on LEVs and optimal rotation ages.
As shown in Figure 4 and in keeping with the ESs, when more than one forest ecosystem-service value is taken into consideration, optimal rotation ages increase. As to the Gompertz curve, when the potential maximum seed production parameter A (SS 1-b) and the growth rate parameter β (SS 3-b) increase, the seed production increases. As a result, the accumulated seed value rises, which will elevate the LEVs, while delaying the optimal rotation ages. Conversely, when the biological constant α increases (SS 2-b), the tree’s seed production reduces; and lessening the accumulated seed value of the forest, leading to lower LEVs.
Among all the scenarios RS, ESs and SSs, forest carbon sequestration invariably counts the largest share of the total carbon savings per year, irrespective of the changes in economic factors or seed production factors. The annual CO2 emission reductions from energy substitution consistently counts for approximately a quarter of the total carbon savings in all scenarios (Table A4 and Table A5). However, the annual biodiesel production and proportions of CO2 emission reductions from energy substitution on the total carbon savings are more sensitive to changes in the assumptions of seed production factors than to changes in economic factors. These minor variations imply the study’s robustness. In the ESs (Table A4), where the changes of economic factors extend the optimal rotation ages (ES 1-a, ES 2-b, and ES 4-a), higher amounts of total carbon savings and biodiesel production occur. As a result, this contributes to increased climate change mitigation compared to other scenarios. The additional years increase the accumulated seed production and forest carbon sequestration allowing for longer optimal rotation, compared to the scenarios with shorter optimal rotation ages (ES 1-b, ES 2-a, and ES 4-b). The decrease in the seed price (ES 2-a) will result in the lowest amount of carbon savings and biodiesel production, while the increase in the seed price (ES 2-b) will lead to the highest outputs. Policies that support increasing seed price and incentives boosting participation in the seed-trade market will increase carbon savings.
In the SSs (Table A5), where the changes of biological factors extend the optimal rotation ages (SS 1-b, SS 2-a, and SS 3-b) higher amounts of annual total carbon savings and biodiesel production will occur. The decrease in potential maximum seed production (SS 1-a) results in the lowest amount of carbon savings and biodiesel production. Conversely, the increase in potential maximum seed production (SS 1-b) will lead to the highest outputs in both areas. Only 10% increase in potential maximum seed production (SS 1-b) will lead to approximately 13% increase in biodiesel production and 4% increase of carbon savings per ha compared to the RS. Therefore, maintaining a high seed production is vital to optimal forest management.
A key factor increasing timber value is the increases of stumpage price (ES 1-b), which will raise the LEVs and shorten the optimal rotation ages. Factors (ES 2-b, SS 1-b, SS 3-b, SS 2-a) that can increase the accumulated seed value, will raise the LEVs, but delay optimal rotation ages. The LEVs and optimal rotation ages are sensitive to the discounting rate changes. Therefore, optimal rotation age extensions will lead to higher total carbon savings and biodiesel production. Seed production is a significant component in forest management. Encouraging the intensive management of seed production can contribute greatly to climate change mitigation.

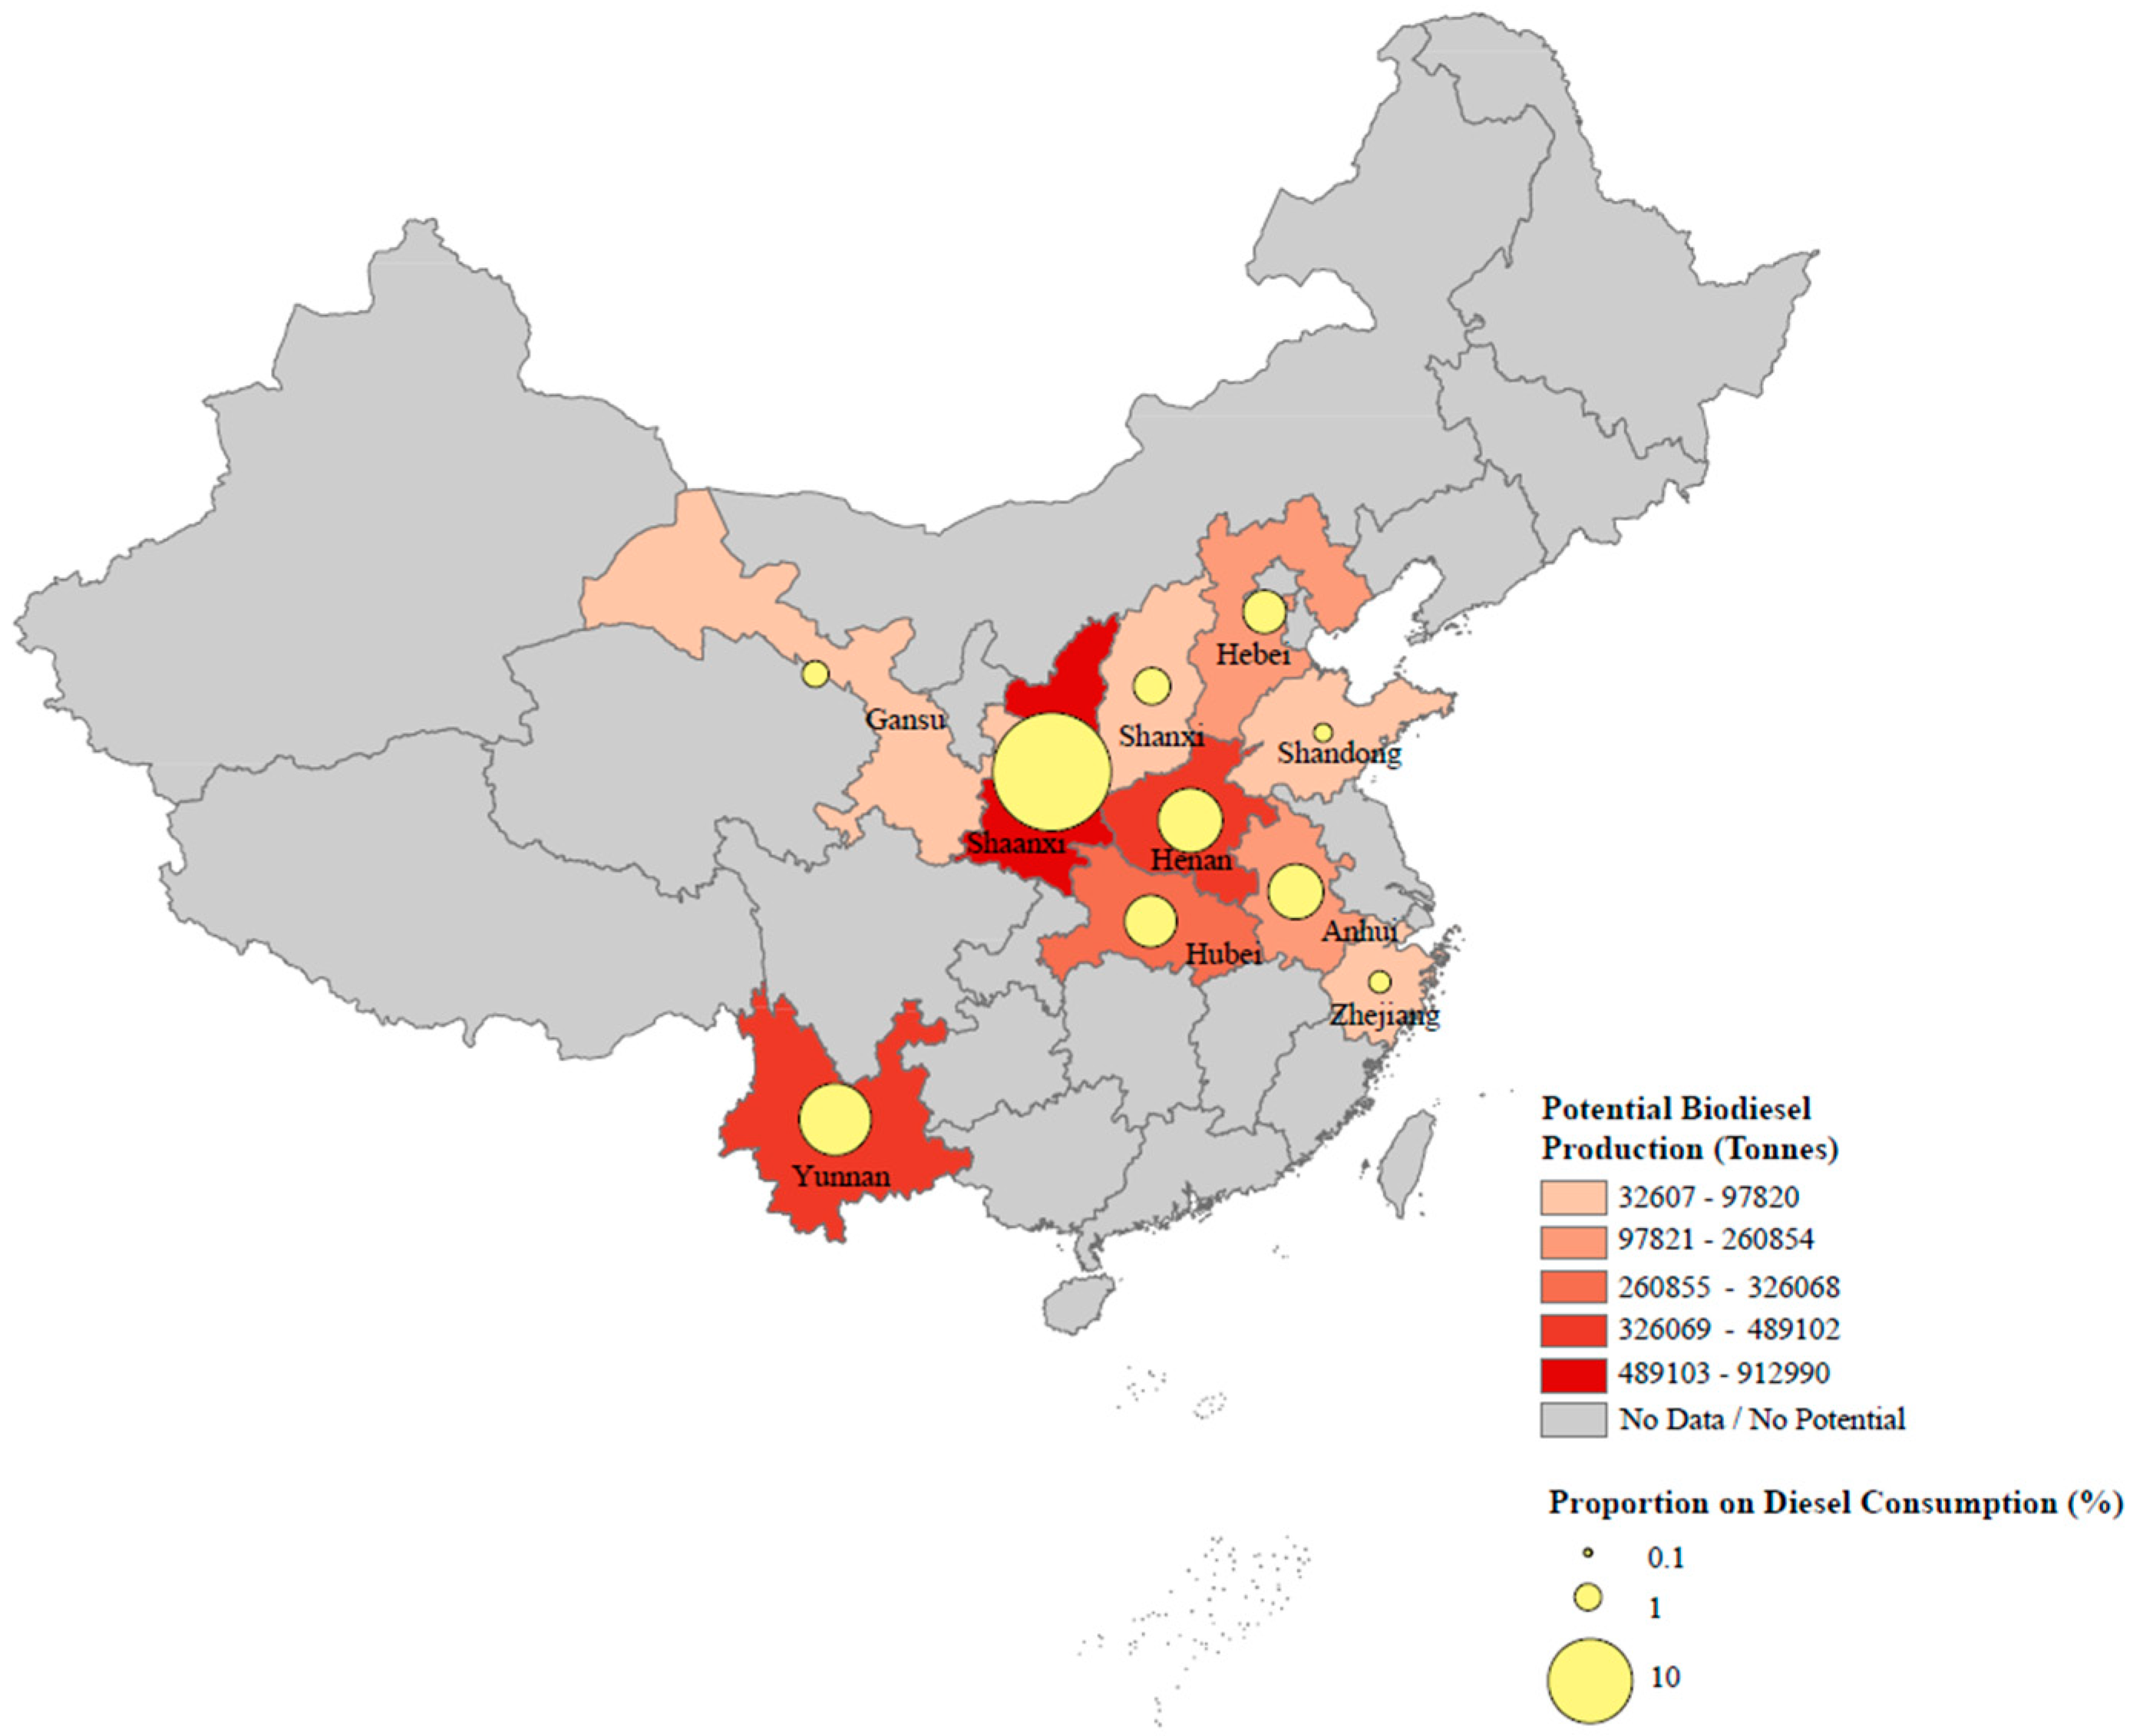
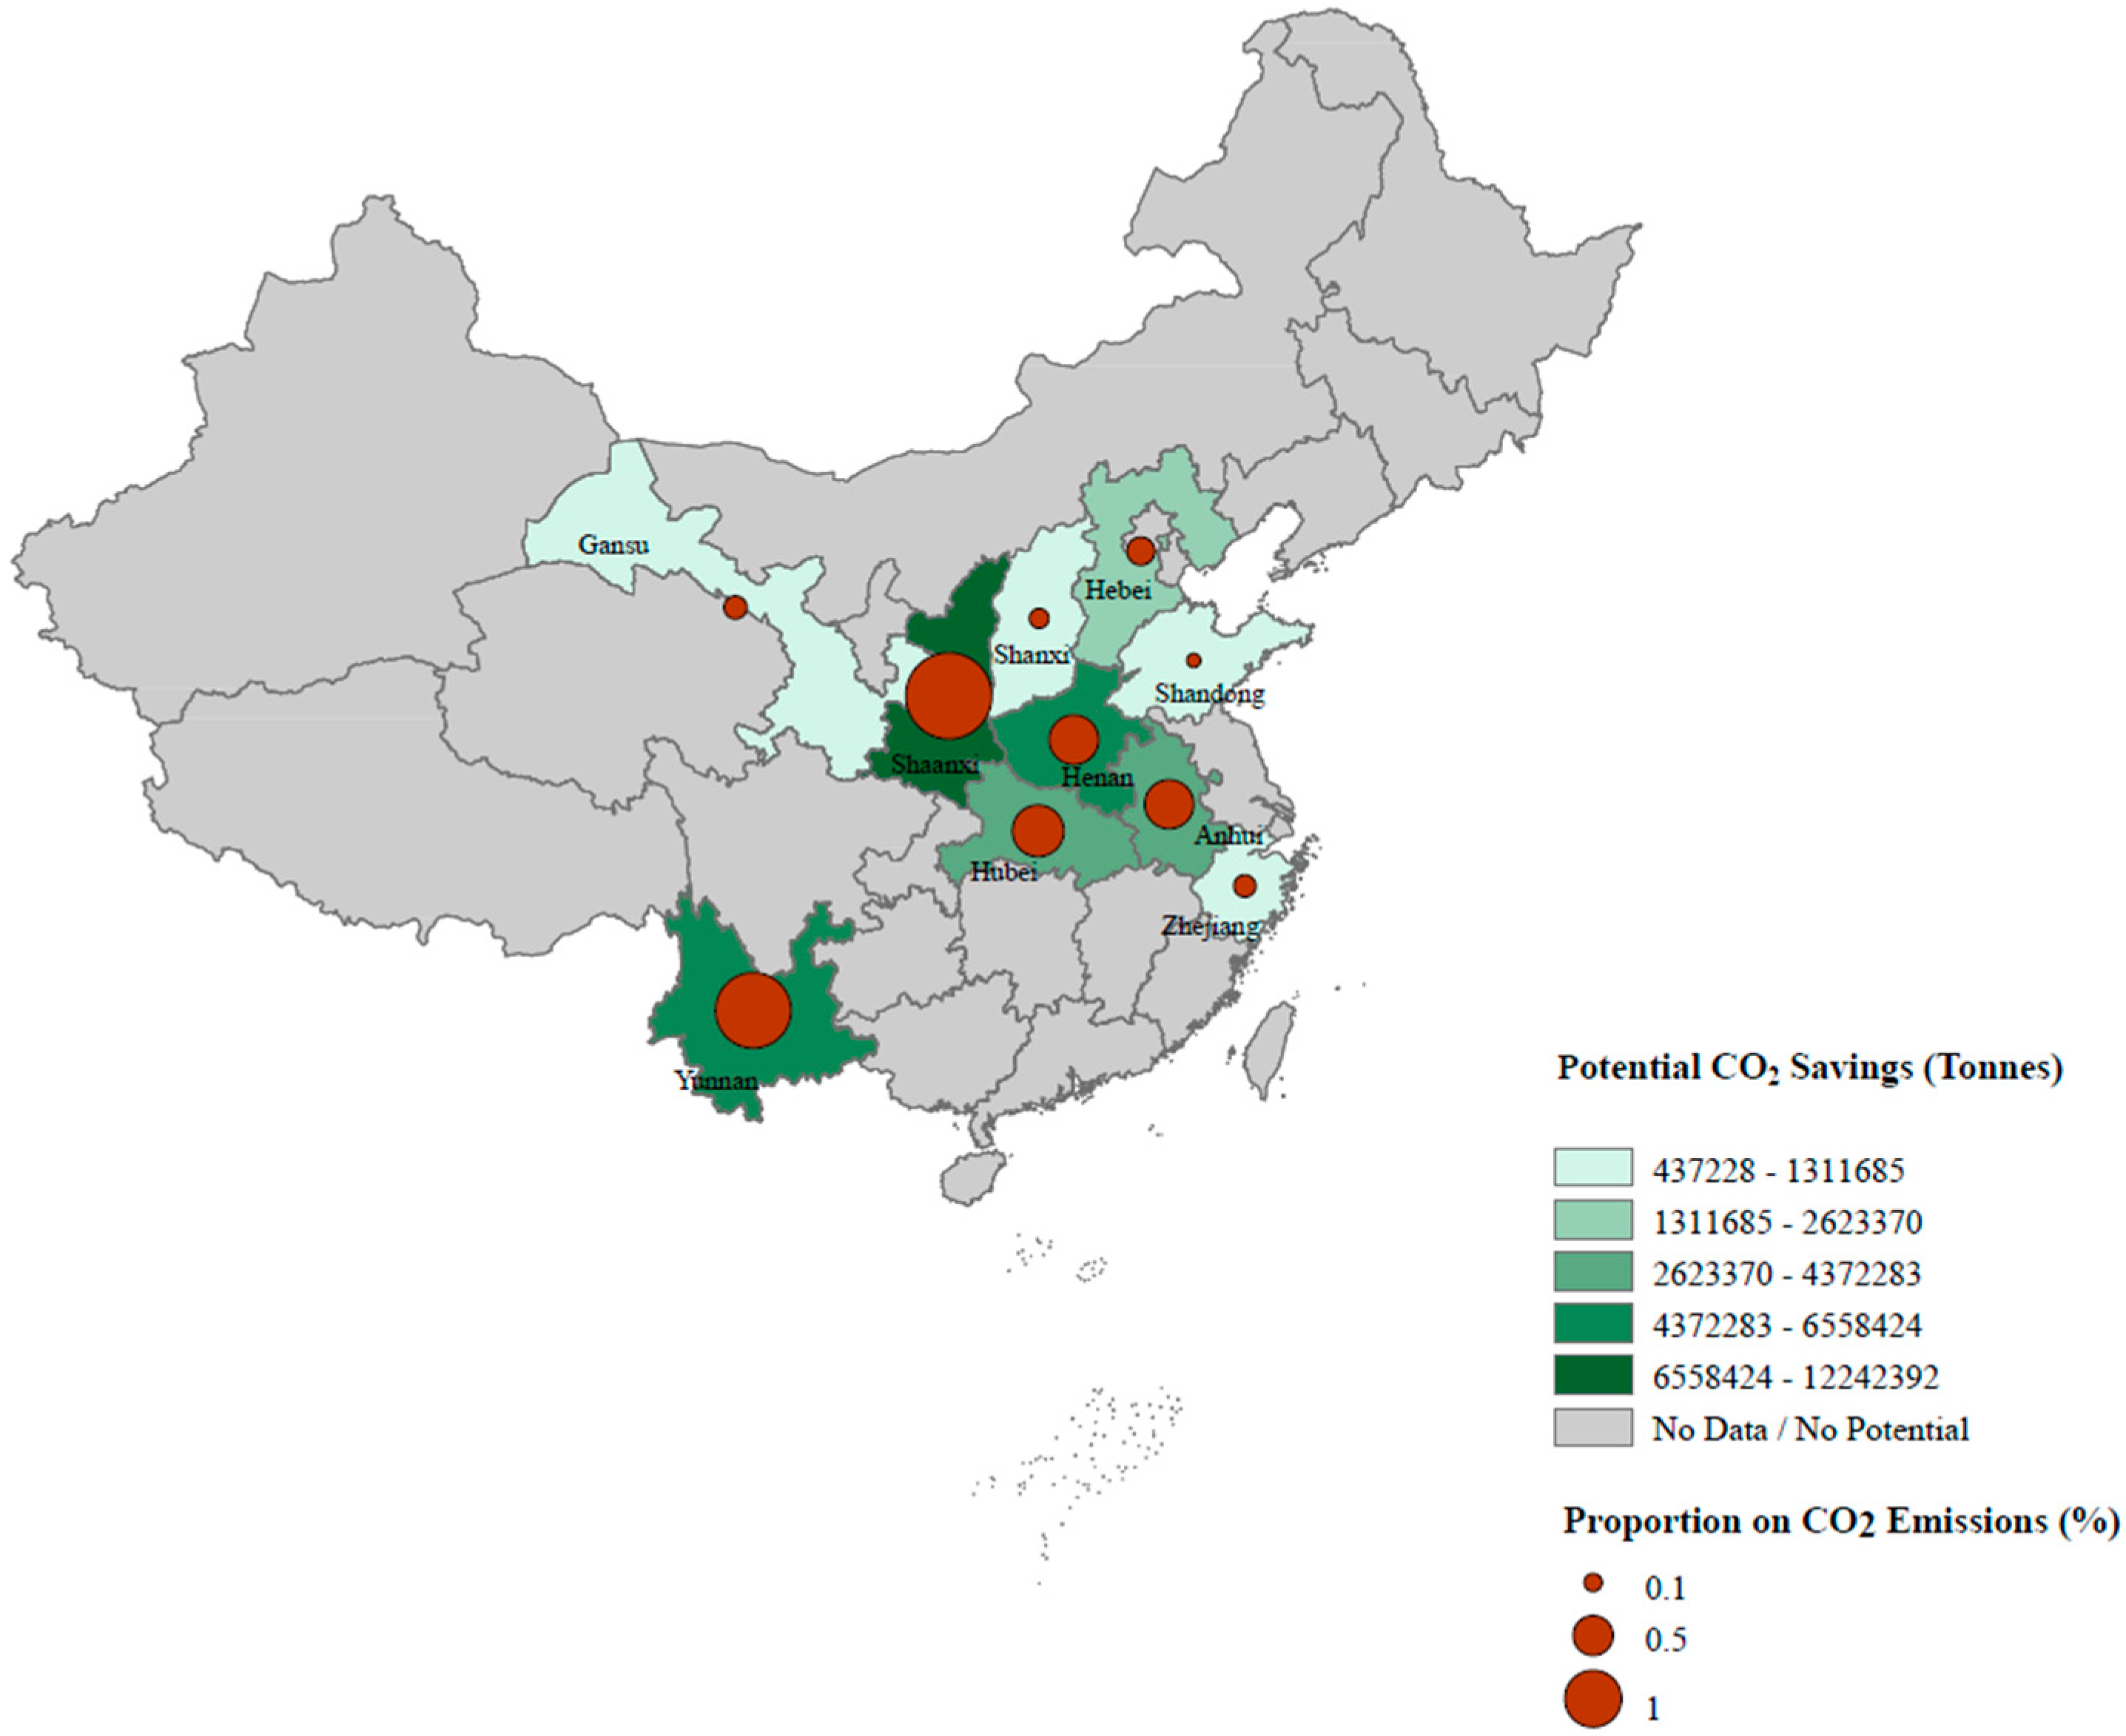
3.4. Upscale of Model Results to the National Level

Looking to the future, by the end of 2020, there will be 880,000 hectares of land used for growing Pistacia chinensis in China [11]. Provinces planning to plant Pistacia chinensis on large areas and delaying forest harvest to the optimal rotation age of year 78, can also benefit from the biodiesel production and carbon savings.
Figure 5 illustrates how annual potential biodiesel production in Chinese provinces impacts the proportions on the provincial diesel consumptions in 2015. Provinces such as Shaanxi, Yunnan and Henan, have large, planned-out areas designated for cultivating and managing Pistacia chinensis forests. The total annual potential biodiesel production in theses areas, counts for about 19.6%, 7.3% and 5.9% respectively of the diesel consumption for 2015. The production of this renewable energy source can greatly reduce the local diesel supply pressure.
Figure 6 illustrates the potential annual carbon savings from both energy substitution and forest carbon sequestration in some of China’s provinces. The proportions are from the potential carbon savings on provincial CO2 emissions for 2015. Coloured provinces indicate those with plans for planting Pistacia chinensis [11]. For example, the planned area in the Shaanxi province is 0.28 million hectares, meaning the potential annual biodiesel production is 0.9 million tonnes, with the total CO2 emssions for 2015 at 530 million tonnes. Potential carbon savings result from delaying the seed harvest to the optimal rotation age of year 78 for both biodiesel production and increased forest carbon sequestration. Savings count approximately 2.3% of the total provincial CO2 emission for 2015, indicating that foresting a large area with oleaginous trees contributes significantly to climate change mitigation.

4. Discussion

Pistacia chinensis provides enormous potential in sustainable management for private forest owners and has considerable overarching social benefits. This part of the paper will discuss results from four different aspects: climate change, energy security, forest synergy outputs and sustainable forest management.

4.1. Implication on Climate Change

Forests have a large potential as carbon sinks. Results show that Pistacia chinensis had an optimal rotation age of a timber value at year 55. Using the Hartman formula and eliminating the seed value, the joint value of timber and carbon sequestration was at year 62 with the LEV of 61,991 CNY/ha. When the seed value was introduced, the new optimal rotation age of the value of timber, seed and carbon savings increased 42% to year 78, with the LEV to 167,611 CNY/ha compared with the LEV of the timber only value. Seed value could significantly influence the LEV and delay the optimal rotation ages. Delaying increases forest carbon sequestration because older, larger volume trees can sequester much more carbon than younger, smaller trees [43]. Climate change mitigation occurs through the sustainable forest development idea of ‘storing carbon in soil and wood’.
Some pilot cities have already developed carbon markets in China, paving the way for the nation-wide carbon market initiative unveiled in 2017. The results of this study focus on the various rotation ages of multiple joint private LEVs and social LEVs. One purpose is to assist key decision-makers in designing efficient payment schemes and viable markets for oleaginous seeds in order to reach the maximum social value. A private forest owners’ objective, is to maximize the income from timber production when there are not matured markets for seed trading. When the demand of biodiesel increases, the energy markets provide forest owners with an additional income sourced from selling seeds for biodiesel production. Harvesting seeds may extend the forest’s optimal rotation age if the income generated covers the loss of waiving a timber harvest. In addition to the seed income, the continued tree growth will support carbon sequestration. Gains go beyond private individual owners, extending to a wider social value, creating a welfare-economic optimal solution. Some countries compensate the value of carbon sequestration through policies such as Reducing Emissions from Deforestation and forest Degradation (REDD) and Clean Development Mechanism (CDM) [44]. Seed harvesting provides value to private individuals and society as a whole. Harnessing the forest ecosystem service for carbon sequestration increases carbon stock. Payment schemes that incorporate climate change mitigation make forest owners stakeholders in the carbon market. Inclusion fosters forest sector incomes and motivates stakeholders to sustainably manage their forests. China must develop effective market mechanisms that attract forest owners to participate in the national carbon market launched in 2017.

4.2. Implication on Energy Security

Traditional energy sources such as coal, oil, and gas are finite, requiring more efficient alternative renewable energy sources [45]. Oleaginous seeds provide a viable, renewable energy source with a broad range of social benefits. In order to access those benefits a robust market infrastructure for trading seeds and providing enough feedstock for biodiesel production is required. When the forest owners delay the harvesting activity until year 78, there will be in total 636 tonnes of seeds production per ha. Assume that 2.5 tonne seeds can be transferred into 1 tonne biodiesel [46], producing approximately 3.3 tonnes biodiesel per ha annually. Given the current planting areas of Pistacia chinensis [11], the annual biodiesel production will be 285,710 tonnes. There is potential to save the total energy about 12286 TJ, which counts for 1.7‰ of the national diesel consumption for the present (the total diesel consumption of China was 171.65 million tonnes in 2014; data source: China Statistical Yearbook 2016) [47].
China is rich in forest biomass resources, containing large land areas, a suitable climate, and optimal soil conditions. Afforestation and reforestation initiatives are successfully increasing China’s forested areas in China in recent years [48]. According to the National Forestry Biomass Energy Development Plan [11], the total planting areas of Pistacia chinensis will reach up to 880,000 hectares by the end of 2020, meaning the annual biodiesel production can meet 1.7% of the national diesel consumption [47]. As a corollary, the provinces that have plans for planting other kinds of oleaginous trees such as Jatropha curcas, will benefit from additional biodiesel production sources.

4.3. Implication on Forest Synergy Outputs of Forest Management

There is always a trade-off in forest management when forest owners wish to gain timber value, over other environmental ecosystem services. The production of wood-based bioenergy is an example. The trade-off between bioenergy supply and carbon sequestration resulting from ecosystem services has gained researchers’ attention [49]. This is because it takes time to grow a generation of forest with the intentions of sequestering carbon emitted immediately from bioenergy combustion. Additionally, carbon is emitted to the atmosphere from harvesting, transporting and processing biomass procedures [49]. While we do consider these issues, we find that the seeds from oleaginous trees can bring synergy outputs of forest ecosystem services, to counteract these trade-offs. The results indicate the optimal rotation age of sole timber value is at year 55, reflecting the realities of Pistacia chinensis forest management (the average maturation time for Pistacia chinensis is between year 51 to year 70) [50]. The trade-off between bioenergy supply and carbon sequestration turns into synergy; both bioenergy value and carbon saving value exist simultaneously because harvesting seeds for bioenergy production does not require cutting down trees as is done through timber harvesting, a win-win situation for developing forest bioenergy. The results from the sensitivity analysis showed that seed production and seed price are vital to successful forest management. Therefore, raising the seed price could delay forest owners’ harvesting time, thus allowing for more carbon savings. Applying intensive management activities, such as reducing pest incidence rates, will increase the potential maximum seed production amount, resulting in increased biodiesel. Looking to the future, synergic multiple forest ecosystem services and their management opens future research directions. The study into the joint value of timber, seed and carbon savings can be applied to a wide variety oleaginous trees in China, such as Xanthoceras sorbif olia, Jatropha curcas, Sapium sebiferum, Ldesia polycarpa, Pistacia chinensis, Rhus succedanea, AIeurites fordii and Cornus wilsoniana [51] as well as some starch trees which are also potential resources for bioenergy production.

4.4. Implication on Sustainable Forest Management

Sustainable development is key in forest management. The fundamental principle was that the forest should be preserved as a renewable resource [25]. Excessive harvesting leads to future forest productivity loss. Different from the optimal economic rotation, the concept ‘ecological rotation’ refers to the period required for a forest managed with a given technology to return to the pre-harvesting state. However, the calculation of ecological rotation is very complicated and highly sensitive to multiple variables, depending on site-specific conditions, including forest management methods, harvesting activities [25], soil conditions and soil replenishment methods [52] as well as other nearby ecosystems. These variables require more information than what is available. The general assumption is that the ecological rotation requires a longer rotational age to allow replenishment of harvested nutrients through rainfall, weathering, nitrogen fixation, etc., than optimal economic rotation [53]. For example, the decline in the production of Chinese fir indicated soil fertility and understory competition were vital for sustainable yield. Extending rotation ages and avoiding planting on infertile lands [54] maintained these two components. Our study implies that extending the rotation age of oleaginous trees provides increased seed yield and carbon savings. When considering the concept of ecological rotation, the optimal age could be at least equal to or even longer than the rotation ages in this study.

5. Conclusions and Future Directions

Throughout this paper, we have put forth that the accumulated seed and carbon saving values are included in the LEV formula. By applying the empirical data of Pistacia chinensis, the consideration of both values would increase the LEVs and extend the optimal rotation ages. The increases in timber price and discounting rate would shorten the optimal rotation age. The increase of seed price sharply raises the LEVs, and results in a delay in the optimal rotation ages. The changes in biological parameters would affect the accumulated seed value. The increases of both potential maximum seed production and growth rate along with the decrease of the biological constant would simultaneously raise LEVs while delaying the optimal rotation ages. Changing forest management methods could delay the optimal rotation age. Oleaginous trees have potential to produce the synergic outputs of ecosystem services, such as continuous bioenergy supply and carbon sequestration.
In conclusion, oleaginous trees are promising plants for China in efforts to achieve climate change mitigation and to reach goals set at the 2015 Paris Climate Conference. Increasing seed price and the potential maximum seed production can enhance the positive effect of this contribution on many levels. This study will be a basis for the key decision makers to design efficient payment schemes for bioenergy production and carbon sequestration from oleaginous trees, providing incentive for this initiative. The changes in biological parameters of Pistacia chinensis will facilitate the studies of similar trees in other areas with considerations of differing growth rates attributed to varying climate and environmental conditions.
One limitation of this paper is that we only considered the emission reductions of CO2 from the usage of biodiesel because it is a major part of GHG emissions. Compared to diesel fuel, the usage of biodiesel can also reduce emissions of particulate, carbon monoxide (CO) and total hydrocarbon (THC) [55]. This may underestimate the contribution of oleaginous trees to climate change mitigation. Furthermore, this paper primarily focused on effects of energy provision and CO2 emission reduction without explicitly considering that planting oleaginous trees could affect biodiversity and other social aspects, which might influence the overall conclusion. For instance, the oil palm expansion in Southeast Asia could cause the loss of biodiversity [56,57]. Biodiversity losses could be, however, prevented if the oil palm expansion is managed to avoid deforestation [58]. Additionally, the results of LEV calculations could directly inform payment schemes, but they will be unable to predict how heterogeneous forest owners will react to concerns with the efficiency of these schemes. There are many avenues for future research due to the results contained in this study.

Author Contributions

The paper was a collaborative effort among the authors. J.Z. was the main responsible person for the design of the research in close collaboration with R.-G.C. and B.H. J.Z. performed the model simulations, analyzed the results, and wrote the paper. Both R.-G.C. and B.H. provided critical comments, and supervised the research work.

Acknowledgments

This research is funded by China Scholarship Council (CSC). Special thanks to geographer Ioannis Angelidis for providing GIS maps as well as the Anyang Forest Ministry in China for the interviews and providing data.

Conflicts of Interest

The authors declare no conflict of interest.

Appendix A. Coefficient Choices

Regarding the density θ of oleaginous trees, we used the data from the Global Wood Density Database [59]. There are two densities given for Pistacia chinensis, one is 0.704 g/cm3, the other is 0.665 g/cm3, so we calculated and used a mean value: 0.685 g/cm3, which equals 0.685 tonne/m3. As to the BEF of Pistacia chinensis, we chose to use the value from IPCC [60], which is 1.4 for the temperate broadleaf trees. μ is the carbon content in the dry mass, here μ is 0.5 [14,20]. When it comes to R, we chose the ratio of the average temperate broadleaf forest from IPCC [60] to estimate the one of Pistacia chinesis. The mean value is 0.31. The atomic weight of carbon is 12 and the molecular mass of CO2 is 44, so ω is 44/12.
The amount of biodiesel production depends on the weight of harvested seeds, and assuming the weight is S(t), it changes with the age of the trees. About 2.5 kg seeds can be transferred into 1 kilogram biodiesel [46], and assume this parameter is η. The net calorific value n of diesel is 43 TJ/Gg (1 TJ = 103 GJ = 106 MJ; 1 Gg = 103 tonnes = 106 kg) [21]. The default value of the emission factor of diesel is 74,100 kg/TJ [21].
Table A1. The coefficients and their values in this paper.
NameDefinitionValue
θthe density of the tree0.685 tonne/m3
BEFbiomass expansion factor1.4
μcarbon content in the dry mass0.5
Rroot to shoot ratio0.31
ωthe molecular mass of CO2 divided by the atomic weight of carbon44/12
ηamount of seeds for per kilogram biodiesel production 2.5 kg
nnet calorific value of diesel43
λ1coefficient to transfer kilogram to gigagram106
mdiesel emission factor (kilogram of CO2 per TJ on a diesel net calorific value)74,100
λ2coefficient to transfer kilogram to tonne103

Appendix B. Data Description and Details

In total, we received data from 249 Pistacia chinensis from Anyang Forest Ministry, China. Three trees are at a very young age (3–5 years) and it is hard to estimate their volume. Among the remaining 246 trees, we used SPSS 24 to make box plot figures to monitor outliers, and the results are as follows.
Figure A1. The box plot of data of 246 Pistacia chinensis.
Energies 11 01123 g0a1
The figure above shows the distribution conditions about the age, volume, diameter and seed production of Pistacia chinensis regarding all available data from 246 trees. Data from the 244th, 245th and 246th tree are outliers as shown here. The volume data distribution of Pistacia chinensis, numbers shown in the figure are very crowded so we decided to closely examine the distribution of this particular data separately.
Figure A2. The separate box plot of volume data of 246 Pistacia chinensis.
Energies 11 01123 g0a2
The figure above shows other outliers of the data from 246 trees, which are from the 22th, 134th, 135th, 136th, 137th, 222th and 224th tree. Outliers can affect the precision of the regression results. Therefore, we decided to delete the data from a total of 10 out of 246 trees, leaving data of 236 trees available.
Pistacia chinensis grows in the central and south-west areas in China, can thrive in poor quality soils (like hills and mountains, rocky lands), and in low and high altitude (from 100 m to 3600 m). It has a long lifetime, reaching up to 300 hundred years [12]. Compared with other fast-growing trees, such as willow, Pistacia chinensis is slow-growing. It can provide seeds from year 12 [12]. The tree has two genders and without human intervention, the ratio of the female and male tree is 1:1 in the western mountainous area of Anyang. Therefore, when we calculated the seed production per hectare, we divided the total number of trees by 2. In general, Pistacia chinensis starts to produce seeds between the age of 10 and 15. In this paper, we assumed that the seed production begins from year 12. Anyang is located in central part of China (N 35°12′–N 36°22′, E 113°37′–E 114°58′). The wild Pistacia chinensis grows in the western part of the city in the Taihang Mountains; and in 2008, the government of Anyang started to plant the bioenergy forest, including Pistacia chinensis.

Appendix C. Definition of Variables and Parameters

Table A2. Definition of variables and parameters.
Name Definition
Amaximum potential growth amount
CPacarbon proportion of time a
CPbcarbon proportion of time b
CP(t)carbon proportion at time t
Cs(t)seed harvesting cost changing with time t
C0establishment cost
E(t) amenity value at time t
E1(t)the amount of carbon sequestration from forest
E2(t)the amount of CO2 emission reduction from energy substitution
ethe base of natural logarithm
f(T)timber volume at harvesting time T
f(t)timber volume at time t
Gsubscript of the Gompertz curve
G1subscript of estimated timber volume growth based on the Gompertz curve
G2subscript of estimated seed production based on the Gompertz curve
Ithe set of 10 provinces that have the plan of cultivating Pistacia chinensis
ian element of set I
Jthe saved energy from diesel substitution
Lsubscript of the logistic curve
L1subscript of estimated timber volume growth based on the logistic curve
L2subscript of estimated seed production based on the logistic curve
NBpotential national biodiesel production from Pistacia chinensis
NCpotential national carbon savings from Pistacia chinensis
Pccarbon price
Psseed price
Ptstumpage price
PDproportion that the potentials of the provincial biodiesel production from Pistacia chinensis on the provincial diesel consumptions
PEproportion that the potentials of the provincial carbon savings from Pistacia chinensis on the provincial CO2 emissions
Qipotential planting areas of Pistacia chinensis of each province
rdiscounting rate
S(t)seed production at time t
Tharvesting time
T1the time point tree starting to produce seeds
ttime
Ythe number of years between time b and time a
y(t)collectively referring to the timber volume or seed production of the tree at the time t
αbiological constant
βthe growth rate
ΔCPannual change of carbon stocks

Appendix D. Description of Costs

Table A3. The table of costs of the LEV calculations.
ActivitiesCost per Chinese acre CNY/Chinese acre Cost per Hectare CNY/haData Source/References
Establishment cost
Land preparation fee 10,250Guo et al. [61]
Seedlings55825interview
Management and tending fee3004500interview
Labour wages (planting)108016,200interview
Harvesting cost (seed)
Labour wages3304950interview
Notes: (1) Assume three people are needed to plant or harvest trees per Chinese acre. (2) The land preparation fee comes from the average calculation of three land preparation fees [61], which present the fees of mono-cultural tea plantation/mono-cultural rubber plantation/intercropping rubber-tea plantation. Although the tree species in that paper are different from those in this paper, general information of the land preparation fee per ha in China are consistent with one another. (3) This paper assumes that the seed harvesting cost value in the table above is for the time when seed production enters a period of high yield, which is normally 10 years later since Pistacia chinensis started to yield seeds. Here in this paper refers to the year 22. The seed harvesting cost changes with the production amount. We assumed that the seed harvesting cost counts for a proportion of the whole seed production value. (4) 1 hectare = 15 Chinese acres. (5) This paper assumes that there are 825 trees in one hectare. We were informed during the interview, that approximately 55 trees can be planted in the mountain areas per Chinese acre. Since the ratio of the female and male tree is 1:1, there will be 412 trees that can yield seeds per ha.

Appendix E. The Criteria for Choosing the Magnitude for the Sensitivity Analysis

The average timber price in 2012 was 757 CNY/m3, almost the same with the one in 2011 [62]. The average timber price in 2013 was 742 CNY/m3, which was 2% less than the one of 2012 [63]. In 2014, the average timber price increased 10.78%, reaching 822 CNY/m3 [40]. If the harvesting cost is not considered, the stumpage price should be applied when calculating the LEV, which is half of the timber price [41]. Based on the market information of annual timber prices, we decided to use 10% as the change in the stumpage price variable for the sensitivity analysis. Likewise, we assumed the seed price fluctuates similar to the stumpage price because both are forest products. Therefore, 10% was also applied to the seed price variable. The carbon price in China of 2017 was between 20 and 70 CNY/tonne, so we chose 45 as the carbon price in the RS [42]. As to the discounting rate test, we followed the literature of Amsalu et al. [15]. In order to be consistent, we chose to use 10% as the magnitude of the changes in both carbon price and discounting rate as well as the factors of SS.

Appendix F. Annual Biodiesel Production and Total Carbon Savings of RS, ESs and SSs

Table A4. Annual biodiesel production and total carbon savings of RS and ESs
ScenariosRSES 1-aES 1-bES 2-aES 2-bES 3-aES 3-bES 4-aES 4-b
Carbon savings from diesel substitution (tonne/ha)10.3910.5710.2110.1110.6510.3910.3910.5710.21
Carbon savings from forest carbon sequestration (tonne/ha)33.3333.6632.9632.7533.8033.3333.3333.6632.96
Total carbon savings (tonne/ha)43.7244.2243.1642.8644.4543.7243.7244.2243.16
Biodiesel production (tonne/ha)3.263.323.203.173.343.263.263.323.20
Table A5. Annual biodiesel production and total carbon savings of RS and SSs.
ScenariosRSSS 1-aSS 1-bSS 2-aSS 2-bSS 3-aSS 3-b
Carbon savings from diesel substitution (tonne/ha)10.399.1011.7210.979.829.5711.13
Carbon savings from forest carbon sequestration (tonne/ha)33.3332.7533.8033.6632.9632.9633.66
Total carbon savings (tonne/ha)43.7241.8545.5244.6342.7742.5344.79
Biodiesel production (tonne/ha)3.262.863.683.443.083.003.49

References

  1. United Nations. Paris Agreement. Available online: http://unfccc.int/files/essential_background/convention/application/pdf/english_paris_agreement.pdf (accessed on 18 December 2017).
  2. Liu, Z. Steps to China’s carbon peak. Nature 2015, 522, 279. [Google Scholar] [CrossRef] [PubMed]
  3. Tollefson, J. China’s carbon emissions could peak sooner than forecast: Five-year plan advances policy to reduce reliance on coal and expand renewable energy. Nature 2016, 531, 425–427. [Google Scholar] [CrossRef] [PubMed]
  4. Repo, A.; Tuomi, M.; Liski, J. Indirect carbon dioxide emissions from producing bioenergy from forest harvest residues. GCB Bioenergy 2011, 3, 107–115. [Google Scholar] [CrossRef]
  5. Routa, J.; Asikainen, A.; Björheden, R.; Laitila, J.; Röser, D. Forest energy procurement: State of the art in Finland and Sweden. Energy Environ. 2013, 2, 602–613. [Google Scholar] [CrossRef]
  6. Salehian, P.; Karimi, K.; Zilouei, H.; Jeihanipour, A. Improvement of biogas production from pine wood by alkali pretreatment. Fuel 2013, 106, 484–489. [Google Scholar] [CrossRef]
  7. Chen, L.; Cong, R.-G.; Shu, B.; Mi, Z.-F. A sustainable biogas model in China: The case study of Beijing Deqingyuan biogas project. Renew. Sustain. Energy Rev. 2017, 78, 773–779. [Google Scholar] [CrossRef]
  8. Itoh, H.; Wada, M.; Honda, Y.; Kuwahara, M.; Watanabe, T. Bioorganosolve pretreatments for simultaneous saccharification and fermentation of beech wood by ethanolysis and white rot fungi. J. Biotechnol. 2003, 103, 273–280. [Google Scholar] [CrossRef]
  9. Sharma, Y.; Singh, B. Development of biodiesel from karanja, a tree found in rural India. Fuel 2008, 87, 1740–1742. [Google Scholar] [CrossRef]
  10. Center for Climate and Energy Solutions. China’s Contribution to the Paris Climate Agreement. Available online: https://www.c2es.org/site/assets/uploads/2015/07/chinas-contribution-paris-climate-agreement.pdf (accessed on 18 December 2017).
  11. State Forestry Administration of the People’s Republic of China. National Forestry Biomass Energy Development Plan; State Forestry Administration of the People’s Republic of China: Beijing, China, 2013. (In Chinese)
  12. Tang, M.; Zhang, P.; Zhang, L.; Li, M.; Wu, L. A potential bioenergy tree: Pistacia chinensis Bunge. Energy Proc. 2012, 16, 737–746. [Google Scholar] [CrossRef]
  13. Bjørnstad, E.; Skonhoft, A. Wood fuel or carbon sink? Aspects of forestry in the climate question. Environ. Resour. Econ. 2002, 23, 447–465. [Google Scholar] [CrossRef]
  14. Olschewski, R.; Benítez, P.C. Optimizing joint production of timber and carbon sequestration of afforestation projects. J. For. Econ. 2010, 16, 1–10. [Google Scholar] [CrossRef]
  15. Amsalu, D.W.; Jacobsen, J.B.; Lundhede, T.H. Economic assessment of use values of near-natural forestry compared with rotational forestry in Denmark. Eur. J. For. Res. 2014, 133, 611–622. [Google Scholar] [CrossRef]
  16. Creedy, J.; Wurzbacher, A.D. The economic value of a forested catchment with timber, water and carbon sequestration benefits. Ecol. Econ. 2001, 38, 71–83. [Google Scholar] [CrossRef]
  17. Faustmann, M. Berechnung des Wertes welchen Walboden sowie noch nicht haubare Holzbestande fur die Waldwirtschaft besitzen. Allg. Forst-Jagdztg. 1849. Republication: Calculation of the value which forest land and immature stands possess for forestry. J. For. Econ. 1995, 1, 7–44. [Google Scholar]
  18. Hartman, R. The harvesting decision when a standing forest has value. Econ. Inq. 1976, 14, 52–58. [Google Scholar] [CrossRef]
  19. Fekedulegn, D.; Mac Siúrtáin, M.P.; Colbert, J.J. Parameter Estimation of Nonlinear Models in Forestry. Silva Fenn. 1999, 33, 327–336. [Google Scholar] [CrossRef]
  20. Levy, P.; Hale, S.; Nicoll, B. Biomass expansion factors and root: Shoot ratios for coniferous tree species in Great Britain. Forestry 2004, 77, 421–430. [Google Scholar] [CrossRef]
  21. Eggleston, H.; Buendia, L.; Miwa, K.; Ngara, T.; Tanabe, K. IPCC Guidelines for National Greenhouse Gas Inventories; The Institute for Global Enviromental Strategies for the IPCC and the Intergovernmental Panel on Climate Change: Hayama, Japan, 2006. [Google Scholar]
  22. Stainback, G.A.; Alavalapati, J.R. Economic analysis of slash pine forest carbon sequestration in the southern US. J. For. Econ. 2002, 8, 105–117. [Google Scholar]
  23. Van Kooten, G.C.; Binkley, C.S.; Delcourt, G. Effect of carbon taxes and subsidies on optimal forest rotation age and supply of carbon services. Am. J. Agric. Econ. 1995, 77, 365–374. [Google Scholar] [CrossRef]
  24. Mutke, S.; Gordo, J.; Gil, L. Variability of Mediterranean Stone pine cone production: Yield loss as response to climate change. Agric. For. Meteorol. 2005, 132, 263–272. [Google Scholar] [CrossRef]
  25. Kimmins, J. Sustained yield, timber mining, and the concept of eclogical rotation; a British Columbian view. For. Chron. 1974, 50, 27–31. [Google Scholar] [CrossRef]
  26. Li, X.; Schmid, B.; Wang, F.; Paine, C.T. Net assimilation rate determines the growth rates of 14 species of subtropical forest trees. PLoS ONE 2016, 11, e0150644. [Google Scholar] [CrossRef] [PubMed]
  27. Rupðys, P.; Petrauskas, E.; Maþeika, J.; Deltuvas, R. The Gompertz type stochastic growth law and a tree diameter distribution. Balt. For. 2007, 13, 197–206. [Google Scholar]
  28. Franses, P.H. A method to select between Gompertz and logistic trend curves. Technol. Forecast. Soc. 1994, 46, 45–49. [Google Scholar] [CrossRef] [Green Version]
  29. Goshu, A.T.; Koya, P.R. Derivation of Inflection Points of Nonlinear Regression Curves—Implications to Statistics. Am. J. Theor. Appl. Stat. 2013, 2, 268–272. [Google Scholar] [CrossRef]
  30. Tjørve, E. Shapes and functions of species—Area curves: A review of possible models. J. Biogeogr. 2003, 30, 827–835. [Google Scholar] [CrossRef]
  31. Sanquetta, C.R.; Corte, A.P.; da Silva, F. Biomass expansion factor and root-to-shoot ratio for Pinus in Brazil. Carbon Balance Manag. 2011, 6, 6. [Google Scholar] [CrossRef] [PubMed]
  32. International Energy Agency. IEA Energy Training and Capacity-Building. Available online: https://www.iea.org/media/training/alumni/CheatSheet.pdf (accessed on 18 December 2017).
  33. Cong, R.-G.; Caro, D.; Thomsen, M. Is it beneficial to use biogas in the Danish transport sector?—An environmental-economic analysis. J. Clean. Prod. 2017, 165, 1025–1035. [Google Scholar] [CrossRef]
  34. Shao, H.; Chu, L. Resource evaluation of typical energy plants and possible functional zone planning in China. Biomass Bioenergy 2008, 32, 283–288. [Google Scholar] [CrossRef]
  35. Zhuang, D.; Jiang, D.; Liu, L.; Huang, Y. Assessment of bioenergy potential on marginal land in China. Renew. Sustain. Energy Rev. 2011, 15, 1050–1056. [Google Scholar] [CrossRef]
  36. Deng, X.; Yu, Y.; Liu, Y. Temporal and Spatial Variations in Provincial CO2 Emissions in China from 2005 to 2015 and Assessment of a Reduction Plan. Energies 2015, 8, 4549–4571. [Google Scholar] [CrossRef]
  37. National Bureau of Statistics of the People’s Republic of China. China Energy Statistical Yearbook 2016; China Statistics Press: Beijing, China, 2017. (In Chinese)
  38. National Bureau of Statistics of the People’s Republic of China. CPI (1978=100). Available online: http://data.stats.gov.cn/easyquery.htm?cn=C01&zb=A0902&sj=2015 (accessed on 18 December 2017). (In Chinese)
  39. Zuo, Y. CPI Rose by 2.0% in 2016. Available online: http://news.xinhuanet.com/local/2017-01/10/c_129439692.htm (accessed on 18 December 2017). (In Chinese).
  40. State Forestry Administration of the People’s Republic of China. National Forestry Statistical Annual Report 2014. Available online: http://www.forestry.gov.cn/main/304/content-769221.html (accessed on 18 December 2017). (In Chinese)
  41. Wang, C. Comments on “Plantation development: Economic analysis of forest management in Fujian Province, China”. For. Policy Econ. 2014, 43, 51–52. [Google Scholar] [CrossRef]
  42. The State Council Information Office of the People’s Republic of China. Xie Zhenhua: A Positive Commitment to Actively Participate in the Governance of Global Climate Change Processes. Available online: http://www.scio.gov.cn/ztk/dtzt/2014/32252/32260/Document/1389330/1389330.htm (accessed on 18 December 2017). (In Chinese)
  43. Schulze, E.D.; Körner, C.; Law, B.E.; Haberl, H.; Luyssaert, S. Large-scale bioenergy from additional harvest of forest biomass is neither sustainable nor greenhouse gas neutral. GCB Bioenergy 2012, 4, 611–616. [Google Scholar] [CrossRef]
  44. Gren, M.; Aklilu, A.Z. Policy design for forest carbon sequestration: A review of the literature. For. Policy Econ. 2016, 70, 128–136. [Google Scholar] [CrossRef]
  45. Cong, R.-G. An optimization model for renewable energy generation and its application in China: A perspective of maximum utilization. Renew. Sustain. Energy Rev. 2013, 17, 94–103. [Google Scholar] [CrossRef]
  46. Li, G. Genetic resources and development of Pistacia chinensis bunge. Agric. Sci. 2009, 15, 68–70. (In Chinese) [Google Scholar]
  47. National Bureau of Statistics of the People’s Republic of China. China Statistical Yearbook 2016; China Statistics Press: Beijing, China, 2017.
  48. Foster, K. The Role of China’s Forests in Mitigating Climate Change. Available online: http://blog.worldagroforestry.org/index.php/2013/07/23/the-role-of-chinas-forests-in-mitigating-climate-change/ (accessed on 18 December 2017).
  49. Vass, M.M.; Elofsson, K. Is forest carbon sequestration at the expense of bioenergy and forest products cost-efficient in EU climate policy to 2050? J. For. Econ. 2016, 24, 82–105. [Google Scholar] [CrossRef]
  50. Jin, L.; Yuan, Q. Growth regularity and cost-benefit analysis of Pistacia chinensis in the south of Taihang Mountain. Cent. South For. Inventory Plan. 1995, 14, 17–19. (In Chinese) [Google Scholar]
  51. Zhang, L.; Zhang, C. Potentials of Forest Bioenergy in China Based on Forest Ecological Security; Zhang, Z., Zhang, R., Zhang, J., Eds.; LISS 2012; Springer: Berlin/Heidelberg, Germany, 2013; pp. 1211–1215. [Google Scholar]
  52. Kimmins, J. Evaluation of the consequences for future tree productivity of the loss of nutrients in whole-tree harvesting. For. Ecol. Manag. 1976, 1, 169–183. [Google Scholar] [CrossRef]
  53. Freedman, B. The Ecological Effects of Pollution, Disturbance and Other Stresses. Environmental Ecology; Academic Press Inc.: San Diego, CA, USA, 1995. [Google Scholar]
  54. Bi, J.; Blanco, J.; Seely, B.; Kimmins, J.; Ding, Y.; Welham, C. Yield decline in Chinese-fir plantations: A simulation investigation with implications for model complexity. Can. J. For. Res. 2007, 37, 1615–1630. [Google Scholar] [CrossRef]
  55. Lapuerta, M.; Armas, O.; Rodriguez-Fernandez, J. Effect of biodiesel fuels on diesel engine emissions. Prog. Energy Combust. 2008, 34, 198–223. [Google Scholar] [CrossRef]
  56. Koh, L.P.; Miettinen, J.; Liew, S.C.; Ghazoul, J. Remotely sensed evidence of tropical peatland conversion to oil palm. Proc. Nat. Acad. Sci. USA 2011, 108, 5127–5132. [Google Scholar] [CrossRef] [PubMed]
  57. Wilcove, D.S.; Koh, L.P. Addressing the threats to biodiversity from oil-palm agriculture. Biodivers. Conserv. 2010, 19, 999–1007. [Google Scholar] [CrossRef]
  58. Fitzherbert, E.B.; Struebig, M.J.; Morel, A.; Danielsen, F.; Brühl, C.A.; Donald, P.F.; Phalan, B. How will oil palm expansion affect biodiversity? Trends Ecol. Evol. 2008, 23, 538–545. [Google Scholar] [CrossRef] [PubMed]
  59. Zanne, A.E.; Lopez-Gonzalez, G.; Coomes, D.A.; Ilic, J.; Jansen, S.; Lewis, S.L.; Miller, R.B.; Swenson, N.G.; Wiemann, M.C.; Chave, J. Data from: Towards a Worldwide Wood Economics Spectrum; Dryad Data Repository: Durham, NC, USA, 2009. [Google Scholar]
  60. Penman, J.; Gytarsky, M.; Hiraishi, T.; Krug, T.; Kruger, D.; Pipatti, R.; Buendia, L.; Miwa, K.; Ngara, T.; Tanabe, K. Good Practice Guidance for Land Use, Land-Use Change and Forestry; The Institute for Global Enviromental Strategies for the IPCC and the Intergovernmental Panel on Climate Change: Hayama, Japan, 2003. [Google Scholar]
  61. Guo, Z.; Zhang, Y.; Deegen, P.; Uibrig, H. Economic analyses of rubber and tea plantations and rubber-tea intercropping in Hainan, China. Agrofor. Syst. 2006, 66, 117–127. [Google Scholar] [CrossRef]
  62. State Forestry Administration of the People’s Republic of China. National Primary Forestry Industrical Product Sellings Price 2012. Available online: http://zcl.forestry.gov.cn/portal/cylhh/s/3849/content-649018.html (accessed on 18 December 2017). (In Chinese)
  63. State Forestry Administration of the People’s Republic of China. National Forestry Statistical Annual Report 2013. Available online: http://www.forestry.gov.cn/uploadfile/main/2014-5/file/2014-5-15-bf6af40b14b34db0bda284a82af0d776.pdf (accessed on 18 December 2017). (In Chinese)
Figure 1. The structure of models and the inputs and outputs of each stage in and their relationships.
Energies 11 01123 g001
Figure 2. The LEVs and optimal rotation ages of the joint values of timber/timber and carbon sequestration/timber and seed/timber, seed and total carbon savings of Pistacia chinensis. (The numbers in the boxes indicate the optimal rotation age of each LEV.)
Energies 11 01123 g002
Figure 3. Comparisons of LEVs and optimal rotation ages of different (joint) values—RS and ESs.
Energies 11 01123 g003
Figure 4. Comparisons of LEVs and optimal rotation ages of different (joint) values—RS and SSs.
Energies 11 01123 g004
Figure 5. Annual potential biodiesel production in Chinese provinces cultivating Pistacia chinensis forests correlates with a decrease in total diesel consumption in those regions.
Energies 11 01123 g005
Figure 6. Chinese provinces planting Pistacia chinensis and the potential for annual carbon savings on total control CO2 emissions.
Energies 11 01123 g006
Table 1. The S-curve formulas of logistic and Gompertz.
NameFormula
logistic y L ( t ) = A L 1 + α L e β L t
Gompertz y G ( t ) = A G e α G e β G t
* Subscript L represents logistic curve; subscript G represents Gompertz curve.
Table 2. The regression results of the parameters of timber volume growth of Pistacia Chinensis.
FunctionsParameters Resultsp-ValueR-Square
f L 1 ( t ) = A L 1 1 + α L 1 e β L 1 t A L 1 2.120.0620.8944
α L 1 29.340.013
β L 1 0.0510.000
f G 1 ( t ) = A G 1 e α G 1 e β G 1 t A G 1 3.150.1720.8961
α G 1 4.310.000
β G 1 0.0200.010
* Subscript L1 represents estimated timber volume growth based on the logistic curve; subscript G1 represents estimated timber volume growth based on the Gompertz curve.
Table 3. The regression results about the parameters of seed production of Pistacia chinensis.
FunctionsParameters Resultsp-ValueR-Square
S L 2 ( t ) = A L 2 1 + α L 2 e β L 2 t A L 2 32.580.0000.9622
α L 2 7.570.000
β L 2 0.0710.000
S G 2 ( t ) = A G 2 e α G 2 e β G 2 t A G 2 36.140.0000.9636
α G 2 2.720.000
β G 2 0.0440.000
* Subscript L2 represents estimated seed production based on the logistic curve; subscript G2 represents estimated seed production based on the Gompertz curve.
Table 4. Scenarios with Corresponding Abbreviations and Values.
Scenario NameAbbreviationStumpage Price (Pt)Seed Price (Ps)Carbon Price (Pc)Discounting Rate (r)Aαβ
Reference ScenarioRS 1425 CNY/m31.5 CNY/kg45 CNY/tonne3%36.142.720.044
Economic factors scenario—Pt decreasing by 10%ES 1-a382.5 CNY/m3
Economic factors scenario—Pt increasing by 10%ES 1-b467.5 CNY/m3
Economic factors scenario—Ps decreasing by 10%ES 2-a 1.35 CNY/kg
Economic factors scenario—Ps increasing by 10%ES 2-b 1.65 CNY/kg
Economic factors scenario—Pc decreasing by 10%ES 3-a 40.5 CNY/tonne
Economic factors scenario—Pc increasing by 10%ES 3-b 49.5 CNY/tonne
Economic factors scenario—r decreasing by 10%ES 4-a 2.7%
Economic factors scenario—r increasing by 10%ES 4-b 3.3%
Seed production factors scenario—A decreasing by 10%SS 1-a 32.53
Seed production factors scenario—A increasing by 10%SS 1-b 39.75
Seed production factors scenario—α decreasing by 10%SS 2-a 2.45
Seed production factors scenario—α increasing by 10%SS 2-b 2.99
Seed production factors scenario—β decreasing by 10%SS 3-a 0.04
Seed production factors scenario—β increasing by 10%SS 3-b 0.048
1 The values in the grey cells are the same as RS.

