Synthetic Diesel Production as a Form of Renewable Energy Storage

1
Department of Energy, Polytechnic University of Turin (POLITO), Corso Duca degli Abruzzi 24, 10129 Turin, Italy
2
Department of Energy Technology, KTH Royal Institute of Technology, Brinellvägen 68, SE-100 44 Stockholm, Sweden
*
Author to whom correspondence should be addressed.
Energies 2018, 11(5), 1223; https://doi.org/10.3390/en11051223
Submission received: 16 March 2018
/
Revised: 4 May 2018
/
Accepted: 7 May 2018
/
Published: 10 May 2018
(This article belongs to the Section D: Energy Storage and Application)
Abstract
:Production of synthetic hydrocarbon fuels as a means for renewable energy storage has gained attention recently. Integration of solid oxide co-electrolysis of steam and carbon dioxide with the Fischer-Tropsch process to transform renewable electricity into Fischer-Tropsch diesel is one of the promising suggested pathways. However, considering the intermittency of produced renewable electricity such integration will have a low capacity factor. Besides, locating a reliable source of carbon dioxide near the installed integrated system may prove to be difficult. A novel integration for production of Fischer-Tropsch diesel from various renewable sources is suggested in this study. The proposed integrated system includes solid oxide electrolysis, entrained gasification, Fischer-Tropsch process and an upgrading system. Gasification is assumed to have a continuous operation which increases capacity factor of the integrated system. Carbon dioxide supplied via gasification of biomass provides a reliable source for on-site co-electrolysis. Technical capabilities of the proposed integrated system examined by investigating performance in relation with electricity, and diesel demand of four different European cities. Results show that the proposed system is capable of supplying Fischer-Tropsch diesel of between 0.9–32% of the annual diesel demand for road transportation respective to the location of installation, with a high emission savings (around 100%). Cost of produced diesel is not competitive with conventional diesel for all cases, even when all the other by-products were assumed to be sold to the market.
1. Introduction
Production of electricity from renewable resources has been gaining considerable attention in the past decades. This trend is due not only to the increased awareness concerning conventional energy systems future availability and reliability but also regarding greenhouse gas emissions. Various technical issues have prohibited their implementation in existing energy systems. For example, intermittent nature of renewable energy sources like solar complicates the matching between energy supply and end-user demand. Another challenge relates to use of such renewable resources in the transportation system. These issues can be solved by deploying chemical energy storage where produced electricity is converted to chemical energy of mass streams such as synthetic hydrocarbon fuels. This technology is one of the most efficient long term energy storage technics (seasonal and annual). Moreover, it is capable to widely interact with electricity, heat, and transportation networks [1].
For this purpose, a high temperature electrolyser (e.g., solid oxide electrolyser cells—SOECs) can be employed to transform excess electrical energy into chemical energy of syngas via co-electrolysis of steam and carbon dioxide. SOECs enable dissociation in a single step while co-electrolysis products, syngas and oxygen, are produced in separate compartments [2,3]. In other words, the co-electrolysis process enables an immediate use of renewables-based electricity to produce syngas. This syngas may then be used as a precursor in production of synthetic liquid fuels via Fischer-Tropsch (FT) process. Liquid FT fuels (e.g., diesel) that are produced in this manner then can be considered as sustainable since they originate from renewable electricity and recycled carbon dioxide. They are also similar in nature to refined fossil-based transportation fuels and can thus be stored and used without any changes in the existing infrastructure [4].
There are few published studies that consider integration between SOEC and FT process. As an example, Becker et al. [4] showed the possibility of liquid hydrocarbon fuels production with high system efficiency of about 55% (HHV base) using a theoretical model, rendering the concept as promising. In another study, Stempien et al. [5] investigated the performance of a simplified integration of SOEC and FT systems using a thermodynamic model. They showed that system efficiency as high as 66% is possible by including recovery turbines in the integrated system. Li et al. [6] suggested an integration of electrochemical conversion of CO2 and FT process and showed that depending on the level of technology advancement, the produced synthetic fuels cost would be in range of 3.80 to 9.20 $/gallon. A numerical study on SOEC-FT for methane production has been performed by Chen et al. [7] in the pressure ranges of 1–5 bar. Their results showed that a peak value of methane production can be achieved at operating pressure of 3 bar. Nevertheless, the reactor itself was the main focus of this study and other required system components were not included in the analysis.
Nevertheless, in all of above mentioned studies continuous operation of SOEC is considered. If SOEC is used as energy storage technology, then it can operate only when produced electricity is in excess to its demand. It is difficult to ensure continuous operation of SOEC throughout a typical operational year if the system is to rely completely on renewables-based electricity. This may cause a problem especially considering the transportation system, since continuous synthetic fuel supplies cannot be guaranteed. Besides, investing in an integrated system that is idle cannot be justified from economic perspective. Furthermore, it is widely known that FT system with rather large capacities should be installed to be considered as economically sustainable [8]. Moreover, locating a proper carbon dioxide source which is in reasonable distance from SOEC and renewable power plant may be proved to be difficult. To tackle these issues, another pathway can be included to produce precursor syngas through gasification of lignocellulosic biomass in parallel to SOEC. Including biomass gasification in the integrated system yields a number of benefits: guaranteed annual FT fuel production, increased capacity factor, increased nominal size of FT system, and provision of reliable and on-site source of carbon dioxide. Including gasification in the integrated system opens new possibilities for internal mass and heat recovery, resulting in lower dependency of the integrated system on external sources. Entrained gasification (EG) of lignocellulosic biomass is considered here. This type of gasifier has high operating temperature which allows production of high quality syngas with negligible amount of tar. They also are insensitive to input feedstock and consequently are suitable for gasification of wide range of biomass feedstocks [9,10,11]. There are several studies that consider production of synthetic diesel from biomass resources [12,13,14,15,16,17,18,19], and recent advances in catalytic application of layered double hydroxides [19] is just one of many innovations that have been brought forth recently. This study focuses on conversion of biomass molecules using layered double hydroxides as a catalyst. The results showed the possibility of implementation of such catalysts in conversion of broad range of biomass with several advantages such as improved activity and selectivity as well as lower water production rate.
The main focus of this study is to investigate the theoretical capabilities of a novel integration between SOEC, EG, and FT technologies in real applications. For this purpose, the integrated system performance is analyzed in relation with electricity, and diesel for road transportation demand of four different European cities. In each case, it is assumed that the share of electricity demand that is normally provided from non-renewable sources will be completely replaced by solar and/or wind based electricity or by consuming a fraction of produced FT diesel in gas turbine. The rest of FT diesel is then compared to road transportation demand of that city. Moreover, levelized cost of produced FT diesel is estimated based on three different scenarios. Furthermore, the possible interaction between the proposed integrated system and district heating network (DH) is investigated.
2. Integrated System Layout and Model Description
Figure 1 illustrates a simplified schematic of the proposed integrated system. The precursor syngas for FT diesel production is partly provided from gasification of lignocellulosic biomass in the EG subsystem. It is assumed that the EG subsystem operates continuously throughout the year. On the other hand, the SOEC subsystem starts its operation whenever the produced electricity from renewable resources (solar PV and wind) becomes available. The produced syngas is delivered to the FT subsystem for further processing. The precursor syngas first enters FT reactor and then passes the upgrading equipment to increase the share of FT diesel in the product stream. As can be seen in Figure 1, there are also several by-products, namely: light gaseous hydrocarbons (LGHC), naphtha, wax, hydrogen, heat and water. Amongst the by-products, some part of produced LGHC is directed to the SOEC subsystem and burned in the combustion chamber (not shown in the schematic) providing the required heat flow in the subsystem. This LGHC fraction differs based on the heat requirements of the SOEC subsystem throughout the operational year owing to the intermittent nature of solar and wind electricity. Details of the amount of required heat from combustion of LGHC and the effect of LGHC internal recovery can be found in references [20] and [21] by the authors, respectively. Internal mass flow integration is considered so that system operation would be either enhanced or close to closed-cycle operation as much as possible. For example, to maintain high operating temperature of EG reactor, pure oxygen is the preferred oxidant agent. Generally, air separation unit (ASU) is used to provide the required amount of oxidant agent. In the proposed integrated system, however, pure oxygen is produced as a by-product of simultaneous electrolysis of steam and carbon dioxide. Hence, it is possible to redirect all or some part of this oxygen based on the gasification requirements, towards EG subsystem which consequently results in either smaller size or total elimination of ASU. In return the produced carbon dioxide during gasification and water shift reactions inside EG subsystem will provide a good source of carbon dioxide for the SOEC system. However, depending on the size of EG and SOEC subsystems, providing carbon dioxide from external sources may be proved to be mandatory [21]. Finally yet importantly, water is a by-product of FT reactions as well as the upgrading processes. Like carbon dioxide, some part or all of produced water in the FT can be used to cover the water input requirement of SOEC subsystem. Provided that the produced water match its consumption, water recovery can be considered as a great advantage of the proposed integrated system since it eliminates the prerequisite of locating the plant near water resources.
The priority of the proposed integrated system is energy storage, hence the chemical energy content of a portion or all of produced FT diesel should be transferred back to electricity. In this study, gas turbine technology is considered to estimate the amount of required FT diesel to cover the electrical power shortage. Therefore, the gas turbine will be in operation when electricity supply cannot meet the demand. Note that in this situation SOEC subsystem is not operational. Since the carbon content of FT diesel is provided from either biomass or recycled carbon dioxide it is considered as renewable fuel and therefore electricity that is supplied from the gas turbine can be considered as CO2 emission free. The remaining part of FT diesel is then considered to be used in the transportation system.
This system is modeled using both ASPEN Plus and Matlab software [22,23]. First electricity demand, lignocellulosic biomass availability, solar PV potential, and wind potential of the given location are estimated in Matlab, as explained in Section 3. Based on the estimated values, size of each subsystem is calculated. Then process flow sheets of each subsystem that contains all of the main components are created in ASPEN Plus. While components such as pressure changers are modeled using the standard components from ASPEN Plus library, the available data in the literature are used to model SOEC unit, EG reactor, and FT reactor. Input parameters were selected based on the desired operating condition of each subsystem as well as hydrogen to carbon monoxide ratio to maximize the FT diesel production. Results from the ASPEN models were transferred to Matlab to estimate the annual potential of diesel production for the given location and the percentage of diesel demand that can be covered by produced FT diesel.
2.1. Solid Oxide Electrolyser
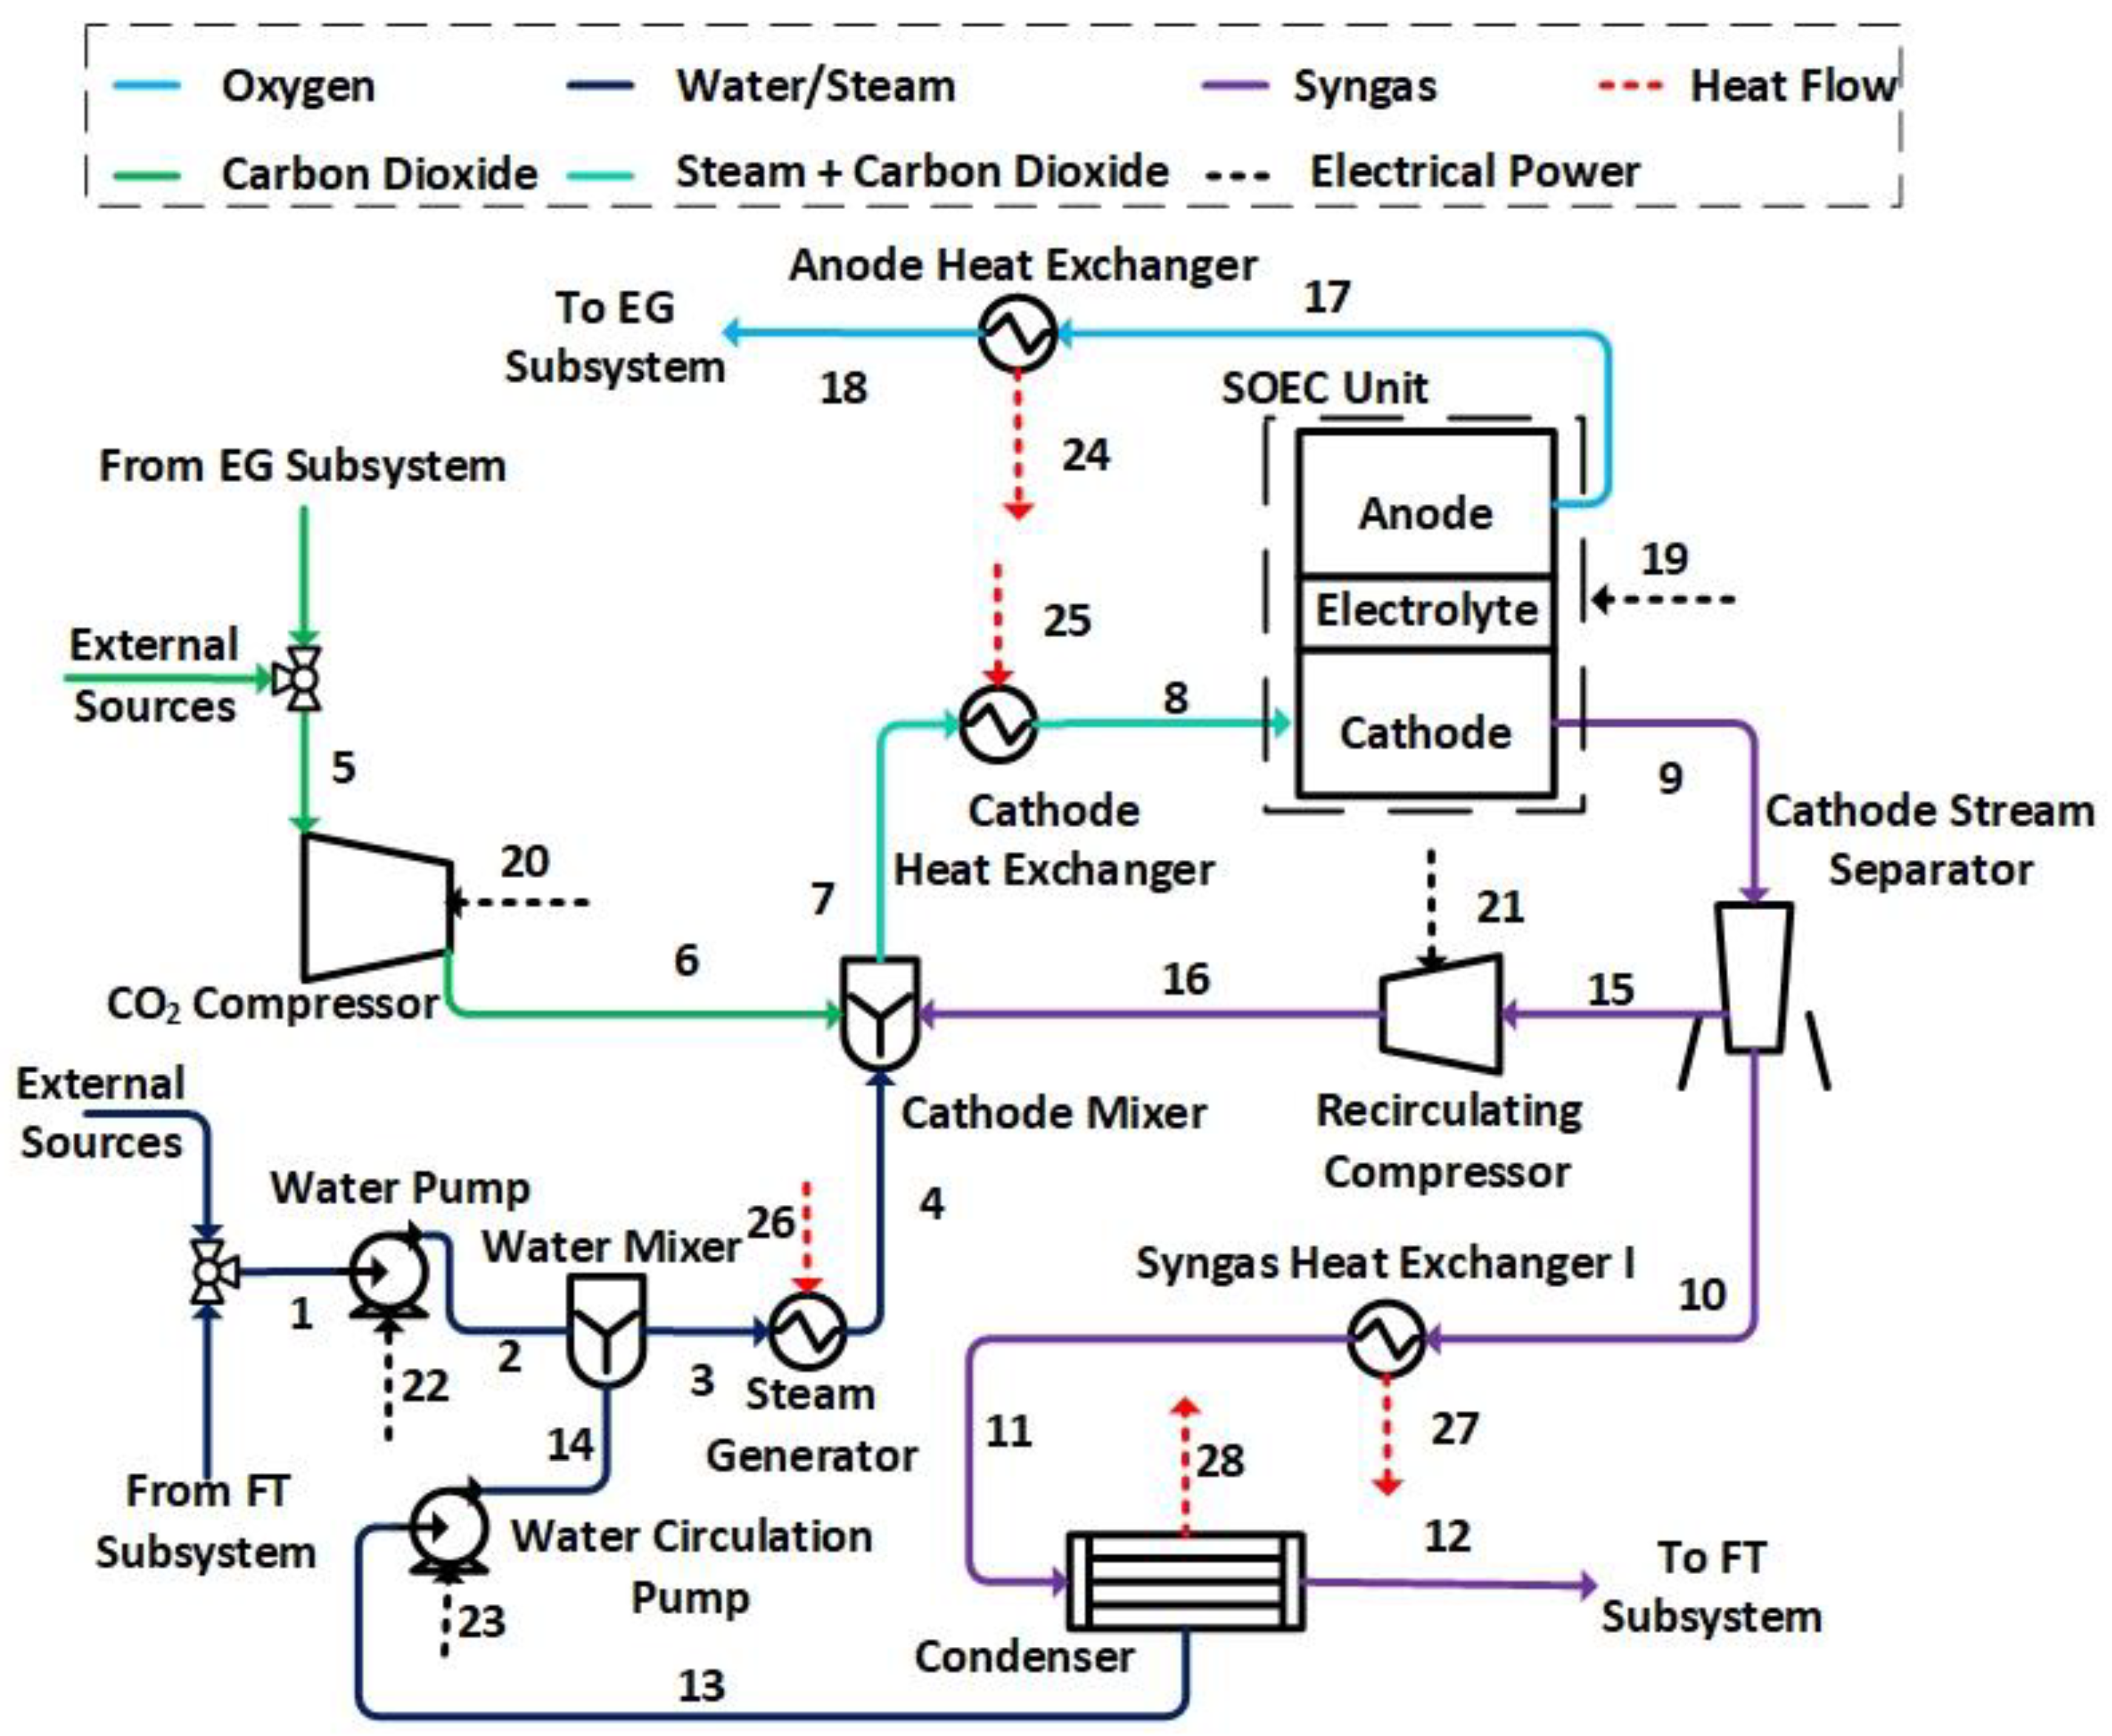
Figure 2 illustrates SOEC subsystem. As can be seen this subsystem includes carbon dioxide compressor, recirculating compressor, two water pumps, SOEC unit, mixers, one separator, condenser and several heat exchangers. Although system operates at atmospheric pressure, compressors and pumps are required to compensate the pressure loss that is occurring inside each component.
Water first enters water pump (stream 1) before being mixed with the condensate (stream 14) that is recycled back to the subsystem. As mentioned before, required water for co-electrolysis purpose is provided by recycling the produced water in FT subsystem. However, depending on the nominal size of SOEC and number of hours that SOEC is in operation it may not be sufficient. Hence, providing water from external sources is also considered. Output stream of water mixer (stream 3) then passes through steam generator (stream 4) prior to being mixed with carbon dioxide (stream 6) and recycled syngas (stream 16). Like water, the carbon dioxide requirement first is met by the recycled CO2 from EG subsystem. Nonetheless, carbon dioxide may be provided from external sources in event that the recycled amount of CO2 would not suffice. Input CO2 (stream 5) first is compressed and then sent to cathode mixture. In addition, a fraction of produced syngas (stream 16) is added to the mixture of H2O/CO2 to maintain the reducing condition on the cathode electrode. A mixture of H2O/CO2/H2/CO (stream 7) then is pre-heated in cathode heat exchanger to the operating temperature of SOEC unit before entering cathode (stream 8). Syngas is produced in the cathode compartment of SOEC unit through electrochemical reactions. The produced syngas leaves cathode (stream 9) and at that point is divided into two streams. A small fraction (stream 15) is recycled back to the cathode inlet, while the rest (stream 10) passes through syngas heat exchanger I and condenser to cool down and remove the extra water content (stream 13). The dried syngas (stream 12) then is sent to the FT subsystem.
On the anode side, oxygen with high purity (>95%) is produced. Generally, some type of sweep gas like air is used in the anode compartment to dilute the produced oxygen [24]. However, in this study, it is assumed that the pure oxygen produced in this subsystem will be recycled and used as oxidant agent in the gasification process in the EG subsystem. Hence, no sweep gas is considered here. The produced oxygen (stream 17) is cooled down in anode heat exchanger before leaving SOEC subsystem (stream 18).
As it is shown in Figure 2, several heat exchangers are used in this subsystem. As shown in previous studies, the required heat for the heat exchangers such as steam generator can be provided by recycling heat from other heat exchangers such as syngas heat exchanger I [24]. Although the amount of produced heat in the subsystem cannot cover all the internal demand, the produced heat from EG and FT subsystem can still be recycled back to this subsystem. Therefore, all the internal heat requirements of the integrated system, which are equal to the heat requirements of SOEC subsystem, can be provided internally through the recycled heat. The only exception is the cathode heat exchanger due to its output stream high temperature. In this case, the required heat stream (stream 25) is provided by burning a fraction of produced FT LGHC (not shown in the schematic). As mentioned previously, since FT LGHC is produced from renewable sources, the associated CO2 emissions are taken to be zero [25].
The SOEC subsystem has been modeled using ASPEN Plus software. Atmospheric operating pressure is selected to gain high contents of hydrogen and carbon monoxide at the system outlet [24]. Also, a constraint is defined in the model to keep hydrogen to carbon monoxide ratio at the subsystem outlet constant at 2.1 which is the desirable value in the production of FT diesel using a cobalt catalyst [4,26,27]. The operating temperature of the SOEC unit is 800 °C. SOEC subsystem capacity depends on the amount of available electrical power. The nominal capacity of SOEC subsystem then is set to be equal to the maximum available excess electricity from renewables in this study. Nevertheless, this subsystem does not have continuous operation at its nominal capacity due to intermittent nature of produced renewable electricity. In other words, the SOEC produces precursor syngas as long as the produced renewable electricity would be higher than user electricity demand. Also, based on the amount of available electricity, syngas production capacity would be different from one hour to another. So, annual production of precursor syngas from co-electrolysis is estimated as the sum of produced syngas for each hour. Likewise, annual carbon dioxide, steam, and heat consumption as well as oxygen production of the subsystem calculated as sum of their either consumption or production rate in each hour. More information regarding the ASPEN Plus model of electrolysis system and its validation can be found in a previous study [24].
2.2. Entrained Gasification
Figure 3 illustrates the simplified schematic of the entrained gasification subsystem. Biomass (stream 1) first goes through a sizing unit to ensure desirable particle size prior entering the gasifier. Both biomass particles (stream 2) and oxygen enter at the top and travel to the bottom of gasifier. As explained previously, oxygen demand is assumed to be covered by recycling the pure oxygen that is produced during co-electrolysis process. However, it may be proven that this amount of oxygen is not enough to meet the demand and therefore the extra oxygen in this case is provided from a cryogenic plant shown in Figure 3 as an air separation unit (ASU). The effect of internal oxygen recovery and the ASU unit resizing/elimination has been investigated in reference [21] by the authors. Syngas temperature at the entrained gasifier outlet (stream 3) is high (~1200 °C) which should be reduced prior to any other treatment. Therefore, syngas pass through a water bath at the bottom of the gasifier. The water vapor content of the syngas output from the water bath (stream 4) is enough to drive water gas shift reaction to increase hydrogen percentage of syngas stream [9]. So, stream 5 directly enters the shift reactor before cooling down to near-ambient temperature and losing its water content in a water knockout tank prior entering to the Selexol unit (stream 8). Selexol is considered to be an ideal process for the selective and bulk removal of hydrogen sulfide and carbon dioxide solvent, respectively [28,29]. The removed carbon dioxide in this step is assumed to be recycled and used as input to the SOEC subsystem. Finally, the clean dry syngas stream (stream 10) leaves the subsystem to participate in FT reactions. It is worth to mention that the heat that is released in syngas cooler either is used to cover the heat demand in the SOEC subsystem or is sold as a byproduct to the DH network.
A steady state model of entrained gasification is developed in ASPEN Plus. The nominal size of the EG subsystem is selected based on the base potential of woody biomass divided equally over an operational year. So unlike SOEC, EG is designed to have continuous operation. Hence, production of a certain amount of syngas and consequently FT diesel is assured throughout a year. Like SOEC subsystem, a constraint is set on the model so that the ratio between hydrogen and carbon monoxide at the EG outlet to be 2.1. EG subsystem operates at atmospheric pressure and 1200 °C. EG model and its validation is comprehensively explained in another publication from authors [30].
2.3. Fischer-Tropsch and Upgrading
Low temperature Fischer-Tropsch (200–240 °C) is favorable for high cetane number-diesel production with negligible amounts of aromatic compounds. Therefore, operating pressure and temperature of 25 bar and 240 °C over cobalt based catalyst was selected, respectively to maximize production of middle distillates in the FT reactor.
Figure 4 shows a schematic of the FT subsystem including syncrude upgrading system. Like SOEC and EG subsystems, FT and upgrading system are also modelled using ASPEN Plus. FT and upgrading subsystem description and comprehensive explanation of its model are given in the other publications by the authors [20,21,31].
2.4. Economic Modeling
The produced FT diesel levelized cost in each case is estimated using Equation (1):
where CICP: installed capital cost of plant; CO&M: operation and maintenance cost; CEl.: cost of electricity; CFeedstock: cost of feedstock (e.g., biomass); and Cincome: income that is gained by selling the produced byproducts. Detailed explanations of these terms and their estimation procedure can be found in [21].
2.5. Emission Modeling
The suggested approach by the European Commission is considered in this study to estimate the GHG emissions of produced FT diesel. According to this directive, the calculated GHG emission that can be emitted during production of FT diesel can be estimated according to Equation (2) [25]:
where: EFT Diesel: total emissions from the use of FT diesel; eec: emissions from the extraction or cultivation of raw materials; ep: emissions from processing; etd: emissions from transport and distribution of fuel; eccs: emission saving from carbon capture and geological storage and eccr: emission saving from carbon capture and replacement.
Emission savings due to use of FT diesel as replacement of its conventional counterpart are then calculated using Equation (3). Ef is the emission from using fossil based fuels and is set to the recommended value of 83.8 gCO2eq/MJ [25]:
Comprehensive explanation of the emission model that is used here can be found in another publication [21].
3. Location
To estimate the theoretical feasibility of proposed integrated system four different European cities, located in different regions of Italy and Sweden, have been selected. Table 1 lists the location, area, and population of each city. These cities have different electricity, heat, and diesel demands as well as contrasting renewable resource accessibility. Such a comparison allows the investigation of the FT diesel production in different settings. All locations have access to a DH network, ensuring market availability of selling heat.
3.1. Electricity Supply and Demand
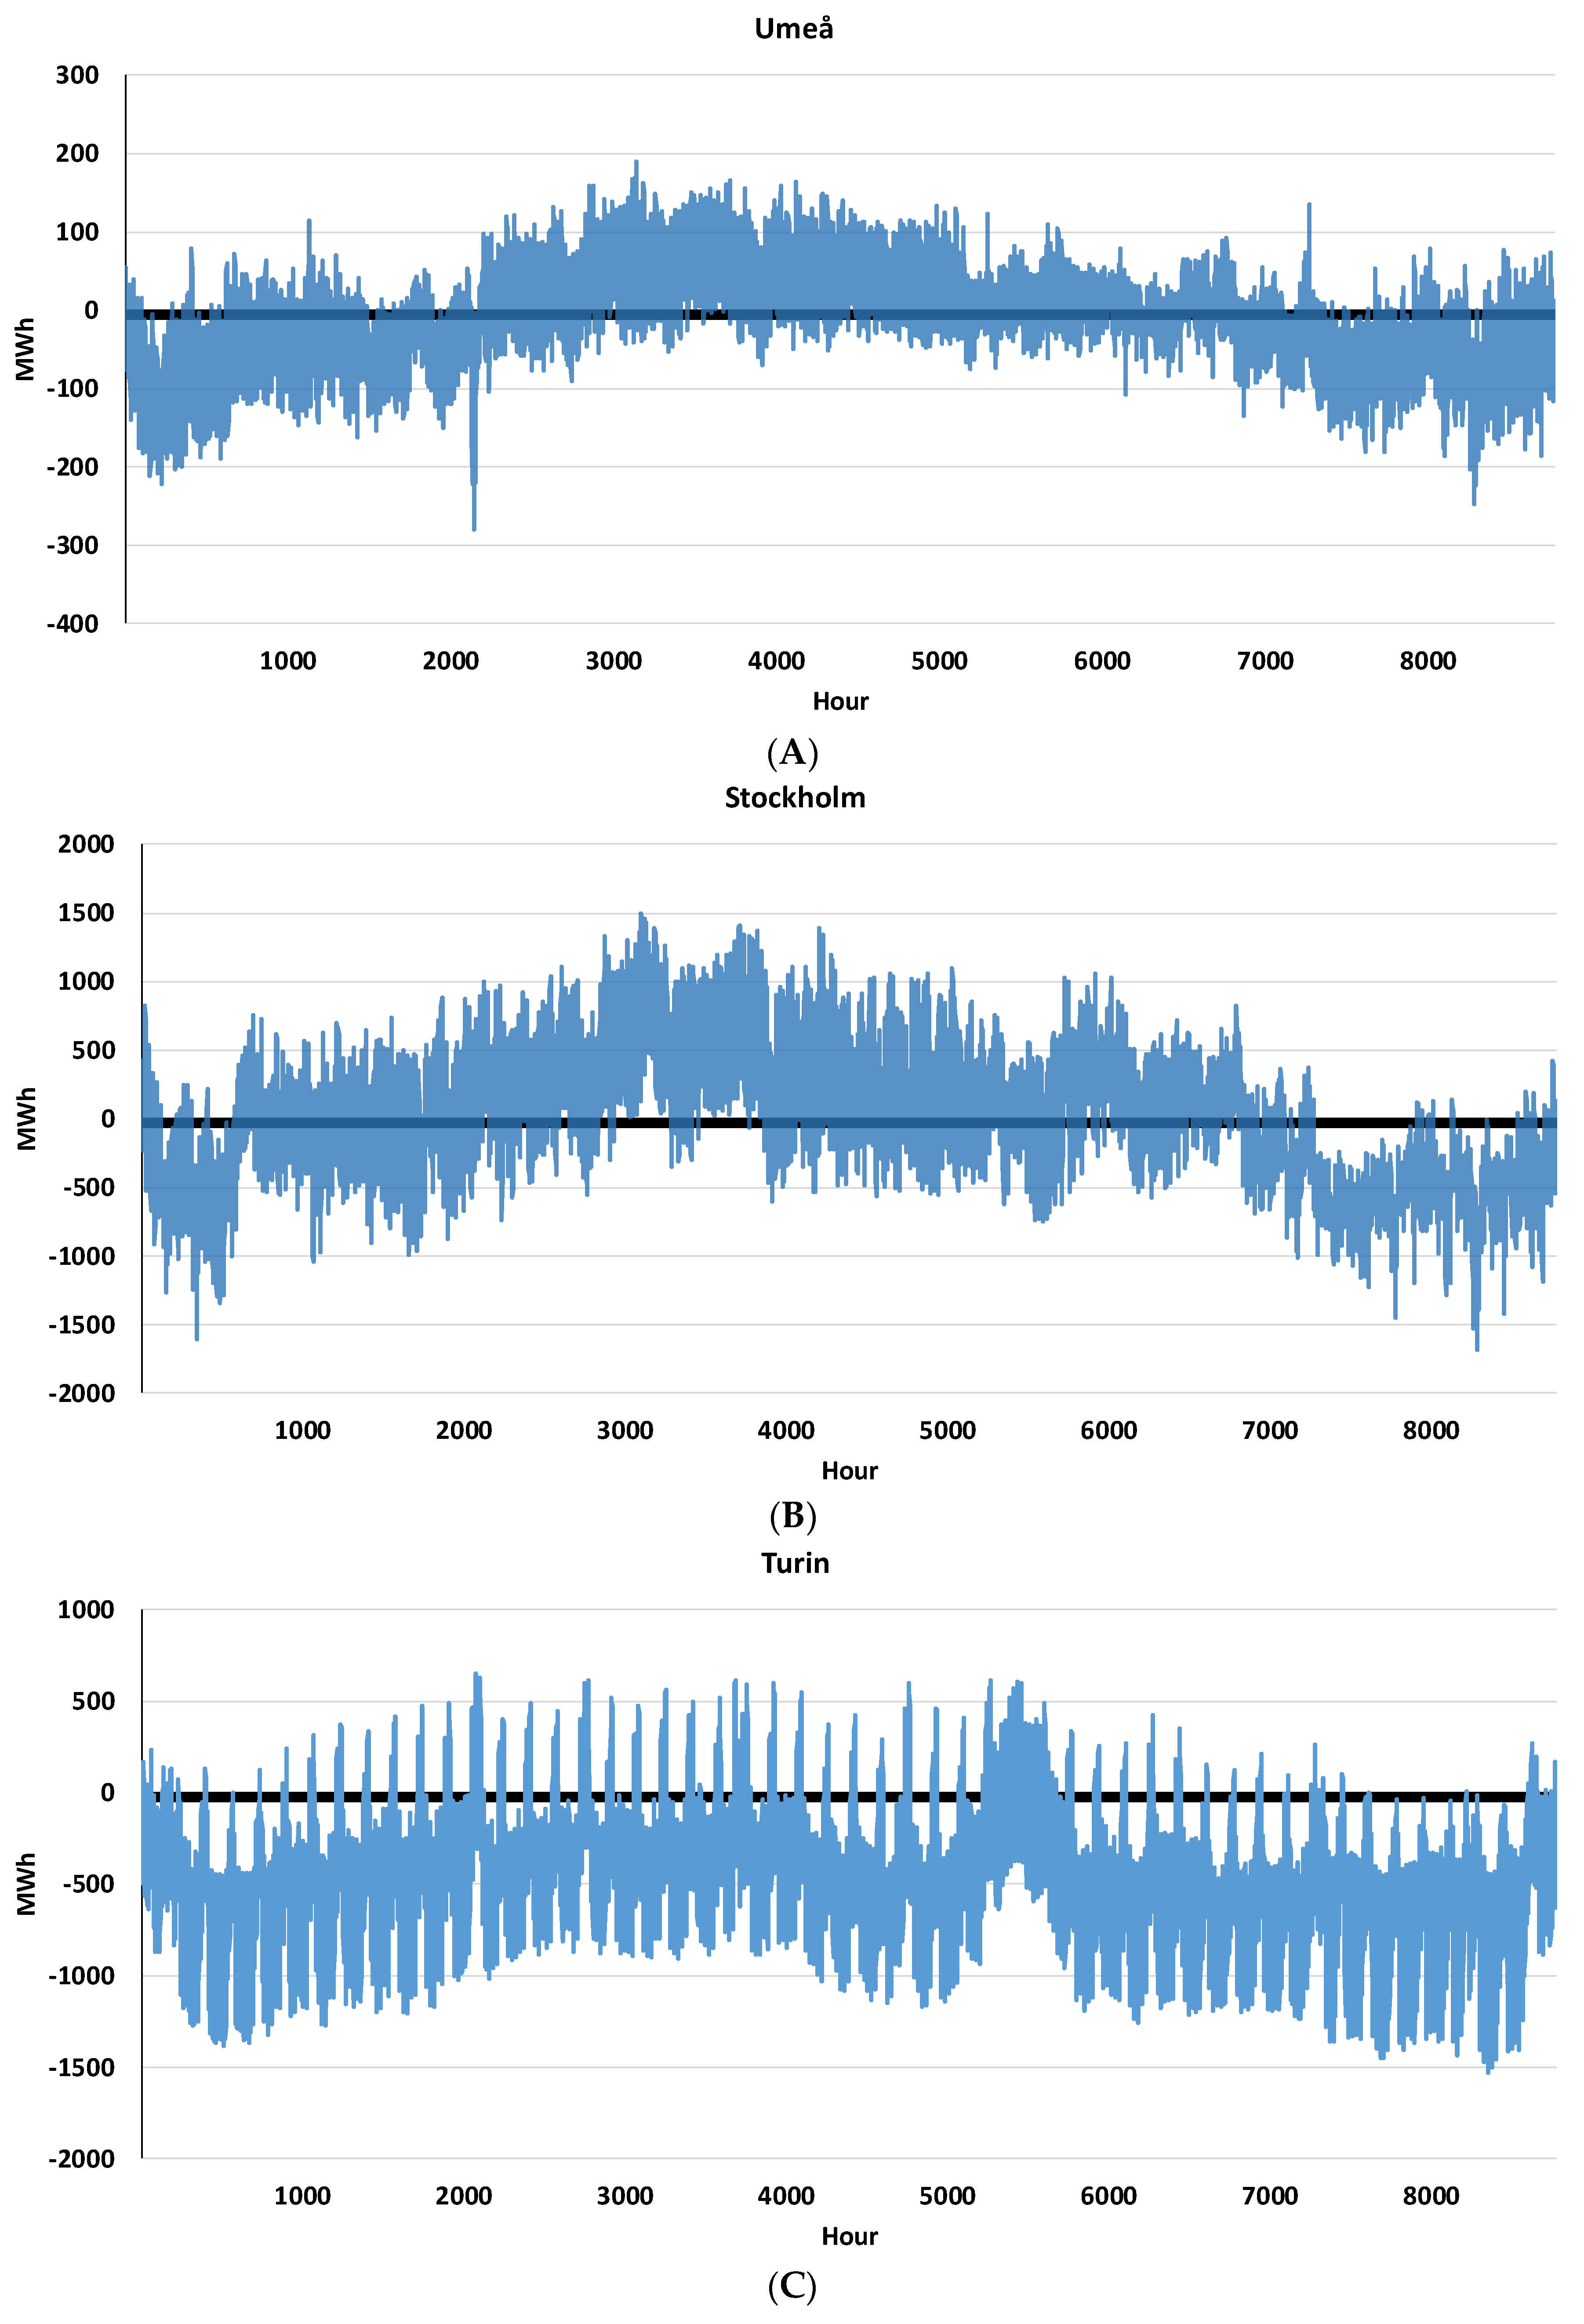
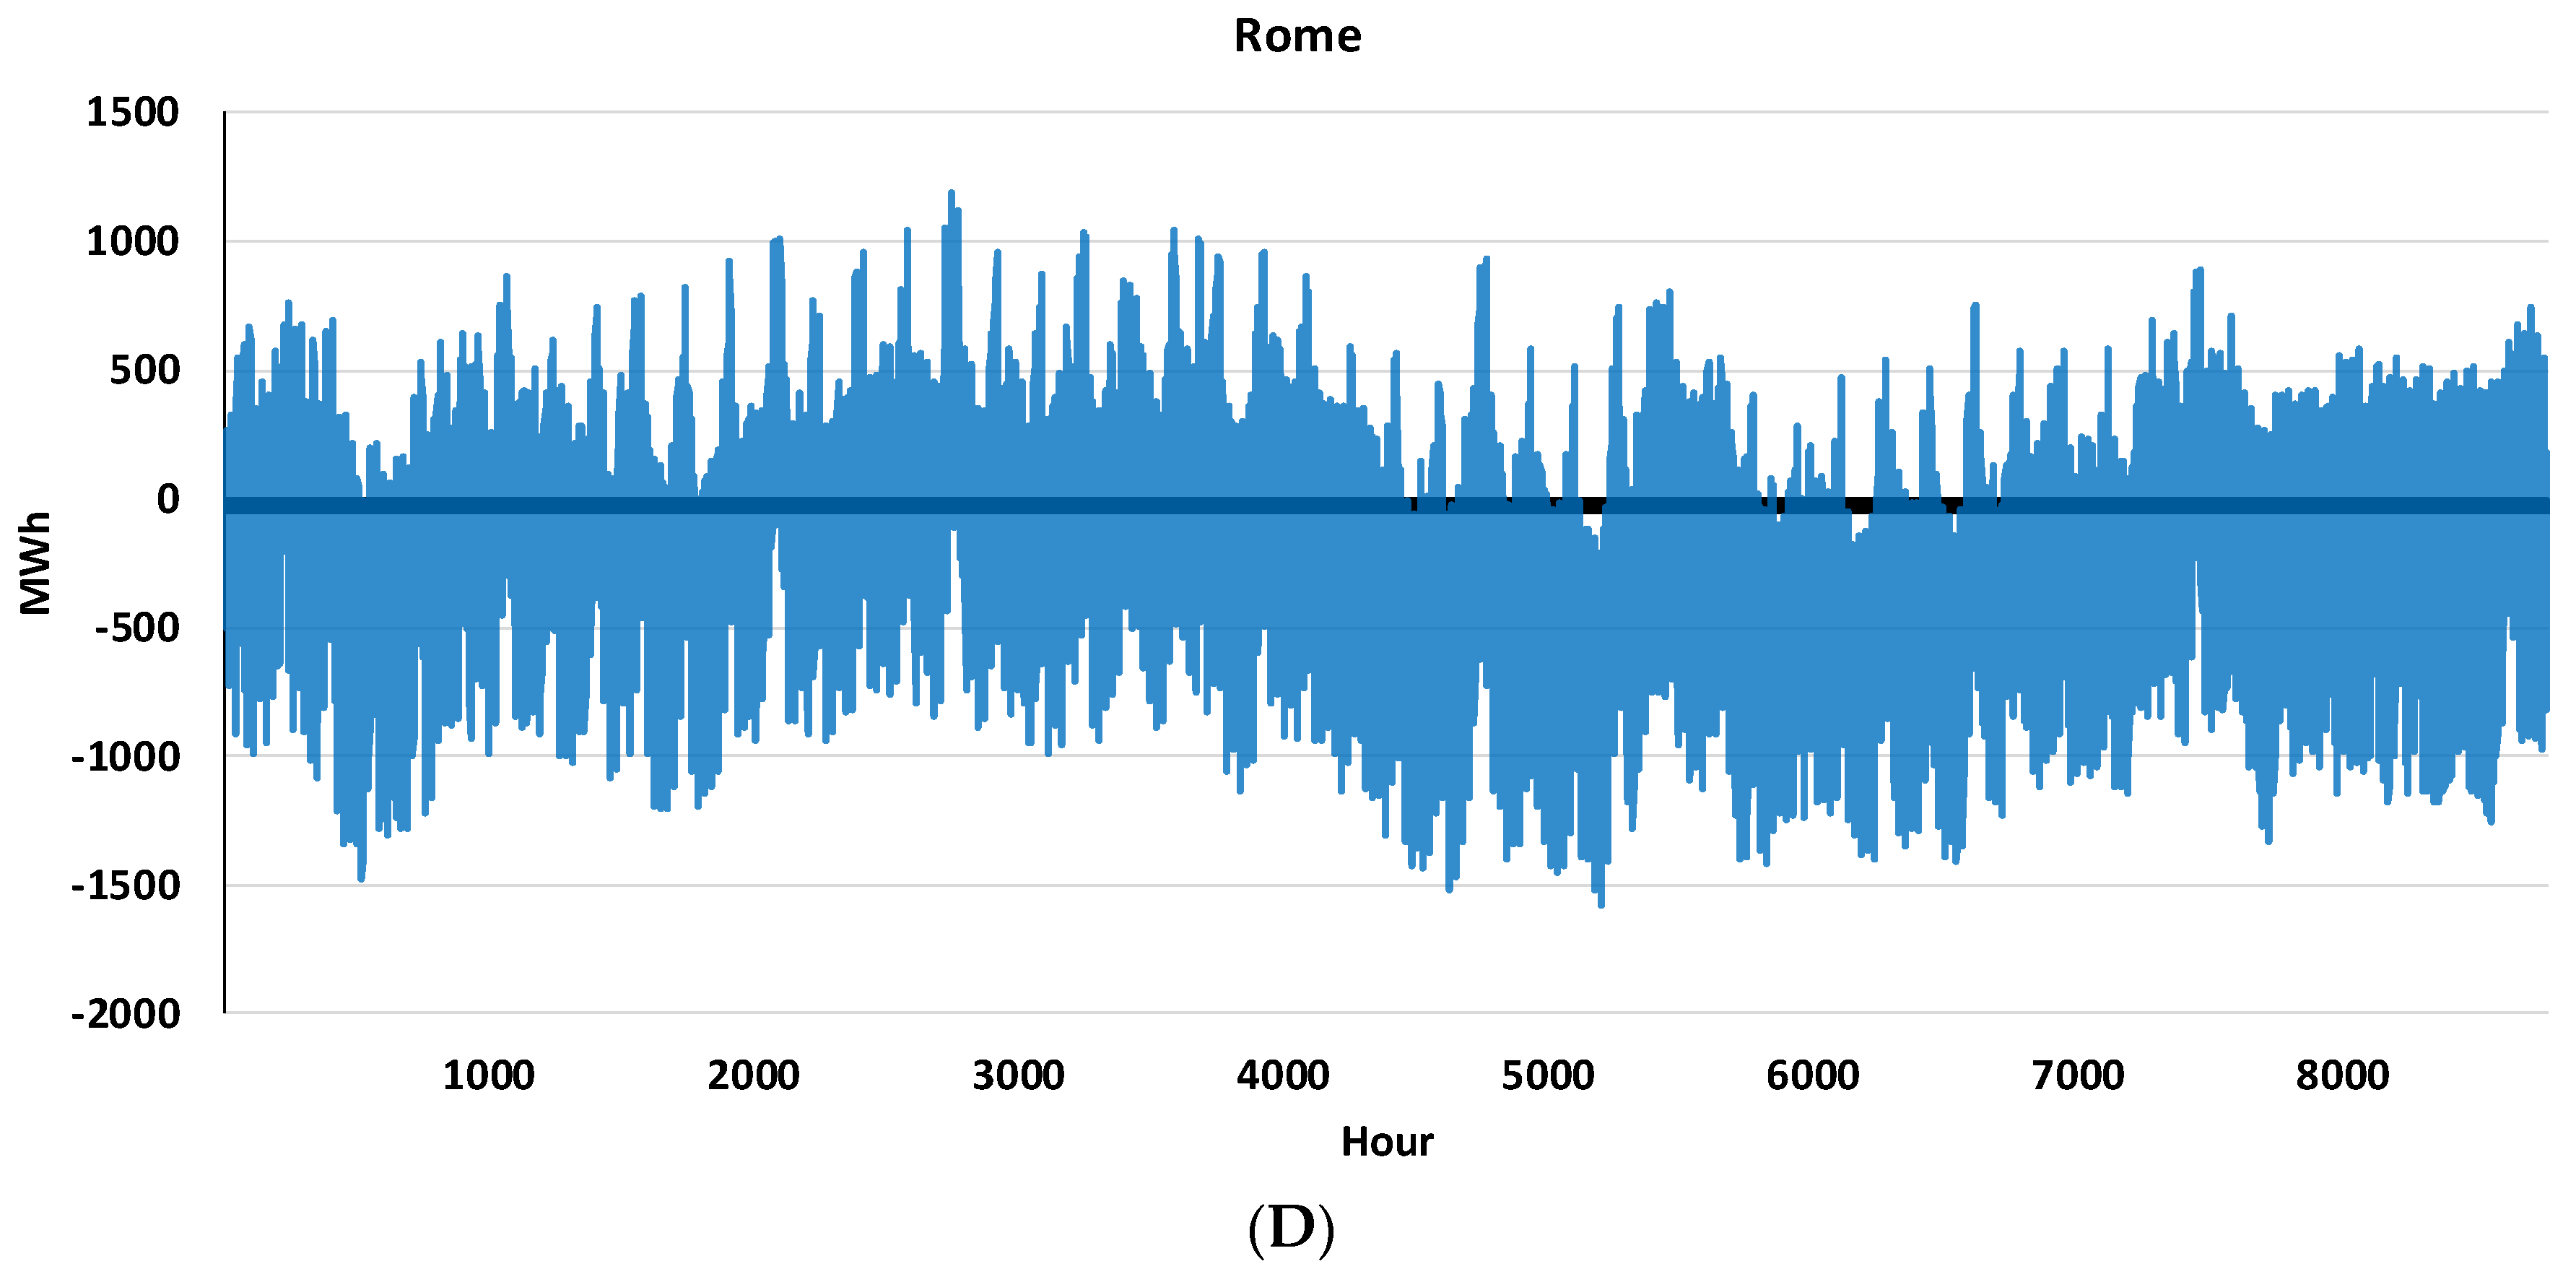
Figure 5A–D illustrate hourly electricity demand and production for each location based on the reported values for 2016. Hourly electricity demands are estimated based on the available data for the respective bidding area that each city is located. Values for hourly electricity supply are derived from the available data for country of origin, scaled to the relevant population size [32,33,34]. As it is shown in the figures, while electricity from nuclear covers considerable part of electricity demand in Sweden, it is completely absent from Italian electricity network. On the other hand, fossil fuel is widely used in supply of electricity in Italy while its share is negligible in Sweden. In this study, it is assumed that the nuclear and fossil fuel share of electricity in case of Umeå and Stockholm and fossil fuel share of electricity in case of Turin and Rome will completely be replaced by solar PV and wind power plants. In other words, the electricity would be supplied from following resources in each location:
- Umeå and Stockholm: wind, hydro, biomass and waste, and solar
- Turin and Rome: wind, hydro, geothermal, biomass and waste, and solar
3.2. Solar PV Potential
Electrical power production potential from solar PV panels in each location is calculated using equation 4. Power output of PV panels, PPV, in each hour depends on the temperature of the cells, Tc, and the average global solar irradiance in that hour, G:
PPV,n, represents the nominal power output of PV cells, Gstc, irradiance at standard test condition, k, approximate effect of temperature on power, and Tstc, the cell temperatures at standard test condition in this equation. Operating temperature of solar PV cells is estimated based on the equation presented by Migan [35]:
In Equation (5), Tair is the ambient temperature while NOCT represent nominal operating cell temperature. Tsoc and Gsoc are the ambient temperature and irradiance at standard operating condition, respectively. The hourly average global irradiance and ambient temperature for a typical day of each month in each location is extracted from the European commission database [36]. Irradiance data used in the model is the reported average global irradiance for 2-axis tracking planes. It is assumed that other days of that month then will have the same condition as this typical day. Other parameters are selected based on the available commercial data of MSX-83 solar PV module from SOLAREX company [37] and can be found in Table 2.
3.3. Wind Potential
Like solar PV, hourly potential of electricity production from wind power plant is estimated for each location. Guo [38] presented a method to downscale wind statistics to hourly wind data. According to this approach, the hourly wind speeds throughout a given day can be estimated by:
In this equation, Un, Uave, Umax, are the wind speed at hour n, daily average wind speed, and daily maximum wind speed, respectively. The daily average and maximum wind speed for a typical day of month in each location are extracted from the NASA database [39]. Similar to solar PV, it is assumed that other days of a given month have the same diurnal wind speed distribution. The reported data by NASA, however, are at altitude of 50 m from earth surface. Since wind speed varies with altitude, the estimated hourly wind speeds should be scaled properly to the height of selected wind turbine according to Equation (7) [40]:
where, UZ and are wind speeds at the hub height of Z and reference height of Zr, respectively. Wind shear exponent, a, then will be estimated by the empirical correlation between wind speed and height which is presented by Mentis et al. [40]:
Hourly power production from wind depends on the wind speed and can be calculated based on Equation (9) [41]:
Pwind and Pt in Equation (9) represent potential wind power production and nominal power of wind turbine, respectively. Uci, Ur, Uco, are cut-in speed, rated wind speed, and cut-off speed of the selected wind turbine, respectively. Parameters used in the above equations are selected based on the V90-3.0 MW wind turbines produced by Vestas and listed in Table 3 [42].
3.4. Biomass Potential
Like solar and wind, each one of selected locations has different base-potential of woody biomass. Table 4 presents the stem wood base potential for the north-west (Turin) and central (Rome) parts of Italy as well as northern (Umeå) and eastern (Stockholm) parts of Sweden. The presented values are the sustainable technical potential of biomass which is estimated according to the available standards for sustainable agriculture farming, forestry management, and land management plans [33]. The sources of stem wood that have been considered in this study mainly includes final felling and thinning of both conifer and non-conifer trees. Nevertheless, the part of stem wood from final felling which is not commercially viable to use for energy and bio-based material due to high price levels have been subtracted [33]. In this study, it is assumed that the share of selected cities from the reported base potentials is in accordance with their respective area. As an example, considering area of Turin from Table 1, share of lignocellulosic biomass that can be allocated to this city would be 64.5 kt which is about 2% of total available woody biomass in north-west region.
4. Results and Discussion
4.1. Electrical Balance
As mentioned in Section 4.1, it is assumed that electricity supply from nuclear and fossil fuels would be replaced by solar PV and wind in each location. The size of each renewable power plant is based on the maximum value of difference between electricity demand and the total value of remaining electricity supply that are presented in Figure 5A–D. Subsequently, the theoretical potential of hourly electricity supply from the solar PV or wind plant is estimated based on the size of power plant and according to the presented procedure in Section 4.2 and Section 4.3, respectively. These estimated hourly values are then added to the remaining electricity supply of each city to determine total electricity supply potential. Figure 6A–D present the electricity balances of each city. The positive values represent excess electricity and consequently point out times of an operational year that the SOEC subsystem can be operative. In other words, excess electricity in each city determines annual syngas production capacity in the SOEC subsystem. Note that electricity demand of the EG and FT subsystem is already included in the city hourly electricity demand before estimating the electricity balance. Hence, the estimated available excess electricity is only used by the SOEC subsystem. Periods of negative balance are handled via electricity generation from surplus FT diesel. As can be seen here, it seems that SOEC would be mostly operational during summer time in Umeå and Stockholm, while excess electricity availability is more scattered throughout the operational year in case of Turin and Rome. Nevertheless, considering the electricity balances presented in Figure 6A–D, the difficulty of continuous operation of the SOEC technology is clear.
4.2. Diesel
Table 5 presents annual diesel demand for road transportation and FT diesel production potential. Annual diesel demand of each city is estimated based on the total per capita demand in the road transportation of its origin country [43]. Total FT diesel production potential that can be used to meet this demand is estimated as the sum of the SOEC and EG shares in total production minus the amount that is used in the gas turbine, presented as GTS in the table, to cover for the electricity shortage.
From the results presented in Table 5, it can be concluded that systems that implemented in Stockholm and Turin have the highest and lowest potential for FT diesel production in general. However, when the estimated values are considered in respect to the annual diesel consumption of cities, Umeå seems to have the highest capability where around 32% of its annual road transportation demand can be covered. Nevertheless, a closer look at the SOEC and EG share in FT diesel production makes it clear that this is caused mainly due to higher base potential biomass in this region rather than presence of SOEC in the integrated system. Comparing estimated amounts of FT diesel that is produced from precursor syngas production in SOEC subsystem reveals that Stockholm has the highest production potential. However, if these values are considered in parallel to EG share, i.e., put into context of share in total production of FT diesel, it seems that Rome, with the share of 22% of total production, is the city that can benefit the most from including SOEC in the integrated system. Therefore, based on the contribution of SOEC in precursor syngas production, cities can be ranked from highest to lowest improvement in annual diesel production as Rome, Stockholm, Turin, Umeå.
Another estimated value is the possible CO2 emission savings that can be achieved by replacing the conventional diesel with the produced FT diesel. As can be seen in Table 5, Rome and Umeå have the highest and lowest emission savings, respectively. This can be explained based on the fact that higher contributions of SOEC in the precursor syngas results in higher consumption of CO2 in the co-electrolysis and consequently, according to Equation (2), emission savings then are higher. So, the similar rank as presented at the end of previous paragraph will be allocated to cities to present the highest to the lowest possible emission saving in case of each city. In other words, considering the emissions saving, the rank from highest to lowest emission saving again would be Rome, Stockholm, Turin, Umeå. Different scenarios have been assumed in the diesel cost calculations based on possibility of selling the following products:
- Diesel cost 1: diesel fuel only.
- Diesel cost 2: diesel fuel and waste heat for district heating (supplied to existing DH networks).
- Diesel cost 3: diesel fuel, waste, and other by-products.
Figure 7 shows the estimated cost of produced FT diesel for the proposed integrated system along with a system variant that excludes the EG subsystem. A comparison between the estimated values reveals that the fully integrated system consistently results in lower levelized fuel costs, illustrating the significance of the EG subsystem. Turin has the highest FT diesel levelized cost among the selected locations. The reason can be explained by the fact that Turin not only has the lowest base potential of biomass but also the lowest potential of FT diesel production amongst the selected cities and consequently final levelized cost would be higher in this case. Moreover, according to results presented in Table 5, including SOEC in the integrated system results in further improvement of only 0.6% in FT diesel production. Therefore, a system with high capital cost is implemented that has capability to produce small amount of FT diesel. Although selling other byproducts including heat decreases the estimated diesel cost, it is still not compatible with conventional diesel prices. Umeå is the second city with high cost of diesel production. Similar to Turin, it can be explained by the fact that SOEC is responsible for very small amount of produced precursor syngas (Table 5). Hence, its capital cost cannot be counterbalanced by the amount of FT diesel that is produced from syngas that is in turn produced during co-electrolysis. The only city that shows a promise from an economical perspective, providing that suitable market is available to sell all the other byproducts of integrated system, is Stockholm. According to the results, in this case FT diesel production cost would be 1.9 $/L (without sales margin) which is closer to the historical conventional diesel price which is in range of 1.24 to 1.96 $/L for Sweden.
4.3. Mass Balance
As it is shown previously in Figure 1, a portion of the subsystem mass stream outputs are assumed to be recycled internally. Figure 8 shows annual production versus consumption rate of each one of these mass streams.
- Oxygen: As can be seen in Figure 8A, in all the systems implemented in the selected cities oxygen consumption rate is higher than production rate. Therefore, in all of the integrated systems oxygen must be provided from an ASU, although its load can be offset to a certain degree via internal recovery.
- Carbon dioxide: Like oxygen, there is a big gap between production and consumption of carbon dioxide in all of integrated systems. As results showed, EG subsystem produced more carbon dioxide that can be absorbed by SOEC, in all cases (Figure 8B). Hence, there is no need for external sources of CO2 and consequently not only necessity of instalment of facility close to available sources of CO2 is eliminated but also no purchase cost would be allocated to carbon dioxide. Since CO2 is produced from gasification of lignocellulose biomass, the produced FT diesel still is considered as CO2-neutral. Like oxygen, difference between production and consumption rate is higher in case of Umeå and Stockholm since they have higher woody biomass potential.
- Water: As shown in Figure 1, the produced water during FT and upgrading process is recycled back to produce the required steam for co-electrolysis. It can be concluded from results shown in Figure 8C that in case of Umeå, Stockholm, and Turin the produced water surpasses its consumption rate. Consequently, all of these cases will allow the degree of freedom to choose an installation site that is far from water sources. Nevertheless, the difference between water production and consumption in the integrated system in case of Turin is quite small. In this case annual water production is slightly higher than its consumption for about 1.7 kt/year. Nonetheless, in case of Rome, providing an external source of water is vital to the system.
- LGHC: as explained earlier, a fraction of LGHC will be recycled to SOEC subsystem and burnt in a combustion chamber to provide required heat for pre-heating the reactants entering the electrolyser unit. In case that produced LGHC is not sufficient to meet the heat demand in SOEC external sources such as natural gas should be employed. However as can be seen in Figure 8D, production of LGHC exceeds its consumption rate and the remaining part is available to be sold to the market as by-product.
5. Conclusions
An integration between three different technologies has been suggested in this study. Such systems not only can be considered as energy storage strategy for intermittent renewables such as solar and wind but also can provide sustainable transportation fuel. The suggested internal integration between SOEC, EG, and FT is designed to have both high system performance and low dependency on external sources such as water and carbon dioxide. Four European cities, namely: Umeå, Stockholm, Turin, and Rome, were selected to investigate theoretical potential of the proposed integrated system. These cities have different solar, wind, and biomass potential as well as different electricity, and diesel demands. In general, results showed that electricity demand of these cities can be met completely with renewable electricity by introducing the integrated system to their energy system. In addition, the proposed integrated system was capable to cover between 0.9–32% of diesel consumption in road transportation per year with high emission savings of 98–102% depending on the location of installation. Besides, it is shown that including SOEC in the integration, indeed increases FT diesel production potential. However, cost of produced diesel was more expensive than conventional diesel in all cases even when all the by-products were assumed to be sold to the market. The only reasonable FT diesel cost was in case of Stockholm provided that all the byproducts of the system would be sold to the market.
Results also showed that there is no requirement for providing carbon dioxide from external sources while using ASU to meet oxidant demand of EG subsystem was inevitable. It is also concluded that no external water sources would be necessary for Umeå, Stockholm and Turin cases. This gives an advantage in selection of plant building site. Nevertheless, water input to the control volume would be mandatory for Rome. Finally, comparison between production and consumption rate of LGHC revealed that the produced LGHC is not only enough to cover the internal demand but also it is possible to sell its remaining to the market as byproduct.
All in all, it can be concluded that production of FT diesel not only can be used as an energy storage technic (power to liquid) but also can be used to increase the share of renewables in the transportation sector. Nonetheless, if the sole purpose of using power to fuel is energy storage then power to gas schemes might be a better choice owing to the less complexity of the system and consequently less expensive levelized cost of the fuel.
The main purpose of this study was to investigate theoretical feasibility of proposed integrated system. In the current study constant levelized costs of renewable electricity and CO2 have been considered so that the only difference between the selected locations would be renewables availability and differences in the demand. Nevertheless, effect of variations in these costs on the FT diesel levelized costs are thoroughly studied in other publications of the authors [21,24]. Additionally, although potential CO2 credits may impact the results, expanding the analysis in this regard is judged to be too broad and therefore not considered here. Aspects such as technical potential of renewable electricity production in regards with its relevant possibilities and obstacles (e.g., installation cost, land availability, and etc.) as well as possible system control strategies especially in regards with recovery of mass streams are beyond the scope of this study and may be considered in future publications. Also comparison between different power to fuel schemes, power to gas versus power to liquid, may be investigated in future publications.
Author Contributions
Conceptualization, M.Sam. and A.M.; Methodology, M.Sam.; Software, M.Sam.; Validation, M.Sam.; Formal Analysis, M.Sam.; Investigation, M.Sam.; Resources, M.Sam.; Data Curation, M.Sam.; Writing-Original Draft Preparation, M.Sam.; Writing-Review & Editing, M.Sam., A.M., M.San., V.N.; Visualization, M.Sam.; Supervision, A.M., M.San., V.N.; Project Administration, M.Sam.; Funding Acquisition, A.M., M.San.
Acknowledgments
This research has been done in collaboration with Politecnico di Torino and Royal Institute of Technology, funded through Erasmus Mundus Joint Doctoral Programme SELECT+, the support of which is gratefully acknowledged.
Conflicts of Interest
The authors declare no conflict of interest.
Nomenclature
Abbreviation
| ASU | Air separation unit |
| BCC | Base capacity of component |
| CCR | Capital charge rate |
| DH | District heating |
| ECC | Estimated capacity of component |
| EG | Entrained gasification |
| FT | Fischer-Tropsch |
| FTS | Fischer-Tropsch synthetic |
| GTS | Gas turbine share in FT diesel consumption |
| IC | Interest during construction of plant |
| LGHC | Light gaseous hydrocarbons |
| O&M | Operation and maintenance |
| PV | Photovoltaic |
| SOEC | Solid oxide electrolysis cell |
| TPC | Total plant cost |
Latin Symbols
| a | Wind shear exponent |
| CICP | Annualized cost of installed capital of plant, $/year |
| CO&M | Annualized cost of operation and maintenance, $/year |
| CEl. | Annualized cost of electricity, $/year |
| CFeedstock | Annualized cost of feedstocks, $/year |
| Cincome | Annualized income from selling the byproducts, $/year |
| Cp | Purchase cost of heat exchanger, $ |
| CB | Heat exchanger base cost, $ |
| CHX-Capital | Capital cost of heat exchanger, $ |
| Cbase | Base cost of each component, $ |
| Ccomponent | Capital cost of component, $ |
| E | Total emissions from the use of the renewable fuel, gCO2eq/MJ |
| Ef | Emissions from the use of the fossil based fuel, gCO2eq/MJ |
| eec | Emissions from the extraction or cultivation of raw materials, gCO2eq/MJ |
| ep | Emissions from processing, gCO2eq/MJ |
| etd | Emissions from transport and distribution, gCO2eq/MJ |
| eccs | Emission saving from carbon capture and geological storage, gCO2eq/MJ |
| eccr | Emission saving from carbon capture and replacement, gCO2eq/MJ |
| FP | Pressure factor of heat exchanger |
| FM | Material factor of heat exchanger |
| FO&M | Operation and maintenance factor |
| G | Average global solar irradiance, W/m2 |
| Gsoc | Irradiance at standard operating condition, W/m2 |
| Gstc | Irradiance at standard test condition, W/m2 |
| K | Approximate effect of temperature on power, %/°C |
| PPV | Power output of PV cells, W |
| Tc | Cell operating temperature, °C |
| Tsoc | Cell temperature at standard operating condition, °C |
| Tstc | Cell temperature at standard test condition, °C |
| Un | Wind speed at hour n, m/s |
| Uave | Daily average wind speed, m/s |
| Umax | Daily maximum wind speed, m/s |
| Uz | Wind speed at the wind turbine hub height, m/s |
| Uzr | Wind speed at the reference height, m/s |
| x | Cost scaling factor |
| Z | Wind turbine hub height, m |
| Zr | Reference height, m |
References
- Connolly, D. The Integration of Fluctuating Renewable Energy Using Energy Storage; University of Limerick: Limerick, Ireland, 2010. [Google Scholar]
- Bierschenk, D.M.; Wilson, J.R.; Barnett, S.A. High efficiency electrical energy storage using a methane–oxygen solid oxide cell. Energy Environ. Sci. 2011, 4, 944–951. [Google Scholar] [CrossRef]
- Sun, X.; Chen, M.; Jensen, S.H.; Ebbesen, S.D.; Graves, C.; Mogensen, M. Thermodynamic analysis of synthetic hydrocarbon fuel production in pressurized solid oxide electrolysis cells. Int. J. Hydrog. Energy 2012, 37, 17101–17110. [Google Scholar] [CrossRef]
- Becker, W.L.; Braun, R.J.; Penev, M.; Melaina, M. Production of Fischer–Tropsch liquid fuels from high temperature solid oxide co-electrolysis units. Energy 2012, 47, 99–115. [Google Scholar] [CrossRef]
- Stempien, J.P.; Ni, M.; Sun, Q.; Chan, S.H. Thermodynamic analysis of combined Solid Oxide Electrolyzer and Fischer–Tropsch processes. Energy 2015, 81, 682–690. [Google Scholar] [CrossRef]
- Li, X.; Anderson, P.; Jhong, H.-R.M.; Paster, M.; Stubbins, J.F.; Kenis, P.J.A. Greenhouse Gas Emissions, Energy Efficiency, and Cost of Synthetic Fuel Production Using Electrochemical CO2 Conversion and the Fischer-Tropsch Process. Energy Fuels 2016, 30, 5980–5989. [Google Scholar] [CrossRef]
- Chen, B.; Xu, H.; Ni, M. Modelling of SOEC-FT reactor: Pressure effects on methanation process. Appl. Energy 2017, 185, 814–824. [Google Scholar] [CrossRef]
- De Klerk, A. Fischer–tropsch process. In Kirk-Othmer Encyclopedia of Chemical Technology; Wiley: Hoboken, NJ, USA, 2013; pp. 1–20. [Google Scholar]
- Weiland, F. Pressurized Entrained Flow Gasification of Pulverized Biomass. Ph.D. Thesis, Luleå Tekniska Universitet, Luleå, Sweden, 2015. [Google Scholar]
- Qin, K. Entrained Flow Gasification of Biomass; Technical University of Denmark: Kongens Lyngby, Denmark, 2012. [Google Scholar]
- Phillips, J. Different Types of Gasifiers and Their Integration with Gas Turbines; National Energy Technology Laboratory, Department of Energy: Washington DC, USA, 2004.
- Tijmensen, M.J.A.; Faaij, A.P.C.; Hamelinck, C.N.; Van Hardeveld, M.R.M. Exploration of the possibilities for production of Fischer Tropsch liquids and power via biomass gasification. Biomass Bioenergy 2002, 23, 129–152. [Google Scholar] [CrossRef]
- Trippe, F.; Fröhling, M.; Schultmann, F.; Stahl, R.; Henrich, E.; Dalai, A. Comprehensive techno-economic assessment of dimethyl ether (DME) synthesis and Fischer-Tropsch synthesis as alternative process steps within biomass-to-liquid production. Fuel Process. Technol. 2013, 106, 577–586. [Google Scholar] [CrossRef]
- Swain, P.K.; Das, L.M.; Naik, S.N. Biomass to liquid: A prospective challenge to research and development in 21st century. Renew. Sustain. Energy Rev. 2011, 15, 4917–4933. [Google Scholar] [CrossRef]
- Kim, K.; Kim, Y.; Yang, C.; Moon, J.; Kim, B.; Lee, J.; Lee, U.; Lee, S.; Kim, J.; Eom, W.; et al. Long-term operation of biomass-to-liquid systems coupled to gasification and Fischer-Tropsch processes for biofuel production. Bioresour. Technol. 2013, 127, 391–399. [Google Scholar] [CrossRef] [PubMed]
- Leibbrandt, N.H.; Aboyade, A.O.; Knoetze, J.H.; Görgens, J.F. Process efficiency of biofuel production via gasification and Fischer–Tropsch synthesis. Fuel 2013, 109, 484–492. [Google Scholar] [CrossRef]
- Buragohain, B.; Mahanta, P.; Moholkar, V.S. Thermodynamic optimization of biomass gasification for decentralized power generation and Fischer–Tropsch synthesis. Energy 2010, 35, 2557–2579. [Google Scholar] [CrossRef]
- Yan, K.; Jarvis, C.; Gu, J.; Yan, Y. Production and catalytic transformation of levulinic acid: A platform for speciality chemicals and fuels. Renew. Sustain. Energy Rev. 2015, 51, 986–997. [Google Scholar] [CrossRef]
- Yan, K.; Liu, Y.; Lu, Y.; Chai, J.; Sun, L. Catalytic application of layered double hydroxide-derived catalysts for the conversion of biomass-derived molecules. Catal. Sci. Technol. 2017, 7, 1622–1645. [Google Scholar] [CrossRef]
- Samavati, M.; Martin, A.; Nemanova, V.; Santarelli, M. Integration of solid oxide electrolyser, entrained gasification, and Fischer-Tropsch process for synthetic diesel production: Thermodynamic analysis. Int. J. Hydrog. Energy 2018, 43, 4785–4803. [Google Scholar] [CrossRef]
- Samavati, M.; Santarelli, M.; Martin, A.; Nemanova, V. Production of Synthetic Fischer-Tropsch Diesel from renewables: Thermoeconomic and Environmental Analysis. Energy Fuels 2017, 32, 1744–1753. [Google Scholar] [CrossRef]
- Mathworks. Matlab V9.1; Mathworks: Natick, MA, USA, 2016. [Google Scholar]
- Aspen Technology. Aspen Plus® V8.8; Aspen Technology: Bedford, MA, USA, 2014. [Google Scholar]
- Samavati, M.; Santarelli, M.; Martin, A.; Nemanova, V. Thermodynamic and economy analysis of solid oxide electrolyser system for syngas. Energy 2017, 122, 37–49. [Google Scholar] [CrossRef]
- European Parliment. Directive 2009/28/EC of the European Parliament and of the Council of 23 April 2009 on the Promotion of the Use of Energy from Renewable Sources and Amending and Subsequently Repealing Directives 2001/77/EC and 2003/30/EC; Official Journal of the European Union: Brussels, Belgium, 2009; pp. 16–62. [Google Scholar]
- O’Brien, J.E.; McKellar, M.G.; Stoots, C.M.; Herring, J.S.; Hawkes, G.L. Parametric study of large-scale production of syngas via high-temperature co-electrolysis. Int. J. Hydrog. Energy 2009, 34, 4216–4226. [Google Scholar] [CrossRef]
- Schulz, H. Short history and present trends of Fischer–Tropsch synthesis. Appl. Catal. A Gen. 1999, 186, 3–12. [Google Scholar] [CrossRef]
- Nexant Inc. Survey and Down-Selection of Acid Gas Removal Systems for the Thermochemical Conversion of Biomass to Ethanol with a Detailed Analysis of an MDEA System Task 1: Acid Gas Removal Technology Survey and Screening for Thermochemical Ethanol Synthesis; Nexant Inc.: San Francisco, CA, USA, 2009. [Google Scholar]
- Selexol|netl.doe.gov 2016. Available online: http://www.netl.doe.gov/research/coal/energy-systems/gasification/gasifipedia/selexol (accessed on 1 February 2016).
- Samavati, M.; Nemanova, V.; Santarelli, M.; Martin, A. Energy and Exergy Analysis of Syngas Production via Biomass Gasification. In Proceedings of the 24th European Biomass Conference and Exhibition, Amsterdam, The Netherlands, 6–9 June 2016; EUBCE Proceedings: Amsterdam, The Netherlands, 2016; pp. 922–928. [Google Scholar]
- Selvatico, D.; Lanzini, A.; Santarelli, M. Low Temperature Fischer-Tropsch fuels from syngas: Kinetic modeling and process simulation of different plant configurations. Fuel 2016, 186, 544–560. [Google Scholar] [CrossRef]
- Glommers MiljöEnergi AB-GME Pellets. Glommers MiljöEnergi AB n.d. Available online: www.glommersmiljoenergi.se (accessed on 5 December 2016).
- Tools for Biomass Chains. S2Biom Proj n.d. Available online: http://www.s2biom.eu/en/ (accessed on 16 January 2017).
- NORDPOOL. Market Data n.d. Available online: http://www.nordpoolspot.com/About-us/ (accessed on 26 May 2017).
- Migan, G.-A. Study of the Operating Temperature of a PV Module; Lund University: Lund, Sweden, 2013. [Google Scholar]
- European Union. PV Potential Estimation Utility. JRC, Eur Commision 2017. Available online: http://re.jrc.ec.europa.eu/pvgis/apps4/pvest.php# (accessed on 9 May 2017).
- Solar Electric Supply. SOLAREX-PHOTOVOLTAIC SOLAR MODULES n.d. Available online: https://www.solarelectricsupply.com/solar-panels/solarex (accessed on 9 May 2017).
- Guo, Z. A simple method to downscale daily wind statistics to hourly wind data. arXiv, 2013; arXiv:1305.3367. [Google Scholar]
- NASA AtSD Center. NASA Surface Meteorology and Solar Energy: Data Subset n.d. Available online: https://eosweb.larc.nasa.gov/cgi-bin/sse/[email protected] (accessed on 9 May 2017).
- Mentis, D.; Hermann, S.; Howells, M.; Welsch, M.; Siyal, S.H. Assessing the technical wind energy potential in Africa a GIS-based approach. Renew. Energy 2015, 83, 110–125. [Google Scholar] [CrossRef]
- Burton, T.; Jenkins, N.; Sharpe, D.; Bossanyi, E. Wind Energy Handbook; Wiley: Hoboken, NJ, USA, 2011. [Google Scholar]
- Vestas. Vestas|Wind It Means the World to Us n.d. Available online: https://www.vestas.com/ (accessed on 9 May 2017).
- Knoema.com. Free Data, Statistics, Analysis, Visualization & Sharing. Knoema.com n.d. Available online: https://knoema.com/ (accessed on 7 January 2017).
Figure 1.
Integrated system schematic.

Figure 2.
Schematic of the SOEC subsystem.

Figure 3.
Schematic of the EG subsystem.

Figure 4.
Schematic of the FT subsystem.

Figure 5.
Electricity supply and demand of (A) Umeå, (B) Stockholm, (C) Turin, (D) Rome.


Figure 6.
Electrical power production potential and consumption of (A) Umeå; (B) Stockholm; (C) Turin; (D) Rome.
Figure 6.
Electrical power production potential and consumption of (A) Umeå; (B) Stockholm; (C) Turin; (D) Rome.


Figure 7.
FT diesel production cost ($/L).

Figure 8.
Comparison between production and consumption of (A) oxygen; (B) carbon dioxide; (C) water; and (D) LGHC in the integrated system.
Figure 8.
Comparison between production and consumption of (A) oxygen; (B) carbon dioxide; (C) water; and (D) LGHC in the integrated system.


Table 1.
Name and specifics of the selected locations.
| City | Umeå | Stockholm | Turin | Rome |
|---|---|---|---|---|
| Region | Northern Sweden | Eastern Sweden | North-western Italy | Central Italy |
| Latitude | 63°49′30″ N | 59°19′46″ N | 45°04′ N | 41°54′ N |
| Longitude | 20°15′50″ E | 18°4′7″ E | 07°42′ E | 12°30′ E |
| Area (km2) | 2317 | 6519 | 1127 | 5352 |
| Population | 120,771 | 2,226,795 | 1,700,000 | 4,353,775 |
Table 2.
MSX-83 PV module characteristics [37].
Table 2.
MSX-83 PV module characteristics [37].
| Parameter | Unit | Value |
|---|---|---|
| Maximum power, PPV,n | W | 83 |
| Voltage at maximum power | V | 17.1 |
| Current at maximum power | A | 4.85 |
| Irradiance at standard test condition, Gstc | W/m2 | 1000 |
| Cell temperature at standard test condition, Tstc | °C | 25 |
| Irradiance at standard operating condition, Gsoc | W/m2 | 800 |
| Ambient temperature at standard operating condition, Tsoc | °C | 20 |
| Nominal operating cell temperature, NOCT | °C | 47 |
| Approximate effect of temperature on power, k | %/°C | 0.5 |
Table 3.
Fact and figures of wind turbine V90-3.0 MW.
| Parameter | Unit | Value |
|---|---|---|
| Rated power, Pt | MW | 3.0 |
| Cut-in wind speed, Uci | m/s | 3.5 |
| Rated wind-speed, Ur | m/s | 15 |
| Cut-off wind speed, Uco | m/s | 25 |
| Hub height, Z | m | 105 |
Table 4.
Base potential of biomass in each region (t/km2) [33].
Table 4.
Base potential of biomass in each region (t/km2) [33].
| Country | Sweden | Italy | ||||||
|---|---|---|---|---|---|---|---|---|
| Region | North | East | North-West | Center | ||||
| Year | 2012 | 2020 | 2012 | 2020 | 2012 | 2020 | 2012 | 2020 |
| Final fellings from nonconifer trees | 5.07 | 5.89 | 10.75 | 12.80 | 45.07 | 42.62 | 44.88 | 44.38 |
| Final fellings from conifer trees | 45.53 | 45.48 | 60.38 | 60.94 | 1.71 | 1.73 | 0.55 | 0.62 |
| Thinnings from nonconifer trees | 4.40 | 4.37 | 10.77 | 10.54 | 6.32 | 6.01 | 6.30 | 5.94 |
| Thinnings from conifer trees | 28.34 | 29.04 | 38.16 | 39.55 | 5.64 | 5.30 | 2.12 | 2.05 |
| Total | 83.34 | 84.78 | 120.07 | 123.84 | 58.75 | 55.66 | 53.85 | 52.99 |
| Average | 84.06 | 121.95 | 57.20 | 53.42 | ||||
Table 5.
FT diesel production potential and emission savings.
| City | Annual Diesel Demand, GWh | Annual Diesel Supply, GWh | Percentage, (%) | Emission Saving, (%) | |||
|---|---|---|---|---|---|---|---|
| SOEC | EG | GTS | Total | ||||
| Umeå | 553 | 12.2 | 165.6 | 0.2 | 177.6 | 32.1 | 98.0 |
| Stockholm | 10,202 | 104.0 | 665.7 | 1.4 | 768.3 | 7.5 | 99.6 |
| Turin | 6969 | 9.9 | 54.7 | 3.4 | 61.2 | 0.9 | 100.2 |
| Rome | 17,848 | 69.0 | 241.4 | 1.9 | 308.5 | 1.7 | 102.0 |
© 2018 by the authors. Licensee MDPI, Basel, Switzerland. This article is an open access article distributed under the terms and conditions of the Creative Commons Attribution (CC BY) license (http://creativecommons.org/licenses/by/4.0/).
Share and Cite
MDPI and ACS Style
Samavati, M.; Martin, A.; Santarelli, M.; Nemanova, V. Synthetic Diesel Production as a Form of Renewable Energy Storage. Energies 2018, 11, 1223. https://doi.org/10.3390/en11051223
AMA Style
Samavati M, Martin A, Santarelli M, Nemanova V. Synthetic Diesel Production as a Form of Renewable Energy Storage. Energies. 2018; 11(5):1223. https://doi.org/10.3390/en11051223
Chicago/Turabian StyleSamavati, Mahrokh, Andrew Martin, Massimo Santarelli, and Vera Nemanova. 2018. "Synthetic Diesel Production as a Form of Renewable Energy Storage" Energies 11, no. 5: 1223. https://doi.org/10.3390/en11051223
Note that from the first issue of 2016, this journal uses article numbers instead of page numbers. See further details here.