Energy Efficiency of China’s Iron and Steel Industry from the Perspective of Technology Heterogeneity

1
School of Economics and Management, University of Science and Technology Beijing, Beijing 100083, China
2
Department of development and science and technology, China Iron and Steel Association, Beijing 100711, China
3
School of Economics and Management, Tsinghua University, Beijing 100084; China
*
Author to whom correspondence should be addressed.
Energies 2018, 11(5), 1247; https://doi.org/10.3390/en11051247
Submission received: 14 March 2018
/
Revised: 20 April 2018
/
Accepted: 1 May 2018
/
Published: 14 May 2018
(This article belongs to the Special Issue Industrial Energy Efficiency 2018)
Abstract
:This paper investigates energy efficiency with the presence of undeniable outputs, efficiency gaps across regions, and determinants of inefficiency of the Chinese Iron and Steel (IS) industry by combining hybrid measure technology and the meta-frontier approach. Empirical results obtained from analyses based on panel data spanning 2010–2015 reveal the necessity of green transition of the IS industry. Simultaneously addressing power supply, environmental impacts, and value creation of energy is still one of the most formidable challenges facing the IS industry nowadays. Moreover, distinct spatial heterogeneity in technology exists extensively across the regions. Energy efficiency of the IS industry in the eastern region performed the best, whereas the central and western areas fell behind due to the intension of managerial failure and expansion of the technology gap. Based on the findings, general and regional-specific policy implications and suggestions are posited.
1. Introduction
With its significant economic, environmental, and strategic attributes, efficient and green utilization of energy resources is central to sustainability and continuous prosperity for society at all levels. Enhancement of energy efficiency is identified as the key strategy as well as a critical approach to achieving green growth by the international society [1]. As the biggest emerging country in the world, China’s economic development has made remarkable achievements but they have come at the expense of extensive energy consumption and environmental degradation. Among all the sectors, the iron and steel (IS) industry has been one of the most energy-intensive and environmental-damaging industries, along with the industrialization, urbanization, and internationalization in the country.
Being the largest iron and steel producer worldwide, China’s IS sector is facing dual pressures from domestic and abroad to become “green”, especially in the “post-financial crisis era” and the “post-Copenhagen era” [2]. Internationally, the Chinese IS sector contributed almost half of the total carbon emissions of the global IS sector, accounting for about 29.3% of global coal consumption, and is the largest final energy consumer worldwide (249 MTOE) followed by India (55.2 MTOE), Russia (32 MTOE), Japan (22.2 MMTOE), and the United States (16 MTOE) [3]. Nationally, according to the China energy statistics yearbook, the yearly proportion of the IS’s energy consumption was about 15% of national total energy consumption in 2015 and the industry ranked as the third largest industrial CO2 emitter in China [4]. Although the IS industry has achieved important efficiency gains during the past two decades due to technical progress and policy guidance [5], the energy utilization efficiency is still lower compared to advanced economics and even the average standard globally [6,7]. Thus, energy efficiency improvement of the IS industry plays a significant role in facilitating the green growth and development of the sector and even the macro economy as a whole. Against this background, the 12th five year plan for the Chinese IS industry released in 2011 set explicit targets on IS industrial resource efficiency by indicating that the comprehensive energy consumption per ton of steel should reach 580 kg standard coal equivalent and the comprehensive utilization of industrial solid waste should be 97% [8]. In the meantime, green transition of resource-intensive industries with high environmental impacts, including the IS industry, was emphasized in the national strategy of “Made in China 2025”. Therefore, a comprehensive estimation of efficiency level, observation of regional efficiency differences, and identification of efficiency gap determinants are in great need to help the Chinese IS sector achieve efficiency gains.
The remainder of this paper is organized as follows. Section 2 provides an overview of literature and research gaps. Section 3 illustrates the methods and models used for efficiency measurement while Section 4 presents selected input- and output variables, the data set, and empirical results. Section 5 provides the conclusion and some policy recommendations.
2. Literature Review
Two oil crises in the 1970s directed attention worldwide to energy efficiency. In light of energy security and safety, approaches and paths for improving the economic efficiency of energy sources were extensively discussed. Various energy efficiency indicators were introduced to measure the level of energy utilization to offer policy suggestions regarding energy management [9]. Among others, energy intensity (EI), measured as energy consumption per unit of GDP, was introduced and applied on both macro, mezzo, and micro levels [10]. Based on the concepts of total factor productivity (TFP) and Data Envelopment Analysis (DEA), the total factor energy efficiency (TFEE) concept was developed by Hu & Wang in 2006 [11]. This updated framework addresses the shortcomings of EI by incorporating capital and labor inputs into the estimation, as opposed to considering single contribution of energy itself.
In the 1980s, negative externalities of energy application received great attention in both theory and practice. Climate change caused by greenhouse gas (GHG) emissions mainly coming from fossil fuel combustion has been identified as a “wicked problem” and is currently the focus of intra-governmental negotiations [12]. Against this background, energy efficiency gains have been identified as the key approach to conserve resources and reduce emissions simultaneously [13,14,15,16]. Undesirable outputs introduced by energy consumption such as carbon emissions, sulfur dioxide emissions, waste water, or smoke dusts have been incorporated into industrial efficiency evaluation frameworks in recent years [17,18], and the absence of energy-related undeniable outputs could result in biased efficiency estimations. There are a number of examples of this [19]. Özkara and Atak levered four DEA-based models to evaluate regional total-factor energy efficiency with the presence of emissions and pollutants of manufacturing industry in Turkey [20] while Wu et al. constructed a two-stage DEA model to investigate the efficiency level of Chinese industries considering emission of pollutants during the process of value adding [21]. Zhang et al. used crude steel production as expected good output and sulfur dioxide emissions as undesirable bad output to compare IS firms’ energy efficiencies in Asian countries using a SBM (slack based measure)-undesirable DEA model [22]. Perez et al. compared three types of DEA models in dealing with undeniable outputs when investigating energy efficiency of the Chilean manufacturing industry [23].
Collectively, in terms of analytical framework, environmental impacts have been considered when estimating energy efficiency to reflect the concept of green development [24], however proxies of such externalities vary from research to research. In terms of analytical methods, DEA-based techniques have become the most mature and widely-used approaches to conduct the measurement, yet few studies have been done using hybrid techniques of DEA. In terms of analytical perspective, regional differences of energy efficiency have been noticed [25], but little research has been done regarding the significance of efficiency gaps or the heterogeneous determinants of inefficiency in various regions. This paper aims to enrich the existing literature in the following facets: first, a state-of-the-art undesirable hybrid measure is utilized to evaluate energy efficiency with the constraints of typical wastes; second, heterogeneity of regional production technologies is considered to investigate efficiency gaps among regions as well as potential in efficiency gains of eastern, central, and western China; and last but not least, decomposition of energy inefficiency is conducted to identify divergent determinants of efficiency loss of various regions. In doing so, context-specific suggestions are proposed to enhance efficiency gains of the IS industry.
3. Methods and Models
3.1. Hybrid Measure of Efficiency
The Data Envelopment Analysis (DEA) approach, a non-parametric linear programming method, is employed to finish the efficiency evaluation [26]. The main branches of DEA approaches are radial and non-radial measures that are represented by the CCR (Charnes, Cooper, and Rhodes) model and the SBM (slack-based measure) model, respectively [27]. However, the former ones have a strict assumption of proportionate contraction and so cannot handle undesirable outputs properly, while the latter ones have looser assumptions on proportional change and fail to match calculation results with actual situations when processing positive and zero values [28]. In order to address the drawbacks of the aforementioned problems, Tone and Tsutsui proposed hybrid measure models that combine radial and non-radial measures and can deal with undesirable outputs simultaneously [29]. This study proposes an Undesirable-Hybrid-Measure (UHM) model by referencing [30] based on the basic models offered by Tone and Tsutsui. Energy efficiencies of decision-making units (DMUs, the term is loosely used for organizations, plants, or firms, etc., and represents the IS firms in this study) with bad outputs are conducted.
The programming formula for any decision-making unit DMU0 is expressed as follows [30]:
where is the efficiency value of a given DMU0, while λ, m, and s are the intensity vector, input number, and output number, respectively. Additionally, θ, φ, and ϕ are radial parameters of the model while S is short for Slacks, respectively. “NRg” and “NRb” are the abbreviations of “non-radial good (i.e., desirable)” and “non-radial bad (i.e., undesirable)”, respectively. Further, and are the input and output metrics. Hence, the input matrix can be decomposed into a radial part as and a non-radial part as with . Analogously, the output matrix will be re-decomposed into the desirable radial part, undesirable radial part, desirable non-radial part, and undesirable non-radial part as , , , and , respectively. An envelope frontier or “best practice” in the set of DMUs, is then formed to indicate the efficiency level of each DMU. Here, a DMU at the frontier will have an efficiency ratio of 1, whereas those located under the frontier with efficiency values between 0 and 1 are relatively inefficient [31,32].
3.2. Meta Frontier Analysis
Traditional DEA analyses take all DMUs unanimously, neglecting the heterogeneity of production technologies among objects under observation. However, divergent context settings in the real world—including economic scale, resource endowment, industrial structure, market conditions, legal constraints, degrees of openness, and geographical environment—usually result in divergent technologies selections of DMUs, which is also known as “heterogeneity of production technology”. Against this background, Hayami and Ruttan [33] proposed a meta-production function to incorporate technological differences among economies into a productivity evaluation. O’Donnell et al. [34] further combined the meta-frontier concept with the DEA method, which has laid the foundation of meta-frontier efficiency estimation and has been used to investigate efficiency gaps and enhancement potential of divergent DMUs [35].
Regional production technology is directly related to the level of its economic development, and technology diffusion usually follows a geographically contiguous pattern [36]. In light of the regional economic development differences in China, this paper utilizes the meta-frontier approach to identify IS industrial efficiency in different areas. Therefore, all DMUs (i.e., IS firms being observed) in this study are divided into multiple sub-groups according to their locations. In so doing, two productivity frontiers (i.e., meta-frontier and group frontier) are formulated and indicated by and , respectively. The meta-frontier consists of all the DMUs, whereas a group-frontier only includes DMUs in a given group. Technological gaps between actual efficiency (i.e., efficiency scores estimated under a group frontier) and potential efficiency (i.e., efficiency scores estimated under the meta-frontier with all DMUs as subject) are then estimated to identify the DMUs’ potential efficiency gains. The meta-frontier methods are also applicable to observe the inefficiency causes of divergent groups.
All the DMUs in this study are divided into k (k = 3) groups by their geographic locations, namely the eastern, central, and western China. Two production technology sets, and are then obtained and (i.e., ∈). For any group k, if there is (m1, m2, s1, s2, s3, s4) ∈ , thus (m1, m2, s1, s2, s3, s4) ∈ . Energy efficiency derived under the meta-frontier and energy efficiency derived under a group frontier are represented as MEE (meta-frontier’s energy efficiency) and GEE (group-frontier’s energy efficiency), respectively. Accordingly, the technology gap ratio (TGR) for any DMUn in group k can be drawn using the following formula:
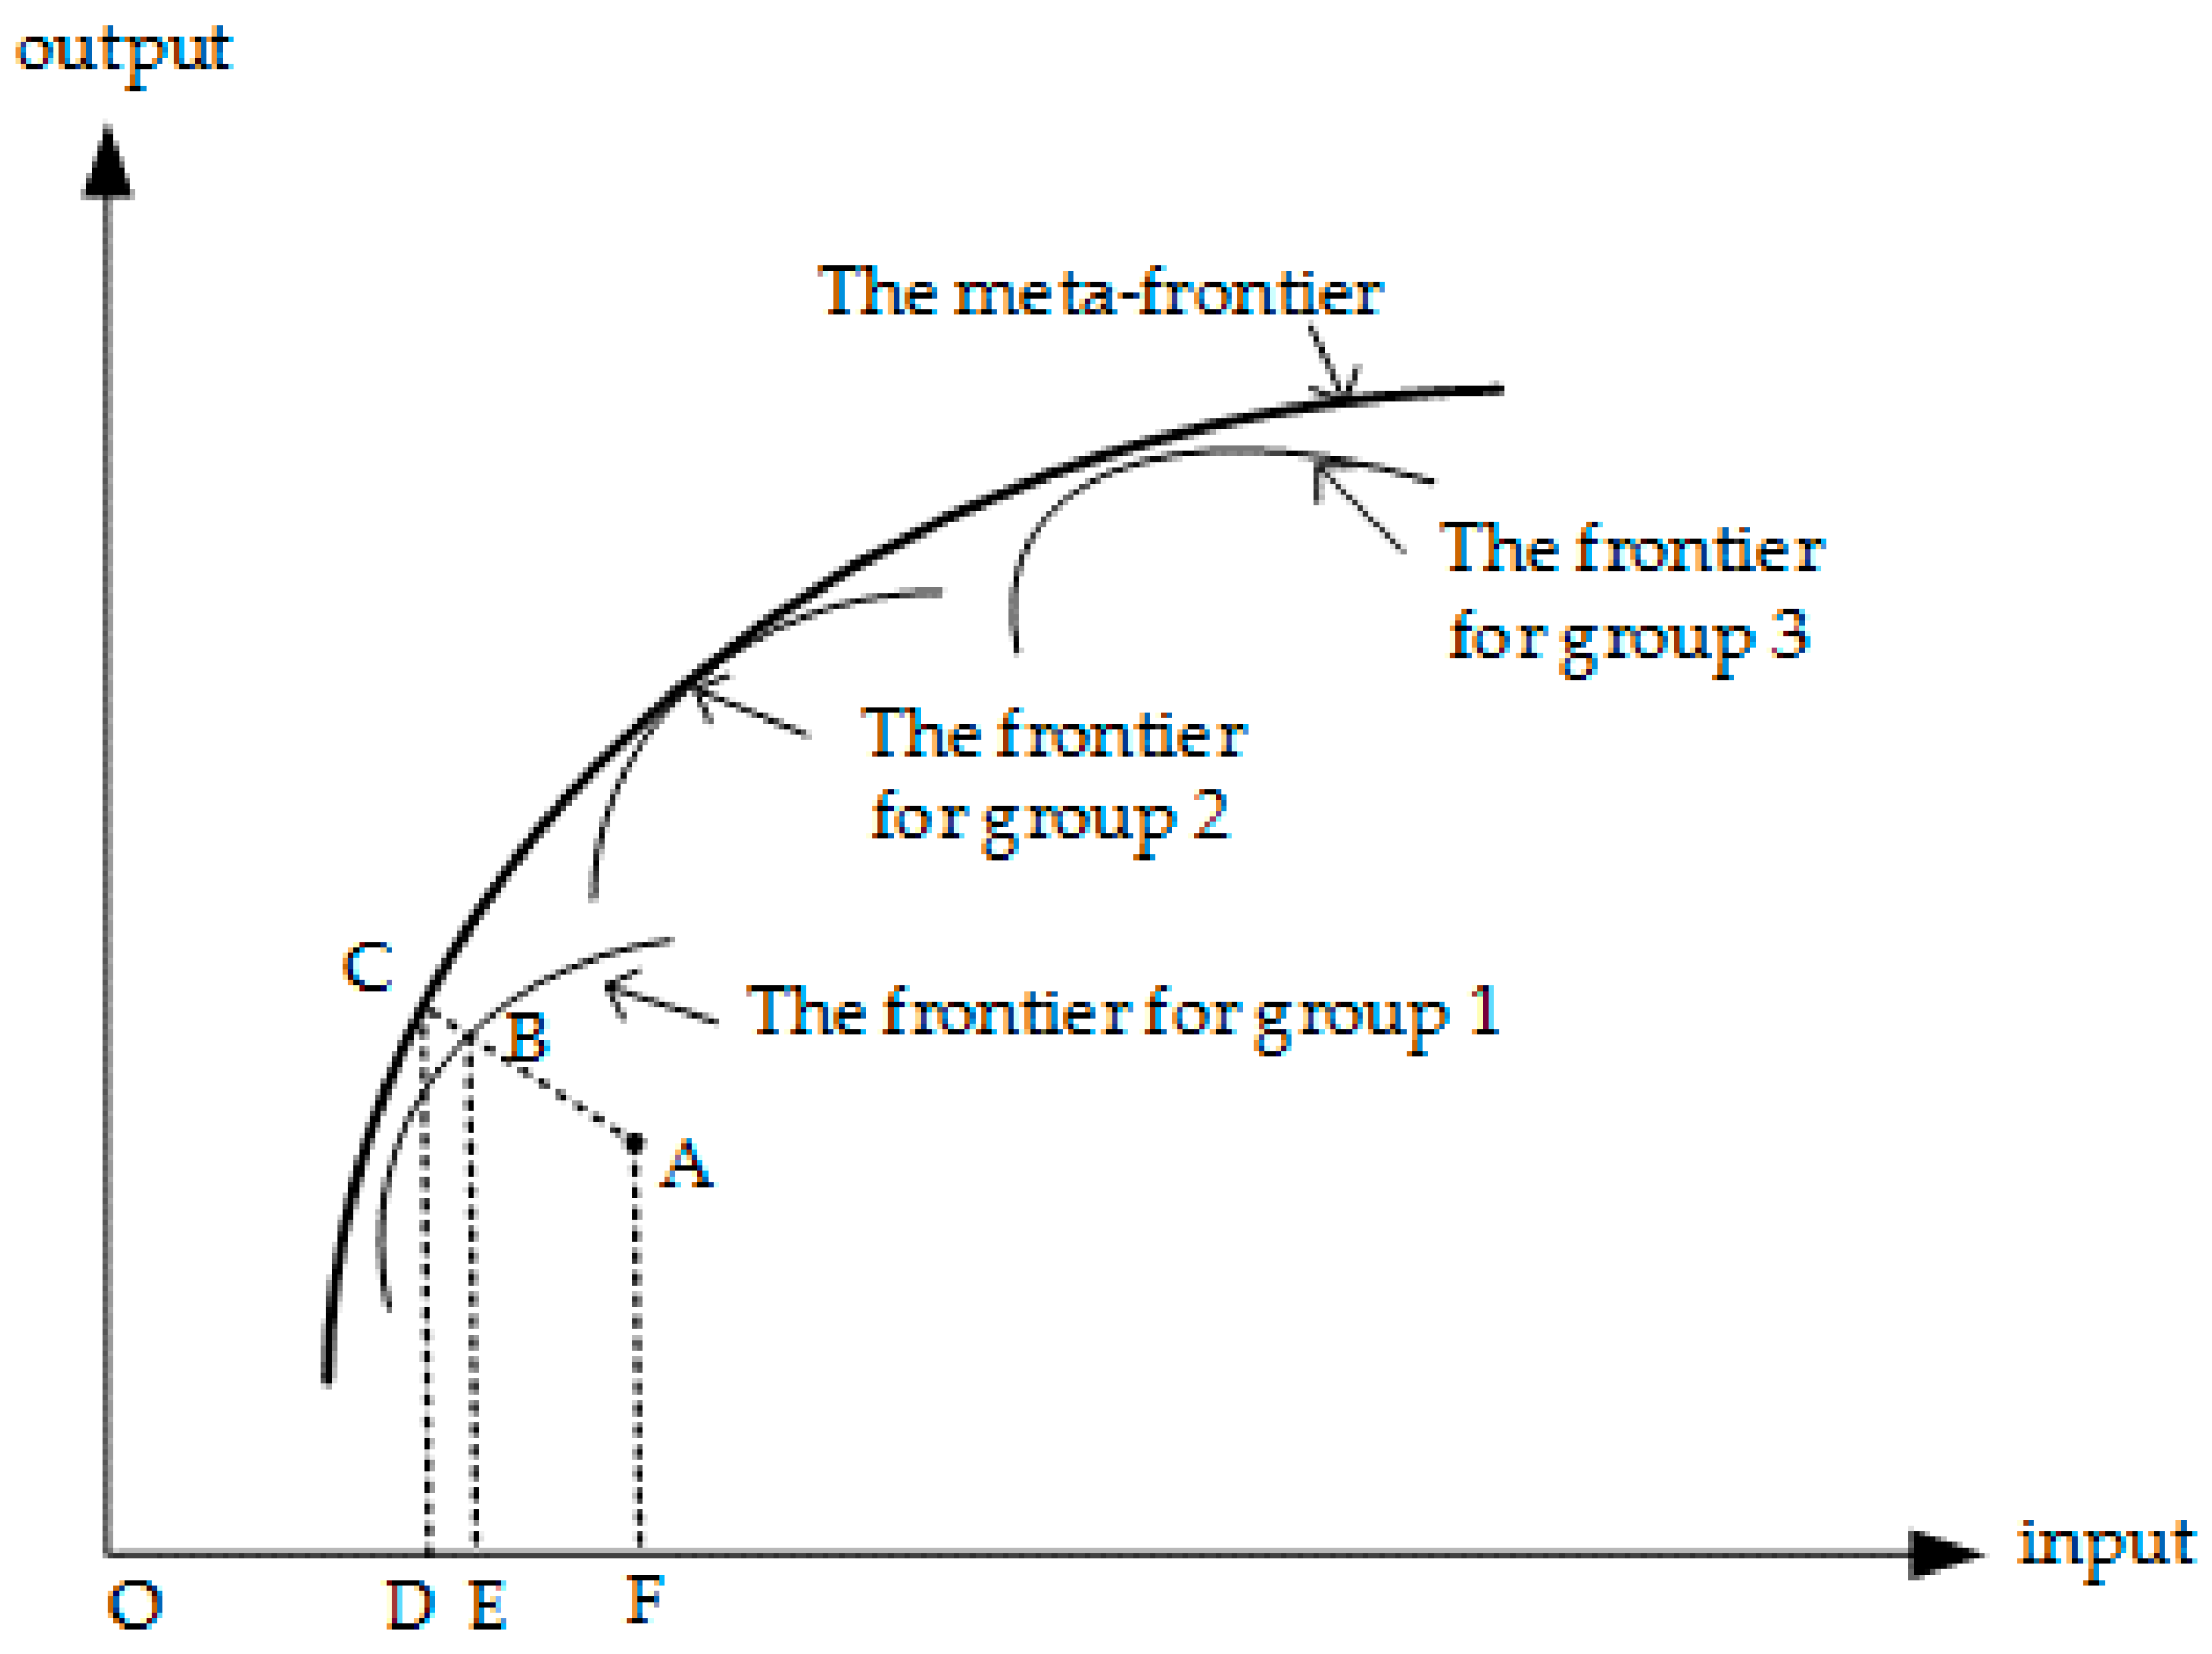
where and are energy efficiency calculated based on meta production set and group production set by means of the Undesirable Hybrid Model in Equation (1), respectively. TGR derived from Equation (3) represents the difference between energy efficiency of the nth firm in the kth group under two frontiers. Apparently, the efficiency obtained under the meta-frontier with all DMUs as peers is no higher than that obtained under group frontier with only DMUs within a certain group as peers, and ≤ (i.e., TGR ∈ (0, 1]). The more TGR close to 1, the smaller efficiency gap is, and vice versa. The smaller TGR is, the efficiency gain potential is bigger. Figure 1 illustrates the concepts of meta-frontier, group frontiers, and technology gap ratio.
Assume that a certain DMU belongs to group 1 and operates on point A. The projection of A under the group frontier and meta-frontier is B and C, respectively. The CEE of the DMU is equal to the ratio of OE/OF when measured relative to group 1’s frontier, and the MEE of the DMU is equal to OD/OF when measured relative to the meta-frontier. The TGR of point A is then measured by the ratio of OD/OE [35].
Furthermore, total efficiency loss caused by TGR is expressed as energy inefficiency relative to the meta-frontier (MTI). MTI consists of technological gap inefficiency (TGI) and managerial inefficiency (MI) [37].
where values of TGI and MI are all between 0 and 1, and the smaller the better.
Generally, technology inefficiency originates from technology gaps among different regions and can be addressed through technology spillover and/or self-dependent innovation. Managerial failure is usually introduced by inefficiency of resource allocation. For example, inefficient utilization of fossil fuels will not only directly result in large amounts of carbon emissions, but will also lead to the release of indirect pollutions during the production, transportation, and consumption processes. Government inefficiency or a lack of government regulation on energy and environmental administration also contribute to managerial failure and cause efficiency loss in general.
4. Empirical Analyses
4.1. Variables and Data
Considering the accuracy and availability of financial, energy, and environmental data, this paper collects data from 51 Chinese IS firms located in eastern, central, and western China during 2010–2015. The sample covers the major IS enterprises in the country and accounts for more than two thirds of yearly total crude steel, while the time window covers a critical phase including the 12th Five-Year period after the global financial crisis, resulting in a high reliability and validity of the research design [38].
Identifying key features of variables in multi-criteria decision making analysis is critical [39]. To evaluate the energy efficiency of the Chines IS industry, this study chooses the following variables as proxies of inputs and outputs following the studies of [40,41]. Furthermore, to fulfill the aforementioned research gap, the radial and non-radial attributes of variables are also identified by referencing [42]. For any firm in a given year, it uses non-radial inputs of capital (represented by net fixed assets), labor (represented by number of employees by the end of year) and radial input of energy (represented by total energy consumption) to generate non-radial expected output of economic income (represented by value added of products) and radial undesirable output of environmental impacts (i.e., typical constraints represented by the three industrial wastes, namely, waste gas, waste water and solid waste).
The statistical definitions of the variables are defined by the China Iron and Steel Association (CISA). For example, waste water contains volatile phenol, cyanide, petroleum, suspended matter, and ammonia nitrogen. Solid waste includes steel slag, blast furnace slag, and dust sludge. Waste gas mainly consists of sulfur dioxide, smoke and dust, and nitrogen oxides [43]. The data are obtained from the following reports: the Environmental Protection Statistics of China’s Iron and Steel Industry, Annual Financial Report of Large and Medium-sized Metallurgical Enterprises [44], and Statistics on Energy Conservation and Environmental Protection of China’s Iron and Steel Industry [45]. In total, 357 observations are collected to finish the empirical tests in the study, and a statistical description of the sample is presented in Table 1.
4.2. Estimation of Energy Efficiency
Energy efficiency scores under both meta-frontier (i.e., MEE) and group-frontier (i.e., GEE) of the firms are estimated based on the UHM and meta-frontier models discussed in Section 3. Specifically, the concept and method of meta-frontier analysis allows us to discuss empirical results on both national and regional levels. Furthermore, the output-oriented model is chosen as the calculations can reflect the concept of delivering greater value (i.e., economic output) with lesser environmental impacts (i.e., industrial pollution) [46,47]. The results of the yearly average mean of MEE, GEE, and TGR of China’s IS and IS in different regions are reported in Table 2.
The results in Table 2 shows that energy efficiency scores of China’s IS industry ranged from 0.53 to 0.7 during the observation period but dropped in 2012 and 2015. Due to the after effect of the “$4 trillion investment” in 2009 and 2010, the IS industrial capacity utilization reached a low point when the market demand declined in 2011 and 2012 [48]. Despite rebounding in 2013–2014, the national industrial efficiency score dropped dramatically in 2015 due to dual challenges coming from strict environmental regulations represented by the new Environmental Protection Law released in 2014 and the decline in both demand and production price during 2014–2015 [49]. In addition, regional differences of energy usage capacity were also significant when the meta-technology set was used as the basis of evaluation. Firms in eastern areas performed best with an average mean of 0.72, followed by firms in central areas with an average mean of 0.67. Firms in western China were not energy-efficient compared to firms in the other regions.
Although trivial distinctions were found among the three regions under the group-technology set when the efficiency scores (i.e., the GEE) of the three regions were all in the range of [0.73, 0.87], the differences between efficiency scores of the two frontiers are considerable, especially for the western IS industry. As can be seen in Table 2, the average technology gap ratios (TGRs) of firms in the west were only 0.65, whereas the TGRs of the eastern firms almost reached 1. This outcome demonstrates that the eastern areas took a lead in terms of technology level, and the other two areas fell behind. Regarding the changes of TGR scores, technology gaps between firms in central China were shrinking, whereas the technology gaps between firms in western areas were widening over time. This outcome implies that firms in central regions had been moving towards the best technology frontier (i.e., the best efficiency level/production technology related to the meta-frontier), whereas firms in western regions had been moving away from the best technology frontier. A Kruskal–Wallis rank sum test was then utilized to investigate the differences of TGRs among the regions, and the null hypothesis was rejected at a significant level of 1%, indicating the remarkable existence of technology heterogeneity across the three grant regions [50]. This outcome also implies the existence of an “energy curse” in western China. Fortunately, a great potential of efficiency gains for firms in the undeveloped areas was identified as well.
4.3. Decomposition of Energy Inefficiency
To identify causes of energy inefficiency as well as total efficiency loss for the IS industry in various regions, the paper further employs Equations (4)–(6) to obtain the technological gap inefficiency (TGI), managerial inefficiency (MI), and meta total inefficiency (MTI) of the IS firms. The average mean of scores of TGI, MI, and MTI on national level and regional level are presented in Table 3.
It can be seen from Table 3 that the average mean of efficiency loss (MTI) of the Chinese IS industry was about 0.35 during the observation period, and the MTI was relatively large in 2012 and 2015, respectively. This outcome is also consistent with the findings on MEE in the previous section. On average, technology failure and managerial failure accounted for about 39% and 61% of efficiency loss, respectively. Accordingly, allocative efficiency and managerial capability of IS industrial administration should be given more weight compared to technological innovation in the field.
For the eastern IS industry, the MTI was rather low with an average mean of 0.277, and the efficiency loss in the area mostly originated from managerial failure, as it accounted for more than 97 percent of energy loss, as opposed to technical inefficiency. A similar situation also happened in IS firms in the central areas as technological inefficiency and managerial inefficiency contributed about 72.7% and 27.3% to efficiency loss, respectively. On the other hand, energy inefficiency in the western areas was caused mainly by lagging technology, accounting for about 70 percent of the recorded efficiency loss. The managerial failure cost was relatively low in the western areas and accounted for about 30 percent of the efficiency loss.
Results obtained in this section show that technology diffusion between firms of the developed areas and the more backward areas will contribute to efficiency gains in the non-eastern regions, especially in the west. Meanwhile, improvement in allocative efficiency and energy-environmental administrative capacity will play more important roles than technical progress does in efficiency gains for firms in the advanced regions, especially the eastern provinces (cities).
5. Conclusions and Policy Implications
5.1. Conclusions and Discussion
This paper explores the energy efficiency and the inefficiency causes of the Chinese IS industry during the period of 2010–2015 from the perspective of technology heterogeneity. Undesirable hybrid measure is combined with meta-frontier analysis in the paper to estimate energy efficiency with the presence of undesirable environmental impacts, changing trends of efficiency stages in divergent regions, efficiency gaps across the country, and divergent causes for efficiency loss in various areas.
The empirical tests reveal interesting findings regarding the Chinese IS industry during the observation period:
- ●
- Existence of energy trilemma. Collectively, a slight declining trend was found for energy efficiency with the presence of environmental impacts of the industry, indicating the energy trilemma (i.e., simultaneously achieve value creation, energy saving, and pollution abatement) faced by the industry is still grave and the green transition target of the industry is also imperative.
- ●
- Regional differences and efficiency gains potential. The average efficiency level of the IS industry in eastern areas was the highest, followed by central and western areas, indicating a notable advantage of firms in advanced regions and a large potential in backward provinces (cities) regarding energy conservation and emission reduction.
- ●
- Widening of technology gaps. Technology gaps across the three grant regions were notable with the advanced areas holding the best practice frontier and the backward regions away from the optimal frontier.
- ●
- Divergent causes of inefficiency. The causing factors of efficiency loss were also divergent in different contexts as MTIs in eastern and central China were attributed to managerial failure, yet the MTIs in western China were attributed to technology inefficiency. Consequently, the west could significantly improve efficiency by addressing the technology gaps, while the central and eastern regions should pay more attention to managerial enhancement.
5.2. Suggestions for Efficiency Gains
General and context-specific policy suggestions are further posited in the following part based on the implications of the empirical analyses.
First, the green development strategy in the IS industry should be reinforced. The concept of “Greenization” was coined as the fifth national development strategy in 2015, followed by a distinct formulation of “green development” in the 19th session of National Congress of the CPC in 2017 [51]. For the IS industry, a series of administrative instructions aimed at energy-saving and emission reduction can be found in the 12th five-year plan for the IS industry, the “de-capacity” policy, and revised norms of the IS industry [52]. However, holistic guidance and a roadmap are still absent. Therefore, a comprehensive green development strategy as well as multi-stage, multi-dimensional, and multi-scale plans are in great need to steer the transition of the industry.
What’s more, green governance of the IS industry should be enhanced. As inferred from the empirical findings, managerial failure accounts for a remarkable proportion of energy inefficiency both on national and regional levels, especially for the advanced areas. Against this background, priorities should not only be given to technology progress and production capacity, but also to governance capability. Advanced managerial concepts, strategies, and approaches including proactive environmental strategies, corporate social responsibility management, and environmental management systems should be advocated on macro, mezzo, and micro levels. Meanwhile, the focus of future work should also include further promotion of market-oriented reforms and toolkits represented by ownership structure reform, energy price reform, and carbon pricing schemes.
Finally, green technology spillover effects should be encouraged. The Chinese government has committed to promoting technology innovation and fostering balanced regional development. Technology progress, especially the innovation, utilization, and expansion of cleaner production and pollution abatement technologies, has contributed greatly to the productivity enhancement of the IS industry. However, regional technology distance has widened over time, causing major efficiency loss and harming the development of the industry as a whole. Therefore, spillover effects associated with advanced technology of energy conservation and emission reduction originating from advanced areas should be further emphasized to narrow the gaps to boost the green transition of the Chinese IS industry.
Author Contributions
Xiaoling Wang conceived of the research, undertook data collection and analysis, and drafted the article. Linfeng Zhang contributed significantly to the research design, data collection, and result interpretation. Feng He and Lili Chen played important roles in research positioning, manuscript development, and article revision.
Acknowledgments
The authors are grateful for the support provided by the National Natural Science Foundation (NSF) of China (71704010, 71771024, 71320107006, 71673022, and41701621).
Conflicts of Interest
The authors declare no conflict of interest.
References
- OECD. OECD Green Growth Studies. In Energy; OECD Publishing: Paris, France, 2012. [Google Scholar]
- Wang, P.; Dai, H.-C.; Ren, S.-Y.; Zhao, D.-Q.; Masui, T. Achieving Copenhagen target through carbon emission trading: Economic impacts assessment in Guangdong Province of China. Energy 2015, 79, 212–227. [Google Scholar] [CrossRef]
- International Energy Agency. Key World Energy Statistics; IEA: Paris, France, 2017. [Google Scholar]
- Xu, W.; Wan, B.; Zhu, T.; Shao, M. CO2 emissions from China’s iron and steel industry. J. Clean. Prod. 2016, 139, 1504–1511. [Google Scholar] [CrossRef]
- Zhang, F.; Huang, K. The role of government in industrial energy conservation in China: Lessons from the iron and steel industry. Energy Sustain Dev. 2017, 39, 101–114. [Google Scholar] [CrossRef]
- Lin, B.; Wu, Y.; Zhang, L. Estimates of the potential for energy conservation in the Chinese steel industry. Energy Policy 2011, 39, 3680–3689. [Google Scholar] [CrossRef]
- Hasanbeigi, A.; Price, L.; Zhang, C.; Aden, N.; Li, X.; Shangguan, F. Comparison of iron and steel production energy use and energy intensity in China and the U.S. J. Clean. Prod. 2014, 65, 108–119. [Google Scholar] [CrossRef]
- Ministry of Industry and Information Technology. 12th Five-Year Development Plan for Iron and Steel Industry; MIIT: Beijing, China, 2011. [Google Scholar]
- Ang, B.W. Monitoring changes in economy-wide energy efficiency: From energy-GDP ratio to composite efficiency index. Energy Policy 2006, 34, 574–582. [Google Scholar] [CrossRef]
- Patterson, M.G. What is energy efficiency? Concepts, indicators and methodological issues. Energy Policy 1996, 24, 377–390. [Google Scholar] [CrossRef]
- Hu, J.L.; Wang, S.C. Total-factor energy efficiency of regions in China. Energy Policy 2006, 34, 3206–3217. [Google Scholar] [CrossRef]
- Levin, K.; Cashore, B.; Bernstein, S.; Auld, G. overcoming the tragedy of super wicked problems: Constraining our future selves to ameliorate global climate change. Policy Sci. 2012, 45, 123–152. [Google Scholar] [CrossRef]
- Ayukawa, Y.; Naoyuki, Y.; Chen, D.M.; Chestin, L.; Kokorin, A.; Denruyter, J.-P.; Fabbri, M.; Kendall, G.; Gamblin, P.; Mallon, K.; et al. Climate Solutions: WWF’s Vision for 2050; WWF: Washington, DC, USA, 2008. [Google Scholar]
- Edmonds, J.A.; Wise, M.W.; Dooley, J.J.; Kim, S.H.; Smith, S.J.; Runci, P.J.; Clarke, L.E.; Malone, E.L.; Stokes, G.M. Global Energy Technology Strategy: Addressing Climate Change Phase 2—Findings from an International Public-Private Sponsored Research Program; Battetlle Memorial Institute: College Park, MD, USA, 2007. [Google Scholar]
- Metz, B.; Davidson, O.R.; Bosch, P.R.; Meyer, D.L.A. Contribution of working group III to the Fourth Assessment Report of the Intergovernmental Panel on Climate Change. In Philosophy; Cambridge University Press: Cambridge, UK; New York, NY, USA, 2007; pp. 171–175. [Google Scholar]
- Pacala, S.; Socolow, R. Stabilization wedges: Solving the climate problem for the next 50 years with current technologies. Science 2004, 305, 968–972. [Google Scholar] [CrossRef] [PubMed]
- Seiford, L.M.; Zhu, J. A response to comments on modeling undesirable factors in efficiency evaluation. Eur. J. Oper. Res. 2005, 161, 579–581. [Google Scholar] [CrossRef]
- Zhou, P.; Ang, B.W. Linear programming models for measuring economy-wide energy efficiency performance. Energy Policy 2008, 36, 2911–2916. [Google Scholar] [CrossRef]
- Mandal, S.K. Do undesirable output and environmental regulation matter in energy efficiency analysis? Evidence from Indian Cement Industry. Energy Policy 2010, 38, 6076–6083. [Google Scholar] [CrossRef]
- Özkara, Y.; Atak, M. Regional total-factor energy efficiency and electricity saving potential of manufacturing industry in Turkey. Energy 2015, 93, 495–510. [Google Scholar] [CrossRef]
- Wu, J.; Xiong, B.; An, Q.; Sun, J.; Wu, H. Total-factor energy efficiency evaluation of Chinese industry by using two-stage DEA model with shared inputs. Ann. Oper. Res. 2015, 255, 1–20. [Google Scholar] [CrossRef]
- Zhang, C.; He, W.; Hao, R. Comparative analysis of Asian main iron and steel countries’ total factor energy efficiency. Curr. Sci. 2017, 112, 2226. [Google Scholar] [CrossRef]
- Perez, K.; González-Araya, M.C.; Iriarte, A. Energy and GHG emission efficiency in the Chilean manufacturing industry: Sectoral and regional analysis by DEA and Malmquist indexes. Energy Econ. 2017, 66, 290–302. [Google Scholar] [CrossRef]
- Li, L.B.; Hu, J.L. Ecological total-factor energy efficiency of regions in China. Energy Policy 2012, 46, 216–224. [Google Scholar] [CrossRef]
- Lin, B.; Wang, X. Exploring energy efficiency in China׳s iron and steel industry: A stochastic frontier approach. Energy Policy 2014, 72, 87–96. [Google Scholar] [CrossRef]
- Lee, K.H.; Farzipoor, S.R. Measuring corporate sustainability management: A data envelopment analysis approach. Int. J. Prod. Econ. 2012, 140, 219–226. [Google Scholar] [CrossRef]
- Tone, K. A Hybrid Measure of Efficiency in DEA; GRIPS Research Report Series; GRIPS: Tokyo, Japan, 2004. [Google Scholar]
- Ai, H.; Deng, Z.; Yang, X. The effect estimation and channel testing of the technological progress on China’s regional environmental performance. Ecol. Indic. 2015, 51, 67–78. [Google Scholar] [CrossRef]
- Tone, K.; Tsutsui, M. 1-C-1 Dealing with Undesirable Outputs in DEA: A Hybrid Measure of Efficiency Approach; The Operations Research Society of Japan: Tokyo, Japan, 2006. [Google Scholar]
- Zhang, Y.; Jin, P.; Feng, D. Does civil environmental protection force the growth of China’s industrial green productivity? Evidence from the perspective of rent-seeking. Ecol. Indic. 2015, 51, 215–227. [Google Scholar] [CrossRef]
- Charnes, A.; Cooper, W.; Rhodes, E. Measuring the efficiency of decision making unites. Eur. J. Oper. Res. 1978, 2, 429–444. [Google Scholar] [CrossRef]
- Dilts, D.M.; Zell, A.; Orwoll, E. A Novel Approach to Measuring Efficiency of Scientific Research Projects: Data Envelopment Analysis. CTS Clin. Transl. Sci. 2015, 8, 495–501. [Google Scholar] [CrossRef] [PubMed]
- Hayami, Y.; Ruttan, V.W. Agricultural productivity differences among countries. Am. Econ. Rev. 1970, 60, 895–911. [Google Scholar]
- O’Donnell, C.J.; Rao, D.S.P.; Battese, G.E. Metafrontier frameworks for the study of firm-level efficiencies and technology ratios. Empir. Econ. 2008, 34, 231–255. [Google Scholar] [CrossRef]
- Du, K.; Lu, H.; Yu, K. Sources of the potential CO2, emission reduction in China: A nonparametric metafrontier approach. Appl. Energy 2014, 115, 491–501. [Google Scholar] [CrossRef]
- Chen, Z.; Song, S. Efficiency and technology gap in China’s agriculture: A regional meta-frontier analysis. China Econ. Rev. 2008, 19, 287–296. [Google Scholar] [CrossRef]
- Chiu, C.-R.; Liou, J.-L.; Wu, P.-I.; Fang, C.-L. Decomposition of the environmental inefficiency of the meta-frontier with undesirable output. Energy Econ. 2012, 34, 1392–1399. [Google Scholar] [CrossRef]
- He, J. China’s Iron & Steel Industry and the Global Financial Crisis. ISIJ Int. 2011, 51, 696–701. [Google Scholar]
- Shi, B.; Meng, B.; Yang, H.; Wang, J.; Shi, W. A novel approach for reducing attributes and its application to small enterprise financing ability evaluation. Complexity 2018, 2018, 1032643. [Google Scholar] [CrossRef]
- He, F.; Zhang, Q.; Lei, J.; Fu, W.; Xu, X. Energy efficiency and productivity change of China’s iron and steel industry: Accounting for undesirable outputs. Energy Policy 2013, 54, 204–213. [Google Scholar] [CrossRef]
- Lu, C.C.; Chiu, Y.H.; Shyu, M.K.; Lee, J.-H. Measuring CO2, emission efficiency in OECD countries: Application of the Hybrid Efficiency model. Econ. Model. 2013, 32, 130–135. [Google Scholar] [CrossRef]
- China Iron and Steel Association (CISA). Environmental Protection Statistics of China’s Iron and Steel Industry (2010–2015); CISA: Beijng, China, 2016. [Google Scholar]
- China Iron and Steel Association (CISA). Annual Financial Report of Large and Medium-sized Metallurgical Enterprises (2010–2015); CISA: Beijng, China, 2016. [Google Scholar]
- China Iron and Steel Association (CISA). Statistics on Energy Conservation and Environmental Protection of China’s Iron and Steel Industry (2010–2015); CISA: Beijng, China, 2016. [Google Scholar]
- Moutinho, V.; Madaleno, M.; Robaina, M. The economic and environmental efficiency assessment in EU cross-country: Evidence from DEA and quantile regression approach. Ecol. Indic. 2017, 78, 85–97. [Google Scholar] [CrossRef]
- Rebolledo-Leiva, R.; Angulo-Meza, L.; Iriarte, A.; González-Araya, M.C. Joint carbon footprint assessment and data envelopment analysis for the reduction of greenhouse gas emissions in agriculture production. Sci. Total Environ. 2017, 36, 593–594. [Google Scholar] [CrossRef] [PubMed]
- Zhou, G.; Chung, W.; Zhang, X. A study of carbon dioxide emissions performance of China’s transport sector. Energy 2013, 50, 302–314. [Google Scholar] [CrossRef]
- Chen, L.; He, F.; Zhang, Q.; Jiang, W.; Wang, J. Two-stage efficiency evaluation of production and pollution control in Chinese iron and steel enterprises. J. Clean. Prod. 2017, 165, 611–620. [Google Scholar] [CrossRef]
- Liu, D. China: New environment law shows its fangs. Nature 2015, 525, 321. [Google Scholar] [CrossRef] [PubMed]
- Wang, Q.; Su, B.; Sun, J.; Zhouo, P.; Zhou, D. Measurement and decomposition of energy-saving and emissions reduction performance in Chinese cities. Appl. Energy 2015, 151, 85–92. [Google Scholar] [CrossRef]
- Hu, A. Ecological Civilization Construction and Green Development. In China’s Road and China’s Dream; Springer: Singapore, 2018. [Google Scholar]
- Zhu, L.; Zhang, X.B.; Li, Y.; Wang, X.; Guo, J. Can an emission trading scheme promote the withdrawal of outdated capacity in energy-intensive sectors? A case study on China’s iron and steel industry. Energy Econ. 2017, 63, 332–347. [Google Scholar] [CrossRef]
Figure 1.
A graphical illustration of meta-frontier, group frontier, and technology gap ratio (TGR).
Figure 1.
A graphical illustration of meta-frontier, group frontier, and technology gap ratio (TGR).


Table 1.
Statistical description of variables (2010–2015).
| Variables | Mean | Std. Dev. | Min | Max | Unit | Attribute | |
|---|---|---|---|---|---|---|---|
| Input | employee | 32.51 | 35.89 | 1.33 | 189.47 | thousand | non-radial |
| capital | 25.10 | 31.61 | 0.94 | 168.86 | billion yuan | non-radial | |
| energy | 4.34 | 3.48 | 0.28 | 20.14 | million standard coal equivalent | radial | |
| Output | value added | 6.46 | 8.58 | −4.36 | 57.27 | billion yuan | non-radial |
| solid waste | 4.56 | 4.7 | 0.08 | 25.22 | million tons | radial | |
| waste gas | 15.18 | 14.54 | 1.15 | 79.76 | billion cubic | radial | |
| waste water | 100.19 | 129.1 | 0.05 | 1112.9 | million cubic m | radial | |
Table 2.
Average mean of MEE, GEE, and TGR of Chinese IS industry during 2010–2015.
| Year | MEE (Meta-Frontier’s Energy Efficiency) | GEE (Group Frontier’s Energy Efficiency) | TGR (Technology Gap Ratio) | |||||||||
|---|---|---|---|---|---|---|---|---|---|---|---|---|
| China | East | Central | West | China | East | Central | West | China | East | Central | West | |
| 2010 | 0.68 | 0.70 | 0.69 | 0.66 | 0.80 | 0.70 | 0.80 | 0.91 | 0.86 | 1.00 | 0.86 | 0.72 |
| 2011 | 0.69 | 0.77 | 0.69 | 0.63 | 0.82 | 0.77 | 0.80 | 0.89 | 0.85 | 1.00 | 0.85 | 0.70 |
| 2012 | 0.63 | 0.72 | 0.60 | 0.55 | 0.77 | 0.73 | 0.73 | 0.84 | 0.82 | 1.00 | 0.83 | 0.64 |
| 2013 | 0.68 | 0.74 | 0.73 | 0.58 | 0.83 | 0.75 | 0.79 | 0.95 | 0.84 | 0.99 | 0.92 | 0.61 |
| 2014 | 0.70 | 0.77 | 0.73 | 0.60 | 0.84 | 0.79 | 0.81 | 0.93 | 0.84 | 0.98 | 0.90 | 0.65 |
| 2015 | 0.53 | 0.63 | 0.58 | 0.36 | 0.66 | 0.66 | 0.62 | 0.70 | 0.81 | 0.95 | 0.94 | 0.54 |
| Average | 0.65 | 0.72 | 0.67 | 0.56 | 0.79 | 0.73 | 0.76 | 0.87 | 0.84 | 0.99 | 0.88 | 0.65 |
Table 3.
Average mean of TGI, MI, and MTI of Chinese IS industry during 2010–2015.
| Year | TGI (Technological Gap Inefficiency) | MI (Managerial Inefficiency) | MTI (Meta Total Inefficiency) | |||||||||
|---|---|---|---|---|---|---|---|---|---|---|---|---|
| China | East | Central | West | China | East | Central | West | China | East | Central | West | |
| 2010 | 0.121 | 0.000 | 0.114 | 0.249 | 0.196 | 0.300 | 0.198 | 0.090 | 0.317 | 0.300 | 0.311 | 0.338 |
| 2011 | 0.125 | 0.001 | 0.116 | 0.259 | 0.181 | 0.232 | 0.197 | 0.114 | 0.306 | 0.233 | 0.312 | 0.373 |
| 2012 | 0.139 | 0.003 | 0.123 | 0.292 | 0.234 | 0.273 | 0.272 | 0.158 | 0.374 | 0.275 | 0.396 | 0.450 |
| 2013 | 0.145 | 0.005 | 0.066 | 0.364 | 0.171 | 0.253 | 0.206 | 0.054 | 0.316 | 0.259 | 0.272 | 0.418 |
| 2014 | 0.144 | 0.017 | 0.080 | 0.336 | 0.157 | 0.214 | 0.189 | 0.068 | 0.301 | 0.231 | 0.269 | 0.403 |
| 2015 | 0.134 | 0.022 | 0.041 | 0.339 | 0.341 | 0.343 | 0.376 | 0.304 | 0.475 | 0.365 | 0.417 | 0.643 |
| Ave. (average) | 0.135 | 0.008 | 0.090 | 0.306 | 0.213 | 0.269 | 0.240 | 0.131 | 0.348 | 0.277 | 0.330 | 0.438 |
© 2018 by the authors. Licensee MDPI, Basel, Switzerland. This article is an open access article distributed under the terms and conditions of the Creative Commons Attribution (CC BY) license (http://creativecommons.org/licenses/by/4.0/).
Share and Cite
MDPI and ACS Style
Wang, X.; He, F.; Zhang, L.; Chen, L. Energy Efficiency of China’s Iron and Steel Industry from the Perspective of Technology Heterogeneity. Energies 2018, 11, 1247. https://doi.org/10.3390/en11051247
AMA Style
Wang X, He F, Zhang L, Chen L. Energy Efficiency of China’s Iron and Steel Industry from the Perspective of Technology Heterogeneity. Energies. 2018; 11(5):1247. https://doi.org/10.3390/en11051247
Chicago/Turabian StyleWang, Xiaoling, Feng He, Linfeng Zhang, and Lili Chen. 2018. "Energy Efficiency of China’s Iron and Steel Industry from the Perspective of Technology Heterogeneity" Energies 11, no. 5: 1247. https://doi.org/10.3390/en11051247
Note that from the first issue of 2016, this journal uses article numbers instead of page numbers. See further details here.