A Numerical Study on the Light-Weight Design of PTC Heater for an Electric Vehicle Heating System

1
Green Car Power System R&D Division, Korea Automotive Technology Institute, 303 Pungse-Ro, Pungse-Myeon, Cheonan-Si 330-912, Chungnam, Korea
2
Donga High Tech Company, Dongtangiheung-Road, Dongtan-Myeon, Hwaseong-Si 445-813, Gyunggi-Do, Korea
*
Author to whom correspondence should be addressed.
Energies 2018, 11(5), 1276; https://doi.org/10.3390/en11051276
Submission received: 4 May 2018
/
Revised: 10 May 2018
/
Accepted: 15 May 2018
/
Published: 16 May 2018
(This article belongs to the Special Issue Fluid Flow and Heat Transfer)
Abstract
:As the market for electric vehicles grows at a remarkable rate, various models of electric vehicles are currently in development, in parallel to the commercialization of components for diverse types of power supply. Cabin heating and heat management components are essential to electric vehicles. Any design for such components must consider the requirements for heating capacity and power density, which need to reflect both the power source and weight reduction demand of any electric vehicle. In particular, design developments in electric heaters have predominantly focused on experimental values because of structural characteristics of the heater and the variability of heat sources, requiring considerable cost and duration. To meet the ever-changing demands of the market, an improved design process for more efficient models is essential. To improve the efficacy of the design process for electric heaters, this study conducted a Computational Fluid Dynamics (CFD) analysis of an electric heater with specific dimensions by changing design parameters and operating conditions of key components. The CFD analysis modeled heat characteristics through the application of user-defined functions (UDFs) to reflect temperature properties of Positive Temperature Coefficient (PTC) elements, which heat an electric heater. Three analysis models, which included fin as well as PTC elements and applied different spaces between the heat rods, were compared in terms of heating performance. In addition, the heat performance and heat output density of each analysis model was analyzed according to the variation of air flow at the inlet of the radiation section of an electric heater. Model B was selected, and a prototype was fabricated based on the model. The performance of the prototype was evaluated, and the correlation between the analysis results and the experimental ones was identified. The error rate between performance change rates was approximately 4%, which indicated that the reliability between the design model and the prototype was attained. Consequently, the design range of effective performance and the guideline for lightweight design could be presented based on the simulation of electric heaters for various electric vehicles. The fabrication of prototypes and minimum comparison demonstrated opportunities to reduce both development cost and duration.
1. Introduction
Issues such as energy shortages and environmental pollution are currently being addressed across all industries. The automobile industry accounts for over 10% of both global energy consumption and greenhouse gas emissions. Such a contribution cannot be neglected [1]. According to the World Business Council for Sustainable Development, the number of passenger cars in the world will reach about 2 billion by 2050 [2].
The replacement of the existing combustion engine vehicles with electric vehicles (EVs) is one of the solutions to the above problem [3,4,5]. However, one obstacle to the spread of electric vehicles is the reduction of electric vehicle mileage by almost 50% due to the operation of cabin heating system [6]. Accordingly, cabin heating systems must be improved through the development of enhanced heating capacity and a reduction in energy consumption [7].
Heating systems in conventional combustion engines use waste heat from the engines. On the other hand, EVs have no engine and require a separate heating system. To improve the heating system of an EV, some studies have proposed heat pump systems for EVs, which reduce energy consumption [8,9]. Cho and Lee utilized the energy discharged from electrical components such as the motor, battery, or inverter to develop a heat pump that was suitable for the heating condition of EV [10]. Shin verified the performance of an electric heater using high-voltage Positive Temperature Coefficient (PTC) elements to improve the energy efficiency of EVs [11].
With regard to the above heating systems for EVs, the performance of the heat pump heating system showed considerable deterioration during prolonged low temperature conditions, as in winter. Studies which used waste heat from electrical components such as the motor, battery, or inverter found that the heat capacity was far below the cabin heating capacity and thus was largely useless for heating. A promising and realistic alternative is to improve the performance of the electric heater, which is a key heating component. In this regard, it is necessary to determine an optimal heating capacity, designing an electric heater according to the performance requirements of the system in which the heater is used.
An electric heater offers a simple structure as well as good compatibility and a fast response time due to PTC elements. In addition, because PTC elements drastically increase the resistance at or above a set temperature to maintain it, electric heaters include both temperature control and safety functions of its own, unlike other heating systems. However, one significant drawback to this feature is its inability to predict the power consumption of a PTC element based electric heater according to external environment and boundary conditions. Moreover, even if an electric heater with optimal heating capacity is designed in accordance to various specifications (weight, volumes, etc.) of the system where the heater is to be used, the reliable (accurate) performance of real products is difficult to attain.
The performance of an air-heating electric heater is significantly affected by the structural designs of heat rods (Figure 1) and fins. Heat transfer is caused by the dispersion of wake flow which occurs as a result of periodic friction in the boundary layer between air and fin. Accordingly, if the finite area of fin increases, heat transfer is improved; however, this also increases friction and drag, which facilitates a drop in pressure [12]. As mentioned above, the heat transfer mechanisms are under development not only in heaters but throughout various fields, such as nanoscales [13,14]. Any successful design must satisfy the requirements for heat transfer and pressure drop as well as the weight reduction of components, which have great effect on the fuel economy of EV. An analytical approach can effectively consider these factors.
A three-dimensional Computational Fluid Dynamics (CFD) simulation can easily reflect physical conditions without the need for an expensive tester or fabrication of a prototype; accordingly, various design options can be effectively tested at a low cost. Lalot and Florent used a CFD simulation to examine the non-uniformity of flow in an electric heater and demonstrated its impact on the non-uniformity of heat exchange [15]. Zhang and Li applied a CFD method to ensure uniform heat distribution according to fluid flow inside a heat exchanger. They could easily predict physical phenomena caused by the inlet shape of a heat exchanger [16].
This study conducted a comparative analysis of power density (heating performance/weight) according to the configuration of key components by using a 3D heat flow analysis model. The analysis examined the design of 6 kW electric heaters which are conventionally used in the cabin of EVs. The heat flow simulation model for an electric heater formulated PTC characteristic curves to model PTC heating. In this way, the number of heat rods inserted into the radiation fin and the heating performance could be simulated. Additionally, to verify the reliability of the simulation, a prototype of the electric heater was fabricated based on the analysis model which tested performance. Both the heating performance and the output density characteristic of the electric heater were analyzed according to the radiation fin and heat rod. On the basis of this analysis, a guideline on weight reduction design, which satisfied reference performance factors, was proposed.
2. CFD Model Details
2.1. Physical Model
Figure 2 shows a geometric model of an electric heater including the plate fins and heat rods which were adopted in this study [17]. Different spaces between heat rods were applied by changing the number of heat rods used in the electric heater. The radiation performance of each model was compared. Seven PTC heating elements were inserted into each heat rod and the elements were connected in parallel. The heat core, which consisted of heat rods and fins, was divided into two zones. In each heat core, heat rods were inserted at regular intervals into 112 fin layers.
Comprising a repeating shape of fins and heat rods, the electric heater model required a considerable number of meshes, which demanded a significant period of time for the convergence process of analysis; it also decreased the reliability of results because of its complex structure. To reduce the number of iterative calculations and required analysis time, an analysis domain was set, as shown in Figure 3. The analysis domain indicated half of the fin pitch and heat rod pitch. The open ratio of this domain was calculated by the ratio of the inlet area of the domain to that of the heater model. and indicate the width and height of the analysis domain, respectively. To improve the reliability of the analysis, the flow path of the inlet was reduced while that of the outlet was set at over five times the hydraulic diameter, which could prevent reverse flow. As shown in Figure 3, the analysis domain included air, heat bar, PTC elements, fin, and insulator. Table 1 presents the common geometric design values of each model. Table 2 shows the properties of each part of the domain.
A three-dimensional simulation was implemented through the commercial program, Fluent. The grid was built and the meshes were improved by applying the proximity and curvature method. An inflation layer was applied near the fin surface to create the necessary amount of meshes to study whether the heat transfer according to air flow on the fin surface was more effective. In addition, on the basis of the initial analysis, the adaption function was applied to points with high temperature variation to generate meshes with higher density. Finally, approximately meshes were made.
2.2. Analysis Model
Navier-Stokes and SIMPLE algorithm were used to solve three-dimensional energy equations for steady-state fluid mechanics and the heat transfer zone (1)–(3).
Continuity equation:
Momentum equation:
Energy equation in steady state condition:
Among turbulence models provided by Ansys Fluent, the Transition SST (Shear Stress Transport) model was used as the analysis model. This model was the combination of the k-omega model for analyzing wall flow and the k-epsilon, which was effective in predicting flow behaviors occurring far from the wall. To implement the Transition SST model, meshes need to satisfy the requirement of . The y value, which was the distance from a wall to the first mesh-formation layer, was calculated by using the Equation (4). The prism mesh was applied to the layer.
2.3. Model Parameters and Boundary Condition
For the boundary condition for the inlet of the heater, the mass flow rate of 300 kg\h, which is conventionally used to test a heater, was adopted; the temperature condition was 0 °C, which acted as the reference temperature of winter. However, this boundary condition corresponded to the area of . Accordingly, it had to be adjusted to the simulation domain. Table 3 presents mass flow rates and open area ratios of each simulation model. The open area ratio was the ratio of inlet area of a model to the radiation section area of the electric heater.
Open area ratio :
The length of fin (that is, the distance between heat rods) was set as a model parameter to predict the heater performance according to the number of heat rods in the same area of heater. Figure 3 illustrates Model B. The fin lengths of Models A and C were set to the half and twice of that of Model B, respectively. Table 3 provides parameters of each model.
User define functions (UDFs) were used to apply real radiation characteristics of PTC to the simulation. On the basis of the experimental data, curve fitting was performed to obtain the resistance-temperature curve of PTC elements, as shown in Figure 4. Two sections were distinguished to effectively formulate the drastic change of resistance according to temperature. For the section of the heating temperatures ranging from 25 °C to 140 °C, Equation (6) was applied. Equation (7) was used for the heating temperature over 145 °C. To calculate the equation of PTC elements characteristic curve as power consumption, Equation (10) was used, which applied Ohm’s law (9) to Joule’s law (8). Power consumption of PTC elements was assumed to be converted to thermal energy without loss. The power consumption was obtained by using the applied voltage of 330 V and the resistance values functionalized by temperature variation, as shown in Equations (6) and (7). This was set to the boundary condition of the calorific value of PTC elements.
Resistance–Temperature equation
Heat generation
3. Simulation Result and Analysis
3.1. Analysis of Each Model According to Test Condition
To design a lightweight electric heater for EVs, which could satisfy the target performance (6 kW), this study conducted a simulation of heating performance by applying different heat rod distances to the heater radiation section (heat core). Figure 5 illustrates distributions of air, fin, and PTC temperature for three models.
Figure 6 shows temperature distributions from the center of PTC elements in the width direction of fins, an essential component of heaters. Models A and B had variations of 0.8% and 6.2%, respectively, both of which were lower than 24.2% of Model C.
In the case of a drop in pressure, as shown in Table 4, Model A had the highest value of 43 Pa, as it included the largest number of heat rods in the same area. Model A showed the lowest calorific value of 1.34 W in the analysis domain. However, this value was converted to 7203.84 W by the unit of the whole heater model, which was the highest value. The comparison of heating capacity in Figure 7a revealed that Models A and B had similar levels. As shown in Figure 7c, Model B had the highest heating power density, when heating capacities were compared according to the unit weight of heater per each model. Also, Model C showed a similar value but it did not satisfy the target performance (6 kW) of electric heaters.
When an electric heater is designed, heating capacity must be secured that is suitable for its required size and performance; the use of main component materials can achieve a lightweight and cost-effective design. On the basis of these considerations, Model B was selected as the most appropriate option as a result of the simulation.
3.2. Analysis of Each Model According to Flow Rate Variation
The above result was obtained under the ideal condition that the outlet air temperature and mass flow rate were constant according to locations of heater radiation section. For this reason, the heating performance attained was beyond expectation.
However, existing studies have already demonstrated that the entire radiation section of an electric heater does not have a uniform temperature distribution; temperature variation may be as much as 10 °C~20 °C in areas [18]. Such non-uniformity of temperature distribution points to the non-uniformity of air density, which transfers heat, in relationship to the location of a heater radiation section. This also implies that the non-uniformity of mass flow rate depends on the location of the heater.
The analysis domain of this study was an ideal position, which was a local area of a real heater, as shown in Figure 8. If the results of the analysis can be converted to data for an entire heater, the ideal heater could be designed and fabricated. However, as is clear from Figure 8, the real heater included an edge position that exhibited relatively inferior performance. Accordingly, temperature and mass flow rate had different values, depending on the distance from the aforementioned edge position. Analysis results for the heating performance, which were derived from the ideal position, were more positive than the experimental results reflecting flow and heat loss, which were applicable to the entire heater.
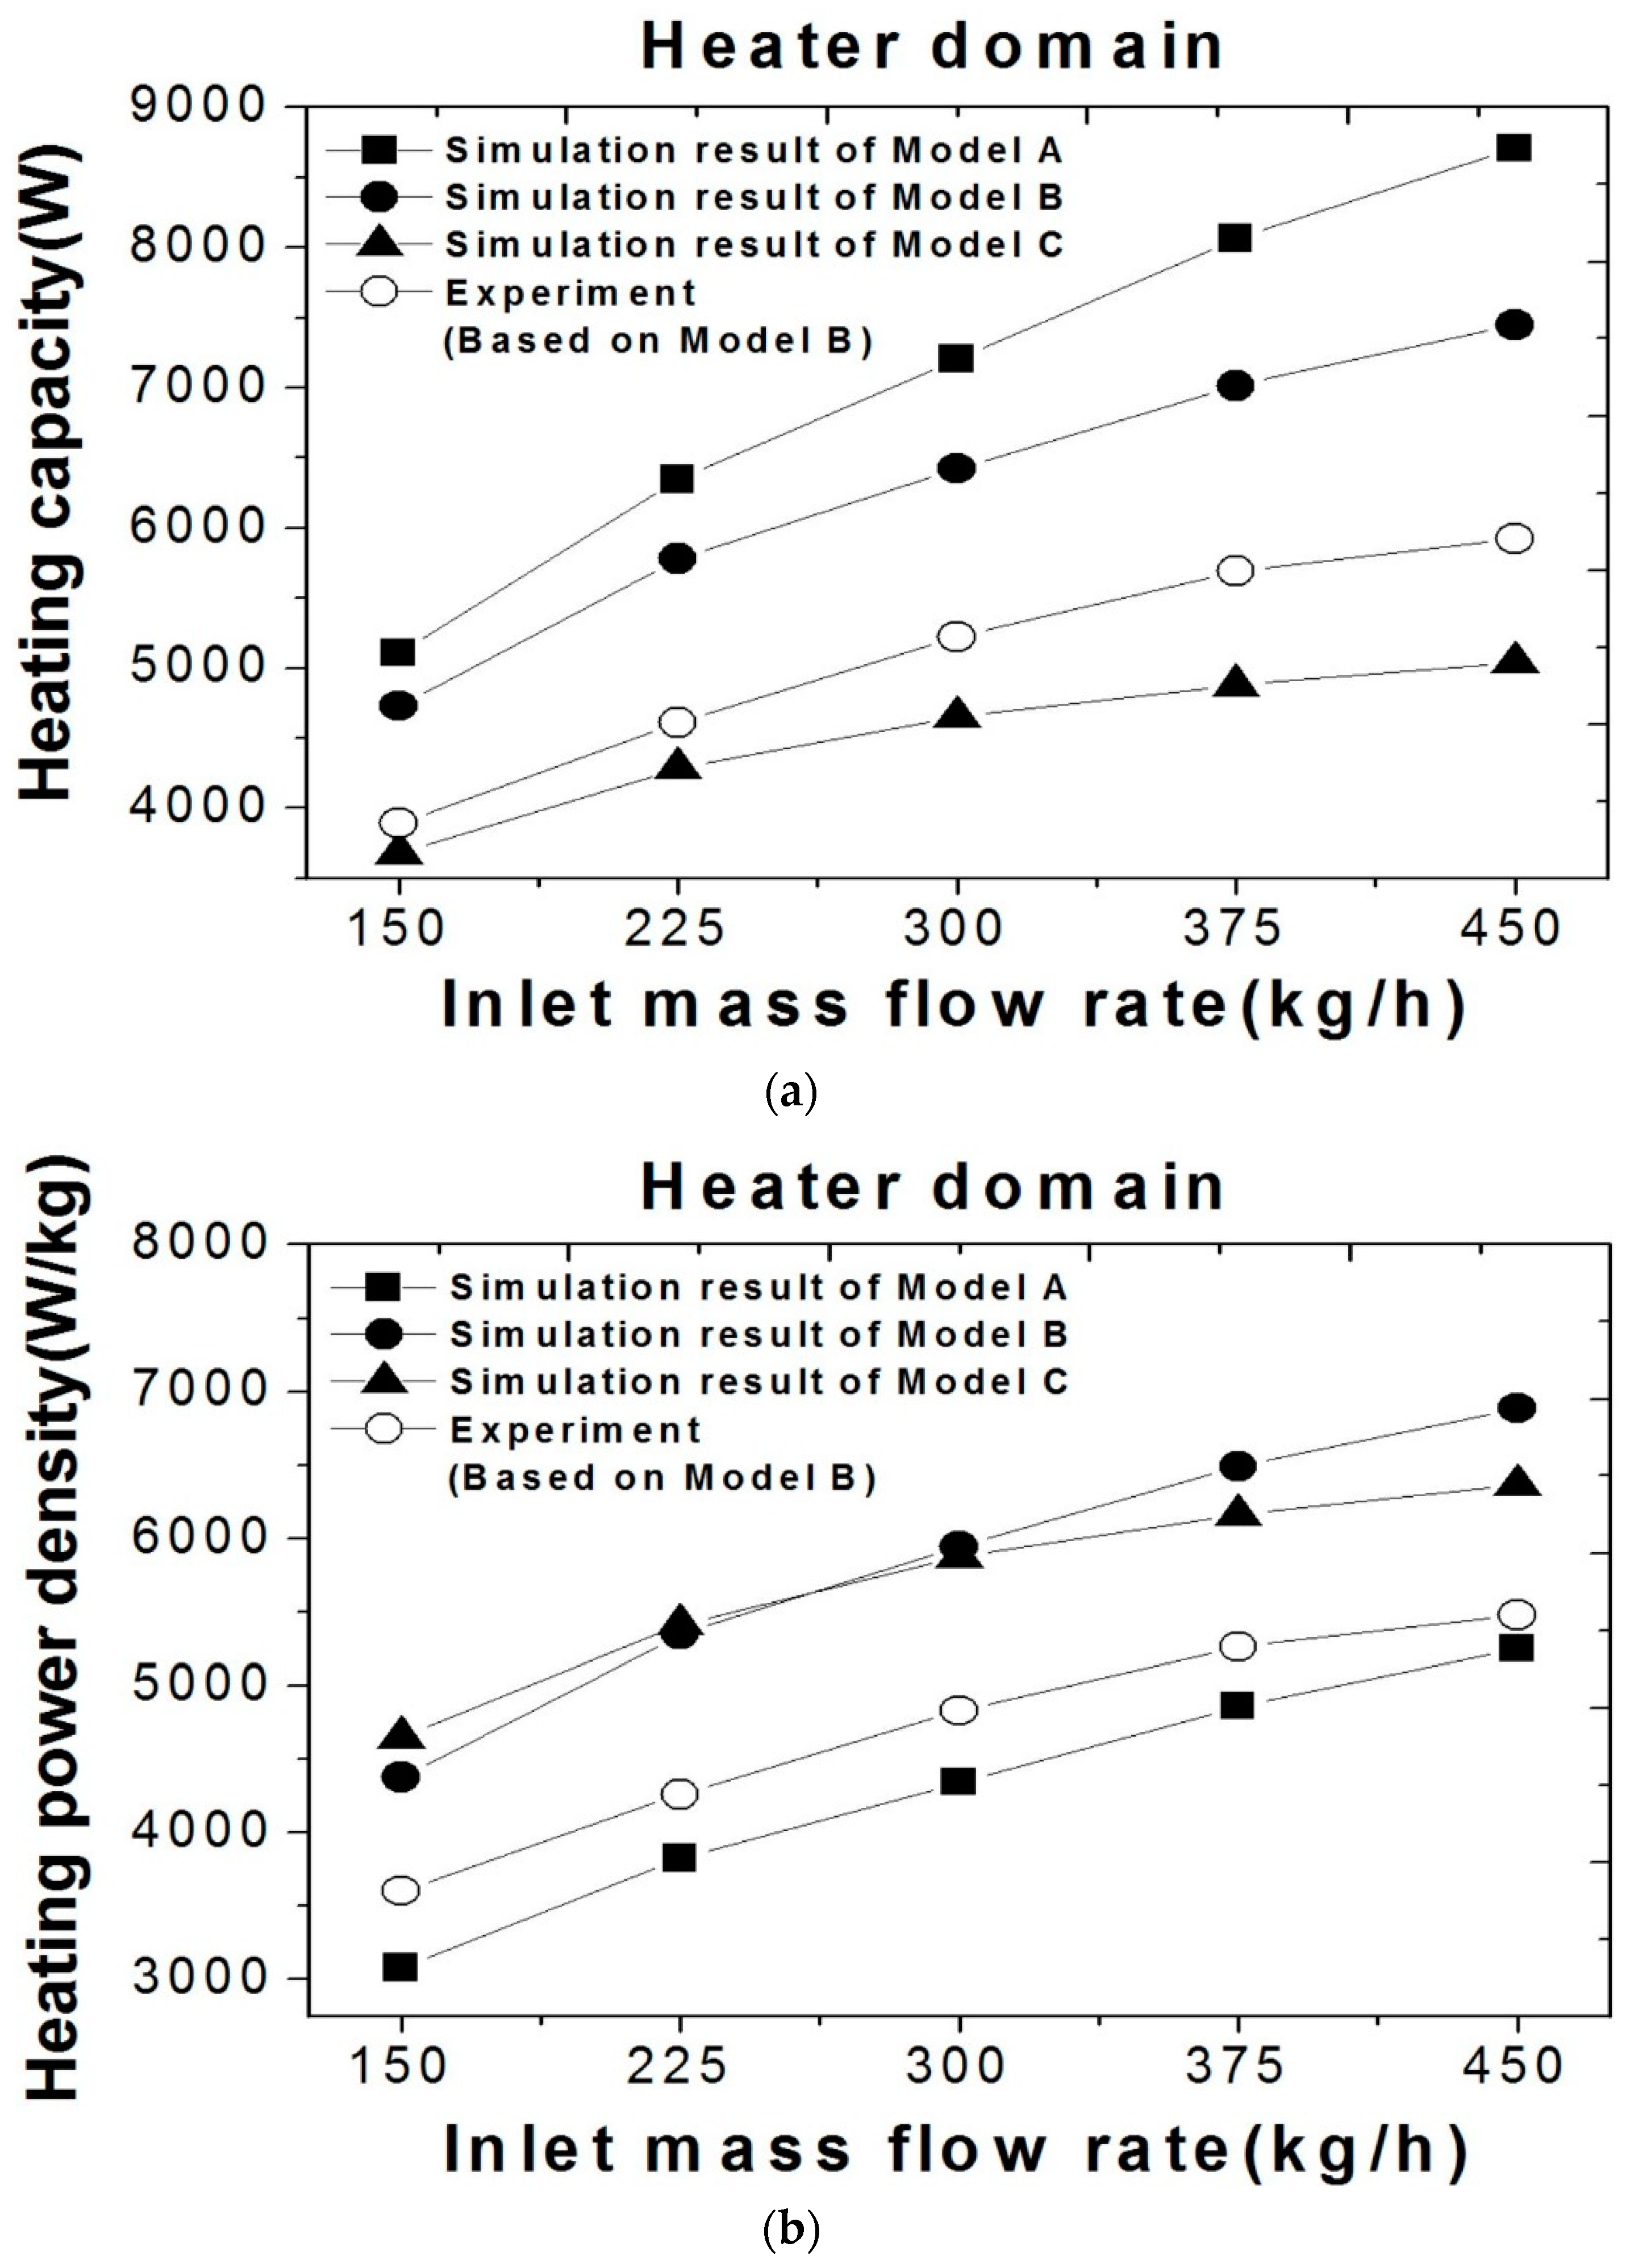
To verify such a gap with experimental performance, the mass flow rates of each model were modified by applying 150 kg/h, 225 kg/h, 300 kg/h, 375 kg/h, and 450 kg/h to the basic flow rate, respectively, as shown in Table 5; the heating performance was also verified. The distribution of heating performance was obtained reflecting different flow rates, as shown in Figure 9. Figure 9a shows the heating capacities of the entire heater, which were calculated by multiplying the heating capacity of the simulation domain. In Models A and B, the heating capacity is proportional to the mass flow rate. Figure 9b illustrates the density of heat output, which is an important factor for securing sufficient heating performance and lightweight design for an entire heater. The above results show that the heating capacity of all three models increases when the mass flow rate increases. In addition, it was confirmed that the heating power density of Model B was the highest when the mass flow rate was 300 kg/h or higher. On the basis of this consideration, an effective number of heat rods and the distance between radiation fins could be determined to achieve the target performance and lightweight design of an electric heater with specific dimensions.
4. Experimental Results for the Electric Heater
To measure and compare the heating performance, efficiency, and pressure values of the prototype electric heater fabricated in this study, a wind tunnel and environmental chamber system (Figure 10) were constructed. Each operational condition was applied and compared. The inlet/outlet air temperature of the electric heater in the winder tunnel was measured using 25 T-type thermocouples with ±0.1 °C error rate. The pressure drop of the radiation section was measured by using a pressure gauge. The data loggers of Ganter and Yokogawa were used to collect temperature and pressure values. To prevent the influence of the radiation section, the temperature sensors were installed in a 4 × 6 arrangement, with equal spacing at a distance over 3 cm from the outlet surface of the radiation section. Accordingly, temperature distributions of heat cores could be compared. A 12 V power supply was used to operate the controller of the radiation section. The electric heater ran based on the duty control using a can analyzer. The inlet flow rate was set by considering air density (0.99~1.28 kg/m3) according to temperature variation. The test conditions of Table 6 were applied.
As shown in Figure 11, the results of the prototype electric heater test show a difference in heating performance according to the heat dissipation location of the heater. This effect was likely caused by the difference in contact of thermal resistance of each part (heat rod and fin). Therefore, to determine qualitative characteristics, we compared the rate of change in heating performance by changing the inlet air mass flow rate between the experiment and the analysis results. Figure 9 illustrates the comparison of heating performance results according to flow rate between analysis and experiment. The variations of heating performance according to flow rates at the level of the entire heater ranged from 3% to 22% in the analysis and experiment, respectively. When the variations were compared for each flow rate range in both the analysis and experiment, the maximum error rate was 4%, which indicated that the error rate of performance variation between the analysis model and the prototype was generally reliable.
5. Conclusions
To ensure an effective design of an electric heater for an EV heating system, this study conducted a simulation of heating performance by applying temperature characteristics of PTC elements. A comparative analysis applied different design parameters of main components and operational conditions to an electric heater with specific dimensions. In this way, candidate models were compared in terms of heating performance and heat output density, which was an indicator of lightweight design. A prototype heater was fabricated based on the selected optimal model, and its performance was evaluated. The conclusions of this study can be summarized as follows.
- (1)
- To obtain an optimal design of an electric heater using PTC elements, a three-dimensional heat transfer analysis was performed by applying simple models that reflected the radiation characteristics of PTC elements and the structural characteristics of the heater. The performance of each model was compared according to different configurations of heat rods and fins, which are dominant components in terms of heat transfer performance.
- (2)
- Each model was analyzed to realize heating capacities over 6 kW, which was the target performance at the level of the entire heater. As the indicator of lightweight design, the heat output densities of Models A, B, and C were 4.34, 5.94, and 5.87 kW/kg. In addition, when the inlet air flow rate varied, the performances (Delta Q, the performance variation in the same flow rate rage) of Models A, B, and C were 3.6, 2.71, and 1.36 kW, respectively. On the basis of these results, Model B was selected as the optimal design option that could achieve a high heat output density as well as proportional and stable performance variation.
- (3)
- A prototype electric heater was fabricated through the application of Model B. Under the reference conditions, the prototype was evaluated to have a heating capacity of approximately 5.23 kW. The correlation between the simulation results and the heating performance results of the prototype according to inlet flow rate showed that the error rate between performance variations was about 4%. This indicated that sufficient reliability between the prototype and the design model had been secured.
In the development of various electric heaters for EVs, a simulation reflecting radiation elements and heater characteristics can provide a guideline to an effective performance design range and lightweight design. Moreover, cost will be reduced by minimizing the comparative fabrication of prototype heaters.
Author Contributions
Hyun Sung Kang designed the research, Hyun Sung Kang, Yoon Hyuk Shin discussed the results and contributed to writing the paper. Thanks to Seungkyu Sim from Donga High Tech Company for helping us with the experiment.
Acknowledgments
This work was supported by the Energy Efficiency & Resources of the Korea Institute of Energy Technology Evaluation and Planning (KETEP), a grant funded by the Korean Government Ministry of Knowledge Economy (20152000000370), and supported by the New Product Development Program with Conditional Purchase (S2422112) funded by the Ministry of Small and Medium-sized Enterprises (SMEs) and Startups.
Conflicts of Interest
The authors declare no conflict of interest.
Nomenclature
| F | Fin |
| H | Heater |
| R | Heat rod |
| T | Temperature |
| Distance from wall (mm) | |
| Simulation domain open ratio | |
| Velocity in shear stress direction (m/s) | |
| Mass flow rate (kg/s) | |
| Inlet hydraulic diameter (mm) | |
| 25 < 140, Resistance of PTC (kΩ) | |
| 140 < 145, Resistance of PTC (kΩ) | |
| 145 < , Resistance of PTC (kΩ) | |
| Power (W) | |
| Voltage (V) | |
| Current (A) | |
| Greek symbols | |
| ∇ | Vector operator |
| Density (kg/m3) | |
| Velocity (m/s) | |
| Coefficient of dynamic viscosity (kg/m·s) | |
| Coefficient of kinematic viscosity (m2/s) | |
| Subscripts | |
| h | height (mm) |
| p | pitch (mm) |
| w | width (mm) |
| t | thickness (mm) |
| c | PTC |
References
- Solomon, S.; Qin, D.; Manning, M.; Chen, Z.; Marquis, M.; Averyt, K.B.; Tignor, M.; Miller, H.L. Contribution of Working Group I to the Fourth Assessment Report of the Intergovernmental Panel on Climate Change; Cambridge University Press: Cambridge, UK; New York, NY, USA, 2007. [Google Scholar]
- Stigson, B. Mobility 2030: Meeting the Challenges to Sustainability; World Business Council for Sustainable Development: Geneva, Switzerland, 2004. [Google Scholar]
- Kambly, K.R.; Bradley, T.H. Estimating the HVAC energy consumption of plug-in electric vehicles. J. Power Sources 2014, 259, 117–124. [Google Scholar] [CrossRef]
- Panchal, S.; Dincer, I.; Agelin-Chaab, M.; Fraser, R.; Fowler, M. Experimental and theoretical investigations of heat generation rates for a water cooled LiFePO4 battery. Int. J. Heat Mass Transf. 2016, 101, 1093–1102. [Google Scholar] [CrossRef]
- Panchal, S.; Dincer, I.; Agelin-Chaab, M.; Fraser, R.; Fowler, M. Thermal modeling and validation of temperature distributions in a prismatic lithium-ion battery at different discharge rates and varying boundary conditions. Appl. Therm. Eng. 2016, 96, 190–199. [Google Scholar] [CrossRef]
- Kim, K.; Lee, W.S.; Kim, Y.Y. Investigation of Electric Vehicle Performance Affected by Cabin Heating. J. Korea Acad. Ind. Coop. Soc. 2013, 14, 4679–4684. [Google Scholar] [CrossRef]
- Yokoyama, A.; Osaka, T.; Imanishi, Y.; Sekiya, S. Thermal management system for electric vehicles. SAE Int. J. Mater. Manuf. 2011, 4, 1277–1285. [Google Scholar] [CrossRef]
- Torregrosa, B.; Payá, J.; Corberán, J.M. Modeling of mobile air conditioning systems for electric vehicles. In Proceedings of the 4th European Workshop—Mobile Air Conditioning and Vehicle Thermal Systems, Torino, Italy, 1–2 December 2011. [Google Scholar]
- Lee, D.Y.; Cho, C.W.; Won, J.P.; Park, Y.C.; Lee, M.Y. Performance characteristics of mobile heat pump for a large passenger electric vehicle. Appl. Therm. Eng. 2013, 50, 660–669. [Google Scholar] [CrossRef]
- Cho, C.W.; Lee, H.S.; Won, J.P.; Lee, M.Y. Measurement and evaluation of heating performance of heat pump systems using wasted heat from electric devices for an electric bus. Energies 2012, 5, 658–669. [Google Scholar] [CrossRef]
- Shin, Y.H.; Ahn, S.K.; Kim, S.C. Performance Characteristics of PTC Elements for an Electric Vehicle Heating System. Energies 2016, 9, 813. [Google Scholar] [CrossRef]
- Wang, C.C.; Chang, Y.J.; Hsieh, Y.C.; Lin, Y.T. Sensible heat and friction characteristics of plate fin-and-tube heat exchangers having plane fins. Int. J. Refrig. 1996, 19, 223–230. [Google Scholar] [CrossRef]
- Vo, T.Q.; Kim, B. Transport phenomena of water in molecular fluidic channels. Sci. Rep. 2016, 6, 33881. [Google Scholar] [CrossRef] [PubMed]
- Vo, T.Q.; Kim, B. Interface thermal resistance between liquid water and various metallic surfaces. Int. J. Precis. Eng. Manuf. 2015, 16, 1341–1346. [Google Scholar] [CrossRef]
- Lalot, S.; Florent, P.; Lang, S.K.; Bergles, A.E. Flow maldistribution in heat exchangers. Appl. Therm. Eng. 1999, 19, 847–863. [Google Scholar] [CrossRef]
- Zhang, Z.; Li, Y. CFD simulation on inlet configuration of plate-fin heat exchangers. Cryogenics 2003, 43, 673–678. [Google Scholar] [CrossRef]
- Park, M.H.; Kim, S.C. Heating Performance Characteristics of High-Voltage PTC Heater for an Electric Vehicle. Energies 2017, 10, 1494. [Google Scholar] [CrossRef]
- Shin, Y.H.; Sim, S.; Kim, S.C. Performance Characteristics of a Modularized and Integrated PTC Heating System for an Electric Vehicle. Energies 2016, 9, 18. [Google Scholar] [CrossRef]
Figure 1.
Schematic diagram of heat rod and fin for electric heater. PTC: Positive Temperature Coefficient.
Figure 1.
Schematic diagram of heat rod and fin for electric heater. PTC: Positive Temperature Coefficient.

Figure 2.
Schematic diagram of PTC heater in an electric vehicle (geometry of housing, heat rod, and fin array).
Figure 2.
Schematic diagram of PTC heater in an electric vehicle (geometry of housing, heat rod, and fin array).

Figure 3.
Schematic of simulation model with boundary conditions.

Figure 4.
Resistance–Temperature curve of PTC, (a) exponential fitting form 25 °C to 140 °C, (b) cubic fitting after 145 °C.
Figure 4.
Resistance–Temperature curve of PTC, (a) exponential fitting form 25 °C to 140 °C, (b) cubic fitting after 145 °C.

Figure 5.
Total temperature of heater, (a) Temperature contour for different heat rod interval, (b) temperature on air outlet, (c) temperature in fin, (d) temperature in PTC.
Figure 5.
Total temperature of heater, (a) Temperature contour for different heat rod interval, (b) temperature on air outlet, (c) temperature in fin, (d) temperature in PTC.


Figure 6.
Temperature distribution of fin (Vertical direction).

Figure 7.
Result of CFD analysis for heater for each model, (a) heating capacity, (b) weight, (c) heater power density.
Figure 7.
Result of CFD analysis for heater for each model, (a) heating capacity, (b) weight, (c) heater power density.

Figure 8.
Schematic diagram of individual position in PTC heater.

Figure 9.
Variation of inlet air mass flow rate, (a) heater heating capacity, (b) heater power density.
Figure 9.
Variation of inlet air mass flow rate, (a) heater heating capacity, (b) heater power density.

Figure 10.
Schematic diagram of the PTC heater experimental apparatus.

Figure 11.
Experiment result of outlet air temperature distribution according to the heat dissipation location of the heater (inlet mass flow rate 300 kg/h).
Figure 11.
Experiment result of outlet air temperature distribution according to the heat dissipation location of the heater (inlet mass flow rate 300 kg/h).


Table 1.
Geometrical parameter for heater models.
| Parameters | Values |
|---|---|
| Full size Heater width, (mm) | 265.5 |
| Full size Heater height, (mm) | 215 |
| Heat rod pitch, (mm) | 21 |
| Heat rod thickness, (mm) | 5.1 |
| Fin pitch and Inlet face height, (mm) | 1.8 |
| Fin thickness, (mm) | 0.3 |
Table 2.
Material properties used in the Computational Fluid Dynamics (CFD).
| Material Properties | Air (Fluid) | Aluminum (Fin, Heat Rod) | Silicon Series (Insulator) |
|---|---|---|---|
| Density (kg/m3) | Incompressible-ideal-gas | 2719 | 2329 |
| Specific Heat (J\kg·K) | 1006.43 | 871 | 720 |
| Thermal conductivity (w\m·K) | 0.0242 | 202.4 | 0.25 |
| Viscosity (kg/m·s) | 1.7894 × 10⁻⁵ | - | - |
Table 3.
Specification of each simulation model.
| Parameter | Model A | Model B | Model C |
|---|---|---|---|
| Inlet face width, (mm) | 5.25 | 10.5 | 21 |
| Open ratio, | |||
| Mass flow rate, (kg/s) | |||
| Hydraulic diameter, (mm) | 2.68 | 3.07 | 3.31 |
Table 4.
Analysis results of simulation. Positive Temperature Coefficient.
| Description | Model A | Model B | Model C | |
|---|---|---|---|---|
| Simulation model | Pressure drop (Pa) | 43 | 24 | 19 |
| PTC elements temperature (°C) | 180 | 172 | 164 | |
| PTC resistance (kΩ) | 2.412 | 1.283 | 0.932 | |
| Heating capacity (w) | 1.34 | 2.39 | 3.45 | |
| Heater model | Number of PTC (ea) | 168 | 84 | 42 |
| Power consumption of a PTC element (w) | 42.88 | 76.48 | 110.4 | |
| Weight (kg) | 1.659 | 1.081 | 0.792 | |
| Heating capacity (w) | 7203.84 | 6424.32 | 4636.8 | |
Table 5.
Air mass flow conversion for heating performance according to each model.
| Inlet Air Mass Flow Rate of Heater (kg/h) | Inlet Air Mass Flow Rate of Each Simulation Model (kg/s) | ||
|---|---|---|---|
| Modle A | Modle B | Modle C | |
| 150 | |||
| 225 | |||
| 300 | |||
| 375 | |||
| 450 | |||
Table 6.
PTC heater experimental conditions.
| Parameter | Value | |
|---|---|---|
| Inlet air | Temperature (°C) | 0 ± 2 |
| Mass flow (kg/h) | 300 ± 10 | |
| Power | Input Voltage (V) | 330 ± 5 |
© 2018 by the authors. Licensee MDPI, Basel, Switzerland. This article is an open access article distributed under the terms and conditions of the Creative Commons Attribution (CC BY) license (http://creativecommons.org/licenses/by/4.0/).
Share and Cite
MDPI and ACS Style
Kang, H.S.; Sim, S.; Shin, Y.H. A Numerical Study on the Light-Weight Design of PTC Heater for an Electric Vehicle Heating System. Energies 2018, 11, 1276. https://doi.org/10.3390/en11051276
AMA Style
Kang HS, Sim S, Shin YH. A Numerical Study on the Light-Weight Design of PTC Heater for an Electric Vehicle Heating System. Energies. 2018; 11(5):1276. https://doi.org/10.3390/en11051276
Chicago/Turabian StyleKang, Hyun Sung, Seungkyu Sim, and Yoon Hyuk Shin. 2018. "A Numerical Study on the Light-Weight Design of PTC Heater for an Electric Vehicle Heating System" Energies 11, no. 5: 1276. https://doi.org/10.3390/en11051276
Note that from the first issue of 2016, this journal uses article numbers instead of page numbers. See further details here.