Article

Plasma-Assisted Biomass Gasification with Focus on Carbon Conversion and Reaction Kinetics Compared to Thermal Gasification

1
Lehrstuhl für Energieverfahrenstechnik, Friedrich-Alexander-Universität Erlangen-Nürnberg, Fürther Str. 244f, 90429 Nürnberg, Germany
2
Lehrstuhl für Technische Thermodynamik, Friedrich-Alexander-Universität Erlangen-Nürnberg, am Weichselgarten 8, 91058 Erlangen, Germany
3
Siemens AG, Corporate Technology, Research on Energy and Electronics, Günther-Scharowsky-Str. 1, 91058 Erlangen, Germany
*
Author to whom correspondence should be addressed.
Energies 2018, 11(5), 1302; https://doi.org/10.3390/en11051302
Submission received: 5 April 2018 / Revised: 15 May 2018 / Accepted: 15 May 2018 / Published: 20 May 2018
(This article belongs to the Special Issue Electric Fields in Energy & Process Engineering)

Abstract

:
Compared to conventional allothermal gasification of solid fuels (e.g., biomass, charcoal, lignite, etc.), plasma-assisted gasification offers an efficient method for applying energy to the gasification process to increase the flexibility of operation conditions and to increase the reaction kinetics. In particular, non-thermal plasmas (NTP) are promising, in which thermal equilibrium is not reached and electrons have a substantially higher mean energy than gas molecules. Thus, it is generally assumed that in NTP the supplied energy is utilized more efficiently for generating free radicals initiating gasification reactions than thermal plasma processes. In order to investigate this hypothesis, we compared purely thermal to non-thermal plasma-assisted gasification of biomass in steam in a drop tube reactor at atmospheric pressure. The NTP was provided by means of gliding arcs between two electrodes aligned in the inlet steam flow with an electric power of about 1 kW. Reaction yields and rates were evaluated using measured gas temperatures by the optical technique. The first experimental results show that the non-thermal plasma not only promotes the carbon conversion of the fuel particles, but also accelerates the reaction kinetics. The carbon conversion is increased by nearly 10% using wood powder as the fuel. With charcoal powder, more than 3% are converted into syngas.

1. Introduction

During the “Energiewende”, the provision of a stable and CO2-neutral energy structure through the implementation of renewable energy sources (e.g., photovoltaics, wind turbines, biomass and hydropower) has attracted increasing attention. Due to fluctuations in solar radiation and wind distribution, there will be a temporal and regional mismatch between electricity production and consumption. Therefore, a flexible storage concept for renewable energy is desirable. Chemical energy storage targeting the formation of energetic base chemicals or fuels is a viable option for long-term energy storage (see, e.g., [1]). Recently, plasma application for gasification of biomass, municipal waste, and other carbon-rich materials has been considered, because application of electrical energy allows generation of hydrogen-rich synthesis gas and, depending on the reaction conditions, of methane and C2-hydrocarbons (ethane, ethylene, and acetylene).
Compared to conventional thermal gasification, plasma-assisted gasification of biomass can be performed at higher temperature, which in turn drastically increases rates of gasification reactions by increasing heat transfer rates, chemical rate coefficients, and concentrations of free radicals and charge carriers [2]. Recently, there has been growing interest in non-thermal plasma (NTP) application [3]: In NTPs, electric energy is efficiently supplied to the electrons by means of the electric field, resulting in the ionization, dissociation and excitation of a large fraction of the feed gas molecules. Energy input through plasma offers the possibility of dynamic utilization of electricity generated by renewable sources. However, the major limitation is the high capital costs of plasma generators.
Even though many authors have discussed and investigated the plasma gasification on an experimental basis (e.g., [4,5,6]) and/or by simulation (e.g., [7,8]), no published literature could be found by the authors giving a direct comparison between thermal and plasma biomass gasification under identical experimental conditions, which is the main objective of this work. Furthermore, the furnace temperature often found in the literature is used for results evaluation, and may not represent the actual gas temperature during the gasification. In this work, the results are analyzed using optically measured temperatures. This allows not only an accurate evaluation, but also a better understanding of the gasification reaction mechanism. The description of optical temperature measurement will be published shortly in a following paper. In order to investigate the plasma influence on pyrolysis and charcoal gasification, wood and charcoal powders are used.

2. State of the Technologies

2.1. Utilization of Plasma Technologies

Plasma technologies using both non-thermal and thermal plasma find application in different areas of energy process technology. In [9], non-thermal plasma accelerated the conversion of methane into synthetic fuels. High-energy electron impact initiates methane partial oxidation, enabling a single-step CH4 conversion with oxygen into various oxygenates, such as methanol, formaldehyde and formic acid. Coal gasification was conducted with steam microwave plasma in [10]. Hydrocarbon fuel was reformed at atmospheric pressure using a high-temperature steam torch. Ni et al. [11] investigated the decomposition mechanism of phenol treated with steam plasma jet. In [12], a downstream thermal plasma torch cracked the tar products from the syngas out of a stationary fluidized-bed gasifier. The results showed that almost all kinds of tar groups (primary, secondary and tertiary) were completely reformed into carbon monoxide and carbon dioxide [12]. The most active species in decomposing tar are the oxygen function groups (O, OH, CO) [12]. Kempe et al. [13] utilized a non-thermal plasma source for biomass gasification in order to generate high concentrations of combustible gases. In [14], a water plasma reformed methane and carbon dioxide at atmospheric pressure.
Aside from research activities at research institutes, several companies from around the world have already brought commercial products onto the market. The Longyuan company in China developed a plasma-assisted ignition device for coal power stations [15]. By replacing the original oil ignition device, the air pollution caused by sulfate compounds can be avoided [15]. Two German companies, PlasmaAir AG [16] and Rafflenbeul Anlagenbau GmbH [17], use non-thermal plasma technology mainly in the field of the decontamination of exhaust gas. In Canada, the company PyroGenesis developed a steam plasma torch for hydrocracking, biomass gasification and cleaning of effluent streams [18,19]. Plasma Arc Technologies Inc. [20] and Westinghouse Electric Corporation [21] from USA concentrate on waste-to-fuel process using the plasma technology.

2.2. Biomass Gasification

Depending on the fuel particle size, the processes during gasification can be categorized into three major steps, with the physical and chemical procedures being similar in different types of gasifiers. The first step is known as the drying process, in which the added heat evaporates the water content in the fuel particles, and which is followed by the pyrolysis process. Depending on the heating rate (from several K/min in slow pyrolysis up to 500 K/min in fast/flash pyrolysis), the fuel particles decompose to gaseous products (CO, CO2, CH4, H2 etc.), tar products and solid residues (coke particles and ash). Introducing the gasification medium (air, pure oxygen, water steam, carbon dioxide, etc.) to the reactor, the major gasification reactions take place. These include homogenous gas-gas reactions, e.g., water-shift reaction, and heterogeneous reactions, e.g., coke-steam/oxygen reactions. In the presence of oxygen in an air-blown gasifier, an additional partial combustion provides the needed heat for the reactions mentioned above.
The oldest gasification type is the air-blown fixed-bed reactor, which operates with a large fuel diameter. In the stoichiometric region (i.e., at relative air-fuel ratio λ = 1), the reaction temperature is between 1500 and 2500 °C [22]. Due to the relatively low outlet temperature of 400–650 °C (downdraft) and approximately 100 °C (updraft), the syngas contains about 10% methane. The updraft-gasifier is characterized by high tar content in the produced syngas.
Fluidized-bed gasifiers operate at average temperatures of between 800 and 900 °C [23]. Despite different stationary or circulated reactor structures, the bed material (e.g., sand) guarantees a uniform temperature profile in the reactor, which makes this technology attractive for application in large-scale plants [22]. Depending on how the bed temperature is maintained, either autothermal or allothermal methods can be applied. For example, the allothermal biomass gasification plant in Güssing is based on two corresponding fluidized beds. One combustion chamber is used to heat the bed material. Afterwards, this sensible heat is used in the gasification chamber for an allothermal gasification process [24]. Karl [25] implemented a similar gasification process with indirect heat transfer through heat pipes between two bubbling fluidized beds. In both cases, the combustion process is separated from the gasification chamber. Both concepts allow the production of nitrogen-free syngas from steam gasification with high heating values. However, the tar problem still remains, and in [12,26] different plasma technologies were applied to address it.
The entrained-flow gasifier operates at much higher temperatures of 1300–1400 °C, with a fuel diameter of around 10–20 µm. Entrained-flow gasification is usually based on oxygen as the working medium for the autothermal reaction. The extremely high reaction temperature leads to a carbon conversion of almost 95–99% within a short residence time [23]. Pure oxygen is obtained from an air separation unit (ASU). The major advantages of using oxygen as the working medium are the high caloric value of the syngas and the produced syngas being free of tar products. In the case of entrained-flow biomass gasification, air or oxygen-enriched air is normally applied as gasification medium. The fuel particles need to be ground to a micrometer scale. Additionally, it has to be noted that a high chlorine content in the fuel can cause corrosion problems in the reactor [22,27,28].
Further literature related to biomass gasification can be found in recently published work [29,30,31,32,33,34].

3. Materials and Methods

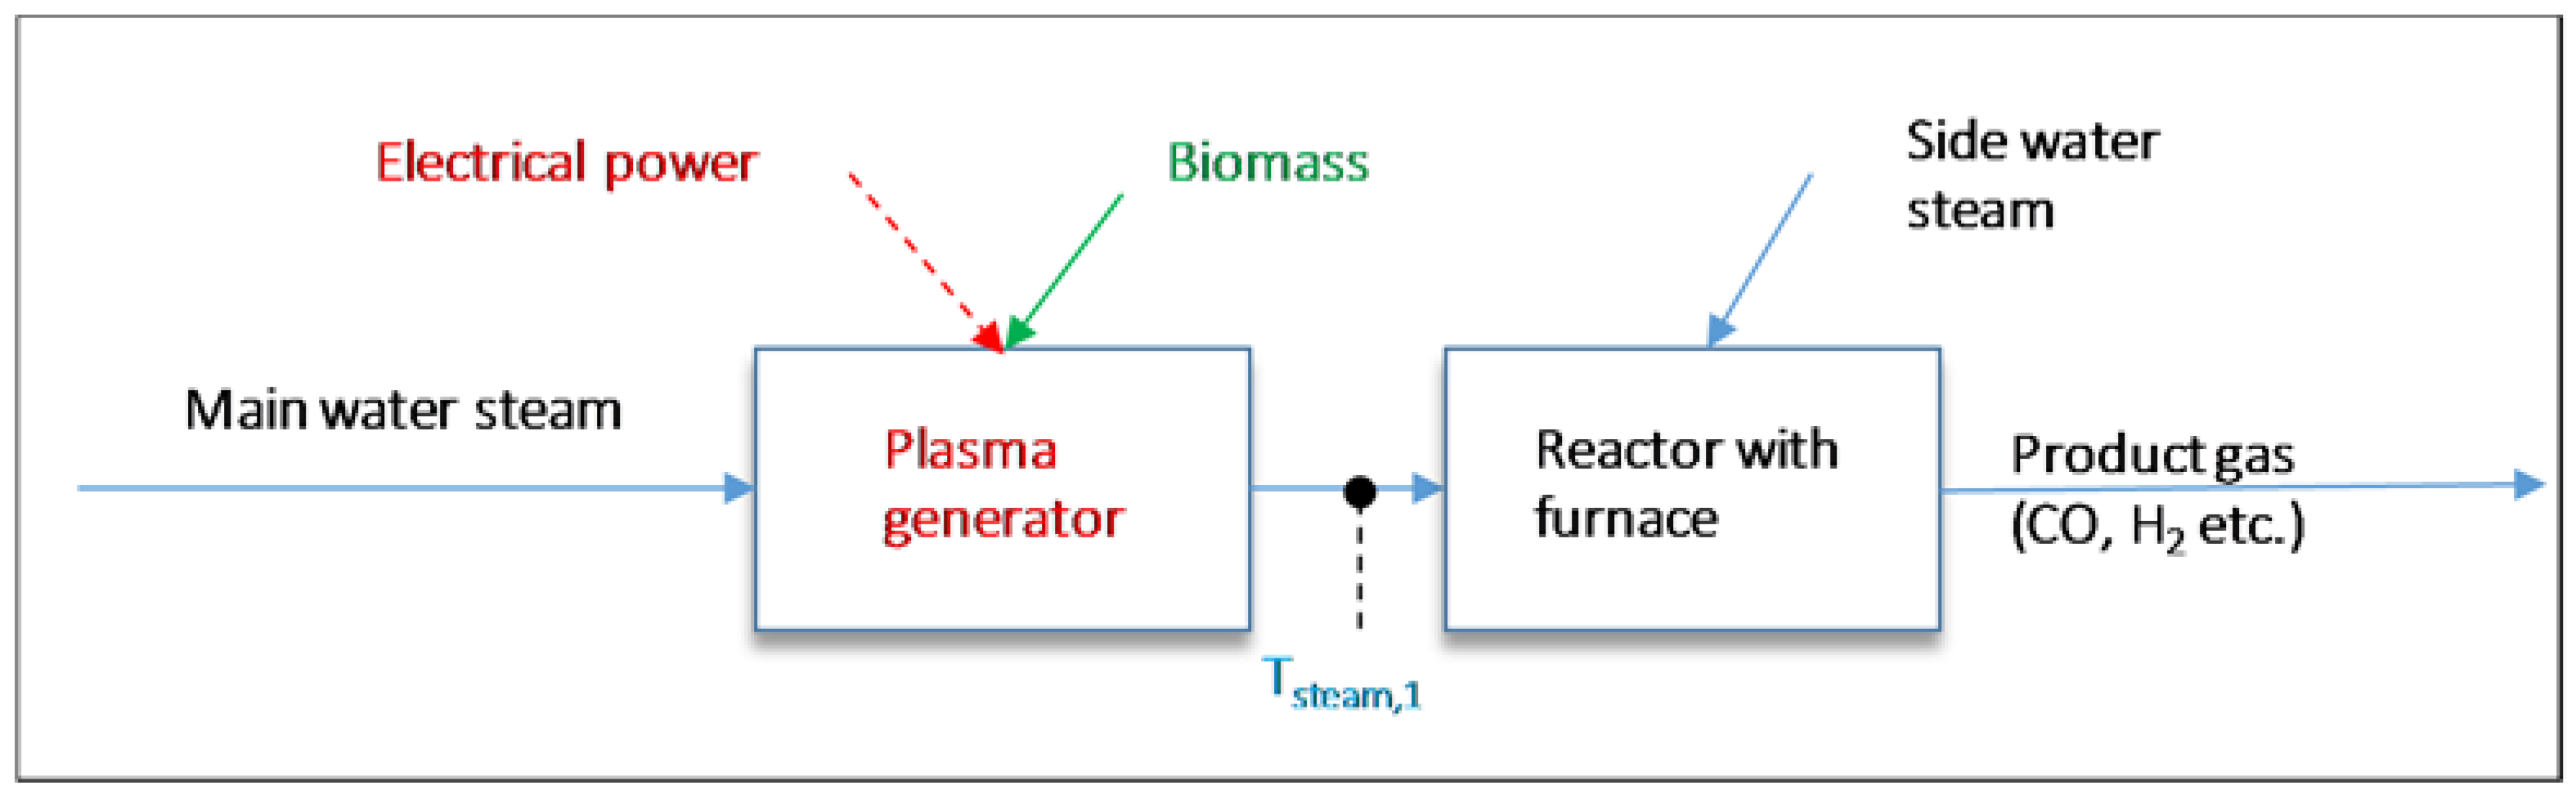
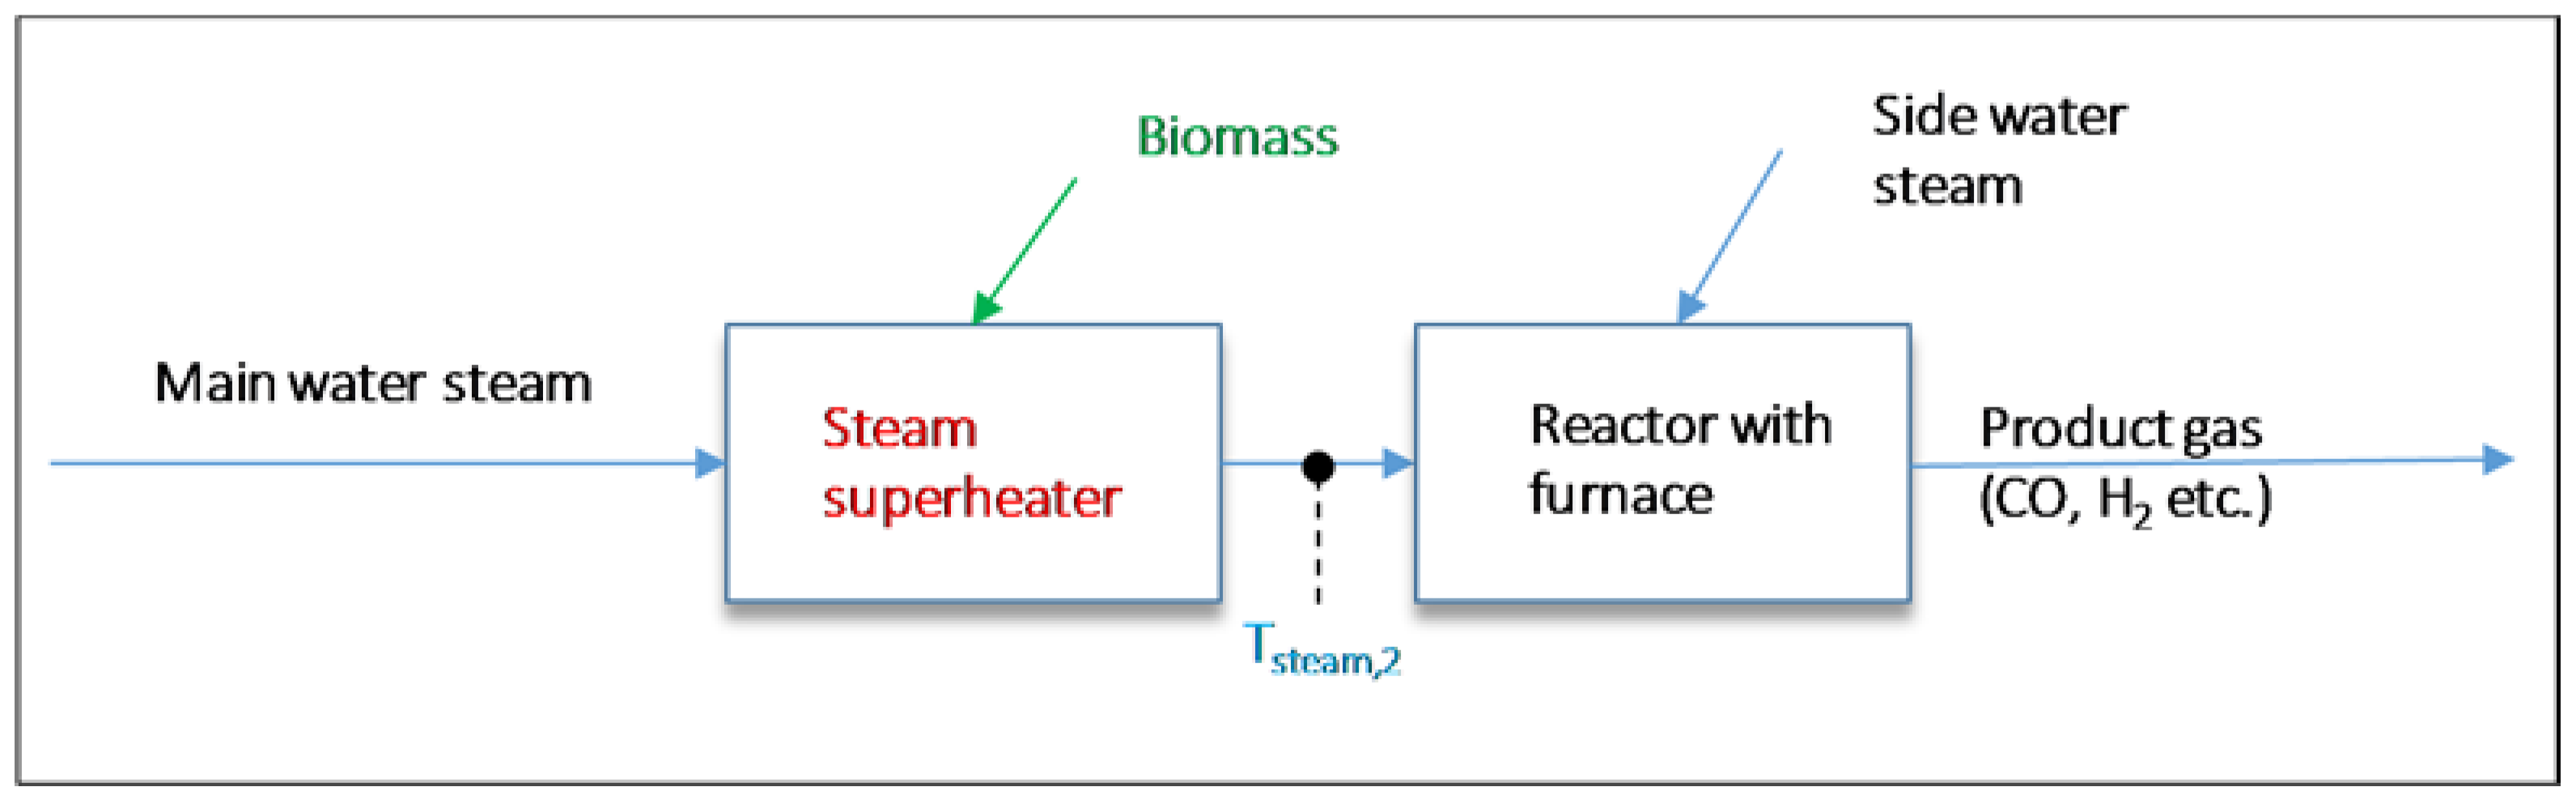
3.1. Experimental Methods

The influence of plasma on the chemical reactions is based on various factors, the two most important being thermal activation caused by gas heating and the generation of reactive species (neutral radicals and ions) caused by electron collision processes (hereafter called electronic activation). In this paper, a direct comparison between the plasma and thermal gasification was conducted in order to distinguish between thermal activation and electronic activation.
Figure 1 presents the experimental method for plasma-assisted gasification. In case 1, conditioned main water steam is the working medium of the non-thermal plasma (NTP) generator. Based on the main water steam flow rate, the feed temperature, electrical plasma input power, and gas temperature of the water steam flow-down of the plasma generator can be calculated based on the assumption of thermal equilibrium. Later on, the gas temperature is measured by using the optical measurement technique. Biomass particles are introduced into the plasma generator in such a way that they fall through the region in which gliding arc plasma filaments occur, guaranteeing a close interaction between the plasma and the biomass particles. The gasification process, including drying, pyrolysis and charcoal gasification, takes place in the drop tube reactor in which the side water steam is added to adjust the steam-to-carbon (S/C) ratio. Finally, the product gas is sampled for gas analysis.
Figure 2 shows the experimental method of thermal gasification as a reference case. The major difference compared to plasma-assisted gasification lies in the steam superheater, which brings the main water steam to the same temperature as that calculated for the plasma case (Tsteam,1 = Tsteam,2).
Based on a comparison between the plasma and the thermal case, the influence of the electronic activation on the gasification reactions can be experimentally determined.

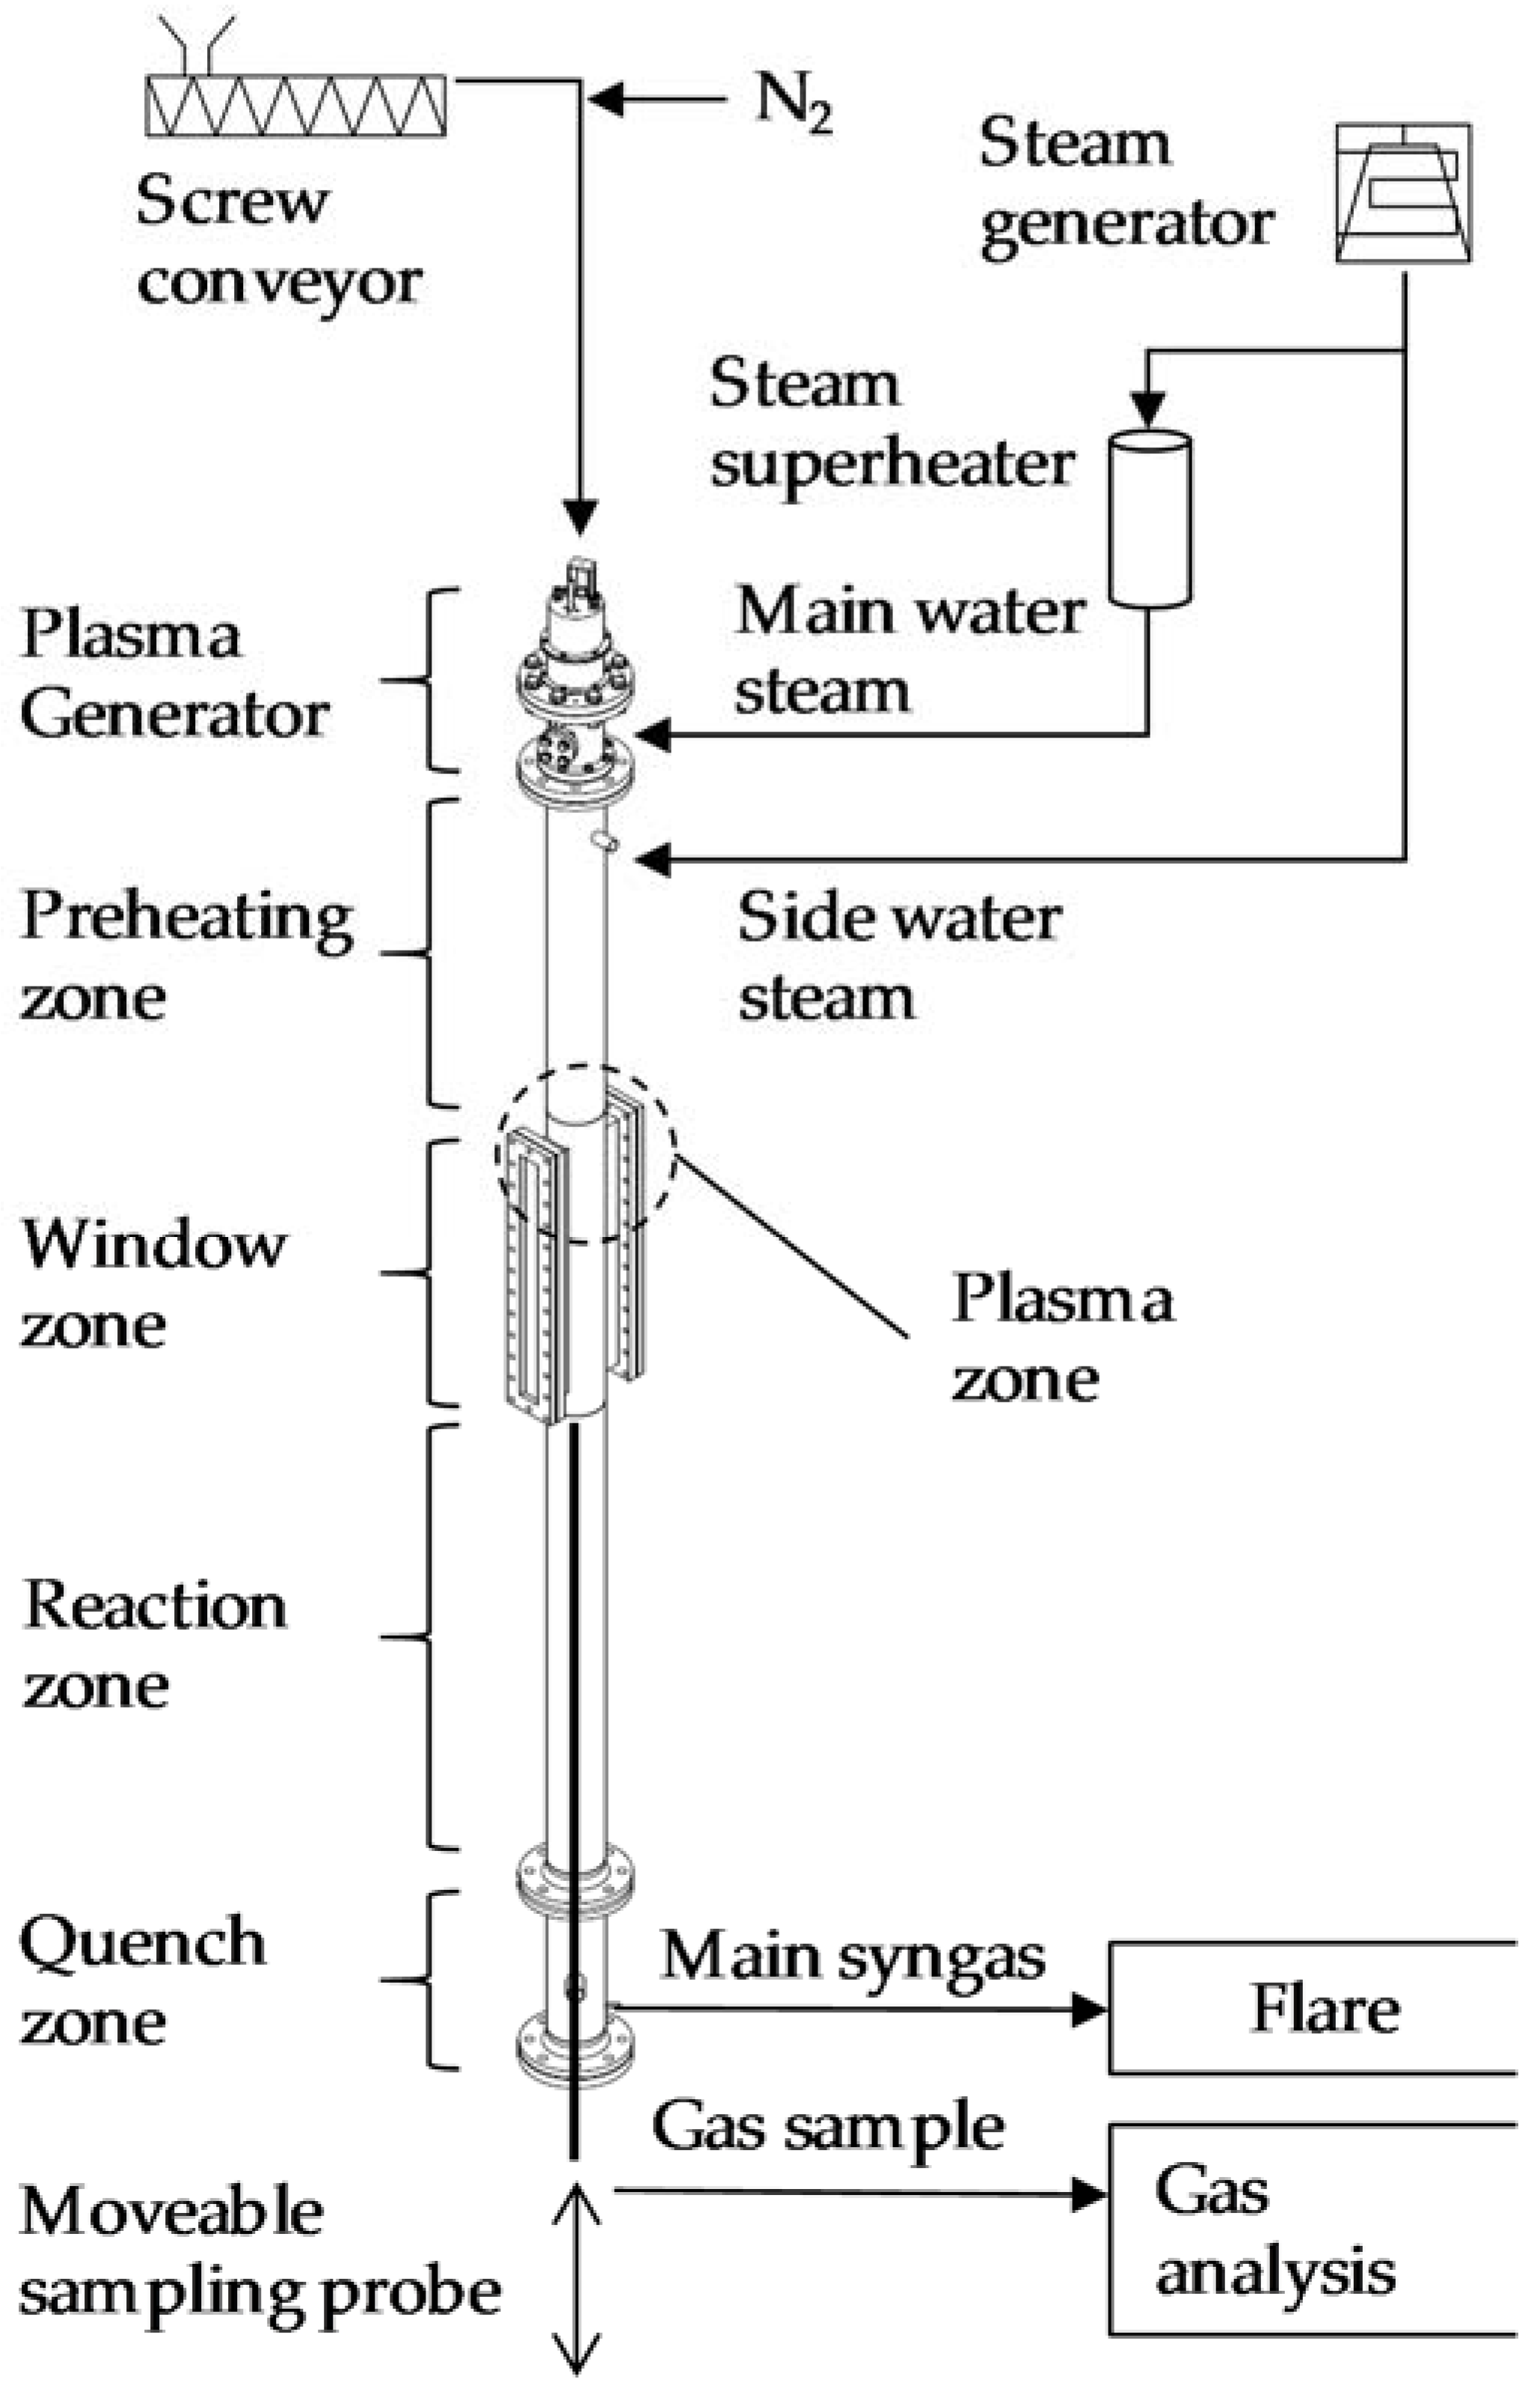
3.2. Experimental Setup

Figure 3 shows the schematic of the experimental setup. The screw conveyor feeds the solid fuel particle with nitrogen purge into the reactor. Because the volume flow rates of nitrogen are known, nitrogen purge can further be used as a tracer for the calculation of the syngas production rates. The screw conveyor operates on the volumetric principle with twin screw compact feeder and allows a very precise feeding of the fuel particles. Table 1 presents the characteristics of the solid fuel particles.
The steam generator provides both the main water steam as the working medium and the side water steam for S/C adjustments (see Figure 1 and Figure 2). The steam mass flow is measured and controlled by Coriolis and orifice plate flow meters, respectively. In the reference case, the steam superheater adjusts the temperature of the main water steam to the experimental condition. The plasma generator is installed on the top of the reactor. Two electrodes with a length of about 1 m ignite the non-thermal plasma in the window zone (see Figure 3).

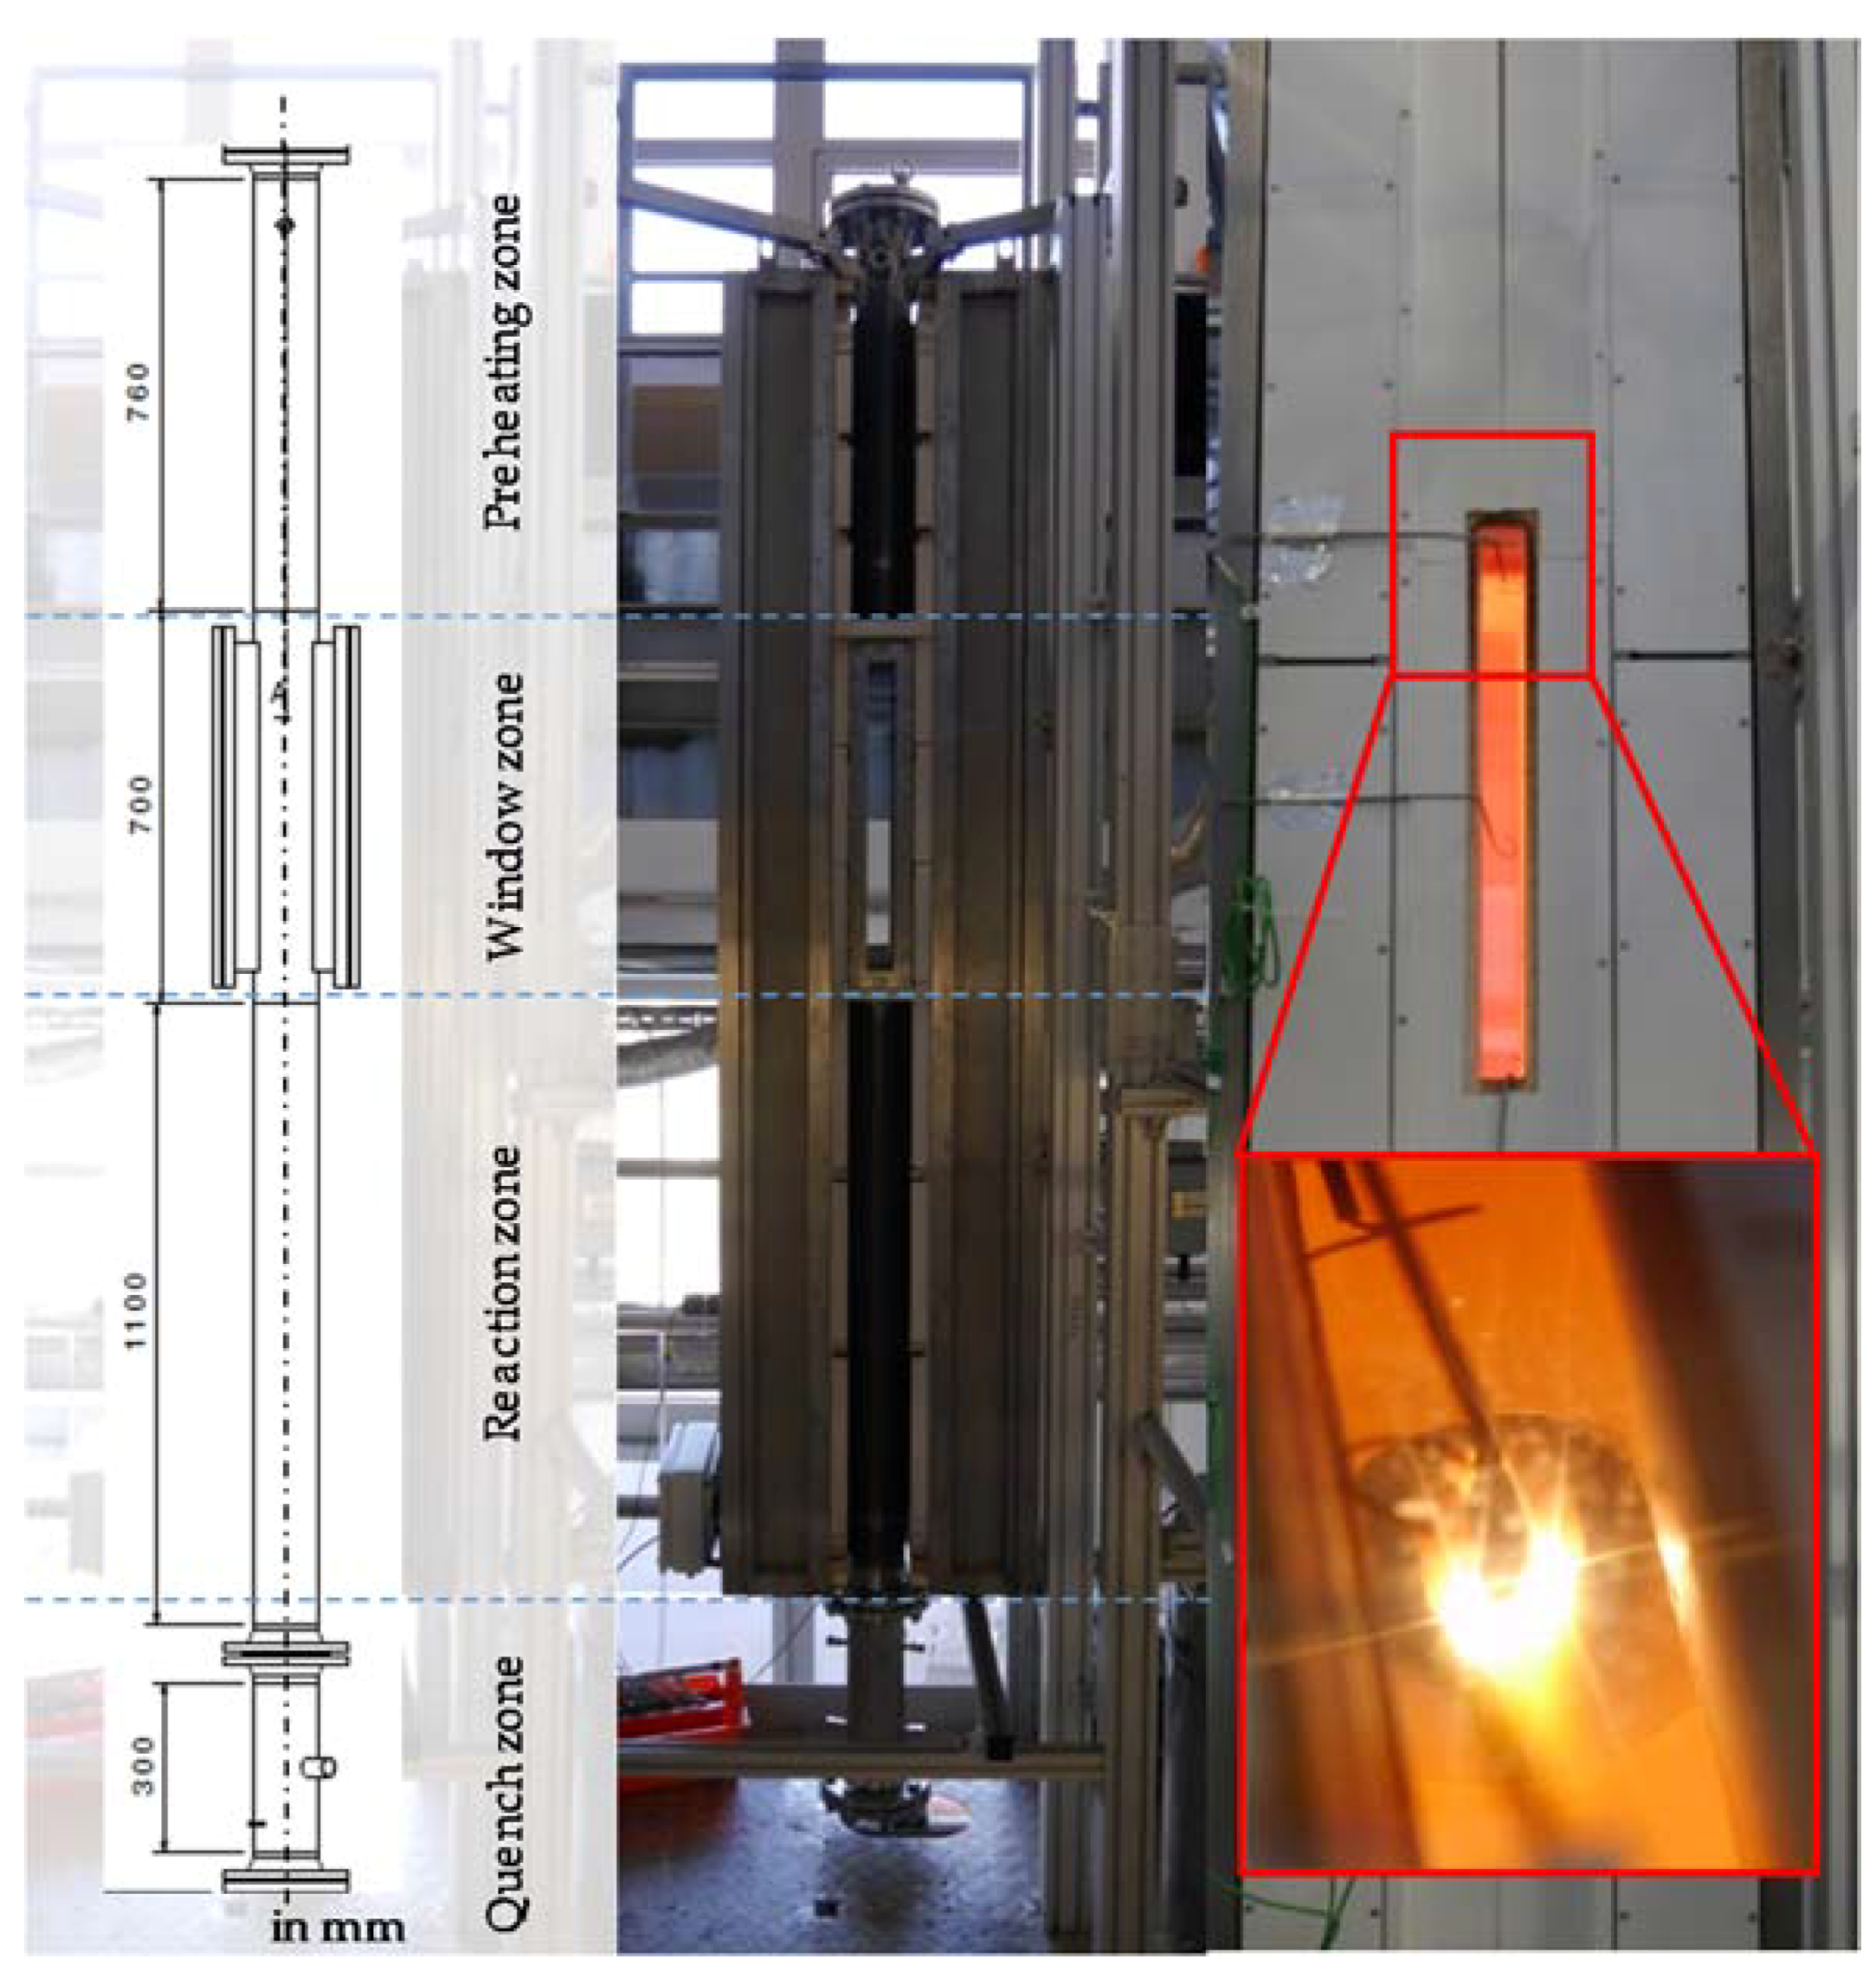
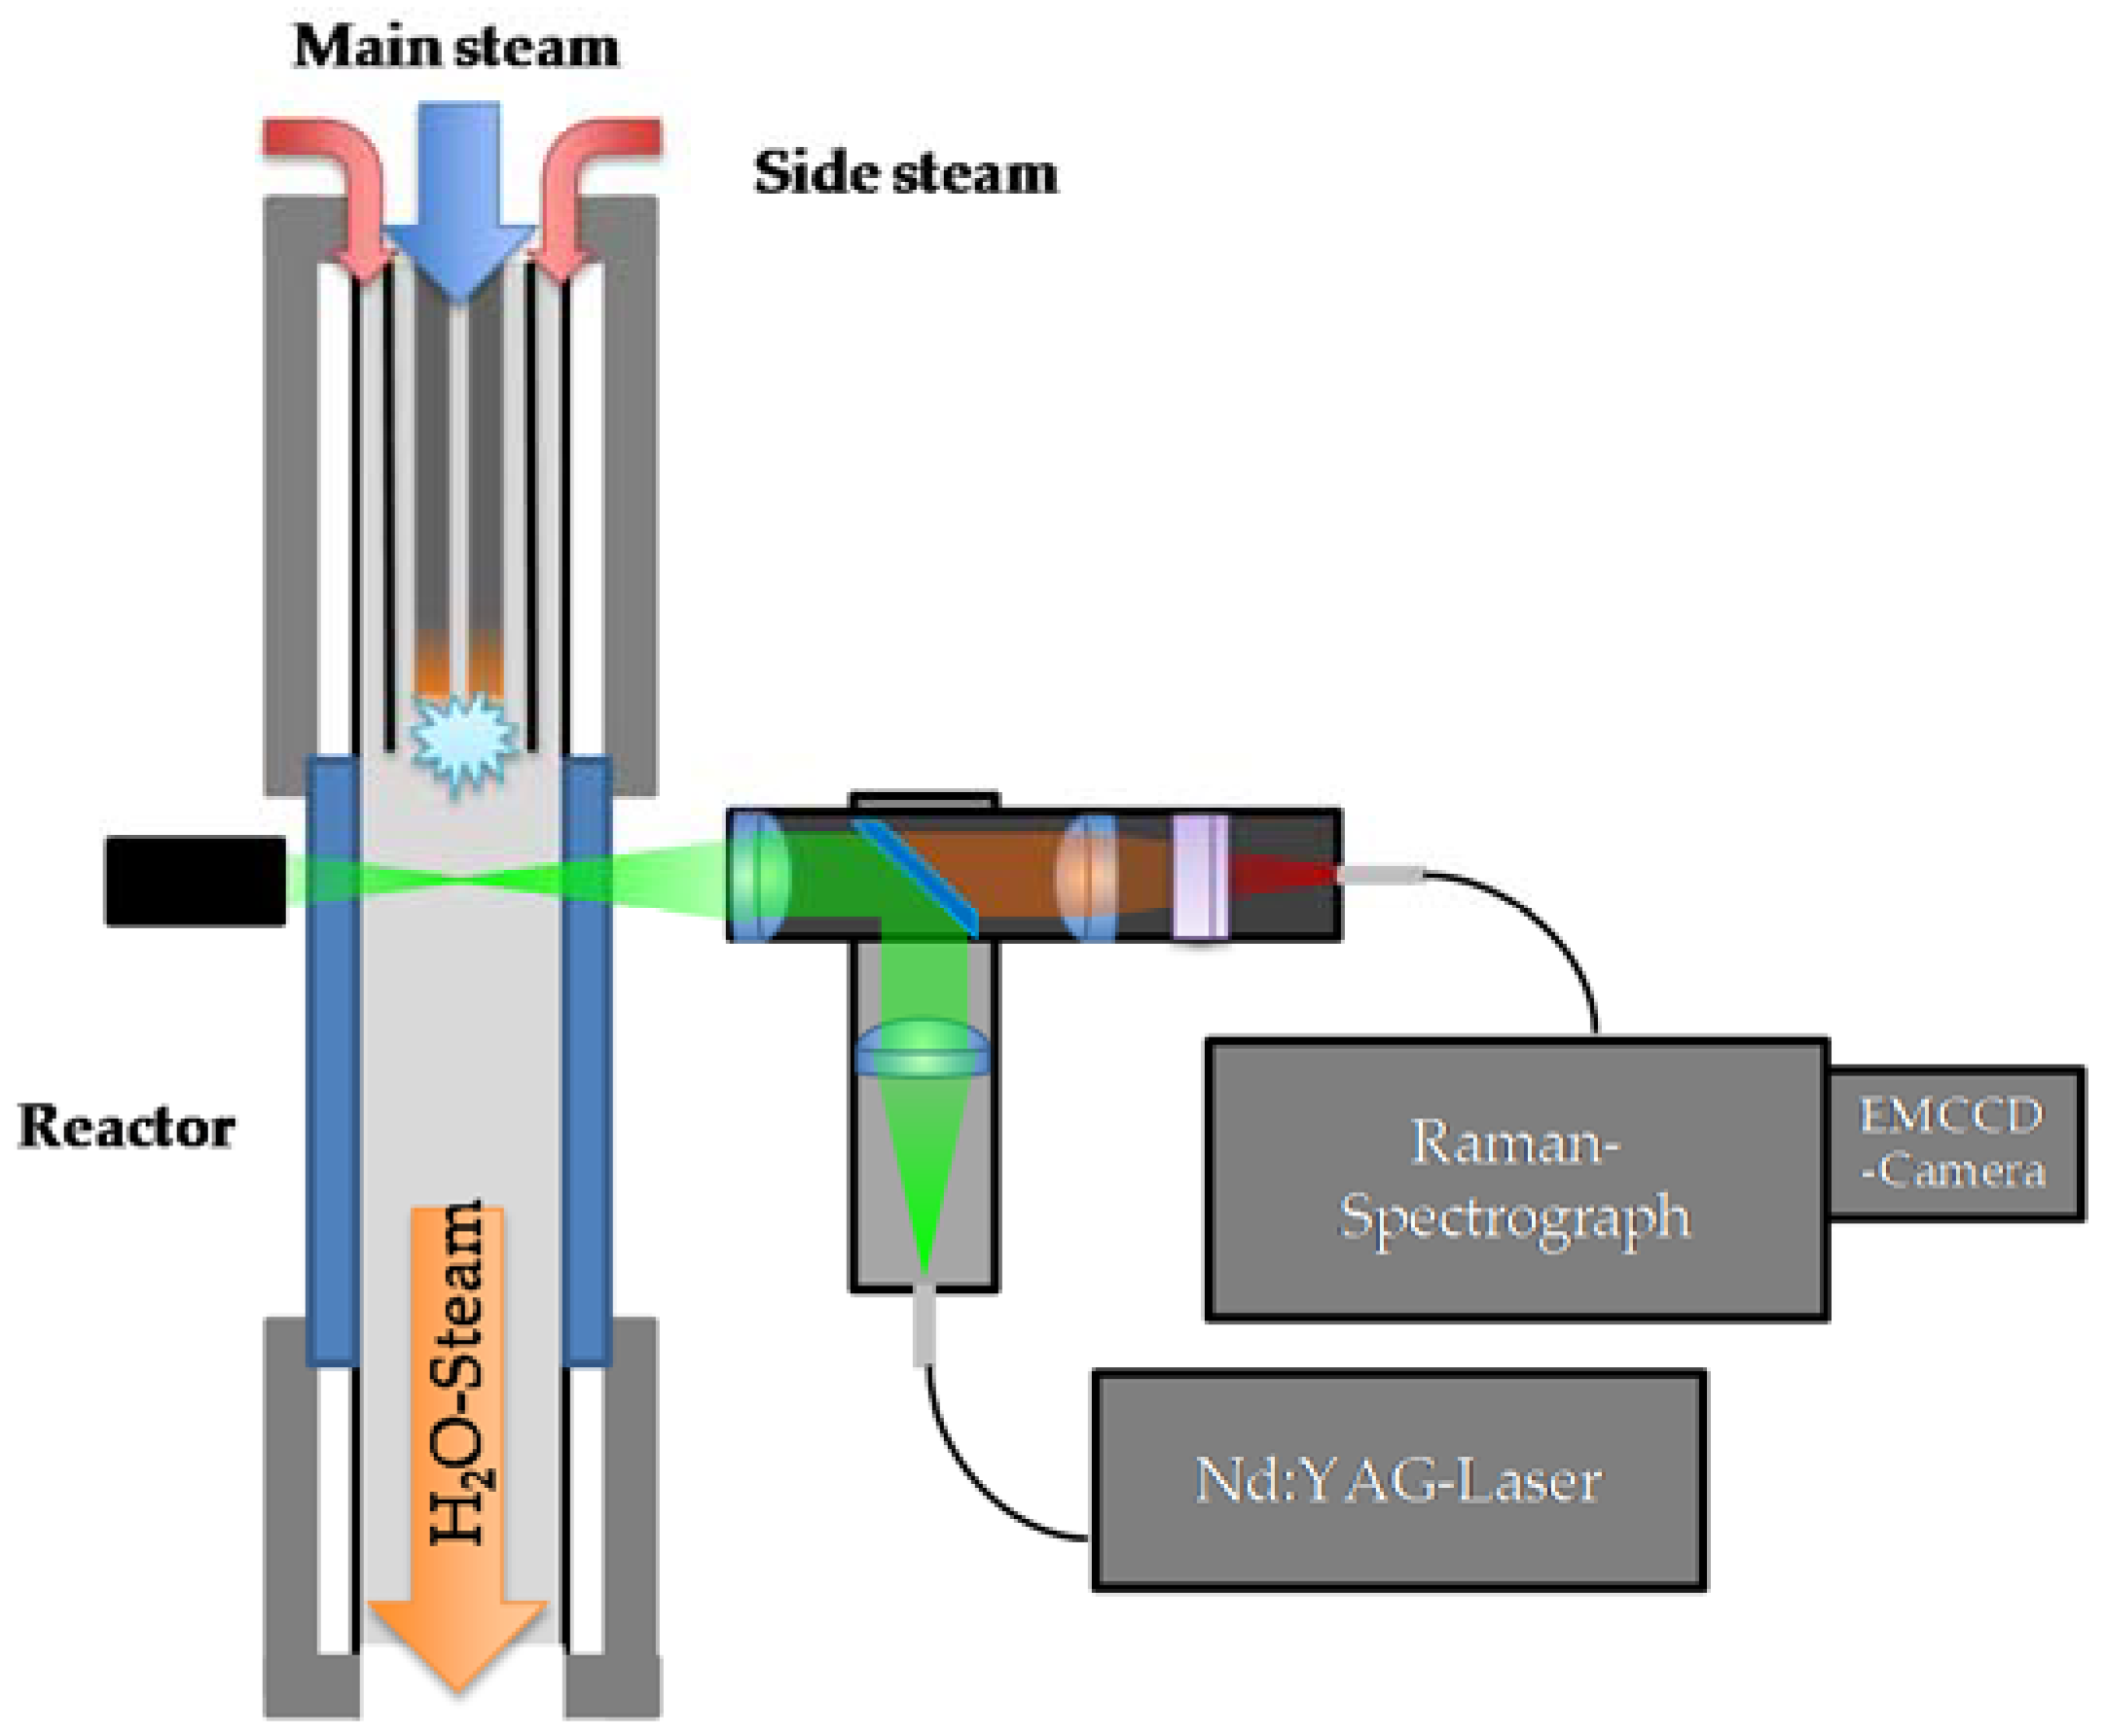
3.2.1. Drop Tube Reactor

A major component of the test rig is the drop tube reactor with an electrical heater, as shown in Figure 4. The electrical furnace can heat the reactor up to 1000 °C, which is necessary for the gasification experiments. The reactor consists of a preheating zone, a window zone, a reaction zone and a quench zone. In the preheating zone, the furnace conditions the temperature of the side water steam for the experiment. After the preheating zone, both water steam flows are combined in the window zone, where fuel particles are added, and the gliding arc plasma is operated such that the fuel particles fall through the non-thermal plasma region. The window zone allowing optical access of the reactor for temperature measurements is equipped with two rectangular quartz glasses (length 500 mm, width 50 mm) mounted in the front and rear parts of the reactor. In order to compensate for the heat loss due to the glasses, the furnace heats the window zone to the same temperature as the preheating and the reaction zone. In the following reaction zone, gas samples are drawn at different heights by means of a vertically adjustable gas probe and transferred to gas analysis. This makes it possible to vary the residence time of fuel particles. The gas sample after suction in the probe is immediately cooled down to avoid further reactions. After passive cooling in the quench zone, the synthesis gas containing carbon monoxide and hydrogen enters the flare. The sampled gas probe, however, is investigated with a gas analyzer.

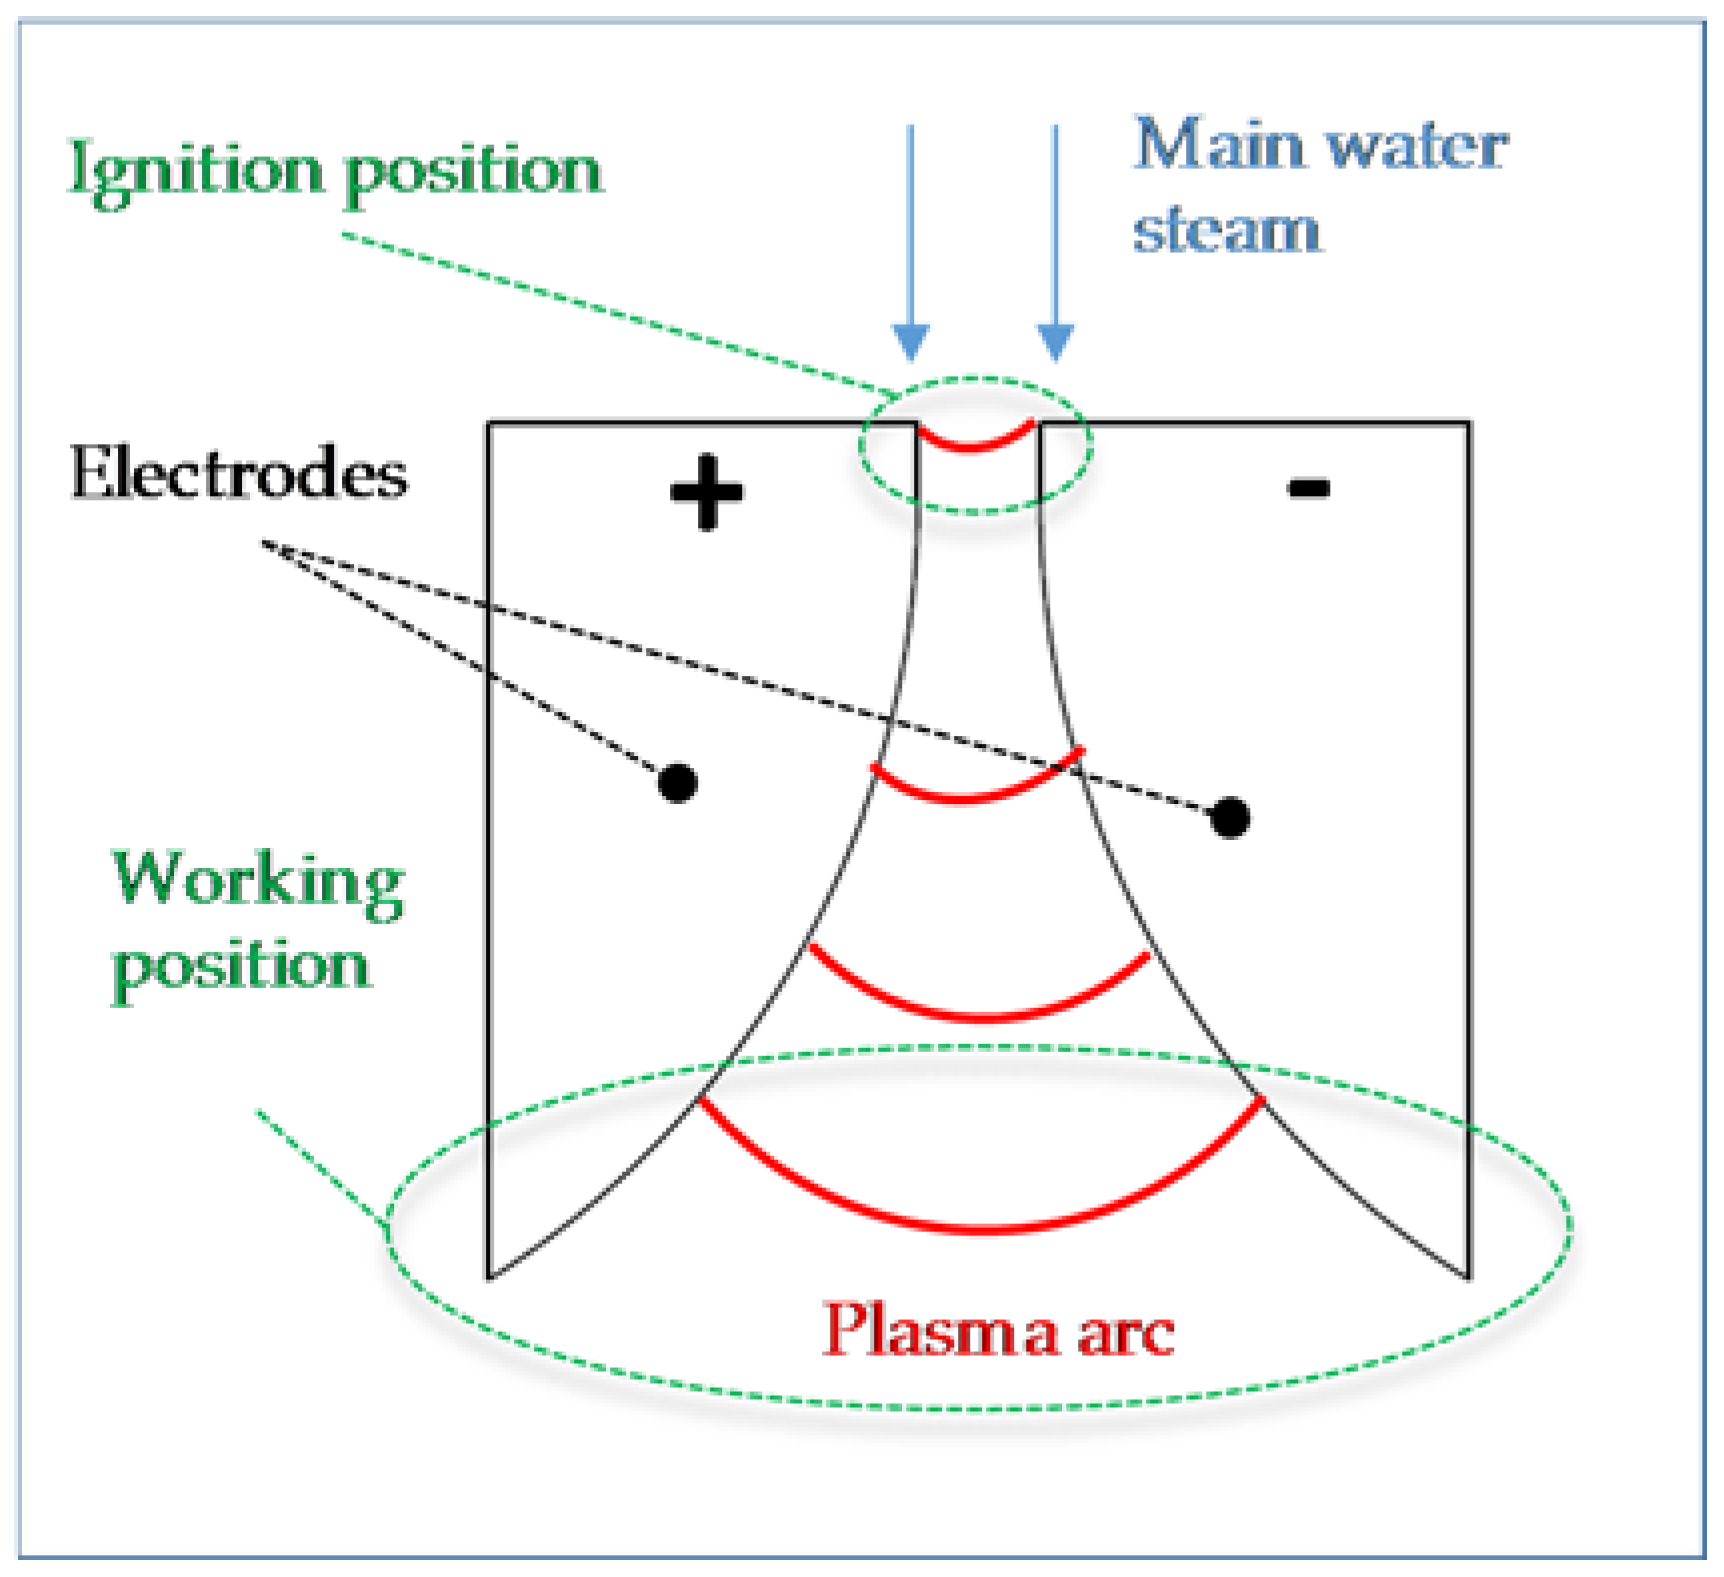
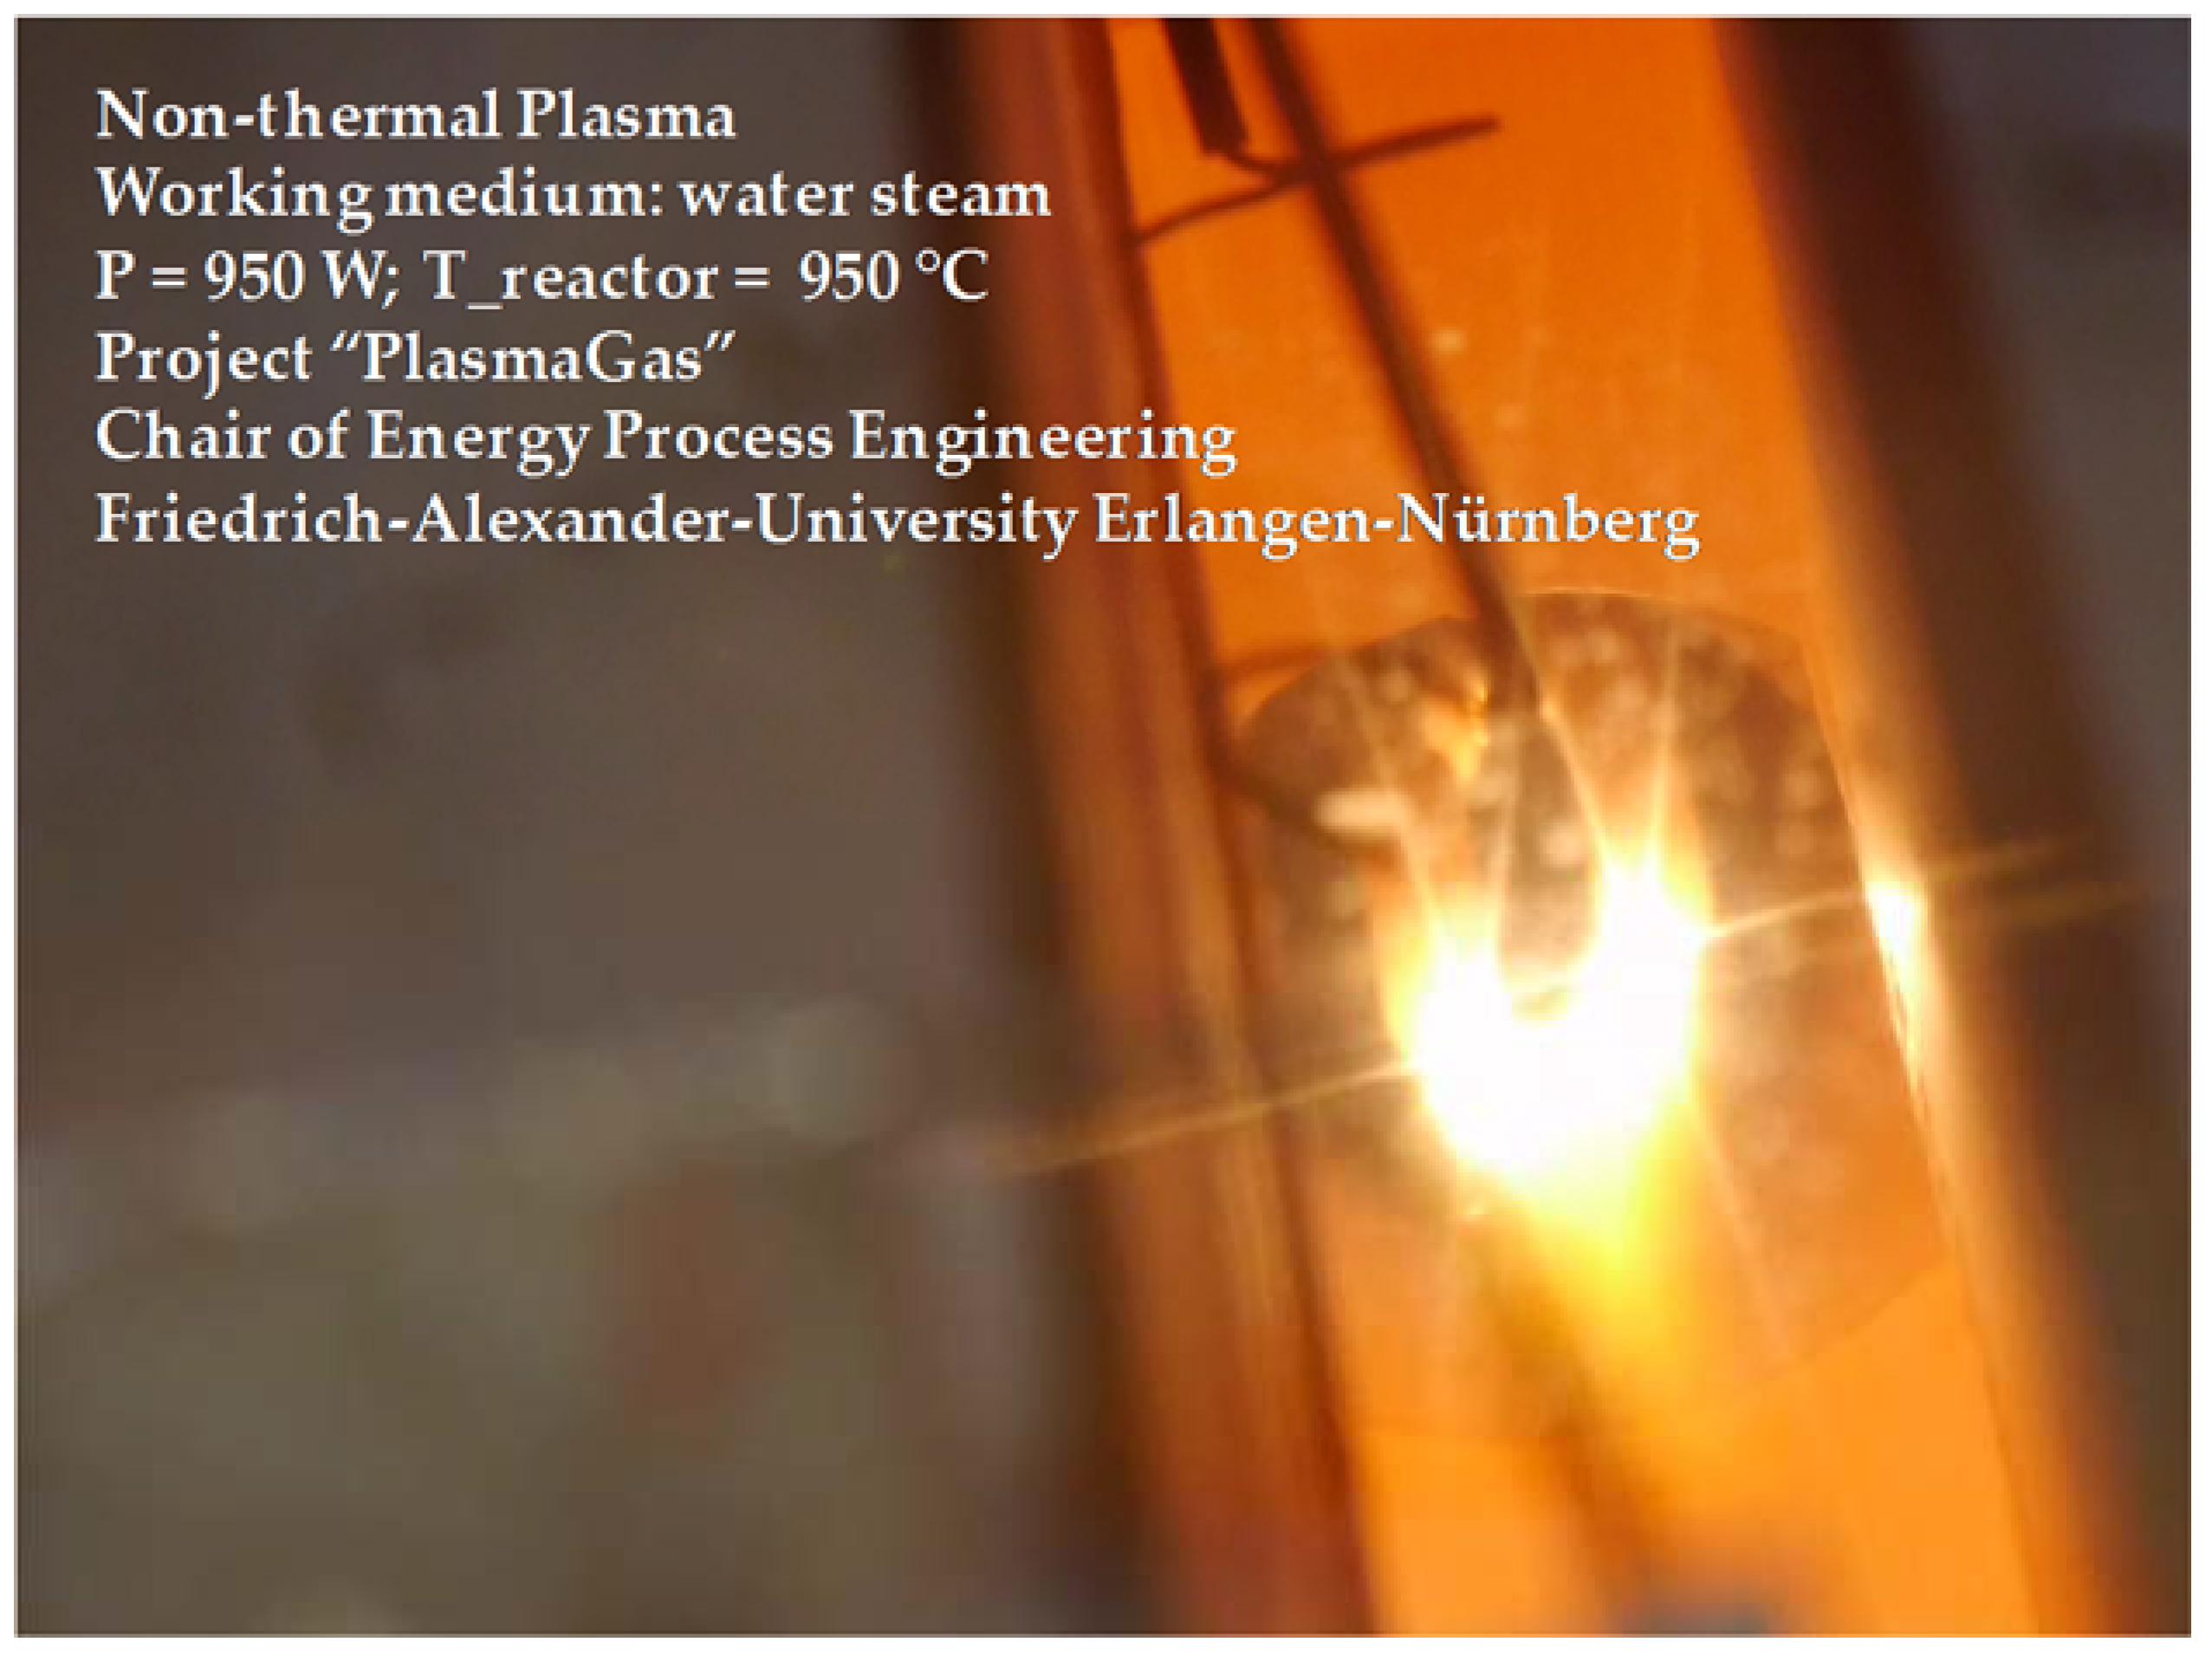
3.2.2. Non-Thermal Plasma Generator

The key component of the test-rig is the gliding arc plasma generator mounted from the top of the drop tube reactor. It consists of two diverging electrodes (schematically shown in Figure 5), which are supplied by a medium-frequency high-voltage power supply (Redline G2000, maximum voltage amplitude 10 kV, typical operation frequency 90 to 100 kHz). A 1-m-long feed structure is utilized in order to enable plasma operation in the window zone. Under optimum operation conditions, an average power of 1000 W can be supplied to the gliding arc plasma. The electrodes provide an electrode gap that increases in flow direction from 2 mm to about 20 mm. Arc ignition takes place at the smallest distance, where voltage amplitudes of less than 1.5 kV are required to maintain the plasma (see Figure 6). Due to the interaction of arc and gas flow, the arc moves along the diverging electrodes. Thus, the gliding arc is characterized by rapidly increasing length of the arc filament, causing increasing voltage. When the gliding arc reaches the electrode tips, it further expands into the volume until the voltage amplitude reaches about 8 kV. Then the arc extinguishes, and re-ignition occurs at the smallest distance. Thus, the arc voltage and current amplitudes vary on the time scale of milliseconds from 1.5 kV to 8 kV and 700 to 400 mA, respectively. By visual inspection, the maximum length of arc filaments was found to be 10 to 15 cm. Voltage and current clearly indicate that the gliding arc plasma is non-thermal.
Inside of the rapidly changing arc volume, water molecules are ionized and dissociated. Due to the diffusion and rapid movement of the arc, ionization and dissociation products leave the arc filament and recombine. Thus, heat transfer from the arc filament to the surrounding water steam is enhanced. Because of the non-thermal character of the gliding arc filament ion and radical concentrations are strongly enhanced, as compared to thermal plasma with the same specific input enthalpy. Thus, an increase of reaction rates compared to thermal processes is to be expected [35].
Based on the measurements performed, it is not possible to distinguish ionization from dissociation of H2O; neither the degree of ionization nor the radical concentrations, e.g., of OH-radicals or H-radicals, were measured. Thus, the only information available is the (time-resolved) voltage drop between the electrodes and the electrical current flowing through the non-thermal plasma (s. Figure 6). This allows the power input and the impedance of the non-thermal plasma to be calculated. The impedance varying between 2 kOhm and 20 kOhm clearly indicates that the plasma is a non-thermal one. Because of the lack of information about active plasma volume and local temperature in active plasma, this does not allow evaluation of the degree of ionization.
However, considering the rate coefficients for the following electron collision reaction [35,36]:
H 2 O + e H + OH
H 2 O + e H + OH
H 2 O + e O + H 2
H 2 O + e H + OH
H 2 O + e H 2 O + + 2 e
Using BOLSIG+ software [37] leads to the conclusion that dissociative processes forming OH-radicals will dominate.

3.2.3. Gas Temperature Measurement

In order to compare both gasification processes (thermal and plasma-assisted) appropriately, a comprehensive knowledge and control of the gas temperature is essential. Heat and mass transfer calculations help to estimate those temperatures at different locations and with varying process parameters. Nevertheless, completely integrating all influences was not possible due to there being too many unknown parameters in the complex system. Hence, temperature measurements were necessary, and were mostly achieved by standard thermocouples. Inside the drop tube reactor, especially in the areas close to the plasma, thermocouples could not be utilized since this would have led to flashovers.
Therefore, we conducted the local temperature measurements of the water gas phase by the laser-based optical method Raman spectroscopy. This optical measurement method is non-invasive, as it does not interact with the reaction nor with the plasma. More details on temperature determination with Raman spectroscopy can be found in [38,39]. Additionally, a comprehensive description of the applied setup and analysis routine will be published in a forthcoming paper.
The gas temperature measurements took place without the addition of biomass particles, but under reactor conditions identical to those used for the gasification experiments. Because the emission spectrum of the plasma does not influence the measurement technique, the influence of the plasma on the gas stream temperatures could be determined. The gas temperature is optically measured in the window zone (see Figure 3 and Figure 4), 15 cm below the tip of the ignited non-thermal plasma filament. In the thermal case, the same measurement point is chosen. In Figure 7, a schematic overview of the measurement setup applied to the drop tube reactor is shown. This paper wishes to emphasize the spatial measurement section with Raman spectroscopy, which permits a spatially resolved temperature determination.
Raman spectroscopy
Under the given high temperature conditions at atmospheric pressure, Raman signal intensities are extremely low due to the generally low Raman scattering cross-sections and, moreover, the low molecule density in the gas stream. In addition, the reactor walls begin to emit black body radiation at elevated temperatures, which can superimpose the Raman signal in particular at temperatures above 700 °C. To counter these constraints, a high-power Nd: YAG continuous-emission (Pmax = 8 W) laser with an excitation wavelength of 532 nm was used for signal excitation and a measurement head (for signal excitation and collection) was designed in such a way as to achieve a very high degree of confocality. The latter was also required to be very robust to temperature, vibration and other disturbing influences applied to it. This was accomplished by a fiber-connected fully integrated design, which also allowed horizontal and vertical movement to measure temperatures at different heights and radial positions without realignment. A Shamrock i303 Spectrograph with 2400 lines/mm grating and a Newton EMCCD camera were used for signal acquisition. The integration time of a spectrum was 10 s, with 30 spectra recorded for each measurement point.
The Raman signal of the symmetrical stretching vibration v1 in the range of 3580 to 3670 cm−1 was analyzed to retrieve information of the gas temperature based on the changing shape of the data curve, which is temperature dependent. Due to the varying external light influences (sunlight, lamps, reactor radiation), all spectra had to be background-corrected prior to the further analyzing steps. The exact procedure will be explained in detail in a forthcoming publication.

3.3. Experimental Conditions

Table 2 summarizes experimental conditions. The furnace maintains the drop tube reactor at between 600 and 950 °C. The furnace temperature is set to be constant along the axis from preheating to reaction zones and gives the information of the temperature at the outer surface of reactor. The measurement of furnace temperature is conducted by thermocouples (Type K). The steam superheater conditions the temperature of the main water steam to 270 °C in the plasma case and to 650–730 °C in the thermal reference case. A mill grinds the solid particles to 700–1400 µm and to 90–1400 µm receiving wood and charcoal powder, respectively. The mass flows of the main and side water steam are set to 6 and 2 kg/h. This is due to the stability of plasma generator, which is explained in chapter 3.4. The mass flow of fuel is controlled by the rotational speed of the feeding screw. The selection of the mass flow is based on the assumption that no significant temperature change should occur due to endothermal steam gasification. An electrical power of around 900 W is applied and introduced into the reactor by the plasma generation.
The estimation of the particle residence time is based on the force equilibrium (6) of gravitational force FG (7), drag force FW (8) and buoyancy force FB (9). The results of the range of particle diameters used in our experiments are given in Table 3.
F G = F W + F B
F G = π 6 ρ p g d p 3
F W = π 8 c W ρ g d p 2 ( u g u p ) 2
F B = π 6 ρ g g d p 3
c W = 24 Re   f o r   0.1 < R e < 10
with
Both thermal and non-thermal plasma-assisted gasification are complex processes. Their micro-kinetic description would require a large number of volume and surface reactions, which in the case of non-thermal plasma-assisted gasification had to be amended by electron and ion kinetics. In order to simplify the evaluation of the results, only the following overall gasification reaction has been taken into consideration:
CHxOy + H2O → H2 + CO + CH4 + CO2 + tar
The concentrations of the gas components such as O2, H2, CO, CH4 and CO2 have been measured with a gas analyzer (ABB AO2000 System). The nitrogen concentration is calculated from the total gas composition as the remaining gas. Each individual gas volume flow rate can be determined by the known nitrogen flow rate, which is controlled by mass flow controllers.

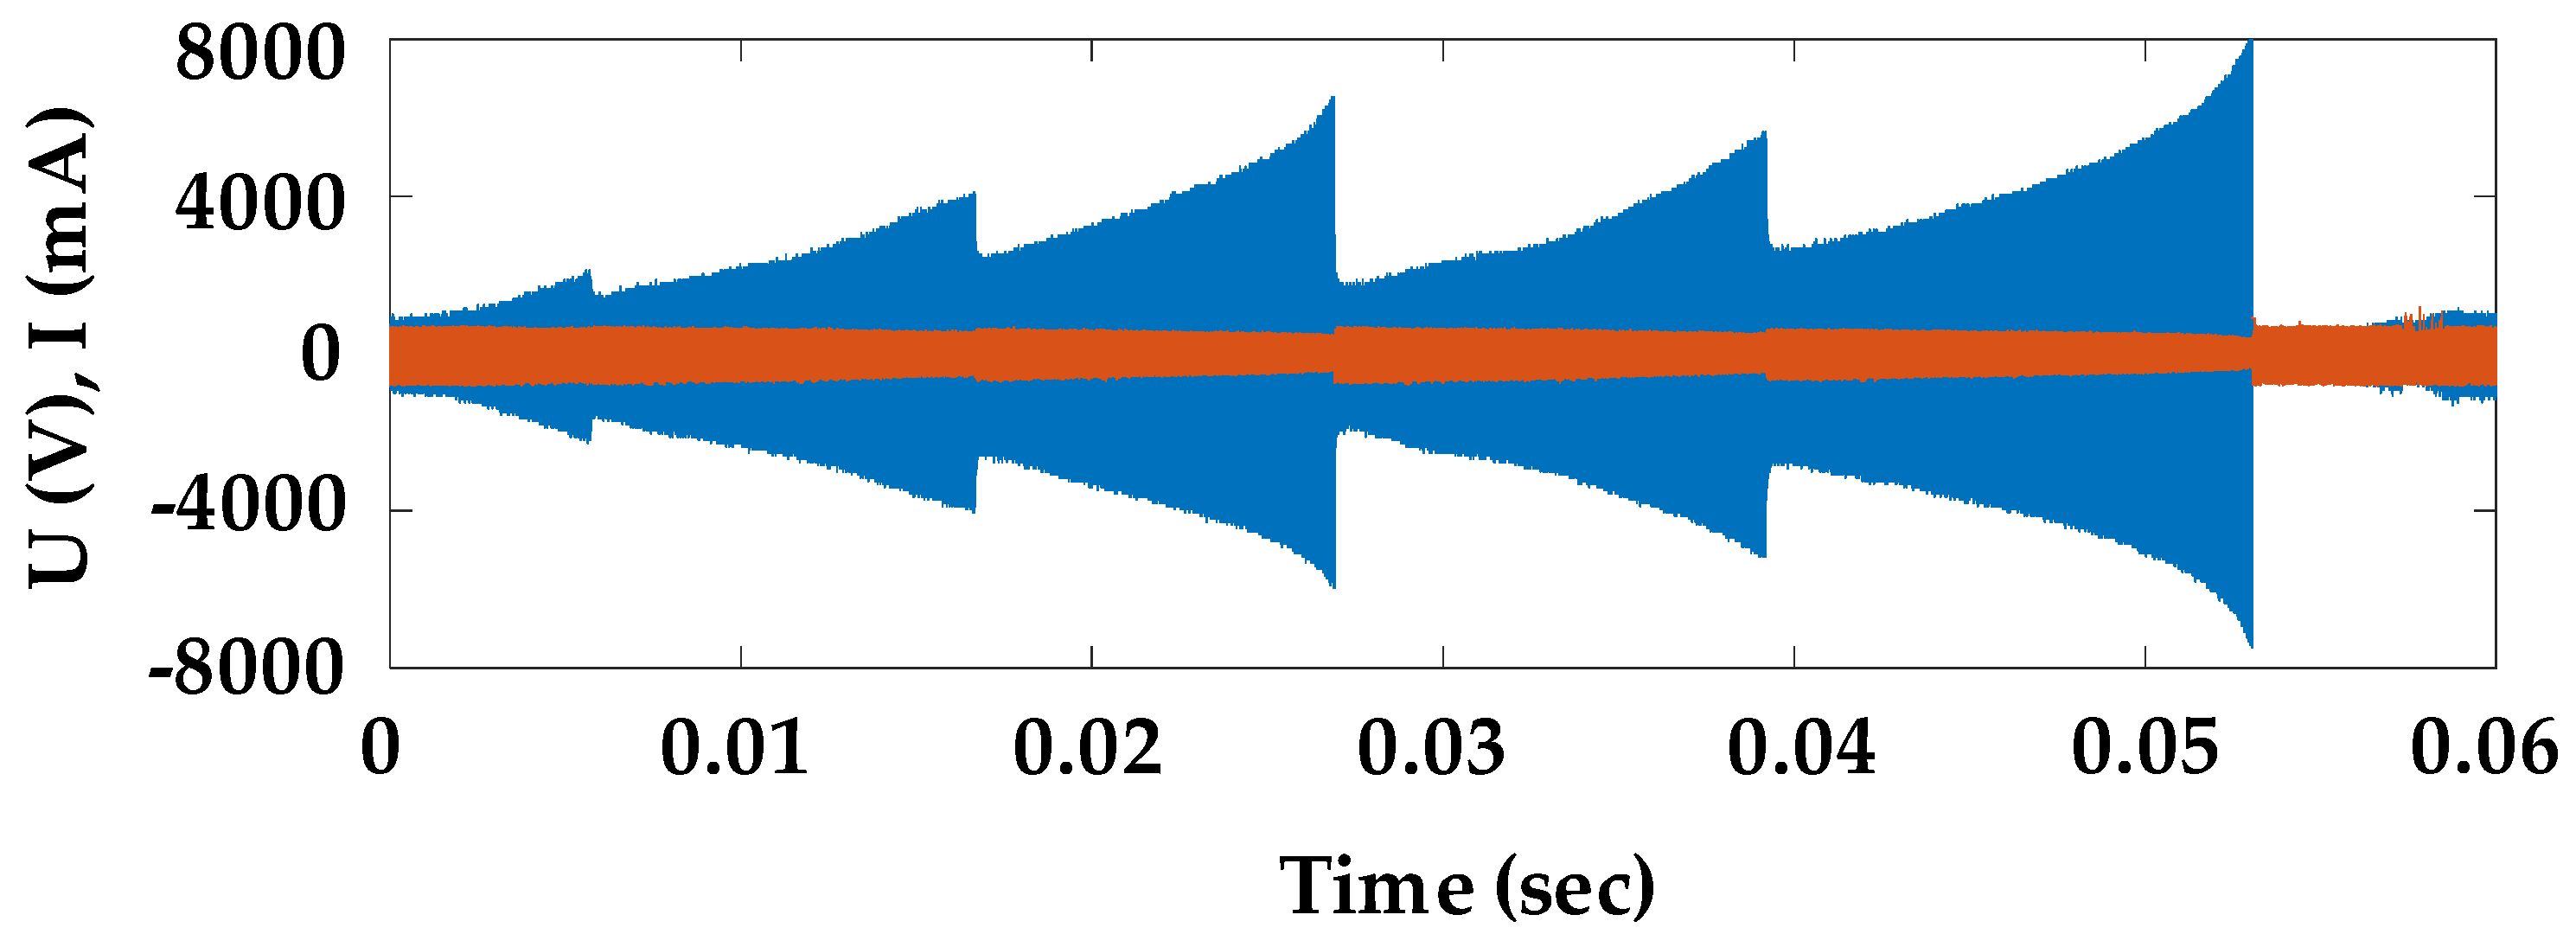
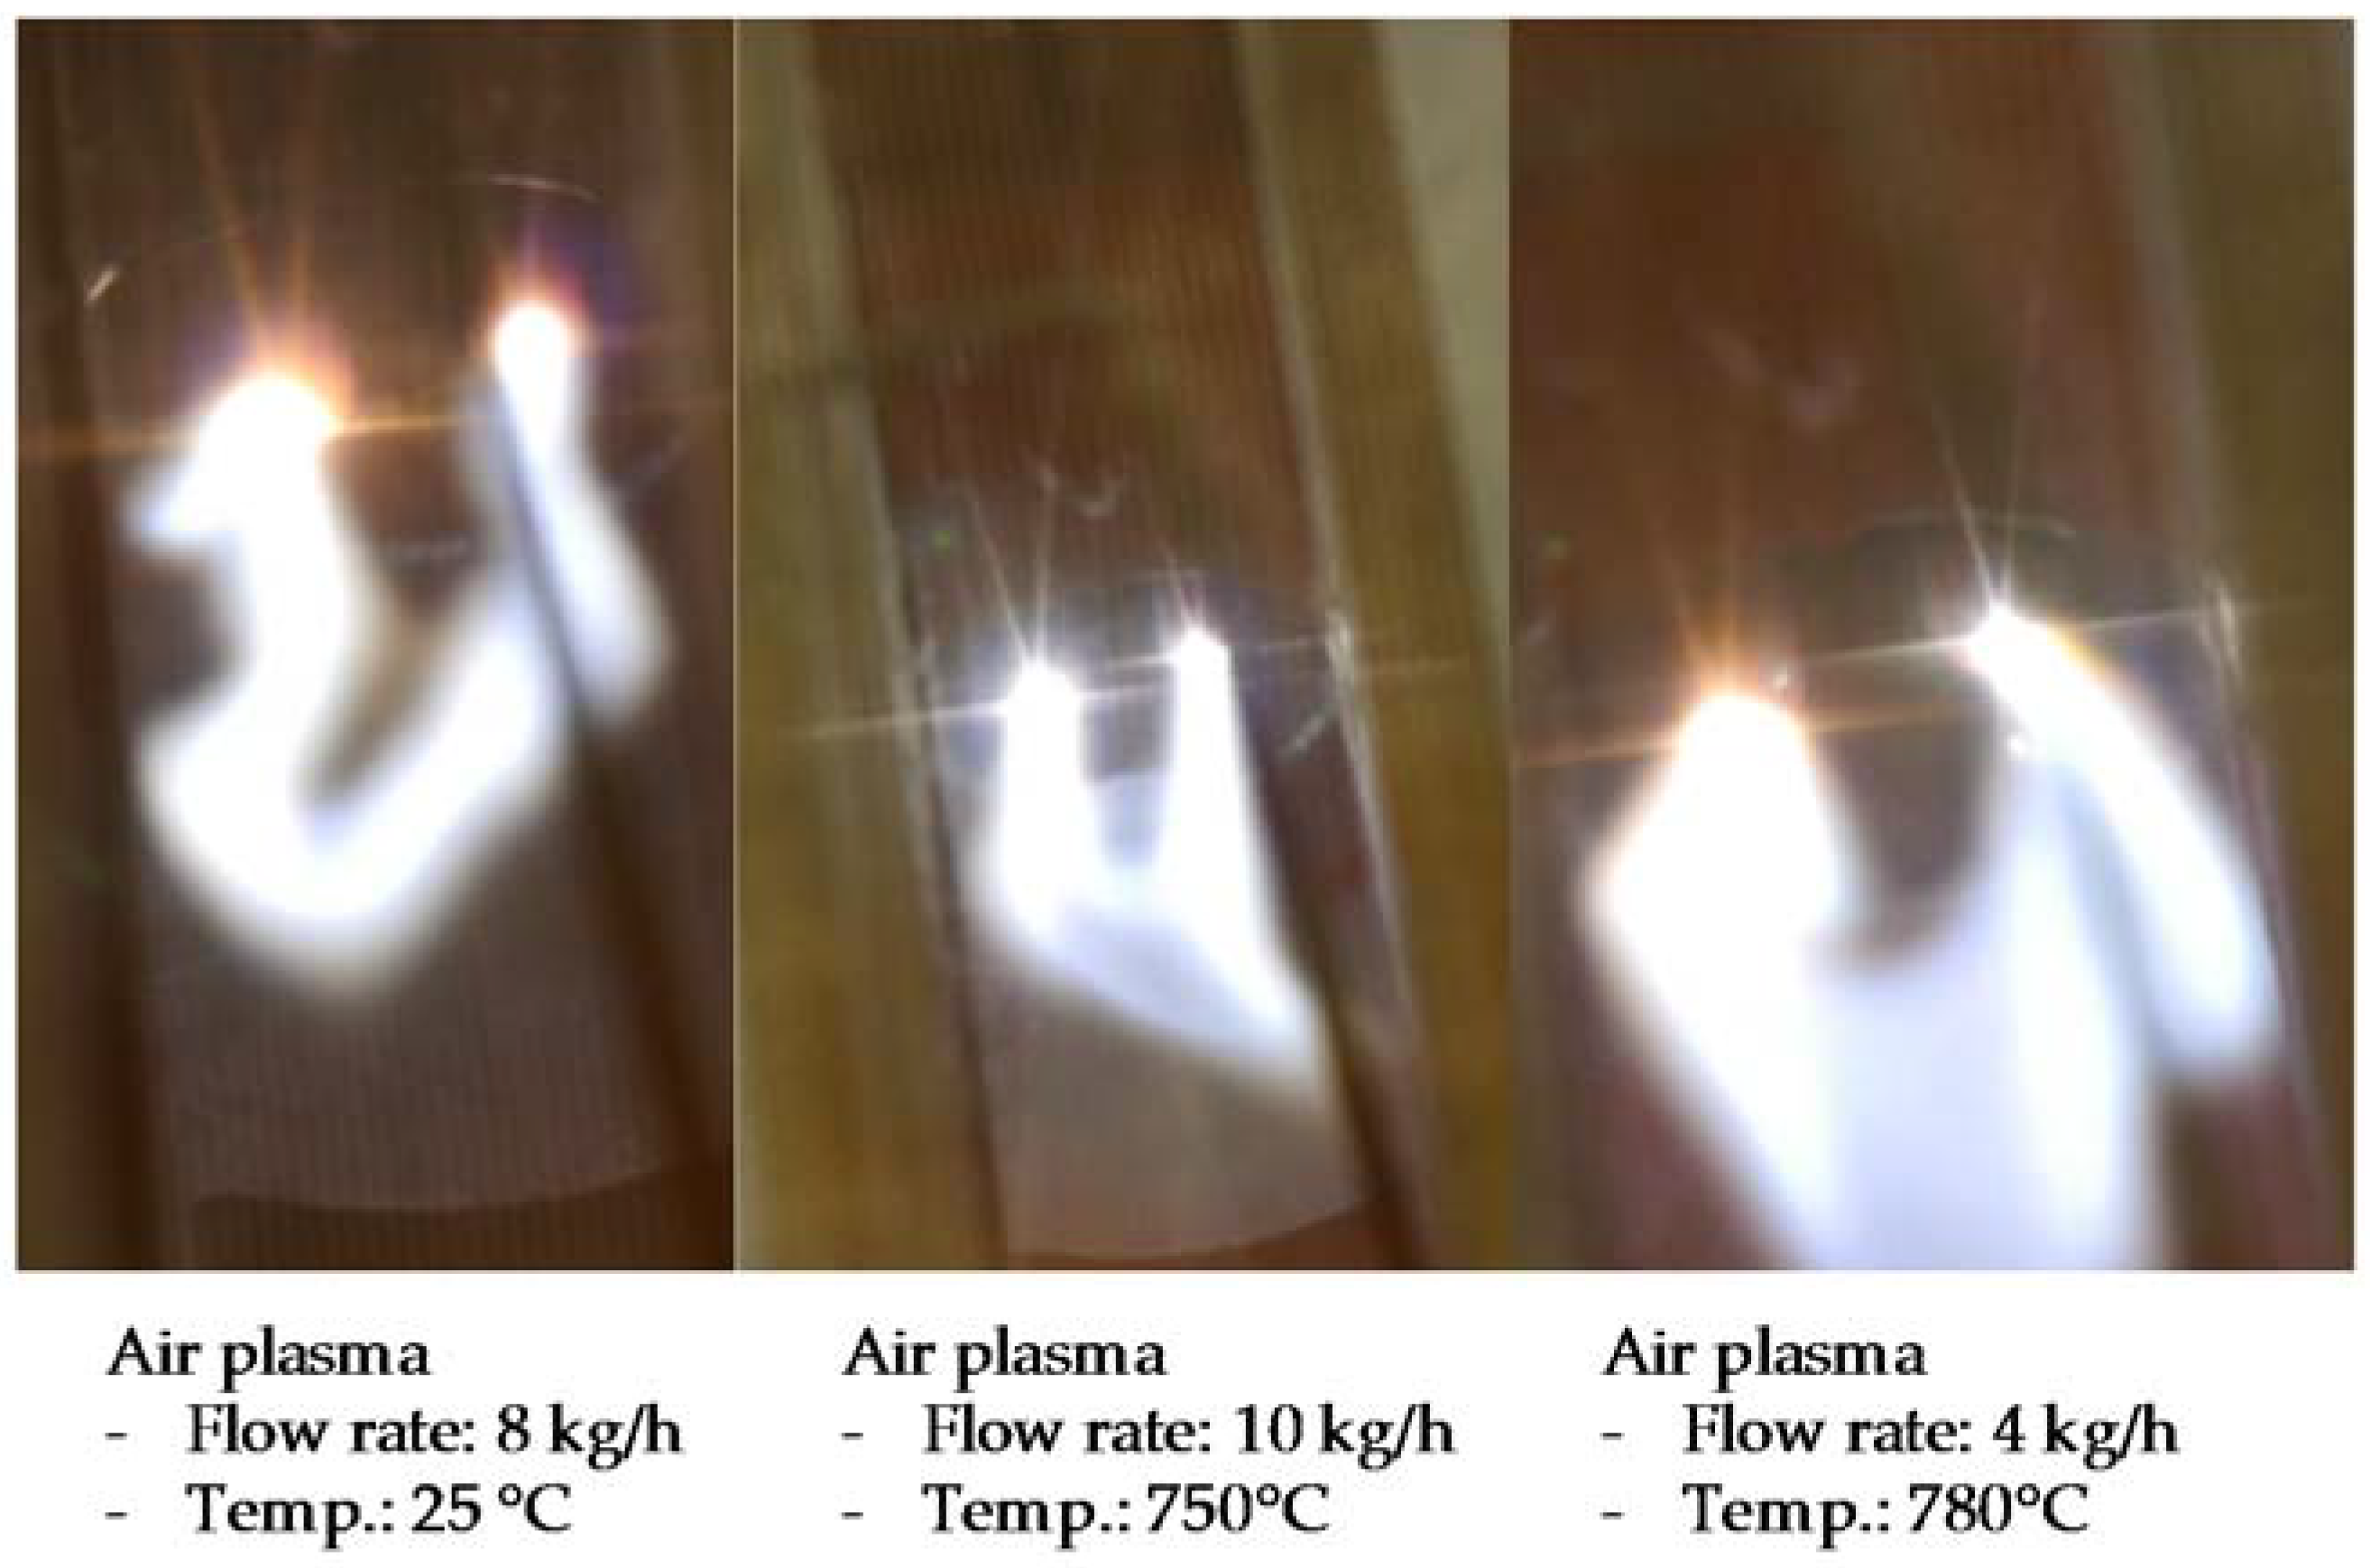
3.4. Plasma Stability

The stability of the generated plasma plays an essential role in the gasification process. It can be influenced by the working medium, working temperature, electrode geometry, process parameters, etc. The experiments were operated using a non-thermal plasma generator with preheated air and water steam. Figure 8 shows that the expansion of the plasma filaments is almost constant under parameter variations of the gas volume flow rate between 4 and 10 kg/h and furnace temperature between 25 and 780 °C. The output of the power supply to the plasma generator power remains stable within a range of +/−10% around the mean.
However, in cases of water steam plasma, the plasma stability becomes an issue depending on the gas volume rate and furnace temperature. From commissioning tests with water steam, NTP turns out to be less stable when the furnace temperature is above 800 °C. Reduced visible plasma expansion of filaments has been observed. At temperatures above 800 °C, the average power output drops by 15%. After the experiments, significant erosion was found on the top of the electrodes.
According to [11,40,41,42], the following geometric and process optimization possibilities are suggested as stabilization mechanisms:
  • Increasing the gas velocity to reach larger Reynolds numbers for stabilization or introducing further turbulence structures
  • Optimization of the operation parameters of the plasma generator (voltage, frequency, etc.)
  • Increasing the gap distance at the ignition position (see Figure 5)
  • Increasing the nitrogen content in the gas mixture
  • Optimization of electrode geometry for better electrical field distribution
After a review of all possible solutions, the first three options were chosen as the primary methods. The mass flow rate of the main water steam is set to be 6 kg/h to guarantee sufficient gas velocity and Reynolds number, which results, on the other hand, in a large S/C ratio (see Table 2). The smallest gap distance is increased by 10% to 2.2 mm. The ignition voltage and working frequency are adjusted by 10%.
After applying the optimization, stable plasma filaments were established between electrodes at the reactor temperature up to 950 °C, see Figure 9. The plasma input power fluctuates less than 1% around the mean.

4. Results

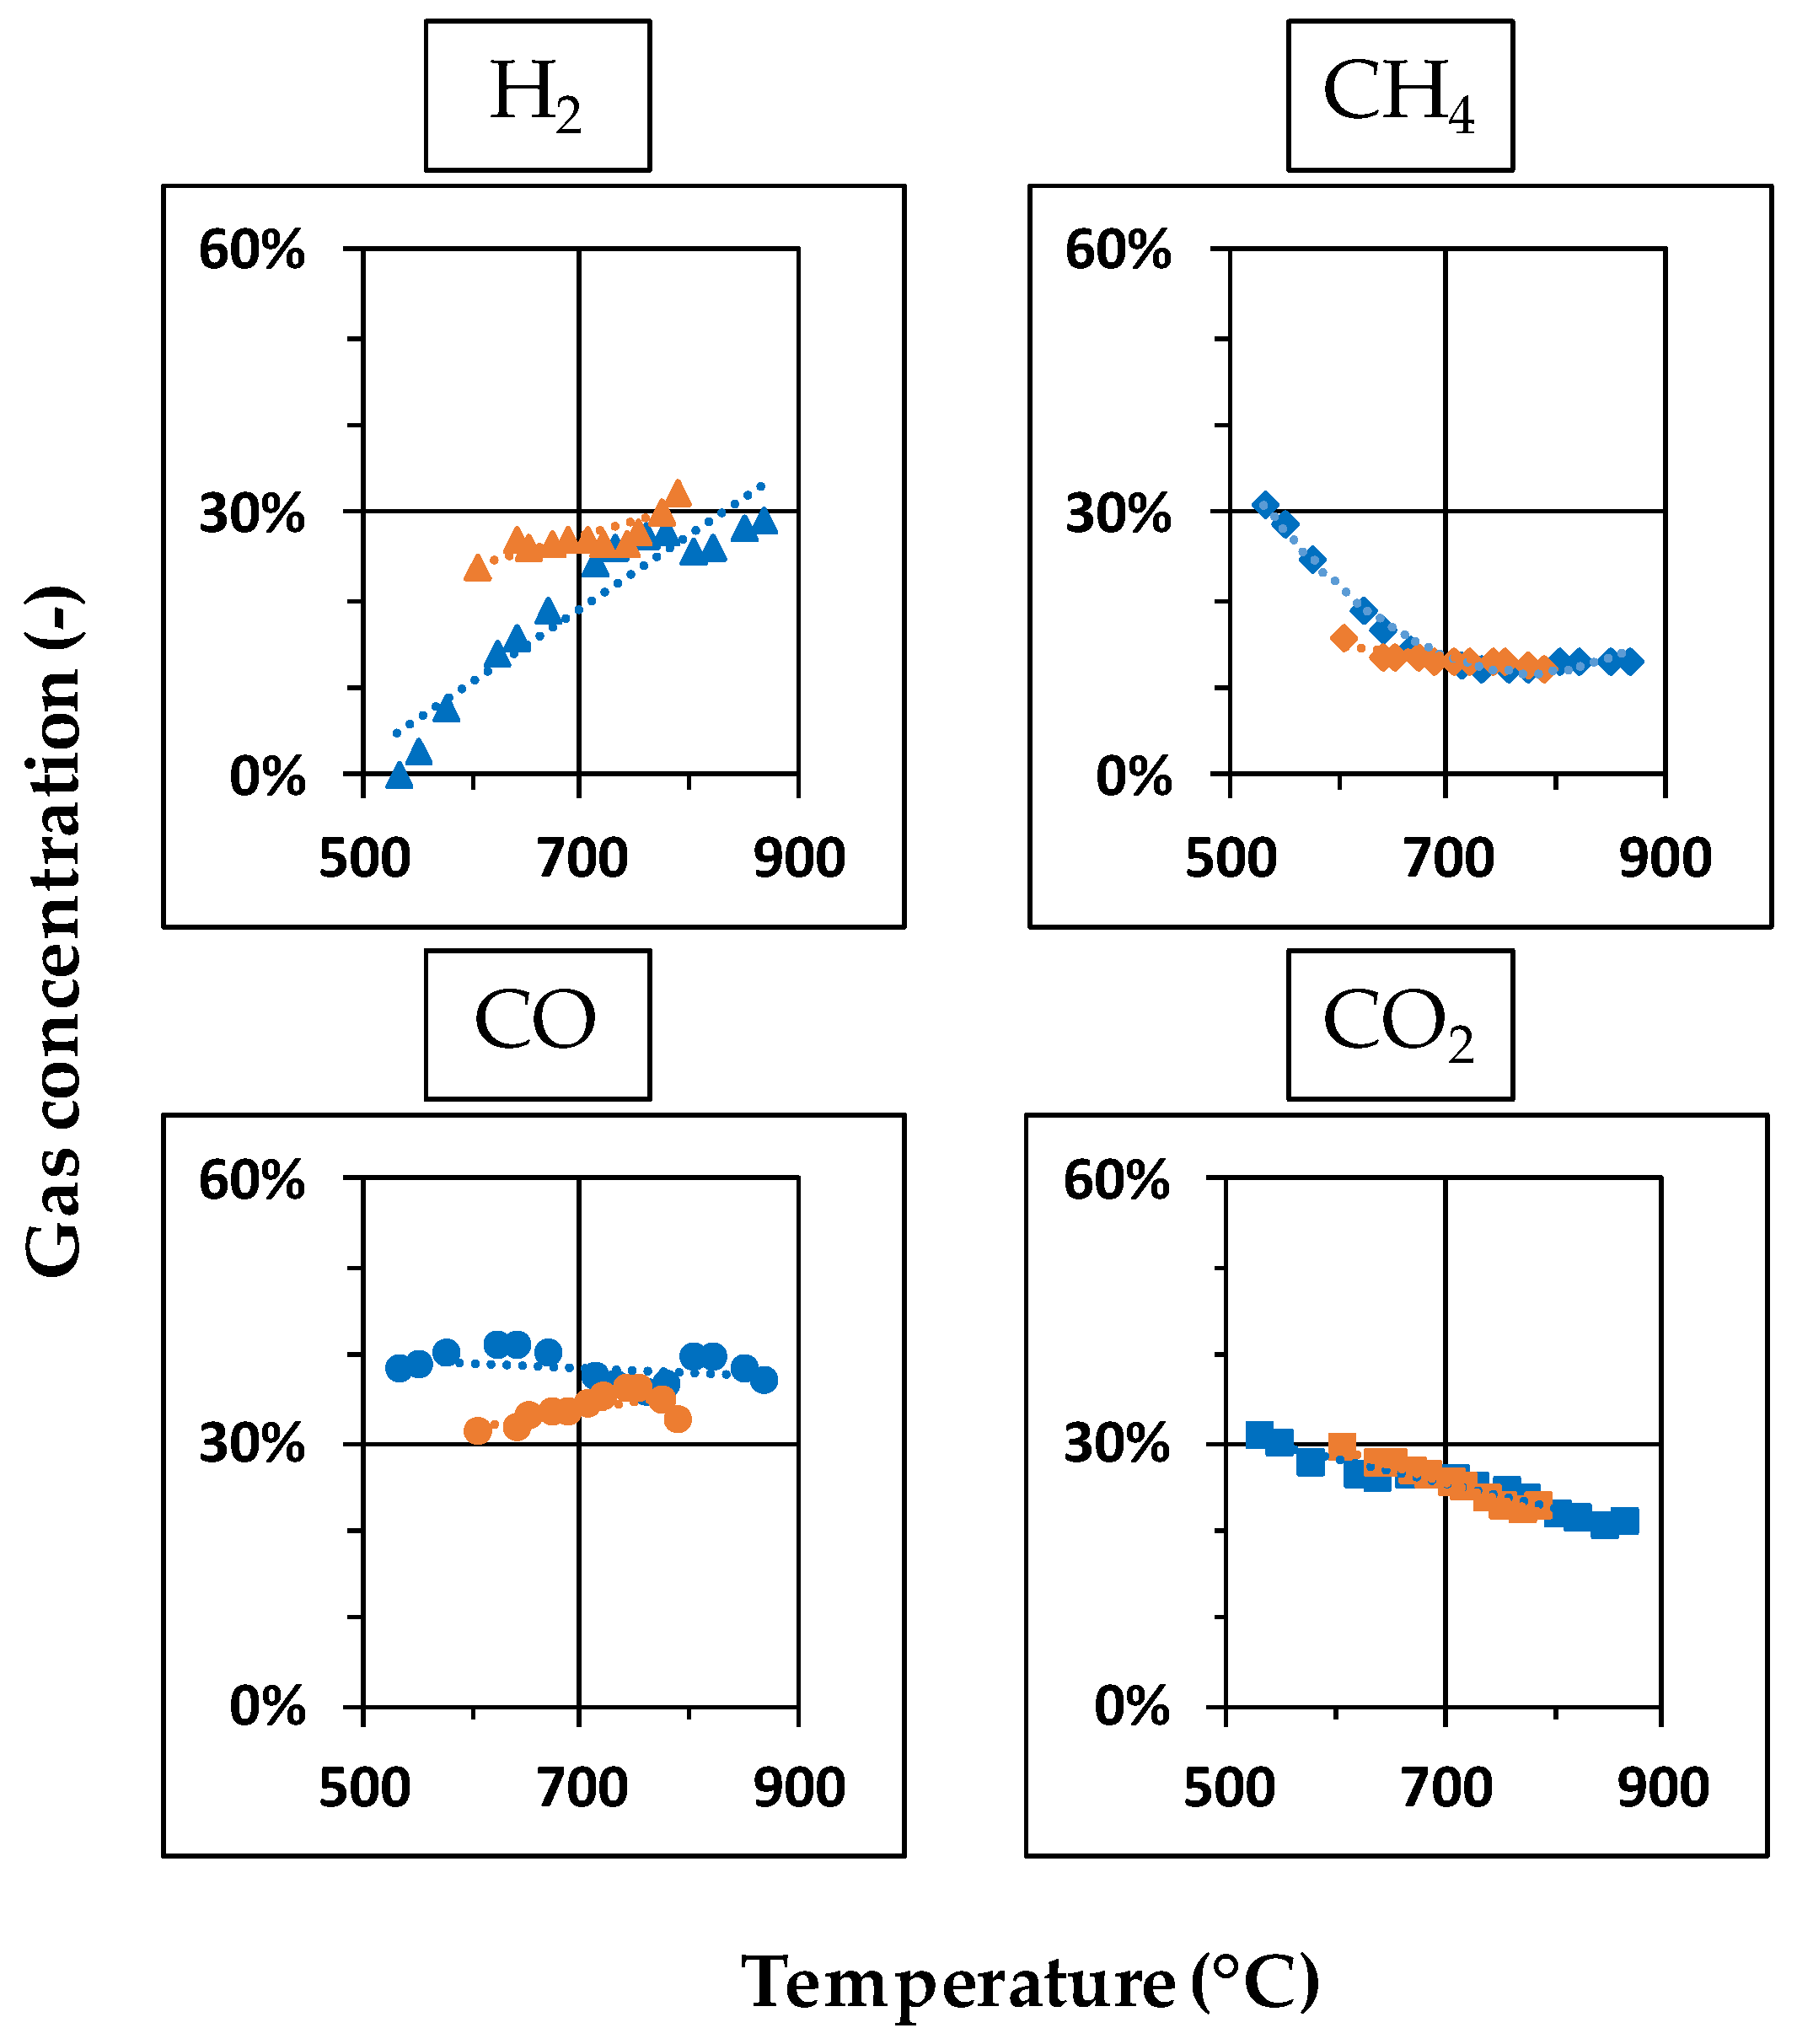
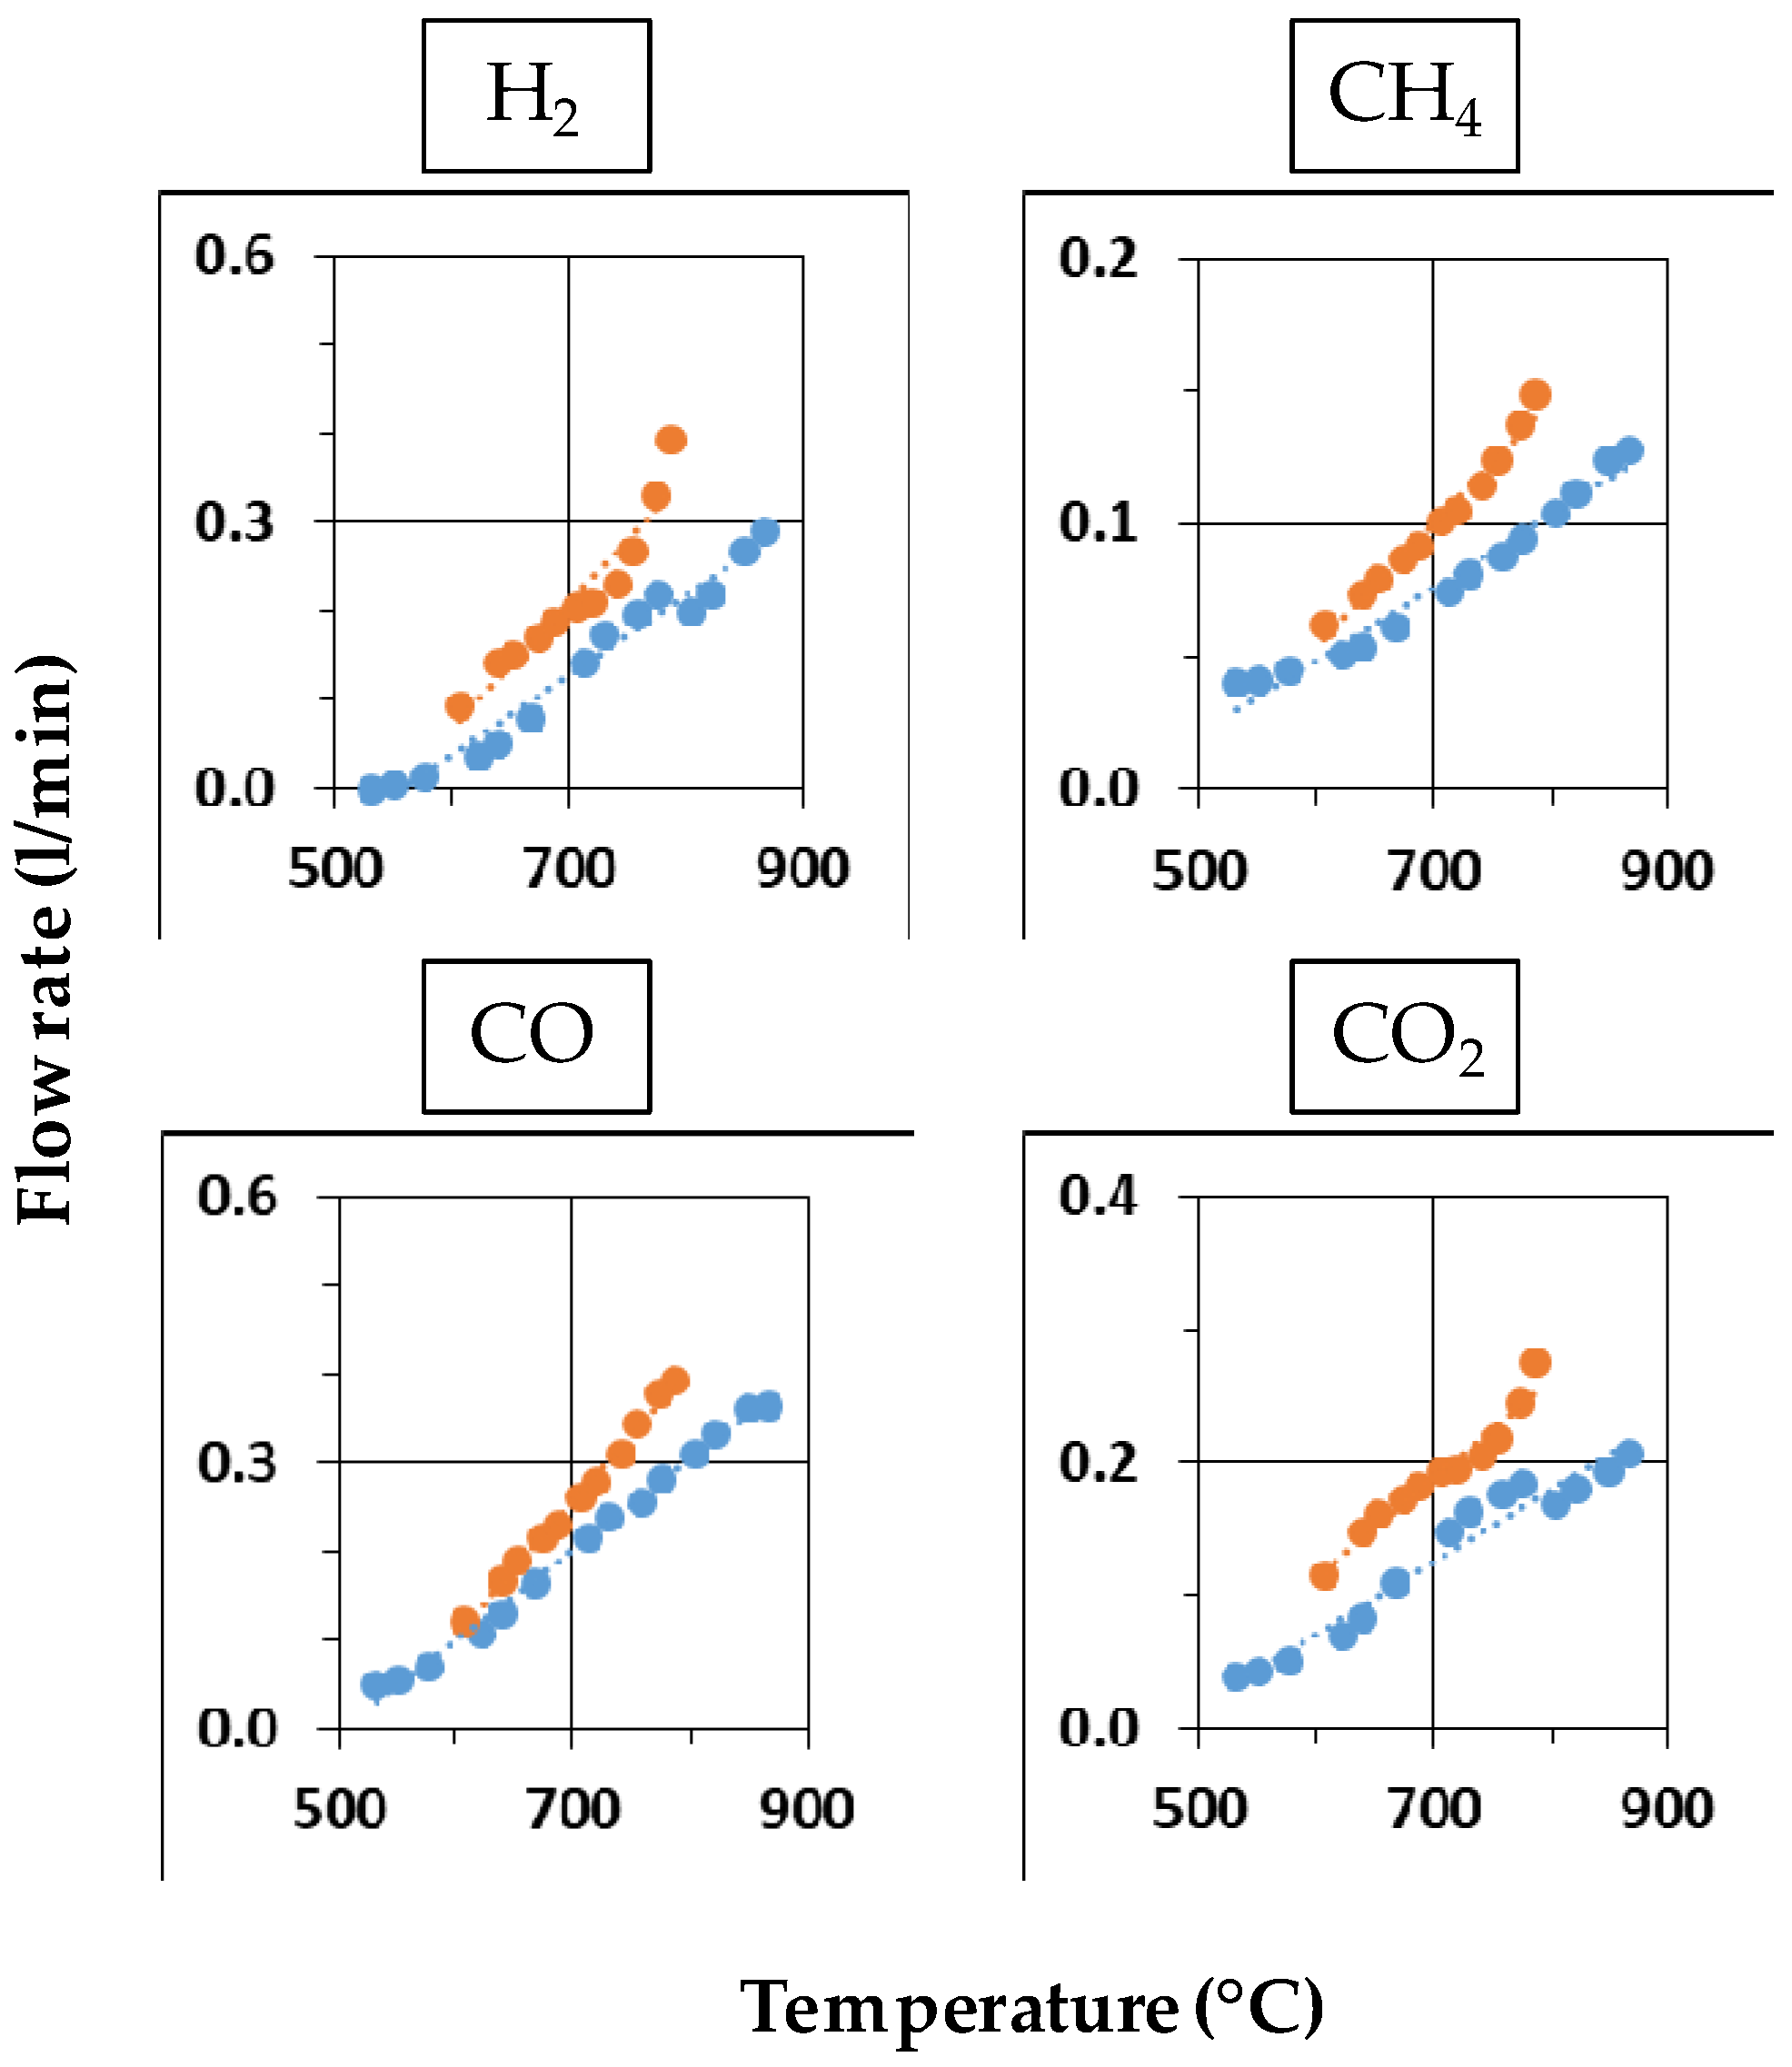
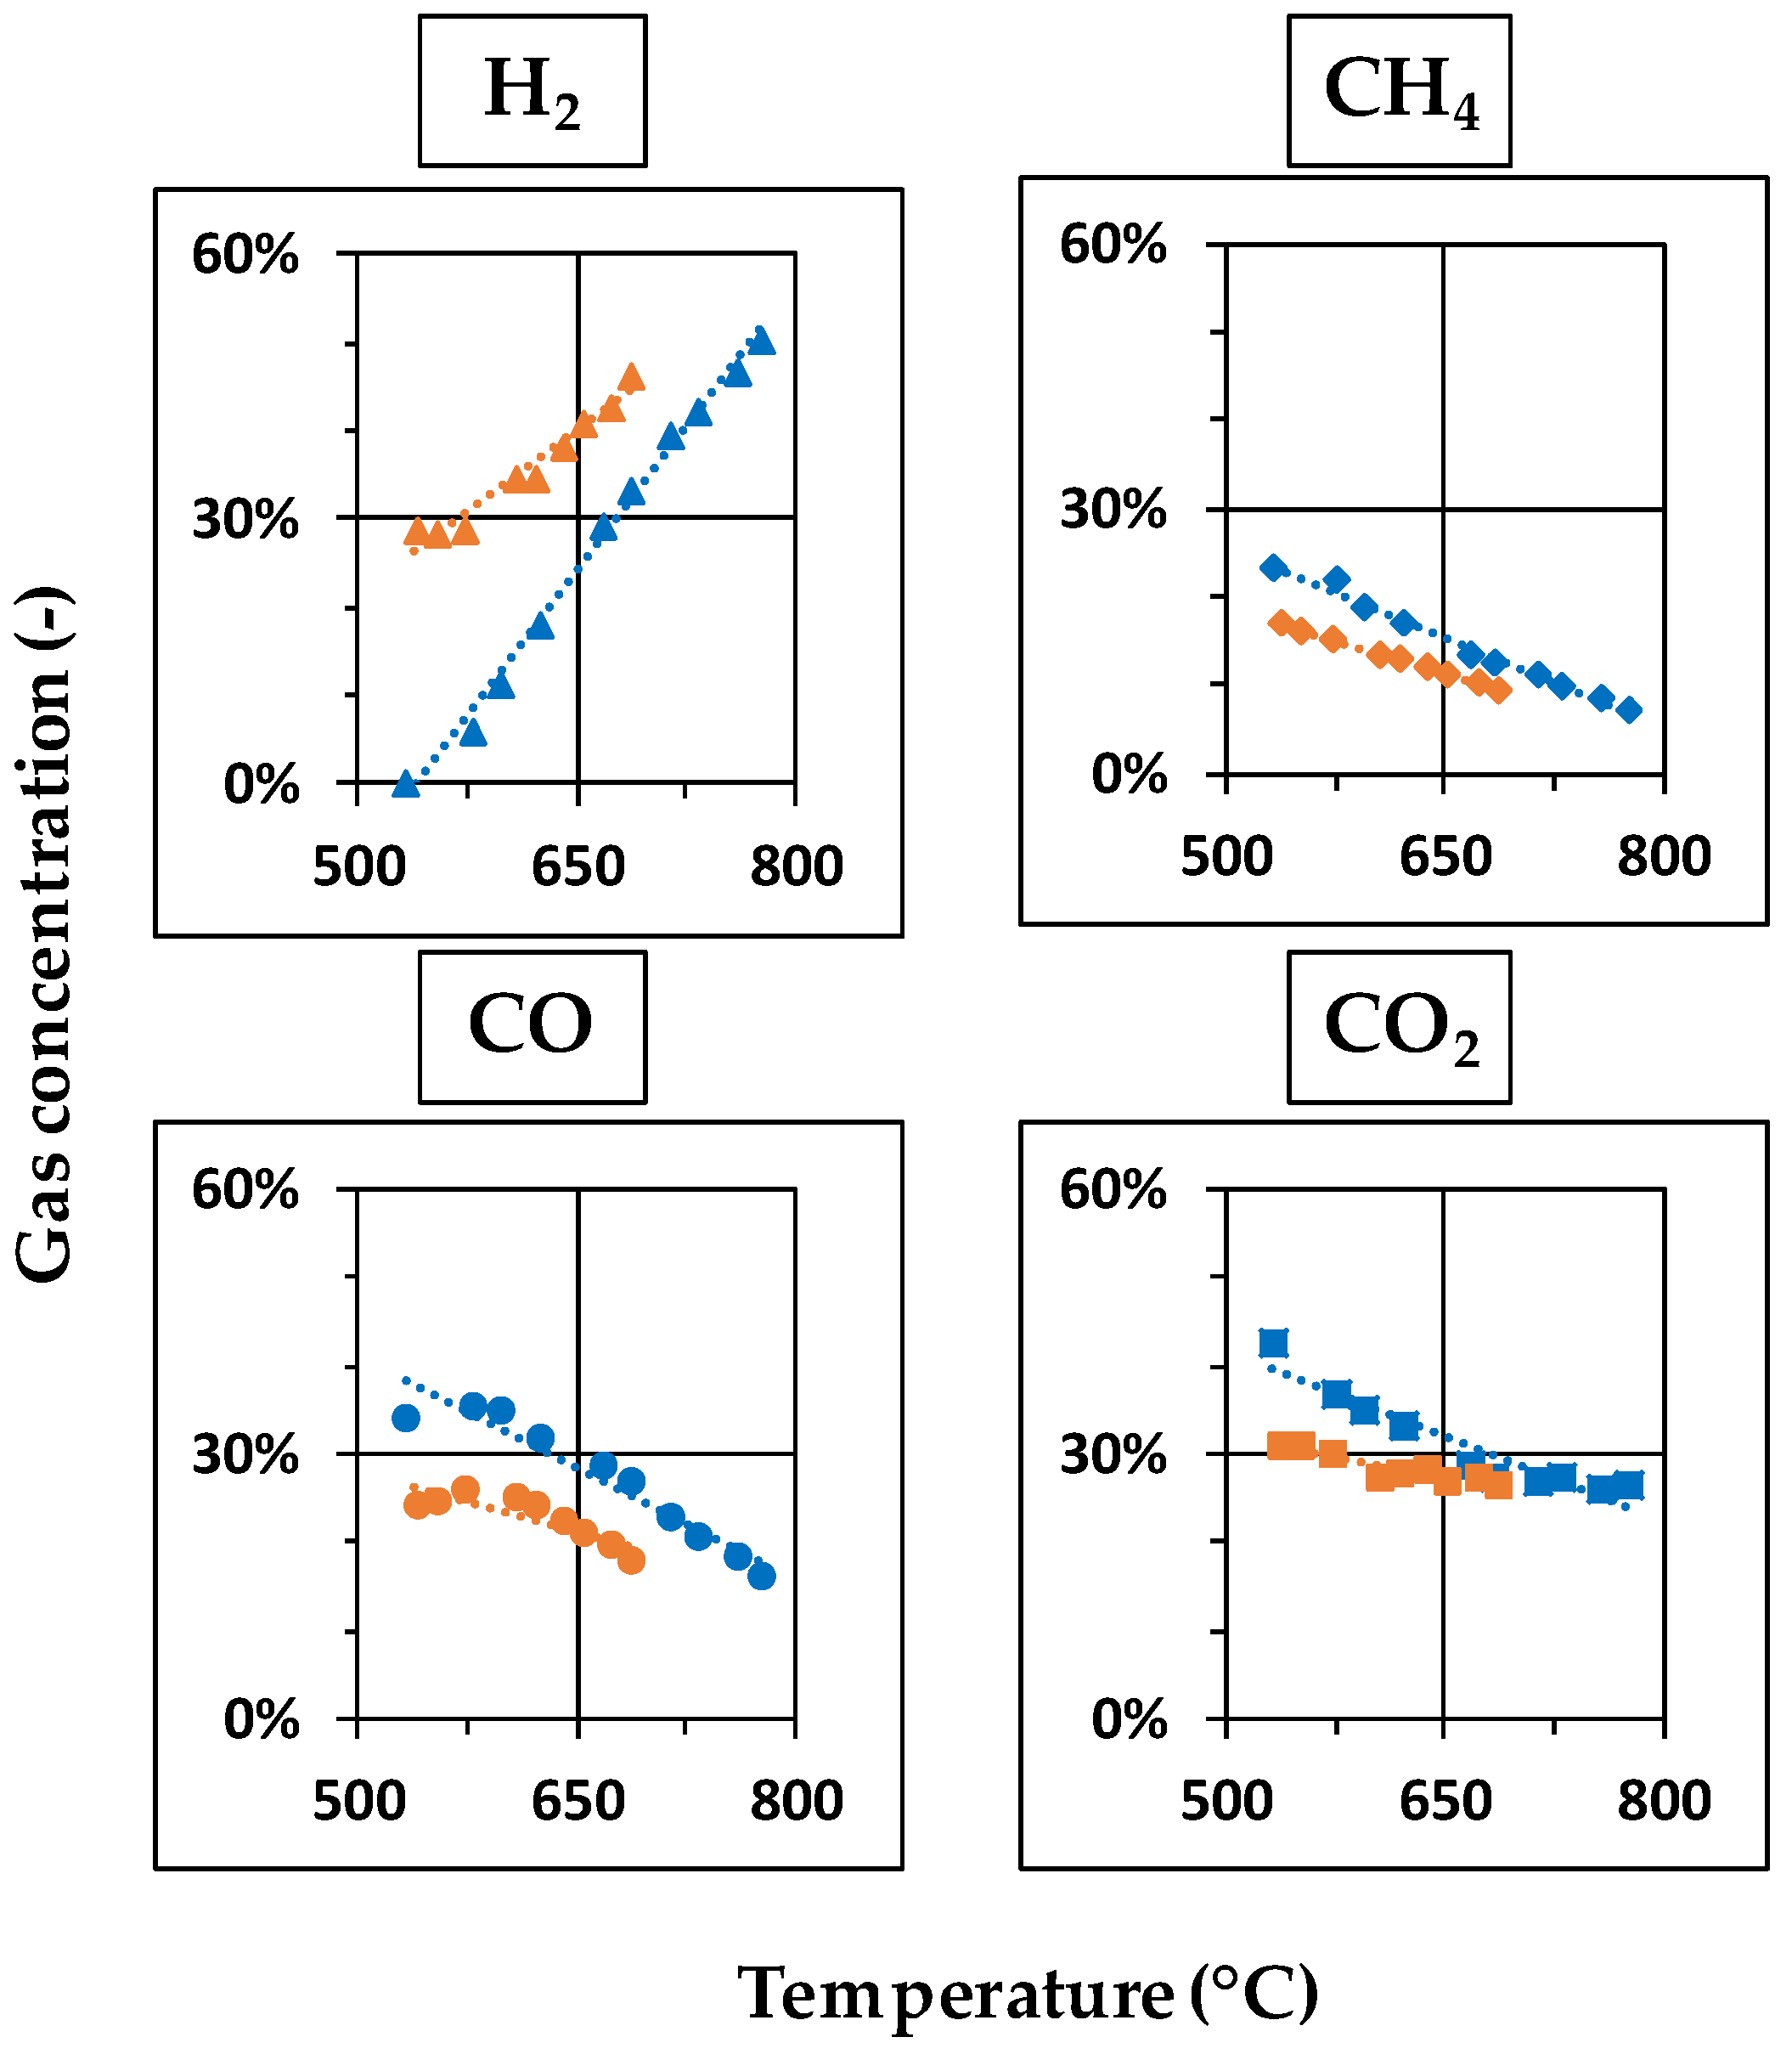
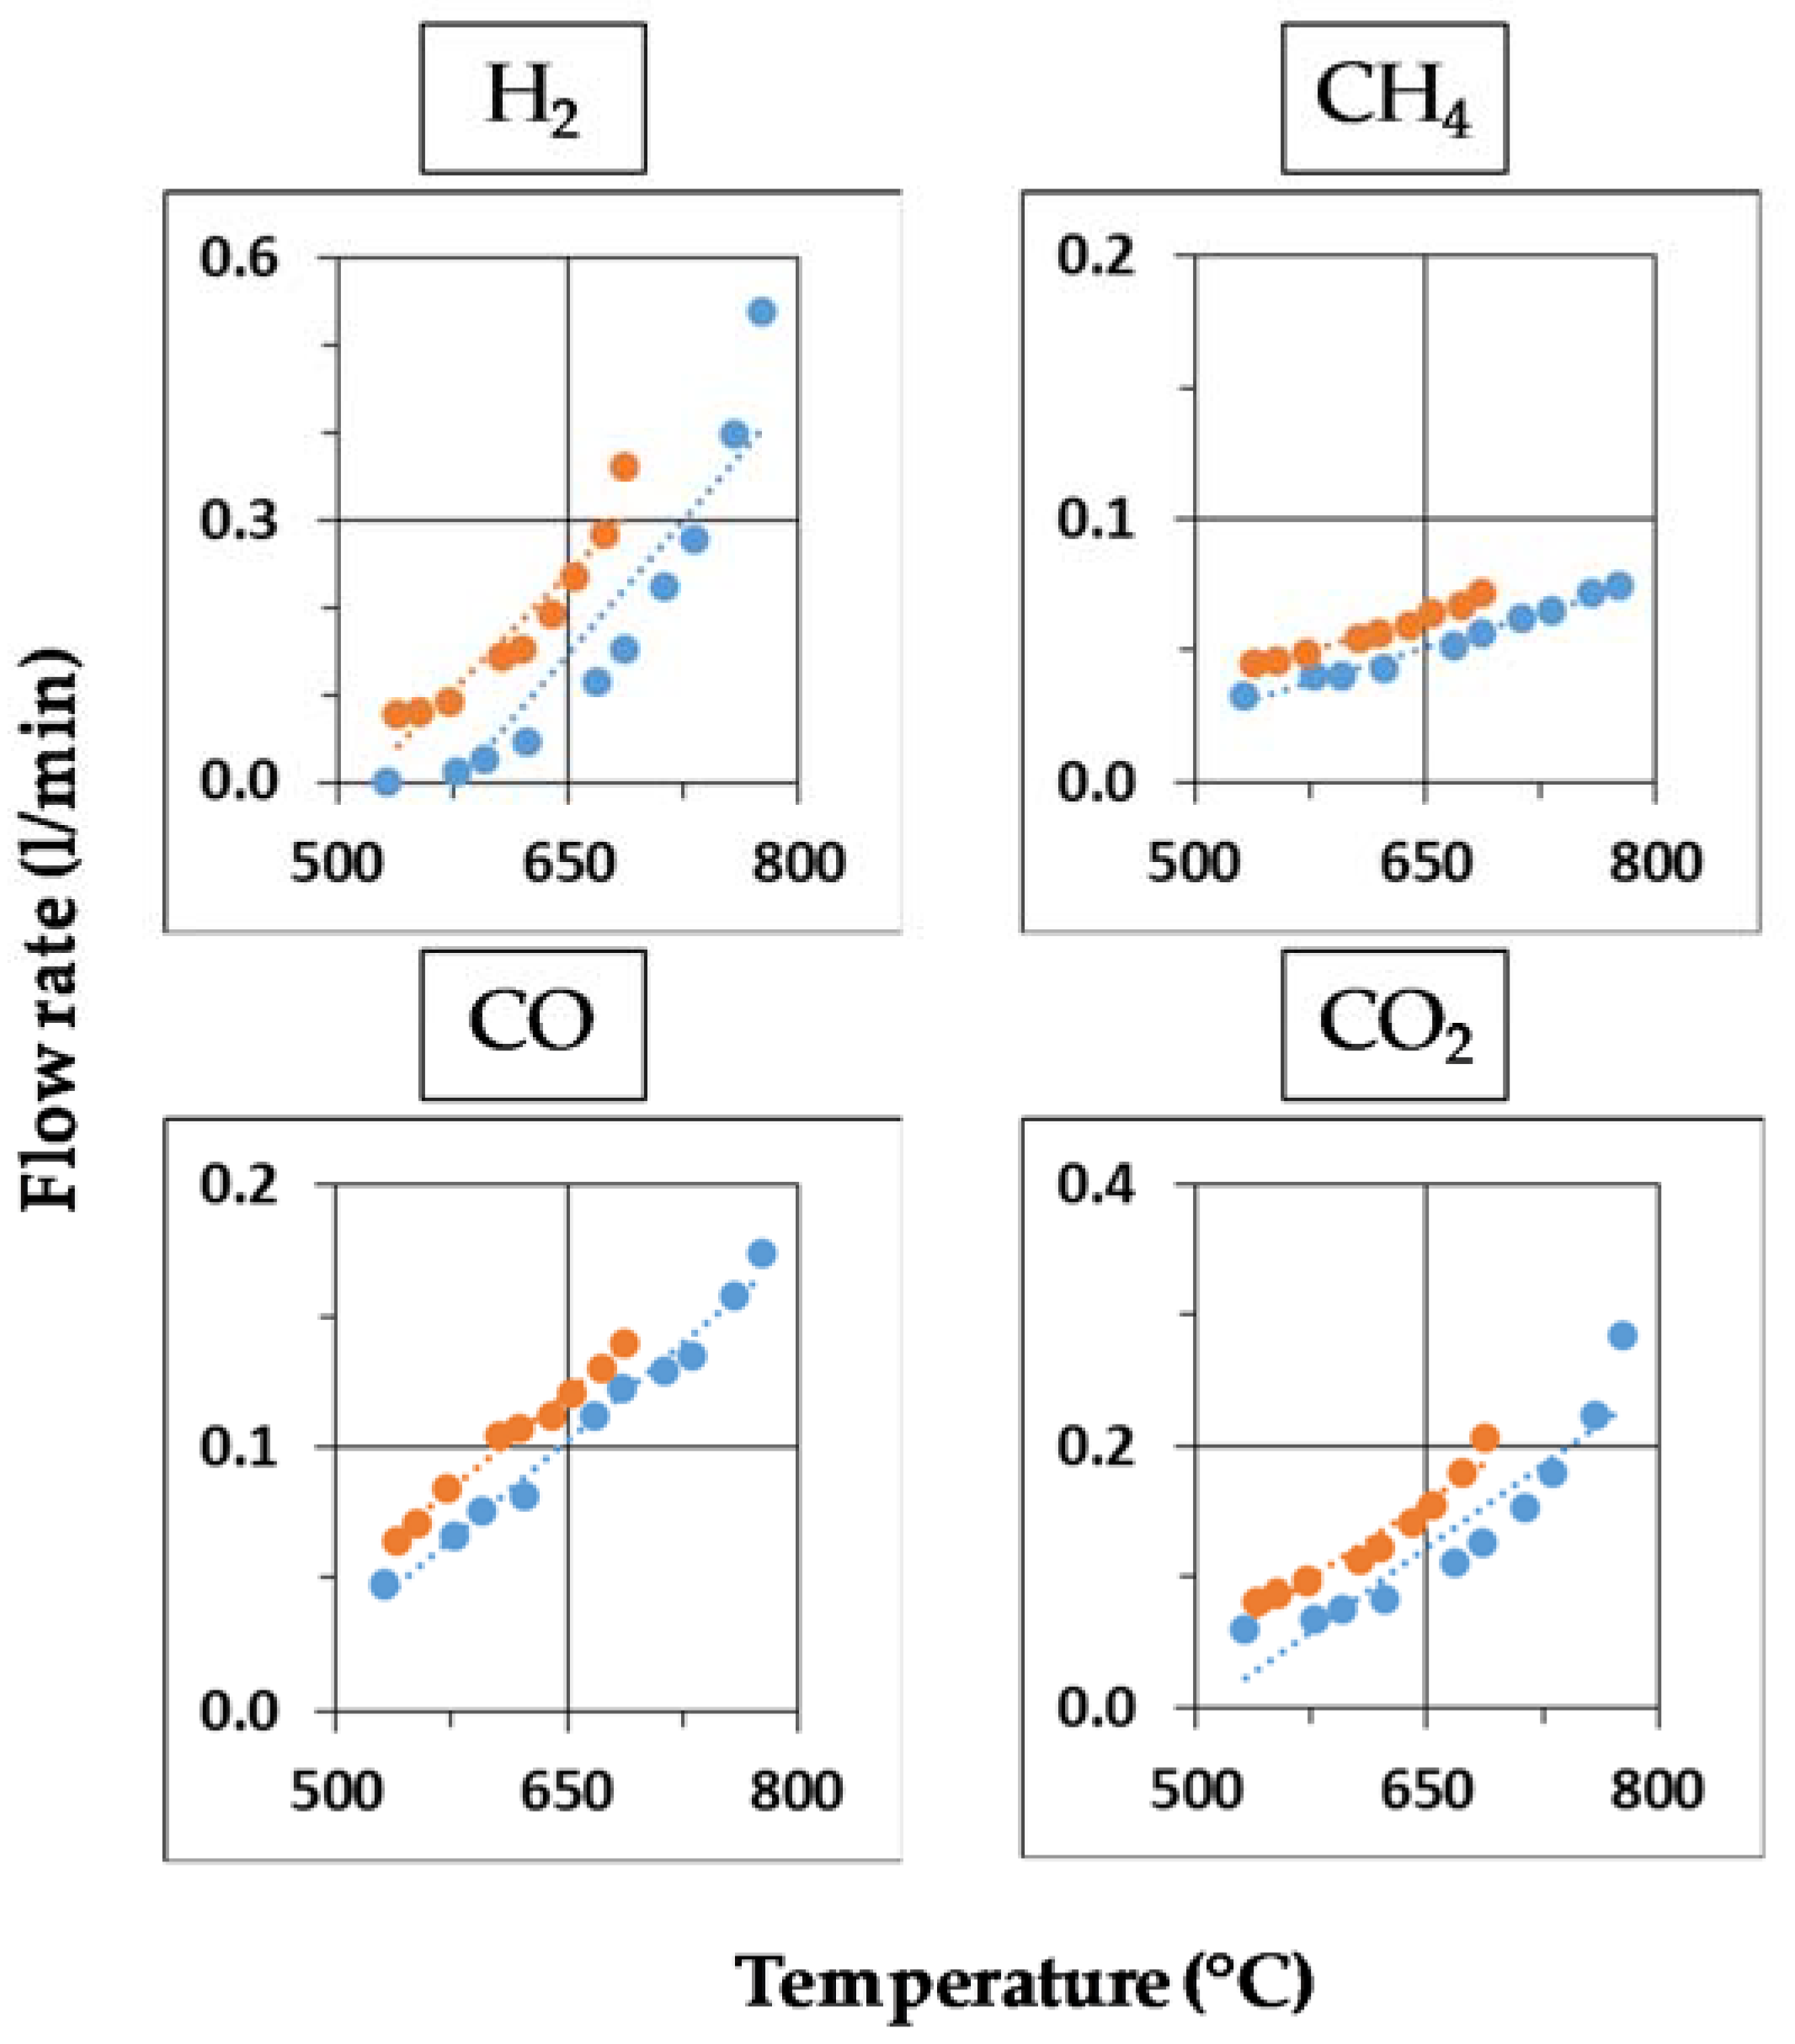
4.1. Syngas Production

The following diagrams show the experimental results of the product gas concentrations as a function of the optically measured temperatures in plasma-assisted and in thermal gasification.
Figure 10 shows the results of wood powder used as fuel. The hydrogen concentration increases with rising temperature. As is the case in NTP-assisted gasification, the hydrogen production is enhanced compared to thermal gasification which can be explained by NTP-induced dissociation of H2O. At low temperature (e.g., 600 °C), the hydrogen production from pyrolysis/gasification is rather small, and the difference between plasma and thermal case can be explained by dissociation of water steam. With rising temperature, the difference becomes smaller, due to enhanced pyrolysis/gasification and tar reforming reactions in both cases. The concentration of carbon monoxide stays relatively constant. With rising temperature, the concentrations of methane and carbon dioxide decrease.
Figure 11 presents the differences of the flow rates in plasma and thermal gasification. The production of each syngas component (H2, CO, CO2 and CH4) is promoted by non-thermal plasma. The hydrogen production in the plasma case is about 15% higher than the production in thermal gasification. This can be explained by increased conversion of hydrocarbons and, in particular, of water dissociation. The increase of methane and carbon monoxide production is at 35% and 25%, respectively. The flow rate of carbon dioxide is enhanced by 20% with plasma, which may be explained by the influence of the water-gas shift reaction.
The experiments were conducted with large nitrogen flow rates. Thus, the measured syngas concentration is highly diluted. The produced flow rate of syngas (CO, CO2, CH4 and H2) is relative small compared to the flow rate of nitrogen at lower temperature range. Considering the confidence range of gas analysis to be 1% (see Section 4.4), the actual syngas concentration without N2 at lower temperature range can have a measurement error up to 150%. The large measurement error is caused by low reaction degree and therefore low syngas production. These errors lead to a relatively high uncertainty (systematic errors), as shown in Figures 14–17, in which, in addition to gas concentrations, the influence of nitrogen flow and mass flow of feedstock are considered.
Figure 12 shows the results of the gas composition of the charcoal powder in both the plasma and the thermal case. The tendency of the individual gas concentration (except for the carbon monoxide) with rising temperature is similar to that shown in Figure 10. The concentration of CO decreases as the temperature increases.
The change in the syngas flow rate can be found in Figure 13. In general, the plasma promotes formation of each species in the syngas by at least 15%. The hydrogen production at lower temperature is strongly promoted through water dissociation. The difference decreases with increasing temperature, which indicates that H2 is produced by steam gasification. With rising temperature, the difference in CO2 flow rate increases by more than 60%, while the difference of carbon monoxide decreases to 15%. The methane production is increased in plasma gasification by nearly 30%.

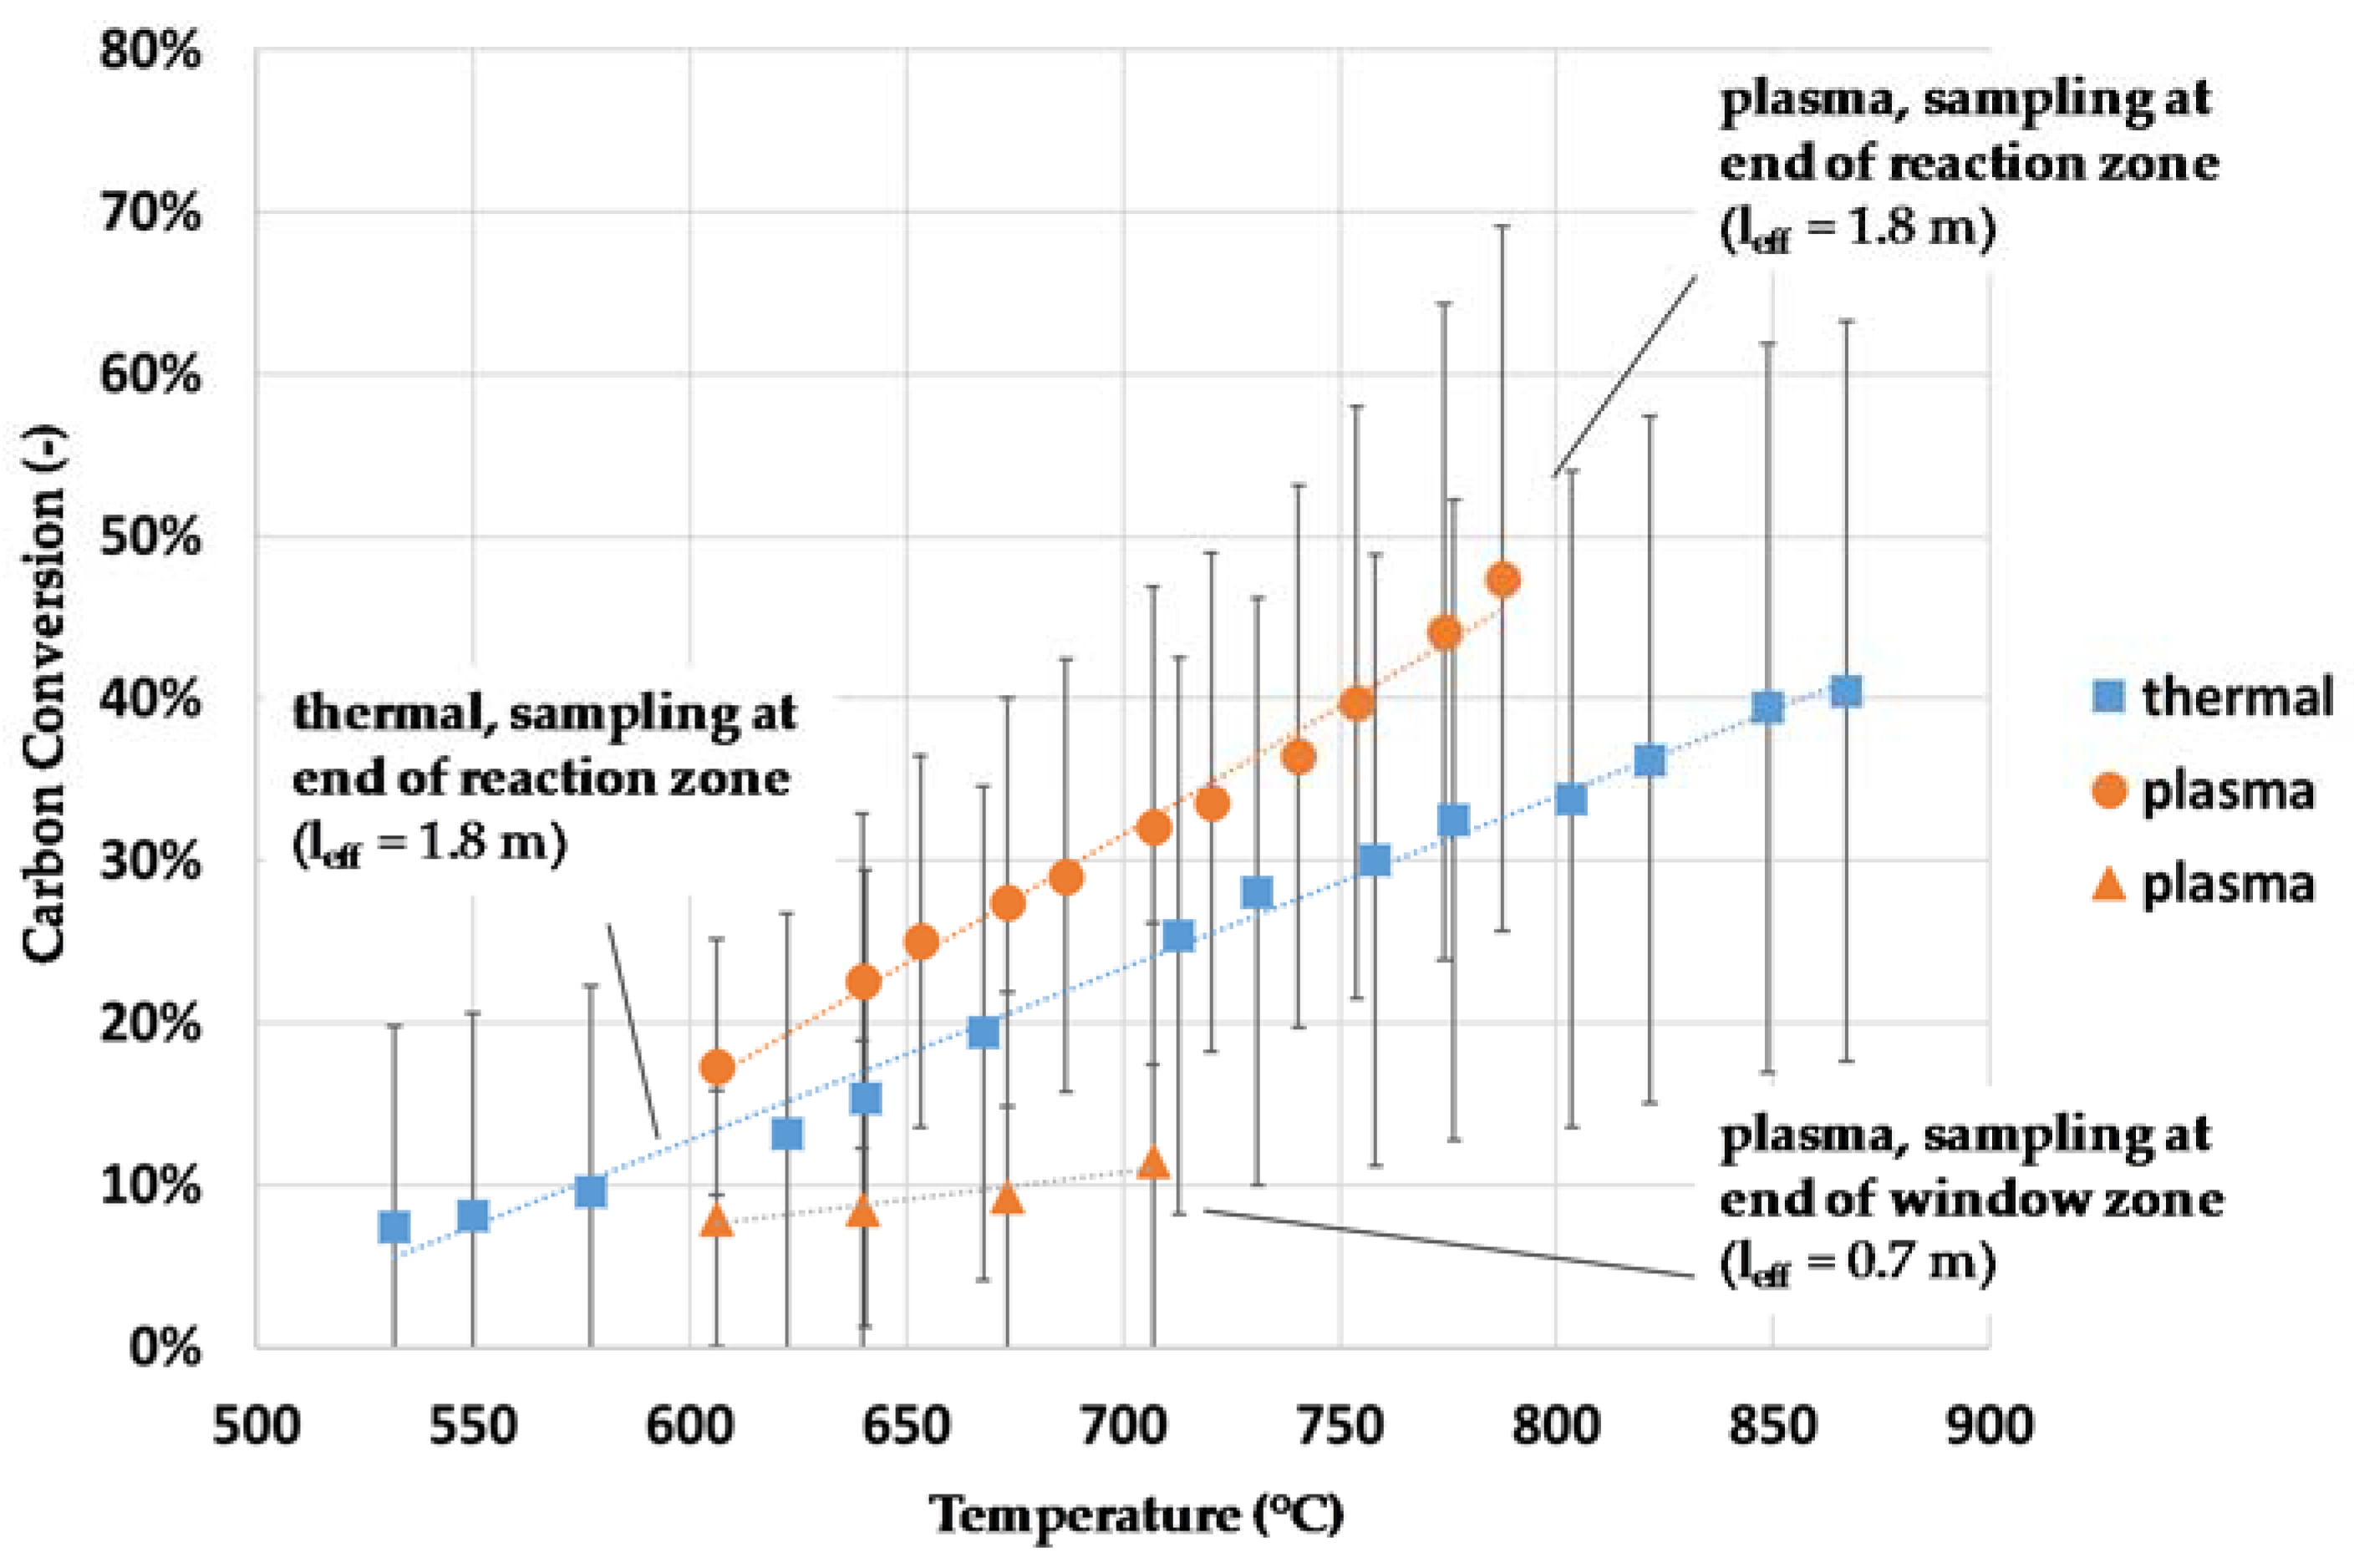
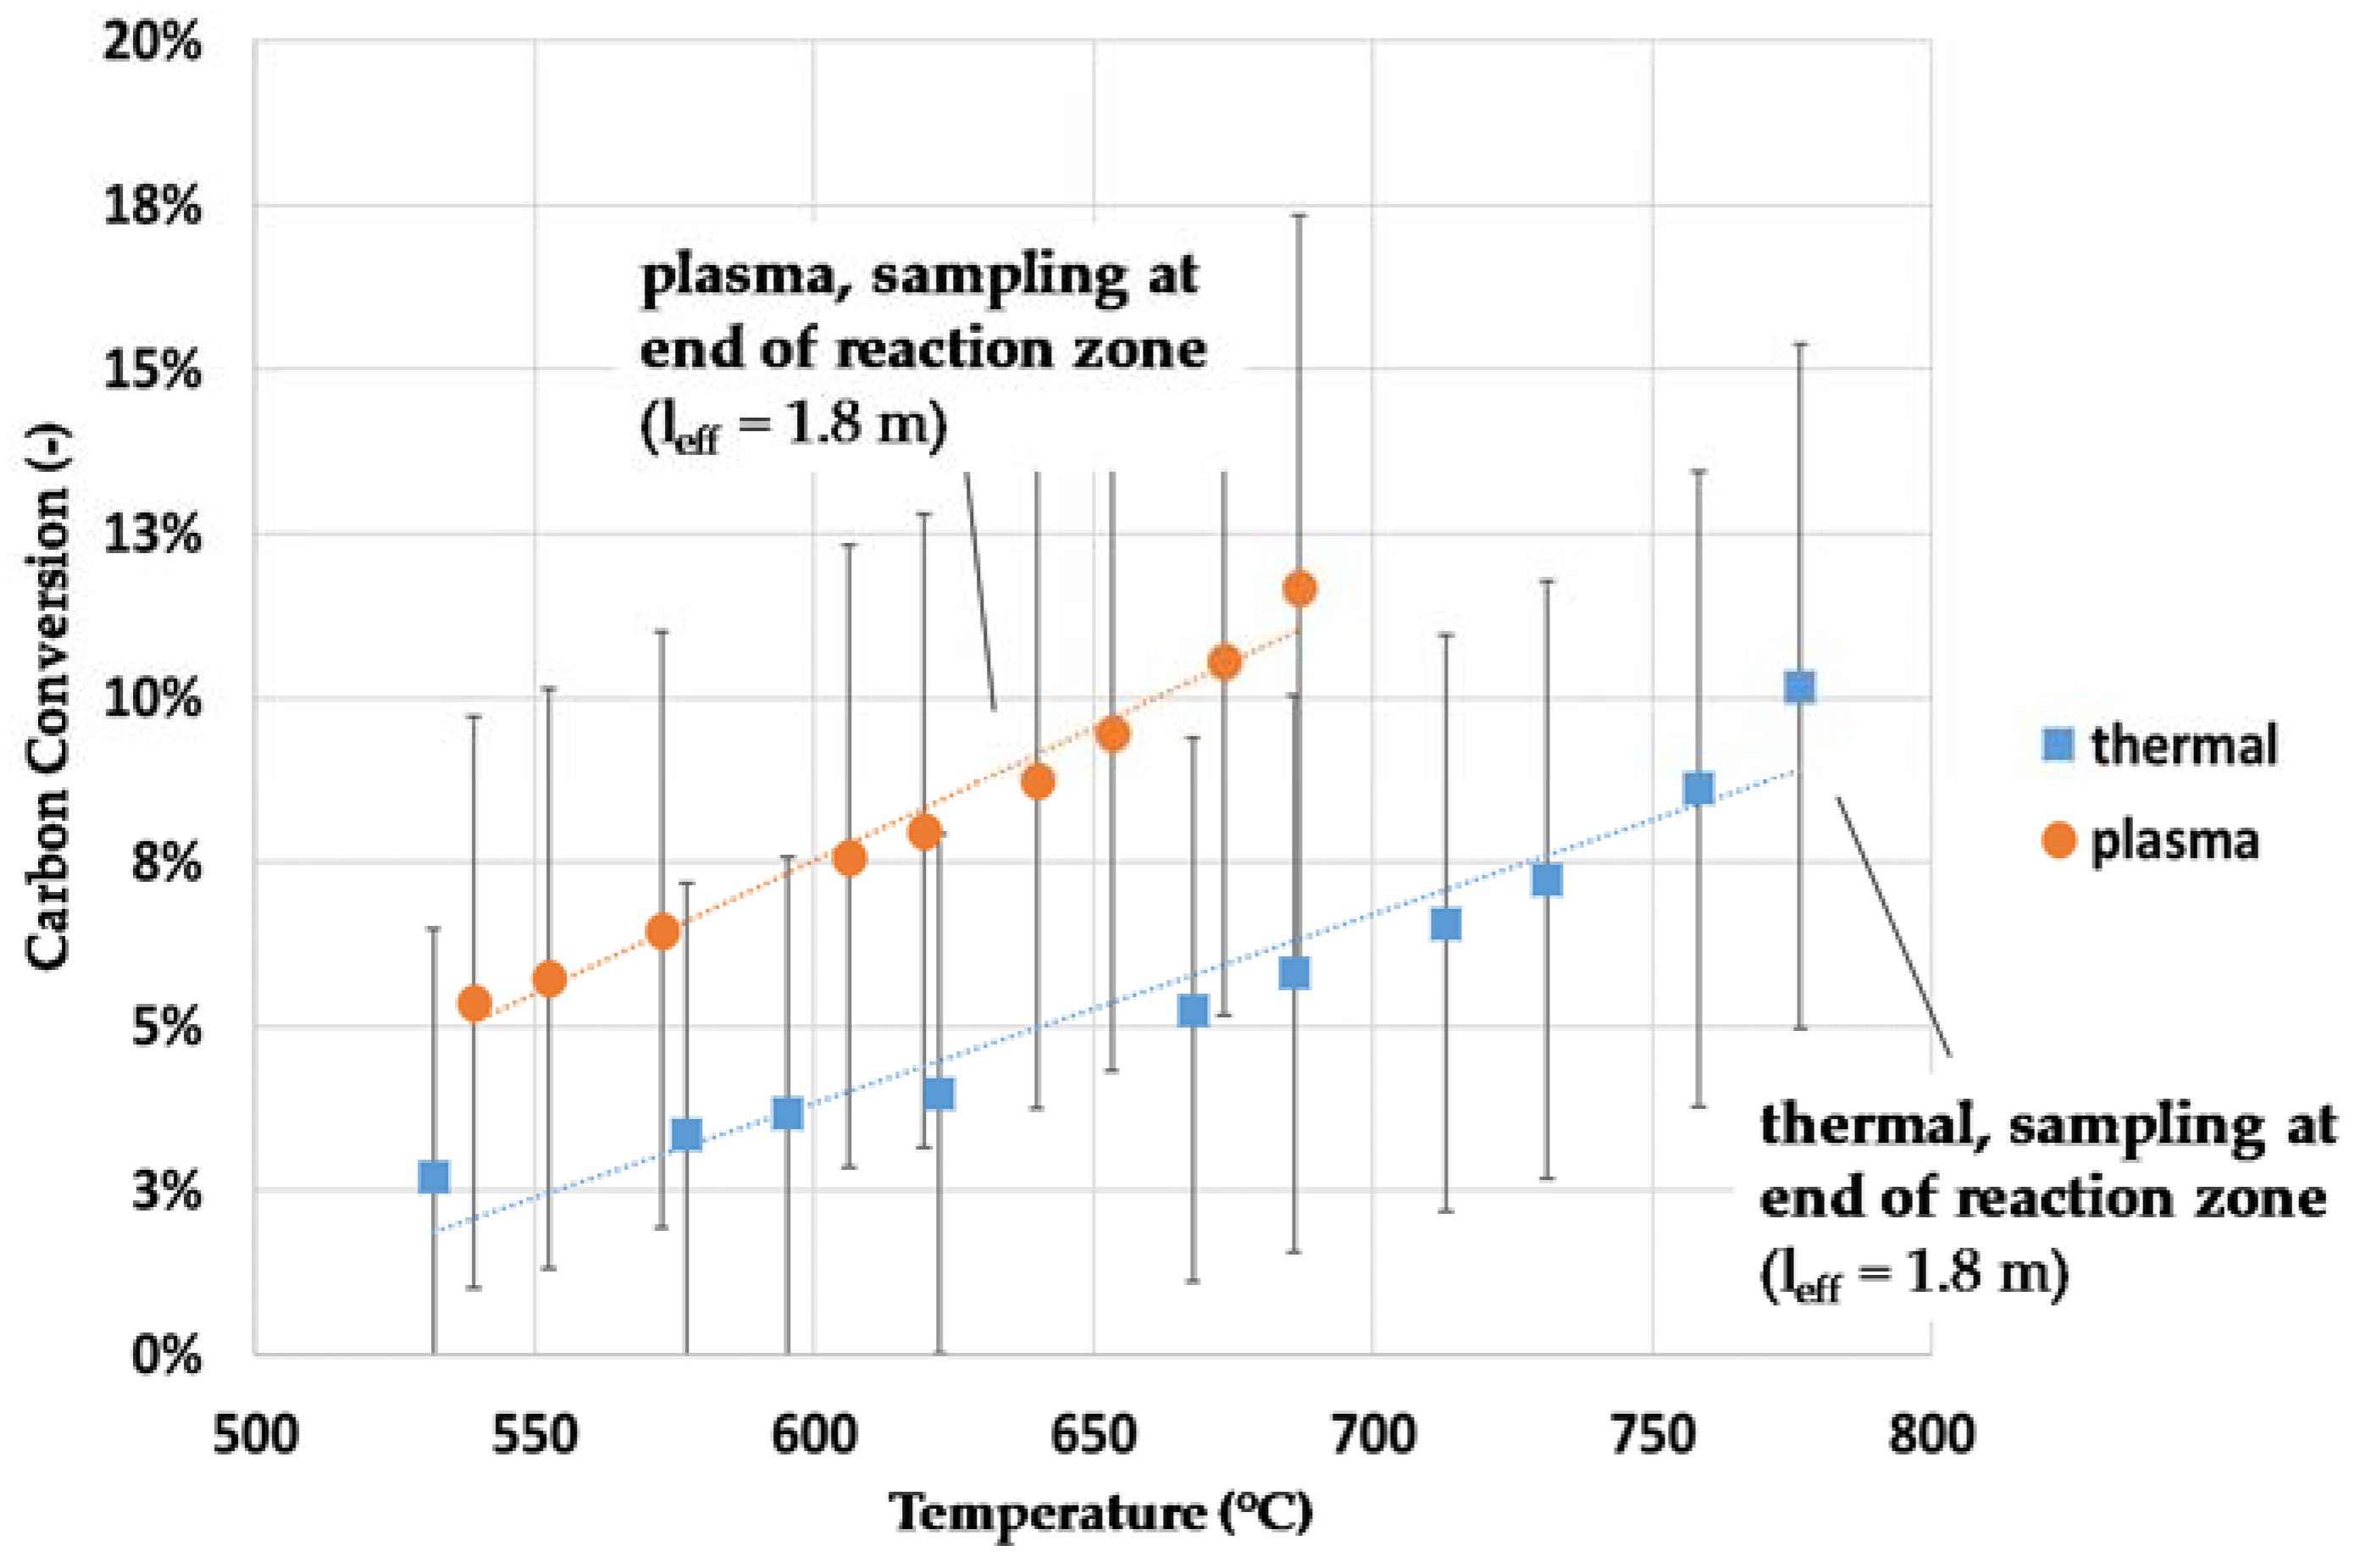
4.2. Carbon Conversion

To determine the reaction progress, the total carbon conversion Xc is often used as the parameter, which is generally defined as:
X c = 1 C r e s i d u e C f u e l
where Cresidue presents the carbon content in the solid residue and Cfuel the carbon content in the fuel. On the other hand, the total carbon conversion can be calculated from the product side. Carbon can be converted from fuel to syngas Xsyngas, to tar products Xtar and to solid carbon Xsc.
X c = X s y n g a s + X t a r + X s c
X s y n g a s = C C H 4 + C C O + C C O 2 C f u e l
X t a r = C t a r C f u e l
X s c = C s c C f u e l
where CCH4, CCO and CCO2 present the carbon content in individual gas species, and Ctar and Csc presents the carbon content in the tar and in the solid carbon, respectively.
In this work, the carbon conversion Xsyngas considering only syngas components is used as the parameter to determine the fuel conversion degree. When the wood powder is used as fuel, the obtained carbon conversion Xsyngas is smaller than the total carbon conversion Xc.
The carbon conversion, calculated from measured syngas concentration, is shown in Figure 14 and Figure 15. The length of the fuel path is 0.7 m with the syngas sampled at the end of window zone. In the case of sampling at the end of reaction zone, the length of the fuel path is 1.8 m (see Figure 4).
In the plasma case using wood powder, 10% more carbon contents in the fuel particles were converted into syngas. With the decreasing residence time by sampling at the end of the window zone, the carbon conversion decreases dramatically. A maximum carbon conversion of 48% at 770 °C in the plasma case and 40% at 870 °C in the thermal case can be achieved.
Using charcoal powder, the carbon conversion was enhanced by 3–8% by means of NTP application. The low carbon conversion is caused by the slow reaction kinetic of charcoal gasification and short residence time of charcoal powder in the reactor (see Table 3).
The difference in carbon conversion by NTP between wood and charcoal powder can be explained mainly by enhanced heating rate. By using wood powder with a highly volatile content (about 80 wt %), the plasma accelerated the chemical reaction by means of an extremely high heating rate. In the case of charcoal powder, the reaction rate is mainly limited by diffusion. Thus, the influence of NTP on the conversion degree is smaller.

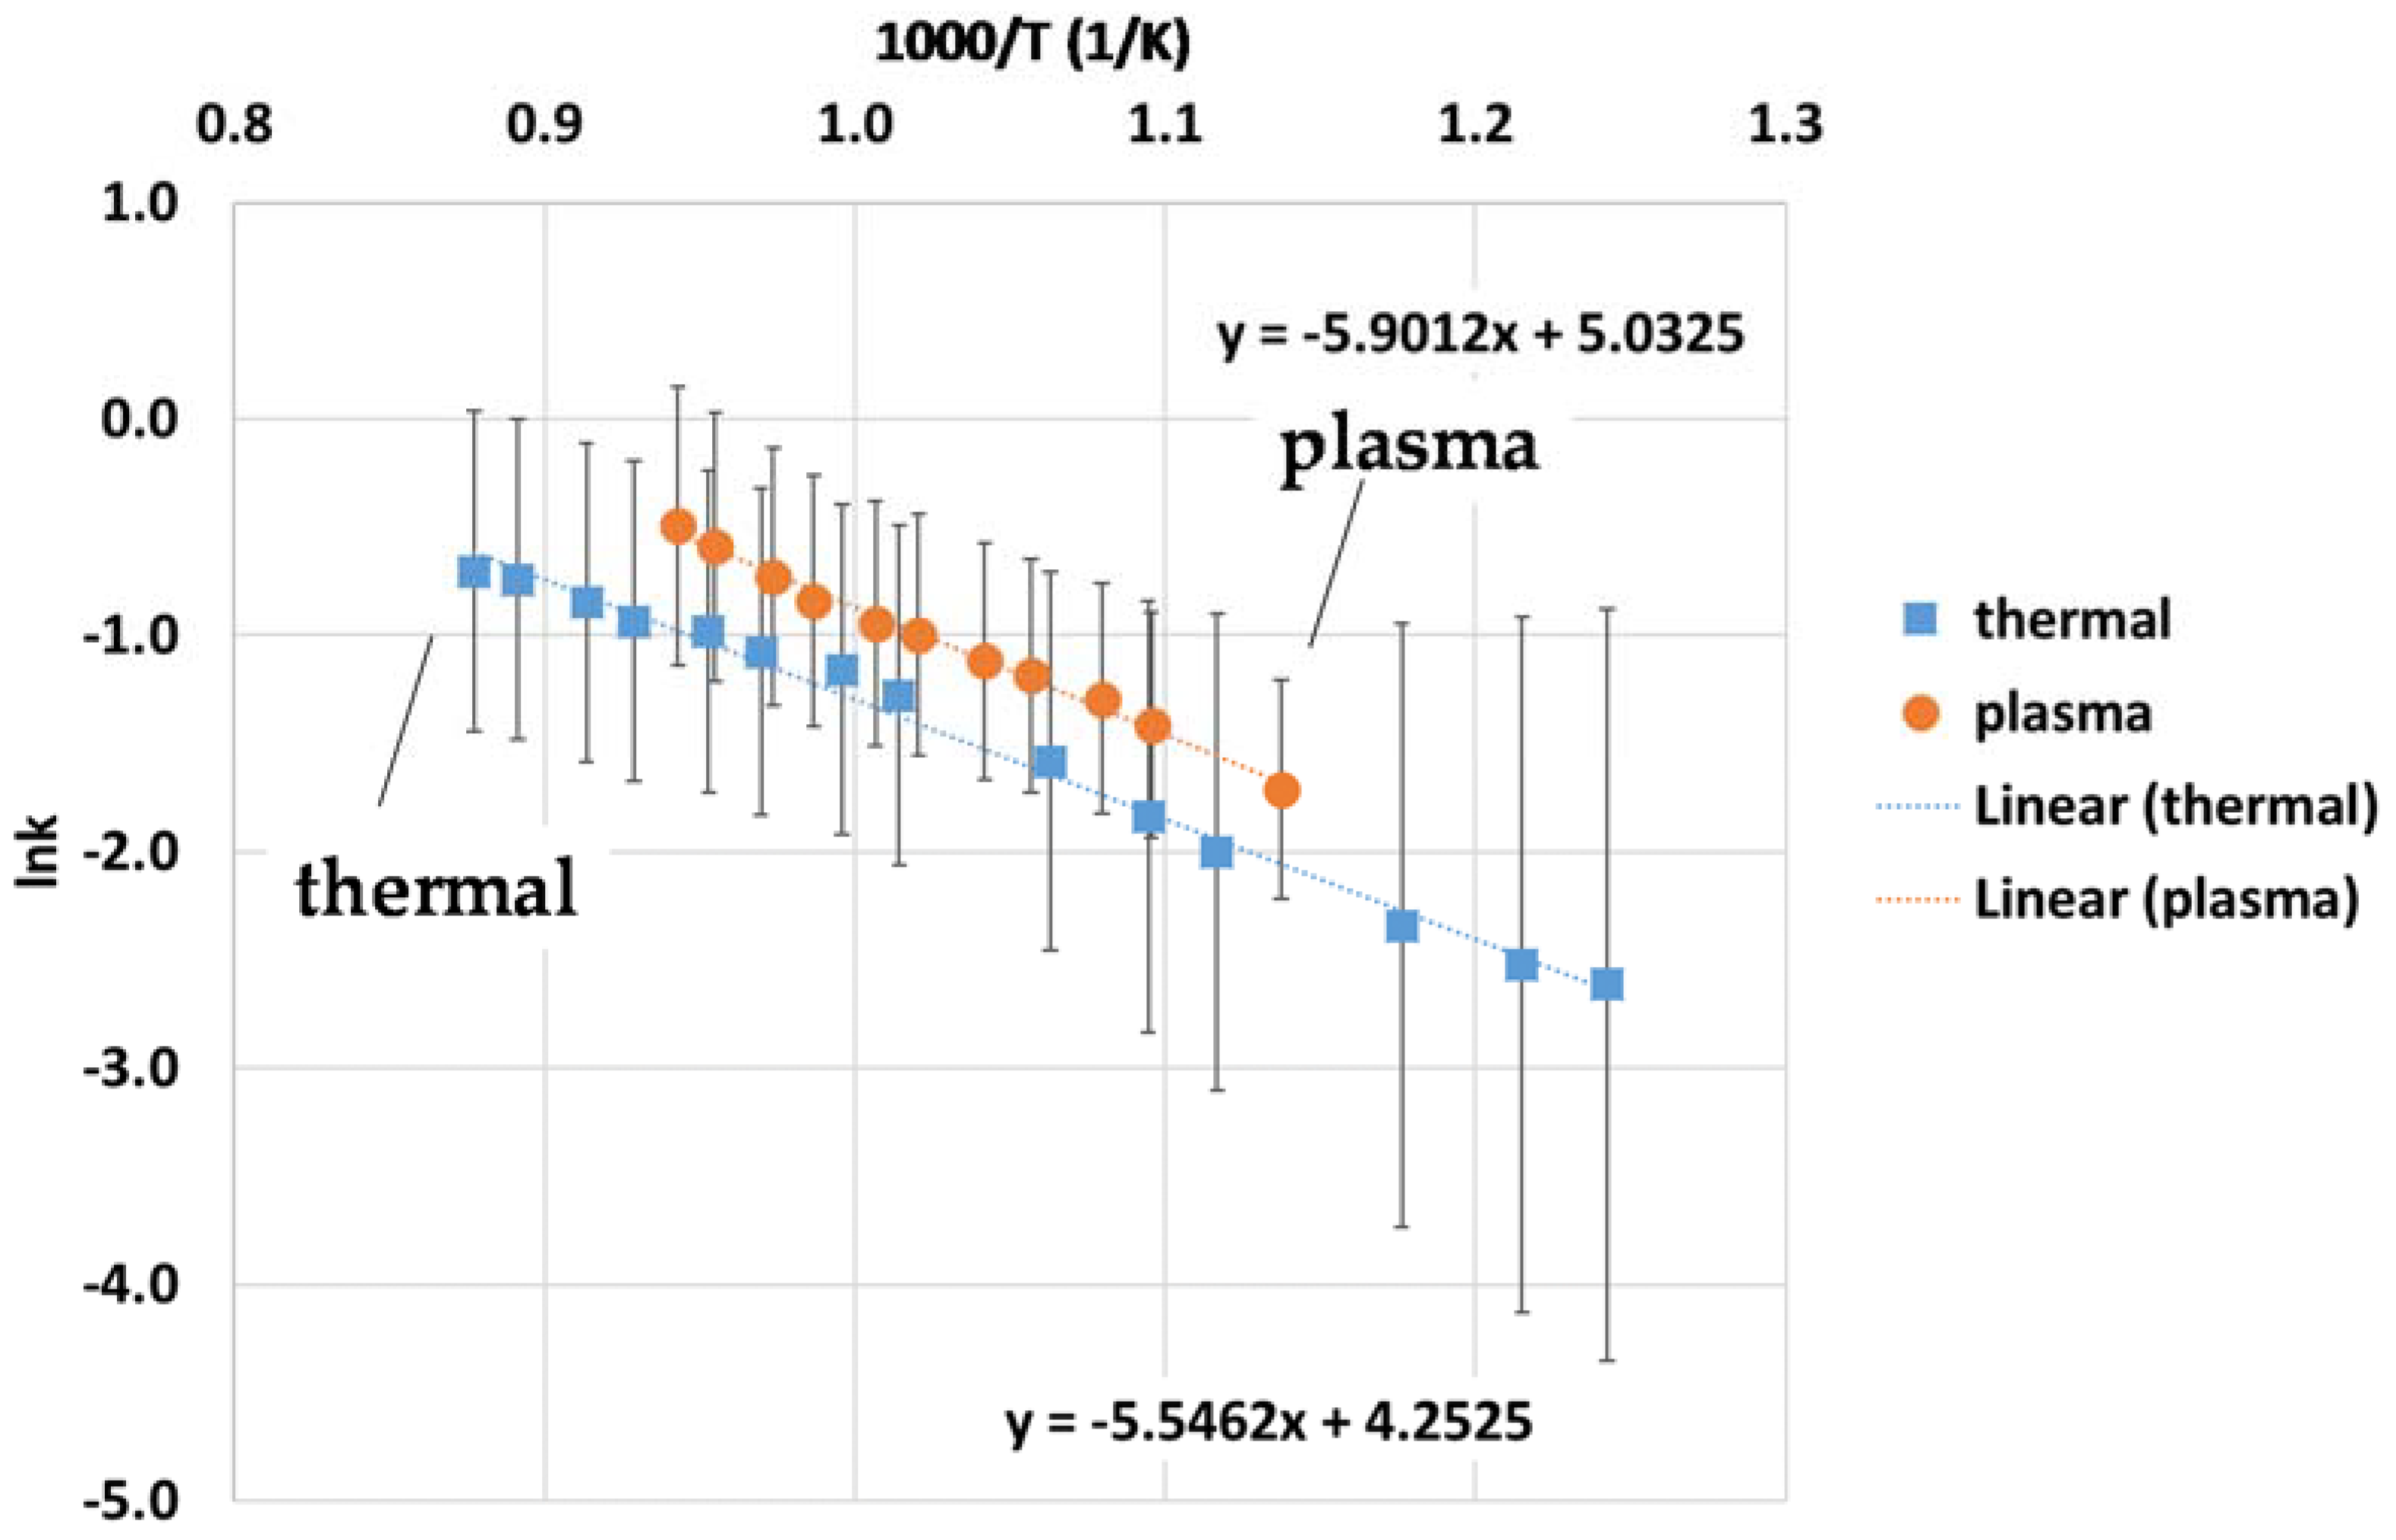
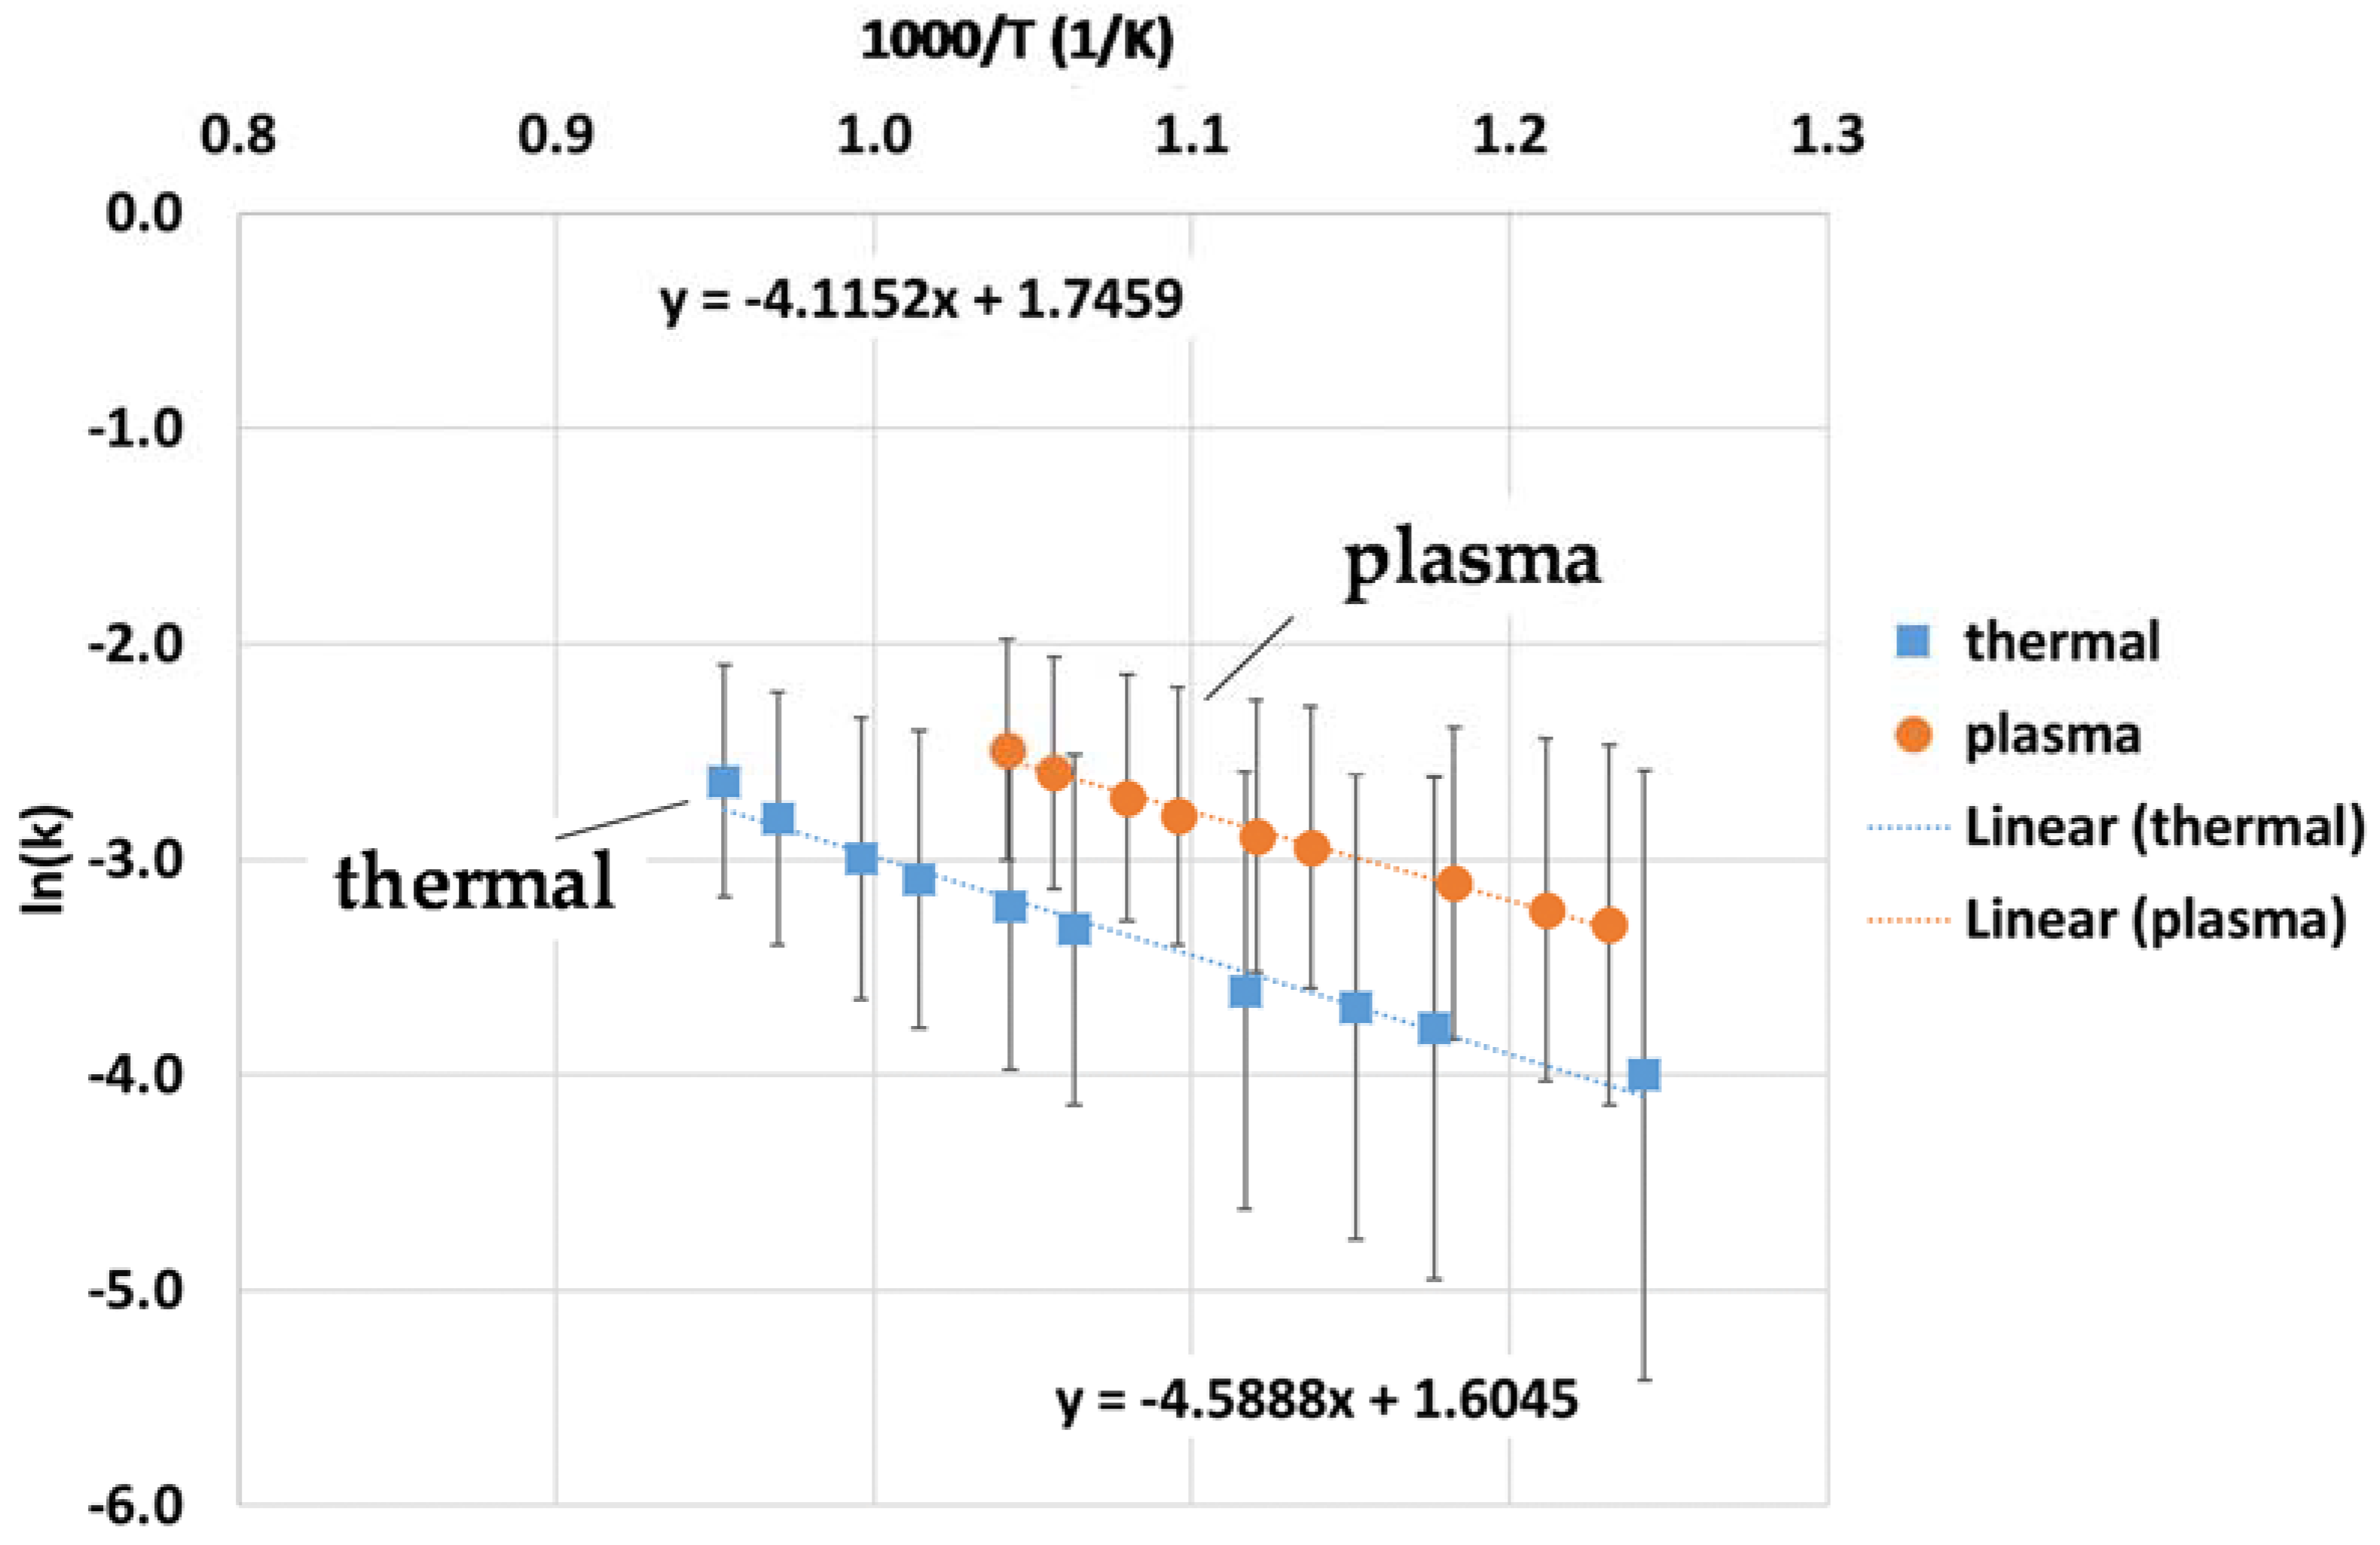
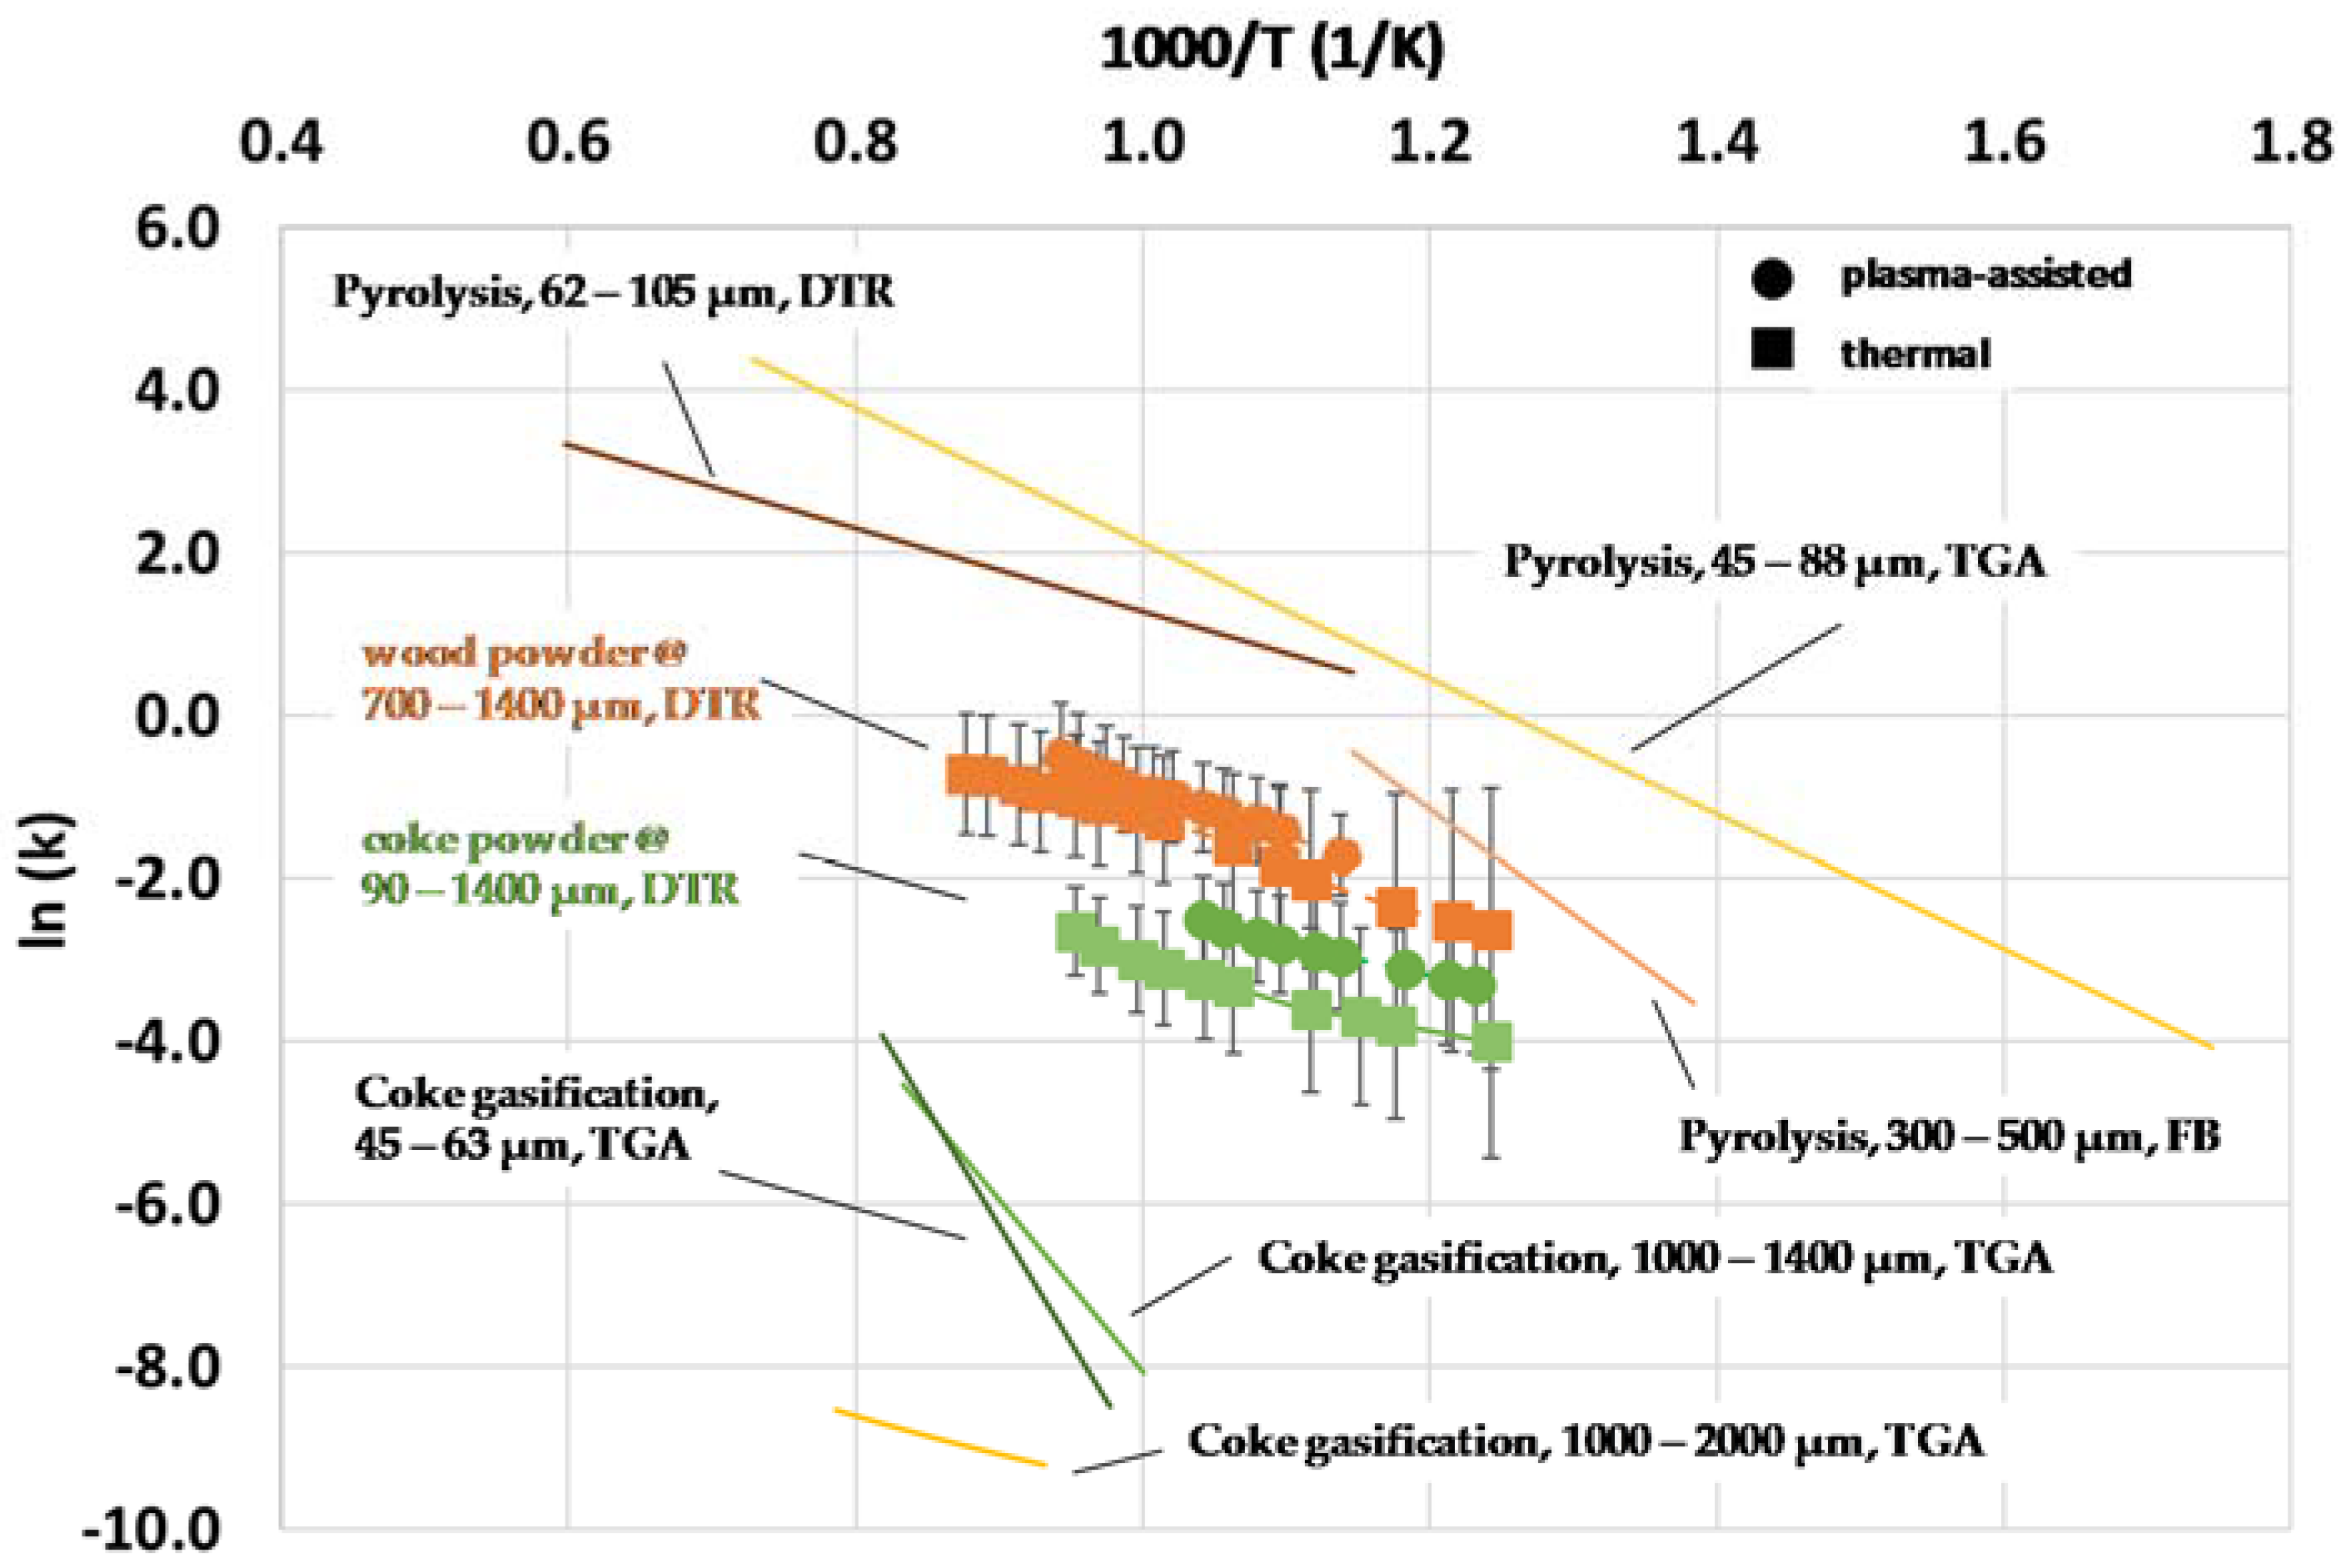
4.3. Reaction Kinetics
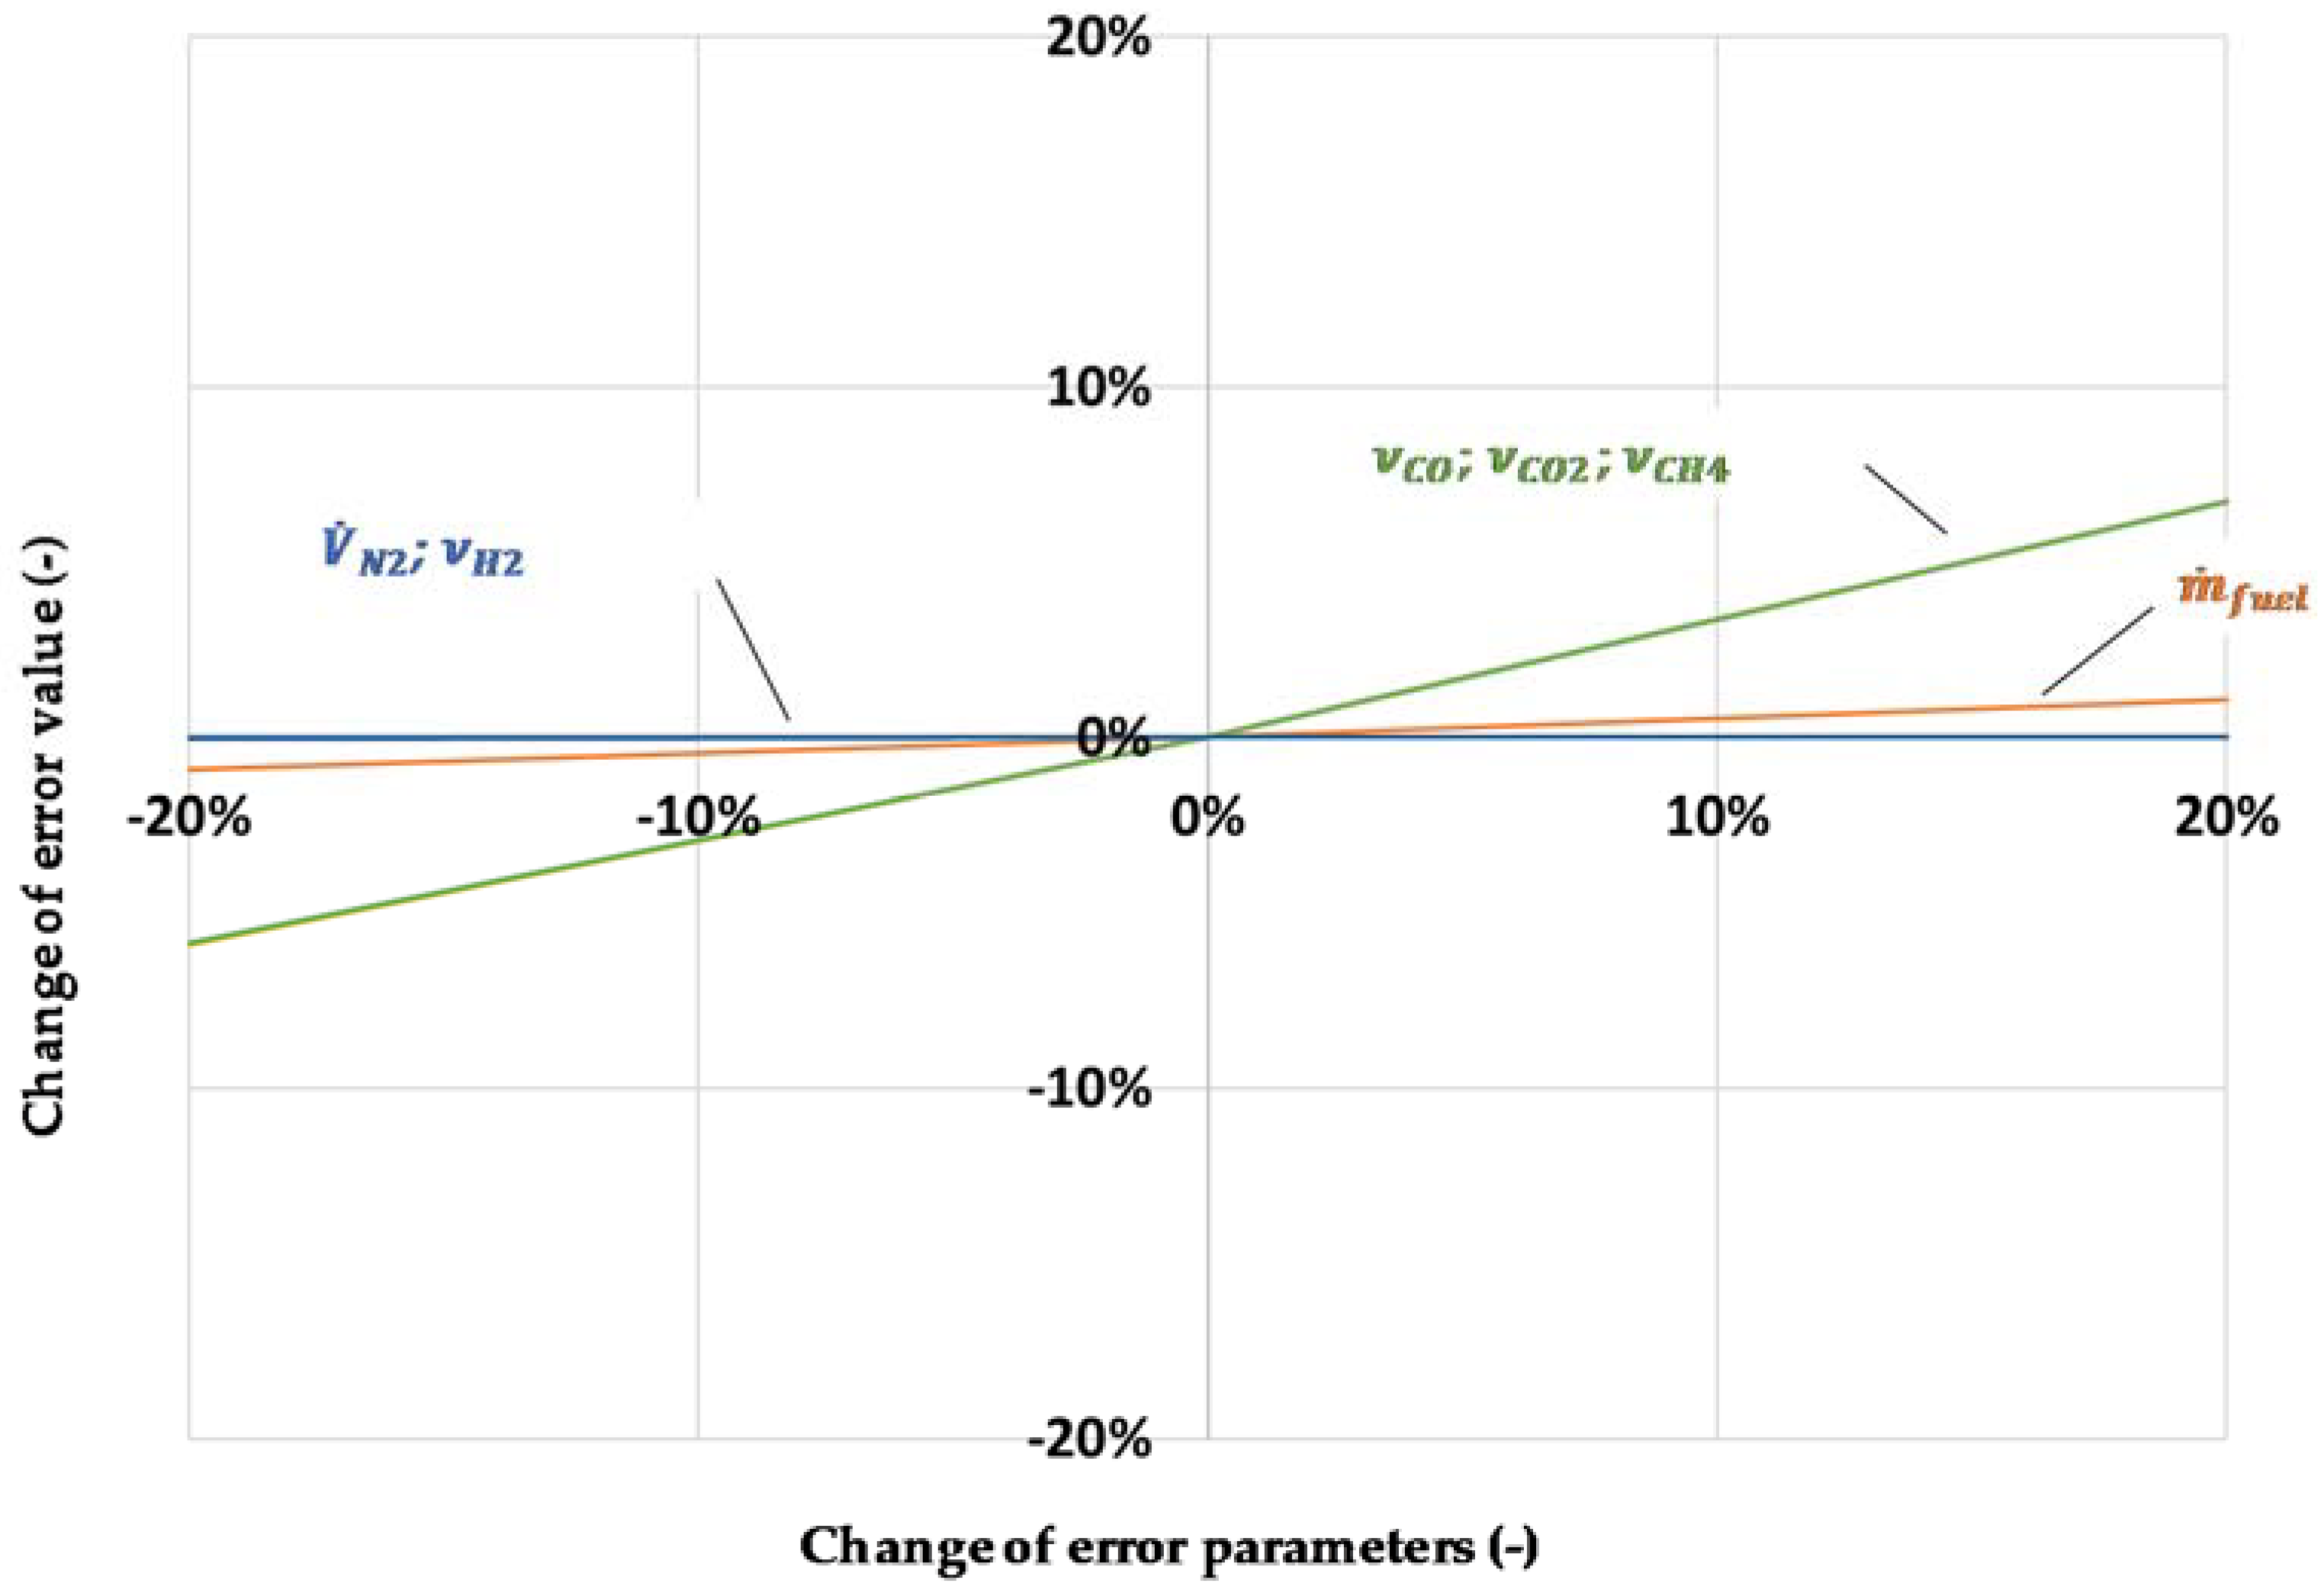
The reaction kinetics of the total gasification process has been studied in this chapter. The reaction rate r is generally defined as the change of concentration ξ or mass m with time t .
r = d ξ d t = 1 m d m d t
This can furthermore be described with the rate coefficient k and the reaction order n :
d m d t = k ( m ( t ) ) n
with the assumption of a first order reaction (n = 1), the relation between reaction rate and rate coefficient k can be expressed with the following linear differential equation.
d m d t = k m ( t )
If further the overall reaction is governed by a rate limiting step, its rate coefficient as a function of temperature can be expressed using the Arrhenius equation:
k = A e E A R T
or in logarithmic form
ln k = E A R 1 T + ln A
where E A normally represents the activation energy, A is the pre-exponential factor, T is the absolute temperature in Kelvin and R is the universal gas constant. Fitting rates obtained experimentally using Equations (19) and (20) results in activation energies and pre-exponential factors both for thermal and plasma-assisted gasification. However, it should be clear that due to the complexity of the gasification process E A values neither in case of thermal nor in the case of plasma-assisted gasification can be considered activation energy in the usual sense. Nevertheless, this approach is widely applied in the literature for describing gasification processes. Thus, it also will be used here.
Table 4 presents kinetic data from the experiments. Figure 16 and Figure 17 show the trend of reaction kinetics with regard to the optically measured temperatures.
In Figure 16, the calculated reaction rate coefficients of wood gasification are compared for both cases. In the NTP case, the rate constant k is 30% higher than that in the thermal case. Figure 17 presents the results of charcoal gasification. The calculated rate constant k in the plasma case is 50% higher than that in the thermal case. A constant slope can be obtained from each case to determine the activation energy and pre-exponential factor. As mentioned above, the calculated values from plasma and thermal gasification don’t represent an activation energy in the usual sense. Furthermore, the difference in between is substantially smaller than the statistical error.
The experimental results are compared to the literature results listed in Table 5. The chosen literature results use a comparable range of particle diameter for the pyrolysis and gasification investigation. Figure 18 shows a graphic comparison between own and literature results.
The literature results shown in Figure 18 were obtained in various reactors (FB: Fluidized-bed; TGA: Thermogravimetric analysis; DTR: Drop tube reactor). Taking into consideration the influence of reactor on the reaction kinetics, we found that our own experimental results for wood powder met quiet well with the literature values of pyrolysis. This indicates that the fed fuel particles have merely been pyrolyzed in a short residence time (see Table 3) in the reactor. The own results of charcoal gasification lie far away from those in the literature. This can be explained by the remaining volatile content in charcoal particles, see Table 1. Another reason is the influence of reactors on test results. In TGA, the heat transfer is slower than in DTR.

4.4. Error Analysis

The measurement errors were calculated according to Gaussian error propagation from [48,49]. A general calculation formula can be found as follows:
G = f ( x , y , z , )
Δ G = ( G x Δ x ) 2 + ( G y Δ y ) 2 + ( G z Δ z ) 2 +
where Δ G represents the standard deviation of the function G = f ( x , y , z ,   etc . ) , G / x , G / y , G / z represent the partial derivatives, Δ x , Δ y , Δ z represent the confidence range of the measured variables.
The error parameters are considered to be the nitrogen flow rate, mass flow rate of fuel and gas concentration of methane, carbon monoxide, carbon dioxide and hydrogen. The reference equation for the calculation of reaction kinetics is as follows:
k = ln ( 1 V ˙ N 2 ( ρ C O ν C O C 2 , C O + ρ C O 2 ν C O 2 C 3 , C O 2 + ρ C H 4 ν C H 4 C 4 , C H 4 ) C 1 , f u e l m ˙ f u e l ( 1 ν C O ν C O 2 ν C H 4 ν H 2 ) ) t
with C1 to C4 depend on material properties and are therefore considered to be constants without error. The systematic error of reaction kinetics can be calculated as following:
Δ k = ( k V ˙ N 2 ) 2 ( Δ V ˙ N 2 ) 2 + ( k m ˙ f u e l ) 2 ( Δ m ˙ f u e l ) 2 + ( k ν C O ) 2 ( Δ ν C O ) 2 + ( k ν C O 2 ) 2 ( Δ ν C O 2 ) 2 + ( k ν C H 4 ) 2 ( Δ ν C H 4 ) 2 + ( k ν H 2 ) 2 ( Δ ν H 2 ) 2
The confidence range of error parameters has been estimated, see Table 6.
The calculated results have been shown in the Figure 16 and Figure 17. A sensitivity analysis of error parameters on the results has been conducted, in order to identify the parameters with larger influence, see Figure 19. The results show that the concentrations of carbon monoxide, carbon dioxide and methane have the most influence on the systematic error followed by mass flow rate of fuel. The concentration of hydrogen has little influence. For future work, the flow rate of nitrogen should be reduced, and the mass flow rate of the fuel should be increased, in order to increase of syngas concentration in the gas mixture.

5. Summary

Non-thermal plasma (NTP)-assisted gasification of solid fuels has been investigated in a thermostatically controlled drop tube reactor with residence times between 0.2 and 1.7 s. The test-rig including the drop tube reactor and periphery systems has been designed, built and commissioned. The reactor offers an optical access for temperature measurement inside the reactor. The preheated water steam flows are used as gasification agent and plasma medium. The non-thermal gliding arc plasma is generated between a pair of diverging electrodes being supplied with electric power of around 1 kW by means of a medium frequency high voltage generator. The stability of NTP operation in water steam at elevated reactor temperature has been optimized by slightly adapting the electrode geometry and flow rates. For comparison, thermal gasification was studied by applying it to the same flow rates of water steam and biomass. Gas temperatures inside of the drop tube reactor being essential for characterization both of the thermal and of the NTP-assisted gasification experiments and evaluation of the results were measured optically by means of Raman spectroscopy.
In the case of NTP-assisted gasification, hydrogen production is strongly enhanced by water dissociation. With increasing temperature, hydrogen production rate is increased by thermal biomass pyrolysis and/or charcoal gasification. Thus, the difference between thermal and NTP-assisted gasification decreases. The production of other gas components such as CO, CO2 and CH4 was also increased by NTP application. This leads to a higher carbon conversion rate: for wood powder, the increase is nearly 10%, and for charcoal powder, it is more than 3%. The temperature dependency of reaction rates was investigated using Arrhenius diagrams assuming first order kinetics. From this analysis for NTP-assisted gasification rate coefficients being 30% higher than for thermal gasification were achieved for wood powder. For charcoal powder, the difference was as large as 50%.
An error analysis according to Gaussian error propagation was conducted to optimize future experimental work. The concentration of syngas components (CO, CO2, CH4) and the mass flow rate of fuel are determined to be the major influence factors of the measurement uncertainty, which could be addressed by increasing the mass flow rate of fuel and reducing the nitrogen flow rate as trace gas.

Author Contributions

Y.P., D.M. and J.K. conceived, designed and performed the experiments; L.B., P.F., L.Z. and S.W. performed the optical temperature measurement; Y.P. and L.B. analyzed the data; T.H., M.B. and R.F. provided the NTP; Y.P., L.B., L.Z., D.M., T.H., R.F. and J.K. wrote the paper.

Acknowledgments

This work was supported by the Campus Future Energy Systems (Campus FES) under the grant “Biomassevergasung in Nichtthermischen Plasmen”. We thank Thomas Werblinski and Sebastian Luther for supporting the optical temperature measurements. Furthermore, we thank Yuhan Huang and Yixuan Yin for supporting the gasification experiments.

Conflicts of Interest

The authors declare no conflict of interest. The founding sponsors had no role in the design of the study; in the collection, analyses, or interpretation of data; in the writing of the manuscript, and in the decision to publish the results.

Abbreviations

FGGravitational force
ρpParticle density
gGravitational constant 9.81 m/s2
dpParticle diameter
FBBuoyancy force
ρgDensity of environmental medium
FWDrag force
cWDrag coefficient
ugGas velocity
upParticle velocity
ReReynolds number
m ˙ f u e l Mass flow rate of fuel (kg/h)
C 1 , f u e l Carbon content in fuel (%)
V ˙ N 2 Nitrogen flow rate (m³/s)
ρ C O Density of carbon monoxide (kg/m³)
ν C O Volumetric concentration of carbon monoxide in syngas (%)
C 2 , C O Carbon content in CO (%)
ρ C O 2 Density of carbon monoxide (kg/m³)
ν C O 2 Volumetric concentration of carbon dioxide in syngas (%)
C 3 , C O 2 Carbon content in CO2 (%)
ρ C H 4 Density of carbon monoxide (kg/m³)
ν C H 4 Volumetric concentration of methane in syngas (%)
C 4 , C H 4 Carbon content in CH4 (%)
ν H 2 Volumetric concentration of hydrogen in syngas (%)
t Residence time of fuel particles (s)

References

  1. Tremel, A.; Wasserscheid, P.; Baldauf, M.; Hammer, T. Techno-economic analysis for the synthesis of liquid and gaseous fuels based on hydrogen production via electrolysis. Int. J. Hydrog. Energy 2015, 40, 11457–11464. [Google Scholar] [CrossRef]
  2. Roth, J.R. Industrial Plasma Engineering: Volume 1: Principles; CRC Press: Boca Raton, FL, USA, 1995. [Google Scholar]
  3. Hammer, T. Application of plasma technology in environmental techniques. Contrib. Plasma Phys. 1999, 39, 441–462. [Google Scholar] [CrossRef]
  4. Huang, H.; Tang, L. Pyrolysis treatment of waste tire powder in a capacitively coupled RF plasma reactor. Energy Convers. Manag. 2009, 50, 611–617. [Google Scholar] [CrossRef]
  5. Hrabovsky, M. Plasma Aided Gasification of Biomass, Organic Waste and Plastics; ICPIG: Praha, Czech Republic, 2011. [Google Scholar]
  6. Messerle, V.E.; Ustimenko, A.B.; Lavrichshev, O.A. Plasma Gasification of Solid Fuels. Recent Adv. Energy Environ. Econ. Dev. 2012, pp. 38–43. Available online: http://www.wseas.us/e-library/conferences/2012/Paris/DEEE/DEEE-03.pdf (accessed on 9 October 2017).
  7. Valmundsson, A.S.; Janajreh, I. Plasma gasification process modeling and energy recovery from solid waste. In Proceedings of the ASME 2011 5th International Conference on Energy Sustainability, Washington, DC, USA, 8 August 2011; pp. 361–368. [Google Scholar]
  8. Nunnally, T.; Tsangaris, A.; Rabinovich, A.; Nirenberg, G.; Chernets, I.; Fridman, A. Gliding arc plasma oxidative steam reforming of a simulated syngas containing naphthalene and toluene. Int. J. Hydrog. Energy 2014, 39, 11976–11989. [Google Scholar] [CrossRef]
  9. Nozaki, T.; Aĝiral, A.; Yuzawa, S.; Gardeniers, J.G.E.H.; Okazaki, K. A single step methane conversion into synthetic fuels using microplasma reactor. Chem. Eng. J. 2011, 166, 288–293. [Google Scholar] [CrossRef]
  10. Shin D, H.; Hong Y, C.; Lee S, J.; Kim Y, J.; Cho C, H.; Ma S, H.; Chun, S.M.; Lee, B.J.; Uhm H, S. A pure steam microwave plasma torch: Gasification of powdered coal in the plasma. Surf. Coat. Technol. 2013, 228, S520–S523. [Google Scholar] [CrossRef]
  11. Ni, G.; Zhao, G.; Jiang, Y.; Li, J.; Meng, Y.; Wang, X. Steam plasma jet treatment of phenol in aqueous solution at atmospheric pressure. Plasma Process. Polym. 2013, 10, 353–363. [Google Scholar] [CrossRef]
  12. Materazzi, M.; Lettieri, P.; Mazzei, L.; Taylor, R.; Chapman, C. Tar evolution in a two stage fluid bed-plasma gasification process for waste valorization. Fuel Process. Technol. 2014, 128, 146–157. [Google Scholar] [CrossRef]
  13. Kempe, V.; Jovicic, V.; Ribeiro, M.A.; Delgado, A. Experimentelle Untersuchungen zur Vergasung von Biomasse mit nicht-thermischem Stickstoff Plasma. In Proceedings of the Fachtagung Lasermethoden in der Strömungsmesstechnik, Munich, Germany, 3–5 September 2013; pp. 1–7. [Google Scholar]
  14. Ni, G.; Lan, Y.; Cheng, C.; Meng, Y.; Wang, X. Reforming of methane and carbon dioxide by DC water plasma at atmospheric pressure. Int. J. Hydrog. Energy 2011, 36, 12869–12876. [Google Scholar] [CrossRef]
  15. Yantai Longyuan Power Technology Co., Ltd. Available online: www.lypower.com/en (accessed on 9 October 2017).
  16. PlasmaAir AG. Available online: http://plasmaair.de/en/company/ (accessed on 9 October 2017).
  17. Rafflenbeul Anlagen GmbH. Available online: http://www.envisolve.com (accessed on 9 October 2017).
  18. Alexakis, T.; Tsantrizos, P.G.; Manoliadis, P.; Beverly, D.; Pelletier, S. A Plasma-Arc-Assisted Thermal Treatment System for Shipboard Waste. In Proceedings of the 21st Conference on Incineration and Thermal Treatment Technologies, New Orleans, LA, USA, 13–17 May 2002. [Google Scholar]
  19. Pyrogenesis Canada Inc. Available online: http://www.pyrogenesis.com (accessed on 9 October 2017).
  20. Plasma Arc Technologies, Inc. Available online: http://www.plasmaarctech.com/ (accessed on 9 October 2017).
  21. Westinghouse Electric Corporation. Available online: http://westinghouse.com/ (accessed on 9 October 2017).
  22. Karl, J. Dezentrale Energiesysteme, Neue Technologien im Liberalisierten Energiemarkt; Walter de Gruyter: Berlin, Germany; Boston, MA, USA, 2012. [Google Scholar]
  23. Higman, C. Gasification. In Combustion Engineering Issues for Solid Fuel Systems; Elsevier: New York, NY, USA, 2008; pp. 423–468. [Google Scholar]
  24. Hofbauer, H.; Rauch, R.; Fürnsinn, S.; Aichernig, C. Energiezentrale Güssing. Energiesysteme der Zukunft-Endbericht. 2005. Available online: https://nachhaltigwirtschaften.at/resources/edz_pdf/0679_energiezentrale_guessing.pdf (accessed on 9 October 2017).
  25. Karl, J. Biomass heat pipe reformer—Design and performance of an indirectly heated steam gasifier. Biomass Convers. Biorefinery 2014, 4, 1–14. [Google Scholar] [CrossRef]
  26. Kim, S.C.; Lim, M.S.; Chun, Y.N. Hydrogen-rich gas production from a biomass pyrolysis gas by using a plasmatron. Int. J. Hydrog. Energy 2013, 38, 14458–14466. [Google Scholar] [CrossRef]
  27. Baumhakl, C. Substitute Natural Gas Production with Direct Conversion of Higher Hydrocarbons. Ph.D. Thesis, Friedrich-Alexander-Universität Erlangen-Nürnberg, Erlangen, Germany, 2014. [Google Scholar]
  28. Zhang, L.; Xu, C.C.; Champagne, P. Overview of recent advances in thermo-chemical conversion of biomass. Energy Convers. Manag. 2010, 51, 969–982. [Google Scholar] [CrossRef]
  29. González-Vázquez, P.M.; García, R.; Pevida, C.; Rubiera, F. Optimization of a Bubbling Fluidized Bed Plant for Low-Temperature Gasification of Biomass. Energies 2017, 10, 306. [Google Scholar] [CrossRef]
  30. Guizani, C.; Jeguirim, M.; Valin, S.; Limousy, L.; Salvador, S. Biomass Chars: The Effects of Pyrolysis Conditions on Their Morphology, Structure, Chemical Properties and Reactivity. Energies 2017, 10, 796. [Google Scholar] [CrossRef]
  31. James, R.A.M.; Yuan, W.; Boyette, D.M. The Effect of Biomass Physical Properties on Top-Lit Updraft Gasification of Woodchips. Energies 2016, 9, 283. [Google Scholar] [CrossRef]
  32. Jayathilake, R.; Rudra, S. Numerical and Experimental Investigation of Equivalence Ratio (ER) and Feedstock Particle Size on Birchwood Gasification. Energies 2017, 10, 1232. [Google Scholar] [CrossRef]
  33. Liu, X.; Wei, J.; Huo, W.; Yu, G. Gasification under CO2–Steam Mixture: Kinetic Model Study Based on Shared Active Sites. Energies 2017, 10, 1890. [Google Scholar] [CrossRef]
  34. Tamošiūnas, A.; Chouchène, A.; Valatkevičius, P.; Gimžauskaitė, D.; Aikas, M.; Uscila, R.; Ghorbel, M.; Jeguirim, M. The Potential of Thermal Plasma Gasification of Olive Pomace Charcoal. Energies 2017, 10, 710. [Google Scholar] [CrossRef]
  35. Ombrello, T.; Qin, X.; Ju, Y.; Gutsol, A.; Fridman, A.; Carter, C. Combustion Enhancement via Stabilized Piecewise Nonequilibrium Gliding Arc Plasma Discharge. AIAA J. 2006, 44, 142–150. [Google Scholar] [CrossRef]
  36. Itikawa, Y.; Mason, N. Cross Sections for Electron Collisions with Water Molecules. J. Phys. Chem. Ref. Data 2005, 34, 1–22. [Google Scholar] [CrossRef]
  37. Hagelaar, G.J.M.; Pitchford, L.C. Solving the Boltzmann equation to obtain electron transport coefficients and rate coefficients for fluid models. Plasma Sources Sci. Technol. 2005, 14, 722. [Google Scholar] [CrossRef]
  38. Avila, G.; Fernandez, J.M.; Mate, B.; Tejeda, G.; Montero, S. Ro-vibrational Raman cross sections of water vapor in the OH stretching region. J. Mol. Spectrosc. 1999, 196, 77–92. [Google Scholar] [CrossRef] [PubMed]
  39. Seeger, T. Moderne Aspekte der Linearen und Nichtlinearen Raman-Streuung zur Bestimmung Thermodynamischer Zustandsgrößen in der Gasphase; ESYTEC Energie- und Systemtechnik GmbH: Erlangen, Germany, 2006. [Google Scholar]
  40. Matveev, I.B.; Serbin, S.I. Modeling of the Coal Gasification Processes in a Hybrid Plasma Torch. Plasma Sci. IEEE Trans. 2007, 35, 1639–1647. [Google Scholar] [CrossRef]
  41. Hrabovsky, M.; Hlina, M.; Konrad, M.; Kopecky, V.; Kavka, T.; Chumak, O.; Maslani, A. Thermal Plasma Gasification of Biomass for Fuel Gas Production. High Temp. Mater. Process. 2009, 13, 299–313. [Google Scholar] [CrossRef]
  42. Uhm, H.S.; Hong, Y.C.; Shin, D.H. A microwave plasma torch and its applications. Plasma Sources Sci. Technol. 2006, 15, S26. [Google Scholar] [CrossRef]
  43. Li, J.; Bonvicini, G.; Tognotti, L.; Yang, W.; Blasiak, W. High-temperature rapid devolatilization of biomasses with varying degrees of torrefaction. Fuel 2014, 122, 261–269. [Google Scholar] [CrossRef] [Green Version]
  44. Nunn, T.R.; Howard, J.B.; Longwell, J.P.; Peters, W.A. Product compositions and kinetics in the rapid pyrolysis of sweet gum hardwood. Ind. Eng. Chem. Process Des. Dev. 1985, 24, 836–844. [Google Scholar] [CrossRef]
  45. Font, R.; Gomis, A.; Verdu, E.; Devesa, J. Kinetics of the Pyrolysis of Almond Shell and Almond Shell Impregnated with CoCl2 in a Fluidized Bed Reactor and in a Pyroprobe. Ind. Eng. Chem. Res. 1990, 29. [Google Scholar] [CrossRef]
  46. Nandi, S.P.; Onischak, M. Gasification of Chars Obtained from Maple and Jack Pine Woods. In Fundamentals of Thermochemical Biomass Conversion; Overend, R.P., Milne, T.A., Mudge, L.K., Eds.; Springer: Dordrecht, The Netherlands, 1985; pp. 567–587. [Google Scholar]
  47. Hawley, M.C.; Boyd, M.; Anderson, C.; DeVera, A. Gasification of wood char and effects of intraparticle transport. Fuel 1983, 62, 213–216. [Google Scholar] [CrossRef]
  48. Barrio, M.; Gøbel, B.; Rimes, H.; Henriksen, U.; Hustad, J.E.; Sørensen, L.H. Steam Gasification of Wood Char and the Effect of Hydrogen Inhibition on the Chemical Kinetics. In Progress in Thermochemical Biomass Conversion; Blackwell Science Ltd.: Hoboken, NJ, USA, 2001; pp. 32–46. [Google Scholar]
  49. Schwister, K.; Leven, V. Verfahrenstechnik fuer Ingenieure: Ein Lehr-und Uebungsbuch; Carl-Hanser-Verlag: Munich, Germany, 2012. [Google Scholar]
Figure 1. Case 1—experimental method of plasma gasification.
Energies 11 01302 g001
Figure 2. Case 2—experimental method of thermal gasification (reference).
Energies 11 01302 g002
Figure 3. Test-rig for experimental investigation of plasma-assisted gasification.
Energies 11 01302 g003
Figure 4. Drop tube reactor with plasma ignition and the surrounding electrical heater.
Energies 11 01302 g004
Figure 5. Schematic geometry of the non-thermal plasma generator.
Energies 11 01302 g005
Figure 6. Voltage (blue) and current (orange) traces of the gliding arc generator operated in nitrogen (N2).
Energies 11 01302 g006
Figure 7. Optical temperature measurement setup (Raman Spectroscopy) at the reactor.
Energies 11 01302 g007
Figure 8. Air plasma filaments under parameter variation of flow rates and furnace temperatures.
Energies 11 01302 g008
Figure 9. Stabilized water steam plasma at reactor temperature of 950 °C.
Energies 11 01302 g009
Figure 10. Gas composition in the case of plasma (orange) and thermal (blue) gasification with dotted trend lines—wood powder d = 700–1400 µm; dry-basis.
Energies 11 01302 g010
Figure 11. Produced syngas flow rate in case of plasma (orange) and thermal (blue) gasification with dotted trend lines—wood powder d = 700–1400 µm; dry-basis.
Energies 11 01302 g011
Figure 12. Gas composition in the case of plasma (orange) and thermal (blue) gasification with dotted trend lines—charcoal powder d = 90–1400 µm; dry-basis.
Energies 11 01302 g012
Figure 13. Produced syngas flow rate in the case of plasma (orange) and thermal (blue) gasification with dotted trend lines—charcoal powder d = 90–1400 µm; dry-basis.
Energies 11 01302 g013
Figure 14. Carbon conversion depending on the optically measured temperature (orange: plasma; blue: thermal; wood powder d = 700–1400 µm).
Energies 11 01302 g014
Figure 15. Carbon conversion depending on the optically measured temperature (orange: plasma case; blue: thermal case; charcoal powder d = 90–1400 µm).
Energies 11 01302 g015
Figure 16. Comparison of reaction kinetics between thermal and plasma cases in Arrhenius diagram (wood powder d = 700–1400 µm).
Energies 11 01302 g016
Figure 17. Comparison of reaction kinetics between thermal and plasma cases in Arrhenius diagram (charcoal powder d = 90–1400 µm).
Energies 11 01302 g017
Figure 18. Comparison of own experimental results to literature.
Energies 11 01302 g018
Figure 19. Sensitivity analysis of systematic error parameters.
Energies 11 01302 g019
Table 1. Proximate and ultimate analysis of wood [27] and charcoal powder.
Fuel TypeWood Powder [27] Charcoal Powder*own analysis
Water content6.9%2.8%
Proximate analysis (wt. %, dry)
Volatile matter85.021.2
Solid carbon14.576.5
Ash content0.52.3
Ultimate analysis (wt. %, dry)
Carbon50.984.5
Hydrogen6.23.1
Oxygen42.99.2
Table 2. Experimental conditions: thermal and plasma-assisted gasification with wood powder and char powder.
Wood PowderCharcoal Powder
Furnace temperature (°C)600–950600–900
Pressureatm.atm.
Main water steam (kg/h)66
Side water steam (kg/h)22
Nitrogen flow rate (slm)1010
Inlet temperature of main water steam (°C)270 (plasma case)
650–730 (thermal case)
270 (plasma case)
650 (thermal case)
Mean fuel particle diameter (µm)700–140090–1400
Mass flow of fuel (kg/h)0.110.16
Electrical plasma power (W)900 (plasma case)900 (plasma case)
Table 3. Calculated residence time of fuel particles.
Residence Time by Sampling at … (s)
Diameter (µm)End of Window ZoneEnd of Reaction Zone
901.11.7
3000.91.5
7000.40.7
10000.30.5
14000.20.3
Table 4. Experimental results of reaction kinetics.
Type of ReactionFuel with DiameterT (°C)EA
(kJ/mol K)
A
(s−1)
Thermal gasificationWood powder
700–1400 µm
530–88046.1147.6
Plasma-assisted gasificationWood powder
700–1400 µm
600–80049.1153.3
Thermal gasificationCharcoal powder
90–1400 µm
530–73038.25.0
Plasma-assisted gasificationCharcoal powder
90–1400 µm
530–68034.25.7
Table 5. Reaction kinetics of biomass pyrolysis and coke gasification from literature.
Type of ReactionFuel with DiameterT (°C)Reactor TypeEA
(kJ/mol K)
A
(s−1)
Sources
PyrolysisPalm kernel shell
62–105 µm
600–1400DTR42.5602[42,43]
PyrolysisWood dust
45–88 µm
300–1100TGA693.39 × 104[43,44]
PyrolysisAlmond shells
300–500 µm
460–605FB1081.86 × 106[44,45]
Coke gasificationWood
1000–1400 µm
730–930TGA1775.55 × 105[45,46]
Coke gasificationWood dust
1000–2000 µm
800–1000TGA1566570[46,47]
Coke gasificationBirch and beech
45–63 µm
750–900TGA2372.62 × 108[47,48]
Table 6. Estimated confidence ranges of error parameters.
Error ParametersConfidence Range
Δ m ˙ f u e l 5%
Δ V ˙ N 2 5%
Δ ν C O , Δ ν C O 2 , Δ ν C H 4 , Δ ν H 2 1%

