1. Introduction
With the advantages of high integration and reliability, high-voltage (HV) switchgear is widely used in the power grid and has already become an essential equipment in power transmission and transformation system [
1,
2,
3,
4]. As a potential threat to the insulation safety of HV switchgears, partial discharge (PD) directly affects the safety and reliability of power supply [
5,
6,
7]. When a partial discharge occurs, the generated electromagnetic signal contains abundant information of insulation states and ultra-high frequency (UHF) components is widely used to detect and diagnose insulation of HV equipment [
8,
9,
10,
11].
Currently, researchers have designed many external and built-in UHF antennas based on IEC-62487 for online PD detection in transformers, generators, gas-insulation switches (GIS) and so on [
12,
13,
14,
15,
16]. In order to improve the detection of partial discharge, some researchers, such as Albarracín, R. considers the influence of metal surroundings on UHF antenna [
14]. In parallel with UHF Antenna design, the propagation of UHF signals generated by PD is also the focus of research. To study the propagation characteristics of the UHF signal, researchers have adopted the finite-difference time-domain (FDTD) method to simulate the discharge signal. Considering that the size of the switchgear is too large and the computer memory cannot meet the requirement, researchers simplified the PD source to a uniformly hardwiring source, which leads to the minimum mesh size reaches one tenth of the wavelength λ [
15,
17,
18,
19]. This provides a good method for studying the propagation of discharge signal in a wide area of space. While for the occurrence of discharge signal is in a limited size of electrical equipment, UHF electromagnetic (EM) wavelength λ (ranges from 10 to 100 cm) is comparable to the size of the electrical equipment. In this case, the PD source cannot be regarded as a uniformly hardwiring source, which leads to an inaccurate calculation.
In recent years, with the development of high-performance computers and numerical algorithms, many scholars have devoted themselves to studying atmospheric pressure gas discharges. Currently, a number of researchers have proposed some fluid chemistry models, which are used to describe the phenomenon of PD [
20,
21,
22,
23]. Peng Qingjun and Zhang Yun established a hydrodynamic drift-diffusion model to describe the spatial-temporal evolution of electrons and ions in the discharge process, in which they obtained the radiation of EM waves propagated into the space. At the same time, the length and radius of the discharge channel were obtained, which provides the possibility of establishing an equivalent discharge source to study the streamer propagation [
24,
25].
In order to obtain the propagation characteristics of PD in limited large size electrical equipment, the near-field to far-field transformation is adopted in our calculation. First of all, an equivalent PD source is established. Secondly, a Huygens’ surface is surrounding the discharge signal to get the near-field distribution of electromagnetic field based on the near-field to far-field transformation. Furthermore, the directly calculated electric field and directivity diagram are compared with these radiated results of the near-field source to validate the proposed method. Finally, the near-field distribution of EM is used to replace a discharge signal in a real sized switchgear and the propagation characteristics are obtained.
2. Near-Field to Far-Field Transformation Method
When PD occurs in HV equipment, the near-field to far-field transformation used for the study the signal propagation is based on Huygens’ Principle (the equivalence theorem) [
26,
27,
28]. The radiating sources of PD are enclosed inside surface
S, as shown in
Figure 1. If the EM field outside the enclosed surface
S is the only field of interest, one can substitute the discharge sources with equivalent electric and magnetic currents (
J and
Jm) placed on the surface of
S. based on Love’s equivalence principle [
29], the field within the closed surface
S is set to zero, and the equivalent sources become
where
HS and
ES denote the external electric field and magnetic field of the closed surface
S, respectively. The EM field generated by those equivalent electric and magnetic currents satisfies the following equation
Here E is the electric field and H is the magnetic field in the passive space; the wavenumber k is defined as and its unit is rad/m; ω is the radian frequency, rad/s; μ is the permeability and ε is the permittivity.
According to vector Green’s theorem [
30],
Here the vector
P and
Q have successive second derivatives. Let assume
,
;
en is the unit normal vector;
r’ denotes the distance of source point and
r denotes the distance of the field point. Then
Considering the Green function
Combined with Equation (1), the electric field distribution can be obtained
For the passive area, the value of the first integral item on the right of the Equation (8) is zero. The electric field
E(
r) outside surface of
S can be calculated by
Similarly, the magnetic field
H(
r) outside surface of
S can be derived as
It can be obtained from Equations (9) and (10) that EM field (E(r), H(r)) in the passive area generated by PD can be obtained by calculating the distributions of electric field ES and magnetic field HS on the closed surface of S. Thus the entire calculation process of the near-field to far-field transformation can be divided into two steps: first, the EM distributions on the closed surface of S are calculated as the near-field source; then the calculated near-field source is used as a secondary source to compute distributions of electric field E and magnetic field H on the passive area.
3. Verification of the Proposed Method
3.1. Discharge Model Setup
When PD occurs, these generated up to UHF EM waves provide a method to evaluate the PD severity states. Peng et al. found out that the short air gap discharge forms an obvious discharge channel and channel radius [
24,
25,
31]. Based on the above characteristics, an equivalent schematic diagram of a discharge model is shown in
Figure 2.
Where
Is denotes the applied pulse current,
Rs is the equivalent input impedance,
U denotes voltage drop in the streamer discharge channel. Since the length of the discharge channel is much smaller than the size of system, the discharge channel can be equivalent as a dipole antenna [
32]. Based on the characteristics of the discharge channel in reference [
25], the maximum radius of the streamer discharge in a 5 mm air gap reaches 0.3 mm. Therefore, a typical length of the equivalent dipole antenna is set to 5 mm and its equivalent radius is set as 0.3 mm. A Gaussian pulse is added on the equivalent dipole antenna as the PD current pulse [
33].
Here
t0,
τ and
I0 denote the time at the peak value of the pulse current; the width of the pulse current, the amplitude of the pulse current, respectively [
34]. The capacity of the discharge pulse
Q is calculated by integrating Equation (12)
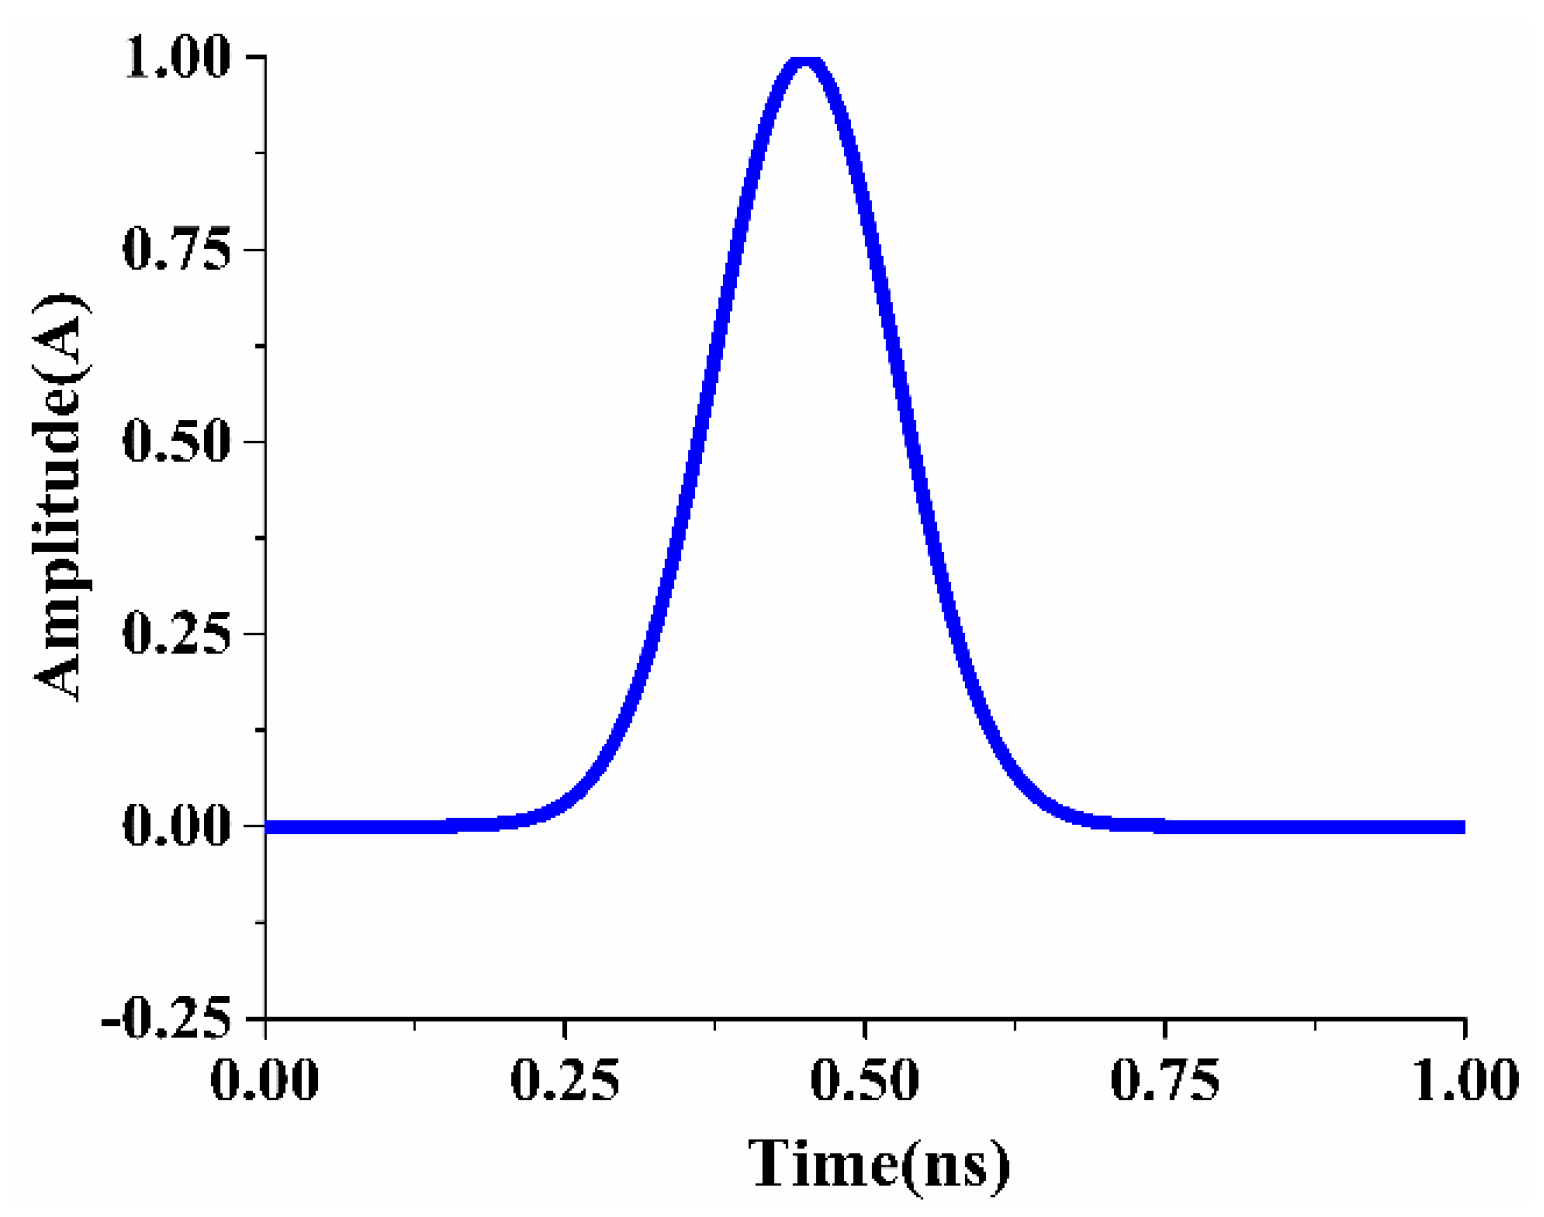
A typical Gaussian pulse with a bandwidth of 3 GHz is set as a PD pulse, which is shown in
Figure 3. The amplitude
I0 is set as 1 ampere and its pulse width
τ is 560 ps and
t0 is 450 ps, thus the total capacity of the discharge pulse
Q is 280 pC.
3.2. Near-Field Test
For simplicity,
Figure 4 shows an equivalent dipole antenna placed along the z-direction. A Huygens’ surface (20 × 20 × 20 mm) is surrounding the discharge model to carry out the near-field test. The model of equivalent dipole antenna is constructed using CST Microwave Studio and the entire calculation is carried out via this software. By numerical simulation, the EM field on the Huygens’ surface is obtained as is shown on the right side of the figure, which is used as an equivalent radiating source. Then the electric field of the surface at a distance of 60 mm was calculated by the near-field to far-field transformation. Finally, these comparisons of electric field and far field directivity between Huygens’ solution and direct calculation were analyzed.
Since there are six faces in Huygens’ box, for clarity, the electric field on the face of x-z plane was used as the test analysis. 1500 MHz was selected as the test frequency. The directly calculated tangential electric field components of
Ex and
Ez were compared with the results obtained from the near-field to far-field transformation. It can be seen from
Figure 5 that the comparison of electric fields at 60 mm reveals a similar behavior. Although some numerical noise is present in the calculated results, these noises have little effect on the accuracy of the far-field calculation, which can be verified by the far-field pattern.
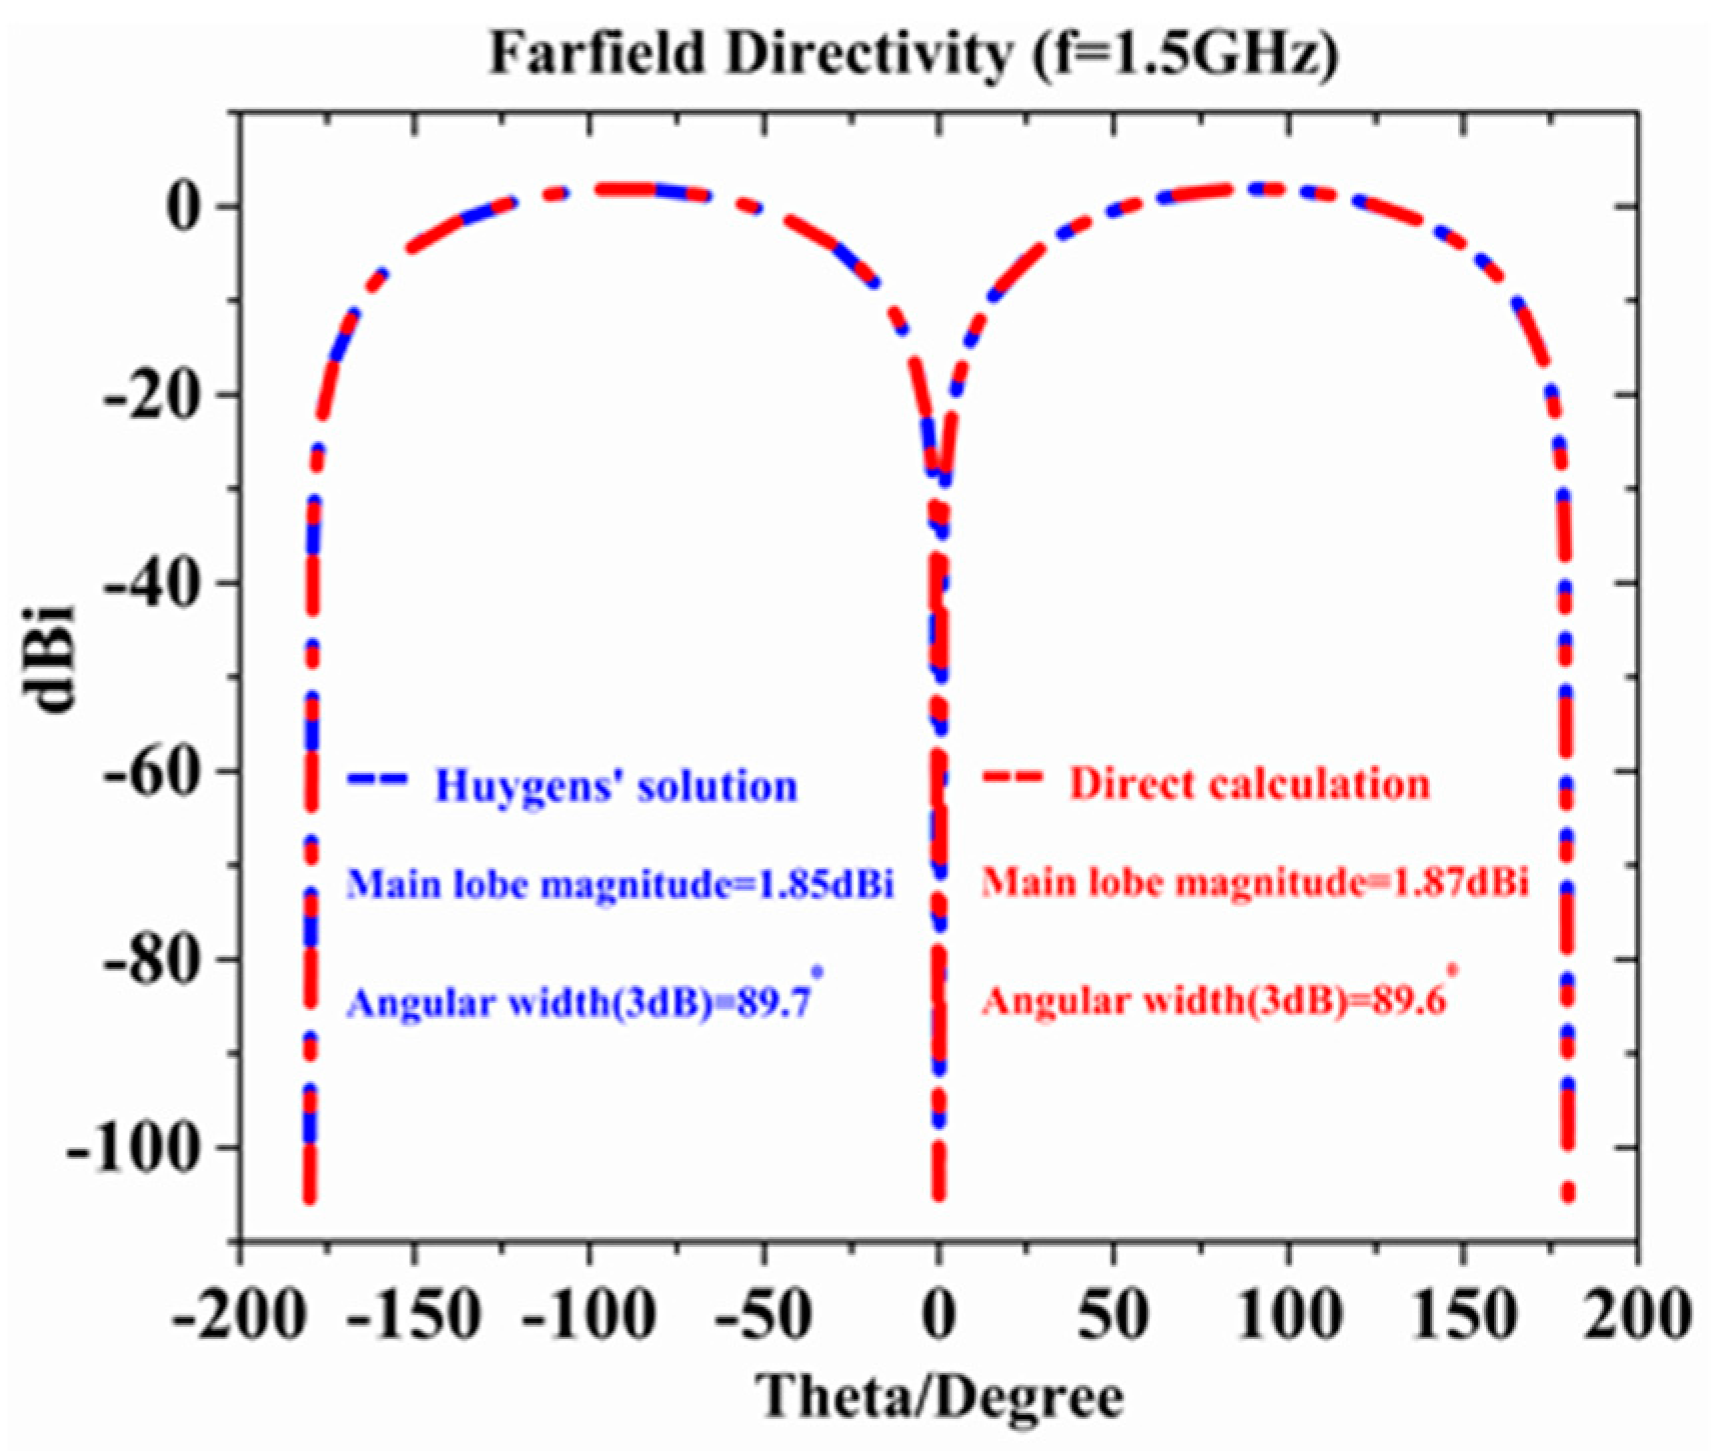
Figure 6 shows the far-field directivity results for 1500 MHz on the x-z plane and angular widths for Huygens’ solution and direct calculation are approximately the same, which also can be obtained that there is a significant difference between the uniformly hardwiring source and dipole antenna in far field directivity. Results of the direct simulation and the Huygens’ simulation using the equivalent near-field source are nearly identical, providing evidence that the proposed method was correctly implemented. These comparisons of two methods in computer consumption are listed in
Table 1. Comparing the run time spent in Huygens’ solution accounts for 48.78% of that in the direct calculation. The consumed maximum memory in Huygens’ solution is 0.62% of that spent in the direct calculation, which is mainly because the model itself is relatively small and the advantage is not particularly obvious. In summary, the method of Huygens’ calculation obviously improves the calculation efficiency.
4. Propagation Characteristics of Discharge Signal in Switchgear
Based on the above verification, the near-far field to far-field transform method is adopted for the study of the propagation characteristics of the PD signal in large-scale HV equipment. To achieve this, a typical model of switchgear with the dimensions of 1110 × 1250 × 2620 mm is established in CST Microwave Studio.
Figure 7 shows the model which consists of a cabinet, bus-bar, insulators, breaker, lightning arrester and bushings. S
1~S
4 represent the near-field sources and P
1~P
5 represent the electric field probes in
Figure 7.
Table 2 lists these materials parameters of the main component in switchgear. Since the size of the PD source is much smaller than the large-scale switchgear, adopting the method of direct calculations will cause simulation difficulties. Hence, in this section, the EM field on the Huygens’ surface (20 × 20 × 20 mm) obtained in
Section 3.2 is used as the near-field source to study the propagation of PD signal in switchgear.
4.1. Influence of Insulator on the Propagation of Discharge Signals
Insulators are mainly used as the HV insulation protection, which are largely and widely distributed in switchgear. The EM waves of discharge pulse are inevitably influenced by these insulators. To study the propagation characteristic of EM wave, the near-field source S1 (150 mm, 760 mm, 0 mm) is placed on the surface of an insulator and two probes are located in the internal space of the switchgear. One electric field probe P1 (150 mm, 900 mm, 0 mm) is placed on the same side of the equivalent source, of which position is near to the equivalent source. For another electric field probe P2 (150 mm, 520 mm, 0 mm) is placed on the opposite side of the near-field source and its position is far from the discharge source.
Figure 8 illustrates the EM waveforms detected by the electric field probe at P
1 and P
2. It can be obtained from
Figure 8a that the amplitude of EM shows significant attenuation with the spread distance. By comparing the Fast Fourier Transform (FFT) waveforms in
Figure 8b, it can be found that the low frequency components are obviously weakened by the insulator. Thus, the PD detection should avoid the shade from the insulator.
4.2. Influence of Bus-Bar on the Propagation of Discharge Signals
As an important current-carrying component, copper bus-bars are widely distributed in the switchgear. To study the influence of the bus-bar on the propagation of the discharge signal, the near-field source S
2 (110 mm, −410 mm, 0 mm) is placed on the B-phase insulator supporting the bus-bar. Two electric field probes are located at P
3 (0 mm, −480 mm, −70 mm) and P
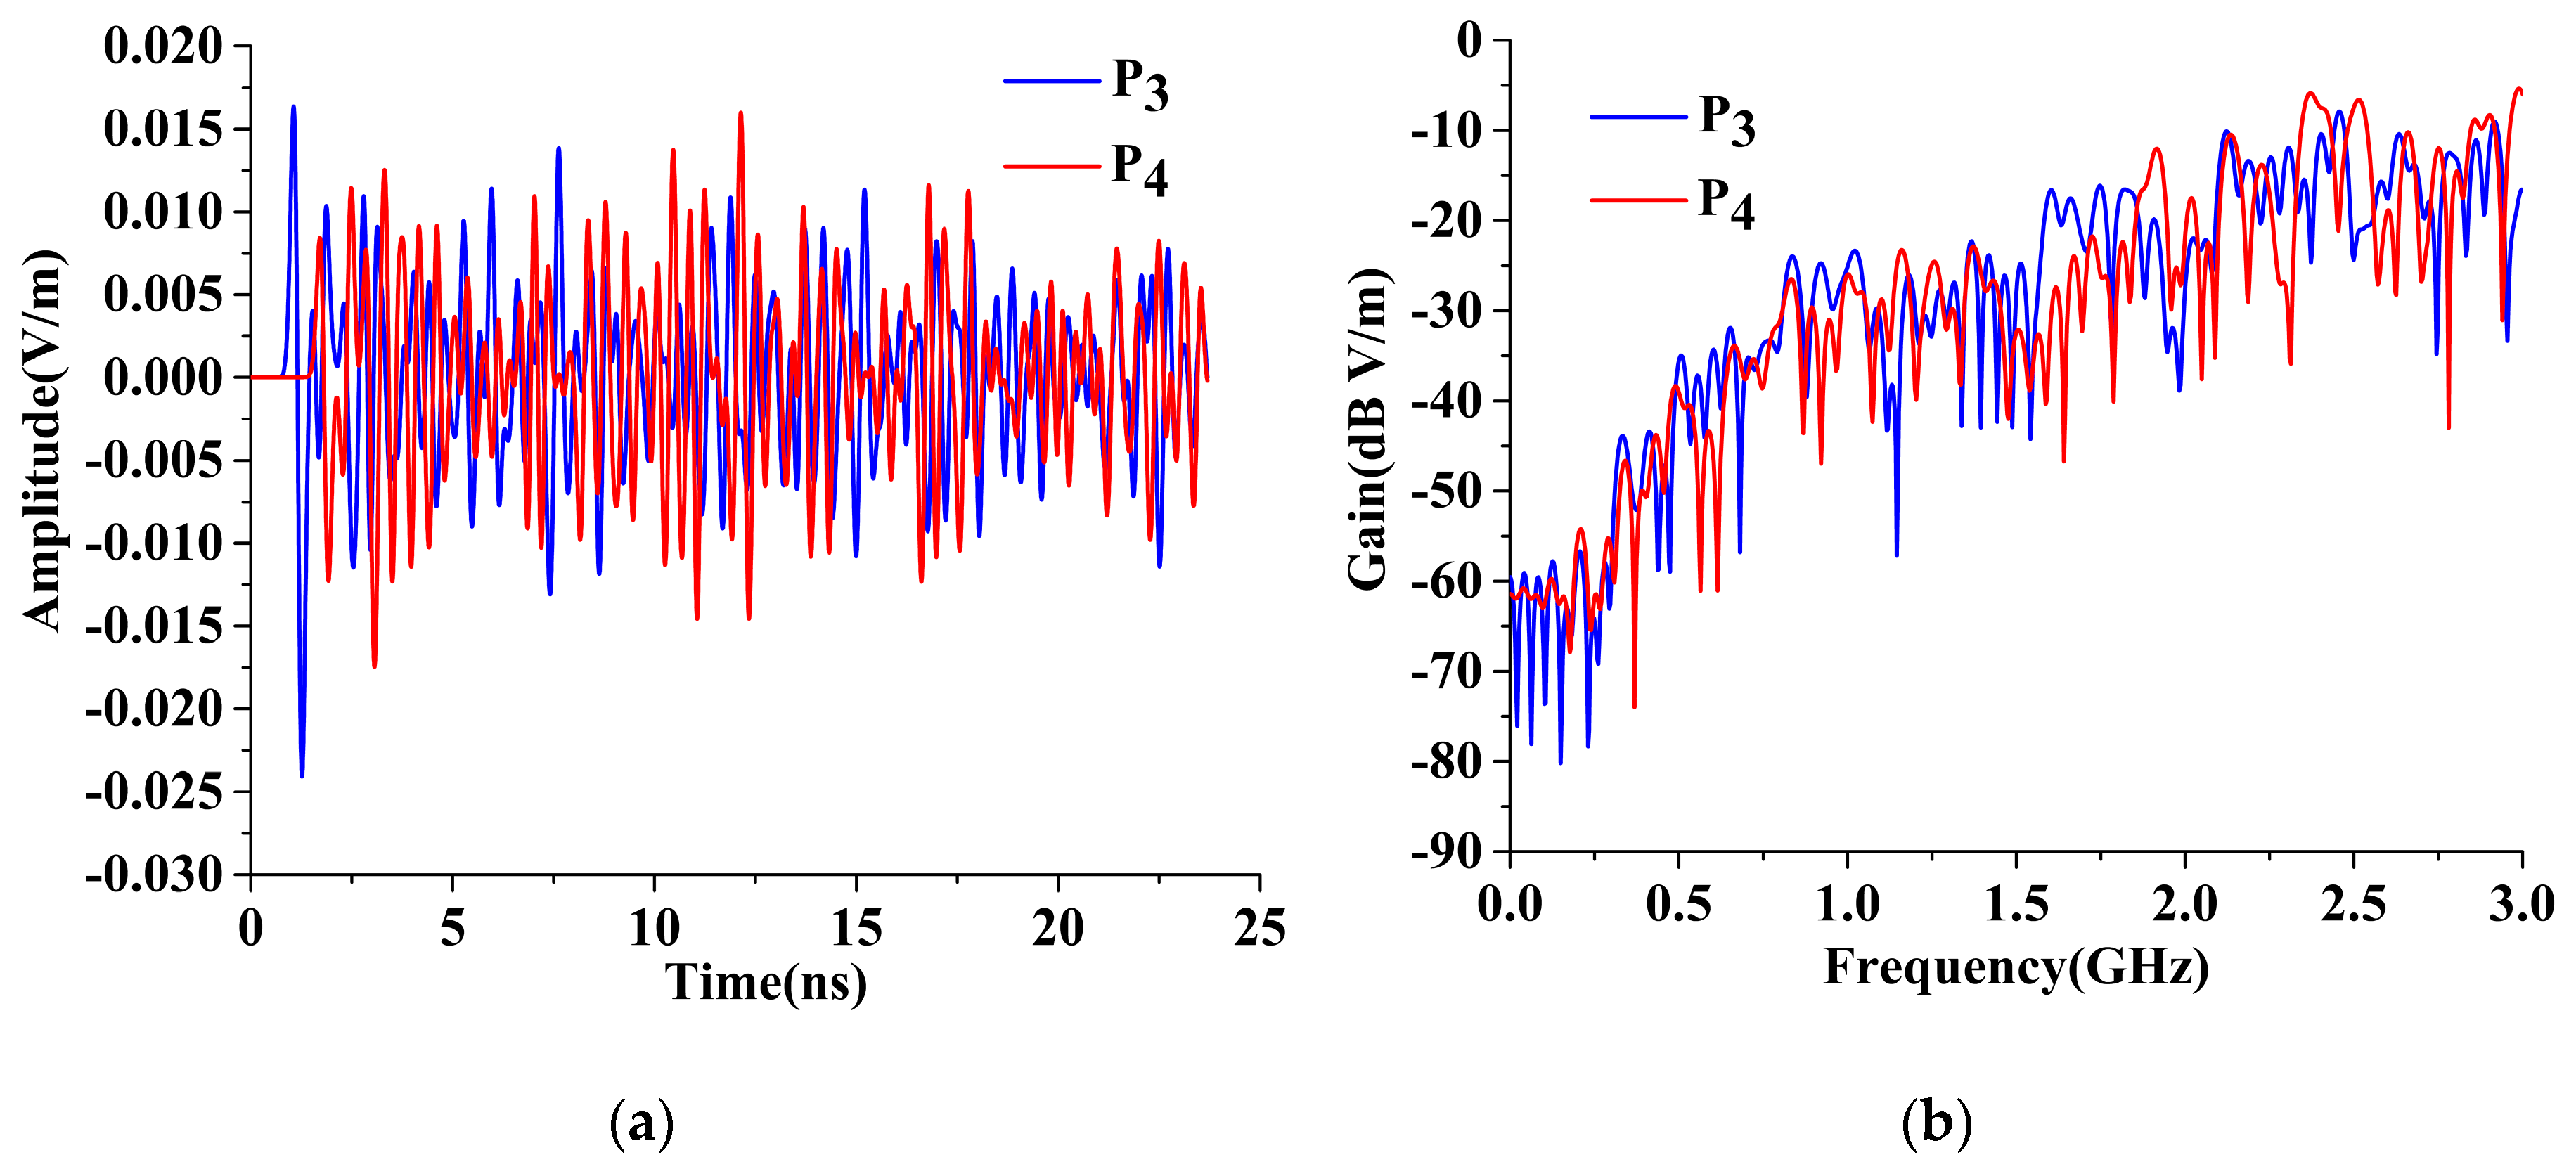
4 (−150 mm, −600 mm, −100 mm) to detect the electric field waveform. These time-domain waveforms and frequency-domain waveforms are illustrated in
Figure 9.
Comparing the time-domain waveforms, it can be obtained that the first-arrival EM at P3 has an amplitude 0.0164 V/m while the amplitude at P4 is 0.084 V/m, which is due to the electric field attenuated with the growth of distance. Meanwhile, it can be found from the FFT waveforms that bus-bar have a slight effect on the propagation of high-frequency EM waves. This is mainly due to the fact that the size of the bus-bar is much smaller than the wavelength of the EM. The EM produces a diffraction effect and the bus-bar has limited absorption on EM.
4.3. Propagation Characteristics of Discharge Signals in Different Direction
Due to the limited size and complex structure of HV switchgear, the discharge source on the insulation structure of switchgear are needed to consider its direction. Hence, two near-field sources S
1/S
3 (150 mm, 760 mm, 0 mm) of discharge signal are placed at the same place on the surface of the supporting insulator apart from their directions are z-direction and x-direction, respectively. Two electric field probes are located at P
1 (150 mm, 900 mm, 0 mm) and P
2 (150 mm, 520 mm, 0 mm) to detect the electric field waveform.
Figure 10 shows the comparison of the electric field waveforms detected by two probes.
Through the time-domain waveforms, it is shown in
Figure 10a that the electric field
Ez at the point P
1 generated by near-field source S
1 is evidently greater than the value generated by near-field source S
3. However, at the detection point P
2, the comparison of the electric fields is obviously opposite to that of in
Figure 10b. Thus, the direction of the discharge signal has a significant effect on the distribution of electric field. Therefore, when studying the characteristics of the discharge signal, the discharge source cannot be simplified to a uniformly hardwiring source.
4.4. Propagation Characteristics of Discharge Signals in Different Length
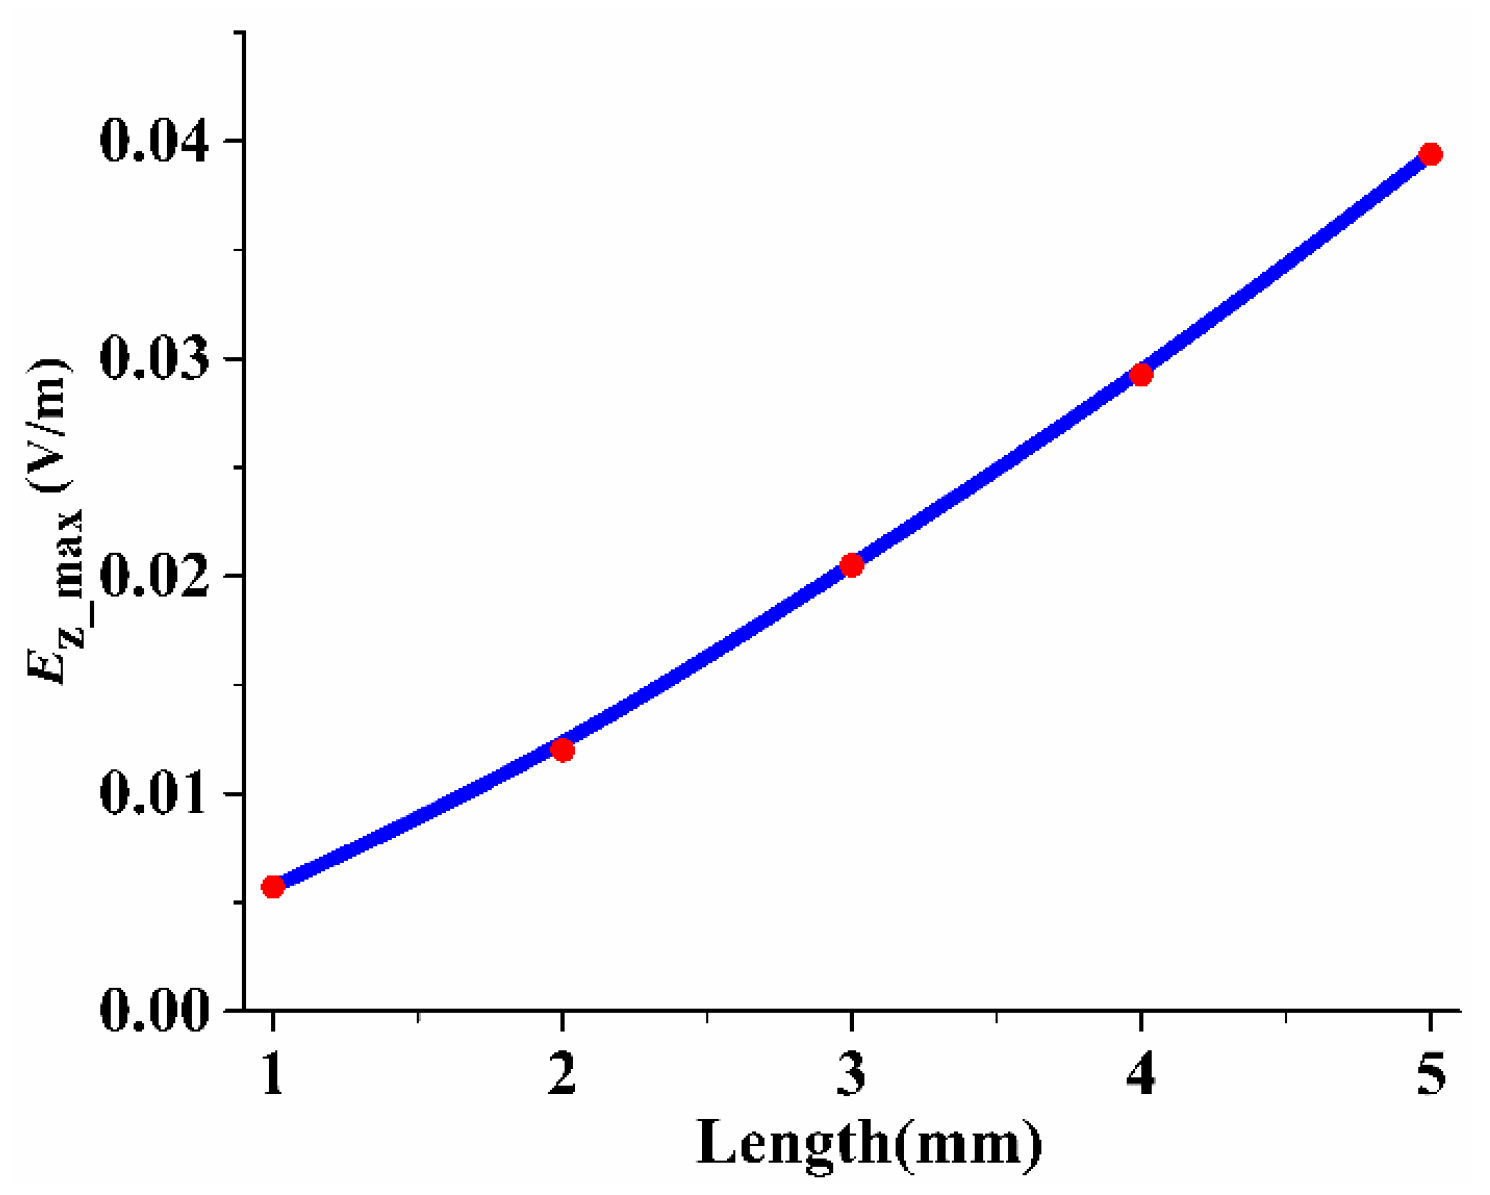
With the development of the discharge process, the length of the discharge channel gradually increases. To study the EM wave propagation characteristics for different length of discharge source, five discharge channels with 1 mm, 2 mm, 3 mm, 4 mm and 5 mm length are built to get these near field sources as is mentioned method in
Section 3, respectively. Then these equivalent sources are respectively placed at S
4 (135 mm, 65 mm, 0 mm). An electric field probe P
5 (−450 mm, 360 mm, 200 mm) is placed near to the inner surface of the switchgear to detect the EM waves. The maximum electric field component in z direction (
Ez_max) is plotted in
Figure 11. According to
Figure 11, the
Ez_max of discharge signal shows a significant growth with the increase of the discharge channel. This is mainly because the electromagnetic radiation capability of the discharge channel increases with its length, which can be used to judge the development status of the discharge channel in the long-term monitoring process.
5. Conclusions
In this paper, a PD model is established to replace the uniformly hardwiring source for the study of propagation characteristics in high voltage switchgear. To solve the difficulties in numerical calculation, as the fine meshed discharge model leads to insufficient computer memory and longer simulation time in large-scale equipment, the near-field to far-field transformation method is adopted in simulation. The proposed method is verified with direct calculation in surface electric field and far field directivity. Then, the near-field source obtained based on this method is used to study the propagation of electromagnetic waves in the large-scale HV switchgear. The simulation results indicate that insulators would affect the EM waves in low frequency components, and that bus-bars cause diffraction effects on EM waves. It is also found that the direction of the discharge has a significant effect on the distribution of the electric field and the maximum value of the EM field increases with the growth of the discharge channel. This research work provides a method for studying the EM propagation of a PD signal in large scale equipment.
Author Contributions
Both authors contributed equally in all the section of this work.
Funding
This work was supported by grants from the National Key Research Project of China (grant numbers 2017YFB0902703) and National “111” Project of China (Grant No: B080360).
Acknowledgments
We are thankful to all our lab fellows for providing support during research and for valuable suggestions.
Conflicts of Interest
The authors declare no conflict of interest.
References
- Yang, F.; Peng, C.; Yang, Q.; Luo, H.; Ullah, I.; Yang, Y. An UWB printed antenna for partial discharge UHF detection in high voltage switchgears. Prog. Electromagn. Res. C 2016, 69, 105–114. [Google Scholar] [CrossRef]
- Fjeld, E.; Rondeel, W.; Vaagsaether, K.; Attar, E. Influence of heat source location on air temperatures in sealed MV switchgear. CIRED-Open Access Proc. J. 2017, 2017, 233–237. [Google Scholar] [CrossRef]
- Tang, J.; Jin, M.; Zeng, F.; Zhou, S.; Zhang, X.; Yang, Y.; Ma, Y.; Sciubba, E. Feature Selection for Partial Discharge Severity Assessment in Gas-Insulated Switchgear Based on Minimum Redundancy and Maximum Relevance. Energies 2017, 10, 1516. [Google Scholar] [CrossRef]
- Wang, X.; Li, X.; Rong, M.; Xie, D.; Ding, D.; Wang, Z. UHF Signal Processing and Pattern Recognition of Partial Discharge in Gas-Insulated Switchgear Using Chromatic Methodology. Sensors 2017, 17, 177. [Google Scholar] [CrossRef] [PubMed]
- Hekmati, A. A novel acoustic method of partial discharge allocation considering structure-borne waves. Int. J. Electr. Power Energy Syst. 2016, 77, 250–255. [Google Scholar] [CrossRef]
- Dai, D.; Wang, X.; Long, J.; Tian, M.; Zhu, G.; Zhang, J. Feature extraction of GIS partial discharge signal based on S-transform and singular value decomposition. IET Sci. Meas. Technol. 2017, 11, 186–193. [Google Scholar] [CrossRef]
- Li, P.; Zhou, W.; Yang, S.; Liu, Y.; Tian, Y.; Wang, Y. Method for partial discharge localisation in air-insulated substations. IET Sci. Meas. Technol. 2017, 11, 331–338. [Google Scholar] [CrossRef]
- Li, J.; Han, X.; Liu, Z.; Yao, X. A Novel GIS Partial Discharge Detection Sensor with Integrated Optical and UHF Methods. IEEE Trans. Power Deliv. 2018, 343, 2047–2049. [Google Scholar] [CrossRef]
- Li, J.; Zhang, X.; Han, X.; Yao, X. A Partial Discharge Detection Method for SF6 Insulated Inverted Current Transformers Adopting Inner Shield Case as UHF Sensor. IEEE Trans. Power Deliv. 2018. [Google Scholar] [CrossRef]
- Hussain, G.A.; Shafiq, M.; Kumpulainen, L.; Mahmood, F.; Lehtonen, M. Performance evaluation of noise reduction method during on-line monitoring of MV switchgear for PD measurements by non-intrusive sensors. Int. J. Electr. Power Energy Syst. 2015, 64, 596–607. [Google Scholar] [CrossRef]
- Álvarez Gómez, F.; Albarracín-Sánchez, R.; Garnacho, V.F.; Granizo, A.R. Diagnosis of Insulation Condition of MV Switchgears by Application of Different Partial Discharge Measuring Methods and Sensors. Sensors 2018, 18, 720. [Google Scholar] [CrossRef] [PubMed]
- Reid, A.; Judd, M.; Duncan, G. Simultaneous measurement of partial discharge Using TEV, IEC60270 and UHF techniques. In Proceedings of the IEEE International Symposium on Electrical Insulation, San Juan, PR, USA, 10–13 June 2012; pp. 439–442. [Google Scholar]
- Judd, M. Developments in UHF PD monitoring technology for power transformers. In Proceedings of the 2014 Euro TechCon (TJ|H2b), Stratford-upon-Avon, UK, 2–4 December 2014. [Google Scholar]
- Albarracín, R.; Ardila-Rey, J.A.; Mas’ud, A.A. On the Use of Monopole Antennas for Determining the Effect of the Enclosure of a Power Transformer Tank in Partial Discharges Electromagnetic Propagation. Sensors 2016, 16, 148. [Google Scholar] [CrossRef] [PubMed]
- Ishak, A.; Ishak, M.; Jusoh, M.; Dardin, S.M.S.M.; Judd, M. Design and Optimization of UHF Partial Discharge Sensors using FDTD Modeling. IEEE Sens. J. 2017, 17, 127–133. [Google Scholar] [CrossRef]
- IEC-TS, P. 62478: 2016 High Voltage Test Techniques—Measurement of Partial Discharges by Electromagnetic and Acoustic Methods; BSI: London, UK, 2016. [Google Scholar]
- Yao, G.; Huang, J.; Wu, B. Propagation Characteristics of UHF Signals in Switchgears by FDTD Method. High Volt. Eng. 2013, 39, 272–279. [Google Scholar]
- Hoshino, T.; Maruyama, S.; Sakakibara, T. Simulation of Propagating Electromagnetic Wave Due to Partial Discharge in GIS Using FDTD. IEEE Trans. Power Deliv. 2008, 24, 153–159. [Google Scholar] [CrossRef]
- Ishak, A.M.; Baker, P.C.; Siew, W.H.; Judd, M.D. Characterizing the Sensitivity of UHF Partial Discharge Sensors Using FDTD Modeling. IEEE Sens. J. 2013, 13, 3025–3031. [Google Scholar] [CrossRef]
- Liao, R.J.; Wu, F.F.; Liu, X.H.; Yang, F.; Yang, L.J.; Zhou, Z.; Zhai, L. Numerical simulation of transient space charge distribution of DC positive corona discharge under atmospheric pressure air. Acta Phys. Sin. 2012, 61, 245201–245379. [Google Scholar]
- Liu, X.; Xian, R.; Sun, X.; Wang, T.; Lv, X.; Chen, S.; Yang, F. Space Charge Transient Kinetic Characteristics in DC Air Corona Discharge at Atmospheric Pressure. Plasma Sci. Technol. 2014, 16, 749–757. [Google Scholar] [CrossRef]
- Sima, W.; Liu, C.; Yang, M.; Shao, Q.; Xu, H.; Liu, S. Plasma model of discharge along a dielectric surface in N2/O2 mixtures. Phys. Plasmas 2016, 23, 604. [Google Scholar] [CrossRef]
- Fan, Y.; Qi, Y.; Bing, G.; Rong, X.; Yanjie, L.; Iroegbu, P.I. Research on the discharge characteristics for water tree in crosslinked polyethylene cable based on plasma-chemical model. Phys. Plasmas 2018, 25, 033512. [Google Scholar] [CrossRef] [Green Version]
- Zang, Y.; Zeng, R.; Li, X. Numerical Simulation on Streamer Discharge of Short Air Gap of Atmospheric Air. Proc. CSEE 2008, 28, 6–12. [Google Scholar]
- Peng, Q.; Sima, W.; Yang, Q. Influence of Initial Electron Concentration on Positive Streamer Discharge in Pin-plate Air Gap. High Volt. Eng. 2013, 39, 37–43. [Google Scholar]
- Gao, X.; Fan, J.; Zhang, Y.; Kajbaf, H.; Pommerenke, D. Far-Field Prediction Using Only Magnetic Near-Field Scanning for EMI Test. IEEE Trans. Electromagn. Compat. 2014, 56, 1335–1343. [Google Scholar] [CrossRef]
- Bod, M.; Sarraf-Shirazi, R.; Moradi, G.R.; Jafargholi, A. A Regularized Source Current Reconstruction Method for Reactive Near Field to Far Field Transformation. Appl. Comput. Electromagn. Soc. J. 2017, 32, 113–119. [Google Scholar]
- Faryad, M.; Lakhtakia, A. On the Huygens principle for bianisotropic mediums with symmetric permittivity and permeability dyadics. Phys. Lett. A 2017, 381, 742–746. [Google Scholar] [CrossRef]
- Rengarajan, S.R.; Rahmat-Samii, Y. The field equivalence principle: Illustration of the establishment of the non-intuitive null fields. IEEE Antennas Propag. Mag. 2000, 42, 122–128. [Google Scholar] [CrossRef]
- Yang, G. Advanced Electromagnetic Theory; Higher Education Press: Beijing, China, 2008; p. 24. [Google Scholar]
- Sima, W.; Peng, Q.; Yang, Q.; Yuan, T.; Shi, J. Study of the characteristics of a streamer discharge in air based on a plasma chemical model. IEEE Trans. Dielectr. Electr. Insul. 2012, 19, 660–670. [Google Scholar] [CrossRef]
- Stutzman, W.L.; Thiele, G.A. Antenna Theory and Design; John Wiley & Sons: Hoboken, NJ, USA, 1981; p. 267. [Google Scholar]
- Li, T.; Wang, X.; Zheng, C.; Liu, D.; Rong, M. Investigation on the placement effect of UHF sensor and propagation characteristics of PD-induced electromagnetic wave in GIS based on FDTD method. IEEE Trans. Dielectr. Electr. Insul. 2014, 21, 1015–1025. [Google Scholar] [CrossRef]
- Yao, C.; Pan, C.; Huang, C.; Yu, C.; Qiao, P. Study on the Application of an Ultra-High-Frequency Fractal Antenna to Partial Discharge Detection in Switchgears. Sensors 2013, 13, 17362–17378. [Google Scholar] [CrossRef] [PubMed] [Green Version]
© 2018 by the authors. Licensee MDPI, Basel, Switzerland. This article is an open access article distributed under the terms and conditions of the Creative Commons Attribution (CC BY) license (http://creativecommons.org/licenses/by/4.0/).


