1. Introduction
Residential buildings are responsible for 18.6% of final energy consumption in Spain, with the largest share (62.7%) of that energy being used to meet the heating, cooling and domestic hot water (DHW) needs [
1]. The 2010 Energy Performance of Buildings Directive (EPBD) [
2] and the 2012 Energy Efficiency Directive [
3] are the European Union’s (EU) main legislation covering the reduction of the energy consumption of buildings. Article 9 of the EPBD establishes the objective that all new buildings must have very low or nearly zero energy needs by the end of 2020. It also sets that the nearly zero or very low amount of energy required by buildings should be covered to a very significant extent by energy from renewable sources.
Aerothermal heat pump systems extract energy from the outdoor air and use it to heat water for DWH and heating purposes. They can also be reversible and provide cold water for air-conditioning. Energy extracted from the outdoor air by means of highly efficient devices is considered as renewable energy according to the EU’s Renewable Energy Directive 2009/28/EC [
4]. The integration of renewable energy sources in national nearly zero-energy buildings (NZEB) implementation is an important issue.
The EU’s recommendation on guidelines for the promotion of NZEB [
5]provides benchmark ranges of primary energy use (kWh/m
2 per year) for the different EU climatic zones [
6]. Characterization of climate zones can be used to guide the design of NZEB by suggesting the suitability of certain technologies to certain climatic zones [
7].
In Spain, 93% of the installed aerothermal heat pumps that meet the requirements established by Directive 2009/28/EC are located in climatic zones characterized by mild outdoor dry-bulb temperatures. They are almost exclusively of the air-to-air type, with a very low number of units driven by other renewable energy sources (geothermal or hydrothermal). By sectors, most heat pumps are installed in households (86%), which is also the predominant sector in terms of installed capacity (57%) [
8].
Current technology allows the use of aerothermal heat pumps in more severe climatic conditions. Houlihan et al. [
9] studied the case of a detached single-family house located in Oslo. The implemented residential NZEB concept was the so-called all-electric solution where essentially a well-insulated envelope was heated using an air-to-water heat pump and where photovoltaic panels (PV) production was used to achieve the CO
2balance.Authors concluded that the house could be labeled as a zero-energy building.
However, geothermal heat pumps are more suitable for the climatic conditions of Northern Europe than aerothermal heat pumps. Paiho et al. [
10] analyzed life-cycle costs (LCCs) of different heat pump-based NZEB concepts for a Finnish new detached house and a new apartment building. They found that for both building types, the LCCs were the smallest with the ground source heat pumps (GSHPs) followed by the air-to-water heat pumps.
Since 2013 it is a legal requirement that all properties for sale or rent in Spain have an Energy Performance Certificate [
11]. This Certificate provides information about energy efficiency of buildings and is one of the policies implemented in most Member States that should drive the market towards NZEB.
The annual energy performance of a building should be calculated on the basis of several factors (e.g., thermal characteristics, ventilation, internal loads, HVAC installations, and application of renewable energies), and this calculation must be facilitated to architecture and engineering firms [
12]. Effective collaboration between design disciplines is one of the reasons for the adoption of Building Information Modelling (BIM) [
13].
BIM can be used as a platform from which to gather information that can be conveyed to energy efficiency simulation tools by using an appropriate interface. The result of this practice is expected to be the design of more efficient buildings through evaluation of different design options [
14]. The interface that provides the exchange of information between BIM and the energy efficiency simulation tool is of the utmost importance to facilitate the task of the professionals involved in the building design [
15].
In Europe, efficient aerothermal heat pumps are being strongly promoted in domestic applications for substituting gas boilers. In fact, the main HVAC manufacturers are already offering a variety of these systems targeted to the residential sector. In order to analyze its convenience, verify the national Building Energy Codes and obtain the mandatory Energy Performance Certificate, a model of the aerothermal heat pump system that can be integrated in a dynamic simulation software is needed.
It is a common practice in building thermal simulation programs to work with hourly averages for all input and output variables. This is justified because the building characteristic response time is significantly larger than one hour, and the HVAC equipment response is generally much faster than one hour. Therefore, it is generally acceptable to combine a dynamic model of the building with static or quasi-static models of HVAC equipment [
16,
17].
HVAC equipment models to be implemented in simulation programs usually requires the regression of data given by the manufacturer in either tabulated of graphical form [
18]. These are the most widespread equipment models in simulation programs like TRNSYS [
19] or ESP-r [
20]. In contrast, dynamic models are used in order to answer specific questions such as responses to quick perturbations or performances in cyclic regimes [
21].
U.S. Department of Energy’s EnergyPlus [
22] is a well-known software that is valid in many countries for energy performance certification purposes and it has been widely used for the study of renewable energy systems applied in NZEB [
23,
24]. However, EnergyPlus version 8.9 does not include any specific model of the reversible air-to-water heat pump (as detailed in
Section 2.2).
This work had two objectives: to develop a model for simulating a reversible air-to-water heat pump with EnergyPlus and to study the operation of this system in a residential building under different climatic conditions compared to a conventional HVAC system. A novel aspect of this work has been the integration of the HVAC system design and the energy simulation in an Open BIM workflow. Thus, the proposed model can be a useful tool for energy performance assessment and certification of buildings.
2. Materials and Methods
2.1. Domestic Aerothermal Heat Pump System
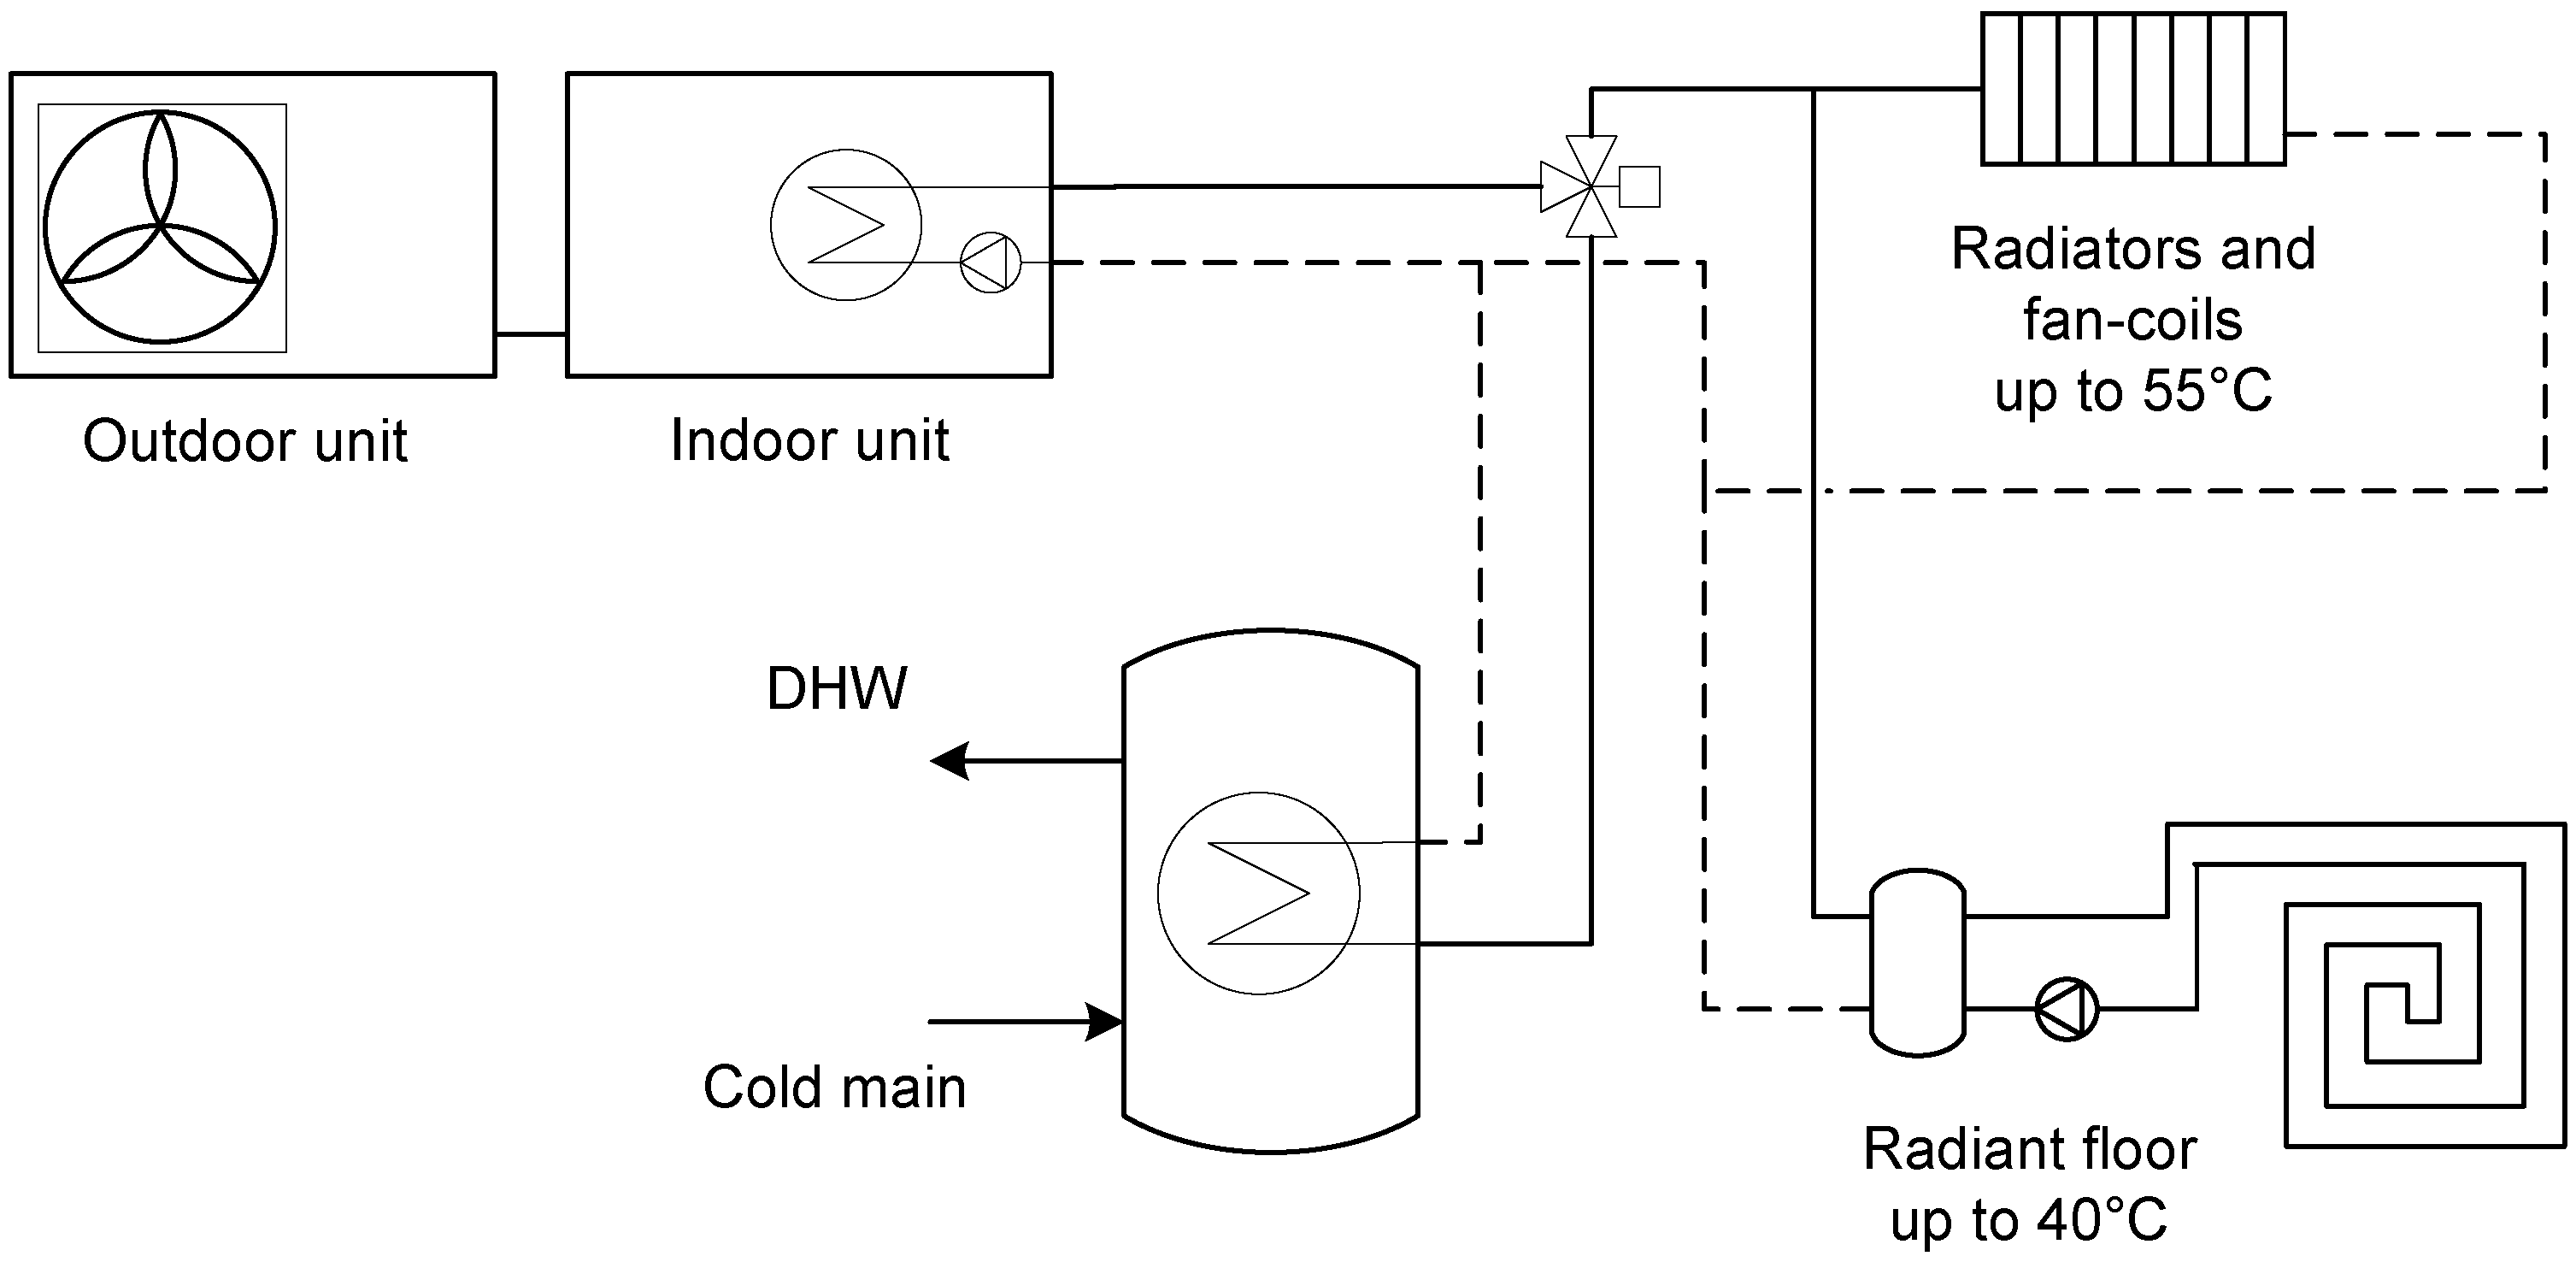
Figure 1 shows a scheme of a domestic heating and cooling system based on an aerothermal heat pump. The most common solution consists of a low temperature split system. The outdoor unit contains a variable speed compressor and a refrigerant-to-air heat exchanger that transfers heat to the outdoor air. The indoor unit comprises a refrigerant-to-water heat exchanger, a supplemental electric heater, a circulation pump and a DHW tank.
In winter the heat exchanger in the indoor unit works as the condenser, heating the water in a closed loop that is delivered to low temperature radiators, radiant floor or fan-coils installed in the housing. Depending on the terminal unit type, the hot water temperature usually ranges from 35 °C up to 55–60 °C. In any case, the supplemental heater will only turn on when the heat pump is not able to reach the hot water setpoint temperature.
In summer the heat pump is reversed and the indoor unit works as the evaporator, producing chilled water at 7 to 18 °C that is delivered to fan-coils or radiant panels. In both seasons, when DHW is required a three-way valve automatically deviates the all water flow through the tank in the indoor unit. The heat pump works at its maximum capacity to heat the water stored in the tank.
2.2. Existing Heat Pump Models in EnergyPlus
Since EnergyPlus 8.9 does not include a model of the described system, its different working modes are simulated separately. Given that the change between cooling and heating modes occurs usually twice a year, the inertia of the water in the system can be neglected. For simplicity, DHW production is decoupled from the HVAC simulation.
The cooling performance of the aerothermal heat pump can be reproduced with the current electric chiller model Chiller:Electric:EIR. This model is based on manufacturer performance data of capacity and power consumption of the device at different outdoor air and chilled water supply temperatures, as well as at different part-load ratios (PLR). These inputs are usually specified in aerothermal heat pump technical data books.
On the contrary, its heating performance cannot be properly simulated with the heat pump models available in EnergyPlus 8.9. The closest object would be WaterHeater:HeatPump: PumpedCondenser, which simulates an air-to-water heat pump that heats the water stored in a tank. However, in radiators and fan-coil systems, the heat pump’s condenser heats directly the water in a closed loop without intermediate storage. The tank has a significant effect in the return temperature and hence in the performance of the system, so this model is not suitable.
Water-to-water heat pump models based in performance data could also be employed for this purpose by forcing the outdoor air temperature in the source side, since the results about the source-side fluid are not relevant for this system. However, the model HeatPump:WaterToWater:EquationFit:Heating does not consider the variation of the heat pump performance with the PLR, while the performance data for the model ChillerHeaterPerformance: Electric:EIR is not available from the aerothermal heat pump technical data books.
Therefore, a new model is required to simulate the heating performance of the aerothermal heat pump system. The object UserDefined:PlantComponent has been employed for this purpose. This component can be directly connected to the hot water loop, thus avoiding the definition of an intermediate hot water tank. The equations that define the behavior of the component must be introduced by the user using the EnergyPlus programming language (Energy Management System (EMS) language).
2.3. Air-to-Water Heat Pump Model
The air-to-water heat pump model simulates the heating performance of this device based on manufacturer performance data. The modeling approach and equations proposed for this model are analogue to the existing chiller model. In fact, the data usually available from the manufacturer is analogue for cooling and heating modes.
The inputs to the model are the loop water mass flow rate (), the inlet water temperature to the heat pump (), the outdoor air temperature () and the leaving hot water temperature setpoint (). The main outputs of the model are the actual leaving hot water temperature () and the power input of the device (). The water mass flow rate is kept constant.
The heat pump model receives as parameters the rated heating capacity () and COP () of the device, the rated power of the supplemental heater () and three performance tables or curves that contain the manufacturer data at off-rated conditions. The curves are handled through EnergyPlus’ curve equation manager.
During the time step, if there is a heating demand and the outdoor temperatures are within the limits specified by the manufacturer, the aerothermal heat pump turns on. For each leaving hot water temperature and outdoor dry-bulb temperature, the available heating capacity is normalized to the reference heating capacity, creating a capacity correction fraction as a function of temperatures (CAPFT) (Equation (1)):
These capacity correction fractions, along with the operating conditions, define the heating performance. The available air-to water heat pump heating capacity (
) is calculated using CAPFT by the following equation:
The part load ratio (
) is then determined as the ratio of the heating demand (
) to the available heating capacity (Equation (3)). The heat pump compressor continually operates as long as the
PLR is above the minimum limit (
PLRmin).
If
, the outlet water temperature from the device is set to the outlet setpoint temperature (Equation (4)) and the supplemental heater remains off (
= 0):
If
, then
PLR is set to 1 and the supplemental heater turns on. The actual outlet temperature from the heat pump (
) is calculated with Equation (5). Then, the electric power consumed by the heater (
) is given by Equation (6) and the outlet temperature of the device (
, after the electric heater) is calculated with Equation (7):
Several factors have to be considered to determine the heat pump electric power consumption. If the operating
PLR is less than the specified minimum PLR, the heat pump compressor will cycle on and off. The cycling ratio of the compressor (
) is calculated with Equation (8):
The heat pump energy input (energy consumption) is modeled using a normalized energy input ratio as a function of temperature (
EIRFT) correction fraction (Equation (9)):
A part-load term accounts for changes in the compressor speed above the minimum compressor part-load ratio.
EIRFPLR is the normalized power input at different part load ratios and leaving hot water temperatures (Equation (10)):
The heat pump energy input (Equation (11)) is based on four multipliers. The available heating capacity divided by the rated coefficient of performance (COP), is multiplied by the normalized
EIRFT correction fraction. These first two terms combined yield the full-load power at the specific operating conditions. The impact of part-load performance and operating
CR are then included as the third and fourth terms, respectively:
Finally, the total power consumption of the device is given by Equation (12):
The energy consumption of the device is calculated as an output of the model (Equation (13)):
The variation of the outdoor air properties through the heat exchanger outside is not relevant, so this calculation is not performed. The following flowchart (
Figure 2) is included to facilitate the understanding of the proposed model.
2.4. Model Verification
The described model was implemented in EnergyPlus 8.9 via EMS language. The performance data was implemented by means of the corresponding tables with linear interpolation. Simulations with constant inputs were performed in EnergyPlus 8.9 to ensure that the proposed equations reproduce the manufacturer catalogue data of heating capacity (
Figure 3) and heating COP (
Figure 4).
2.5. Case Study
The proposed model was employed to analyze the performance of an aerothermal heat pump system in a residential building under the climatic conditions of four cities in Spain: Seville (B4), Barcelona (C2), Madrid (D3), and Burgos (E1). The Spanish Building Technical Code (SBTC) [
25] assign a different climatic zone to each city depending on the severity of the climatic conditions in winter (letters from A to E) and in summer (numbers from 1 to 4). (A, 1) represent the most benign meteorological conditions and (E, 4) the most rigorous ones.
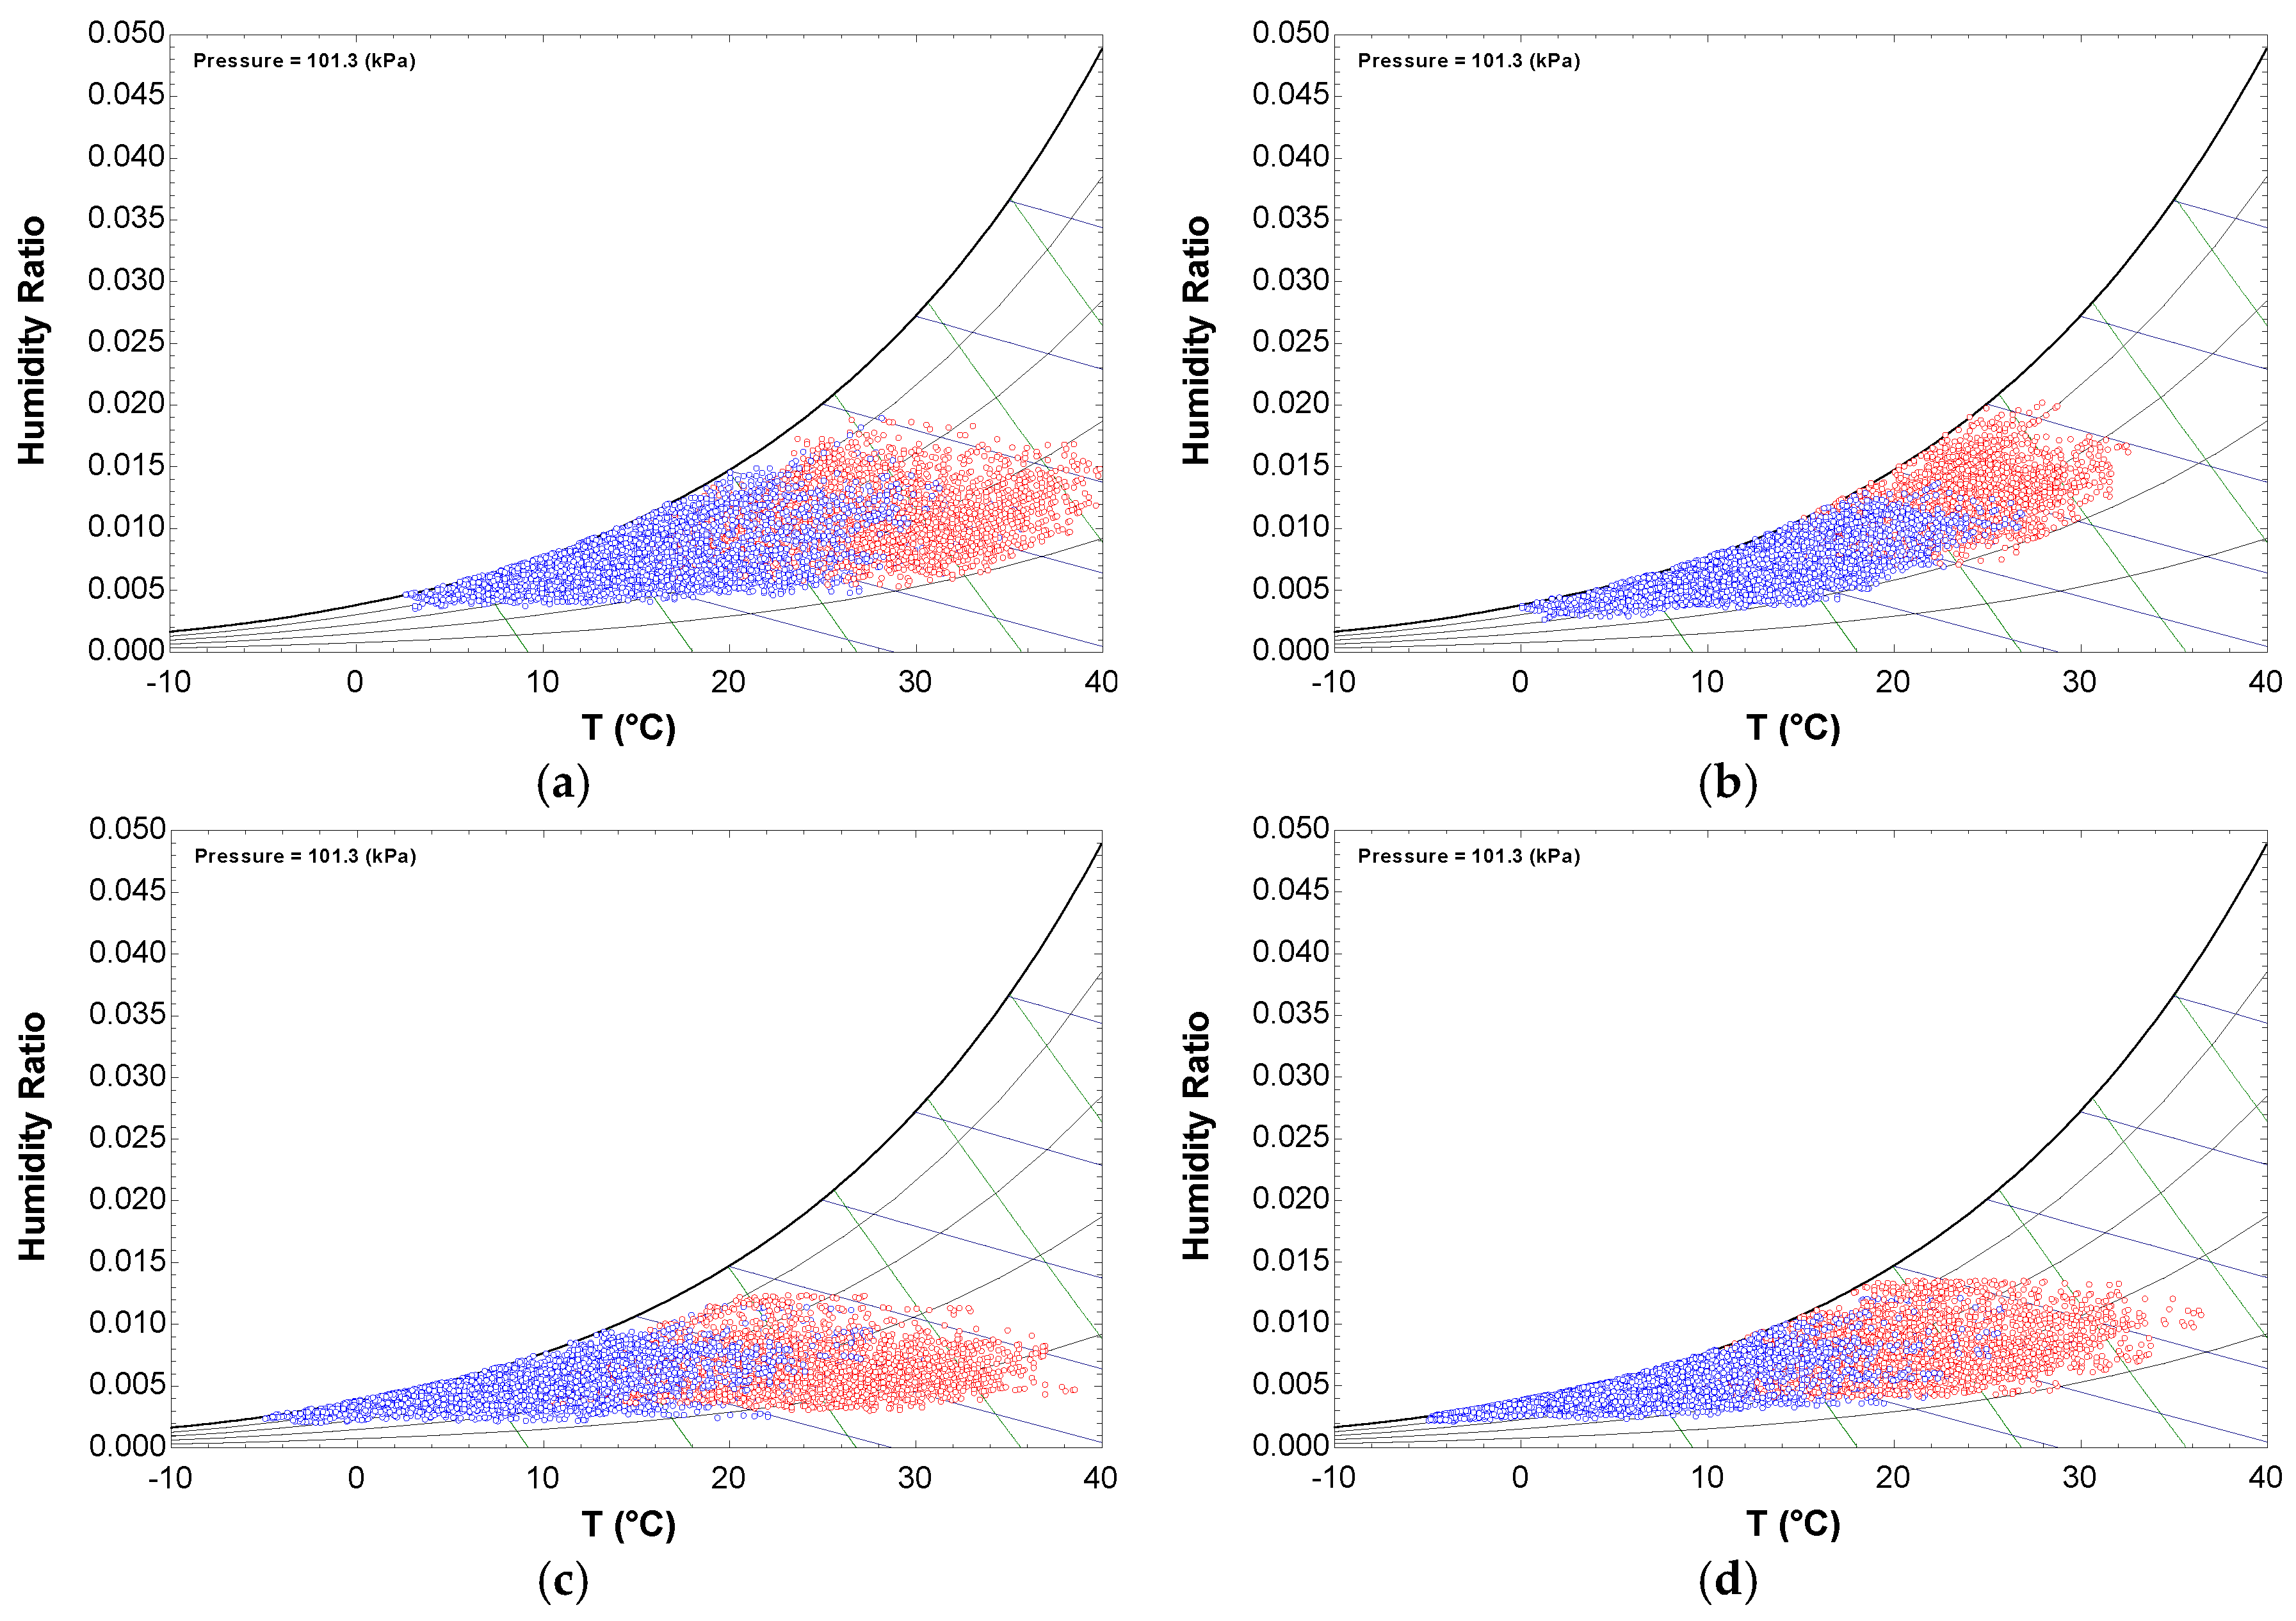
To characterize the climatic conditions in the heating (October–May) and cooling (June–September) seasons, the hourly climatic conditions were represented on the psychrometric chart (
Figure 5), and the mean and standard deviation of the temperature were calculated (
Table 1).
The aerothermal heat pump system is compared to a conventional installation of central heating with a gas boiler plus individual mini-splits for cooling in terms of energy consumption and performance certification.
The simulations have been prepared taking into account the SBTC. This Code includes realistic use profiles and values, as well as an Energy Performance Certification grade according to the European regulations. A sample residential building of 6 stories has been simulated (
Figure 6). The building has a total surface of 922 m
2, distributed among the common zones, 6 apartments of 89 m
2 and 2 duplexes of 162 m
2 in the top floor. The main façade of the building faces the south.
Figure 7 shows the Open BIM workflow. Its main property is that it is based on the use of Industry Foundation Classes (IFC) standard exchange files. This format can be read by the software tools used for designing the building. All the information of the project is stored in a directory linked to the BIMserver center platform, which is a service to manage, update and share all the project files in the cloud [
26].
The geometry of the building was designed with the free distribution application IFC Builder. It is an application for building 3D modelling integrated in the Open BIM workflow through the export of IFC files.
The calculation of the thermal loads, design of the HVAC installation, and energy simulation of the building was made using applications that are integrated in the Open BIM flow: CYPETHERM LOADS, CYPETHERM HVAC and CYPETHERM EPLUS respectively. By working with these applications the project is defined progressively. In other words, different layers of information (thermal loads, HVAC system, and energy analysis) are added to the initial physical model using the above mentioned specialized applications.
The information generated by the applications can be linked to existing elements that have been introduced previously in the project, such as thermal loads in rooms or spaces of the building, or can be a new project entity, such as HVAC equipment. This way, all that information is incorporated in the BIM model, which enriches and gradually completes it.
The external envelope of the building consists of conventional constructive solutions that meet the regulations in the SBTC in terms of thermal demand limitation.
Table 2 shows the heat transfer coefficients for the external walls and roof of the building as a function of the climatic zone. The value of the heat transfer coefficient for the windows has been set constant for all climatic zones and equal to 2 W/m
2K, as well as the solar gain factor (0.75).
Table 2 also shows the calculated heating and cooling demands, as well as the limit values imposed by the SBTC.
The hourly thermal gains due to occupation, lighting, internal equipment and ventilation correspond to the ones specified in the SBTC for residential uses. The software CYPETHERM LOADS, a BIM tool based in the ASHRAE radiant time series method was employed to calculate the peak load of each room and the simultaneous thermal load of the building. One thermal zone per housing was considered. The capacity of the systems studied was selected according to the thermal loads.
HVAC Systems
Two different proposals for the HVAC installation of the building are simulated and compared. System A is a central heating installation, in which a single gas condensation boiler provides hot water at 45 °C to low-temperature radiators. The cooling needs are covered with mini-splits installed in each apartment. The capacity of this system is shown in
Table 3 and corresponds to the default and autosized values proposed by EnergyPlus 8.9. The boiler has a rated efficiency of 0.92 and the splits a rated cooling COP of 3.
System B consists of an air-to-water heat pump (AWHP) per dwelling that delivers hot water at 45 °C and chilled water at 7 °C to a fan-coil installation. The equipment was selected from a manufacturer catalogue using the BIM software CYPETHERM HVAC, which received the building 3D model and the calculated thermal loads (information generated by CYPETHERM LOADS). The nominal capacity (CAP) and COP of the heat pumps are summarized in
Table 4.
The yearly energy performance of the building was simulated with CYPETHERM EPlus, which is a BIM user interface for EnergyPlus version 8.9 that includes the definition of several commercial HVAC systems. An advantage of the Open BIM workflow consists in the fact that the building 3D model and HVAC systems already defined can be directly imported into the program and hence in EnergyPlus.
3. Results
The simulation of the 922 m
2 residential building with the aerothermal heat pump systems (System B) took 4.03 min of EnergyPlus8.9 runtime in a 3.9 GHz PC. The yearly performance of the aerothermal heat pump system (System B) is compared to the conventional system (System A).
Figure 8 shows the monthly heating and cooling demand of the building and the final energy consumed by both HVAC systems to overcome the thermal loads. The energy consumption by the electrical auxiliaries (pumps and fans) is not included.
As can be seen in
Figure 8, Seville (B4) has demand for cooling but not heating, and on the contrary, Burgos (E1) has a high demand for heating but little demand for cooling. Madrid (D3) with a continental temperate climate has significant heating and cooling demands. Summers in Madrid are hot with maximum temperatures of over 35 °C, and winters are cool, with temperatures as low as −5 °C. Barcelona (C2) has a mild coastal climate with moderate heating and cooling loads.
The heating season covers from October to May. As can be seen in
Figure 5 the lowest temperatures in Madrid and Burgos are around −5 °C and in that case and according to
Figure 4, for an outlet hot water temperature of 45 °C (which is the one used in this work) the heating COP is 2 and gets higher as the outdoor temperature increases.
In Madrid, the average heating COP fluctuates between 3.14 in January and 4.20 in May, while in Burgos it ranges between 2.95 and 3.76 for the same months. In Barcelona and Seville, where the outdoor temperatures are higher in winter the values for the heating COP are even higher than those of Madrid and Burgos.
As expected, the heat pump consumes significantly less energy than the condensation gas boiler.
Figure 3 shows how as the demand for heating decreases due to higher outdoor temperatures, the working
PLR of the heat pump also decreases due to the increase in available heating capacity. However, the heat pump is able to maintain the heating COP nearly constant as seen in
Figure 4.
The cooling season covers from June to September. In this case, the cities with significant refrigeration demand are Seville (B4) and Madrid (D3). In Seville the cooling COP of the air-to-water heat pump oscillates between 2.95 and 3.15, while in Madrid it does between 3.12 and 3.27. The cooling COP of the splits that make up system A is slightly lower than that of the system B heat pump. It presents values between 2.78 and 2.85 in Seville, while in Madrid it is between 2.77 and 2.92.
This difference in cooling COP can be explained by the performance curves considered for each device. The commercial air-to-water heat pump considered includes an inverter compressor that works efficiently at part load ratios. However, the default values for a mini-split device proposed by EnergyPlus refer to a single-speed compressor.
The energy consumption for DHW was estimated taking into account the average tap water temperature in every city and the daily DHW demand specified in the SBTC. It was assumed that both systems fulfilled this demand working at 45 °C. The average heating COP of the heat pump was considered at the average yearly temperature.
It was also considered that the building (system A) meets the minimum solar contribution to DHW demanded by the SBTC as a function of the climatic zone. Thus, the gas boiler covers only 40% of the demand for DHW in Seville, 70% in Barcelona and Burgos, and 50% in Madrid.
Table 5 summarizes the yearly results of demand and primary energy consumption of the HVAC systems A and B. To calculate the values given in
Table 5, primary energy factors of 1.19 for natural gas and 1.954 for electrical energy were considered respectively [
27].
It can be seen how the non-renewable primary energy consumption of systems A and B is lower than the maximum established by the SBTC for each climatic zone. However, the reductions in primary energy consumption achieved with the B system are significant: 37% in Barcelona, 27.4% in Madrid, and 33.6% in Burgos. The energy saving is higher in climates with a significant heating demand (Madrid and Burgos) and in cities with a mild climate such as Barcelona.
4. Discussion
Benchmarks of primary energy use for the energy performance of residential NZEB proposed by EU [
5] are in the range of 0–15 (kWh/m
2·year) for the Mediterranean climatic zone and 20–40 (kWh/m
2·year) for the Continental climatic zone. Barcelona and Seville are close to the upper limit of 15 (kWh/m
2·year) recommended for the Mediterranean climate, while Madrid was within the range recommended for the Continental climate and Burgos was close to its upper limit. However, the non-renewable source energy consumption limits valid at the moment in Spain are those shown in the last column of
Table 5. A revision of these benchmarks is expected in the SBTC for 2018.
The energy performance classification scale in Energy Certification of Buildings is divided into seven classes identified by a letter, from A (more efficient building) to G (less efficient building).
Table 6 shows the total CO
2 emissions (energy indicator for certification) for heating, cooling and DHW and building energy performance classification.
Table 6 also contains the CO
2 emissions limits that define classes A and B as a function of the climatic zone.
This building studied in this work was classified as Class A according to the CO2 emissions scale when using the aerothermal heat pump system, and as Class B when using the conventional HVAC system A.
Houlihan et al. [
9] used Polysun software to study the overall performance of the air-to-water heat pump installed in a detached single-family house located in Oslo. This house had a well-insulated envelope with heat transfer coefficients of 0.12 W/m
2K for the external walls, 0.10 W/m
2K for the roof and 0.65 W/m
2K for the windows. The authors obtained a total net annual energy demand of 70 (kWh/m
2·year), which is somewhat higher than the one obtained in this work (including DHW) for the cities of Madrid (57.6 kWh/m
2·year) and Burgos (62.8 kWh/m
2·year). Although the house is better isolated than the house in Madrid and Burgos, the climate is also more severe.
Houlihan et al. also calculated an electrical energy consumption of 39 (kWh/m2·year) to satisfy the energy demand and concluded that a PV installation could easily be designed to counterbalance that consumption. They also pointed out the strong impact that the mismatch between energy production and demand would have on the integration on the electricity grid.
The emission factor of 0.132 kgCO2eq/kWh considered by Houlihan et al. for electricity resulted in 5.15 (kgCO2/m2·year) of total CO2 emissions, which is of the same magnitude as the total CO2 emissions of the Continental cities of Madrid (5.64 kgCO2/m2·year) and Burgos (7.03 kgCO2/m2·year).
The implementation of aerothermal heat pumps in the residential sector is appropriate for both retrofit and new buildings. Asaee et al. [
21] conducted a study to assess the techno-economic feasibility of converting the Canadian housing stock (CHS) into net/near zero energy buildings. The proposed energy retrofit included an air-to-water heat pump and was assessed using the building energy simulation program ESP-r. Results showed that there is a potential to reduce 36% of energy consumption and 23% of CO
2 emissions of the CHS if all eligible houses undertake the retrofit.
As can be seen from the results obtained in this work and those found in the literature, the air-to-water heat pump can contribute to the implementation of more efficient buildings. As mentioned in the Introduction, HVAC equipment models based on manufacturer performance data are the most widespread in simulation programs. EnergyPlus is an open source widely used simulation program that does not include any specific model of the reversible air-to-water heat pump. That is the gap addressed by this work.
This work proposes a model for the air-to-water heat pump and integrates the EnergyPlus program in an Open BIM workflow. In this way, the energy simulation of the building becomes a part of the BIM. This implies that the energy model of the building is provided with all the relevant information gathered in the BIM model, which is automatically transferred to the input data file required by this energy simulation engine. Thus, the proposed model can be easily used by architecture, engineering and construction industry for evaluation of aerothermal heat pump systems viability in residential buildings.
Compared to the traditional non-integrated workflow, the Open BIM workflow ensures consistency, increases productivity and makes accessible the energy simulation with EnergyPlus to a wider scope of professionals involved in the building design. This allows analyzing multiple building and HVAC systems configurations, which will facilitate the task of choosing the most appropriate option for each specific case and thus improve energy savings. The results of the energy simulation can be integrated in the 3D model of the building to visually represent the parts of the building and HVAC system that have a larger influence in the energy consumption. This will help designers to take decisions about energy saving measures starting from the project phase of the building.
In Spain today, the diffusion of aerothermal heat pumps is displacing renewable energy systems such as solar thermal energy for the production of DHW. On the one hand, the SBTC allows substituting the minimum mandatory contribution of solar thermal energy for DHW for that generated by other renewable energies (e.g., aerothermal heat pumps). On the other hand, solar thermal systems need space in the building and, above all, adequate maintenance. The integration of aerothermal heat pumps and photovoltaic solar energy can be seen as a future option.
The economic analysis considers a common utility price of € 0.09/kWh of natural gas and € 0.15/kWh of electricity [
28]. The simple payback analysis provides a tool to compare HVAC systems A and B scenarios.
Table 7 shows the cost of the equipment installed in the residential building.
The cost of system A includes boiler, radiators, splits and the solar thermal installation to cover the mandatory percentage of DHW production according to the climatic zone. The cost of system B includes the aerothermal heat pump and the fan coils.
Table 8 shows the final energy consumption for heating, cooling and DHW, specifying whether it is natural gas (NG) or electricity (E). It also shows the energy annual costs of systems A and B.
The difference between energy costs of systems A and B was used to calculate the payback period of the investment in the aerothermal heat pump (
Table 9).
It can be seen how the payback period is lower the greater the consumption in heating and DHW. In the case of Madrid, although these consumptions are lower than those of Burgos, the initial investment in system A (49,855 €) is higher than in the case of Burgos (42,438 €) because the cooling demand is also higher.
The results presented in
Table 9 are sensitive to energy prices and are more favorable to the aerothermal heat pump as the price of natural gas increases or when the price of electric energy is reduced.
The results obtained from the hypotheses used in this work show how aerothermal heat pumps have adequate payback periods (6–8 years) for the analyzed Continental climates. In the case of Barcelona, with a mild climate, the payback period coincides practically with the useful life estimated by the companies for aerothermal heat pumps (around 15 years).
5. Conclusions
The objectives of this work were to develop a model for simulating a reversible air-to-water heat pump with EnergyPlus 8.9 and to study its operation in a residential building under different climatic conditions compared to a conventional HVAC system.
The integration of the HVAC system design and the energy simulation in an Open BIM workflow has proven to be a useful tool for energy performance assessment and certification of buildings. Information needed to calculate the thermal loads, design the HVAC system, and simulate energy performance was added progressively by means of BIM dedicated software tools that communicate with each other using IFC4 open standard format.
Results show that in the heating season the air-to-water heat pump consumes significantly less energy than the condensation gas boiler because the heat pump is able to maintain high heating COPs even at reduced PLRs. In the case of Madrid, the average heating COP was found to range between 3.14 and 4.20, while in Burgos it ranged between 2.95 and 3.76. In Barcelona and Seville, the heating COPs were even higher than those of Madrid and Burgos because of the higher outdoor temperatures.
In the cooling season the cooling COP of the air-to-water heat pump oscillated between 2.95 and 3.15 in Seville and between 3.12 and 3.27 in Madrid, the cities with the highest cooling demand. The cooling COP of the splits that made up system A was slightly lower (between 2.78 and 2.85 in Seville and between 2.77 and 2.92 in Madrid) because the default values for the splits proposed by EnergyPlus refer to a single-speed compressor.
The obtained non-renewable primary energy consumption of systems A and B was lower than the maximum established by the SBTC for each climatic zone. However, results show that significant primary energy consumption savings can be achieved with the aerothermal heat pump system, ranging from9.3% in Seville to 37% in Barcelona. It can be concluded that energy savings are higher in climates with a significant heating demand (Madrid and Burgos) and in cities with a mild climate such as Barcelona.
It was also found that Seville (22.3 kWh/m2·year) and Barcelona (21.6 kWh/m2·year) were close to the upper limit of the primary energy consumption range (0–15 kWh/m2·year) proposed by the EU for the energy performance of residential NZEB in the Mediterranean climate, while Madrid (36.9 kWh/m2·year) was within the range recommended for the Continental climate (20–40 kWh/m2·year) and Burgos (45.2 kWh/m2·year) was close to its upper limit. However, the non-renewable source energy consumption limits imposed by the SBTC at the moment in Spain are less restrictive.
The residential building studied in this work was classified as Class A according to the CO2 emissions scale when using the aerothermal heat pump system, and as Class B when using the conventional HVAC system A.

 and
and 


