Article

Prediction Method for Power Transformer Running State Based on LSTM_DBN Network

1
Department of Electrical Engineering, Shanghai Jiao Tong University, Shanghai 200240, China
2
Electric Power Research Institute of State Grid Shanghai Municipal Electric Power Company, Shanghai 200120, China
*
Author to whom correspondence should be addressed.
Energies 2018, 11(7), 1880; https://doi.org/10.3390/en11071880
Submission received: 3 July 2018 / Revised: 9 July 2018 / Accepted: 12 July 2018 / Published: 19 July 2018

Abstract

:
It is of great significance to accurately get the running state of power transformers and timely detect the existence of potential transformer faults. This paper presents a prediction method of transformer running state based on LSTM_DBN network. Firstly, based on the trend of gas concentration in transformer oil, a long short-term memory (LSTM) model is established to predict the future characteristic gas concentration. Then, the accuracy and influencing factors of the LSTM model are analyzed with examples. The deep belief network (DBN) model is used to establish the transformer operation using the information in the transformer fault case library. The accuracy of state classification is higher than the support vector machine (SVM) and back-propagation neural network (BPNN). Finally, combined with the actual transformer data collected from the State Grid Corporation of China, the LSTM_DBN model is used to predict the transformer state. The results show that the method has higher prediction accuracy and can analyze potential faults.

1. Introduction

As one of the important pieces of equipment in the power system, power transformers can directly influence the stability and safety of the entire power grid. If the transformer fails in operation, it will cause power to turn off and also cause damage to the transformer itself and the power system, which may result in greater damage [1]. So, it is necessary to take real-time condition monitoring into consideration and make diagnoses for the transformer to predict future running states. The potential failure of the transformer is discovered in time and the potential failure types are analyzed. Sending early warning signals to maintainers and taking corresponding measures in a timely manner can reduce the possibility of an accident.
At present, there is much research on transformer fault diagnosis, but there are relatively few studies on the prediction of future running states of transformers and fault prediction. During the operation of the transformer, its internal insulating oil and solid insulating material will be dissolved in the insulating oil due to aging or external electric field and humidity. The content of various components of the gas in the oil and the proportional relationship between the different components are closely related to the running state of the transformer. Before the occurrence of electrical or thermal faults, the concentration of various gases has a gradual and regular change with time. Therefore, the dissolved gas analysis (DGA) is an important method to find the transformer defects and latent faults. It is highly feasible and accurate to predict transformer running states and make future fault classifications based on the trend of each historical gas concentration and the ratio between gas concentrations [2,3,4]. Current methods include oil gas ratio analysis [5,6,7], SVM [8,9] and artificial neural network (ANN) [10,11]. Li et al. [12] proposes an incipient problem diagnosis method based on the combined use of a multi-classification algorithm self-adaptive evolutionary extreme Learning machine (SaE-ELM) and a simple arctangent transform (AT). This paper uses AT alter the data structure of the experiment data to enhance the generalization capability for SaE-ELM. This article utilizes AT to change the structure of experimental data to enhance SaE-ELM fitting and generalization capabilities. Sherif S.M. Ghoneim [13] utilizes the thermodynamic theory to evaluate the fault severity based on dissolved gas analysis, also it proposes fuzzy logic approach to enhance the network fault diagnosis ability. Zhao et al. [14] proposes a transformer fault combination prediction model based on SVM. The prediction results of multiple single prediction methods such as exponential model, gray model, etc. are taken as the input of SVM for the second prediction to form a variable weight combination forecast. Compared with single prediction, the accuracy of fault prediction is improved. Zhou et al. [15] uses cloud theory to predict the expected value of gas changes in oil in the short term to obtain a series of prediction results with stable tendency. The current method still has the following two problems. (1) The current research is mostly aimed at fault diagnosis at the current moment, which lack analysis of the running states in the future and fault warning analysis. (2) In the state assessment and fault classification of transformers, the gas concentration ratio coding is mainly used as the input of the model, but there are problems such as incomplete coding and too-absolute boundaries [16].
In recent years, with the continuous development of deep learning technologies, some deep learning models have been applied to the analysis of time series data. The deep learning model is a kind of deep neural network with multiple non-linear mapping levels. It can abstract the input signal layer by layer and extract features to discover potential laws at a deeper level. In many deep learning models, the recurrent neural network (RNN) can fully consider the correlation of time series and can predict future data based on historical data. It is more adaptable to predict and analyze time series data. The LSTM is used as an improved model of RNN to make up for the disappearance of gradients, gradient explosions, and lack of long-term memory in the training process of the RNN model. It can make full use of historical data. At present, LSTM has achieved extensive research and application in such fields as speech recognition [17], video classification [18], and flow prediction [19,20]. In this paper, the LSTM model is used to process the superiority of the time series, and the gas concentration in the future is predicted based on the trend of the gas concentration in the transformer oil history. The DBN is cumulatively accumulated by multiple restricted Boltzmann machines (RBM), and the data is pre-trained using a comparative divergence (CD) algorithm. The error back-propagation is used to adjust the parameters of the whole network. The DBN network can effectively support traditional neural networks that are vulnerable to initial parameters, and that handle high-dimensional data at a slower speed. Currently, DBN networks have been widely used in fault diagnosis [21], pattern recognition [22], and image processing [23]. In this paper, the ratio of the future gas concentration obtained from the LSTM prediction model is used as the DBN network input to classify the future operating status of the transformer.
This paper presents a prediction method of transformer running state based on LSTM_DBN model. Firstly, the ability of LSTM model to deal with time series is used to analyze the changing trend of dissolved gas concentration data in transformer oil to obtain the future gas concentration and calculate the gas concentration ratio. Using the powerful feature learning ability of DBN network, the gas concentration ratio value is the input of the model, and the transformer operation state type is output, and a plurality of hidden layer deep networks are constructed. The entire LSTM_DBN model makes full use of the historical data of the transformer oil chromatogram and realizes the analysis of the state of the transformer in the future and the analysis of the early fault warning. Through the analysis of specific examples, we can see that the model proposed in this paper has good prediction accuracy and can analyze potential faults.

2. Prediction of Dissolved Gases Concentration in Transformer Oil Based on LSTM Model

2.1. Prediction of Dissolved Gases Concentration

Transformer oil chromatographic analysis technology has become one of the important methods for monitoring the early latency faults of oil-immersed power transformers and analyzing fault nature and locations after failure. Condition-based maintenance of oil-immersed transformers is fully based on oil chromatographic data. Transformer oil chromatographic analysis test can quickly and effectively find potential faults and defects without interruption of power. It has high recognition of overheating faults, discharge faults, and dielectric breakdown failures.
Most transformers use oil-paper composite insulation. When the transformer is under normal operation, the insulating oil and solid insulating material will gradually deteriorate and a small amount of gas will be decomposed, mainly including H2, CH4, C2H2, C2H4, C2H6, CO, and CO2. When the internal fault of the transformer occurs, the speed of these gases will be accelerated. As the failure develops, the decomposed gas forms bubbles, causing bubbles to flow and diffuse in oil. The composition and content of the gas are closely related to the type of fault and the severity of the fault. Therefore, during the operation of the transformer, chromatographic analysis of the oil is performed at regular intervals, so as to detect potential internal equipment failures as early as possible, which can avoid equipment failure or greater losses. However, due to the complex operation of the transformer oil chromatography test and the long sampling interval, it is of great significance to predict the future development trend based on the historical trend of the gas concentration in the transformer oil.

2.2. Principles of Prediction

The LSTM network is an improved model based on the RNN. While retaining the recursive nature of RNNs, the problem of disappearance of gradients and gradient explosions in the RNN training process is solved [24,25,26,27].
A basic RNN network is shown in Figure 1a. It consists of an input layer, a hidden layer, and an output layer. The RNN network timing diagram is shown in Figure 1b. x = [x(1), x(2), x(3)…, x(n−1), x(n)] is the input vector and y = [y(1), y(2), …, y(n)] is the output vector. h is the state of the hidden layer. Wxh is the weight matrix of the input layer to the hidden layer. Why is the weight matrix of the hidden layer to the output layer, and Whh is the weight matrix of the hidden layer state as the input at the next moment. The layer state h(t−1) is used as the weight matrix input at time t. So when the input at t is x(t), the value of the hidden layer is h(t) and the output value is y(t).
h ( t ) = f ( W x h ( t ) · x ( t ) + W h h ( t 1 ) · h ( t 1 ) )
y ( t ) = g ( W x h ( t ) · h ( t ) )
where f is the hidden layer activation function and g is the output layer activation function. Substituting (2) into (1), we can get:
y ( t ) = g ( W x h ( t ) · h ( t ) ) = g ( W x h ( t ) · f ( W x h ( t ) · x ( t ) + W h h ( t 1 ) · f ( W x h ( t 1 ) · x ( t 1 ) + W h h ( t 2 ) · f ( W x h ( t 2 ) · x ( t 2 ) + W h h ( t 3 ) · f ( W x h ( t 3 ) · x ( t 3 ) + ... ) ) ) )
From (3), it can be seen that the output value y(t) of the RNN network is affected not only by the input x(t) at the current moment, but also by the previous input value x(t−1), x(t−2), x(t−3)….
The RNN network has a memory function and can effectively deal with non-linear time series. However, when the RNN processes a time sequence with a long delay, the problem of gradient disappearance and gradient explosion will occur during the back-propagation through time (BPTT) training process. As an improved model, LSTM adds a gating unit which allows the model to store and transmit information for a longer period of time through the selective passage of information.
The gating unit of LSTM is shown in Figure 2. It consists of an input gate, a forget gate and an output gate. The workflow of the LSTM gate unit is as follows:
(1) Input the sequence value x(t) at time t and the hidden layer state h(t−1) at time t − 1. The discarded information is determined by the activation function. The output at this time is:
f ( t ) = σ ( W f · h ( t 1 ) + W f · x ( t ) + b f )  
where f(t) is the result of the forget state, Wf is the weight matrix of forget state, and bf is offset of forget state. σ is the activation function. It is usually a tanh or sigmoid function.
(2) Enter the gate unit state c(t−1) at time t − 1 and determine the information to update. Update the gate unit state c(t) at time t:
i ( t ) = σ ( W i · h ( t 1 ) + W i · x ( t ) + b i )
c ˜ ( t ) = tanh ( W c · h ( t 1 ) + W c · x ( t ) + b c )
c ( t ) = i ( t ) c ˜ ( t ) + f ( t ) c ( t 1 )
where i(t) is the input gate state result. c ˜ ( t ) is the cell state input at t. Wi is the input gate weight matrix. Wc is the input cell state weight matrix. bi is the input gate bias, and bc is the input cell state bias. means multiplication by elements.
(3) The output of the LSTM is determined by the output gate and unit status:
o ( t ) = σ ( W o · h ( t 1 ) + W o · x ( t ) + b o )
h ( t ) = o ( t ) tanh ( c ( t ) )
where o(t) is the output gate state result. Wo is the output gate weight matrix and bo is the output gate offset.

3. Analysis of Transformer Running State Based on Deep Belief Network

3.1. Transformer Running Status Analysis

For the running state classification of the transformer, it is firstly divided into healthy state (H) and potential failure (P). According to the IEC60599 standard, the types of potential transformer faults can be classified into thermal fault of partial discharge (PD), low-energy discharge (LD), and high-energy discharge (HD), low temperature (LT), thermal fault of medium temperature (MT), thermal fault of high temperature (HT) [21]. Thus, the predicted running state of the transformer is divided into 7 (6 + 1) types.
Due to the normal aging of the transformer, the decomposed gas in the transformer oil is in an unstable state and will accumulate over time and change dynamically. Even though different transformers are in healthy operation, because of their different operating times, the concentration of dissolved gases in the oil varies greatly among different transformers. Therefore, it is necessary to use the ratio between the gas concentrations instead of the simple gas concentration as a reference vector for the prediction of the final running state.
The currently used ratios include IEC ratios, Rogers ratios, Dornenburg ratios and Duval ratios. This paper combines these four methods with other codeless ratio methods. The gas concentration ratios used is shown in Table 1.

3.2. Deep Belief Network

RBM, as a component of DBN, includes a visible layer v and a hidden layer h. The structure of RBM is shown in Figure 3. The visible layer consists of visible units vi and is used to input the training data. The hidden layer is composed of hidden units hi and is used for feature detection. w represents the weights between two layers. For the visible and hidden layers of RBM, the interlayer neurons are fully connected and the inner layer neurons are not connected [28,29,30,31].
For a specific set of (v, h), the energy function of the RBM is defined as:
E ( v , h | θ ) = i = 1 n v a i v i j = 1 n h b j h j i = 1 n v j = 1 n h v i ω i j h j
where θ = ( ω i j , a i , b j ) is the parameter of RBM. ω i j is the connection weight between the visible layer node vi and the hidden layer node hj. ai and bj are the offsets of vi and hj respectively. According to this energy function, the joint probability density of (v, h) is:
p ( v , h | θ ) = e E ( v , h | θ ) / Z ( θ )
Z ( θ ) = v h e E ( v , h | θ )
The probability that the jth hidden unit in the hidden layer and the ith visible unit in the visible layer are activated are:
p ( h j = 1 | v , θ ) = σ ( b j + i = 1 n v v i ω j i )
p ( v j = 1 | h , θ ) = σ ( a i + i = 1 n h h j ω j i )
where σ ( · ) is the activation function. Usually we can choose sigmoid function, tanh function or ReLU function. The expressions are:
sigmoid ( x ) = 1 1 + e x
tanh ( x ) = e x e x e x + e x
ReLU ( x ) = max ( 0 , x )  
Since the ReLU function can improve the convergence speed of the model and has the non-saturation characteristics, this paper uses the ReLU function as the activation function.
When given a set of training samples S, ns is the number of training samples. Maximizing the likelihood function can achieve the purpose of training RBM.
ln L θ , S = i = 1 n s ln P ( v i )
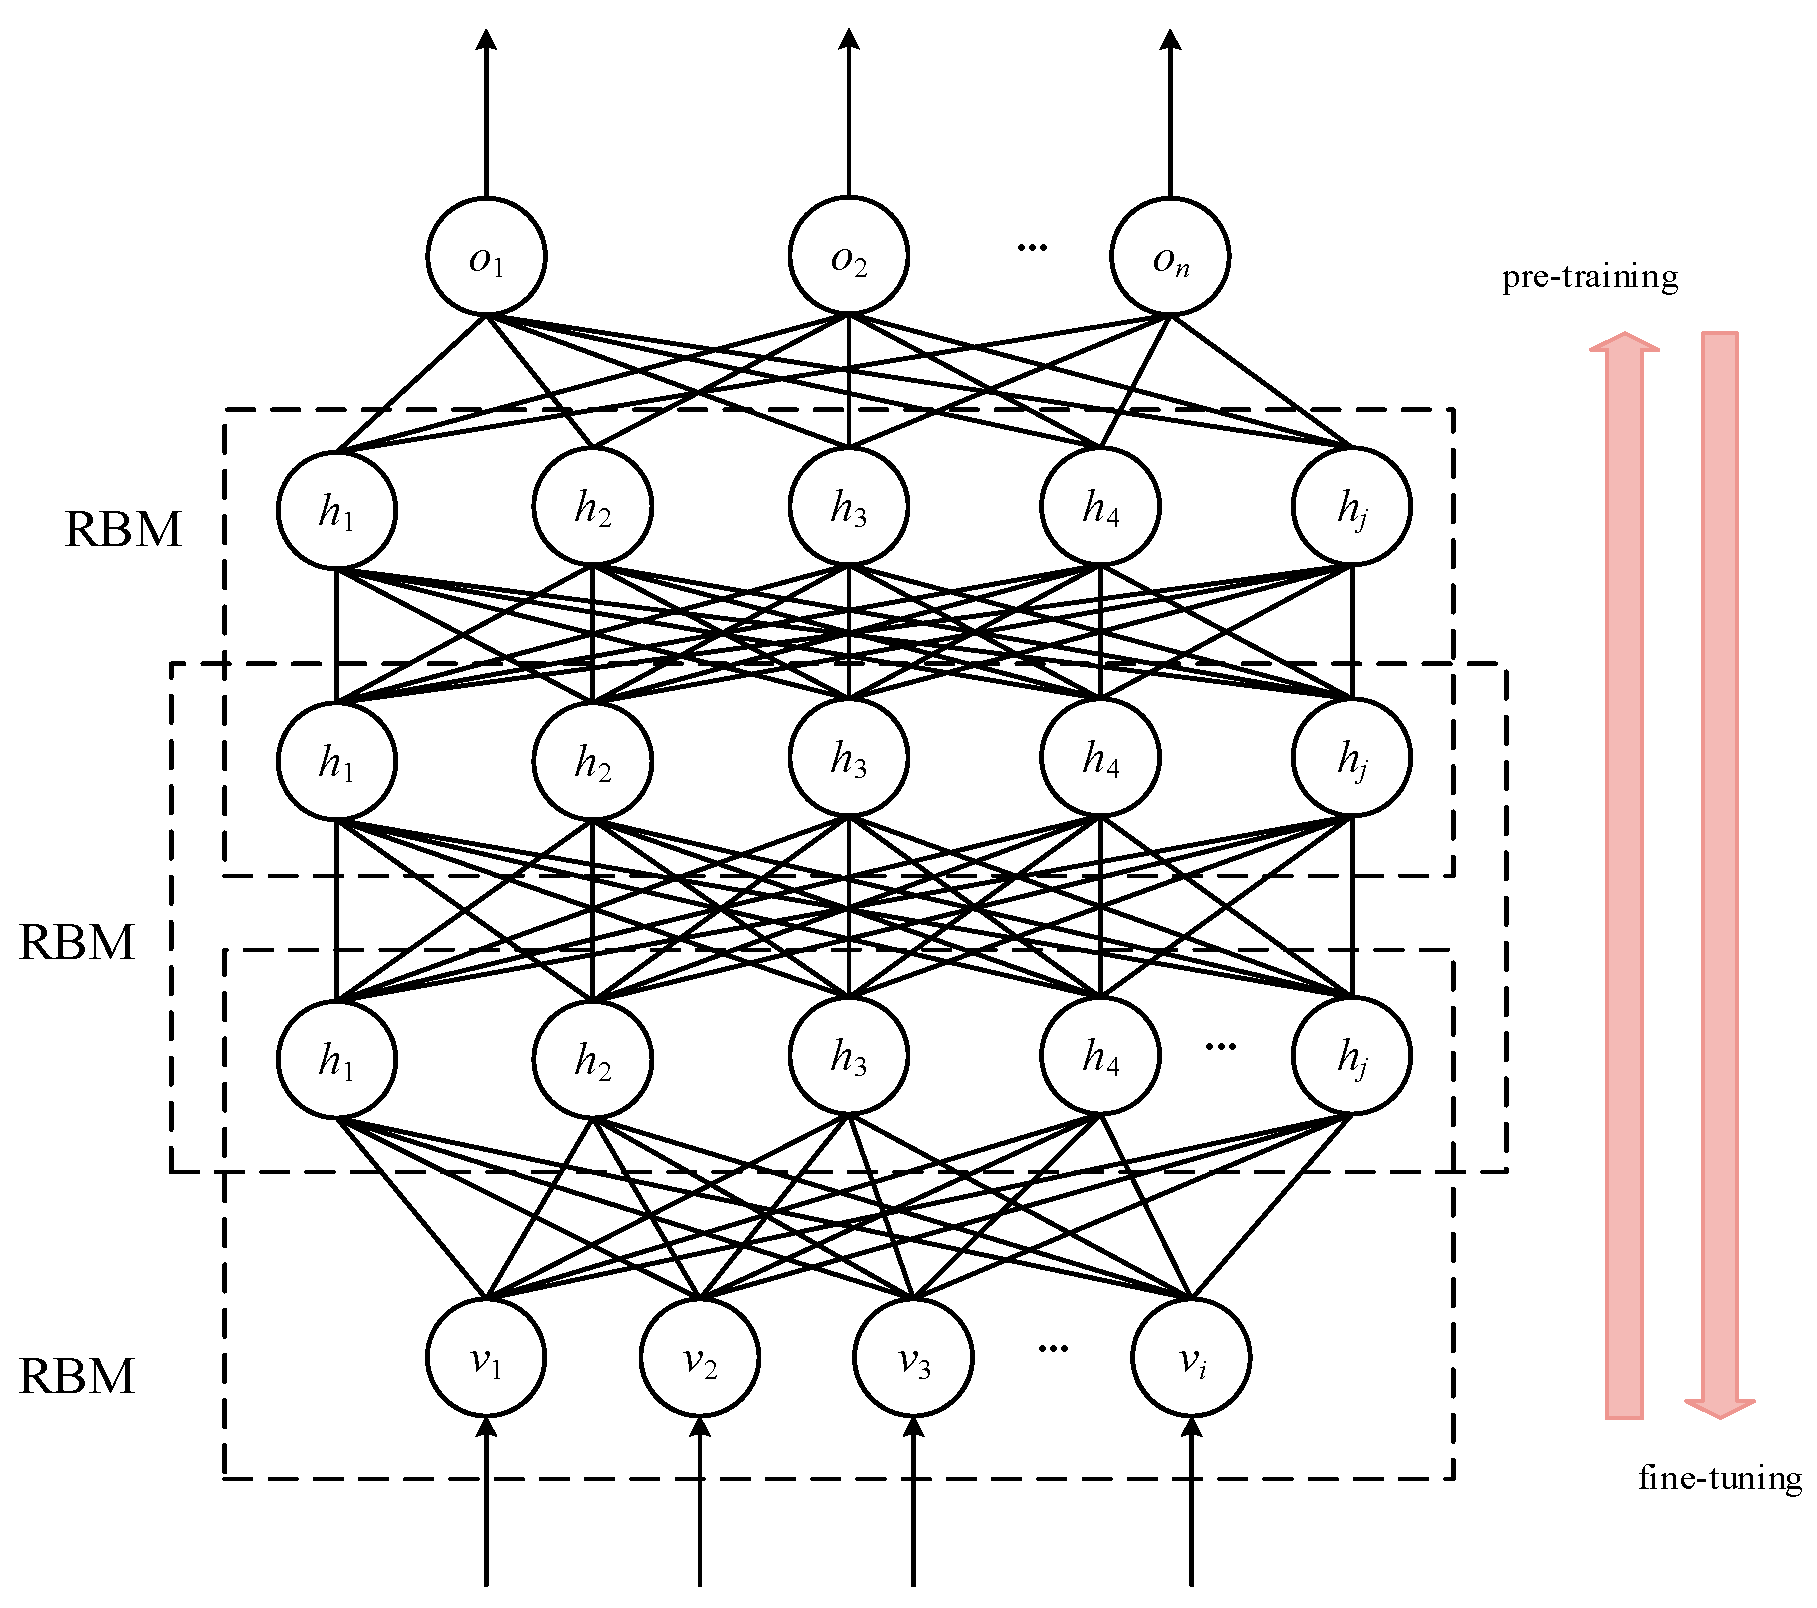
The DBN network is essentially a deep neural network composed of multiple RBM networks and a classified output layer. Its structure is shown in Figure 4.
The DBN training process includes two stages: pre-training and fine-tuning. In the pre-training phase, a contrast divergence (CD) algorithm is used to train each layer of RBM layer by layer. The output of the first layer of RBM hidden layer is used as the input of the upper layer of RBM. In the fine-tuning phase, the gradient descent method is used to propagate the error between the actual output and the labeled numerical label from top to bottom and back to the bottom to achieve optimization of the entire DBN model parameters.

4. Transformer State Prediction Process

With the continuous development of power equipment on-line monitoring technology, the monitoring data are also increasing rapidly. Utilizing the existing historical state information, such as the type and development law of the characteristic gas in the insulating oil, and analyzing the change of the running state is of great significance to the state assessment and prediction.
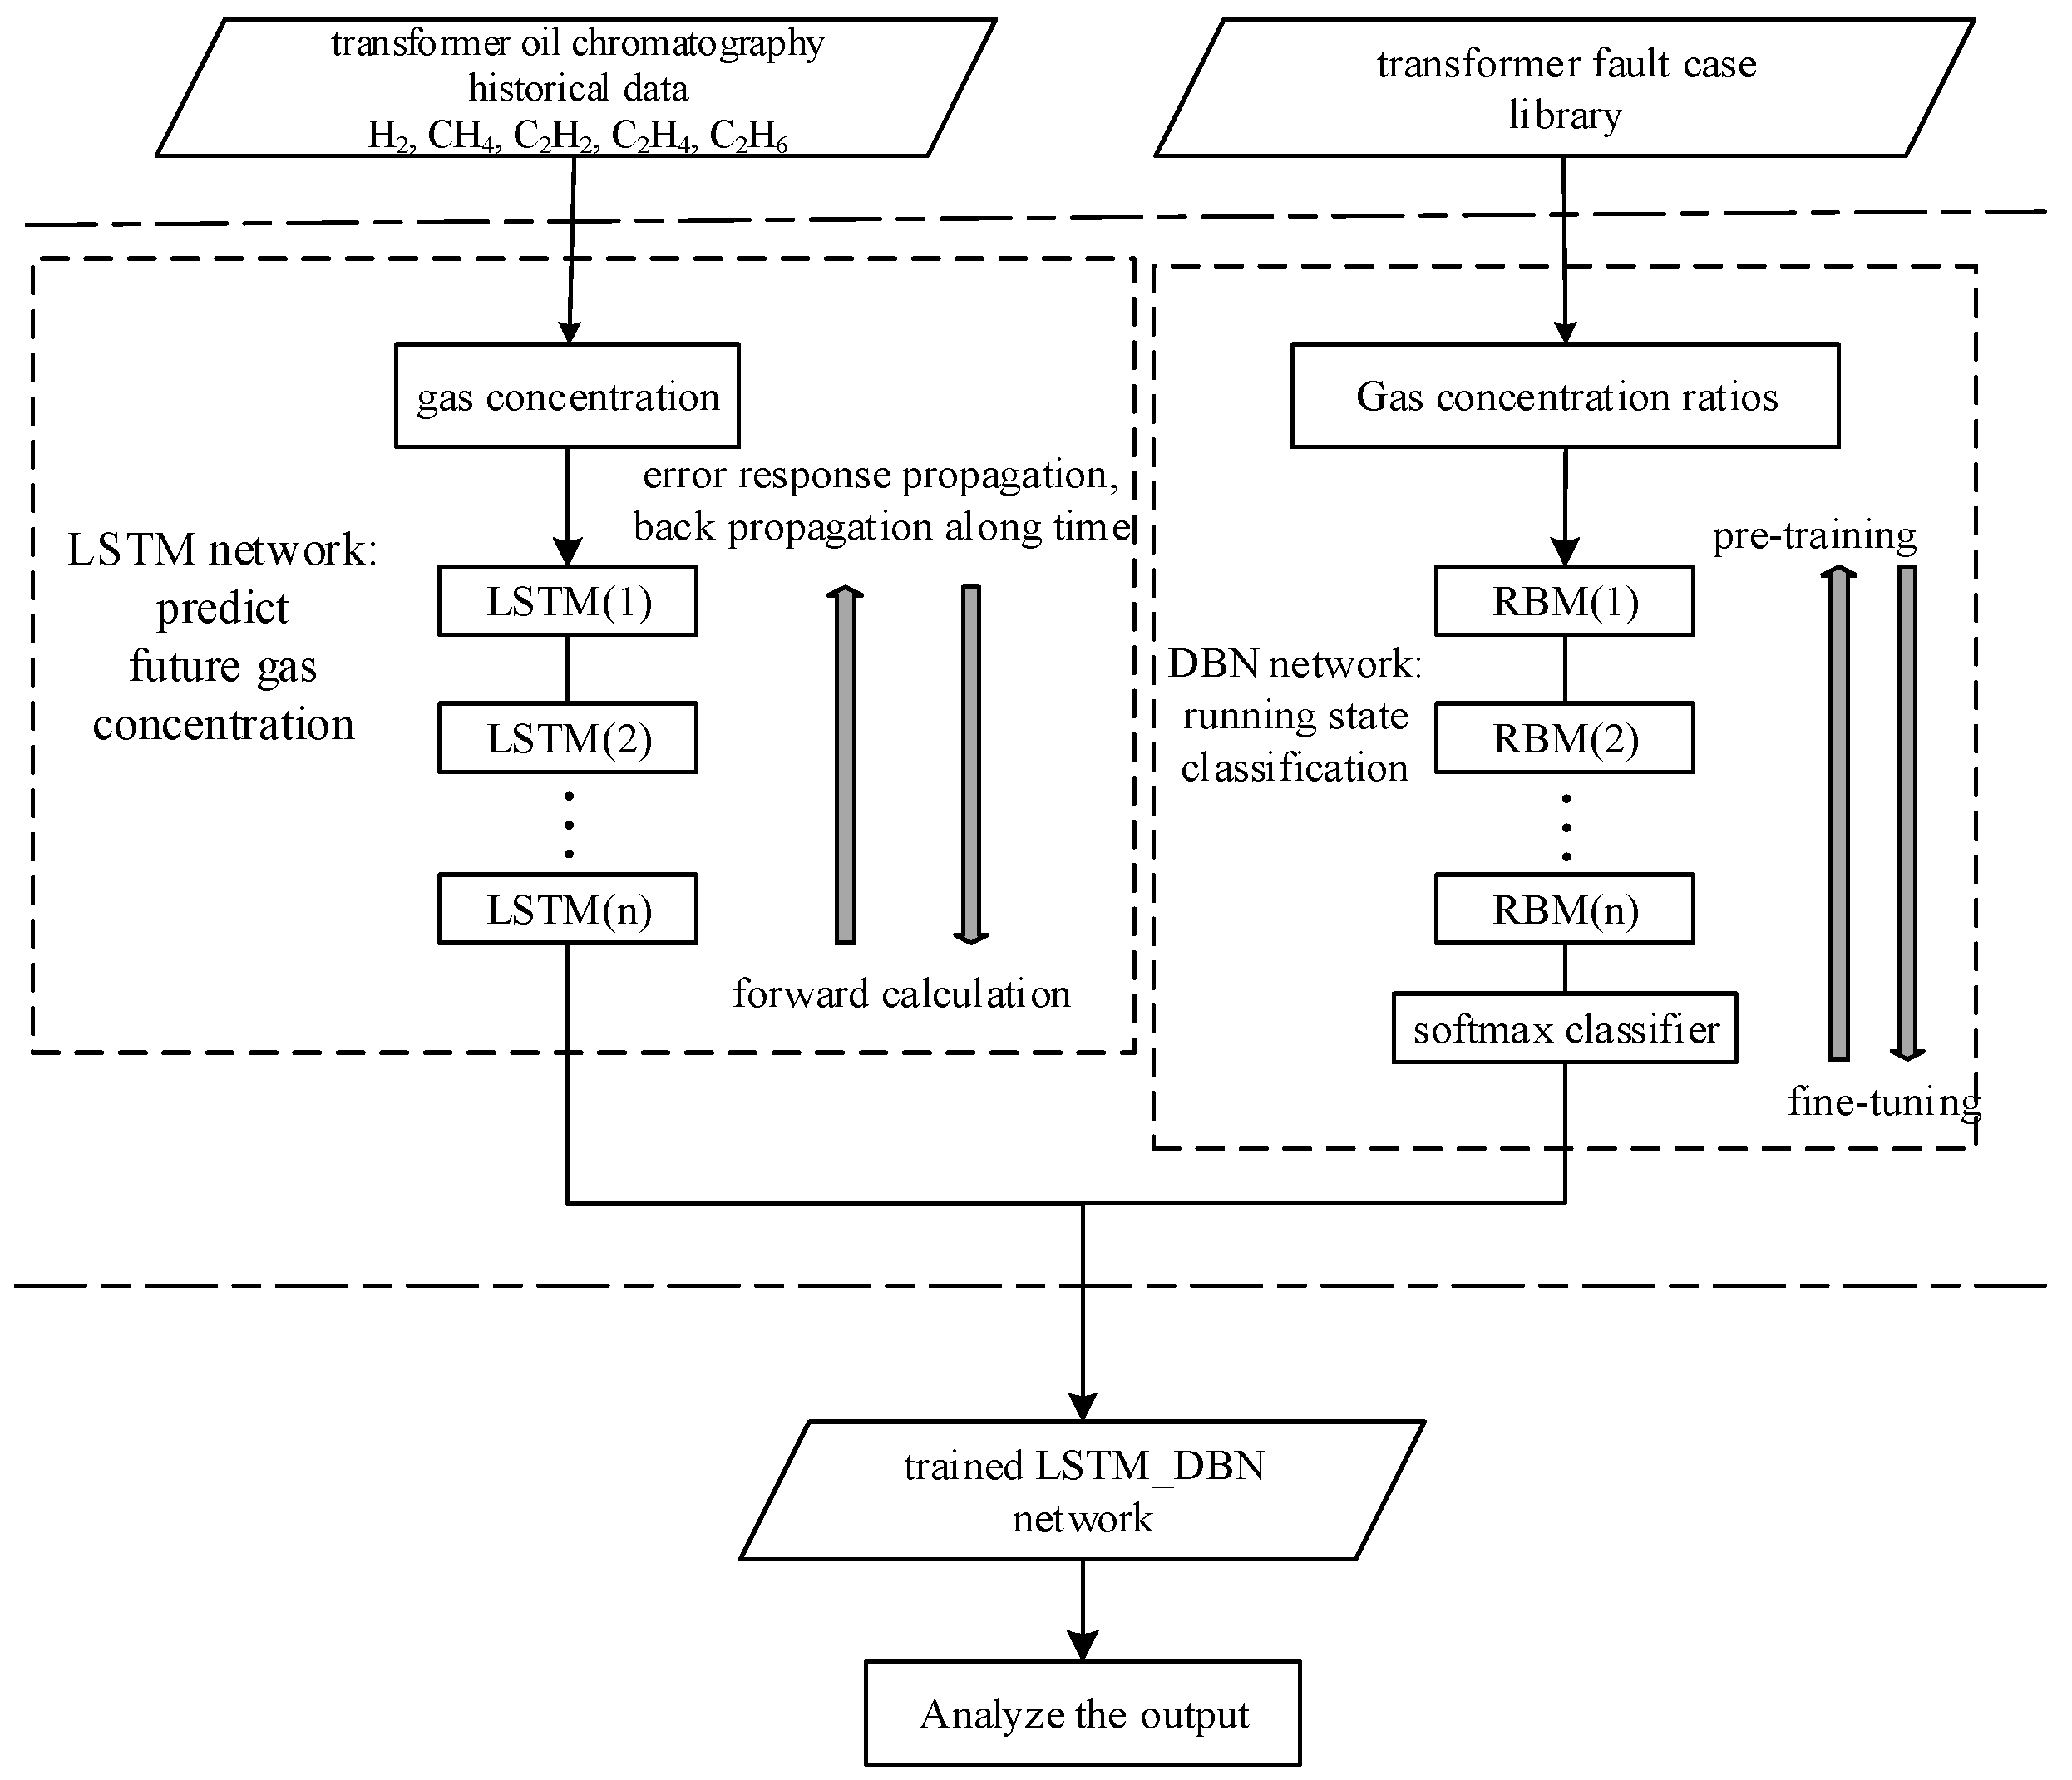
The flowchart of the transformer running state prediction method based on the LSTM_DBN model is shown in Figure 5. The specific steps are as follows:
(1)
Collect the transformer oil chromatographic data and select the characteristic parameters H2, CH4, C2H2, C2H4 and C2H6 as input for the model;
(2)
Train the LSTM model. According to the transformer oil chromatography historical data, each characteristic gas concentration is taken as the input, and the corresponding gas concentration is used as the output to train LSTM model to obtain future gas concentration values;
(3)
Train the DBN model. According to the samples of the transformer fault case library, the gas concentration ratios are taken as the input of the DBN network, and 7 kinds of transformer running states are used as the output to train DBN model;
(4)
Use the trained LSTM_DBN network to test the test set samples. Input the five characteristic gas concentration values to the LSTM model and predict future gas changes. Then calculate the gas concentration ratio and use the ratio results as input to the DBN network to obtain the future running states of the transformer;
(5)
If there is fault information in the prediction result, an early warning signal needs to be issued in time and the fault type can be predicted.

5. Case Analysis

5.1. Gas Concentration Prediction

This paper takes the oil chromatographic monitoring data collected by a 220 kV transformer oil chromatography online monitoring device as an example. The sampling interval is 1 day. For the methane gas concentration sequence, 800 monitoring data are selected as training samples and 100 monitoring data are used as test samples. The prediction results are shown in Figure 6.
In order to evaluate the accuracy and validity of the prediction model proposed in this paper, the following evaluation criteria are used for analysis.
a v g _ e r r = 1 N i = 1 N | x ˜ i x i x i |   ×   100 %
m a x _ e r r = max | x ˜ i x i x i |
where N is the number of set, xi is the real value and x ˜ i is the predicted value.
As shown in Figure 6, the prediction model proposed in this paper has better fitting ability and has a good degree of fitting to the changing trend of methane gas concentration. The relative percentage error between the true and predicted values is shown in Figure 7, where the average relative percentage error is 0.26% and the maximum relative percentage error is 1.21%.
The LSTM model is used to predict the other gas concentrations. The predicted results are shown in Table 2, which shows that the average error of the LSTM method is lower than general regression neural network (GRNN), DBN, and SVM. Therefore, it can be seen that the use of LSTM to predict transformer concentration has high stability and reliability.

5.2. Gas Concentration Prediction

The transformer oil chromatographic gas concentration ratios are used as the input to the DBN network and the seven transformer running states are output. The case database used in this paper contains a total of 3870 datasets, including 838 normal cases and 3032 failure cases (521 LT cases, 376 MT cases, 587 HT cases, 519 PD cases, 489 LD cases and 540 HD cases). 90% of the sample data are randomly selected from the database to train the DBN network, leaving 10% of the sample data as the test sample to test the accuracy of the classification.
The results of the classification of DBN, SVM, and BPNN at a test are shown in Figure 8. This paper evaluates the classification results of transformer running states by drawing confusion matrix. Light green squares on the diagonal indicate the number of samples that match the predicted category with the actual category, and the blue squares indicate the number of falsely identified samples. The last row of gray squares is the precision (the number of correctly predicted samples/number of predicted samples). The last column of orange squares is the recall (the number of correctly predicted samples/actual number of samples). The last purple square is the accuracy (all correctly predicted samples/all samples).
From Figure 8, it can be seen that compared with the SVM model and the BPNN model, the DBN model has the highest classification accuracy, which respectively increases the accuracy by 9.6% and 16.2%. And the precision and recall rate of the DBN model are both high, exceeding 85%. The comparison shows that the DBN model has a good effect for the classification of transformer running states. Since a single experiment may be accidental, this paper repeats 10 sets of tests on the DBN model, the SVM model, and the BPNN model to obtain the average accuracy respectively. The average accuracy of the three models is 89.4%, 80.1%, and 71.9%. Therefore, it can be seen that the DBN model has strong classification stability while maintaining a high accuracy.

5.3. Running State Prediction

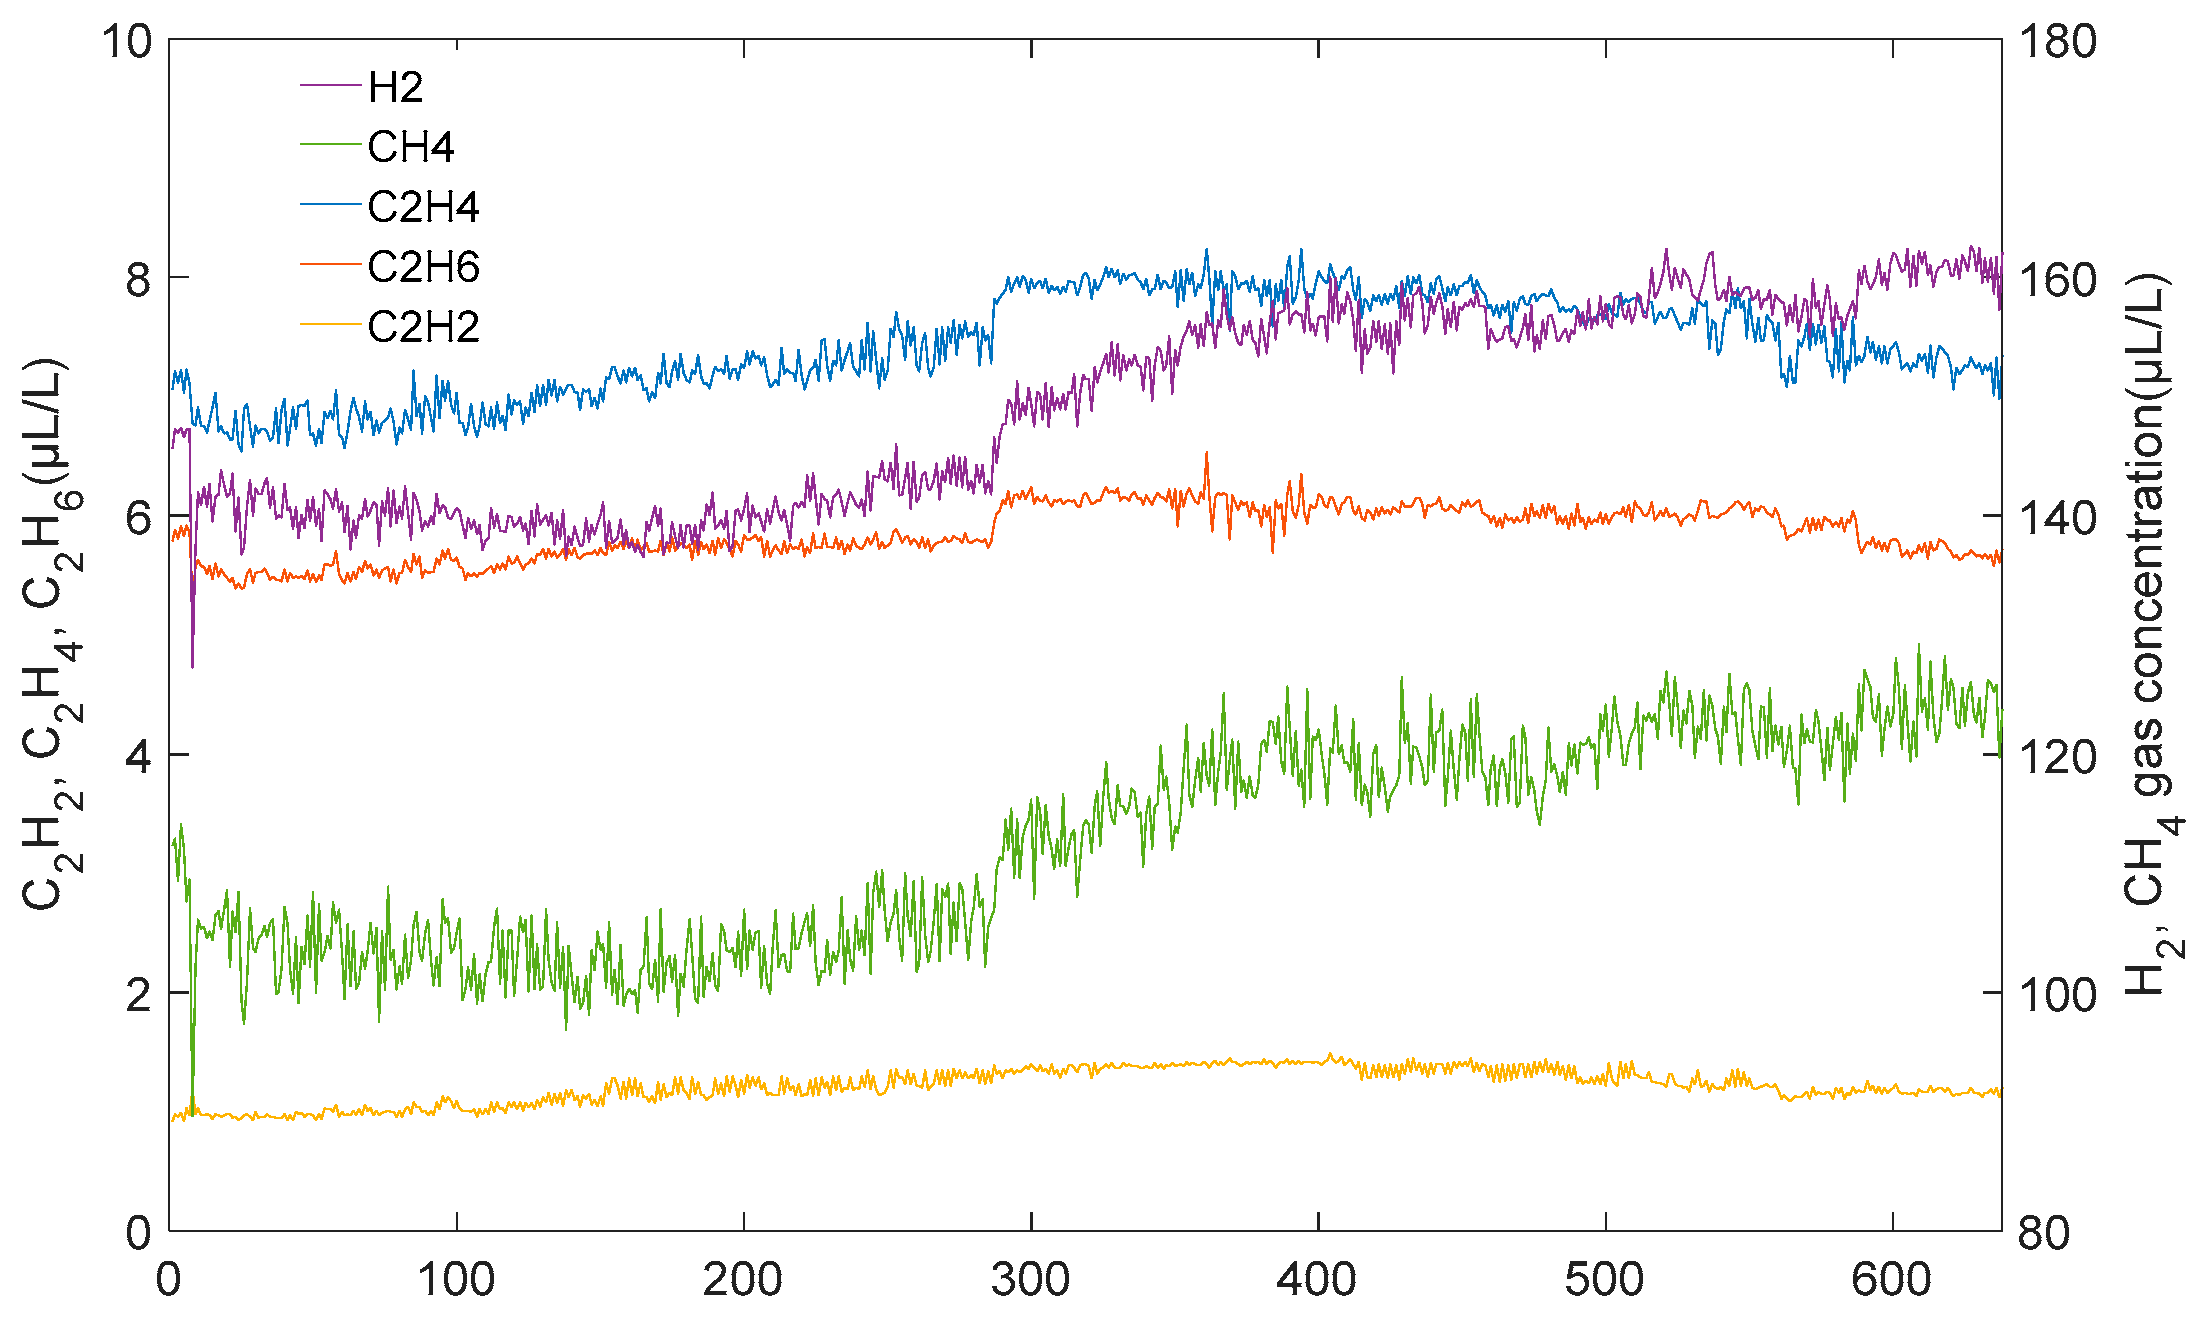
The oil chromatogram data from January to October in 2015 of a main transformer in a substation are selected for analysis. The sampling interval for data points is 12 h. The original data are shown in Figure 9.
First, using the IEC three-ratio method integrated in the original system for analysis, there is no abnormal warning before September. Until September, the measured ratio code is 021, which is consistent with thermal fault of medium temperature. An abnormal warning should be issued at this time. Secondly, using the integrated threshold method in the original system, H2 content in excess of 150 μL/L is detected in October and an early warning signal is required.
Using the LSTM_DBN model proposed in this paper, the transformer running state is predicted and evaluated. Starting from the 5th month, use the LSTM model to predict the transformer gas concentration value in the next month, then calculate the gas concentration ratios and input them into the DBN network to get the transformer’s future running state. The transformer’s running state from May to October is shown in Table 3.
As it can be seen from Table 3, the percentage of fault cases that are obtained through analysis using the LSTM_DBN model is gradually increasing, of which the percentage in August has exceeded 50% and the highest percentage of fault cases in October is 74.2%. It can be seen that there is a potential operational failure. Table 3 shows that, among all the fault type analysis results, the number of fault cases with MT is the largest, so that there is a potential fault type with thermal fault of medium temperature. It needs to send early warning signals. Oil chromatography monitoring device can be interfered with the external environment and cause errors in data acquisition. When the fault case accounts for more than 50%, it should immediately attract the attention of the staff. For this case, equipment early warning should be issued in August: “Closely concerned with the development trend of chromatographic data and timely check the transformer status”.
The actual situation for the operation and maintenance personnel’s detection records shows that the oil temperature rises abnormally since June and the value of the core grounding current increases gradually. The value of H2 in the oil chromatographic device exceeds 150 μL/L from October to December. During the outage maintenance in 2016, there are traces of burn at the end of the winding and the B phase winding is distorted. The prediction results of the transformer running state through the LSTM_DBN model are more consistent with the actual situation. This example shows that the transformer running state prediction method based on LSTM_DBN model can detect the abnormal upward trend of oil chromatographic data in time and provide early warning to the abnormal state of the transformer.

6. Conclusions

(1) The LSTM model has excellent ability to process time series and solves problems such as gradient disappearance, gradient explosion, and lack of long-term memory in the training process. It can fully utilize historical data. The DBN model can extract the characteristic information hidden in fault case data layer by layer and has high classification ability.
(2) The transformer running state prediction method based on the LSTM_DBN model presented in this paper has high accuracy and can send warning information to potential transformer faults in time. Compared with the threshold method according to the standard and the state prediction method in the research literature, this paper can make full use of the historical and current state data.
(3) We will focus on the improvement of the LSTM model and the DBN model, as well as parameter optimization, to further improve the transformer state prediction accuracy in the next step. Due to the small number of substations with complete online monitoring equipment and rich state data, the method proposed in this paper needs further verification.

Author Contributions

Jun Lin designed the algorithm, test the example and write the manuscript. Lei Sum Gehao Sheng, Yingjie Yan, Da Xie and Xiuchen Jiang helped design the algorithm and debug the code.

Acknowledgments

This work was supported in part by the National Natural Science Foundation of China (51477100) and the State Grid Science and Technology Program of China.

Conflicts of Interest

The authors declare no conflict of interest.

Nomenclature

Variables
xthe input vector
ythe output vector
hthe state of the hidden layer
Wxhthe weight matrix of the input layer to the hidden layer of RNN network
Whythe weight matrix of the hidden layer to the output layer of RNN network
Whhthe weight matrix of the hidden layer state as the input at the next moment of RNN network
f(t)the result of the forget state
Wfthe weight matrix of forget state
bfThe offset of forget state
i(t)the input gate state result
c ˜ ( t ) the cell state input at time t
Withe input gate weight matrix
Wcthe input cell state weight matrix
bithe input gate bias
bcthe input cell state bias
o(t)the output gate state result
Wothe output gate weight matrix
bothe output gate offset
va visible layer
wthe weights between visible layers and hidden layers
θ the parameter of RBM
ω i j the connection weight between the visible layer node vi and the hidden layer node hj
aithe offsets of vi
bjthe offsets of and hj
Symbol
σ the activation function
multiplication by elements

References

  1. Taha, I.B.M.; Mansour, D.A.; Ghoneim, S.S.M. Conditional probability-based interpretation of dissolved gas analysis for transformer incipient faults. IET Gener. Transm. Distrib. 2017, 11, 943–951. [Google Scholar] [CrossRef]
  2. Singh, S.; Bandyopadhyay, M.N. Dissolved gas analysis technique for incipient fault diagnosis in power transformers: A bibliographic survey. IEEE Electr. Insul. Mag. 2010, 26, 41–46. [Google Scholar] [CrossRef]
  3. Cruz, V.G.M.; Costa, A.L.H.; Paredes, M.L.L. Development and evaluation of a new DGA diagnostic method based on thermodynamics fundamentals. IEEE Trans. Dielectr. Electr. Insul. 2015, 22, 888–894. [Google Scholar] [CrossRef]
  4. Yan, Y.; Sheng, G.; Liu, Y.; Du, X.; Wang, H.; Jiang, X.C. Anomalous State Detection of Power Transformer Based on Algorithm Sliding Windows and Clustering. High Volt. Eng. 2016, 42, 4020–4025. [Google Scholar]
  5. Gouda, O.S.; El-Hoshy, S.H.; El-Tamaly, H.H. Proposed heptagon graph for DGA interpretation of oil transformers. IET Gener. Transm. Distrib. 2018, 12, 490–498. [Google Scholar] [CrossRef]
  6. Malik, H.; Mishra, S. Application of gene expression programming (GEP) in power transformers fault diagnosis using DGA. IEEE Trans. Ind. Appl. 2016, 52, 4556–4565. [Google Scholar] [CrossRef]
  7. Khan, S.A.; Equbal, M.D.; Islam, T. A comprehensive comparative study of DGA based transformer fault diagnosis using fuzzy logic and ANFIS models. IEEE Trans. Dielectr. Electr. Insul. 2015, 22, 590–596. [Google Scholar] [CrossRef]
  8. Li, J.; Zhang, Q.; Wang, K. Optimal dissolved gas ratios selected by genetic algorithm for power transformer fault diagnosis based on support vector machine. IEEE Trans. Dielectr. Electr. Insul. 2016, 23, 1198–1206. [Google Scholar] [CrossRef]
  9. Zheng, R.; Zhao, J.; Zhao, T.; Li, M. Power Transformer Fault Diagnosis Based on Genetic Support Vector Machine and Gray Artificial Immune Algorithm. Proc. CSEE 2011, 31, 56–64. [Google Scholar]
  10. Tripathy, M.; Maheshwari, R.P.; Verma, H.K. Power transformer differential protection based on optimal probabilistic neural network. IEEE Trans. Power Del. 2010, 25, 102–112. [Google Scholar] [CrossRef]
  11. Ghoneim, S.S.M.; Taha, I.B.M.; Elkalashy, N.I. Integrated ANN-based proactive fault diagnostic scheme for power transformers using dissolved gas analysis. IEEE Trans. Dielectr. Electr. Insul. 2016, 23, 586–595. [Google Scholar] [CrossRef]
  12. Li, S.; Wu, G.; Gao, B.; Hao, C.; Xin, D.; Yin, X. Interpretation of DGA for transformer fault diagnosis with complementary SaE-ELM and arctangent transform. IEEE Trans. Dielectr. Electr. Insul. 2016, 23, 586–595. [Google Scholar] [CrossRef]
  13. Ghoneim, S.S.M. Intelligent Prediction of Transformer Faults and Severities Based on Dissolved Gas Analysis Integrated with Thermodynamics Theory. IET Sci. Meas. Technol. 2018, 12, 388–394. [Google Scholar] [CrossRef]
  14. Zhao, W.; Zhu, Y.; Zhang, X. Combinational Forecast for Transformer Faults Based on Support Vector Machine. Proc. CSEE 2008, 28, 14–19. [Google Scholar]
  15. Zhou, Q.; Sun, C.; Liao, R.J. Multiple Fault Diagnosis and Short-term Forecast of Transformer Based on Cloud Theory. High Volt. Eng. 2014, 40, 1453–1460. [Google Scholar]
  16. Liu, Z.; Song, B.; Li, E. Study of “code absence” in the IEC three-ratio method of dissolved gas analysis. IEEE Electr. Insul. Mag. 2015, 31, 6–12. [Google Scholar] [CrossRef]
  17. Song, E.; Soong, F.K.; Kang, H.G. Effective Spectral and Excitation Modeling Techniques for LSTM-RNN-Based Speech Synthesis Systems. IEEE Trans. Speech Audio Process. 2017, 25, 2152–2161. [Google Scholar] [CrossRef]
  18. Gao, L.; Guo, Z.; Zhang, H. Video captioning with attention-based lstm and semantic consistency. IEEE Trans. Multimed. 2017, 19, 2045–2055. [Google Scholar] [CrossRef]
  19. Zhao, J.; Qu, H.; Zhao, J. Towards traffic matrix prediction with LSTM recurrent neural networks. Electron. Lett. 2018, 54, 566–568. [Google Scholar] [CrossRef]
  20. Lin, J.; Sheng, G.; Yan, Y.; Dai, J.; Jiang, X. Prediction of Dissolved Gases Concentration in Transformer Oil Based on KPCA_IFOA_GRNN Model. Energies 2018, 11, 225. [Google Scholar] [CrossRef]
  21. Dai, J.J.; Song, H.; Sheng, G.H. Dissolved gas analysis of insulating oil for power transformer fault diagnosis with deep belief network. IEEE Trans. Dielectr. Electr. Insul. 2017, 24, 2828–2835. [Google Scholar] [CrossRef]
  22. Ma, M.; Sun, C.; Chen, X. Discriminative Deep Belief Networks with Ant Colony Optimization for Health Status Assessment of Machine. IEEE Trans. Instrum. Meas. 2017, 66, 3115–3125. [Google Scholar] [CrossRef]
  23. Beevi, K.S.; Nair, M.S.; Bindu, G.R. A Multi-Classifier System for Automatic Mitosis Detection in Breast Histopathology Images Using Deep Belief Networks. IEEE J. Transl. Eng. Health Med. 2017, 5, 1–11. [Google Scholar] [CrossRef] [PubMed] [Green Version]
  24. Karim, F.; Majumdar, S.; Darabi, H. LSTM fully convolutional networks for time series classification. IEEE Access 2017, 6, 1662–1669. [Google Scholar] [CrossRef]
  25. Zhang, Q.; Wang, H.; Dong, J. Prediction of Sea Surface Temperature Using Long Short-Term Memory. IEEE Geosci. Remote Sen. Lett. 2017, 14, 1745–1749. [Google Scholar] [CrossRef] [Green Version]
  26. Zhang, S.; Wang, Y.; Liu, M. Data-Based Line Trip Fault Prediction in Power Systems Using LSTM Networks and SVM. IEEE Access 2017, 6, 7675–7686. [Google Scholar] [CrossRef]
  27. Song, H.; Dai, J.; Luo, L.; Sheng, G.; Jiang, X. Power Transformer Operating State Prediction Method Based on an LSTM Network. Energies 2018, 11, 914. [Google Scholar] [CrossRef]
  28. Zhong, P.; Gong, Z.; Li, S. Learning to diversify deep belief networks for hyperspectral image classification. IEEE Geosci. Remote Sen. Lett. 2017, 55, 3516–3530. [Google Scholar] [CrossRef]
  29. Lu, N.; Li, T.; Ren, X. A deep learning scheme for motor imagery classification based on restricted boltzmann machines. IEEE Trans. Neural Syst. Rehabil. Eng. 2017, 25, 566–576. [Google Scholar] [CrossRef] [PubMed]
  30. Chen, Y.; Zhao, X.; Jia, X. Spectral–spatial classification of hyperspectral data based on deep belief network. IEEE J. Sel. Top. Appl. Earth Observ. 2015, 8, 2381–2392. [Google Scholar] [CrossRef]
  31. Taji, B.; Chan, A.D.C.; Shirmohammadi, S. False Alarm Reduction in Atrial Fibrillation Detection Using Deep Belief Networks. IEEE Trans. Instrum. Meas. 2018, 67, 1124–1131. [Google Scholar] [CrossRef]
Figure 1. (a) Basic recurrent neural network (RNN) network; (b) RNN expansion diagram.
Energies 11 01880 g001
Figure 2. Structure of long short-term memory (LSTM) gate unit.
Energies 11 01880 g002
Figure 3. Structure of LSTM gate unit.
Energies 11 01880 g003
Figure 4. Structure of deep belief network (DBN)s.
Energies 11 01880 g004
Figure 5. Flowchart of transformer running state prediction.
Energies 11 01880 g005
Figure 6. Methane gas concentration prediction results.
Energies 11 01880 g006
Figure 7. Relative percent error.
Energies 11 01880 g007
Figure 8. Comparison of classification results (a) DBN results; (b) SVM results; (c) BPNN results.
Energies 11 01880 g008aEnergies 11 01880 g008b
Figure 9. Relative percent error.
Energies 11 01880 g009
Table 1. Structure of LSTM gate unit.
IEC ratiosCH4/H2, C2H2/C2H4, C2H4/C2H6
Rogers ratiosCH4/H2, C2H2/C2H4, C2H4/C2H6, C2H6/CH4
Dornenburg ratiosCH4/H2, C2H2/C2H4, C2H2/CH4, C2H6/C2H2
Duval ratiosCH4/C, C2H2/C, C2H4/C, where C = CH4 + C2H2 + C2H4
gas concentration ratiosCH4/H2, C2H2/C2H4, C2H4/C2H6, C2H6/CH4, C2H2/CH4, C2H6/C2H2, CH4/C1, C2H2/C1, C2H4/C1, H2/C2, CH4/C2, C2H2/C2, C2H4/C2, C2H6/C2
where C1 = CH4 + C2H2 + C2H4, where C2 = H2 + CH4 + C2H2 + C2H4 + C2H6
Table 2. Gas Concentration Prediction Results.
Type of GasAverage Error (%)
LSTMGRNNDBNSVM
H21.895.012.486.77
CH40.263.931.784.01
C2H22.454.671.936.32
C2H41.452.982.055.94
C2H62.14.241.648.46
Table 3. Transformer running state prediction results.
MonthHLTMTHTPDLDHDFault Case Rate
May571301008.1%
June5305110011.7%
July49010200120.9%
August30228101051.6%
September21434100065%
October16337402074.2%