Fault Detection for Gas Turbine Hot Components Based on a Convolutional Neural Network
by
 ,
,
Jiao Liu
1, 
Jinfu Liu
1,*,
Daren Yu
1,*,
Myeongsu Kang
2,
Weizhong Yan
3,
Zhongqi Wang
1 and
Michael G. Pecht
2 
1
School of Energy Science and Engineering, Harbin Institute of Technology, Harbin 150001, China
2
Center for Advanced Life Cycle Engineering (CALCE), University of Maryland, College Park, MD 20742, USA
3
Machine Learning Lab, GE Global Research Center, Niskayuna, NY 12309, USA
*
Authors to whom correspondence should be addressed.
Energies 2018, 11(8), 2149; https://doi.org/10.3390/en11082149
Submission received: 4 August 2018
/
Revised: 11 August 2018
/
Accepted: 14 August 2018
/
Published: 17 August 2018
Abstract
:Gas turbine hot component failures often cause catastrophic consequences. Fault detection can improve the availability and economy of hot components. The exhaust gas temperature (EGT) profile is usually used to monitor the performance of the hot components. The EGT profile is uniform when the hot component is healthy, whereas hot component faults lead to large temperature differences between different EGT values. The EGT profile swirl under different operating and ambient conditions also cause temperature differences. Therefore, the influence of EGT profile swirl on EGT values must be eliminated. To improve the detection sensitivity, this paper develops a fault detection method for hot components based on a convolutional neural network (CNN). This paper demonstrates that a CNN can extract the information between adjacent EGT values and consider the impact of the EGT profile swirl. This paper reveals, in principle, that a CNN is a viable solution for dealing with fault detection for hot components. Based on the distribution characteristics of EGT thermocouples, the circular padding method is developed in the CNN. The sensitivity of the developed method is verified by real-world data. Moreover, the developed method is visualized in detail. The visualization results reveal that the CNN effectively considers the influence of the EGT profile swirl.
1. Introduction
Gas turbines are widely used as the main power source in many areas, such as aircraft, ships, oil and gas applications, and power generation. Reducing maintenance costs and increasing the availability of gas turbines are two essential issues for equipment owners [1,2]. Prognostics and health management (PHM) can solve these problems and ensure that gas turbines run safely and economically [3,4,5]. The hot components, including the combustion system and turbine, are the critical components of gas turbines. The hot components operate under the adverse environmental conditions of high temperature, high pressure, and high speed. Hot component failures often result in catastrophic accidents and very large economic losses. Fault detection plays an important role in PHM systems, and usually focuses on timely detection of faults and avoiding more serious losses. Therefore, fault detection for gas turbine hot components is particularly significant.
Exhaust gas temperature (EGT) provides the most relevant information about gas turbine hot component performance, so it is usually used to monitor gas turbine hot components. EGT is measured by several thermocouples distributed equally in the gas turbine exhaust section. All thermocouple readings are almost identical when the hot components are healthy, whereas some thermocouple readings are variable when the hot components malfunction. Hence, the EGT profile can be used for fault detection. The uniformity of the EGT profile indicates the health status of the hot components, and some typical indicators are presented, such as the temperature difference between EGT and the average EGT value [6,7], temperature difference between the maximum and the minimum EGT [8], maximum EGT [7,9], median EGT [7] and average EGT [7]. Excessive and sudden changes or consistent upward trends in the indicators mean the potential hot component problems. However, in practice, the operators have found this solution to lack adequate sensitivity. In other words, the hot components have been damaged seriously once the alarm is generated [10].
The methods above take advantage of discrepancies between different EGT values to detect faults. However, the hot component fault is not the only reason for EGT discrepancies. Different operating and ambient conditions also cause EGT discrepancies. Hot gas from the combustors is rotated by the turbine blades. The swirl angle changes depending on the operating and ambient conditions. Hence, the EGT profile swirls under different operating and ambient conditions, and the EGT profile swirl results in the EGT discrepancies. At the same time, the EGT profile scales under different operating and ambient conditions, which also causes the EGT discrepancies. It is difficult to detect the faults from these complex interference factors. Obviously, by simply monitoring the EGT discrepancies, the methods above cannot detect the faults as early as possible.
Therefore, many researchers have focused on the fault detection method of the hot components based on the EGT model [11,12,13,14,15,16,17,18,19,20,21]. A normality EGT model is built [11,12,13,14,15,16,17,18,19,20,21]. If the estimated EGT based on the model is different from the actual EGT, the abnormalities of the hot components are identified. The more accurate the model, the better the detection performance is. The model may be built either from some prior identification based on a set of training data (data-driven model) or from prior physical knowledge of the gas turbine (physical model).
Data-driven models usually use some data mining methods to learn the relationship between the measurable parameters and EGT. Song et al. [11] and Yılmaz [12] evaluated the relationship between EGT and operational parameters based on a multiple linear regression. An artificial neural network (ANN) is also usually used to build the EGT model [13,14]. Tarassenko et al. [13] presented an EGT model of normality based on an ANN and made use of the spatial correlations in the EGT profile. When a fault develops in one of the combustors, there is a local effect on the temperature profile; only a small number of contiguous thermocouples are significantly affected whilst the rest of the profile is largely unchanged. The model of normality was, therefore, constructed by learning the function relating the temperature values from the four thermocouples opposite it. Yan [15,16] took advantage of stacked denoising autoencoder to extract feature from EGT and used extreme learning machines (ELM) to detect abnormalities in combustors. Hierarchical clustering and self-organizing map neural networks were used for gas turbine pre-chamber burnout anomaly detection [17].
Some EGT physical models were also presented. Basseville et al. [18,19] presented an EGT physical model. In this model, the swirl angle was calculated based on gas turbine physical principles. There were some ideal hypotheses, and the size of the gas turbine need to be known. Medina et al. [20] presented an EGT model based on both basis function expansion and the Brayton cycle. The swirl angle was obtained based on an empirical function of the ambient temperature and the power generated, which was provided by the manufacturer. As a universal empirical function, it is insensitive to detect the hot component faults of a specific gas turbine. Liu et al. [21] presented an EGT model and two main factors affecting the EGT were considered, including the operating and ambient conditions, and the structure deviation of different combustors caused by processing and installation errors. However, the EGT profile swirl was not considered.
Although many EGT models were presented in previously works, the influence of EGT profile swirl on EGT values has not been well considered. Therefore, to further improve the sensitivity of fault detection for gas turbine hot components, the EGT model should be developed by considering the effect of the EGT profile swirl.
Convolutional neural network (CNN) are successfully used in pattern recognition and image processing [22,23,24]. A CNN, to the best of our knowledge, has not been used for gas turbine hot components PHM applications. A CNN is good at learning local features, and it is robust to the feature shift, scale, and distortion. The property of a CNN makes it a viable solution for dealing with the EGT profile problem. First, the abnormal information of the hot component is contained in several adjacent EGT values rather than all the EGT values. By perceiving local features and sharing weights, a CNN can exactly extract key information from adjacent EGT values. Second, the EGT profile swirl can be seen as the shift of the EGT profile. Since a CNN can ensure some degree of shift invariance, it can effectively discern the impact of the EGT profile swirl. In this paper, the influence of the EGT profile swirl on fault detection of the hot components is described. Furthermore, the reason why CNN is suitable for hot components fault detection is analyzed and visualized in detail. According to the distribution characteristics of EGT thermocouples, the circular padding method of CNN is developed. CNN is evaluated in the context of a real-world application of gas turbine hot component fault detection.
The remainder of this paper is organized as follows. Section 2 introduces the challenges of fault detection of gas turbine hot components and emphasizes the influence of the EGT profile swirl. Section 3 describes the theoretical background of CNN and analyzes the reason why CNN is suitable for hot component fault detection. Based on the distribution characteristics of gas turbine EGT thermocouples, the circular padding method of CNN is developed. The experimental results and visualization results are given in Section 4, and Section 5 concludes the paper.
2. Challenges of Fault Detection for Gas Turbine Hot Components
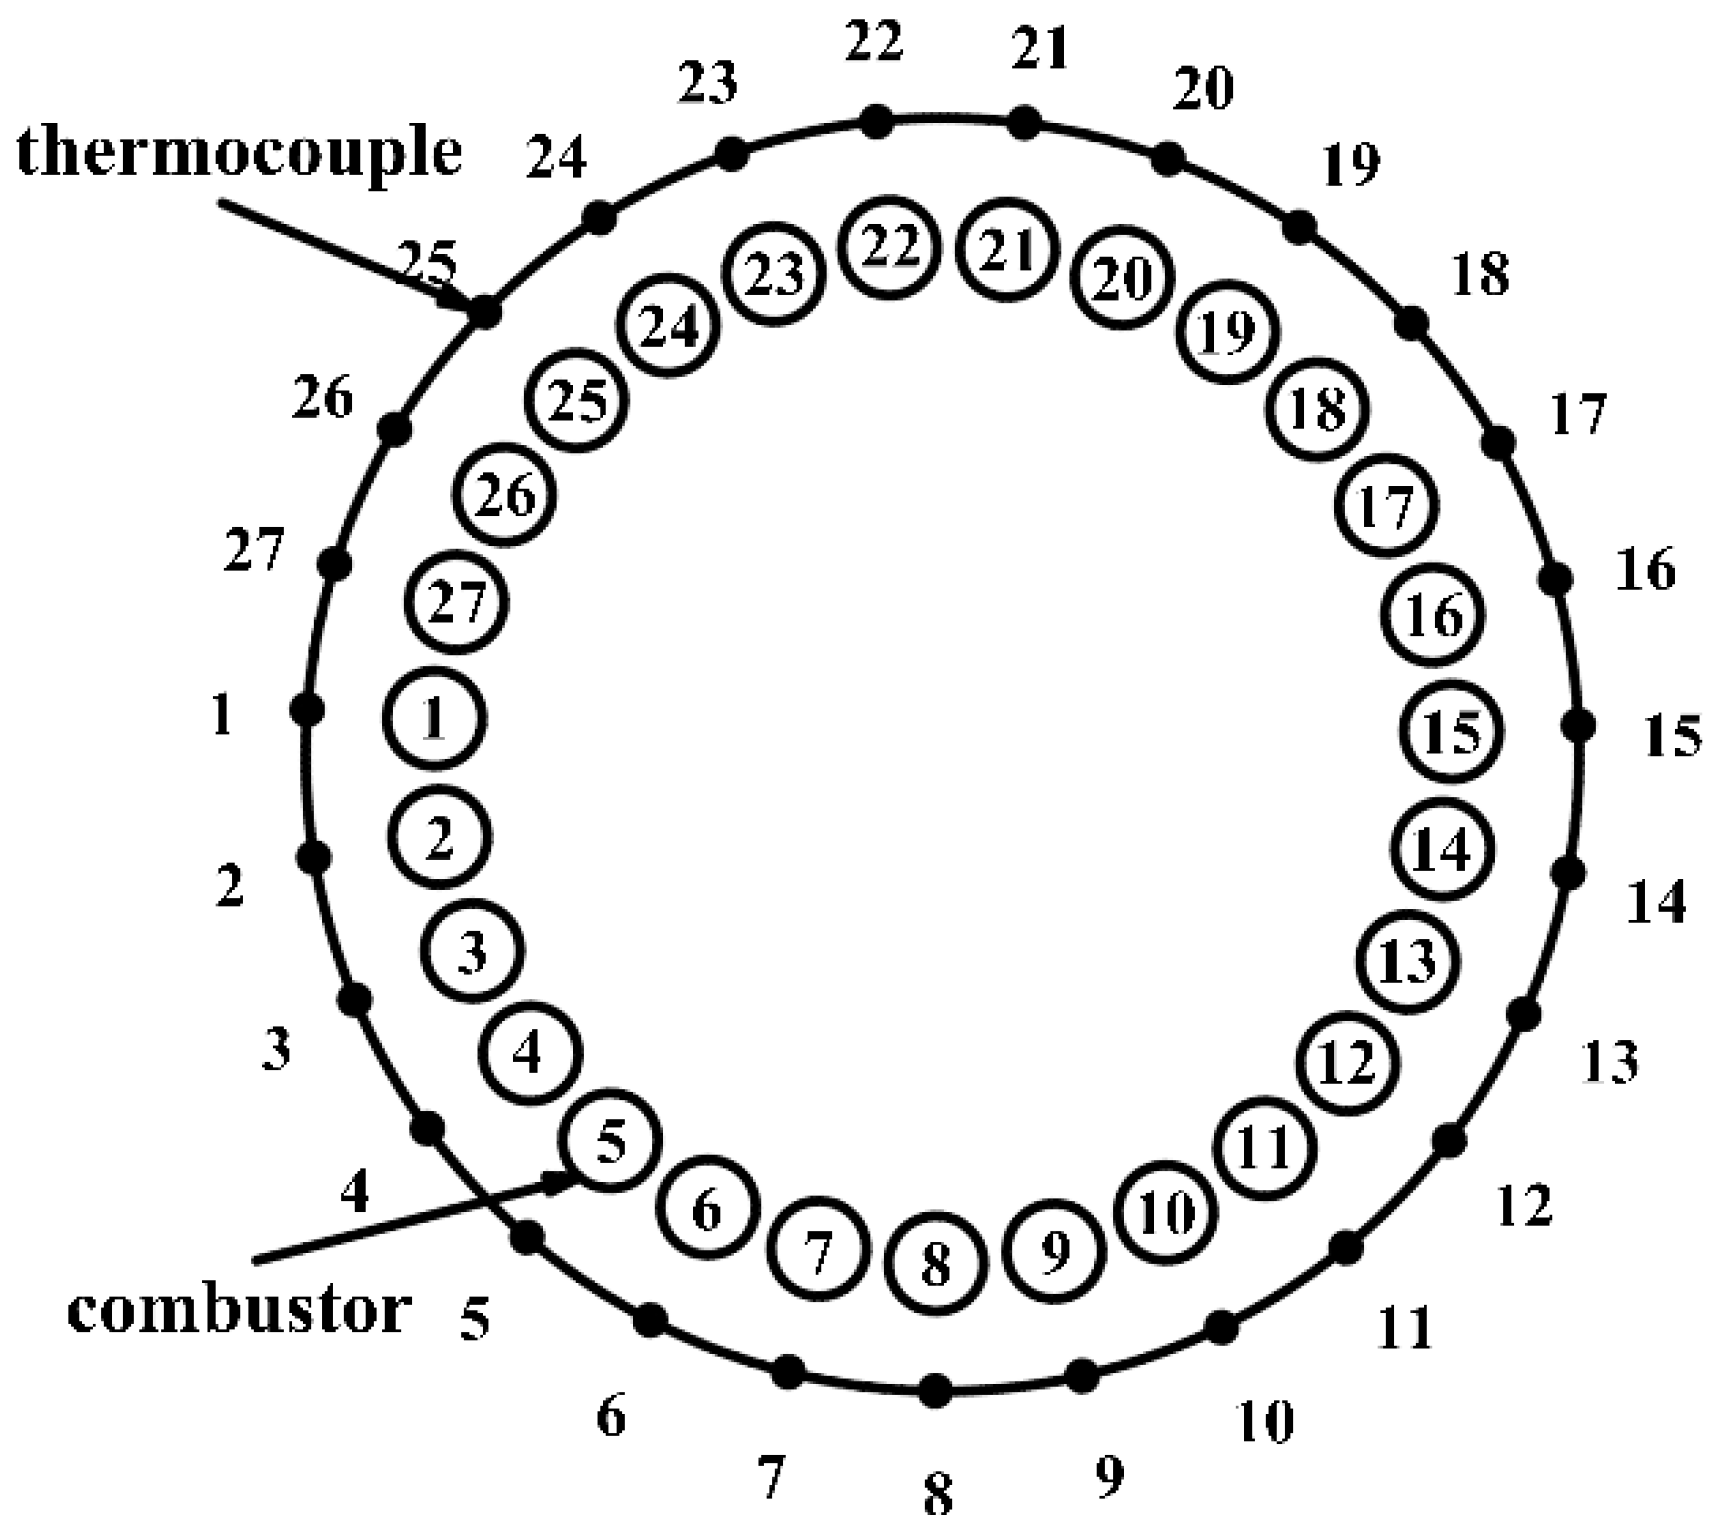
A typical gas turbine usually consists of three components—a compressor, a combustion system, and a turbine. EGT is a widely used parameter to monitor the performance of hot components. EGT is measured by several thermocouples distributed uniformly in the gas turbine exhaust section. Figure 1 describes the circumferential distribution of the combustors and thermocouples. As is known, the burning status of the combustors is almost same in the normal operation, and all the thermocouple readings are almost same. When the hot components are abnormal, some thermocouple readings would be different from the other thermocouple readings. Therefore, normal hot components result in a uniform EGT profile, while abnormal hot components give rise to an unequal EGT profile, as shown in Figure 2. The greater the temperature discrepancy between different thermocouple readings, the greater the possibility of the hot component faults.
However, the hot component fault is not the unique factor that causes the discrepancy between varying EGT values.
First, every EGT value changes with the operating and ambient conditions. All the EGT values increase or decrease at the same time, and it is shown that the EGT profile scaling under different operating and ambient conditions. In previous work [11,12,13,14,21], this factor was mainly discussed. In this paper, it will also be considered.
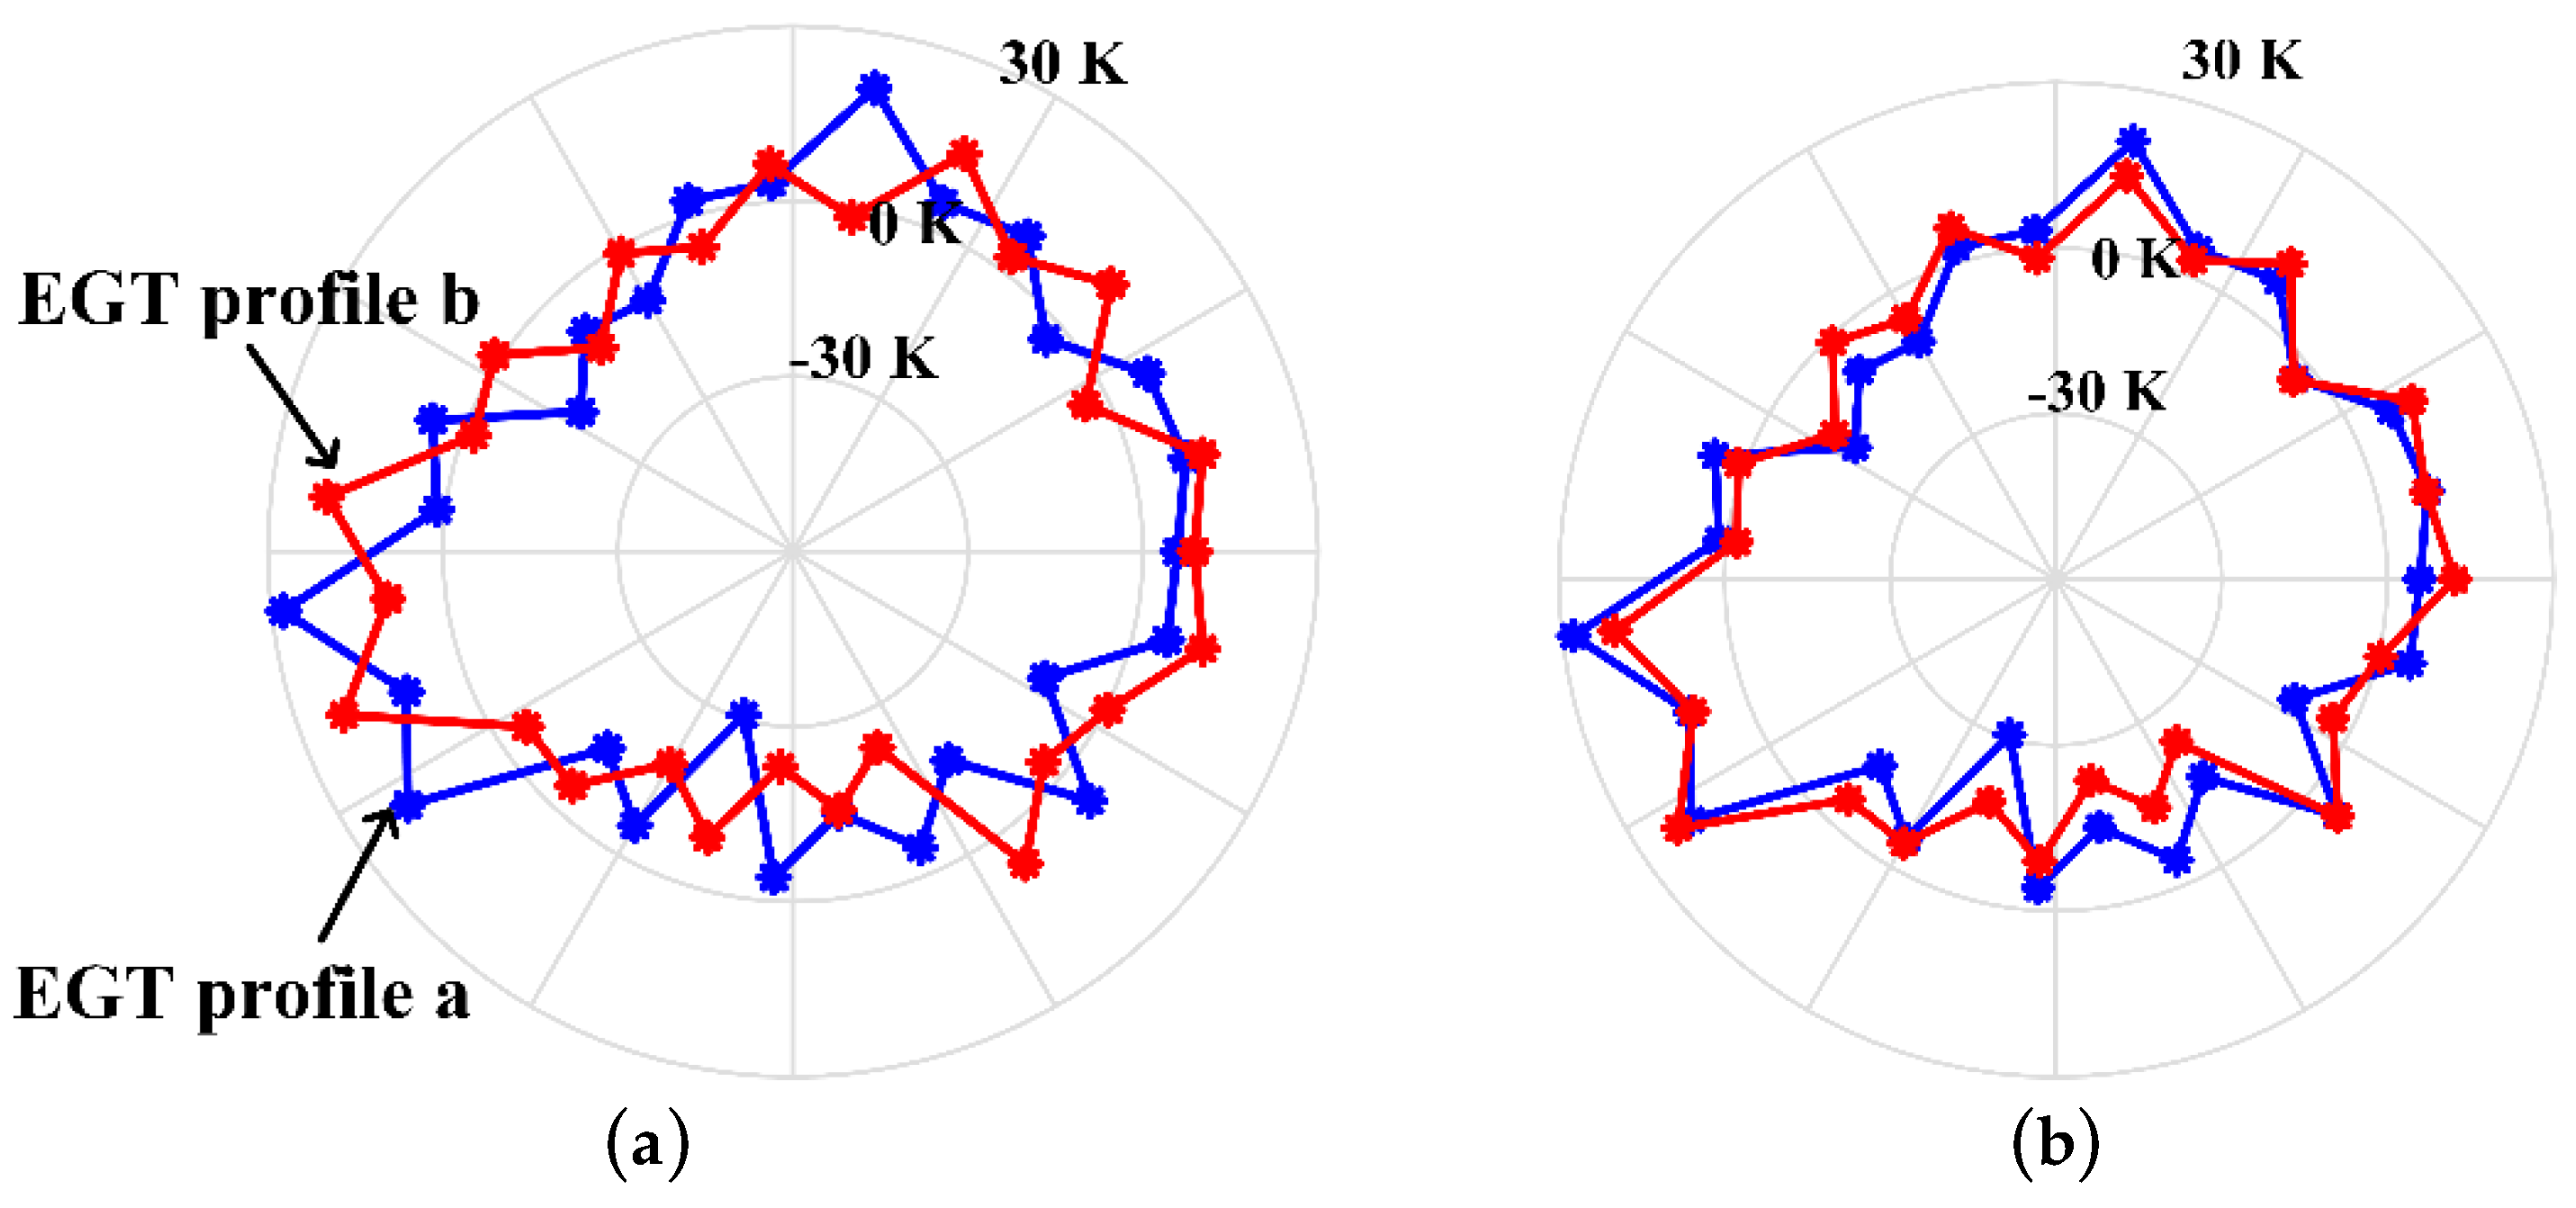
Second, the EGT profile also swirls under different operating and ambient conditions. The combustion system heats a mixture of air and fuel at very high temperature, and the hot gas from the combustors drives the turbine to rotate. Naturally, the hot gas is rotated by the turbine blades, as described in Figure 3. As a result, the thermocouple does not measure the temperature of the gas from the combustor at the same angular position. There is a swirl angle between the combustor and the thermocouple measuring the temperature of the hot gas from this combustor. The swirl angle depends on the operating and ambient conditions. Figure 4 illustrates the different EGT profiles under different power. The EGT profiles are shown after mean normalization to simply eliminate the EGT profile scaling caused by operating and ambient conditions. EGT profile a is measured at 121.56 MW of power, and EGT profile b is measured at 148.92 MW of power. The EGT profile swirls about one thermocouple when generated power is reduced from 148.92 MW to 121.56 MW. As depicted in Figure 5, the position of the thermocouples is fixed, and the EGT profile swirls under the operating and ambient conditions. It can be seen that the temperature discrepancies between different thermocouple readings could change.
In addition, the hot gas from different combustors mixes in the turbine, which reduces the amplitude of the EGT discrepancies compared with the temperature discrepancies at the exit from the combustors. Accordingly, the EGT discrepancies caused by the hot components’ faults would be very small.
The false alarm rate (FAR) and the missing alarm rate (MAR) are the two most critical evaluation indexes of fault detection. The detection threshold is small and the FAR will high, while the detection threshold is large and the MAR will high, as shown in Figure 6. As is analyzed, EGT discrepancies can be used as the fault detection indicator. However, different operating and ambient conditions can also cause the EGT discrepancy. The effect of the operating and ambient conditions is not only reflected in the EGT profile scaling, but also in the EGT profile swirl. At the early stage of the fault, the influence of the faults is even smaller than the influence of these factors. To avoid a high false alarm rate, the threshold should be set larger. This causes a high missing alarm rate, i.e., the fault cannot be detected as early as possible. Hence, the challenge of fault detection for hot components is determining how to eliminate the effects of different operating and ambient conditions on the EGT profile.
It should be mentioned that the operating points analyzed in this paper are that the start-up process of the gas turbine is completed and then the gas turbine runs stably under different operating and ambient conditions.
3. Developed Fault Detection Method for Gas Turbine Hot Components Based On a CNN
3.1. Theoretical Background of a CNN
A CNN is a multi-stage feed-forward artificial neural network that learns a hierarchical feature representation mechanism for input data with different levels of abstraction [25]. In each stage, a certain number of feature maps corresponds to a level of abstraction for features. The feature map consists of several neurons. Feature maps at different stages are connected by operations such as convolution, nonlinear activation, and pooling. Figure 7 shows a typical CNN architecture.
A CNN comprises three basic architectural concepts: local receptive fields, shared weights, and sub-sampling [26]. These concepts ensure CNN has some degree of scale, shift, and distortion invariance.
The first concept means each neuron (convolutional kernel) of the convolution layer perceives only the local area of the input rather than the global input. Due to local receptive fields, the elementary key features can be extracted, such as corners, end-points, and oriented edges in digit recognition. Then these elementary key features are combined by the subsequent layers to detect higher-order features.
The second indicates the convolutional kernel shares the same weights in feature maps at a certain stage. The input would be scanned sequentially by a signal convolutional kernel that has a local receptive field. Therefore, if the input is shifted, the output will be shifted by the same amount, but will be left unchanged otherwise. Mathematically, the j-th output feature map of a convolution layer is expressed as Equation (1):
where is the i-th input feature map, and is the j-th output feature map. is the convolutional kernel between and , and is the bias. The symbol is the convolutional operation. indicates the nonlinear activation function, ReLU activation is usually applied in a CNN, i.e., .
The third concept, sub-sampling, is commonly known as “pooling”. Pooling obtains a specific feature from every feature map. For example, in Equation (2), global average pooling [27] obtains the average value of the feature map , such as , whereas the feature map is separated into many non-overlapping regions, and max-pooling obtains the maximum value of each region, such as . As can be seen, the location of the extracted feature is eliminated after pooling. This is because the location is less important, once the elementary key features are detected. This property also ensures CNN is robust to the feature shifts.
3.2. Applicability of CNNs in Gas Turbine Hot Component Fault Detection
According to thermodynamic theory, the EGT is obtained as Equation (3):
where is the combustor outlet temperature, is turbine efficiency, is the expansion ratio, and k is the isentropic exponent. A gas turbine usually contains several combustors. Considering the hot gas mixing, the depends on the temperature of each combustor. Then, Equation (3) can be written as Equation (4):
where is the outlet temperature of the j-th combustor and is the exhaust gas temperature measured by the i-th thermocouple. indicates the influence of each combustor on . It is usually modeled as the normal distribution, as shown in Equation (5) and Figure 8 [24,28]. is the angular position of the j-th combustor, is the angular position of the i-th thermocouple, and A and are constant parameters that characterize the influence of the combustor.
Since the hot gas rotates in the turbine, the thermocouple does not measure the temperature of the gas from the combustor at the same angular position. The swirl angle is used to correct Equation (4). is related to the operating and ambient conditions. Finally, the expression for the EGT is shown as Equation (6):
Based on Equation (6), it can be seen that one combustor’s performance can affect several adjacent thermocouple readings. For illustration, Figure 9 shows a schematic diagram of the influence of the combustor outlet temperature on thermocouple readings. As can be seen, the abnormal information of the hot component is contained in several adjacent EGT values rather than all the EGT values. As stated earlier, one of the advantages of CNN is the ability to perceive local features. The CNN can extract the key information in several adjacent EGT values.
In addition, because of the rotation of the hot gas, the same combustors would affect the different thermocouples when the operating and ambient conditions change. That means the EGT profile swirls under different operating and ambient conditions. For example, the hot component fault causes a “cold zone” in the EGT profile, as shown in Figure 10. When the operating and ambient conditions change, the cold zone would present at a different angular position. The EGT profile swirl can be seen as the shift of some elementary key features. As stated earlier, the CNN extracts the elementary key features from the input. After pooling, the key feature does not contain the original location information. The CNN has the property of shift, scale, and distortion invariance. Therefore, a CNN can effectively consider the effect of EGT profile swirl.
In general, the faulty information of the hot component is included in the local EGT profile rather than the global EGT profile. The EGT profile swirl reflects the shift of some key features. The three basic architectural ideas, local receptive fields, shared weights, and pooling, ensure that the CNN is robust to the feature scale, shift, and distortion. Therefore, a CNN is suitable for detecting early faults in gas turbine hot components.
3.3. Improved CNN for Gas Turbine Hot Component Fault Detection
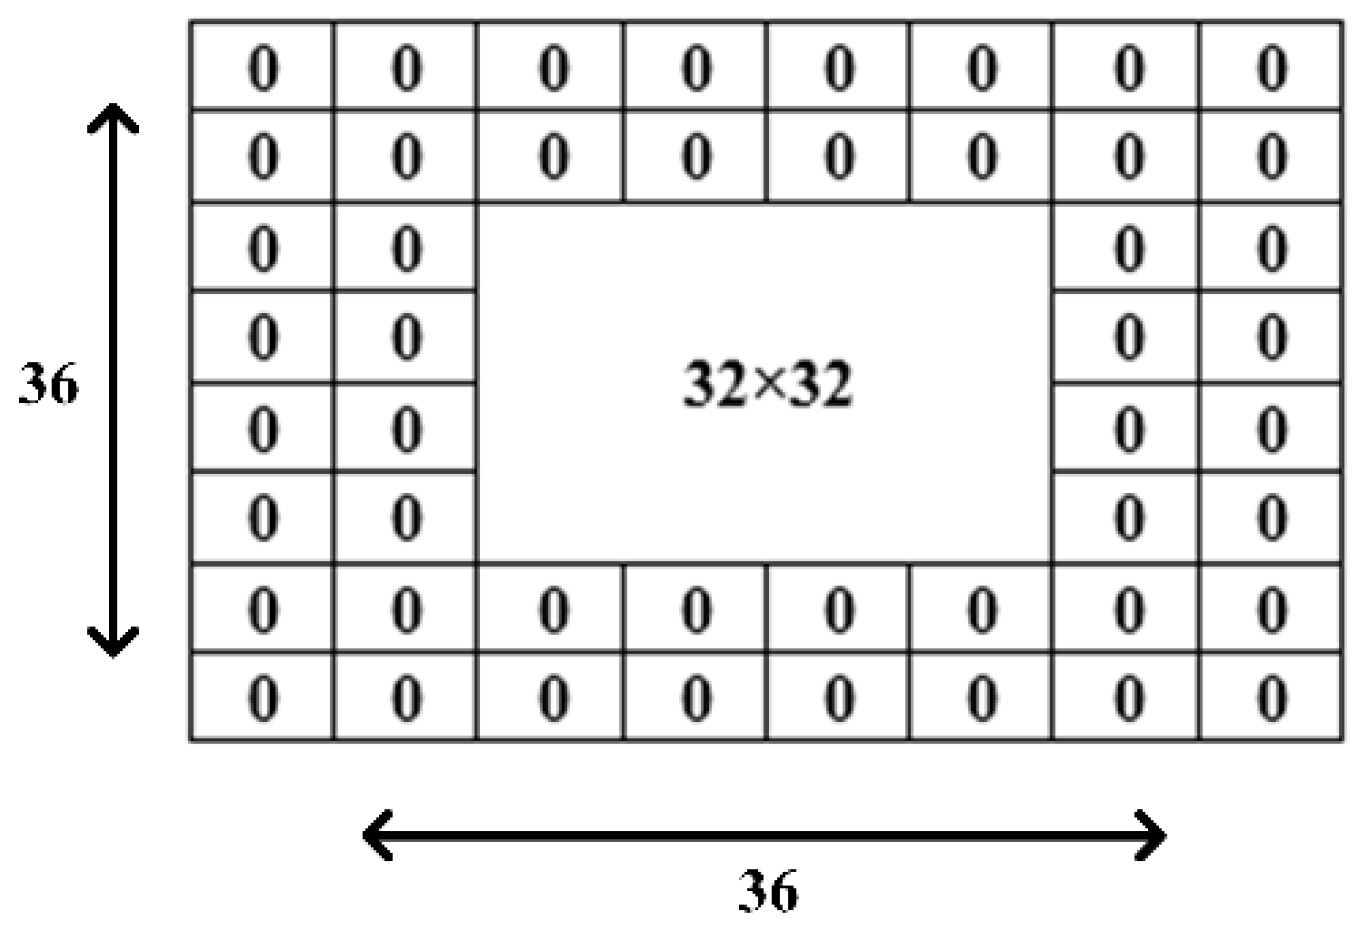
Convolutions are usually performed after padding the feature maps. Padding means adding some values to the edge of the input matrix. On the one hand, it can save the size of feature maps so that it is a useful way to increase the model depth. On the other hand, padding in feature maps can better use the border information of feature maps, which is beneficial for the detection performance. No-padding means there is no padding operation. A typical padding method in CNNs is zero-padding. In zero-padding, zeros are added to the edge of the input matrix, as shown in Figure 11. The EGT thermocouples are circumferentially distributed. Based on the distribution characteristics of EGT thermocouples, the circular-padding method is used to detect faults of gas turbine hot components in this paper, as shown in Figure 12. In circular-padding, the last EGT thermocouple readings are added to the front of the first EGT thermocouple readings, and the first EGT thermocouple readings are added to the back of the last EGT thermocouple readings. For example, of the 27 EGT thermocouples, 25th, 26th, and 27th thermocouple readings are added to the front of the first thermocouple reading. The circular-padding operation makes sure that the information between the first EGT thermocouple readings and the last EGT thermocouple readings is fully extracted.
4. Experiments
4.1. Data Description and Model Parameters Setup
The real operating data sampled once per minute come from the gas turbine running for three months. The gas turbine is used to generate electricity. The gas turbine has 27 combustors and 27 thermocouples to measure the EGT. The data come from the real operating gas turbine, and the measurement equipment are the 27 thermocouples distributed equally in the gas turbine exhaust section. Filtering out those data points corresponding to part operation condition (speed < 95%) results in 16,825 samples, of which 16,636 samples are normal and 189 samples are abnormal. The EGT profiles are shown after mean normalization.
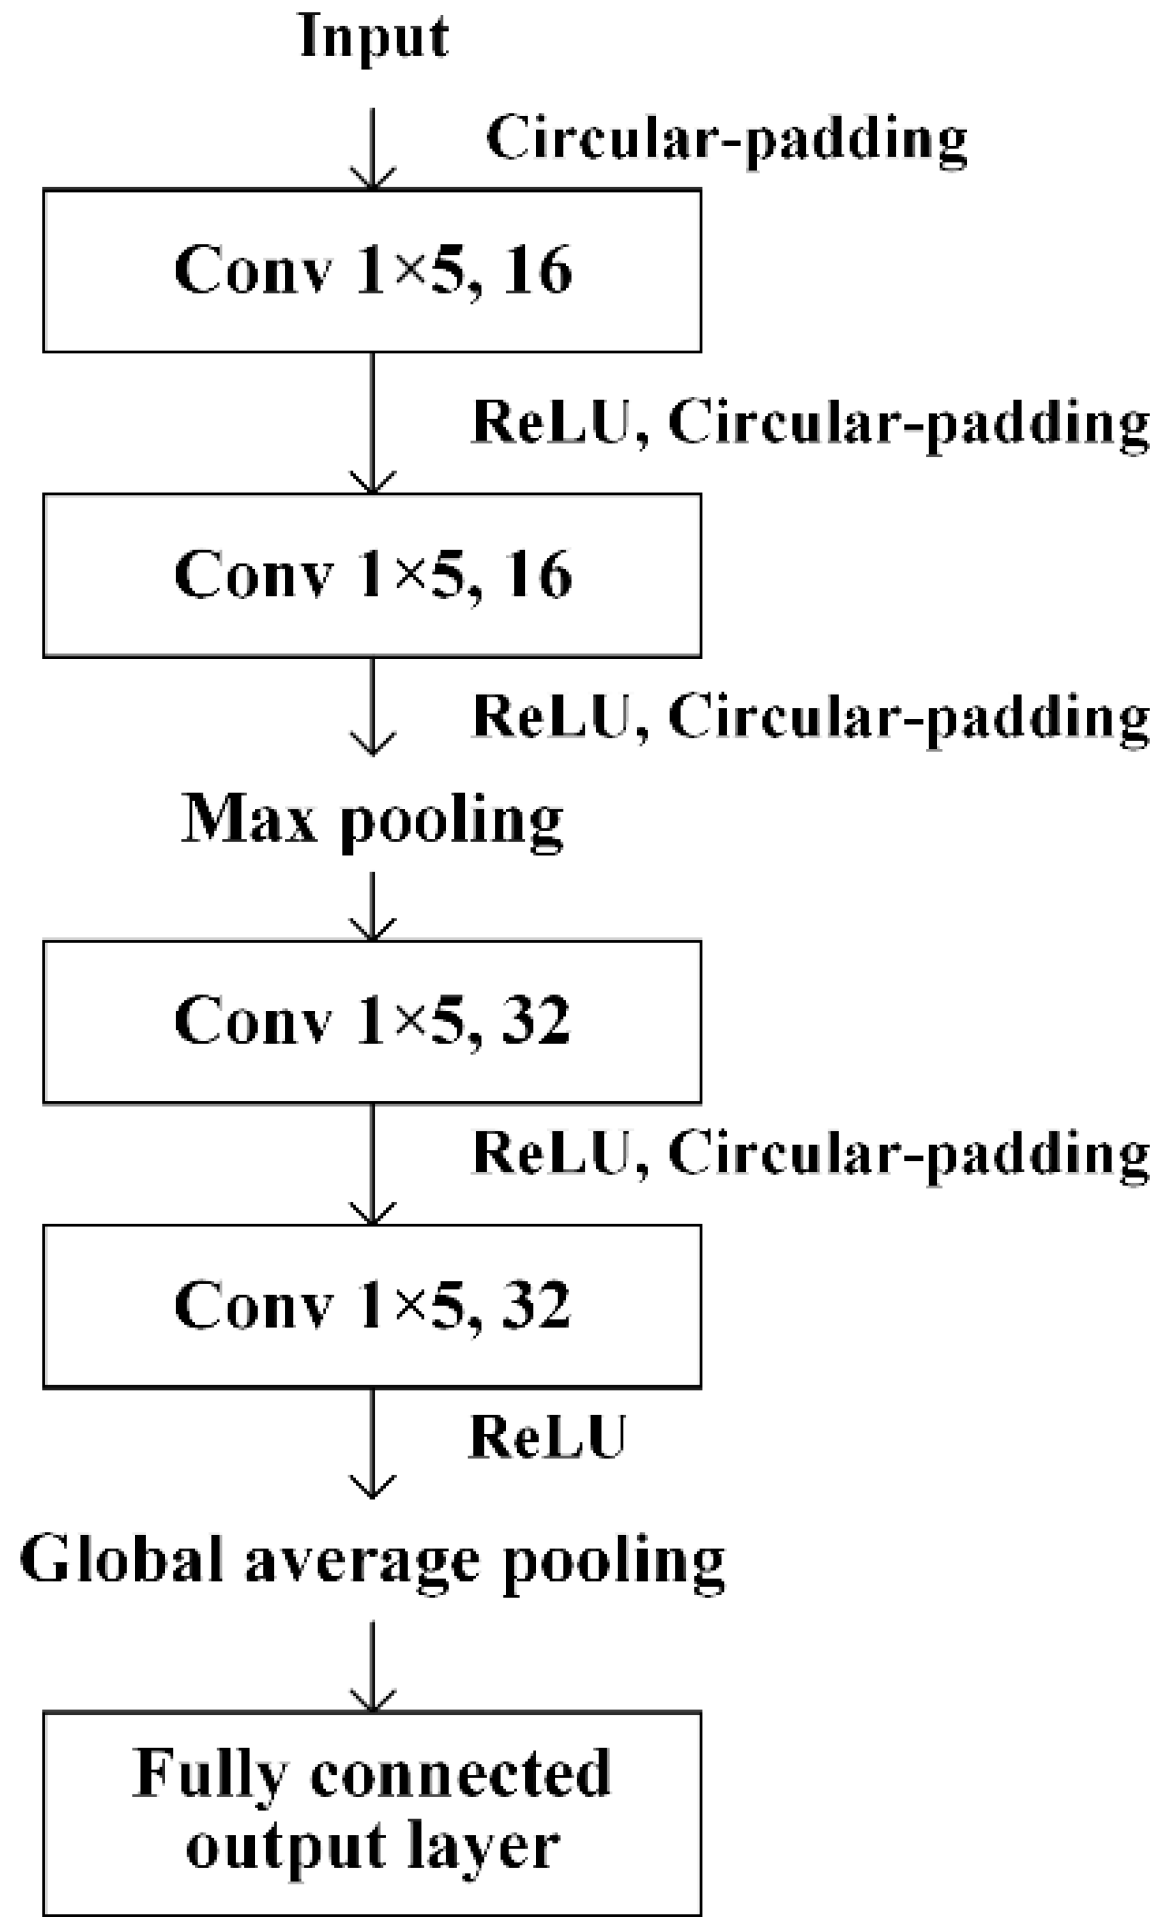
The CNN architecture is shown as Figure 13. Referring to some well-known CNN architectures [29,30] and cross-validation results, four convolution layers, one max-pooling layer, one global average pooling layer, and one fully-connected layer are used in this paper. The activation function for the convolution layers is the ReLu function, and the activation function for the fully connected layer is the softmax function. The filter size reflects the number of thermocouples affected by one combustor. Based on experience, the filter size is set to 1 × 5. Based on the cross-validation results, the filter number is 16 in the first two layers. After max pooling, the size of the feature map is half that of the original. Thus, the filter number is set to 32 in the last two layers. For the CNN design, this paper sets the parameters based on many empirical suggestions [30,31]. The learning rate is set to 0.1. The number of epochs for learning is 200. Momentum is used as a weight-updating strategy to accelerate the training process [32]. Usually, the momentum coefficient is recommended to be 0.9. L2 regularization is used as a strategy to overcome the overfitting problem [32]. The regularizer decay parameter is set to 0.0001.
4.2. CNN Detection Performance
ANN and ELM were the two most commonly used methods for building EGT model in previous works [13,14,15]. To evaluate the effectiveness of the CNN for hot component fault detection, the detection performance was compared between the ANN, ELM, and CNN. The model parameters were determined via cross-validation and empirical suggestions. For the ANN design, a three-layer ANN was used. The neural node number in the hidden layer was 20. The activation function for the hidden layer was the sigmoid function, and the activation function for the output layer was the purelin function. The learning rate was 0.1. The number of epochs for learning was 500. The ELM has one design parameter, the number of hidden neurons. Referring to [15], the number of hidden neurons was set to 1000.
The five-fold cross-validation was employed for model training and validation. The samples were randomly partitioned into five equal sizes subsamples. Of the five subsamples, a single subsample was retained as the validation data, and the remaining four subsamples were used as the training data. The training data was used to obtain the ANN, ELM, and CNN models. The validation data was used to evaluate the effectiveness of the three methods. The cross-validation process was then repeated five times, with each of the five subsamples used exactly once as the validation data. The detection result was the average of the five results. To obtain a more robust comparison, the five-fold cross-validation was run 10 times, each time with different random splitting of five folds of the data. The CNN, ANN and ELM were implemented in Python 3.6.
In this paper, accuracy (ACC), receiver operating characteristic (ROC) curves, and Matthews correlation coefficient (MCC) were used as the detection performance measure for comparison. MCC is defined as Equation (7) [33]:
Figure 14 shows one five-fold cross-validation comparison of ROCs for the three models. The CNN model performs better than the ANN and ELM models. To perform a quantitative comparison of the ROCs, the area under ROC curve (AUC) for each of the ROCs was calculated. The ACC and MCC for different models were also calculated. The means and the standard deviations of the ACCs, AUCs, and MCCs of 10 random runs for the three models are shown in Table 1. As described in Section 4.1, the dataset is seriously imbalanced, so the ACC does not clearly show the advantage of the CNN. However, from the means and standard deviations of MCC and AUC, it can be seen that the CNN model’s detection performance is significantly better than the ANN model and ELM model. The next section discusses why the CNN is better at detecting early faults in gas turbine hot components in detail.
4.3. Detection Visualization
A CNN is a black box model, and visualization can help us better understand how the CNN works well in the fault detection of gas turbine hot components.
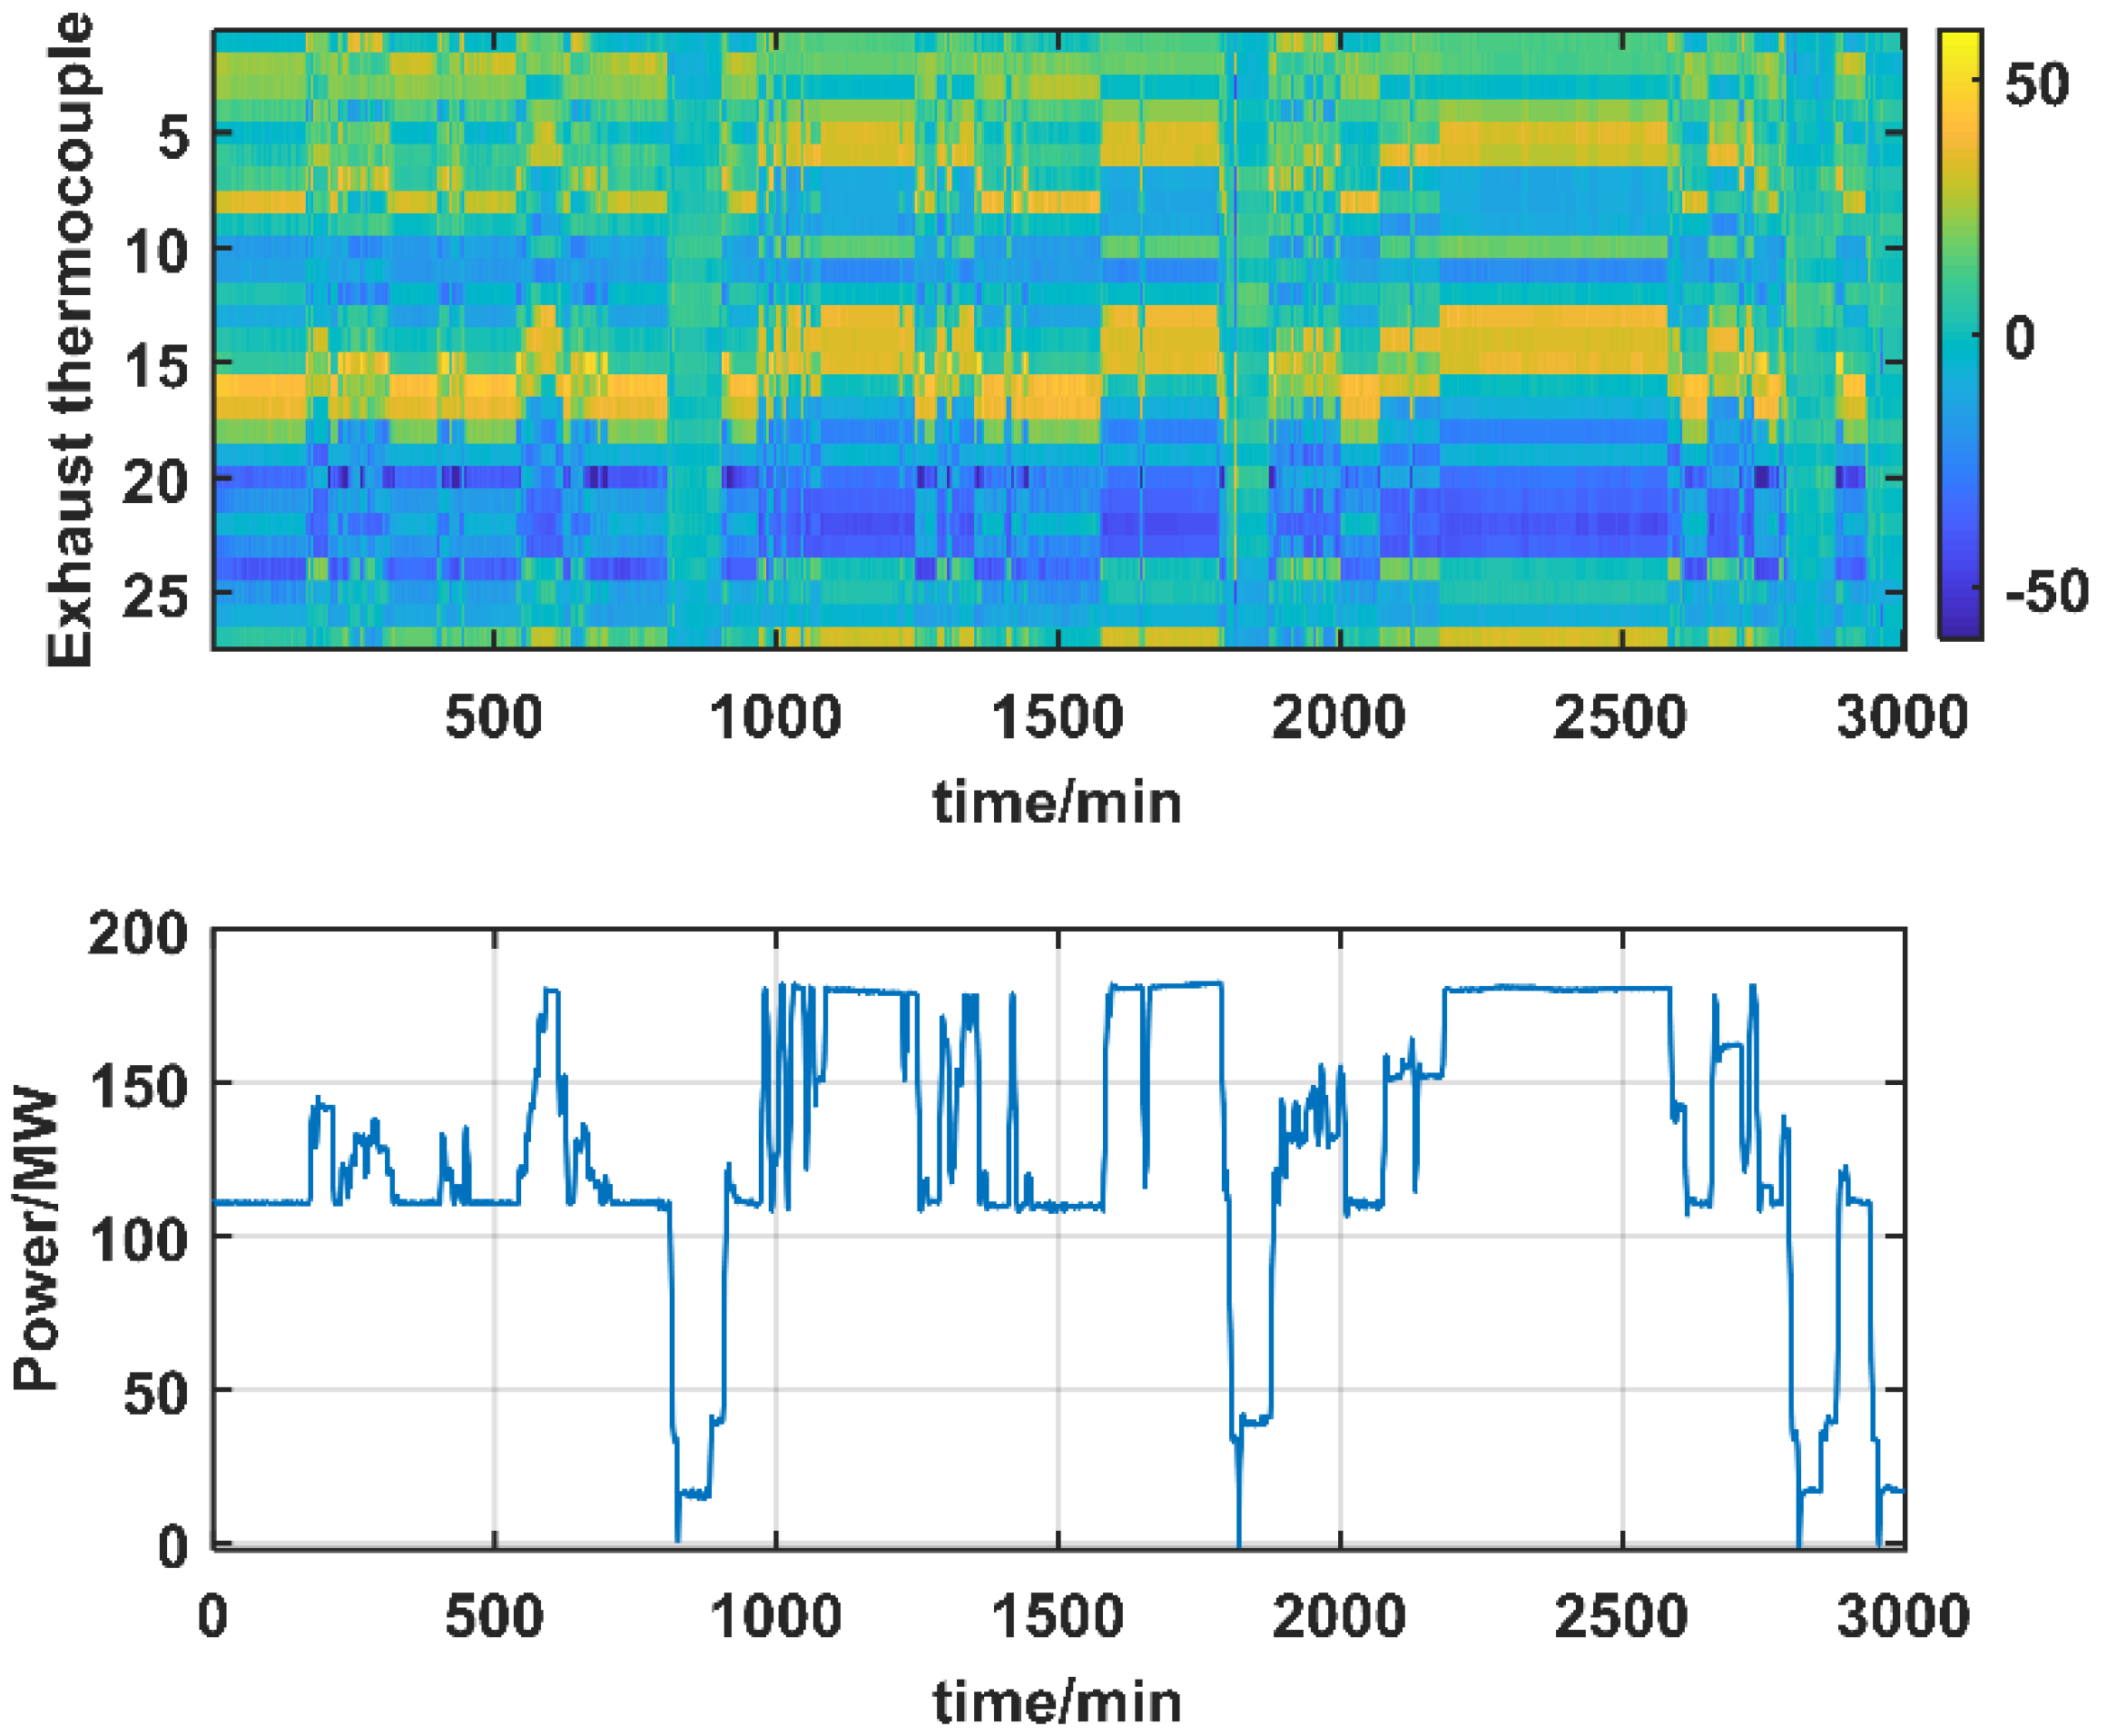
The EGT profile swirls with different operating and ambient conditions. The swirl angle will vary with the operating and ambient conditions. This phenomenon is clearly shown in Figure 15. The different colors indicate different EGT values. The higher the temperature, the brighter the color. Figure 15 shows the shift trend of the EGT profile is the same as that of power. For example, the generated power rises at about 550 min. At the same time, the location of the highest EGT value shifts from the 16th thermocouple to the 14th thermocouple. When the generated power drops to the original level, the location of the highest EGT value also comes back. The location of other EGT values shows a similar phenomenon. It should be noted that the speed and IGV angle remain basically constant during this time.
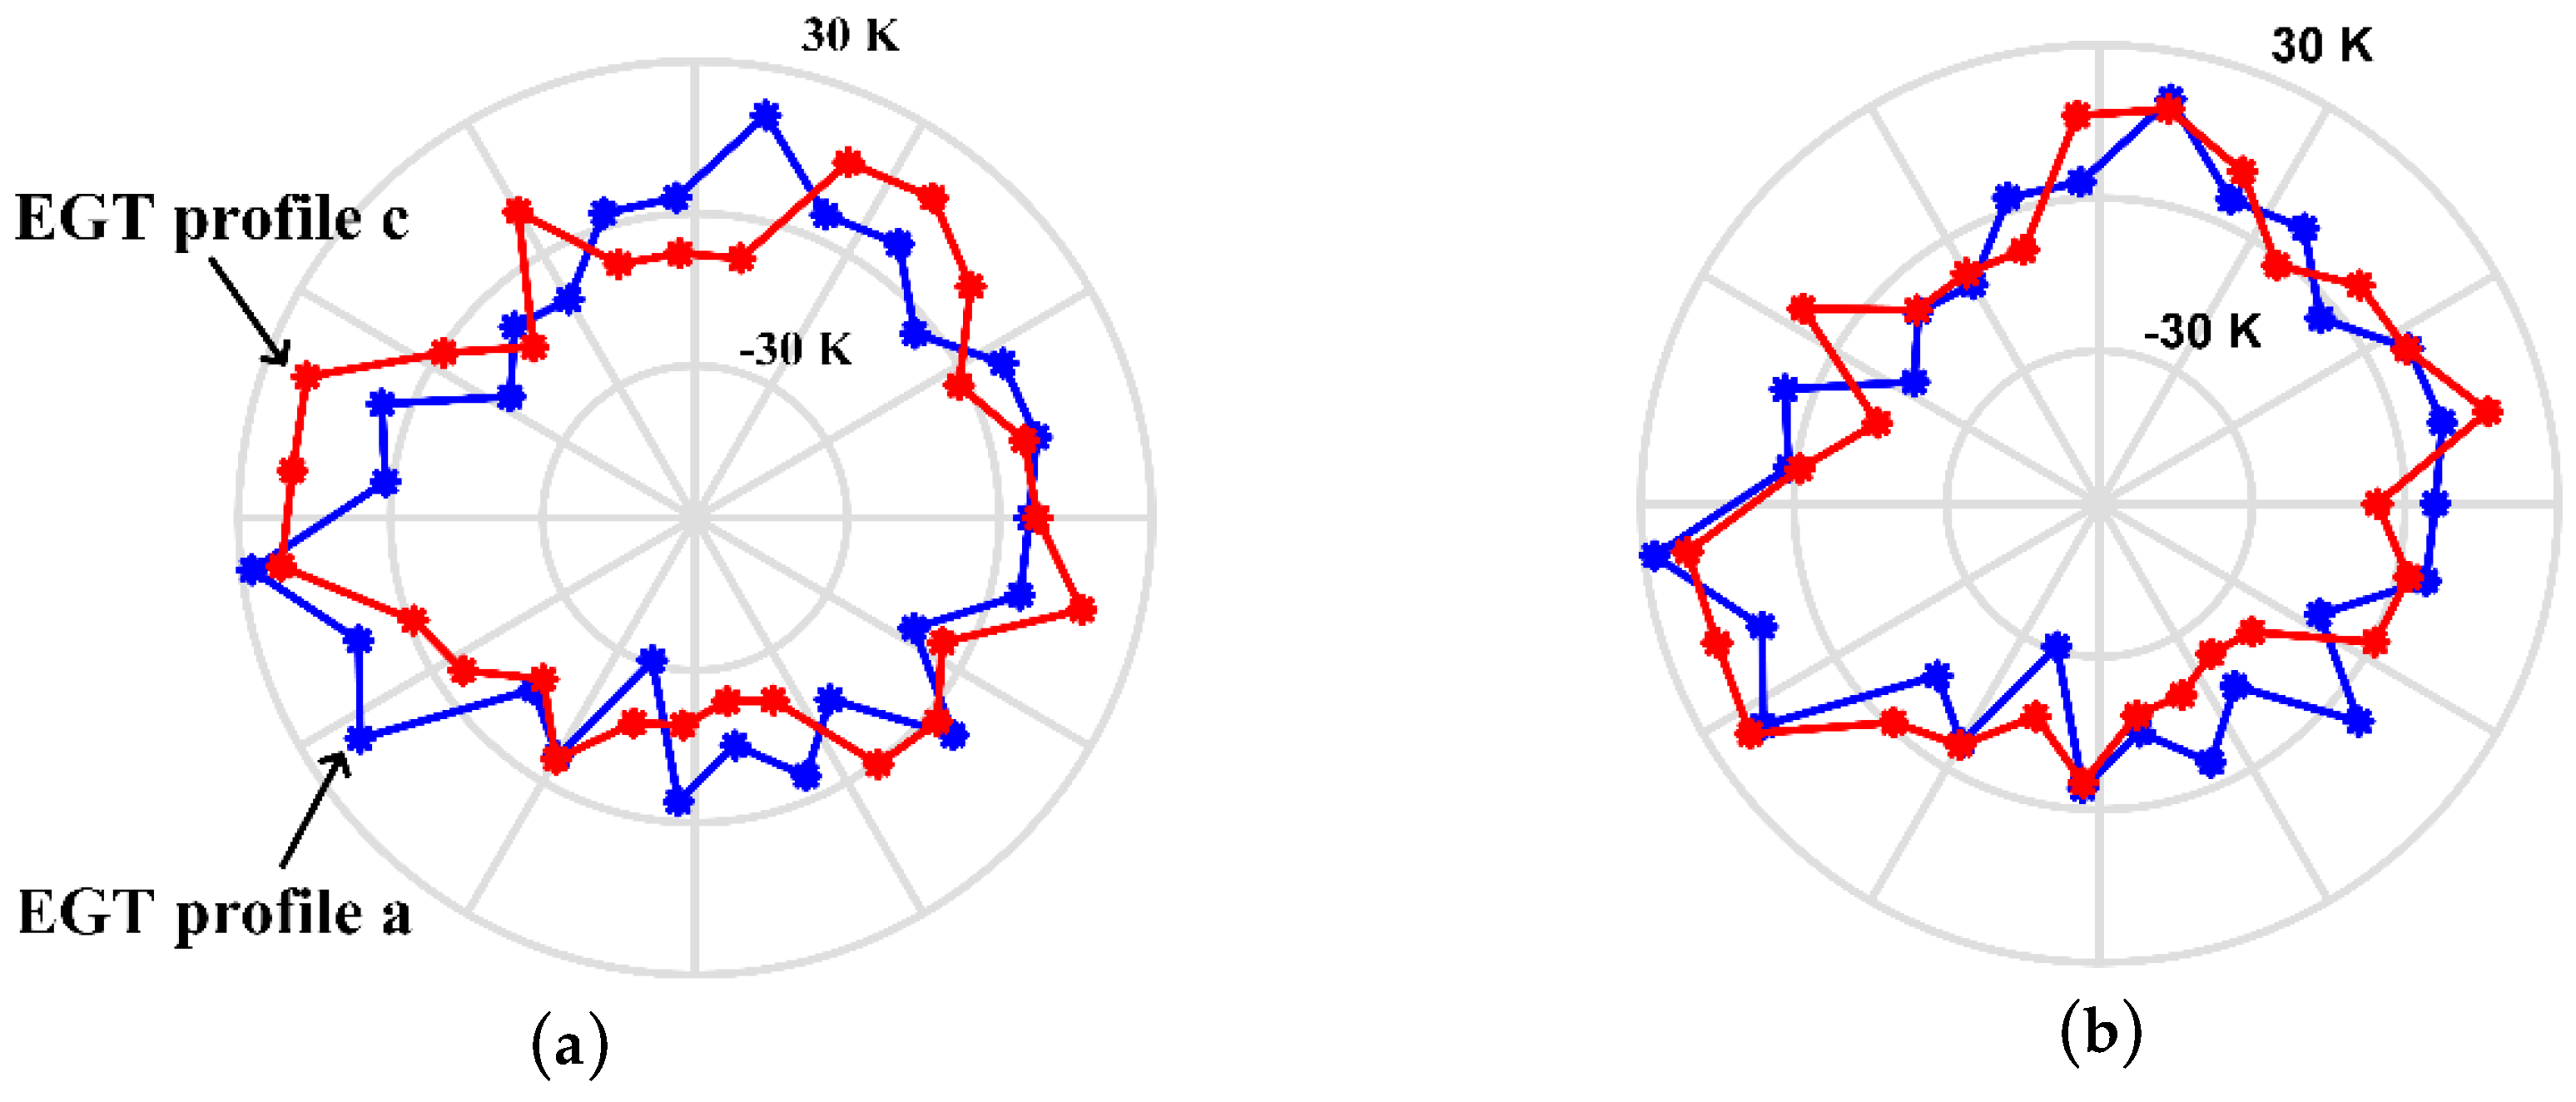
Figure 4 and Figure 16 show the specific example of the EGT profiles swirl under operating and ambient conditions. EGT profile a is measured under 121.56 MW, EGT profile b is measured under 148.92 MW, and EGT profile c is measured under 181.87 MW. The EGT profile swirls about one thermocouple when power is increased from 121.56 MW to 148.92 MW, and the EGT profile swirls about two thermocouples when power is increased from 121.56 MW to 181.87 MW. The EGT profiles a, b, and c are all measured under normal conditions. EGT profiles a, b, and c are examples to illustrate the CNN detection, and they are unfolded in Figure 17. The CNN architecture and model parameters are the same as in Section 4.1.
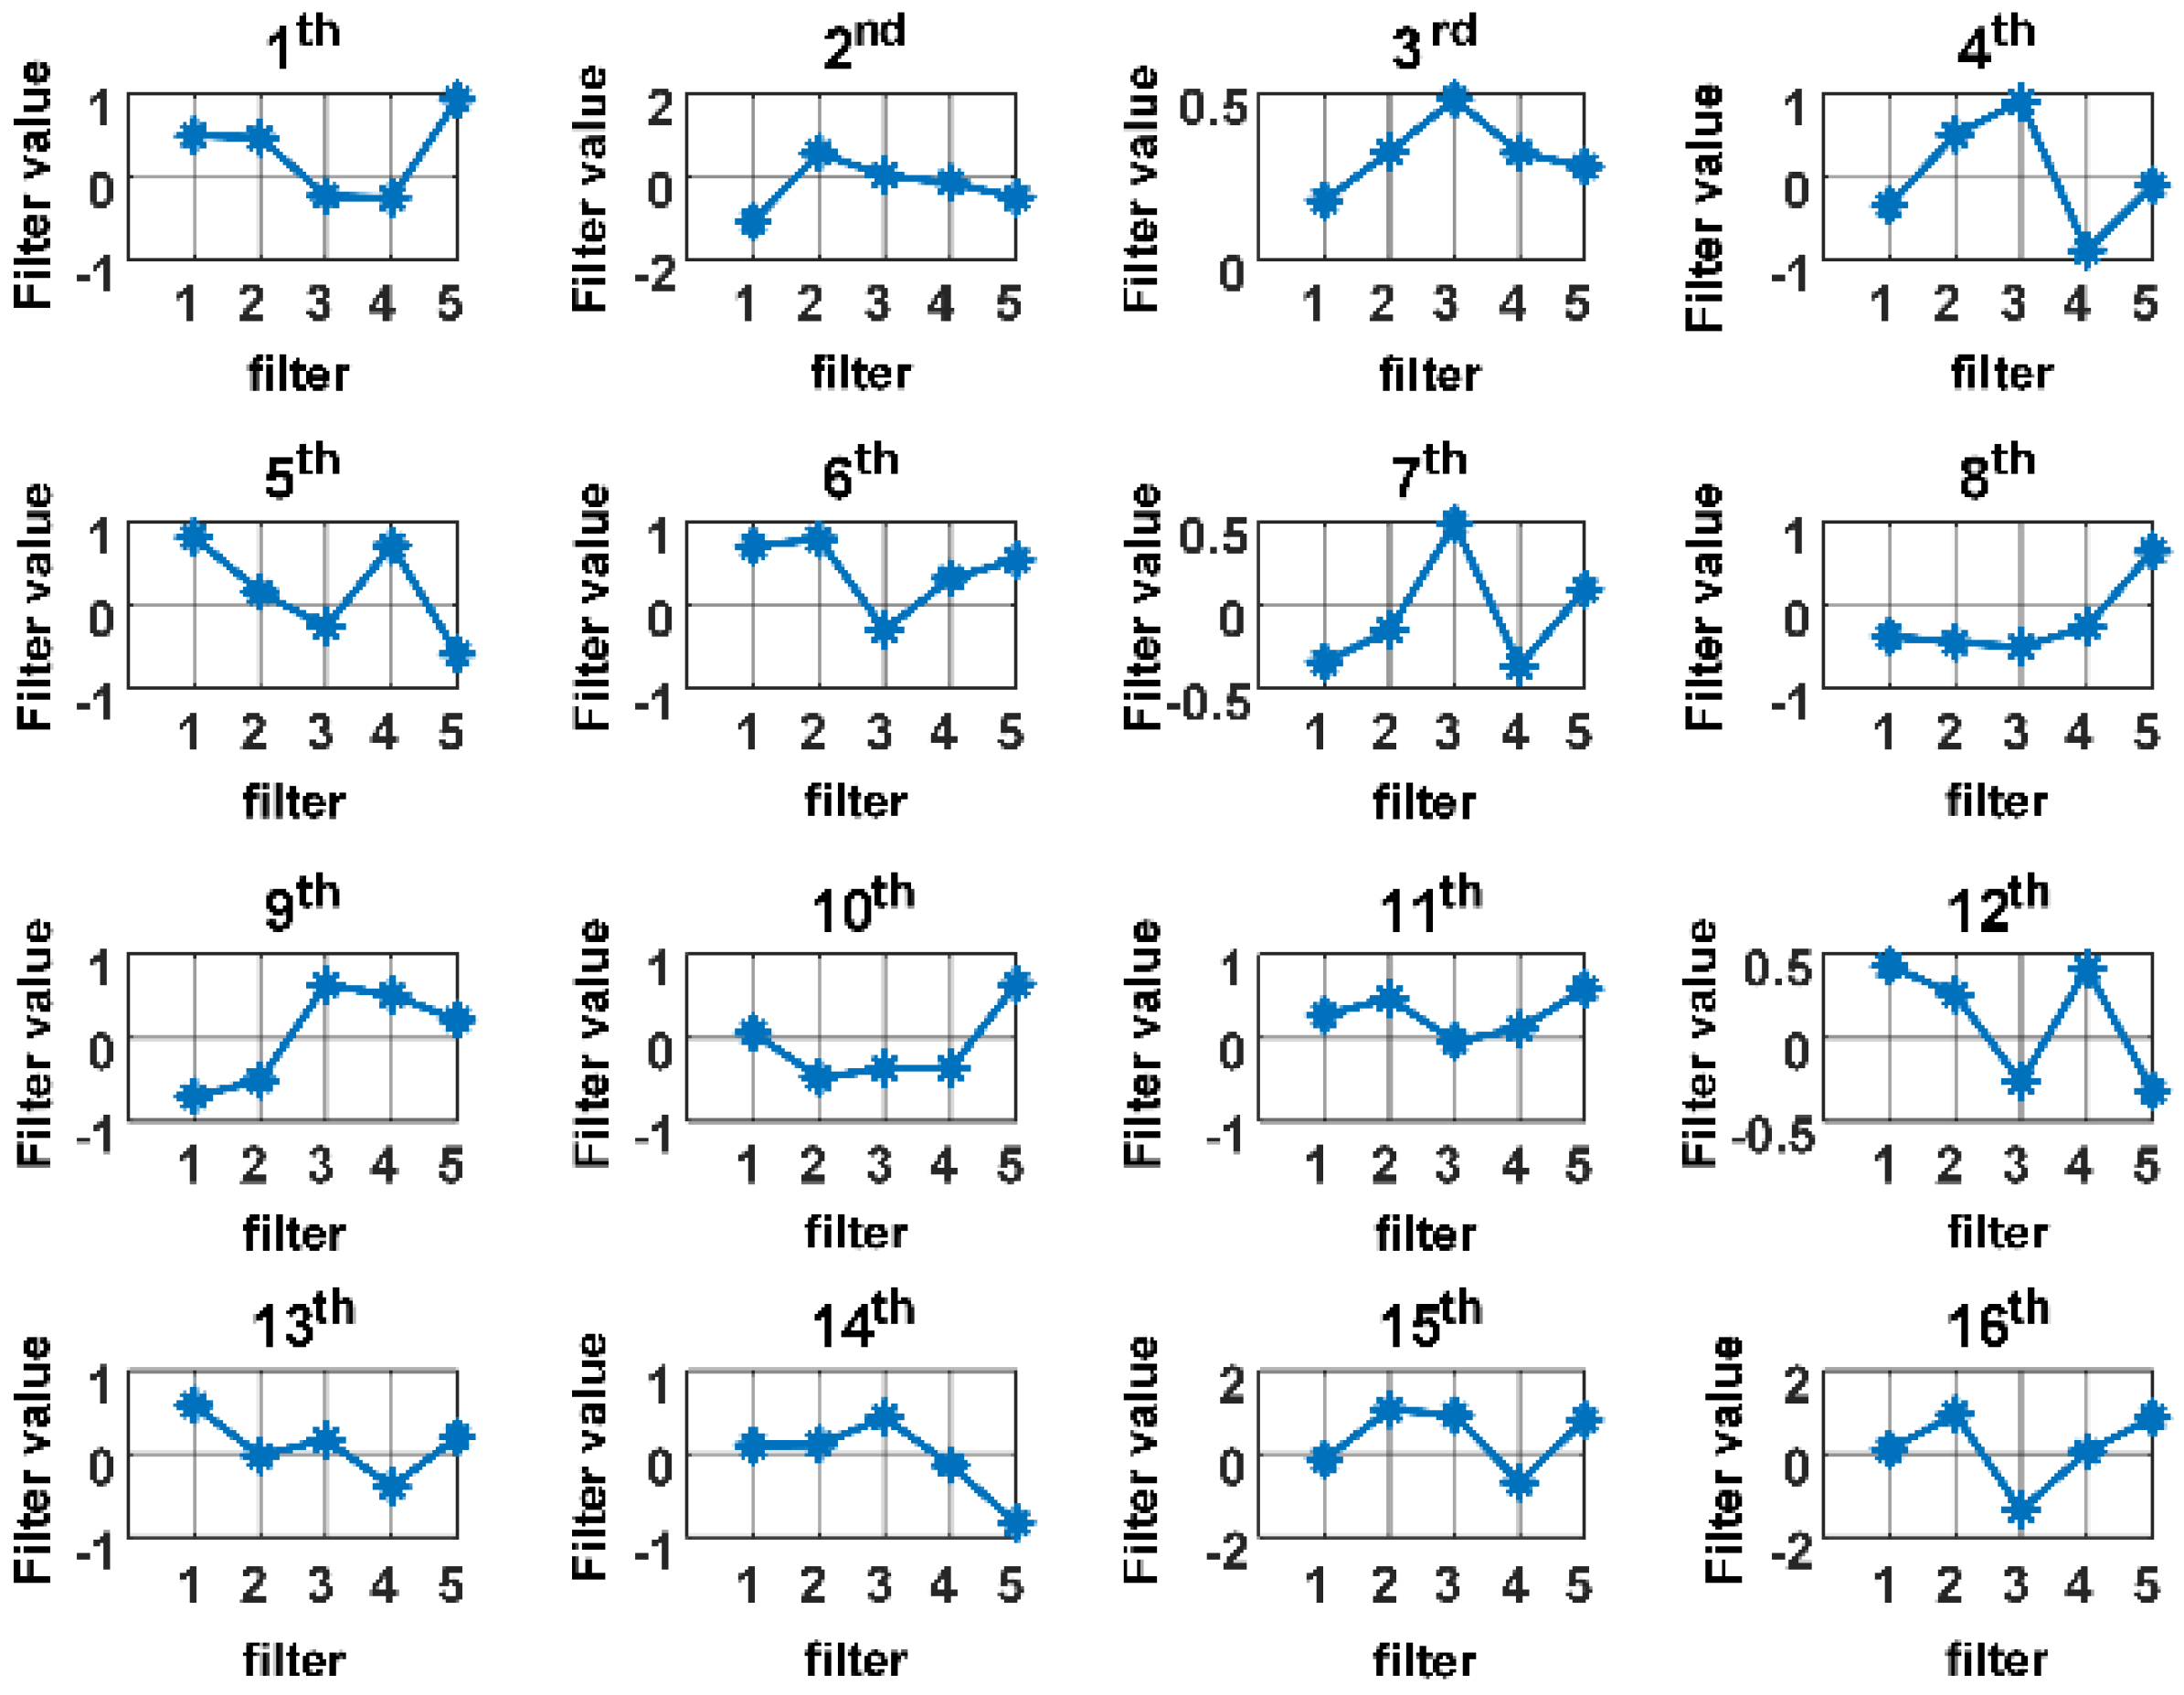
Figure 18 shows the 16 filters in the first convolution layer. The CNN extracts the features which can be used to distinguish between normal and abnormal classes. After the first convolution layer, the feature maps of EGT profiles a, b, and c can be seen in Figure 19. Different filters can be used to perceive different features. The feature extracted by the second filter is shown as an example. In the first EGT profile a, the feature mainly appears at the 22nd thermocouple. However, due to the swirl, the feature mainly appears at the 21st thermocouple in the second EGT profile b, and the feature mainly appears at the 20th thermocouple in the third EGT profile c. The other features also demonstrate similar phenomena. The results show that the effect of EGT profile swirl makes the key feature appear in different locations, and the convolution operation successfully perceives the key features.
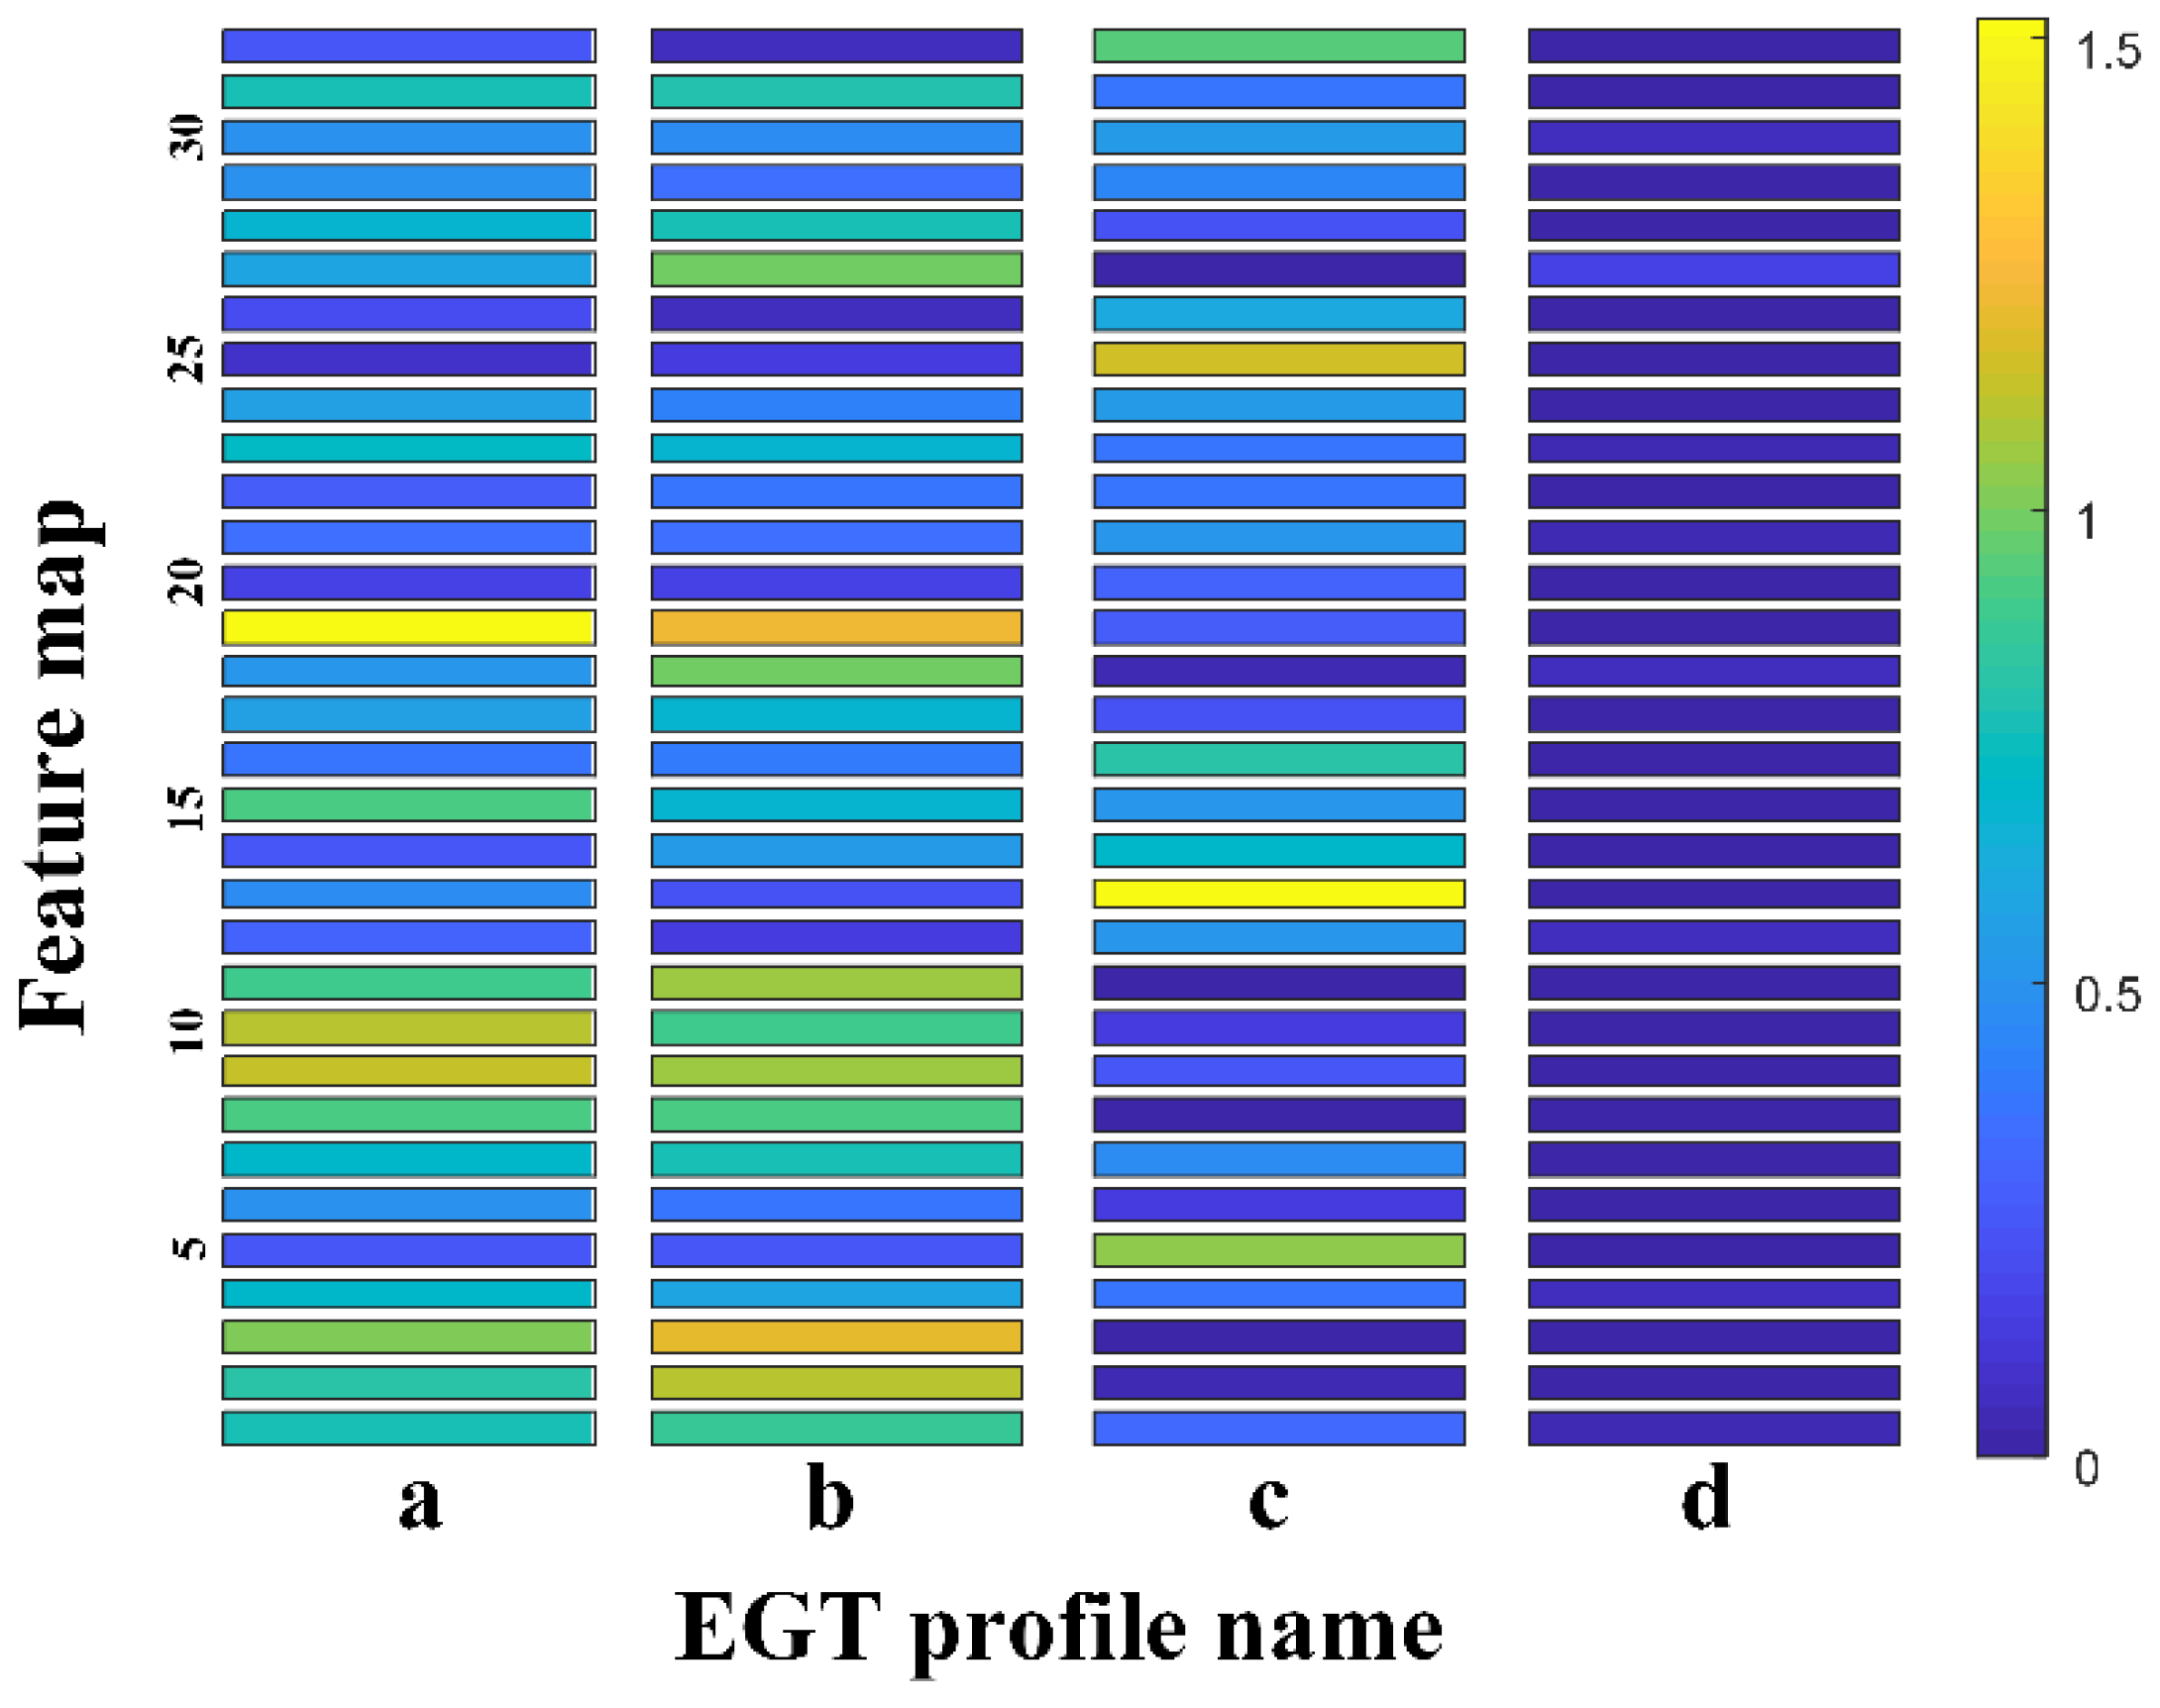
After the pooling layer, the location information of the key feature is eliminated. As long as the feature exists, it will be reflected in the final feature map. Figure 20 shows the feature map after the global average pooling layer. In the normal EGT profile, some key features can be perceived. However, no features have been detected in the abnormal EGT profile d (Figure 21), so CNN successfully judge EGT profile d as an anomaly. Therefore, the CNN can detect a specific feature wherever it appears in the EGT profile. The specific feature refers to the key feature used to distinguish between normal and abnormal classes. This is the reason why a CNN can solve the EGT profile swirl problem and improve the sensitivity of fault detection of gas turbine hot components.
4.4. Improvement in Circular-Padding
In this section, the detection results of three different padding methods were compared. The three padding methods are: no-padding, zero-padding, and circular-padding. The CNN architecture and model parameters are the same as in Section 4.1. The only difference is the padding method. A padding operation was used before every convolution operation. ACC, MCC, and AUC were used as the detection performance measure. As can be seen in Figure 22, padding in feature maps is useful for improving the detection performance. Zero-padding is not suitable for gas turbine hot component fault detection because it would introduce the wrong information on the border. The circular-padding method detects better than the other methods owing to the reasonable addition of the border information.
5. Conclusions
In this paper, a method used for fault detection of gas turbine hot components based on a CNN is developed. The hot component fault is not the unique factor that causes the discrepancy between varying EGT values. Different operating and ambient conditions can also cause the EGT discrepancy. To detect hot component faults as early as possible, and improve the detection performance, the key problem is how to eliminate the influence of various factors on the EGT profile. In this paper, the effect of the EGT profile swirl under different operating and ambient conditions is studied in detail.
It is found that the abnormal information is contained in several adjacent EGT values rather than the global EGT profile, and the EGT profile swirl reflects the shift of some key features. CNN which has the properties of local perception and shared weights could effectively extract the abnormal information from the EGT profile. Moreover, pooling operation eliminates the location information of the key features. Therefore, CNN is robust to the feature scale, shift, and distortion. These characteristics make CNN suitable for solving the problem caused by EGT profile swirl in the fault detection of gas turbine hot components. To fully extract the information in the EGT profile, according to the EGT thermocouples with circular distribution, this paper develops the circular-padding method in a CNN. In circular-padding, the last EGT thermocouple readings are added to the front of the first EGT thermocouple readings, and the first EGT thermocouple readings are added to the back of the last EGT thermocouple readings.
The experiment results on the real-world gas turbine data indicate that the fault detection for gas turbine hot components based on CNN is more accurate than the typical methods. The CNN visualization results explain the reason why CNN is suitable for hot components fault detection. It is proved that the effect of the EGT profile swirl is the key feature which can distinguish between normal and abnormal classes appear in different locations, and the convolution operation successfully perceives the key features. Then by the pooling operation, the position information of the key features is eliminated. Some key features can be perceived in the normal EGT profile, whereas no features can be detected in the abnormal EGT profile. CNN extracts the information between adjacent EGT values and eliminates the impact of EGT profile swirl. The experiment results also show that the circular-padding method is better than other typical padding methods.
Author Contributions
Conceptualization, J.L., J.F.L. and D.Y.; Methodology, J.L. and M.K.; Data Curation, W.Y.; Supervision, Z.W. and M.G.P.
Conflicts of Interest
The authors declare no conflict of interest.
Abbreviations
| EGT | Exhaust gas temperature |
| CNN | Convolutional neural network |
| PHM | Prognostics and health management |
| Static blade inlet velocity | |
| Static blade outlet velocity | |
| Moving blade outlet velocity | |
| Turbine speed | |
| Static blade outlet airflow angle | |
| Static blade outlet relative velocity angle | |
| Moving blade outlet airflow angle | |
| Moving blade outlet relative velocity angle | |
| FAR | False alarm rate |
| MAR | Missing alarm rate |
| Output feature map | |
| Bias | |
| Convolutional kernel | |
| Input feature map | |
| Combustor outlet temperature | |
| Exhaust gas temperature | |
| Expansion ratio | |
| Turbine efficiency | |
| Isentropic exponent | |
| Angular position of the i-th thermocouple | |
| Angular position of the j-th combustor | |
| Swirl angle of hot gas | |
| A | Amplitude of the function |
| Constant parameter that characterizes the influence of the combustor | |
| TP | True positive |
| TN | True negative |
| FP | False positive |
| FN | False negative |
| ACC | Accuracy |
| ROC | receiver operating characteristic |
| MCC | Matthews correlation coefficient |
| AUC | Area under ROC curve |
References
- Zaidan, M.A.; Relan, R.; Mills, A.R.; Harrison, R.F. Prognostics of Gas Turbine Engine: An Integrated Approach. Expert Syst. Appl. 2015, 42, 8472–8483. [Google Scholar] [CrossRef]
- Lu, F.; Jiang, C.; Huang, J.; Wang, Y.; You, X. A Novel Data Hierarchical Fusion Method for Gas Turbine Engine Performance Fault Diagnosis. Energies 2016, 9, 828. [Google Scholar] [CrossRef]
- Tahan, M.; Tsoutsanis, E.; Muhammad, M.; Karim, Z.A.A. Performance-Based Health Monitoring, Diagnostics and Prognostics for Condition-Based Maintenance of Gas Turbines: A Review. Appl. Energy 2017, 198, 122–144. [Google Scholar] [CrossRef]
- Lu, J.; Huang, J.; Lu, F. Sensor Fault Diagnosis for Aero Engine Based on Online Sequential Extreme Learning Machine with Memory Principle. Energies 2017, 10, 39. [Google Scholar] [CrossRef]
- Volponi, A.J. Gas Turbine Engine Health Management: Past, Present and Future Trends. J. Eng. Gas. Turbines Power-Trans. ASME 2014, 136, 051201. [Google Scholar] [CrossRef]
- General Electric Company. Heavy Duty Gas Turbine Monitoring & Protection; General Electric Company: Las Vegas, NV, USA, 2015. [Google Scholar]
- Miller, K.W.; Iasillo, R.J.; Lemmon, M.F. Method of Monitoring for Combustion Anomalies in A Gas Turbomachine and A Gas Turbomachine Including A Combustion Anomaly Detection System. U.S. Patent 20,150,267,591, 24 September 2015. [Google Scholar]
- Yu, L.; Jin, J. Study on Deflection Laws of 9FA Gas-Turbine Exhaust Temperature Field. Electr. Power Constr. 2009, 3, 26. [Google Scholar]
- Gulen, S.C.; Griffin, P.R.; Paolucci, S. Real-time on-line Performance Diagnostics of Heavy-duty Industrial Gas Turbines. J. Eng. Gas. Turbines Power-Trans. ASME 2002, 124, 910–921. [Google Scholar] [CrossRef]
- Liu, J. The Research for Exhaust Temperature Anomaly Detection in Gas Turbine. Master’s Thesis, Harbin Institute of Technology, Harbin, China, 2014. [Google Scholar]
- Song, Y.X.; Zhang, K.X.; Shi, Y.S. Research on Aeroengine Performance Parameters Forecast Based on Multiple Linear Regression Forecasting Method. J. Aerosp. Power 2009, 24, 427–431. [Google Scholar]
- Yılmaz, I. Evaluation of the relationship between exhaust gas temperature and operational parameters in CFM56-7B engines. Proc. Inst. Mech. Eng. Part G-J. Aerosp. Eng. 2009, 223, 433–440. [Google Scholar] [CrossRef]
- Tarassenko, L.; Nairac, A.; Townsend, N.; Buxton, I.; Cowley, Z. Novelty detection for the identification of abnormalities. Int. J. Syst. Sci. 2000, 31, 1427–1439. [Google Scholar] [CrossRef]
- Kenyon, A.D.; Catterson, V.M.; McArthur, S.D.J. Development of An Intelligent System for Detection of Exhaust Gas Temperature Anomalies in Gas Turbines. Insight 2010, 52, 419–423. [Google Scholar] [CrossRef]
- Yan, W.; Yu, L. On Accurate and Reliable Anomaly Detection for Gas Turbine Combustors: A Deep Learning Approach. In Proceedings of the 2015 Annual Conference of the Prognostics and Health Management Society, Austin, TX, USA, 18–22 October 2015. [Google Scholar]
- Yan, W. One-Class Extreme Learning Machines for Gas Turbine Combustor Anomaly Detection. In Proceedings of the 2016 International Joint Conference on Neural Networks (IJCNN), Vancouver, BC, Canada, 24–29 July 2016. [Google Scholar]
- Zhang, Y.; Bingham, C.; Garlick, M.; Gallimore, M. Applied Fault Detection and Diagnosis for Industrial Gas Turbine Systems. Int. J. Auto. Comput. 2017, 14, 463–473. [Google Scholar] [CrossRef]
- Basseville, M.; Benveniste, A.; Mathis, G.; Zhang, Q. Monitoring the combustion set of a gas turbine. IFAC Symp. Fault Detect. Superv. Saf. Tech. Process. SAFEPROCESS 1994, 1, 397–402. [Google Scholar] [CrossRef]
- Zhang, Q.; Basseville, M.; Benveniste, A. Early warning of slight changes in systems. Automatica 1994, 30, 95–113. [Google Scholar] [CrossRef]
- Medina, P.; Saez, D.; Roman, R. On Line Fault Detection and Isolation in Gas Turbine Combustors. In Proceedings of the ASME Turbo Expo 2008: Power for Land, Sea, and Air, Berlin, Germany, 9–13 June 2008. [Google Scholar]
- Liu, J.F.; Liu, J.; Wan, J.; Wang, Z.; Yu, D. Early Fault Detection of Hot Components in Gas Turbines. J. Eng. Gas. Turbines Power-Trans. ASME 2017, 139, 021201. [Google Scholar]
- Jin, K.H.; Mccann, M.T.; Froustey, E.; Unser, M. Deep convolutional neural network for inverse problems in imaging. IEEE Trans. Image Process. 2017, 26, 4509–4522. [Google Scholar] [CrossRef] [PubMed]
- Dong, C.; Chen, C.L.; He, K.; Tang, X. Image super-resolution using deep convolutional networks. IEEE Trans. Pattern Anal. Mach. Intell. 2016, 38, 295–307. [Google Scholar] [CrossRef] [PubMed]
- Luong, T.X.; Kim, B.K.; Lee, S.Y. Color Image Processing Based on Nonnegative Matrix Factorization with Convolutional Neural Network. In Proceedings of the 2014 International Joint Conference on Neural Networks (IJCNN), Beijing, China, 6–11 July 2014. [Google Scholar]
- Liu, Y.; Chen, X.; Peng, H.; Wang, Z. Multi-focus image fusion with a deep convolutional neural network. Inf. Fusion 2017, 36, 191–207. [Google Scholar] [CrossRef]
- Lecun, Y.; Bottou, L.; Bengio, Y.; Haffner, P. Gradient-based learning applied to document recognition. Proc. IEEE 1998, 86, 2278–2324. [Google Scholar] [CrossRef] [Green Version]
- Lin, M.; Chen, Q.; Yan, S. Network in network. arXiv, 2013; arXiv:1312.4400. [Google Scholar]
- Zhang, Q. Contribution à la Surveillance de Procédés Industriels. Ph.D. Thesis, University of Rennes 1, Rennes, France, 1991. [Google Scholar]
- Simonyan, K.; Zisserman, A. Very deep convolutional networks for large-scale image recognition. arXiv, 2014; arXiv:1409.1556. [Google Scholar]
- He, K.; Zhang, X.; Ren, S.; Sun, J. Deep Residual Learning for Image Recognition. In Proceedings of the 2016 IEEE Conference on Computer Vision and Pattern Recognition (CVPR), Seattle, WA, USA, 27–30 June 2016. [Google Scholar]
- He, K.; Zhang, X.; Ren, S.; Sun, J. Delving Deep into Rectifiers: Surpassing Human-Level Performance on ImageNet Classification. In Proceedings of the 2015 International Conference on Computer Vision (ICCV15), Santiago, Chile, 11–18 December 2015. [Google Scholar]
- Goodfellow, I.; Bengio, Y.; Courville, A. Deep Learning; MIT Press: Cambridge, MA, USA, 2016. [Google Scholar]
- Matthews, B.W. Comparison of the predicted and observed secondary structure of t4 phage lysozyme. Biochim. Biophys. Acta 1975, 405, 442–451. [Google Scholar] [CrossRef]
Figure 1.
Combustors and thermocouples distribution.

Figure 2.
Comparison between normal and abnormal operation.

Figure 3.
Rotation of hot gas in a turbine.

Figure 4.
EGT profiles swirl: (a) EGT profiles under different power; and (b) EGT profile b is manually rotated counter-clockwise for one thermocouple.
Figure 4.
EGT profiles swirl: (a) EGT profiles under different power; and (b) EGT profile b is manually rotated counter-clockwise for one thermocouple.

Figure 5.
The influence of EGT profile swirl on the EGT.

Figure 6.
Bayesian decision diagram.

Figure 7.
Typical CNN architecture.

Figure 8.
Function .

Figure 9.
Schematic diagram of the influence of the combustor outlet temperature on thermocouple readings.
Figure 9.
Schematic diagram of the influence of the combustor outlet temperature on thermocouple readings.

Figure 10.
Abnormal EGT profiles under different operating and ambient conditions.

Figure 11.
Zero-padding.

Figure 12.
Circular-padding.

Figure 13.
CNN architecture.

Figure 14.
ROC comparison.

Figure 15.
EGT profile swirl under different power.

Figure 16.
EGT profiles swirl: (a) EGT profiles under different power; and (b) EGT profile c is manually rotated counter-clockwise for two thermocouples.
Figure 16.
EGT profiles swirl: (a) EGT profiles under different power; and (b) EGT profile c is manually rotated counter-clockwise for two thermocouples.

Figure 17.
Unfolded EGT profiles.

Figure 18.
Filters in the first convolution layer.

Figure 19.
Feature map after the first convolution layer.

Figure 20.
Feature map after global average pooling.

Figure 21.
An abnormal EGT profile.

Figure 22.
Comparison of different padding methods.


Table 1.
Detection results for different models.
| Measures | ACC | MCC | AUC | |
|---|---|---|---|---|
| Models | ||||
| ANN | 0.994 ± 0.0016 | 0.709 ± 0.0866 | 0.808 ± 0.0920 | |
| ELM | 0.992 ± 0.0009 | 0.564 ± 0.0736 | 0.686 ± 0.0616 | |
| CNN | 0.998 ± 0.0007 | 0.927 ± 0.0347 | 0.999 ± 0.0014 | |
© 2018 by the authors. Licensee MDPI, Basel, Switzerland. This article is an open access article distributed under the terms and conditions of the Creative Commons Attribution (CC BY) license (http://creativecommons.org/licenses/by/4.0/).
Share and Cite
MDPI and ACS Style
Liu, J.; Liu, J.; Yu, D.; Kang, M.; Yan, W.; Wang, Z.; Pecht, M.G. Fault Detection for Gas Turbine Hot Components Based on a Convolutional Neural Network. Energies 2018, 11, 2149. https://doi.org/10.3390/en11082149
AMA Style
Liu J, Liu J, Yu D, Kang M, Yan W, Wang Z, Pecht MG. Fault Detection for Gas Turbine Hot Components Based on a Convolutional Neural Network. Energies. 2018; 11(8):2149. https://doi.org/10.3390/en11082149
Chicago/Turabian StyleLiu, Jiao, Jinfu Liu, Daren Yu, Myeongsu Kang, Weizhong Yan, Zhongqi Wang, and Michael G. Pecht. 2018. "Fault Detection for Gas Turbine Hot Components Based on a Convolutional Neural Network" Energies 11, no. 8: 2149. https://doi.org/10.3390/en11082149
Note that from the first issue of 2016, this journal uses article numbers instead of page numbers. See further details here.