Computational Fluid Dynamics Approach for Performance Prediction in a Zinc–Air Fuel Cell


1
Department of Vehicle Engineering, National Taipei University of Technology, Taipei 10608, Taiwan
2
Department of Energy and Refrigerating Air-Conditioning Engineering, National Taipei University of Technology, Taipei 10608, Taiwan
*
Author to whom correspondence should be addressed.
Energies 2018, 11(9), 2185; https://doi.org/10.3390/en11092185
Submission received: 26 July 2018
/
Revised: 9 August 2018
/
Accepted: 17 August 2018
/
Published: 21 August 2018
(This article belongs to the Section L: Energy Sources)
Abstract
:In this study, we investigated the development of a computational fluid dynamics (CFD) model for simulating the physical and chemical processes in a zinc (Zn)–air fuel cell. Theoretically, the model was based on time-dependent, three-dimensional conservation equations of mass, momentum, and species concentration. The complex electrochemical reactions occurring within the porous electrodes were described by the Butler–Volmer equation with velocity, pressure, current density, and electronic and ionic phase potentials computed in electrodes. The Zn–air fuel cell for the present study comprised of four major components, such as a porous Zn anode electrode, air cathode electrode, liquid potassium hydroxide (KOH) electrolyte, and air flow channels. The numerical results were first compared with the experiments, showing close agreement with the predicted and experimental values of the measured voltage–current data of a single Zn–air fuel cell. Numerical results also exhibited mass fraction contours of oxygen (O2) and zinc oxide (ZnO) in the mid-cross-sectional plane. A parametric study was extended to assess the performance of a Zn–air fuel cell at various cathode and electrolyte parameters.
1. Introduction
In order to meet the increasing requirements of reduced emissions and higher energy demand, there has emerged a need for exploiting metal–air batteries as important alternatives to conventional power sources [1]. Extensive endeavors have been made to develop the process of generating electricity by directly converting chemical energy in metals to electrical power. Compared to other metal–air-based batteries, Zn is considered the best due to the following benefits over other metals: low equilibrium potential with respect to hydrogen, relatively long-term stability in aqueous electrolytes, electrochemical reversibility, high volumetric energy density, environmentally friendly nature, cost-effective production, and ease of storage and handling [2,3]. These merits render Zn uniquely suitable for the design and manufacture of high energy density and high power regenerative batteries from a material standpoint [4,5]. For the specific category of rechargeable fuel cells, the battery is charged by mechanically removing spent Zn and resupplying a fresh Zn anode, and a separate fuel tank is employed to regenerate the Zn fuel by chemical electrolysis during standby periods [6]. The design of this type of fuel cell emphasizes the application of electric vehicles which have been widely investigated since 1970s [7,8,9].
Understanding of the correlation between operative parameters and chemical conditions as well as their contribution to the performance of Zn–air batteries is a crucial step in the rational designing of an efficient configuration. To address this issue, several theoretical simulations of Zn–air batteries have been discussed in the literature, most of which are based on the general and macroscopic models for porous electrodes [10,11]. Subsequently, numerical simulations with one-dimensional [12] and two-dimensional [13] models have been conducted to investigate Zn electrode redistribution by evaluating the occurrence of a highly nonuniform reaction distribution during high-current discharge. The Zn–ZnO redistribution blocks the electrode pores, thereby causing a low discharge capacity for repeated cycling, which is a significant drawback in Zn–air batteries.
The durability of the Zn–air battery has been one-dimensionally modeled, considering the effects of ZnO precipitates [14,15,16,17]. The improved models were used to analyze the experimental discharge behavior of Zn–air batteries, involving the effects of a microporous separator and a porous air cathode [14]. Another model that was combined with a dilute solution approach [15] has achieved good agreement with galvanostatic experiments where the charging–discharging behavior of an electrically rechargeable Zn–air battery was investigated. Additionally, a model that can consider the application of measured values on the cathode surface area and thickness has been reported to more realistically predict discharge performance [16]. Stamm et al. have reported that the correlation between nucleation of ZnO, diffusion of reactants through ZnO, and the characteristic features in discharge curves was obtained by a one-dimensional model. In that, the electrolyte transport model was related to rational thermodynamics and it emphasized diffusion, migration, and convection [17]. On the other side, the effect of the air composition and atmospheric carbon dioxide on the battery’s cycle performance has been explored without resolving the nonuniform reaction distribution of the Zn anode. The model confirmed the reduction of lifetime due to carbonization of the alkaline electrolyte [18].
Several numerical models have been developed to describe the operations of Zn–air batteries. However, the current models reported in literatures have insufficient information regarding the full system design. Enhanced performance of the fuel cell can be attained through proper control of the mass distribution, porosity, and effective surface area of the Zn metal anode, as well as electrolyte concentration, gas diffusion layer, and catalyst layer. In particular, few physical and chemical complexities are involved in the peculiar flow field. In order to make a Zn–air fuel cell more progressive, an in-depth understanding of the extensive operative parameters is necessary. Therefore, the present paper aims to develop a comprehensive computational approach for predicting the performance of a Zn–air fuel cell by the implementation of various sophisticated porous media treatments, comprising of heat and mass transfer electrochemical reactions via Butler–Volmer kinetics [19] and current continuity equations in porous media. Thus, these models can effectively achieve satisfactory calculations of electrode overpotential, cell voltage, and current density for the energy transfer process [19,20,21,22]. Contemplating the multifaceted flow nature in a fuel cell, simulations by computational fluid dynamics (CFD) code can be very useful as an effective design tool to circumvent expensive experiments or by narrowing down the range of parameters for the experiments, thus rendering the study more cost effective. Avoiding inherent difficulties during the simulation of the complex physical and chemical mechanisms of Zn–air fuel cells involving the strong coupling between fluid flow, heat transfer, electron transport, mass transport, and electrochemical reactions was very crucial. For this purpose, a commercial CFD software, CFD-ACE+® (V2004, ESI CFD Inc., Huntsville, AL, USA), was employed for numerical simulation [23]. Validation of the present theoretical formulation involved the comparison of the polarization curve with the measured data for a single-cell Zn–air fuel cell module. Numerical experiments were conducted to assess the discharge characteristics of Zn–air fuel cells of different designs and operational parameters. These included the volume fraction of void space present in the catalyst layer, gas channel width, and, finally, the porosity and thickness of the gas diffusion layer.
2. Results and Discussion
2.1. Model of Zn–Air Fuel Cell
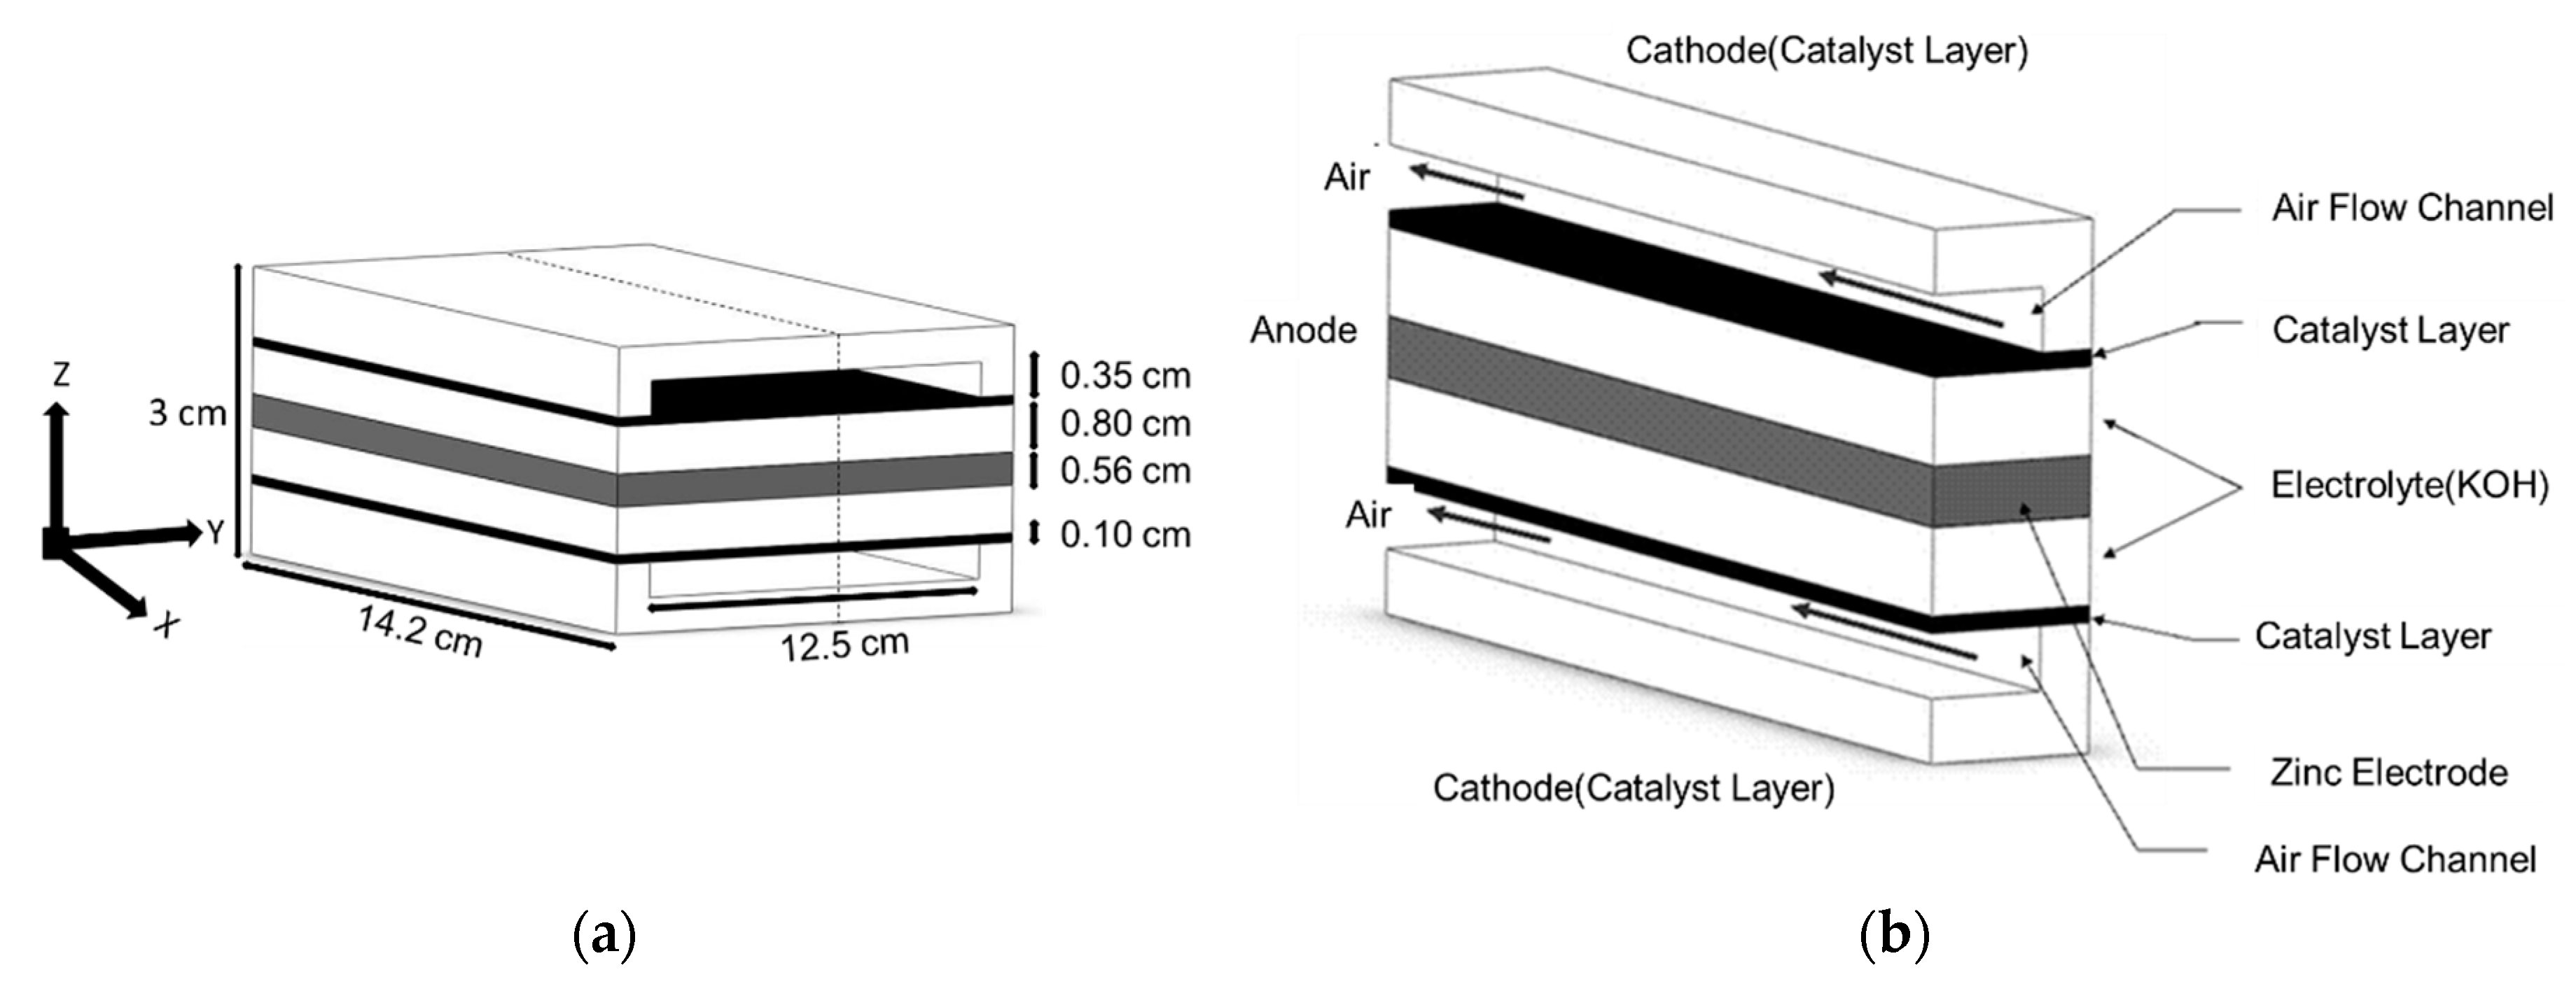
A complete fuel cell is an inherently complex system and it requires some simplifying assumptions to design a numerically tractable model for simulating the physical and chemical processes in a Zn–air fuel cell. The theoretical model of the present study had the following assumptions: (i) steady-state operation of the fuel cell; (ii) uniform and constant temperature in the fuel cell over the solution domain; (iii) the gas diffusion layer (consisting of carbon black) and the catalyst layer in the cathode side as well as the Zn electrode in the anode side were homogeneous, isotropic porous media; (iv) the gas flow in the gas channel and the porous layers in both anode and cathode sides was laminar and compressible, with a flow motion having insignificant buoyancy effects; and (v) constant electrochemical and thermodynamic properties of the gases, liquids, and solid materials of the fuel cell components. A single Zn–air fuel cell with parallel straight channels on both the anode and the cathode carbon plates is schematically represented in Figure 1. The photographs of the fuel cell are shown in Figure 2a and the schematic diagram of the experimental setup adopted in the present study is portrayed in Figure 2b.
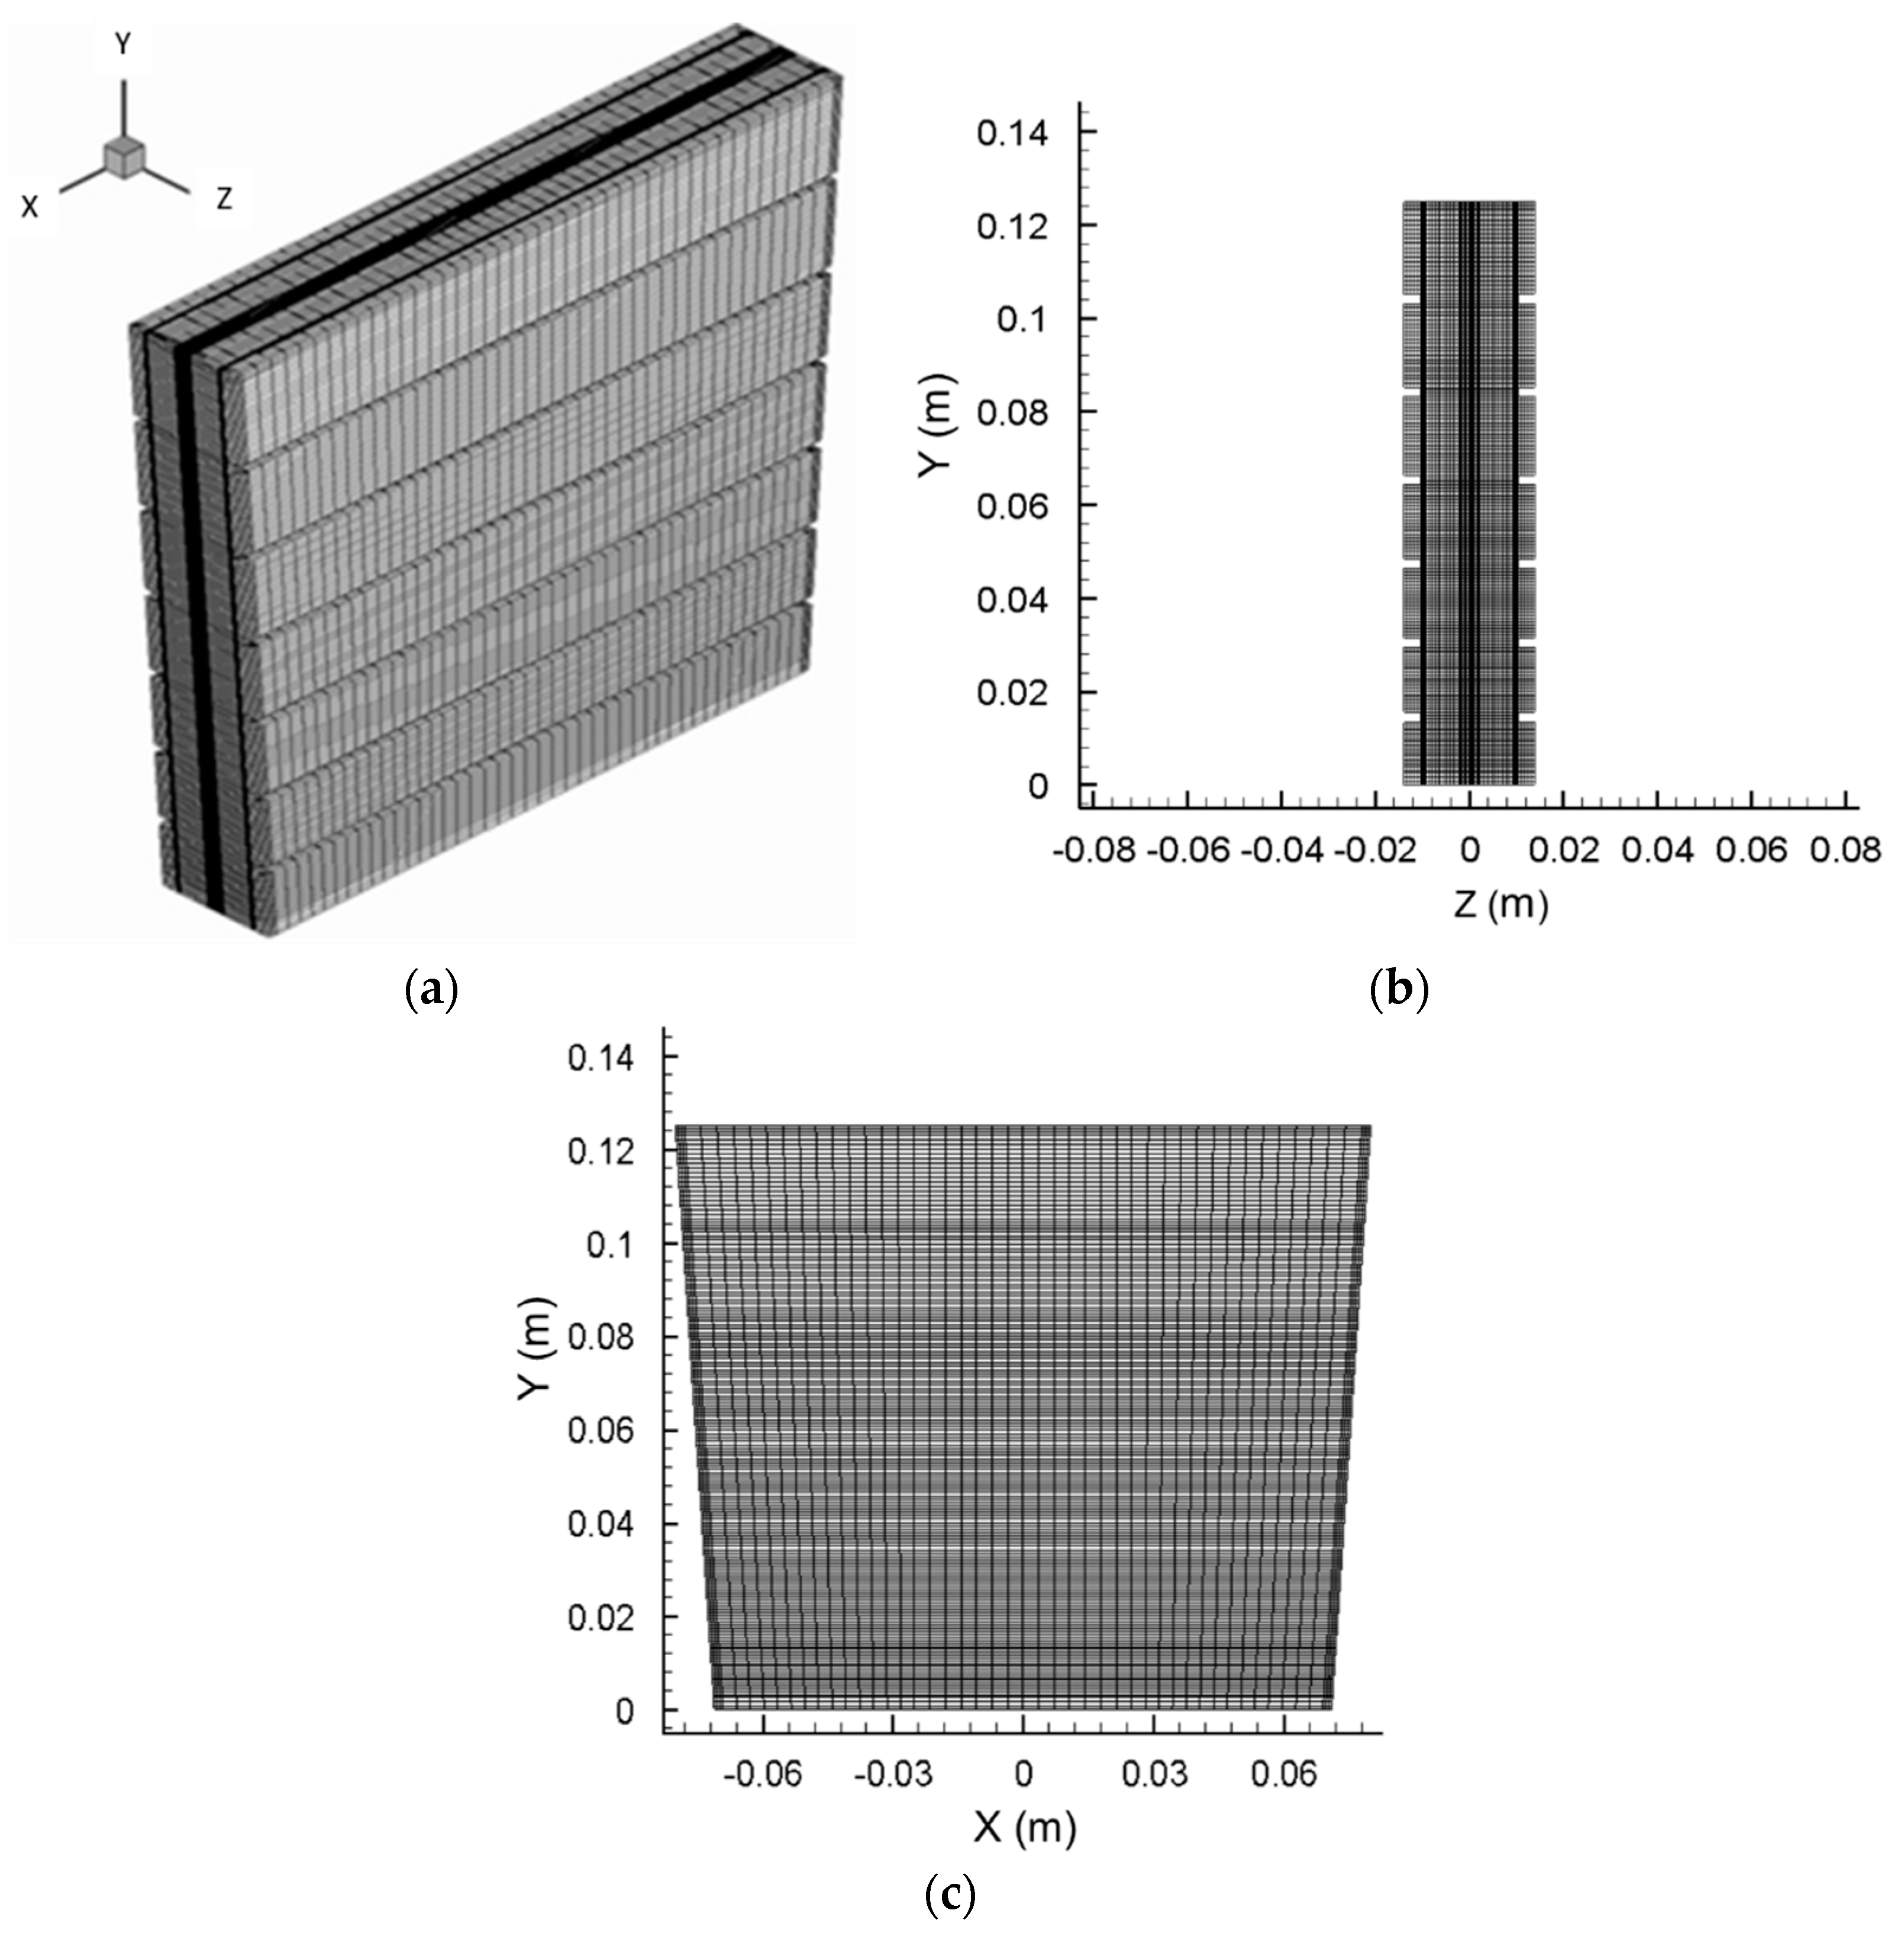
A Zn–air single fuel cell model was developed using the computational fluid dynamics code CFD-ACE+®. Numerical calculations were conducted for the validation of the theoretical formulation and thereby comparisons with the predictions for performance evaluations were made. The numerical grids of a single Zn–air fuel cell with the stereogram, front and side view for performance predictions, are shown in Figure 3. The mesh system was mainly composed of four structured sections, including the porous Zn anode electrode, air cathode electrode, liquid potassium hydroxide (KOH) electrolyte, and air flow channels. For resolving steep variations of flow and species properties, finer grids were placed in the regions inside the porous Zn plate and near the solid wall boundaries with a small spacing of ~75 μm. The ionic conductivity of the liquid KOH electrolyte as a user subroutine was coded using a subprogram with the Fortran language. It can be linked into the CFD-ACE+® computer software for electrochemical analysis. To examine the power generating process of a Zn–air fuel cell, numerical calculations were performed on the total number grids of 474,062, 592,578, and 711,094 points for one cell. The results specified that satisfactory grid independence can be attained by using a mesh of 592,578 grids for the polarization curve prediction. When the normalized residuals for each primary variable dropped well below 10-4 with the mass conservation check within 0.5 %, the computation was considered as converged. Around 150 h of central processing unit (CPU) time on an Intel-Core2 Duo E6750-2.66 GHz (manufactured by Intel, Intel Corporation, Santa Clara, CA, USA) personal computer was typically required for a complete simulation towards a stable value of power density.
2.2. Comparison of Simulation and Experiment
Electrochemical characteristics such as the open circuit voltage, voltage-current density, and power density–current density discharge curves of the Zn–air fuel cells were analyzed with the aid of an electrochemical analyzer. The open circuit voltage was measured directly by the voltmeter when the galvanoscope was not connected on to any external resistance (open circuit condition). The cell was discharged at different constant currents at room temperature. The cell was operated at an open circuit condition for 30 h at room temperature and the open circuit voltage was measured. The operational and geometrical conditions in the simulation were consistent with the experimental module. Figure 4 exhibits a comparison of numerical predictions with measured voltage–current data of a single Zn–air fuel cell. The cathode/anode interface area was approximately 375 cm2, and the cell operation temperature was maintained at 27 °C with the electrolyte concentration of 60 wt % KOH. In practice, the typical operating voltage of the Zn–air fuel cell was fixed at 0.8 V. It was observed that the prediction was in good agreement with the measured current density value of 112 mA/cm2 at the voltage of 0.8 V with the corresponding error of 5.8%. The voltage losses in a polarization curve at the start, center, and end parts were due to activation resistance, ohmic losses, and mass transport limitation inside the cell components, respectively. In general, the model prediction agrees reasonably well with the experimental data, indicating that the present theoretical model can simulate the performance characteristics of the single Zn–air fuel cell with a satisfactory accuracy. The simulations can also be used to provide detailed insight into various transport mechanisms and their interactions.
2.3. Simulation Results of Mass Fraction
Figure 5 illustrates the mass fraction contours of O2 and ZnO in the mid-cross-sectional (x-z) plane at an operating voltage of 0.8 V. Overall, it was observed that the inlet manifold region had the highest O2 concentrations, whereas the outlet manifold region had the lowest O2 concentrations. It was found that elevated concentrations of O2 prevailed in the channels of all cells and the distribution of O2 concentration was also slightly reduced from the inlet to the outlet due to catalytic reaction with water and electrons at V = 0.8 V. At the air electrode (cathode), O2 gas passed through several transport phases before being electrolytically consumed at reaction areas. These phases consisted of transfer into the gas fed porous layer by diffusion and convection in the gas phase, dissolution into the electrolyte, and diffusion in the electrolyte phase to the reaction areas. The chemical kinetics of O2 electrode reaction was affected by the catalyst used but was generally very slow compared to that of zinc oxidation at the anode. The O2 solubility in KOH solution was relatively less and was reduced in a high concentration electrolyte, and consequently, the electrode might have suffered a significant voltage loss due to concentration polarization. In contrast, zinc oxide solubility was relatively high in an alkaline solution, as dissolved zinc formed various complexes with hydroxide ions and thereby produced ZnO at the outer surface of the anode. Figure 6 portrays the current density contours at the cathode and anode of the base case in mid-cross-sectional (x-z) plane. This indicated that the current density distributions decreased from the inlet to the outlet as a result of a reduction in oxidant concentration by electrochemical reactions.
2.4. Effect of Oxidant Concentration
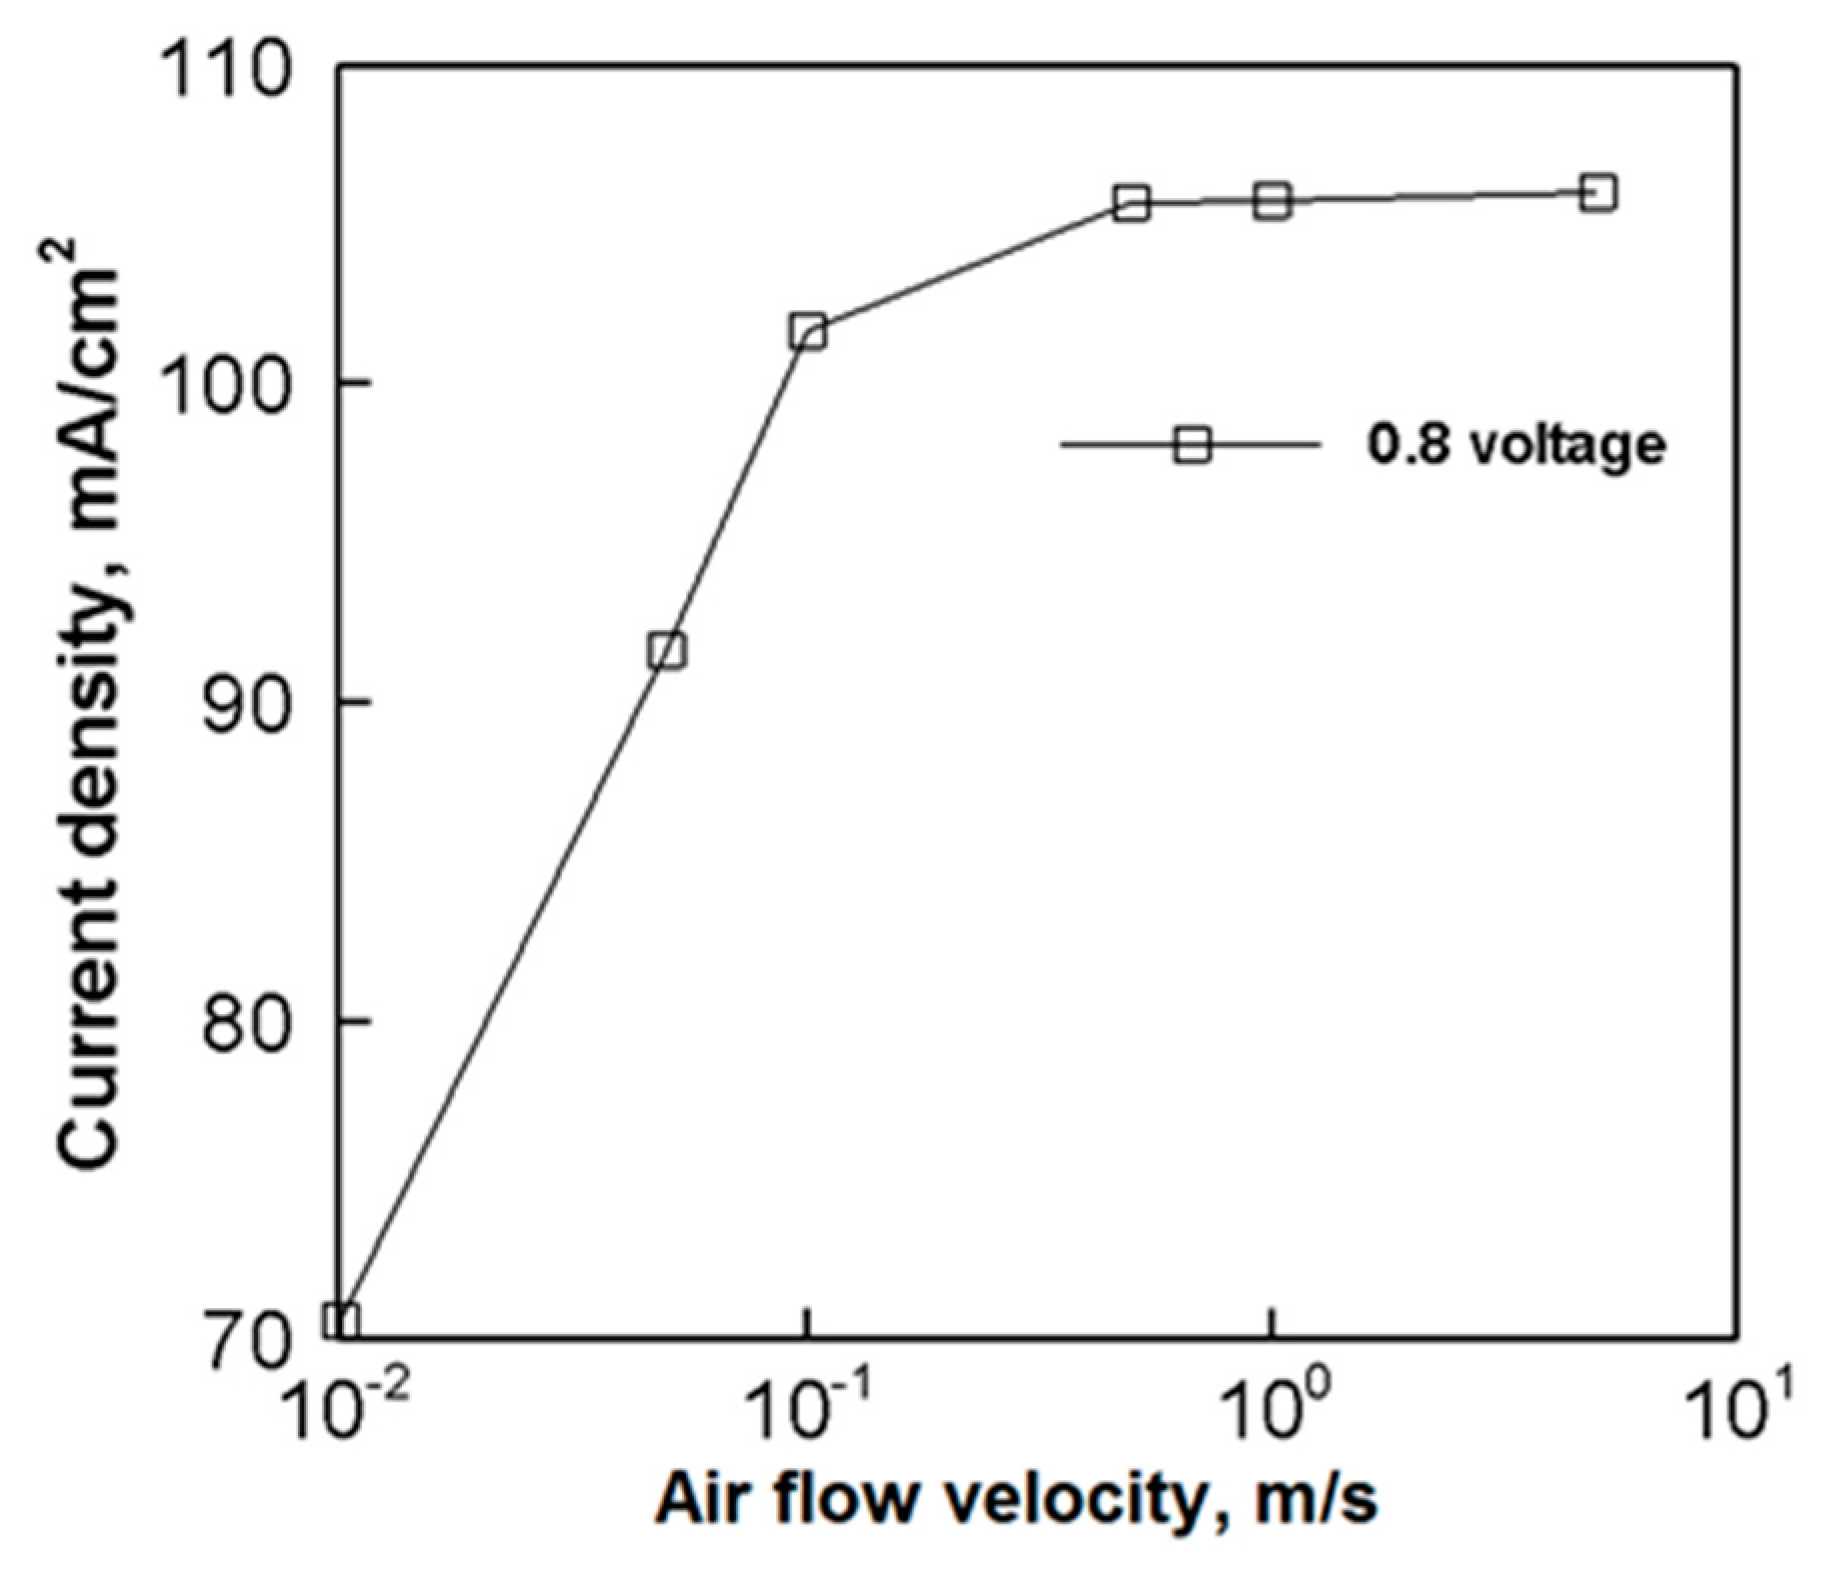
Figure 7 illustrates the effect of the oxidant concentration on cell performance. The monotonously decreasing curves denote the polarization curves. The oxidant concentrations were 21% and 99%, whereas the oxidants of the former and latter cases represented air and pure O2. The cell performance with 99% oxidant concentration was better than that with 21% oxidant concentration under a broad range of the current density up to 180 mA/cm2. Nitrogen in the air might have functioned as the diffusion resistance to counteract O2 in the catalyst layer and water in the cathode gas channel, thus resulting in a lower limiting current density. During operations, the air flow velocity of the oxidant was a crucial factor affecting cell performance. Figure 8 depicts the effect of air flow velocity on the current density of a single Zn–air fuel cell. Regarding air serving as the oxidant gas, an increase of the air flow velocity might have led to the increase of the current density (and cell performance) in the flow velocity, which ranged from 0.01 to 0.5 m/s. Nevertheless, the O2 concentration was decreased due to inadequate oxidation by the Zn in the electrolyte as the current density increased. The performance of the cell was effectively enhanced by the active reduction reaction due to the sufficient supply of O2 in the electrode catalyst as the air velocity increased to 0.5 m/s. Constrained by the catalytic reaction rate, the current density remained constant for the excess supply of O2 as the air flow velocity was above 0.5 m/s.
2.5. Effect of Electrolyte Concentration
Figure 9 illustrates the effect of the KOH concentration on cell performance. When the KOH concentration was increased from 10 to 40 wt %, the current density was augmented accordingly at a specific voltage above 0.7 V. The current density decreased with further increase in KOH concentration and it was due to the reduction in the H2O concentration despite the high concentration of KOH. There was only a minimal effect on activation overpotential while the concentration overpotential initially decreased and then increased with the increase in KOH concentration. The less availability of H2O at the anode further led to an increase in the concentration polarization at high KOH concentrations. Nevertheless, maximum cell performance occurred in the ohmic loss region despite the lowering of the KOH concentration that increased the ionic conductivity of the medium or decreased the ohmic loss.
In the operation of the Zn electrode, maintenance of optimal OH– concentration inside the cell is very important [24]. Therefore, a successful rechargeable Zn–air fuel cell had the design of a flow electrolyte, which effectively improved the Zn electrode durability [25]. Besides, when solid ZnO hindered the electrode performance, the complement of fresh electrolytes can postpone the electrode failure. An effective flow electrolyte design can enhance the electrolyte circulation to maintain stable KOH concentrations, thereby eliminating the formation of solid ZnO and maximizing the use of Zn electrode materials.
3. Methods
3.1. Theoretical Model
The theoretical model implemented in the ACE+® computer software was designed according to the time-dependent, three-dimensional conservation laws of mass, momentum, and species concentration. The electrochemical reactions within the porous electrodes were described using the Butler–Volmer equation and the simulations provided calculations for velocity, current density, pressure, and electronic and ionic phase potentials in the anode and cathode. The equations are given below:
Continuity equation:
Momentum equation:
Species concentration equation:
Here, and represent the porosity and the permeability of the porous layers, respectively, denotes the fluid stress tensor, indicates the diffusion flux, and is the source term. Details of nomenclatures are listed in Appendix A. For those cases considering pure fluid flow across the gas channels, the values of and are specified as = 1 and = ∞, respectively. For describing the diffusion term in the species equation, the diffusion flux is denoted by
where M denotes the mixture molecular weight.
The initial term denotes diffusion caused by the concentration gradients. The final three terms are the correction terms accounting for the porous medium in the Stefan–Maxwell relation in multicomponent species systems. The effective mass diffusivity for species i within the porous medium can be determined via Bruggemann’s equation as follows [26]:
where indicates the mass diffusivity of species i, whereas stands for the Bruggemann coefficient of the porous layer with a typical value of 1.5.
The term represents the source term of species j resulting from the electrochemical reactions in the porous Zn electrode and the catalyst layer, with Zn and O2 consumed at the anode and the cathode, respectively. In the meantime, the anode reaction yields ZnO as a product. Thus, the source terms for different species are
where and indicate transfer current densities at anode and cathode, respectively, which are accessed via the Butler–Volmer equation as follows:
where the variables and are the reference transfer current densities (along with the concentration parameters and ) at the anode and the cathode. Additionally, αa and αc denote the charge transfer coefficients for the anode and cathode reactions, respectively. is the reference concentrations at which the exchange current densities are obtained. The electrode overpotential can be explained as the difference between the electronic (or solid phase) potential and the electrolyte (or ionic phase) potential .
In the calculations of a Zn–air fuel cell, the current conservation within any material under the assumption of electro-neutrality can be written as follows:
where is the current density vector. Considering a porous electrode in a Zn–air fuel cell, the current flow may be divided into two parts: one passing through the liquid electrolyte (potassium hydroxide) to produce an ionic phase current , and the another one passing through the porous media to generate electronic phase current . Thus, it can be rewritten as follows:
The current transport in the ionic phase is due to the presence of ions, and in the electronic phase, it is because of the electrons. The transportation in each and every phase is directed by separate electric potential fields. According to Ohm’s law, it can be modified as
where and indicate the conductivity of the ionic and electronic phases, respectively, whereas and denote the electric potentials of ionic and electronic phases, respectively. The current exchange between the ionic and electronic phase occurs due to electrochemical reactions. Meanwhile, the current is carried by ions and electrons in the ionic and solid phases, respectively. Thus, Equation (13) can be rewritten as
The effective surface-to-volume ratio, , denotes the ratio of the catalyst active surface area and the Zn electrode to its overall volume. Mathematically, Equation (14) represents two elliptic partial differential equations closely linked via the transfer current source term. The ionic phase electric potential equation is determined in the catalyst layers and the KOH liquid electrolyte. The electronic phase electric potential equation is defined in the catalyst layer and gas diffusion layer [26]. The gas diffusion layer, catalyst layers, and a porous Zn anode electrode functioned as conductors for electric currents. In practice, there are no electrochemical reactions in the gas diffusion layer and they occur only in the catalyst layers and porous Zn anode electrode. The ionic form of OH– was generated in the cathode catalyst layer and then migrated via the liquid electrolyte towards the porous Zn anode electrode to react with Zn for releasing electrons. The simulation parameters are listed in Table 1. For the boundary treatment, the solid walls of the gas channel were impermeable, and consequently, and on the walls. Due to the fact that both the gas channels and the liquid electrolyte were insulators against electrons, the normal gradient of the electric potential disappeared at the boundaries of these two components.
3.2. Experimental Apparatus
A Zn–air fuel cell employed in the present experiments comprised four major parts: a porous Zn anode electrode, an air cathode electrode, a liquid KOH electrolyte, and air flow channels. The porous Zn anode was 0.47 cm in thickness and employed a copper plate to conduct electrons, whereas the dimensions of the carbon-based air cathode, including the diffusion and catalyst layers, were 15 cm long × 12.5 cm wide × 0.13 cm high, with a cathode/anode interfacial area of ~375 cm2. The concentration of the liquid KOH electrolyte varied from 30 to 65 wt %. The air stream was supplied by a fan and it passed via two 12.7 cm wide × 0.3 cm high rectangular-shaped channels and the flow velocity was measured by an anemometer (425 N). The channels were designed and constructed using acrylic plates, which were cut using a conventional milling machine. The length of the straight section of the rectangular channels was 15 cm. The geometrical parameters are listed in Table 1.
4. Conclusions
The discharge characteristics of a single Zn–air fuel cell module were examined using numerical calculations and experimental measurements. The experimental results demonstrated that during the validation of the present computer software, the calculated current–voltage curve was observed to be in reasonable agreement with the measured current densities for the operating voltage above 0.8 V. For a broad range of the current density values up to 180 mA/cm2, the cell performance with 99% oxidant concentration was higher than that with 21% oxidant concentration. This was due to the fact that nitrogen in air can oppose the diffusion process of O2 approaching the catalyst layer. Meanwhile, when the flow velocity range increased from 0.01 to 0.5 m/s, the increase of air velocity resulted in an increase in the current density and cell performance. Nevertheless, at a specific voltage above 0.7 V, the KOH concentrations varying from 10 to 40 wt % enhanced the current density. These results obviously indicated that the numerical simulation models can not only be employed for the performance prediction of a Zn–air fuel cell with satisfactory accuracy but can also be used for feasible future applications of the technique.
Author Contributions
Conceptualization, K.D.H.; Methodology, K.D.H.; Software, W.-F.C.; Validation, W.-F.C.; Data Curation, W.-F.C. and C.L.; Formal analysis, P.-T.C.; Writing-Review & Editing, P.-T.C. and T.S.; Supervision, K.D.H. and P.-T.C.
Acknowledgments
We thank National Energy Program-Phase II of Ministry of Science and Technology for having supported this study. P.T. thanks Prof. Wei-Mon Yan for useful discussions.
Conflicts of Interest
The authors declare no conflict of interest.
Appendix A
| Nomenclature | |
| Mass diffusivity (m2·s−1) | |
| Faraday constant, 96,487 C·mol−1 | |
| Gas velocity vector (m·s−1) | |
| Pressure (Pa) | |
| Mass fraction of species | |
| Diffusion flux | |
| Source term in species equation | |
| Molecular weight (kg·kmol−1) | |
| Transfer current densities (Am−3) | |
| Universal gas constant, 8.314 J·mol−1·K−1 | |
| Temperature (K) | |
| Current density vector | |
| Greek letters | |
| Density (kg·m−3) | |
| Porosity | |
| Stress tensor (N·m−2) | |
| Permeability (m2) | |
| Transfer coefficients | |
| Conductivities | |
| Electric potentials | |
| Electrode overpotential | |
| Superscripts | |
| Bruggemann coefficient | |
| Concentration parameters | |
| Subscripts | |
| i | Species of anode, cathode, electrolyte, and air flow channel |
| j | Source term of species (O2, Zn, or ZnO) |
| Acronyms | |
| a | Anode |
| c | Cathode |
| F | Fluid phase |
| S | Solid phase |
| Abbreviations | |
| eff | Effective |
| ref | Reference |
References
- Rahman, M.A.; Wang, X.; Wen, C. High energy density metal-air batteries: A review. J. Electrochem. Soc. 2013, 160, A1759–A1771. [Google Scholar] [CrossRef]
- Panchal, S. Impact of Vehicle Charge and Discharge Cycles on the Thermal Characteristics of Lithium-ion Batteries. Master’s Thesis, University of Waterloo, Waterloo, ON, Canada, 2014. [Google Scholar]
- Fu, J.; Cano, Z.P.; Park, M.G.; Yu, A.; Fowler, M.; Chen, Z. Electrically Rechargeable Zinc-Air Batteries: Progress, Challenges, and Perspectives. Adv. Mater. 2017, 29, 1604685. [Google Scholar] [CrossRef] [PubMed]
- Lee, C.W.; Sathiyanarayanan, K.; Eom, S.W.; Yun, M.S. Novel alloys to improve the electrochemical behavior of zinc anodes for zinc/air battery. J. Power Sour. 2006, 160, 1436–1441. [Google Scholar] [CrossRef]
- Zhu, W.H.; Poole, B.A.; Cahela, D.R.; Tatarchuk, B.J. New structures of thin air cathodes for zinc–air batteries. J. Appl. Electrochem. 2003, 33, 29–36. [Google Scholar] [CrossRef]
- Zhu, A.L.; Wilkinson, D.P.; Zhang, X.; Xing, Y.; Rozhin, A.G.; Kulinich, S.A. Zinc regeneration in rechargeable zinc-air fuel cells: A review. J. Energy Storage 2016, 8, 35–50. [Google Scholar] [CrossRef]
- Li, Y.; Dai, H. Recent advances in zinc–air batteries. Chem. Soc. Rev. 2014, 43, 5257–5275. [Google Scholar] [CrossRef] [PubMed]
- Cheiky, M.C.; Danczyk, L.G.; Wehrey, M.C. Rechargeable zinc-air batteries for electric vehicle applications. SAE Tech. Pap. 1990, 901516. [Google Scholar] [CrossRef]
- Cheiky, M.C.; Danczyk, L.G.; Scheffler, R.L. Zinc-air powered electric vehicle systems integration issues. SAE Tech. Pap. 1991, 910249. [Google Scholar] [CrossRef]
- Pei, P.; Wang, K.; Ma, Z. Technologies for extending zinc–air battery’s cycle life: A review. Appl. Energy 2014, 128, 315–324. [Google Scholar] [CrossRef]
- Choi, K.W.; Bennion, D.N.; Newman, J. Engineering analysis of shape change in zinc secondary electrodes I theoretical. J. Electrochem. Soc. 1976, 123, 1616–1627. [Google Scholar] [CrossRef]
- Sunu, W.G.; Bennion, D.N. Transient and failure analyses of the porous zinc electrode I theoretical. J. Electrochem. Soc. 1980, 127, 2007–2015. [Google Scholar] [CrossRef]
- Isaacson, M.J.; McLarnon, F.R.; Cairns, E.J. Current density and ZnO precipitation-dissolution distributions in Zn-ZnO porous electrodes and their effect on material redistribution: A two-dimensional mathematical model. J. Electrochem. Soc. 1990, 137, 2014–2021. [Google Scholar] [CrossRef]
- Mao, Z.; White, R.E. Mathematical modeling of a primary zinc/air battery. J. Electrochem. Soc. 1992, 139, 1105–1113. [Google Scholar] [CrossRef]
- Deiss, E.; Holzer, F.; Haas, O. Modeling of an electrically rechargeable alkaline Zn–air battery. Electrochim. Acta 2002, 47, 3995–4010. [Google Scholar] [CrossRef]
- Jung, C.Y.; Kim, T.H.; Kim, W.J.; Yi, S.C. Computational analysis of the zinc utilization in the primary zinc-air batteries. Energy 2016, 102, 694–704. [Google Scholar] [CrossRef]
- Stamm, J.; Varzi, A.; Latz, A.; Horstmann, B. Modeling nucleation and growth of zinc oxide during discharge of primary zinc-air batteries. J. Power Sour. 2017, 360, 136–149. [Google Scholar] [CrossRef] [Green Version]
- Schröder, D.; Krewer, U. Model based quantification of air-composition impact on secondary zinc air batteries. Electrochim. Acta 2014, 117, 541–553. [Google Scholar] [CrossRef]
- Panchal, S.; Dincer, I.; Agelin-Chaab, M.; Fraser, R.; Fowler, M. Transient electrochemical heat transfer modeling and experimental validation of a large sized LiFePO4/graphite battery. Int. J. Heat Mass Transf. 2017, 109, 1239–1251. [Google Scholar] [CrossRef]
- Um, S.; Wang, C.Y.; Chen, K.S. Computational fluid dynamics modeling of proton exchange membrane fuel cells. J. Electrochem. Soc. 2000, 147, 4485–4493. [Google Scholar] [CrossRef]
- Giridharan, M.G.; Krishnan, A. An implicit numerical model for electrophoretic systems, Micro-Electro-Mechanical Systems (MEMS). In Proceedings of the ASME International Mechanical Engineering Congress and Exposition, Anaheim, CA, USA, 15–20 November 1998. [Google Scholar]
- Coltrin, M.E.; Kee, R.J.; Rupley, F.M. Surface chemkin: A general formalism and software for analyzing heterogeneous chemical kinetics at a gas-surface interface. Int. J. Chem. Kinet. 1991, 23, 1111–1128. [Google Scholar] [CrossRef]
- CFD-ACE(U)® V2004 User’s Manual; ESI-CFD Inc.: Huntsville, AL, USA, 2004; Available online: www.cfdrc.com (accessed on 18 August 2018).
- Song, H.; Xu, X.Z.; Li, F. Numerical simulation of discharge process and failure mechanisms of zinc electrode. Acta Phys. Chim. Sin. 2013, 29, 1961–1974. [Google Scholar]
- Xu, M.; Ivey, D.G.; Xie, Z.; Qu, W. Rechargeable Zn-air batteries: progress in electrolyte development and cell configuration advancement. J. Power Sour. 2015, 283, 358–371. [Google Scholar] [CrossRef]
- Cheng, C.H.; Lin, H.H.; Lai, G.J. Numerical prediction of the effect of catalyst layer Nafion loading on the performance of PEM fuel cells. J. Power Sour. 2007, 164, 730–741. [Google Scholar] [CrossRef]
- Siu, S.; Evans, J.W. Flow and transport due to natural convection in a galvanic cell. J. Electrochem. Soc. 1997, 144, 2705–2711. [Google Scholar] [CrossRef]
Figure 1.
Schematic representation of a single Zn–air fuel cell. (a) Single cell with rectangular shaped channels and (b) flow channels geometry.
Figure 1.
Schematic representation of a single Zn–air fuel cell. (a) Single cell with rectangular shaped channels and (b) flow channels geometry.

Figure 2.
(a) Actual Zn–air fuel cell and (b) experimental apparatus for performance measurements of a single zinc–air fuel cell.
Figure 2.
(a) Actual Zn–air fuel cell and (b) experimental apparatus for performance measurements of a single zinc–air fuel cell.

Figure 3.
Numerical grids of a single Zn–air fuel cell. (a) Stereogram, (b) front and (c) side views.
Figure 3.
Numerical grids of a single Zn–air fuel cell. (a) Stereogram, (b) front and (c) side views.

Figure 4.
Comparison of predictions with measured voltage–current data of a single Zn–air fuel cell.
Figure 4.
Comparison of predictions with measured voltage–current data of a single Zn–air fuel cell.

Figure 5.
Mass fraction contours of (a) O2 and (b) ZnO in the mid-cross-sectional (x-z) plane.

Figure 6.
Current density contours in the mid-cross-sectional (x-z) plane.

Figure 7.
Effect of oxidant concentration on cell performance.
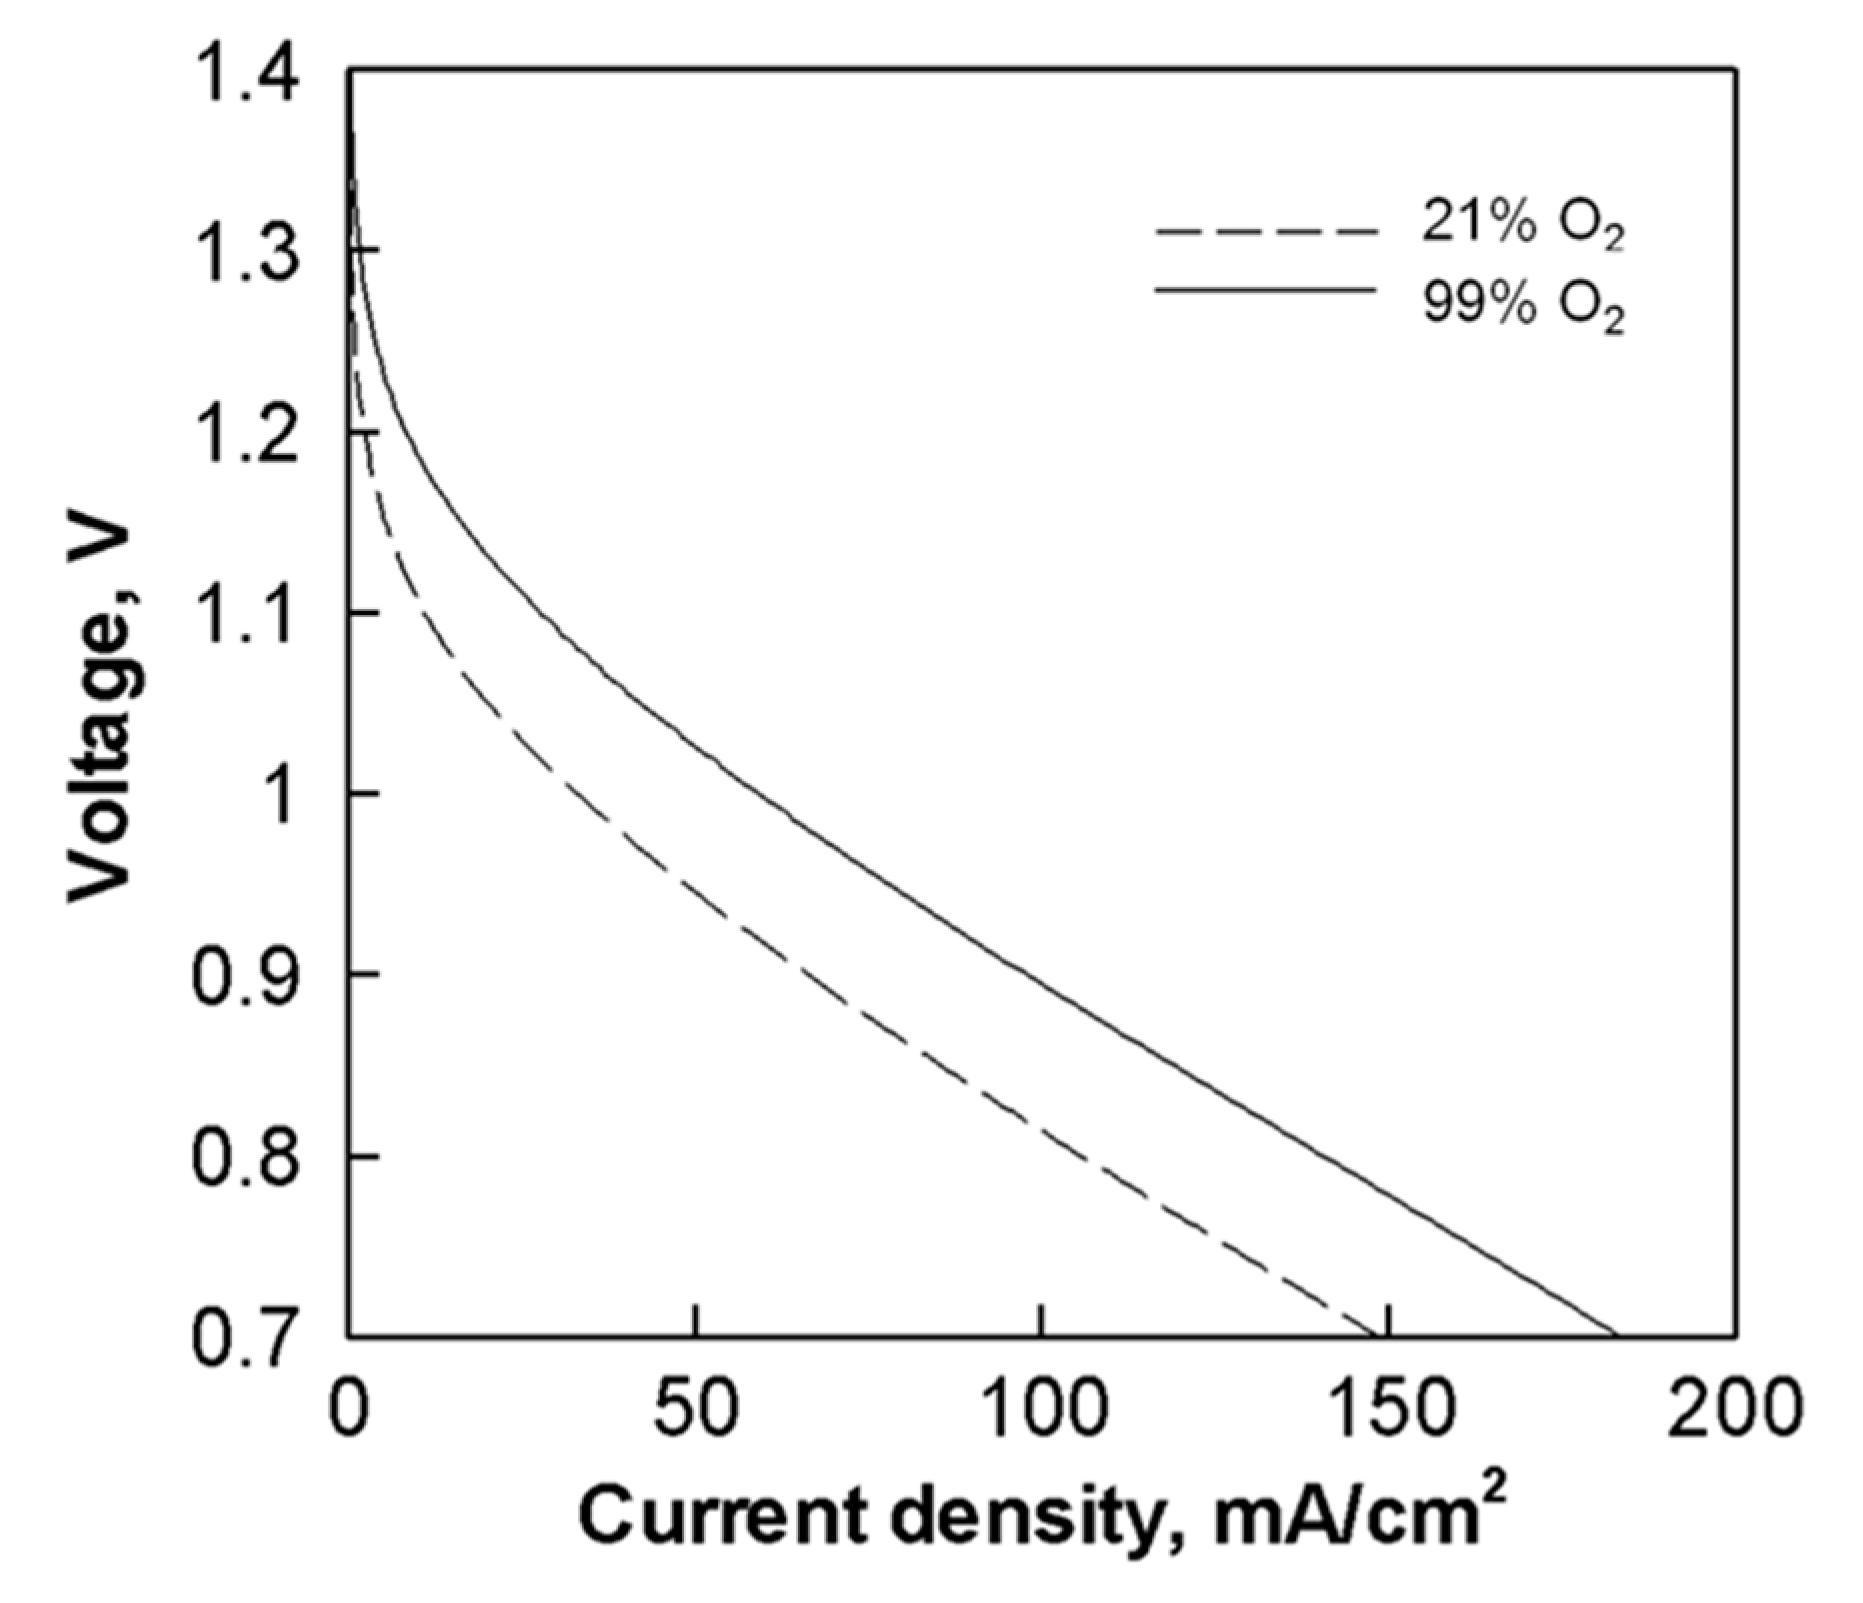
Figure 8.
Effect of air flow velocity on current density.

Figure 9.
Effect of KOH concentration on cell performance.


Table 1.
Specification of single cell and conditions in experiments.
| Parameter | Symbol | Value | Unit | References |
|---|---|---|---|---|
| Gas channel length | 14.2–16 | cm | # | |
| Gas channel height | 1.6 | cm | # | |
| Gas channel width | 0.35 | cm | # | |
| Zn plate length | 14.2–16 | cm | # | |
| Zn plate height | 12.5 | cm | # | |
| Zn plate width | 0.56 | cm | # | |
| Catalyst layer thickness | 0.1 | cm | # | |
| Catalyst layer porosity | 0.4 | [27] | ||
| Zn plate porosity | 0.4 | [27] | ||
| Bruggemann coefficient | 1.5 | [27] | ||
| Transfer coefficients for anode | 0.5 | [27] | ||
| Transfer coefficients for cathode | 0.5 | [27] | ||
| Reference transfer current density at anode | 1 × 10⁷ | Am−3 | [27] | |
| Reference transfer current density at cathode | 300 | Am−3 | [27] | |
| Anode concentration parameter | 1 | [27] | ||
| Cathode concentration parameter | 1 | [27] | ||
| Electronic conductivity of catalyst layer | 5.96 × 10⁷ | Ω−1 m−1 | [27] | |
| Electronic conductivity of Zn | 1.66 × 10⁷ | Ω−1 m−1 | [27] | |
| Cell operational temperature | T | 300 | K | [27] |
# Experimental design of this paper.
© 2018 by the authors. Licensee MDPI, Basel, Switzerland. This article is an open access article distributed under the terms and conditions of the Creative Commons Attribution (CC BY) license (http://creativecommons.org/licenses/by/4.0/).
Share and Cite
MDPI and ACS Style
Huang, K.D.; Sangeetha, T.; Cheng, W.-F.; Lin, C.; Chen, P.-T. Computational Fluid Dynamics Approach for Performance Prediction in a Zinc–Air Fuel Cell. Energies 2018, 11, 2185. https://doi.org/10.3390/en11092185
AMA Style
Huang KD, Sangeetha T, Cheng W-F, Lin C, Chen P-T. Computational Fluid Dynamics Approach for Performance Prediction in a Zinc–Air Fuel Cell. Energies. 2018; 11(9):2185. https://doi.org/10.3390/en11092185
Chicago/Turabian StyleHuang, K. David, Thangavel Sangeetha, Wu-Fu Cheng, Chunyo Lin, and Po-Tuan Chen. 2018. "Computational Fluid Dynamics Approach for Performance Prediction in a Zinc–Air Fuel Cell" Energies 11, no. 9: 2185. https://doi.org/10.3390/en11092185
Note that from the first issue of 2016, this journal uses article numbers instead of page numbers. See further details here.