Integrated Energy Planning with a High Share of Variable Renewable Energy Sources for a Caribbean Island


1
Department of Energy Conversion and Storage, Technical University of Denmark (DTU), Frederiksborgvej 399, 4000 Roskilde, Denmark
2
Power System Design & Studies Group, National Renewable Energy Laboratory, 15013 Denver West Parkway, MS ESIF200, Golden, CO 80401, USA
*
Author to whom correspondence should be addressed.
Energies 2018, 11(9), 2193; https://doi.org/10.3390/en11092193
Submission received: 21 July 2018
/
Revised: 18 August 2018
/
Accepted: 20 August 2018
/
Published: 22 August 2018
(This article belongs to the Special Issue Applied Energy System Modeling 2018)
Abstract
:Although it can be complex to integrate variable renewable energy sources such as wind power and photovoltaics into an energy system, the potential benefits are large, as it can help reduce fuel imports, balance the trade, and mitigate the negative impacts in terms of climate change. In order to try to integrate a very large share of variable renewable energy sources into the energy system, an integrated energy planning approach was used, including ice storage in the cooling sector, a smart charging option in the transport sector, and an excess capacity of reverse osmosis technology that was utilised in order to provide flexibility to the energy system. A unit commitment and economic dispatch tool (PLEXOS) was used, and the model was run with both 5 min and 1 h time resolutions. The case study was carried out for a typical Caribbean island nation, based on data derived from measured data from Aruba. The results showed that 78.1% of the final electricity demand in 2020 was met by variable renewable energy sources, having 1.0% of curtailed energy in the energy system. The total economic cost of the modelled energy system was similar to the current energy system, dominated by the fossil fuel imports. The results are relevant for many populated islands and island nations.
1. Introduction
Following the Paris agreement, nations across the globe have decided to take actions to mitigate global warming by well under 2 °C [1]. In order to achieve that goal, a significant reduction in greenhouse gas (GHG) emissions will need to be attained [2]. Renewable energy sources can achieve three different targets, reducing GHG emissions, providing a more affordable energy system in the long term, and securing an energy supply, the three pillars of the European Union’s plan for the energy transition [3]. The security of the energy supply is especially important for islands and islanded countries, even more so if they do not have transmission connections with neighbouring countries. Currently, many island countries depend on GHG emission-rich diesel generators, which leads to a large consumption of fuel oil and diesel, and their associated GHG emissions [4]. Being heavily reliant on oil makes the island communities especially sensitive to fluctuations in oil prices [5]. Currently, many islands have expensive oil-based energy systems in place, meaning that their transition towards cleaner energy systems does not necessarily need to result in a more expensive energy system in the long run, due to the rapidly decreasing costs of renewable energy technologies [6]. Furthermore, such communities can tackle the issue of security of the energy supply by using energy sources that do not demand fuel, such as photovoltaics (PV) and wind turbines.
A comprehensive review of the modelling and planning of energy systems for isolated areas can be found in [7]. The authors showed that the most common software tools for modelling isolated areas were HOMER, H2RES, and, to a lesser degree, EnergyPLAN. In the mentioned review [7], papers being reviewed involved case studies focusing on the power sector and/or water sector only and not on integrated energy planning across the whole energy sector. The most commonly used combinations of technologies were diesel-wind-PV with batteries and/or reverse osmosis (RO) for water desalination [7].
Some papers focused on the theoretical 100% renewable energy systems in islands, while others focused on the renewable energy supply in the power sector only. The EnergyPLAN tool was used to show that it is possible to achieve a 100% renewable energy system on an island in Northern Europe by 2030 [8]. The authors stated that the renewable energy island would not be significantly more expensive than the business-as-usual case, having total system costs of 247 M€ per year for the renewable energy scenario and 229 M€ per year for the business-as-usual case. The authors adopted a holistic approach, integrating power, thermal, and transport sectors at an hourly time resolution; however, seawater desalination was not considered. Besides other technologies, the renewable scenario included a heavily electrified transport sector, where batteries were used to provide the grid flexibility via the vehicle-to-grid (V2G) technology, as well as different power-to-gas technologies. Variable renewable sources had a share from 33% to 68% of the total primary energy supply in different scenarios, while the remaining share was met by the biomass and biofuels combustion. Moreover, all of the alternative scenarios had a non-negligible amount of curtailed energy, in the range from 2% to 28%, the lowest amount being obtained in a scenario that included the large capacity of synthetic fuels production via electrolysers and methanation processes. The scenario with the lowest primary energy consumption (a 6% reduction compared to a business-as-usual scenario) integrated all the energy sectors, including the total electrification of the transport sector with vehicle-to-grid utilisation.
A similar methodology was adopted on a case study of a 100% renewable energy supply of La Gomera island for the year 2030 [4]. The modelling tool was again EnergyPLAN and the time resolution adopted was one hour. The power, heating, and transport sectors, as well as water desalination, were taken into account. The authors showed that based on their cost assumptions all of the alternative renewable scenarios had lower annual costs compared to the business-as-usual scenario. The most utilised technologies were PV, wind, electrolysers, and biomass power plants, while the storage technologies being utilised were batteries and hydrogen storage [4]. The share of variable renewable electricity generation was from 53% to 96.7% in different scenarios, while the remaining share was met by biomass combustion [4].
Fiji represents a small island developing state that is heavily dependent on imported fossil fuels. It produced 50.9% of the electricity demand by diesel generators in 2014, with fuel import having a 21% share of total imports [9]. Thus, the authors stated that strategies for a quick transition to larger shares of renewable energy sources should be found in order to reduce the dependence on fuel imports [9]. As the authors carried out a SWOT analysis (strengths, weaknesses, opportunities, threats), they reported only yearly potentials of different technologies, without more detailed supply-demand analysis at a finer temporal resolution.
Montserrat is a Caribbean island with a population of approximately 5000. As the island was completely dependent on diesel imports, several stakeholders suggested a transition towards renewable alternatives [10]. The proposed solution included a 4.5 MW geothermal plant and 1 MW of PV. Diesel generators would only serve as an emergency backup. The authors concluded that, based on net present cost analysis, a transition to renewable energy sources presents an economically viable option. However, the availability of a large geothermal energy potential for electricity generation on islands is seldom the case.
One invited paper examined the potential for an energy independent island that would use a combination of wind and ocean energy [11]. The case study was carried out for the Aran Islands off the west coast of Ireland. Practical yearly wind generation potential was estimated to be 1599 GWh, while the wave resource potential was estimated to be 192 GWh. In order to make the island completely renewable, the authors suggested the electrification of the transport fleet and heating components. Moreover, the authors proposed flexible charging of electric vehicles which would coincide with periods of high renewable energy generation [11]. Smart charging of electric vehicles was also adopted in the present paper. Results of the paper showed that only energy efficiency measures had positive economic benefits [11].
The case study of Shetland, a group of 16 islands located in the UK, focused only on the power sector [12]. Results showed that active demand management is needed in order to incorporate increased amounts of variable renewable energy. A combination of individual electric heaters and heat storages were used for the demand response, resulting in a viable wind energy capacity of 13.9 MW, from an initial capacity of 4 MW. The resulting share of wind energy production was 25.4%, and curtailed energy was 0.6% [12].
One of the recent research papers focused on the renewable possibilities in a group of islands in Croatia [13]. Authors used an hourly supply-demand model and a combination of PV, batteries, and interconnectors between the group of islands. The four examined islands reached shares of variable renewable energy generation of 74%, 86%, 84%, and 80%. However, curtailed energy was 5% in the best case and 35% in the worst case; the worst case being the one without interconnectors to other islands [13].
Mauritius is an island with a population of around 1.2 million. As 50.7% of the final energy demand is consumed by the transport sector, Mauritius is significantly dependent on imported oil [14]. Hence, the authors of [14] suggested a holistic approach when modelling a future energy system, including the transportation and cooling sectors. The authors of [14] presented the yearly potentials of different technologies citing many different sources, without a detailed supply-demand analysis at a more detailed time resolution. Another research group focused on the possibility of 100% renewable electricity on the island of Reunion by 2030 [15]. The authors used a TIMES model, having eight hourly time slices for each day of a year [15]. The technical solution included 50% variable energy sources, mainly solar and to a lesser extent wind and wave energy, while the remaining share was met by hydro and biomass [15]. However, the authors focused solely on the power sector and not on the whole energy system. Finally, Samsø island in Denmark achieved a 100% net renewable electricity supply by a set of different energy policies and a significant inclusion of the local population in the transition [16]. Their technical solution included around 38% of primary energy demand met by variable renewable energy sources, mostly by wind, while other sources in the power sector included biomass and straw [16]. The scenarios for a 100% renewable holistic energy system were carried out at an hourly resolution, integrating the power, heating, and transport sectors [17].
Integrated energy modelling usually includes several or all of the following sectors: Power, heating/cooling, transport, gas, and water [18,19]. The integrated energy modelling approach includes all the energy sectors, as opposed to a sole focus on a single sector, such as the power sector. It has been claimed that the cross-sectoral integration can achieve significant energy savings and result in a cheaper sustainable energy system [20].
The Hawaiian Island of Maui is located in a hot climate and imports a large amount of diesel. In order to reduce its fossil fuel dependence, the US Department of Energy set a goal of achieving 40% of renewable generation by 2030 [21]. Integrated modelling revealed that curtailed energy dropped from 23.1% to 19.0% by utilising a smart charging option. In the best case simulated for the year 2030, delivered variable renewable energy reached 26.4% of the total energy delivered [21].
The literature review presented here focused mostly on the future energy system in the medium- and long-term. Moreover, a lack of the holistic approach focusing on the whole energy system can also be observed in the reviewed literature [7,15], with the power system often treated independently, and desalination infrequently included. On the other hand, papers that focused on the holistic energy system [4,8,17] focus on the short-term and used hourly time resolution. The latter resulted in viable models for energy planning purposes, but not for the operational planning, for which finer temporal resolutions are needed.
In order to tackle the problems identified in the literature, this paper aims to couple a comprehensive holistic approach in energy systems modelling with a finer temporal resolution (5 min) for a Caribbean Island case study, allowing for modelling at the operational level, rather than the planning level. Moreover, the resulting energy system is compared with the reference energy system in terms of the levelized costs of electricity. The amount of curtailed energy is often considered an important technical indicator for evaluating the integration level of variable renewable energy sources. The main goal of the paper was to reach a significant share of variable renewable energy sources in an island without interconnections to nearby regions, with a low amount of curtailed energy. In order to keep the curtailed energy as low as possible, an integrated approach between the power, cooling, transport, and water desalination sector was proposed. As islands located in hot climates, such as in the Caribbean, are often dominated by the consumption of imported diesel, this paper will evaluate the possibility to utilise significant shares of the region’s widely available renewable resources, helping to curb the amount of imported fossil fuels.
2. Methods
Energy Exemplar’s PLEXOS software (version 7.2 R2, Energy Exemplar, North Adelaide, Australia) was used to model the energy system of the representative Caribbean island nation. PLEXOS is a simulation software that uses optimisation techniques and a user-friendly interface to simulate the integrated electric power and gas systems [22]. PLEXOS can implement a user-defined time resolution, providing the needed flexibility to the modeller. In this paper, a deterministic mixed integer linear programming approach was used with the objective function to minimise the total system operational costs. The PLEXOS modelling tool is a unit commitment and economic dispatch tool that can take into account different security, fuel, and operational constraints. For the purpose of this paper, the focus was on the economic dispatch, and no security constraints were imposed that would take into account a possible sudden malfunction of a generator, voltage control, and/or frequency regulation.
For this paper, 5 min and 1 h resolutions were implemented in order to compare the differences in results when coarser and finer temporal resolutions were implemented. One year of operation of the energy system was modelled for the reference energy system, with the representative year chosen to be 2015, as well as for the near future energy system, with the modelled year chosen to be 2020.
The studied energy system integrated the power, cooling, transport, and water desalination sectors in order to absorb very large shares of variable renewable energy sources in the system. The driving force for this approach was the notion that much cheaper thermal energy storage (ice storage) can be used instead of more expensive grid batteries. Moreover, RO for water desalination can be operated flexibly, if sufficient overcapacity exists in the system, helping to match the electricity demand and supply. Furthermore, for a part of the transport sector that was anticipated to be electrified by the year 2020, a smart charging option was assumed to help balance the demand and supply. Finally, the difference between vehicle-to-grid (V2G), where electricity can be fed to the grid from vehicle batteries when they are not used, and the smart charging option was compared in a sensitivity analysis.
In the power sector, PV, wind turbines, and gas power plants driven by biomethane extracted from landfills were prioritised for different reasons. First, both PV and wind energy do not contribute to air pollution (no emissions of NOx, SOx, or particulate matter (PM)) or greenhouse gases (GHGs). Second, both PV and wind farms already exist on many of the Caribbean islands, making it easier to scale-up the installed power, as the expertise already exists in the system. Third, waste disposal is a necessity in every country; thus, it is suitable to use it for energy generation in order to reduce the negative effects of landfills. Fourth, both PV and wind turbines are rapidly developing technologies which have shown significant decreases in cost in the past several years [4]. The latter is beneficial for the economic feasibility of the energy system with large shares of renewable energy.
Based on the literature review, the two most widely used software tools for the modelling of islanded energy systems were H2RES and Homer [7]. The H2RES model follows a simple methodology of mapping the needs and resources and matching these two [23]. It has several pre-modelled technologies, such as wind, solar, wave, hydro, geothermal, biomass, fossil fuels, and desalination. Moreover, the model includes thermal storage, hydrogen storage, and batteries. It is a simulation software that uses an hourly temporal resolution. It has previously been predominantly used for case studies in Portugal and Croatia [23].
Homer is a more flexible model compared to H2RES, with the possibility of modelling the power networks in much greater detail. Homer is focused on the power sector, with capabilities for modelling many different technological constraints specific to the power sector, and can implement the temporal resolution down to one minute. Due to its heavy focus on the power sector, the software has mostly been used for smaller technical systems such as microgrids or different combinations of PV or wind turbines combined with water desalination [7]. However, the Homer software is not particularly suited for modelling different storage solutions. It only has batteries as a predefined storage option. One workaround is that by suitably tweaking different battery characteristics, it is possible to model other types of storage, e.g., pumped hydro storage [24]. The objective of the Homer software is to find the lowest-cost combination of equipment for microgrids that can consistently meet the electric load.
PLEXOS is a more flexible and comprehensive model compared to both Homer and H2RES. It has flexibility in both temporal and spatial resolutions as the modeller can choose the level of detail with which they want to model the transmission grid and load/generating characteristics. Moreover, PLEXOS has well-developed general storage solutions which can easily be adopted for any storage that generates or consumes electricity.
In this paper, the part of the transport sector that was electrified was modelled via batteries located in electric vehicles. A smart charging option was utilised, meaning that the vehicles could be charged in an optimal way from the system point of view, as long as they are parked and connected to the grid. The hourly transport demand pattern was taken from [25], while the transport energy demand for the typical Caribbean island country was taken from [26].
Thermal storage (ice storage) can provide a load-shifting possibility in the system, as the ice can be generated when there is an abundance of electricity generated in the system and then utilised when there is a lack of low marginal cost electricity available in the system. Ice storage was modelled as storage that can be filled at any point in time. The energy can then be discharged to meet the cooling loads in the system. The discharge of the storage was constrained up to the maximum amount of the cooling demand in a particular hour or 5 min period. However, the cooling demand could have been met by direct utilisation of the electricity in electric chillers, by ice storage, or by a combination of both. The latter combination was allowed to cover the possibility that due to the large installed capacity of PV, the excess electricity could be generated during the midday when the cooling demand is usually the largest. There were no implemented constraints on the number of cycles that chillers could perform in a year. The cooling pattern for hotels in hot regions was adopted from [27] while the amount of energy demand for cooling of hotels and resorts in a typical Caribbean island nation was taken from [26].
Finally, RO technology for water desalination and the associated desalinated water storage was the third modelled storage in this paper. RO can be run flexibly if an excess capacity exists in the system. The typical Caribbean island nation can have more than 38% of excess capacity for the desalination of seawater [28]. As the average consumption of electricity per m3 of desalinated water produced by RO technology is around 3.5 kWh, RO technology can be considered as storage if more desalinated water is produced when there is excess electricity available in the power system, and then stored in relatively cheap desalinated water storage. The equivalent of three days of storage of desalinated water was assumed in this study to increase the flexibility of the energy system. The approach of using water storage instead of energy storage was also adopted in [29], although their storage size was much larger, equating to 30 days of water demand. On the other hand, for the case of flexibly utilising reverse osmosis in Jordan, the storage capacity equated only to 6 h of average demand [30]. For this paper, it was assumed that a smaller capacity of three days of average water demand would provide enough flexibility in the energy system.
3. Case Study
The case study used in this paper depicts a typical island nation in the Caribbean and is based on data derived from measured data from Aruba. Our case study consists of a single island nation with a population of approximately 100,000. The yearly electricity consumption in the reference year (2015) was 657.5 GWh, while the peak load demand equates to 99.5 MW. Almost all the primary energy demand for fossil fuel is in different forms of oil, i.e., diesel, gasoline, and fuel oil. All the oil used in the energy system is imported, putting a significant burden on the current account balance of the island country. One can assess the share of oil demand in different sectors in Table 1. Electricity generation is responsible for 75% of the total oil demand.
The island is located in a very warm region, with relatively small temperature oscillations throughout the year. It does not have a space heating demand. Furthermore, it has very high wind and solar potential, with high capacity factors of wind turbines and PV.
Current power plants are driven by distillate fuel oil, consisting of back-pressure steam turbines, combustion turbines, and reciprocating engines, along with the wind turbines and PV. One can note from Table 2 that the number of generators decreased in terms of steam turbines and combustion turbines. The most demanding aspect would be to find suitable locations for another two onshore wind plants. This could possibly be solved via significant upgrades to the two sites currently in use.
Both 5 min and hourly load profiles were scaled from the real data obtained for Aruba. Load demand is expected to remain constant through the year 2020 due to increased energy efficiency measures. Hence, an increase in economic activity was assumed to be balanced by the increased energy efficiency measures, resulting in a flat electricity demand.
In order to project a realistic energy system for the short-term future, it is important not to significantly increase the number of energy generator sites, as the latter can significantly complicate the projects due to siting and permitting issues.
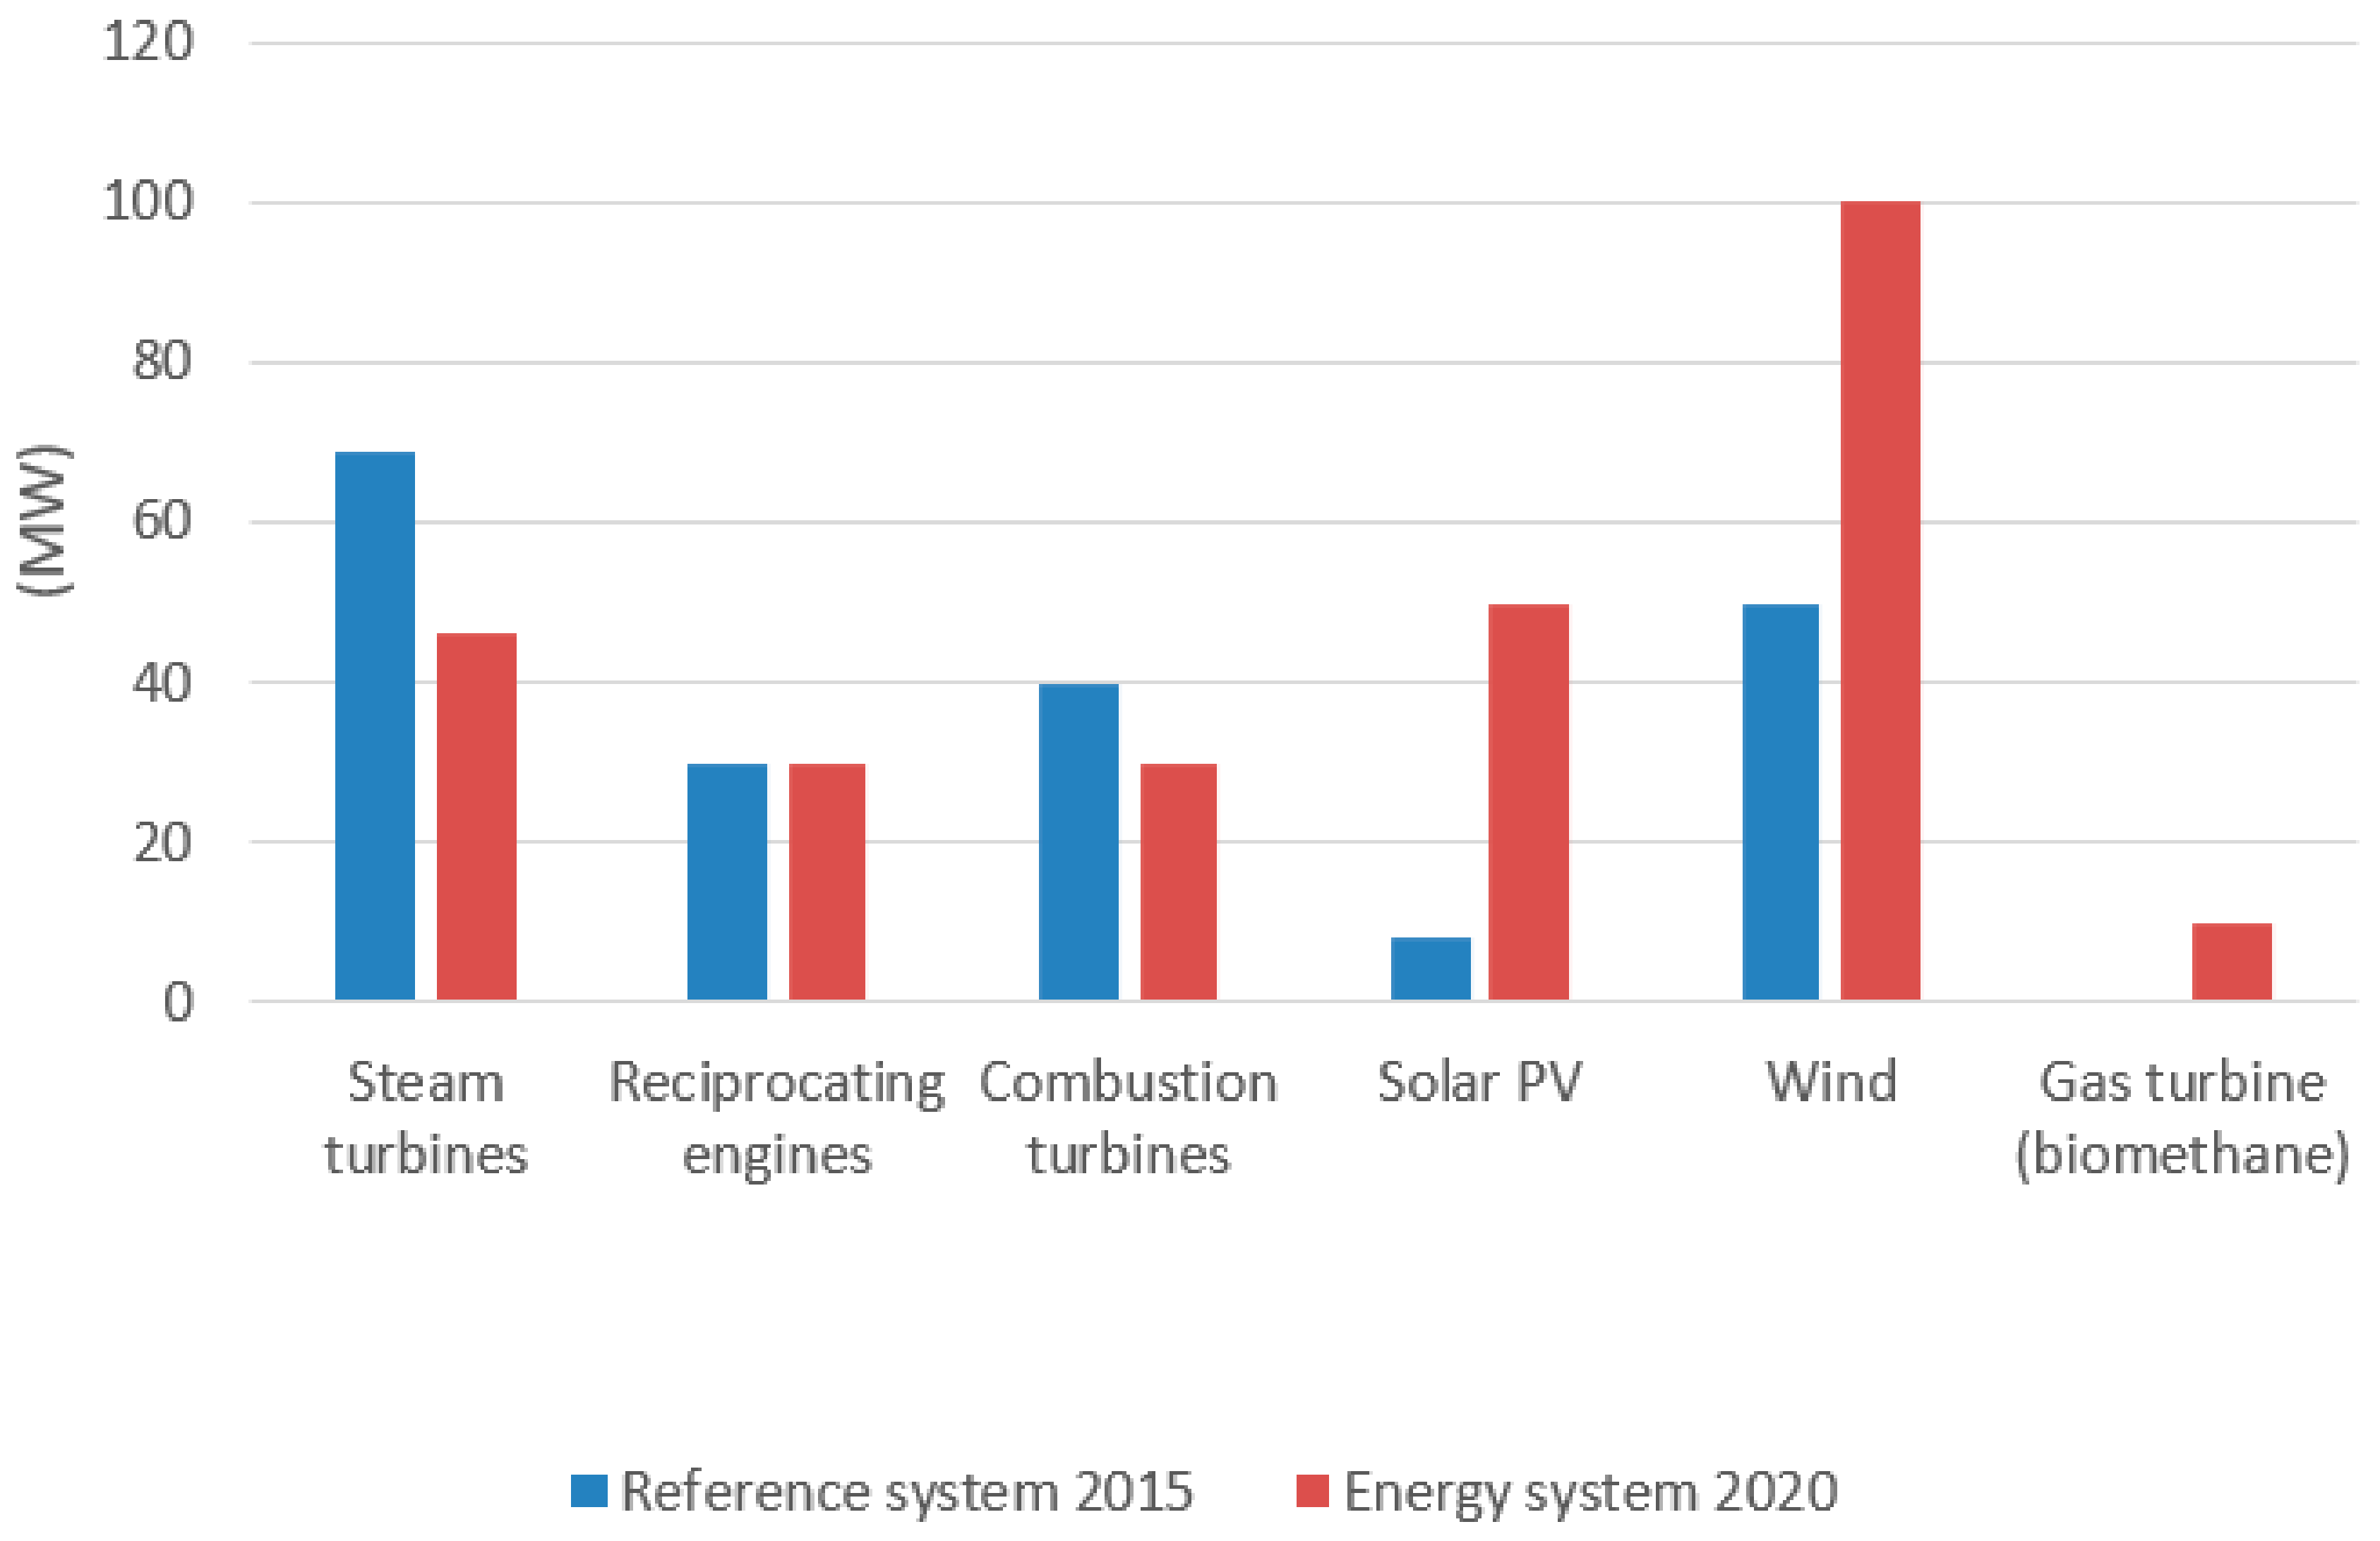
Installed capacities of the different technologies can be found in Figure 1. The total capacity of ice storage was 820 MWh, with 30 MW of power in a pumping mode and 15 MW in a discharge mode. Reverse osmosis had a capacity of 44,000 m3/day, equivalent to the peak power demand of 6.4 MW. The total capacity of batteries installed in vehicles was 25.4 MWh.
The typical distribution between different transport modes for a Caribbean island nation dominated by tourism can be seen in Table 3. Buses, tour buses, and taxis (noted with bold font) are the transport modes that could be quickly electrified via governmental policies. Moreover, these transport modes usually operate significantly more frequently than personal vehicles, which could bring additional savings to their operational costs. The transport modes anticipated to be electrified represent 11.9% of the final transport energy demand.
Economic input consisted of the investment costs of the energy plants, fixed and variable operating and maintenance (O&M) costs, and fuel costs. Socio-economic costs of the energy system were calculated and reported, meaning that the taxes were not included. A potential carbon tax [31] and the resulting costs were separately reported in the sensitivity analysis to allow for comparison if the negative externalities caused by the climate change are to be included in the socio-economic costs. The economic parameters used in this study can be seen in Table 4.
The distillate fuel oil price that was used for the year 2020 was 5.43 2015 USD/MWhfuel, while the price forecast was obtained from the US Energy Information Administration [37]. Possible carbon tax for the year 2020 was set at 15 USD/tonCO2, based on [31]. The weighted average cost of capital (WACC) that was used for the economic calculations was 7%.
Based on reference [26], it was assumed that 15% of the total electricity consumption over the year goes toward the cooling of hotels and resorts in the Caribbean nations. It was assumed that the same share of the peak load is demanded by the cooling systems of hotels and resorts. Hourly cooling distribution was adapted from [27], that was made for the case of Singapore, which also has steady temperatures without distinctive seasons over the year. The total capacity of thermal storage (ice storage) was set to the equivalent of three days of cooling demand, i.e., to 0.8 GWh. The heat exchangers could deliver 15 MW of cold in the discharging mode and store 30 MW of cold in the charging mode.
In total, 88.5 GWh of the yearly oil demand for transport (11.9% of the total oil demand for transport) was electrified, as it was assumed that buses, tour buses, and taxis could quickly switch to electrified means, due to the large operational times and thus, large potential operational savings when electrified. Due to the increased efficiency of electric motors compared to the internal combustion engines, it was assumed that the buses would become more efficient by a factor of 2.5 [38,39] and taxis by a factor of 3.5 [40]. The resulting final electricity demand for the same transport demand amounted to 30.7 GWh/year.
It was assumed that the consumption of buses is 1.35 kWh/km [38] and the consumption of cars is 0.2 kWh/km [40]. Battery capacities were 320 kWh per bus and 100 kWh per car (taxi). Buses were charged via 150 kW chargers and cars via 100 kW chargers. The resulting capacity of batteries in all the electrified vehicles in the year 2020 was 21.3 MWh for the case of buses and 4.1 MWh for the case of cars.
The main economic indicator for the energy system was the total socio-economic cost of the system, while the technical indicators were fossil fuel consumption, total primary energy supply, curtailed energy, and the need for dispatchable power sources in the system for the case when neither wind turbines nor PV were generating electricity. Total CO2 emissions were the environmental indicator of the energy system.
4. Results
The energy system was simulated via the PLEXOS model built from the data described in Section 3, finding the cost-optimal generation mix, resulting in minimised operating costs of the energy system. The total load demand and curtailed energy on both 5 min and 1 h time resolutions, in addition to the primary energy supply in the energy sector, can be seen in Table 5.
One can note from Table 5 that the curtailed energy is significantly greater with the 5 min resolution than with the 1 h temporal resolution. The reason is that the sudden spikes in the energy generation from the variable energy sources are averaged out in the 1 h resolution data, not revealing the true amount of the curtailed energy. It is important to note that in the Caribbean both PV and onshore wind turbines have high capacity factors, i.e., 54.1% for wind turbines and 25.3% for PV in this case study. The total curtailed energy with the 5 min resolution data for the year 2020 was equal to 1.0% of the total generated electricity.
For the energy system in the year 2020, PV met 14.5% of the total electricity demand, wind met 63.6% of the total electricity demand, and the biogas power plant met 6.5% of the total electricity demand. Therefore 78.1% of the total electricity demand was met by variable renewable energy sources and a total of 84.6% of the electricity demand was met by renewable energy sources. The shares of steam turbine plants, combustion turbine plants, and reciprocating engines electricity generation were 4.8%, 0.1% and 10.6%, respectively.
Electric vehicles consumed a total of 30.7 GWh of electricity (11.9% of the end-use transport demand and 4.4% of the total electricity generation), and all of the energy demand was met via smart charging. Excess capacity of the RO for water desalination used the 0.9 GWh of electricity in a flexible manner (0.13% of the total electricity generation), acting as a flexible load for the grid. Ice storage provided 19.16 GWh of thermal (cooling) energy to the hotels and resorts, equivalent to the 19.4% of the total cooling demand of the hotels and resorts. The remaining amount was met by direct utilisation of electricity in electric chillers.
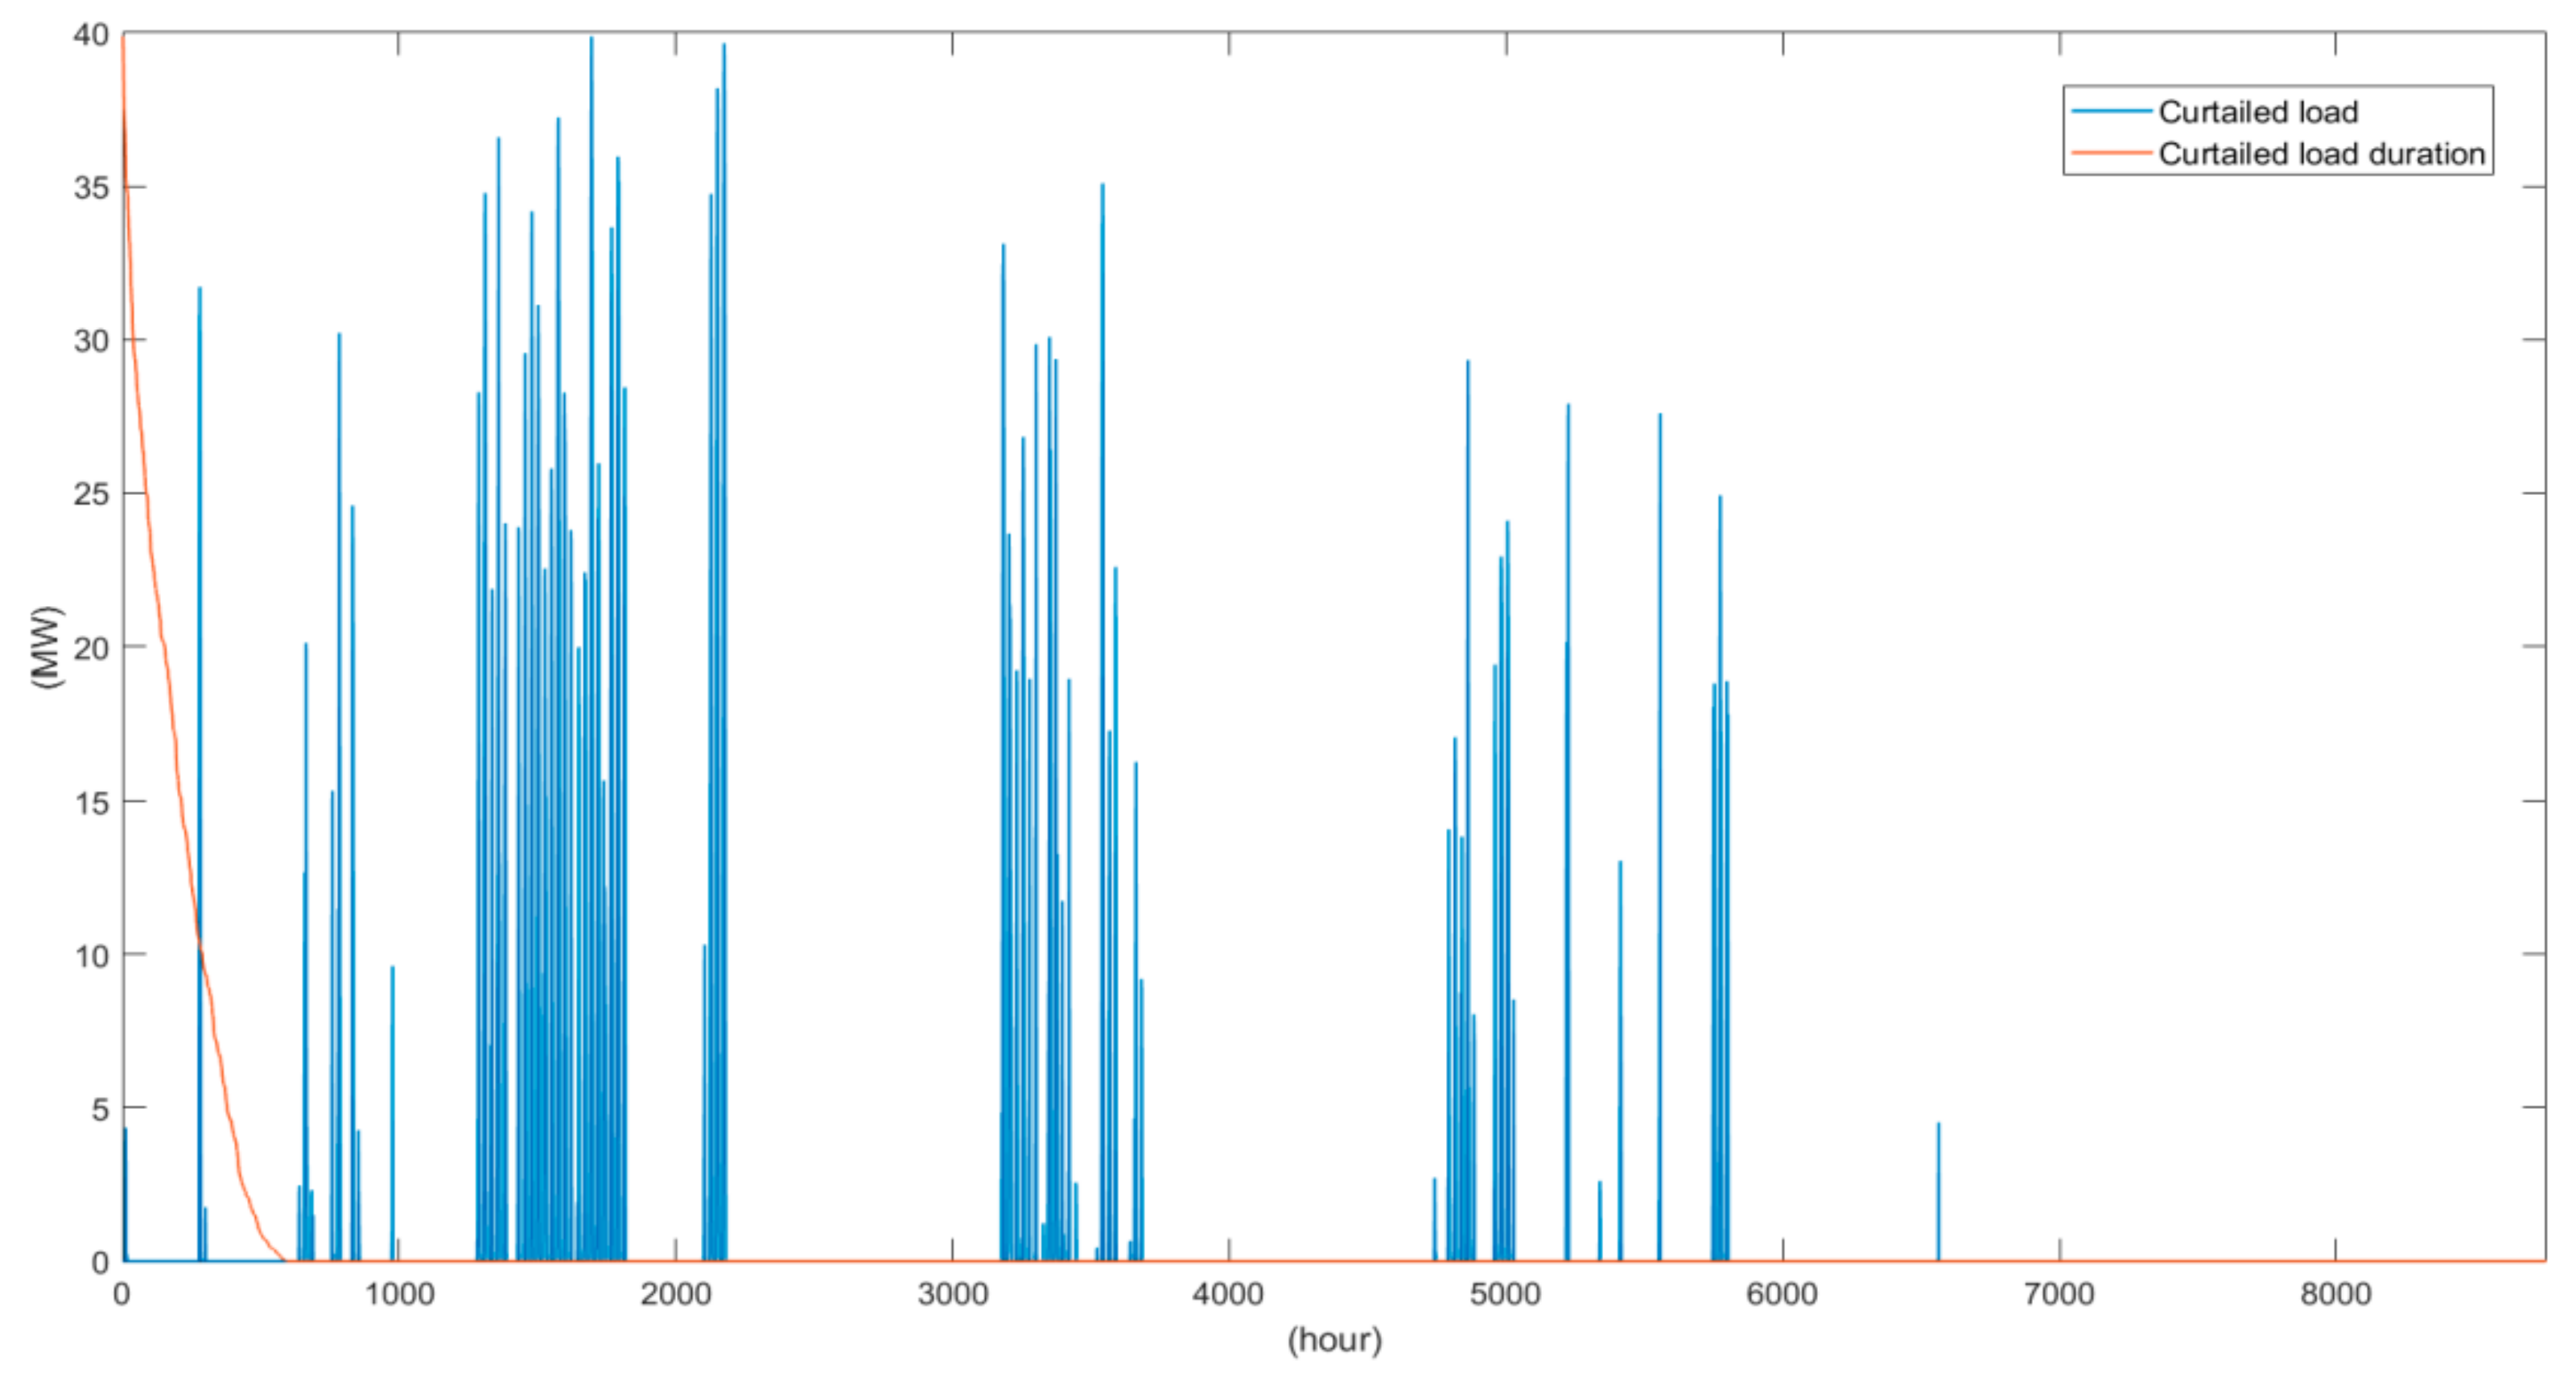
The curtailed energy in the hours of the occurrence, as well as the curtailed load duration representation, can be seen in Figure 2. It can be seen that the curtailed energy occurred during a small number of hours, but at very high levels. Curtailed energy occurred during 5.3% of the yearly 5 min intervals.
The maximum dispatchable power needed on the 5 min time resolution was 98.5 MW or 89% of the peak load of the system. Although there were 104 h when neither wind turbines nor PV were generating electricity, the dispatchable power needed was lower than the peak load due to the mismatch in the peak load demand and periods without any generation from variable sources, as well as the ability of thermal energy storage to cover part of the cooling load instead of using electricity directly in chillers.
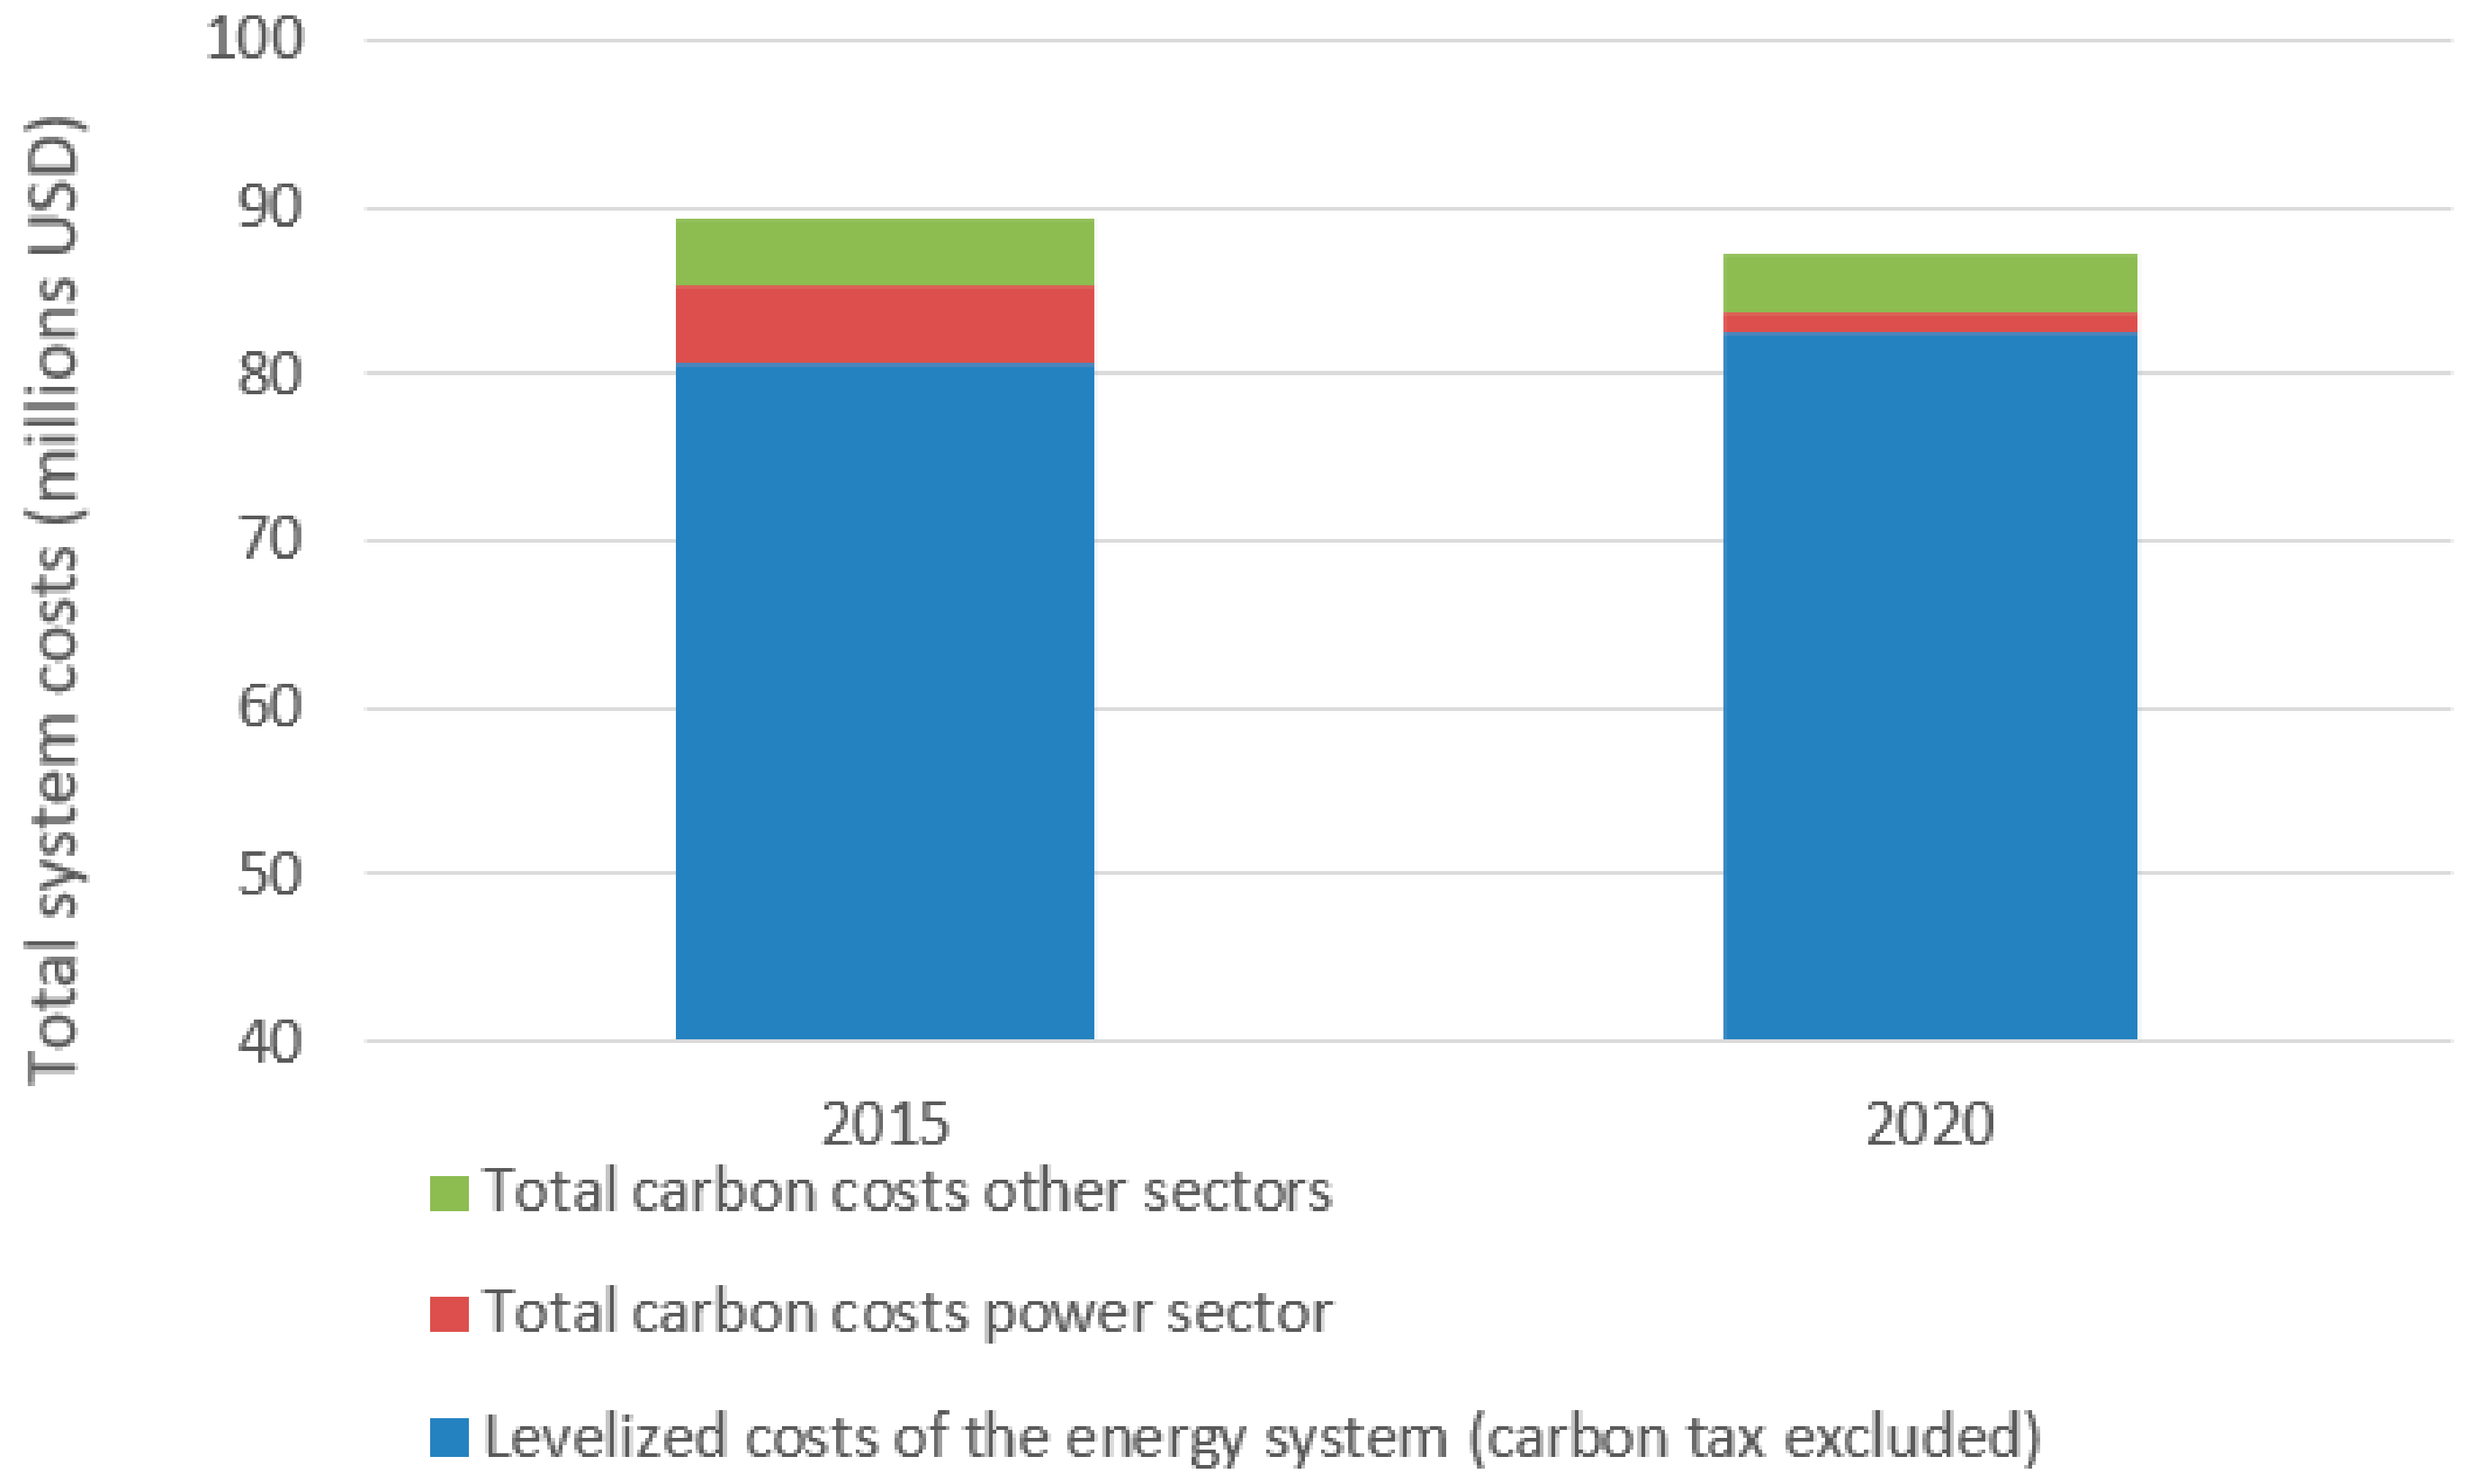
The total system costs are presented in Figure 3. The levelized costs of the energy system (carbon costs excluded) were 2.2% higher in the year 2020 than in the year 2015. On the other hand, the socio-economic costs of the energy system (carbon costs included) were 2.5% lower in the year 2020 than in the year 2015.
Detailed economic results of the contributing costs of different parts of the energy system to the overall costs can be seen in Figure 4. One should note that only the costs of the transportation that underwent electrification are presented in Figure 4 as the costs for other vehicle types did not differ between the two compared energy systems.
A sensitivity analysis was carried out in order to check the impact of a potential V2G charging concept versus smart charging. The sensitivity analysis was carried out with the 5 min temporal resolution data. The amount of curtailed energy was 7.01 GWh in the V2G case, versus 7.12 GWh in the smart charging case. The V2G option managed to integrate only marginally more renewable energy sources, 84.7% to 84.6%. Hence, it can be concluded that smart charging is sufficient for the penetration levels of the variable renewable energy sources assumed in this case study. The latter could be an important finding as many vehicle manufacturers could be hesitant to allow for the higher cycling of vehicle batteries that would be needed if the V2G option were to be utilised.
Another sensitivity analysis was carried out in order to check the sensitivity of the fossil fuel based energy system on the price of oil. As it can be seen from Figure 3, the levelized costs of the energy system (without carbon tax included) were 2.2% higher for the renewables-based energy system than the fossil fuel based energy system. The sensitivity analysis showed that a fuel price increase of 7.3% compared to the prices reported by the US Energy Information Administration [37] would be needed to reach the price parity of both energy systems in terms of the levelized costs (carbon tax excluded).
The CO2 emissions of the energy sector, transportation, and industry can be seen in Table 6. Carbon emissions in the power sector were reduced by 76% in 2020 compared to the reference system. The total carbon emissions were reduced by 46% in the year 2020 compared to the energy system of the reference year.
5. Discussion
Using the integrated energy modelling approach described in this paper, an energy system with a significant amount of variable renewable energy was simulated at a cost similar to the traditional, fossil fuel-based energy system in the Caribbean. Moreover, it was shown that when a significant amount of variable energy is modelled in the system, a sub-hourly temporal resolution is needed in order to realistically capture the curtailed energy. Furthermore, it was shown that the energy system could significantly change in the near future using existing technology solutions.
Generally, there are four main flexibility sources in an energy system: Transmission capacity to neighbouring areas for import/export of electricity, energy storage, demand response, and power-to-heat or power-to-gas technologies [41]. In this paper, the value of energy storage and power-to-heat flexibility sources in meeting carbon and fuel reduction goals was investigated. It is important to note that no grid battery storage was installed, while very large shares of variable renewable energy were still integrated in a competitive manner.
Also important to note is that the ice storage is significantly cheaper than the battery storage and this fact was successfully utilised in the modelled energy system [42]. Although the battery prices have dropped significantly in the last decade, and even if the positive trends continue, the resulting prices of different battery types are anticipated to be in the range of 100–200 USD/kWh [43]. Compared to the ice storage prices of 10 USD/kWh, shown in Table 4, one can note that the future prices are expected to be at least one order of magnitude lower compared to the prices of battery storage. The latter points to the importance of integrated modelling of the power and cooling sectors, and more broadly heating, ventilation, and air conditioning (HVAC), in order to make it possible to utilise the lower capital expenses (CAPEX) costs of thermal energy storage technologies.
The achieved curtailed energy in this paper was 1.0% of the total generated electricity, which is a lower amount than given in [44], where the 5% threshold was achieved. Moreover, on one of the resulting charts from [8], it could be seen that all the future scenarios modelled for the Åland Islands had between 2% and 28% of the energy curtailed, a much larger amount than in the present paper. Furthermore, this case study generated 78.1% of electricity from the variable energy sources, compared to the 38% for the case of renewable energy on Samsø island [16] and around 50% for the case of renewable energy on Reunion island [15]. In addition, the local integrated energy system without the import/export transmission capacity achieved a 57% share of the variable renewable energy generation, without the reported curtailed energy (modelled on a 1 h temporal resolution) [45]. Finally, the resulting curtailed energy in the present paper was significantly lower than in [13], which focused on the power sector only. In [13], shares of variable renewable energy generation were between 74% and 86% for different islands, and the achieved curtailed energy was 5% in the best performing island, which included an interconnector with the nearby island. In the worst performing case, curtailed energy reached 35%.
The transport sector can play an important role in providing flexibility when electrified. One paper that used the same modelling tool as the present paper showed that the smart charging of vehicles does not cause an increased peak load for the case of Ireland [46]. In this paper, the electrified part of the transport sector successfully provided the flexibility needed for the integration of a significant amount of renewable energy sources. Furthermore, the difference between smart charging and the V2G mode was only marginal, i.e., the amount of curtailed energy reduced by 1.5% in the case of the V2G operational mode (from 7.12 GWh to 7.01 GWh). However, keeping in mind that the total curtailed energy of the energy system of 2020 amounted to the 1.0%, the resulting difference between smart charging and V2G is not significant.
Finally, oil imports could be significantly reduced by adopting the proposed measures in the energy sector. The resulting oil imports for the power, transport, and industry sectors in 2020 would be 46.4% lower than in 2015, see Table 5. Reduced oil imports would improve the balance of payments, as well as increase the generation diversity. Furthermore, a shift towards more capital intensive renewable energy sources would shift the burden of operational costs from variable cost, dependent on the changing fuel prices, to fixed costs, which can be planned for in advance. Moreover, the holistic energy modelling and resulting measures, as well as the achieved lower reliance on the imported oil for a typical Caribbean island nation is in line with the recommendations made for Mauritius [14].
There are several limitations of this study. First, the adopted 5 min temporal resolution is still not sufficient for modelling frequency and voltage control, which could impose further costs on the power system. Second, the transmission and distribution grids were not modelled, resulting in a lack of potential to capture grid congestion which could further curtail a certain amount of renewable generation. Third, due to the lack of available data, industry consumption data was not optimised in the system, meaning that there are probably additional efficiencies that could have been captured. Fourth, only the socio-economic costs were reported, which lacks the detailed business-economic analysis needed if the push for more PV and wind energy were to be achieved by private investors. Fifth, air pollution and the corresponding negative externalities were not captured by this model. Although one can argue that more wind energy and PV will emit less harmful emissions and pollutants (NOx, SOx, and PM) compared to oil-driven technology, the latter difference was not quantitatively calculated by this model. The limitations mentioned here represent possible future research directions that could further improve energy planning of the island countries, especially for those located in the hot regions, like the ones in the Caribbean.
As globally more than 11,000 inhabited islands can be found, with a population of around 740 million people [45], the results of this study are relevant for many different case studies, especially those of developed countries in tropical regions. Furthermore, the results of this study are relevant for any energy system with a large cooling demand, which is not connected to the surrounding regions via transmission cables.
6. Conclusions
An integrated energy modelling approach for a Caribbean Island case study was carried out in this work. The study focused on the energy transition in the short-term, taking into account the power, transport, cooling, and water desalination sectors. Moreover, the study focused on the operational planning of the energy system with a large share of variable renewable energy sources, adopting a 5 min time resolution. Several conclusions arose from this study:
- Integrated energy modelling allowed for integration of a large share of variable renewable energy sources, i.e., 78.1% of the final electricity demand was met by variable renewable energy sources, with 1.0% of curtailed energy in total, although the modelled energy system did not have external transmission capacity with the surrounding regions.
- A Vehicle-to-grid (V2G) charging option had only marginally better results in integrating variable renewable energy sources (measured by reduction in curtailed energy) than the smart charging option, reducing the amount of curtailed electricity generation by only 1.5% (from 7.12 GWh to 7.01 GWh).
- The energy system based on variable renewable energy sources had a similar economic cost compared to the incumbent, fossil fuels based energy system. The renewable energy system was 2.2% more expensive the than fossil fuels based energy system, excluding the costs of CO2 emissions. In terms of socio-economic costs of the energy system (carbon costs included), the renewable energy system was 2.5% cheaper than the fossil fuel based one. One of the sensitivity analyses showed that fossil fuel prices would need to increase by 7.3% in order for levelized costs of the renewable energy system to reach the price parity of the fossil fuel based energy system.
- Oil imports could be reduced by 46% in this case study, potentially reducing the negative current account balances for small island nations.
- A large number of inhabited islands worldwide (more than 11,000 with approximately 740 million inhabitants) makes the result of this study relevant and transferable to other case studies located in the warm regions.
Author Contributions
Conceptualization, D.F.D.; Data curation, G.S.; Formal analysis, D.F.D.; Investigation, D.F.D. and G.S.; Methodology, D.F.D., G.S., B.-M.H. and A.S.P.; Project administration, B.-M.H. and A.S.P.; Resources, B.-M.H. and A.S.P.; Software, G.S.; Supervision, G.S., B.-M.H. and A.S.P.; Validation, D.F.D.; Writing—original draft, D.F.D.
Funding
This work was financed as a part of the CITIES project No. DSF1305-00027B funded by the Danish Innovationsfonden. Its contribution is greatly acknowledged. The latter project covered the open access fee for publishing of the present paper. Moreover, a guest research stay of the first author of the present paper at National Renewable Energy Laboratory in Colorado, USA was funded by the EliteForsk grant for the best young researchers in Denmark, obtained by the Danish Ministry of Higher Education and Science. Furthermore, this work was authored in part by Alliance for Sustainable Energy, LLC, the Manager and Operator of the National Renewable Energy Laboratory for the U.S. Department of Energy (DOE) under Contract No. DE-AC36-08GO28308. The views expressed in the article do not necessarily represent the views of the DOE or the U.S. Government. The U.S. Government retains and the publisher, by accepting the article for publication, acknowledges that the U.S. Government retains a non-exclusive, paid-up, irrevocable, worldwide license to publish or reproduce the published form of this work, or allow others to do so, for U.S. Government purposes.
Acknowledgments
WEB Aruba provided us initial datasets for developing the case study. We are thankful for their support.
Conflicts of Interest
The authors declare no conflict of interest.
References
- United Nations Framework Convention on Climate Change (UNFCCC). The Paris Agreement; UNFCCC: New York, NY, USA, 2017. [Google Scholar]
- Intergovernmental Panel on Climate Change (IPCC). Fifth Assessment Report; IPCC: Geneva, Switzerland, 2014. [Google Scholar]
- European Commission. European, Communication from the Commission to the Parliament, the Council, the European Economic and Social Committee and the Committee of the Regions; Energy Roadmap 2050; European Commission: Brussels, Belgium, 2011. [Google Scholar]
- Meschede, H.; Child, M.; Breyer, C. Assessment of sustainable energy system configuration for a small Canary island in 2030. Energy Convers. Manag. 2018, 165, 363–372. [Google Scholar] [CrossRef]
- Shah, I.H.; Hiles, C.; Morley, B. How do oil prices, macroeconomic factors and policies affect the market for renewable energy? Appl. Energy 2018, 215, 87–97. [Google Scholar] [CrossRef]
- Lazard. Lazard’s Levelised Cost of Energy Analysis—Version 110; Lazard: Hamilton, Bermuda, 2017. [Google Scholar]
- Liu, Y.; Yu, S.; Zhu, Y.; Wang, D.; Liu, J. Modeling, planning, application and management of energy systems for isolated areas: A review. Renew. Sustain. Energy Rev. 2018, 82, 460–470. [Google Scholar] [CrossRef]
- Child, M.; Nordling, A.; Breyer, C. Scenarios for a sustainable energy system in the Åland Islands in 2030. Energy Convers. Manag. 2017, 137, 49–60. [Google Scholar] [CrossRef]
- Prasad, R.D.; Bansal, R.C.; Raturi, A. A review of Fiji’s energy situation: Challenges and strategies as a small island developing state. Renew. Sustain. Energy Rev. 2017, 75, 278–292. [Google Scholar] [CrossRef]
- Römer, B.; Aldonza, K.; Julliard, Y.; Lewis, O. Planning 100% renewable energy islands: The case of the Caribbean island of Montserrat. CIRED Open Access Proc. J. 2017, 2017, 2488–2492. [Google Scholar] [CrossRef]
- Denny, E.; Keane, A. A smart integrated network for an offshore Island. Proc. IEEE 2013, 101, 942–955. [Google Scholar] [CrossRef] [Green Version]
- Mathieson, C.; Gill, S.; Dolan, M.; Emhemed, A.; Kockar, I.; Barnacle, M.; Ault, G. Increasing renewable penetration on islanded networks through active network management: A case study from Shetland. IET Renew. Power Gener. 2015, 9, 453–465. [Google Scholar] [CrossRef] [Green Version]
- Pfeifer, A.; Dobravec, V.; Pavlinek, L.; Krajačić, G.; Duić, N. Integration of renewable energy and demand response technologies in interconnected energy systems. Energy 2018, 161, 447–455. [Google Scholar] [CrossRef]
- Khoodaruth, A.; Oree, V.; Elahee, M.K.; Clark, W.W. Exploring options for a 100% renewable energy system in Mauritius by 2050. Util. Policy 2017, 44, 38–49. [Google Scholar] [CrossRef]
- Maïzi, N.; Mazauric, V.; Assoumou, E.; Bouckaert, S.; Krakowski, V.; Li, X.; Wang, P. Maximizing intermittency in 100% renewable reliable power systems: A holistic approach applied to Reunion Island in 2030. Appl. Energy 2017. [Google Scholar] [CrossRef]
- Sperling, K. How does a pioneer community energy project succeed in practice? The case of the samsø renewable energy island. Renew. Sustain. Energy Rev. 2017, 71, 884–897. [Google Scholar] [CrossRef]
- Mathiesen, B.V.; Hansen, K.; Skov, I.R.; Lund, H.; Nielsen, S. Samsø Energy Vision 2030: Converting Samsø to 100% Renewable Energy; Department of Development and Planning, Aalborg University: Aalborg, Danmark, 2015. [Google Scholar]
- EnergyPLAN. Smart Energy Systems. Available online: http://www.energyplan.eu/smartenergysystems/ (accessed on 4 August 2017).
- Dincer, I.; Acar, C. Smart energy systems for a sustainable future. Appl. Energy 2017, 194, 225–235. [Google Scholar] [CrossRef]
- Lund, H.; Østergaard, P.A.; Connolly, D.; Mathiesen, B.V. Smart energy and smart energy systems. Energy 2017, 137, 556–565. [Google Scholar] [CrossRef]
- Corbus, D.; Kuss, M.; Piwko, D.; Hinkle, G.; Matsuura, M.; McNeff, M.; Roose, L.; Brooks, A. All options on the table: Energy systems integration on the island of Maui. IEEE Power Energy Mag. 2013, 11, 65–74. [Google Scholar] [CrossRef]
- Energy Exemplar. PLEXOS® Simulation Software. Available online: https://energyexemplar.com/software/plexos-desktop-edition/ (accessed on 19 April 2018).
- Faculty of Mechanical Engineering University of Zagreb. H2RES Model. Available online: http://h2res.fsb.hr/ (accessed on 19 April 2018).
- Canales, F.A.; Beluco, A. Modeling pumped hydro storage with the micropower optimization model (HOMER). J. Renew. Sustain. Energy 2014, 6, 043131. [Google Scholar] [CrossRef]
- Venkatanarayana, R.; Smith, B.; Demetsky, M. Quantum-frequency algorithm for automated identification of traffic patterns. Transp. Res. Rec. J. Transp. Res. Board 2008, 2024, 8–17. [Google Scholar] [CrossRef]
- McMahon, H.; Cullinen, M.; Lee, T.; Kazemi, L. Smart Growth Pathways: Building a Green Platform for Sustainable Aruba; Carbon War Room: New York, NY, USA, 2013. [Google Scholar]
- Oh, S.J.; Ng, K.C.; Thu, K.; Chun, W.; Chua, K.J.E. Forecasting long-term electricity demand for cooling of Singapore’s buildings incorporating an innovative air-conditioning technology. Energy Build. 2016, 127, 183–193. [Google Scholar] [CrossRef]
- Aruba, W. Technologies Used for Desalination. Available online: https://www.webaruba.com/water-production/technologies-used (accessed on 19 April 2018).
- Tafech, A.; Milani, D.; Abbas, A. Water storage instead of energy storage for desalination powered by renewable energy—King Island case study. Energies 2016, 9, 839. [Google Scholar] [CrossRef]
- Novosel, T.; Ćosić, B.; Krajačić, G.; Duić, N.; Pukšec, T.; Mohsen, M.S.; Ashhab, M.S.; Ababneh, A.K. The influence of reverse osmosis desalination in a combination with pump storage on the penetration of wind and PV energy: A case study for Jordan. Energy 2014, 76, 73–81. [Google Scholar] [CrossRef] [Green Version]
- Clyne, G. The Case for a Caribbean Carbon Market; NewSecurityBeat: Washington, DC, USA, 2016. [Google Scholar]
- Energy Technology Systems Analysis Program (IEA-ETSAP); International Renewable Energy Agency (IRENA). Thermal Energy Storage—Insights for Policy Makers; IEA-ETSAP: Paris, France; IRENA: Abu Dhabi, UAE, 2013. [Google Scholar]
- US Department of ENERGY (DOE). Combined Heat and Power Technology Fact Sheet Series; Reciprocating Engines; DOE: Washington, DC, USA, 2016.
- Energinetdk. Technology Data for Energy Plants; Energinetdk: Erritsø, Denmark, 2012; ISBN 978-87-7844-940-5. [Google Scholar]
- International Renewable Energy Agency (IRENA). Renewable Power Generation Costs in 2017 Abu Dhabi; IRENA: Abu Dhabi, UAE, 2018. [Google Scholar]
- Ghaffour, N.; Missimer, T.M.; Amy, G.L. Technical review and evaluation of the economics of water desalination: Current and future challenges for better water supply sustainability. Desalination 2013, 309, 197–207. [Google Scholar] [CrossRef] [Green Version]
- US Energy Information Administration. Annual Energy Outlook 2018; Scenario ref2018; US Energy Information Administration: Washington, DC, USA, 2018.
- Zhou, B.; Wu, Y.; Zhou, B.; Wang, R.; Ke, W.; Zhang, S.; Hao, J. Real-world performance of battery electric buses and their life-cycle benefits with respect to energy consumption and carbon dioxide emissions. Energy 2016, 96, 603–613. [Google Scholar] [CrossRef]
- Graurs, I.; Laizans, A.; Rajeckis, P.; Rubenis, A. Public bus energy consumption investigation for transition to electric power and semi-dynamic charging. Eng. Rural. Dev. 2015, 14, 366–371. [Google Scholar]
- Dominković, D.F.; Bačeković, I.; Pedersen, A.S.; Krajačić, G. The future of transportation in sustainable energy systems: Opportunities and barriers in a clean energy transition. Renew. Sustain. Energy Rev. 2018, 82, 1823–1838. [Google Scholar] [CrossRef]
- Dominković, D.F.; Gianniou, P.; Münster, M.; Heller, A.; Rode, C. Utilizing thermal building mass for storage in district heating systems: Combined building level simulations and system level optimization. Energy 2018, 153, 949–966. [Google Scholar] [CrossRef]
- Lund, H.; Østergaard, P.A.; Connolly, D.; Ridjan, I.; Mathiesen, B.V.; Hvelplund, F.; Thellufsen, J.Z.; Sorknæs, P. Energy storage and smart energy systems. Int. J. Sustain. Energy Plan. Manag. 2016, 11, 3–14. [Google Scholar] [CrossRef]
- International Renewable Energy Agency (IRENA). Electricity Storage and Renewables: Costs and Markets to 2030; IRENA: Abu Dhabi, UAE, 2017. [Google Scholar]
- Dominković, D.F.; Bačeković, I.; Ćosić, B.; Krajačić, G.; Pukšec, T.; Duić, N.; Markovska, N. Zero carbon energy system of South East Europe in 2050. Appl. Energy 2016, 184, 1517–1528. [Google Scholar] [CrossRef]
- Bačeković, I.; Østergaard, P.A. Local smart energy systems and cross-system integration. Energy 2018, 151, 812–825. [Google Scholar] [CrossRef]
- Foley, A.; Tyther, B.; Calnan, P.; Ó Gallachóir, B. Impacts of electric vehicle charging under electricity market operations. Appl. Energy 2013, 101, 93–102. [Google Scholar] [CrossRef]
Figure 1.
Installed capacities of different technologies in the year 2015 and 2020.

Figure 2.
Curtailed energy in the energy system of 2020.

Figure 3.
The total system costs of energy systems in 2015 and 2020 (note that y-axis does not start at zero).
Figure 3.
The total system costs of energy systems in 2015 and 2020 (note that y-axis does not start at zero).

Figure 4.
Economic results (carbon costs excluded) of the energy systems in the reference year and the year 2020.
Figure 4.
Economic results (carbon costs excluded) of the energy systems in the reference year and the year 2020.


Table 1.
Primary energy demand for the representative Caribbean island.
| Oil Consumption | GWh/Year | Share |
|---|---|---|
| Electricity generation | 3141 | 75% |
| Transport | 743 | 18% |
| Industry | 304 | 7% |
| Total | 4188 |
Table 2.
Number of generator units and the total installed capacities in 2015 and 2020 *.
| Reference System 2015 (MW) | Energy System 2020 (MW) | |
|---|---|---|
| Steam turbines | 4 (69) | 3 (46) |
| Reciprocating engines | 6 (30) | 6 (30) |
| Combustion turbines | 5 (40) | 4 (30) |
| Solar PV | 1 (8) | 2 (50) |
| Wind | 2 (50) | 4 (100) |
| Gas turbine (biomethane) | 0 | 1 (10) |
* For PV and wind plants the stated value represents the number of locations. The total capacities are stated in parentheses.
Table 3.
The share of different transportation modes in a typical Caribbean island [26].
Table 3.
The share of different transportation modes in a typical Caribbean island [26].
| Number | Fuel Type | Total Gallons per Day | Share | GWh/Year | |
|---|---|---|---|---|---|
| Passenger cars | 24,991 | gasoline | 15,446 | 28.0% | 204 |
| Passenger vans (gasoline) | 17,493 | gasoline | 14,788 | 26.8% | 195 |
| Passenger vans (diesel) | 4806 | diesel | 2844 | 5.2% | 40 |
| Trucks | 901 | diesel | 10,030 | 18.2% | 141 |
| Buses | 116 | diesel | 2409 | 4.4% | 34 |
| Tour buses | 173 | diesel | 1497 | 2.7% | 21 |
| Taxis | 373 | gasoline | 2557 | 4.6% | 34 |
| Rental | 3620 | gasoline | 4648 | 8.4% | 61 |
| Government vehicles | 448 | gasoline | 383 | 0.7% | 5 |
| Motorcycles | 1791 | gasoline | 610 | 1.1% | 8 |
| Total | 15,446 | 743 |
Table 4.
Economic parameters used in the study.
| Investment Cost (USD/MW) | Fixed O&M (USD/MW) | Variable O&M (USD/MWh) | Efficiency | Technical Lifetime (year) | Ref. | |
|---|---|---|---|---|---|---|
| Steam turbines | 1,500,000 | 45,000 | 4.25 | 26% | 30 | [32] |
| Reciprocating engines | 1,430,000 | 0 | 9 | 42% | 25 | [33] |
| Combustion turbines (mini size, 0.1–5 MW) | 1,750,000 | 0 | 7 | 29% | 25 | [34] |
| Wind turbines | 1,384,000 | 22,000 | 0 | 20 | [35] | |
| Photovoltaics | 1,450,000 | 14,000 | 0 | 30 | [35] | |
| Biomethane (gas turbine, medium size, 5–40 MW) | 1,400,000 | 0 | 4.25 | 40% | 25 | [34] |
| Desalination plant (USD/m3/day) | 800 | 40 | 0 | 25 | [36] | |
| Ice storage (USD/MWh) | 10,000 | 250 | 0 | 90% | 25 | [32] |
Table 5.
Technical indicators of the energy system.
| Indicator | 2015 | 2020 |
|---|---|---|
| Peak demand (MW) 1 h | 93.6 | 109.4 |
| Peak demand (MW) 5 min | 99.5 | 110.6 |
| Total generation (GWh) | 657.5 | 699.0 |
| Curtailed energy 1-h (GWh) | 0 | 0.5 |
| Curtailed energy 5-min (GWh) | 0 | 7.1 |
| Wind (GWh) | 237.9 | 461.5 |
| PV (GWh) | 17.81 | 98.4 |
| Oil * for power sector (GWh) | 1273.2 | 305.8 |
| Oil * for transport and industry (GWh) | 1047 | 939 |
| Primary energy supply (GWh) | 2575.8 | 1805.1 |
* All of the oil consumption was imported.
Table 6.
CO2 emissions in the energy system.
| Carbon Emissions | 2015 | 2020 | Unit |
|---|---|---|---|
| Carbon emissions power sector | 317,000 | 76,000 | tonCO2 |
| Total carbon emissions (including industry and transport) | 578,000 | 311,000 | tonCO2 |
© 2018 by the authors. Licensee MDPI, Basel, Switzerland. This article is an open access article distributed under the terms and conditions of the Creative Commons Attribution (CC BY) license (http://creativecommons.org/licenses/by/4.0/).
Share and Cite
MDPI and ACS Style
Dominković, D.F.; Stark, G.; Hodge, B.-M.; Pedersen, A.S. Integrated Energy Planning with a High Share of Variable Renewable Energy Sources for a Caribbean Island. Energies 2018, 11, 2193. https://doi.org/10.3390/en11092193
AMA Style
Dominković DF, Stark G, Hodge B-M, Pedersen AS. Integrated Energy Planning with a High Share of Variable Renewable Energy Sources for a Caribbean Island. Energies. 2018; 11(9):2193. https://doi.org/10.3390/en11092193
Chicago/Turabian StyleDominković, Dominik Franjo, Greg Stark, Bri-Mathias Hodge, and Allan Schrøder Pedersen. 2018. "Integrated Energy Planning with a High Share of Variable Renewable Energy Sources for a Caribbean Island" Energies 11, no. 9: 2193. https://doi.org/10.3390/en11092193
Note that from the first issue of 2016, this journal uses article numbers instead of page numbers. See further details here.