Deformation, Permeability and Acoustic Emission Characteristics of Coal Masses under Mining-Induced Stress Paths

1
State Key Laboratory of Eco-hydraulics in Northwest Arid Region, Xi’an University of Technology, Xi’an 710048, China
2
School of Civil Engineering, Henan Polytechnic University, Jiaozuo 454003, China
3
State Key Laboratory for Geomechanics and Deep Underground Engineering, China University of Mining and Technology, Xuzhou 221116, China
*
Author to whom correspondence should be addressed.
Energies 2018, 11(9), 2233; https://doi.org/10.3390/en11092233
Submission received: 31 July 2018
/
Revised: 20 August 2018
/
Accepted: 24 August 2018
/
Published: 26 August 2018
Abstract
:The geomechanical and seepage evolution characteristics of coal masses during mining are the key factors that affect the drainage of coalbed methane and the safety of coal mining. Nevertheless, the influence of mining paths on coal seam permeability is rarely investigated given the complexity of mining-induced stress experiments. To study the effect of mining-induced stress on coal mining, the mechanical properties, acoustic emission characteristics and energy evolution of coal masses were experimentally evaluated through mining-induced stress experiments. Experimental results indicated that at peak intensity, the deviatoric stress and axial strain of coal samples under the stress path of protective coal-seam mining are lower than those of coal samples under the non-pillar stress path. The unloading ratio of confining pressure is large under a stress path of non-pillar mining, and the elastic energy, the absorbed energy, and the dissipated energy of coal mass are low during destruction. The effect of high confining pressure on AE events is pronounced under the non-pillar mining path. The overall b value under high confining pressure is smaller than that under low confining pressure, and AE events generally have high energy. The fracture structure of coal mass is complex, and the fractal size of coal is large under high unloading rates of confining pressure, which induce the increase of permeability after coal destruction.
1. Introduction
Coal is a typical porous medium material. Compared with single coal mining or gas extraction, the simultaneous extraction of coal and methane is an efficient mining layout for the concurrent collection of coal and methane [1,2,3]. This layout can eliminate the risk of gas disasters and enable the complete recovery of methane. During underground coal mining, mining disturbances weaken the mechanical properties of coal, as well as affect the fracture distribution and permeability of coal. These conditions can occasionally cause rock burst and coal and gas outburst [4,5,6]. A great deal of energy is accumulated in the deep coal seam. With the occurrence of mining disturbance, the energy accumulated in the coal mass will quickly leak out to the free surface [7,8,9]. Therefore, the geomechanical and seepage evolution characteristics of coal masses and rock masses under mining conditions should be investigated to determine their influence on the occurrence of dynamic mine disasters [10,11,12].
The characteristics of mining-induced stress evolution have been extensively investigated [13,14,15,16,17]. Wang et al. [10] investigated the influence of roof rupture on mine tremor by field test, and analyzed the energy release law of roof rock breakage. Yang et al. [13] analyzed the distribution characteristics of vertical stress in mining process by finite element software FLAC, and pointed out the characteristics of pressurized zone and decompression zone. Thompson et al. [14] analyzed the stress evolution characteristics of strata under filling conditions and proposed that real-time stress monitoring is an effective method to optimize filling efficiency. Xue et al. [15] mainly studied the damage characteristics of rock mass after underground excavation and the influence of excavation damage on seepage characteristics. Corkum et al. [16] examined the effects of rock properties and tectonic stress on the strata strain through stress monitoring data. By introducing inhomogeneous stress and pore water pressure, Aubertin and Li [17] analyzed the strength and stress distribution characteristics between backfill materials and surrounding rocks. Shen et al. [18] analyzed the influence of the entrance on coal pillar under the action of support and the breaking characteristics of coal roof, and proposed using hydraulic cracking to reduce the failure of coal roof caused by in-situ stress. Coal masses before the working face exhibit increasing and decreasing vertical stress and decreasing horizontal stress in coal mining. The deformation and permeability evolution law of coal seams affect coal mine safety [18,19]. Therefore, the permeability distribution of coal should be investigated to improve the safety of mine operations.
Coal mass permeability has been widely studied, and numerous mechanical models of coal mass permeability have been proposed [20,21,22,23]. Several permeability models that account for the effect of effective strain and adsorption deformation in terms of strain have been developed [24,25,26,27], and the permeability of coal masses have been experimentally investigated through conventional triaxial [28], cyclic loading [29] and unloading tests [30]. For example, Li et al. [31] conducted a triaxial test to investigate the anisotropic characteristics of shale permeability and the influence of cleat and principal stress on coal permeability. Liu et al. [32] experimentally analysed the permeability evolution law of coal and non-Darcy effect in seepage under variable confining pressures. De Silva et al. [33] stated that the composition of rock materials and the effect of bedding structure remarkably influence reservoir permeability due to the heterogeneity of rock materials. Moreover, Zhai et al. [34] found that the feature of permeability of tectonically deformed coal mass is dominantly influenced by structural deformation degree, effective pressure, adsorption swelling and slip effect. Chen et al. [35] used micro-computational tomography (CT) to assess the influence of cracking closure on the behaviour of fluid flow of reservoirs and evaluated the quantitative relationship between the variation in confining pressure and that in distribution of rock pores.
Although scholars have found that for the coal in front of the working face, the vertical stress increases firstly and then decreases, and the horizontal stress decreases continuously in the process of coal mining. There has been a lack of summary of this phenomenon and quantitative analysis of stress changes. Xie et al. [36,37] evaluated the change regularity of coal seam stresses before the working face. The effect of coal mining on the geomechanical and seepage features of coal masses should be fully revealed through experiments conducted under the mining stress path. In this work, different stress loading paths were adopted to simulate the real stress environments encountered during coal mining. The contribution and main goal of this work is the evaluation of the acoustic emission (AE) characteristics, the seepage characteristics, and the energy evolution of coal mass under the different mining stress paths. Based on this goal, a gas permeability test was conducted to research the seepage characteristics and mechanical response of coal masses in deep mining.
2. Experimental Setup
2.1. Evolution Laws of Mining-Induced Stress under Three Mining Paths
The abutment pressure of coal masses before the coal face differs under various mining paths. The coal masses before the coal face can be classified as areas of primary stress, stress concentration and pressure relief in accordance with the distribution of abutment pressure. Xie et al. [36] carried out a lot of in-situ stress measurements and characterised stress evolution on the basis of differences in abutment pressure under three mining paths, as shown in Figure 1.
Under the deep condition, the rock is in the state of quasi hydrostatic pressure, so the stress environment in coal mining begins at the state of quasi hydrostatic pressure (point ①), i.e., . , and are the stress of coal at three different direction, MPa. is the volume-weight of stratum rock, N/m3, and H is the depth of coal seam, m. With the advance of the working face, the abutment pressure of coal mass gradually increases and experiences point ②. The horizontal stress is reduced from to , while the vertical stress increase from to . Then the peak stress is reached, i.e., point ③. The peak stress concentration coefficients of the three typical mining paths of the protective coal-seam, the top-coal caving and the non-pillar are 1.5–2.0, 2.0–2.5 and 2.5–3.0, respectively. After the peak stress point ③, with the destruction of coal body, the vertical stress gradually decreases to the pressure residual strength at the coal wall (point ④), and the horizontal stress is gradually reduced to 0 (i.e. unstressed state). The quantitative stress evolution characteristics of coal body under three different mining paths summed up by Xie et al. [36] have important guiding significance for studying the mechanical behaviour of coal mass under different mining conditions.
The mining face emerges as the area of large pressure relief in mining. Fracture distribution and permeability characteristics will remarkably change if the coal masses surrounding the working face are damaged. The stress state of coal mass before the working face transforms from the hydrostatic pressure state to the peak stress state and then to the residual stress state.
The effect of mining on the geomechanical features and seepage characteristics of coal can be revealed by analysing mechanical responses of coal in the practical mining stress states. The mining stress path should be considered from an experimental perspective. As the current coal and rock mechanics tests are normally conducted in the conventional triaxial condition and the stress changes in the horizontal direction are ignored, this paper designed the mining stress path to analyse the geomechanical and seepage evolution characteristics of coal mass, on the basis of the quantitative mining-induced stress evolution characteristic proposed by Xie et al. [36].
Therefore, in this work, seepage–stress coupled tests were conducted and the deformation, fracture development and seepage characteristics of coal were analysed under different mining paths. Such an analysis provides an experimental basis for reasonable gas drainage and gas outburst control and prevention.
2.2. Specimen Preparation and Testing Equipment
The samples of coal mass in this test were collected from the coal face of eight mines of Pingmei Corporation and were processed into standard cylindrical samples in the laboratory. The test system comprised a TAW-2000 servo rock triaxial test machine combined with a gas seepage control system. The schematic of experimental system is shown in Figure 2, and the images of the test equipment are shown in Figure 3.
The coal sample is installed in the pressure chamber, and the deformation sensor and the AE sensor are mounted outside the coal sample. Data acquisition is realized by computer. The triaxial test machine realizes the loading of external stress by using a hydraulic system. The seepage system is connected to the two sides of the coal sample through the pipeline. A booster pump is employed to increase the gas pressure (nitrogen cylinder) to a certain pressure. Then, the gas penetrates one end of the coal sample and flows at the other end. The gas permeation measurement system comprises a pressure sensor and flow meter. The vacuum pump is also connected with the pipeline of the seepage system, and the gas in the pipeline is evacuated before the test. Pressure sensors and flow sensors are installed upstream and downstream of the pipeline to measure gas pressure and flow rate.
2.3. Test Scheme
A schematic of the loading and unloading schemes for the entire test is shown in Figure 4. is the volume-weight of stratum rock, N/m3, and H is the depth of coal seam, m. is the peak stress concentration coefficient. The loading and unloading paths of the specimen shown in Figure 4 are designed according to the quantitative stress evolution characteristic proposed by Xie et al. [36]. The point A in Figure 4 corresponds to the point ① in Figure 1, the point B in Figure 4 corresponds to the point ② in Figure 1, and the points C, D and E in Figure 4 corresponds to the point ③ in Figure 1. When the stress values of Figure 1 and Figure 4 are equal at these key points, it can be achieved that the stress of coal samples under the designed stress paths in Figure 4 is consistent with the insitu stress of coal mass under mining environment shown in Figure 1.
(1) Pressure loading to hydrostatic pressure state (line OA in Figure 4)
The loading speed of hydrostatic pressure was 3 MPa/min, pressure was loaded to 15 MPa () and gas pressure was 2 MPa. Line OA represents the loading to achieve the initial state, i.e., hydrostatic pressure state. The coal in this stage is not affected by the mining.
(2) First unloading phase (line AB in Figure 4)
Axial pressure was increased at the speed of 2.7 MPa/min to 22.5 MPa (), the confining pressure was decreased at the speed of 1.2 MPa/min and the ratio of the loading speed of and unloading speed of was 2.25:1. Line AB represents the increase of vertical stress and the decrease of horizontal stress. Line AB corresponds the stage of ①–② in Figure 1.
(3) Second unloading phase
Lines BC, BD and BE in Figure 4 constitute the second unloading stages. BC is the protective coal-seam mining path. Under this condition, axial pressure was increased at the speed of 2.7 MPa/min, and the confining pressure was decreased at the speed of 1.2 MPa/min. The ratio of loading of and unloading of was held constant at 2.25:1 until the coal sample was destroyed. BD is the protective coal-seam mining path. Under this condition, axial pressure was increased at the speed of 4.2 MPa/min, and the confining pressure was decreased at the speed of 1.2 MPa/min. The ratio of loading of and unloading of was held constant at 3.5:1 until the coal sample was destroyed. BE is the protective coal-seam mining path. Under this condition, axial pressure was increased at the speed of 5.7 MPa/min, and the confining pressure was decreased at the speed of 1.2 MPa/min. The ratio of loading of and unloading of was held constant at 4.75:1 until the coal sample was destroyed.
Different mining layouts mean the different of mining stress. Therefore, different unloading speed was adopted in the test scheme. The loading and unloading speed was set according to quantitative mining-induced stress evolution characteristic proposed by Xie et al. [36]. Displacement control was adopted in the postpeak process, and the unloading speed of confining pressure was kept constant.
2.4. Test Procedure
The ends of the specimens were fixed by using osmotic heads. The samples were placed in a triaxial pressure cylinder after they were sealed with a heat-shrinkable film. Axial and ring extensometers were installed on the sample.
An AE probe was installed after sample installation. The pressure cylinder was filled with oil, and hydrostatic pressure was increased to 15 MPa. The seepage control system was filled with gas. Gas pressure at the intake valve was held constant when the gas pressure reached the set pressure. The outlet valve was started, and the gas flow was recorded when the flow had stabilised.
The force control mode was set for the axial pressure, and the confining pressure was adjusted in accordance with the test scheme. A circumferential displacement control was adopted after the coal sample yielded. After loading to the specified pressure, the gas flow was recorded timely when air flow had stabilised at the outlet. The outlet valve was closed, and loading was continued when the gas flow measurement was completed.
The experiment was terminated and the next test was conducted when the coal sample ruptured.
The calculation formula of the gas permeability for the test is:
where represents the permeability, m2; represents the volumetric flow rate, L/min; represents the dynamic viscosity coefficient of nitrogen gas, Pa·s; represents the coal sample length, m; and represent gas pressures at the inlet and outlet, respectively, MPa, and represents the cross-section area, m2.
3. Test Result Analysis
3.1. Influence of Mining-Induced Stress Paths on the Geomechanical Characteristic of Coal Specimen
A scanning electron microscopy (SEM) image of a coal specimen is shown in Figure 5. In Figure 5, the coal mass almost lacks microcracks. Although the coal mass exhibits a large number of pore structures, its fracture development is not obvious and is pores are unconnected. Observing the pore structure of coal under high magnification revealed the absence of obvious fractures and the lack of pore convergence. The coal sample has low macroscopic permeability despite the presence of numerous pore structures. The mineralogical composition of coal mass is mainly aluminosilicate, such as quartz, kaolinite and white mica. The main chemical composition of the ashes is SiO2, Al2O3, CaO, Fe2O3, TiO2, MgO, K2O, Na2O, P2O5, SO3. Microscopic scanning is an effective means to observe the microstructure of coal. The microstructure has a decisive influence on the macroscopic parameters, such as strength and permeability of coal. When the fracture structure of coal body is densely distributed and the connection characteristics are obvious, the strength of coal body will be greatly reduced and the permeability will also be reduced. From the microscopic observation of coal in this test, we can see that the fracture structure of coal is not obvious. From the test results of composition analyses, the main component of coal is quartz, so it is also characterized by dense and hard. Therefore, the coal mass presents a tight and hard physical state at the macroscopic level, and we need to further analyze the mechanical characteristics through the experiment.
The stress-strain curve of coal specimens is shown in Figure 6. , and are the axial strain, hoop strain and volumetric strain of coal samples. The different mining paths reflect the different unloading pressure rates on the coal. The peak intensity in the protective coal-seam mining layout is small due to the large unloading rate on the coal sample under this loading condition. Under the same axial stress condition, the coal samples are under low confining pressure and are easily damaged. The lateral and volumetric strain curve of coal samples gradually decrease after coal failure. When the unloading speed is high, the coal sample is under low axial strain at the damage position. The condition shows that the strength and ductility of coal samples decrease under high confining pressure loading rates, which inflict considerable damage on the coal samples.
The mechanical and permeability parameters of all coal specimens are measured during the experiment and the experimental results as shown in Table 1. Compared with those of sample C-1, the deviatoric stress and axial strain of specimens have decreased by 37.1% and 19.8%, respectively. The strength and ductility deformation of coal samples decrease as the unloading rate increases. The peak stress concentration coefficients of samples C-1, C-2, C-3, C-4, C-5 and C-6 are 3.06, 2.49, 2.04, 3.02, 2.36 and 1.88, respectively. The numbers are coincided with the stress concentration coefficients in the non-pillar mining path (2.5–3.0), top-coal caving mining path (2.0–2.5) and protective layer mining path (1.5–2.0). This result verifies the correctness of the test scheme. Therefore, the test can effectively simulate the stress paths encountered during mining.
3.2. Influence of Mining-Induced Stress Paths on the Energy Densities and Permeability of Coal Samples
The energy method is employed to analyse deformation and damage mechanism of coal mass during rock mechanics tests. Microscopic mechanics theory states that the damage evolution of the coal mass is mainly caused by the microcrack initiation [38]. The form, expansion, growth of the microcracks in coal mass absorb external energy. This part is total energy, , which can be calculated by the integral of stress to strain (Equation (2)). Elastic energy is stored in the coal mass by elastic deformation, mJ/mm3. It’s the linear integral for strain and can be calculated through Equation (3). Dissipated energy is consumed during crack initiation, mJ/mm3. It can be calculated through subtracting elastic energy from total energy (Equation (4)). Rock damage and degradation are caused by crack expansion.
As shown in Figure 7, the stress and strain curve of the coal mass is used to analyse the elastic deformation energy and dissipative energy in coal samples. is the axial stress, MPa, is the axial strain, and E is the modulus, MPa. The energy absorbed by the coal mass can be calculated by the flowing equations:
where is total energy, mJ/mm3, , and are the principal stress in three directions, MPa, , and are the principal strain in three directions; is the elasticity modulus, is the Poisson’s ratio, is the axial stress; and is the confining pressure.
During the triaxial experiment, the energy absorbed by the coal mass mainly originates from the work done by the load. The absorbed energy is stored in coal mass, and the remaining energy is consumed in the microcrack propagation of coal mass. The characteristics of rock damage is estimated with reference to the energy evolution rule of rocks. During loading, the density of elastic energy is higher than that of dissipated energy. The amount of energy that the rock should absorb is reduced when the rock is destroyed during confining pressure unloading stage. In addition, elastic energy and dissipative energy of internal storage can be reduced when the rock is damaged under high unloading rates of confining pressure.
Figure 8 shows the relationship between the elastic energy and the dissipated energy under different mining paths. Dissipated energy slowly increases as stress increases. The number of microcracks increases drastically, and the amplitude of the dissipated energy escalates when the stress ratio reaches 70%. High unloading rates of confining pressure are associated with the low elastic and dissipative energy of coal samples at the same stress ratio. The non-coal pillar and protective coal-seam mining paths correspond to the elastic energies of 0.248 and 0.117 mJ/mm3 of coal samples C-1 and C-3, respectively, under the stress ratio of 100%. The energy storage limit of coal sample C-3 is 52.82% lower than that of coal sample C-1 under increasing unloading rate. Similarly, the dissipated energy at peak stress is small under high unloading rates of confining pressure. The dissipated energy of sample C-3 is 68.29% lower than that of sample C-1. Therefore, the fracture development characteristics of coal remarkably vary under different mining paths.
Figure 9 shows the curves of strain–stress and permeability–stress of coal samples. the k represents the permeability, m2, and represents the volumetric strain. The specimens are compressed under stress loading, and the coal samples expand in volume under increasing deviatoric stress. The change trend of volumetric strain indicates that the permeability of coal sample firstly decreases and increases after coal failure. High unloading speed accelerates coal damage and influences coal permeability. Large confining pressure limits the horizontal deformation of coal samples and the vertical gas flow of coal samples. These effects decrease the vertical gas flow of coal samples. Specifically, the measured macroscopic permeability of coal during the test is relatively low. By contrast, high unloading speed decreases the bearing capacity of coal samples and render the coal prone to damage. Crack development increases coal permeability.
3.3. Influence of Mining-Induced Stress Paths on the AE Signal of Coal Samples
Void collapse, crack growth and particle slip will occur with stress loading. The internal energy of coal is discharged as stress waves. This release pattern results in AE signals that reflect the damage and rupture of coal microstructures. The analysis of AE signals can help reveal the deformation and damage rules of coal mass. The cumulative AE energy curve of coal samples under various mining paths is shown in Figure 10.
A similar law exists for the change in cumulative AE energy under different mining paths. The changes in cumulative AE energy are classified as the three following stages:
(1) Initial crack compaction stage: This phase corresponds to the elastic deformation phase of coal samples. Most of the energy imposed by stress is transformed as elastic energy given the elastic compaction and crack closure of coal samples. No obvious AE event is observed.
(2) Unstable crack propagation stage: This stage corresponds to the plastic deformation stage of coal samples. Under stress loading, microcrack development and crack propagation in the coal transform a portion of energy into dissipated energy. The cumulative energy curve of AE gradually increases, AE activity collectively remains at a low level and energy accumulation slowly increases.
(3) Unstable crack propagation stage: This stage corresponds to the rupture stage of coal samples. In this stage, the coal reaches its ultimate strength, and damage and destruction are observed. Internal cracks rapidly expand, and macrofractures form in the coal. The amount of AE signals instantaneously increases with energy release in the coal. The cumulative energy curve vertically increases near the peak point.
These stages of AE cumulative energy correspond to the coal deformation and damage stages. The coal mass releases large amounts of energy during loading and failure. AE can be used to monitor rock rupture from the perspective of internal energy release and infer fracture development from the stress–strain curve.
The amplitude distribution characteristics of AE signals reflect the relationship between seismic magnitude and frequency [38,39]. Earthquake magnitude and cumulative frequency have a linear logarithmic relationship with the slope of b. The variation rule of AE activity can be used to investigate rock deformation and failure. The value of b is obtained with . During loading, the AE amplitude is A, is the value of AE events in which the amplitude is larger than A and C is a constant. In a given stress state, the b value can be obtained by fitting the AE data of the test.
The value of b illustrates the relationship between distribution parameters of the amplitude and frequency of AE signals. The increase in b value implies the increase in a small AE events proportion and the number of small cracks. An unchanged b value indicates that the magnitude distribution of AE events is maintained at a constant ratio. A decrease in b value indicates an increase in the large fractures number.
Figure 11 shows the b value of the AE of coal samples under different mining paths. The b value of AE increases with external load, which comprehensively declines with continuous fluctuation. The b value of AE is large at the beginning of loading and then slightly decreases under increasing load. This behaviour indicates that crack development in the rock is slow, and the proportion of large AE events is small. The proportion of different energy events remains unchanged, and the development of primary and regenerated cracks is stable. During the plastic stage, the b value of AE begins to rapidly decrease and cracks rapidly develop. During this stage, the AE events proportion with high energy increases, the proportion of low energy AE events decreases and the number of large-scale cracks gradually increases. High confining pressures correspond to dense crack concentration in the rock. Different crack sizes result in the differences among the energy of AE events. Small cracks interconnect and develop into large-scale cracks when peak intensity is reached. The majority of crack growth is confined by confining pressure, and a small number of cracks continue to expand and form macroscopic cracks under increasing load. The stress–strain curves of coal samples do not exhibit a stress drop segment and instead exhibit a progressive failure segment. The effect of high confining pressure on AE events is pronounced under the non-pillar mining path. The overall b value under high confining pressure is smaller than that under low confining pressure, and AE events generally have high energy. Meanwhile, the amount of AE is reduced, and the strain softening of rock samples is obvious.
To illustrate the influence of mining paths on ultrasonic velocity, the P-wave velocity of coal samples is shown in Figure 12. As shown in Figure 12, the velocity of P-wave varies with mining paths. The P-wave velocity is enhanced when the mining paths change from the protective coal-seam mining to the non-pillar mining. The P-wave velocity and AE event can be characterised by three stages, as shown in Figure 13. During the initial compression deformation stage (stage I), the velocity of P-wave increases rapidly and the AE count is low. During the line elastic deformation stage (stage II), the accumulated AE count gradually increases and the velocity of P-wave fluctuates. During the nonlinear deformation stage (stage III), the velocity of P-wave decreases and the AE counts exponentially increase. In the residual strength stage, the velocity of P-wave decreases and the accumulated AE count gradually increases.
3.4. Influence of Mining-Induced Stress Paths on the Fractal Dimension of Coal Samples
Fractal dimensions can be used to analyse the influence of mining paths on fracture network of coal masses. The coal breaks into fragments of different shapes when it reaches its peak strength, and these fragments have a statistical size distribution. Fractal dimensions are calculated on the basis of the relationship between the number and the shape and size of rock fragments [40]. Figure 14 shows particle size distribution (PSD) after coal destruction under different mining paths. The PSD statistical results are shown in Table 2. The metal sifters with different mesh sizes are used to achieve the classification of different size of coal particles and weigh them with different scales.
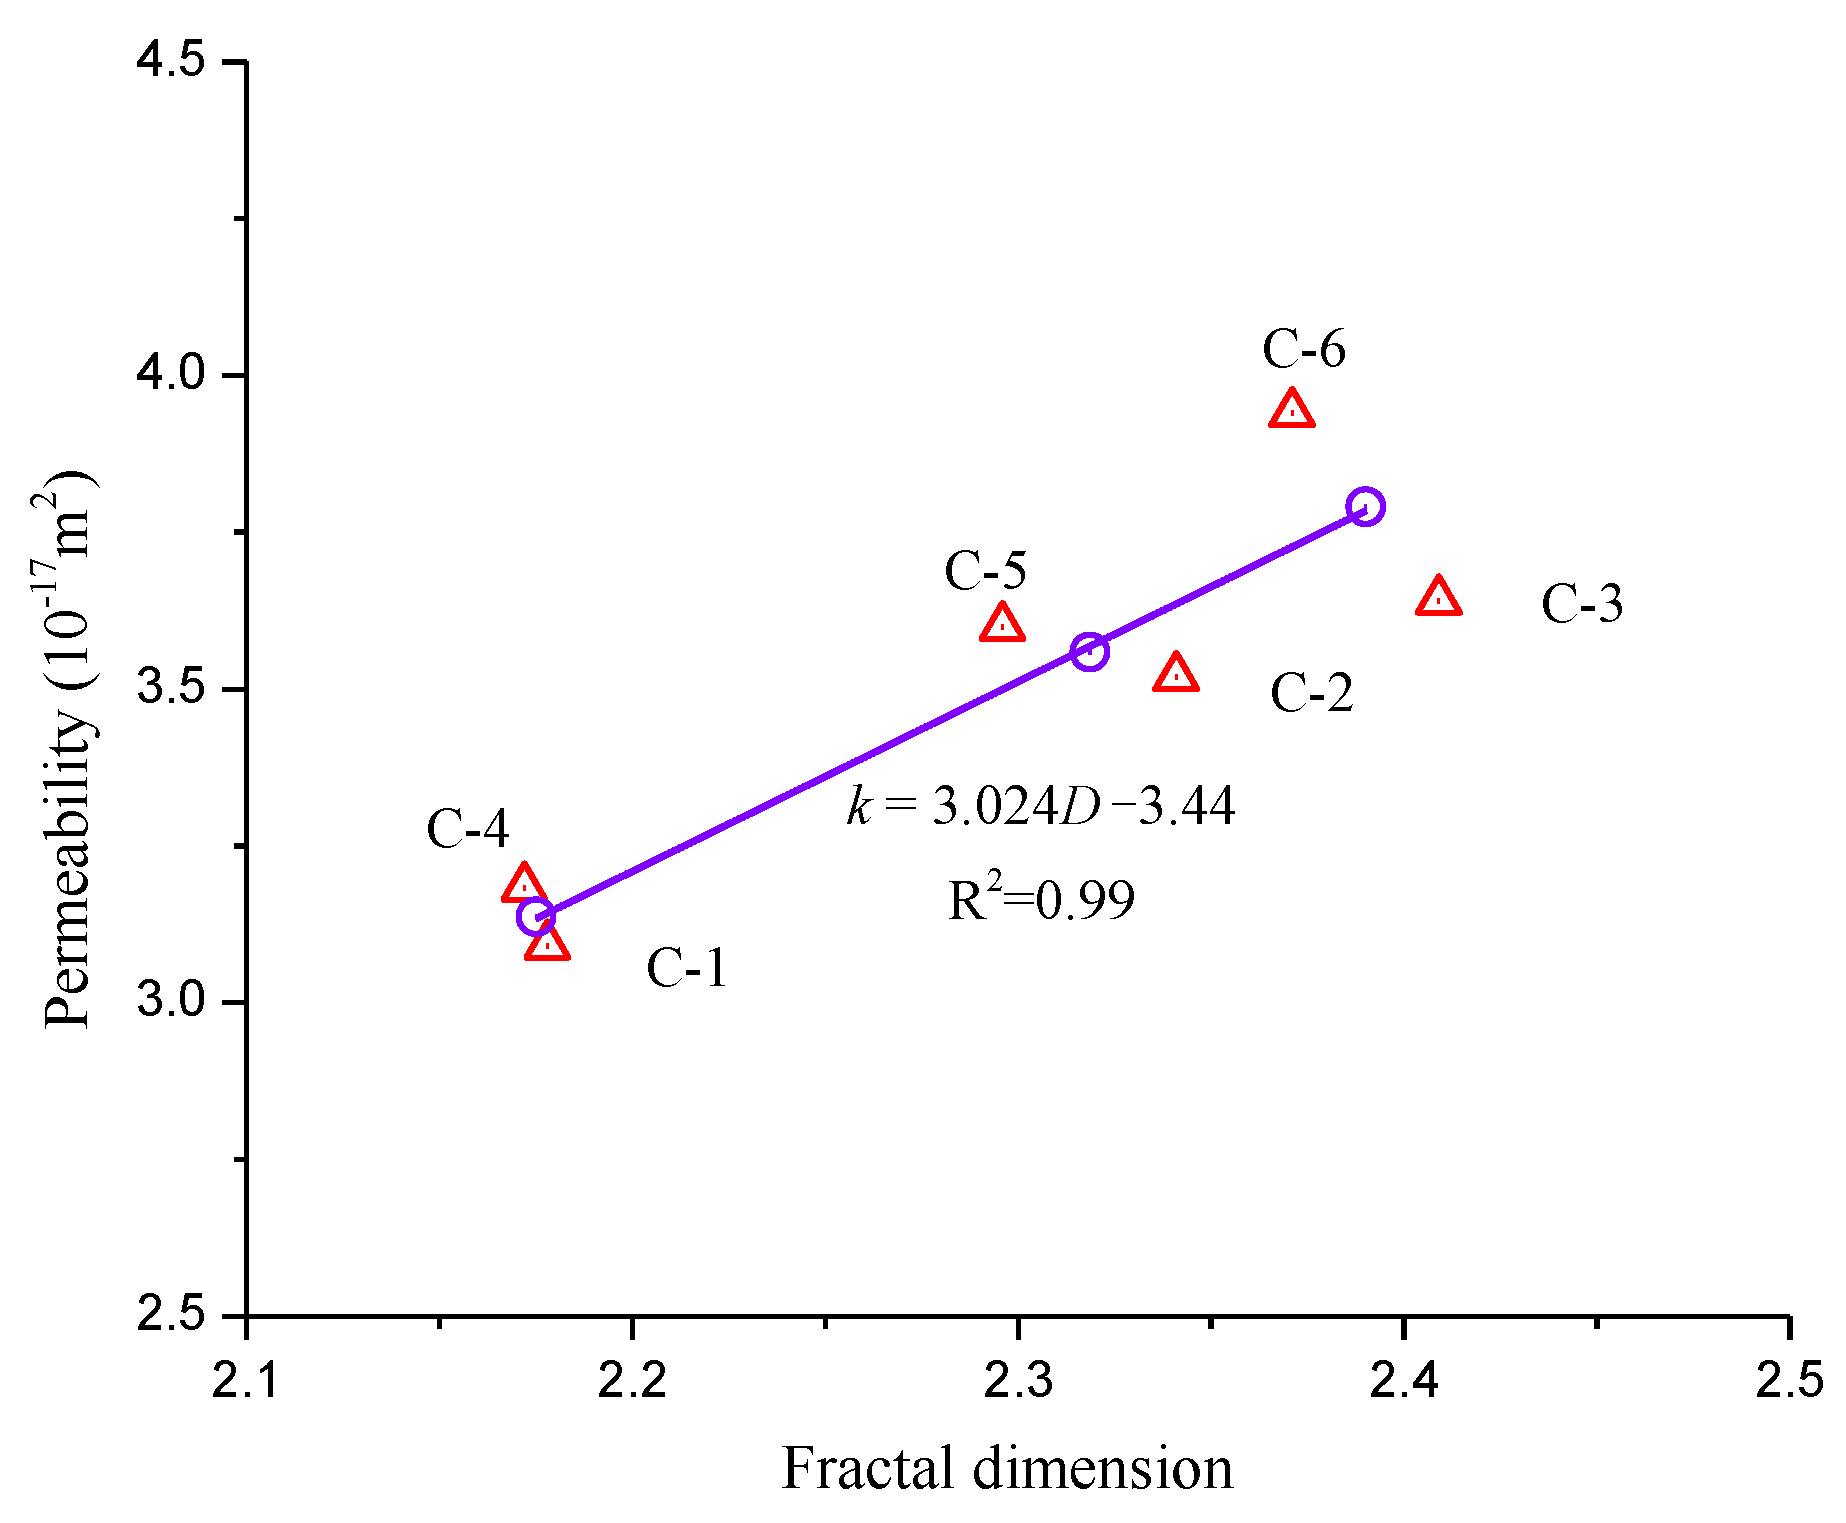
As shown in Figure 14 and Table 2, the fracture system is complex, and the fractal dimension is large after coal sample destruction under protective coal-seam mining. Compared with C-3 and C-6, large-size fragments of C-1 and C-4 account for a large proportion, indicating that they are less destructive. The distribution characteristics of coal particles are related to the fracture network of coal, which will affect the permeability of coal. Permeability increases with the fractal dimension increase. Under the non-pillar mining stress path, the fractal dimensions of C-1 and C-4 coal samples are 2.178 and 2.172, respectively. The fractal dimensions of C-3 and C-6 coal samples are 2.409 and 2.371, respectively, under the stress path of protective coal-seam mining and are higher by 10.6% and 9.2%, respectively, than those under the non-pillar mining path.
Figure 15 shows the permeability of fractured coal sample and fractal dimension in the residual state. Fractal dimension represents the complexity of the coal fracture network, and the fracture network determines the seepage of coal samples. Therefore, the permeability of coal samples can be obtained by analysing the coal fractal dimension. Coal fracture intensifies and fragmentation increases when the fractal dimension of coal sample is high. By contrast, a low fractal dimension indicates that fracture degree is low and fragmentation is limited.
4. Conclusions
The geomechanical and seepage evolution characteristics of coal masses under mining-induced stress paths are quite different from that of conventional loading and unloading paths. In this paper, a loading and unloading test was conducted to investigate the geomechanical response and seepage characteristics of coal masses in deep mining. The contribution and main goal of this work is the evaluation of the acoustic emission (AE) characteristics, the seepage characteristics, and the energy evolution of coal mass under the different mining stress paths. Based on this goal, a gas permeability test was conducted to research the seepage characteristics and mechanical response of coal masses in deep mining. The main conclusions are as follows:
Different mining stress paths indicate that coal samples are subjected to different rates of unloading confining pressures during testing. The strength and ductility deformation of coal samples decrease as the unloading rate increases. The deviatoric stress and axial strain of sample C-3 at peak point under the stress path of protective coal-seam mining are lower by 37.1% and 19.8%, respectively, than those of sample C-1 under the stress path of the non-pillar. And the low unloading speed corresponds to high stress and high failure strength when the sample is damaged. Strain characteristics differ under different mining paths.
During loading, most of the absorbed energy by coal samples is stored in coal mass. The elastic energy and dissipated energy of specimen during destruction under the stress path of non-pillar mining are lower than those of coal samples under other mining paths. The non-coal pillar and protective coal-seam mining paths correspond to the elastic energies of 0.248 and 0.117 mJ/mm3 of coal samples C-1 and C-3, respectively, at the stress peak point. Coal permeability initially decreases and then rapidly increases during coal destruction. The change in volumetric strain changes permeability. Fracture degree and permeability are directly proportional during coal destruction. Thus, extensive damage is associated with high permeability.
The changes in cumulative AE energy are classified as the three stages: initial crack compaction stage, unstable crack propagation stage, and unstable crack propagation stage. The effect of high confining pressure on AE events is pronounced under the non-pillar mining path. The overall b value under high confining pressure is smaller than that under low confining pressure, and AE events generally have high energy. Fractal dimension is high when the unloading speed of confining pressure is high under different mining paths and increases coal permeability after coal destruction. Under the stress path of non-pillar mining, the fractal dimensions of coal samples C-4 and C-6 are higher by 10.6% and 9.2%, respectively, than those of samples C-1 and C-3.
The results of this paper can provide theoretical guidance for the evaluation of geo-mechanical characteristics of coal seams under different mining conditions, as well as the prevention and control of mine disasters, such as rock burst and gas outburst. Scholars no longer need to evaluate the mechanical characteristics of coal under mining conditions according to the mechanical characteristics of coal mass under conventional loading or unloading conditions. The mechanical characteristics of coal mass under these loading unloading conditions have a big difference.
Author Contributions
Y.X. and F.D. designed the experiments; Y.X., Z.C. and F.D. performed the experiments; X.C. and F.G. analyzed the data; Y.X. and J.R. wrote the paper.
Acknowledgments
This study is sponsored by the National Natural Science Foundation of China (51679199), the China Postdoctoral Science Foundation (2018M633549), and the Key Scientific Research Project Fund of Colleges and Universities of Henan Province (19A130001).
Conflicts of Interest
The authors declare no conflict of interest.
References
- Sobczyk, J. A comparison of the influence of adsorbed gases on gas stresses leading to coal and gas outburst. Fuel 2014, 115, 288–294. [Google Scholar] [CrossRef]
- Dennis, J.B. Investigations into the identification and control of outburst risk in australian underground coal mines. Int. J. Min. Sci. Technol. 2017, 27, 749–753. [Google Scholar] [CrossRef]
- Masoudi, R.; Sharifzadeh, M. Reinforcement selection for deep and high-stress tunnels at preliminary design stages using ground demand and support capacity approach. Int. J. Min. Sci. Technol. 2017, 28, 573–582. [Google Scholar] [CrossRef]
- Xie, H.; Ju, Y.; Gao, F.; Gao, M.; Zhang, R. Groundbreaking theoretical and technical conceptualization of fluidized mining of deep underground solid mineral resources. Tunn. Undergr. Space Technol. 2017, 67, 68–70. [Google Scholar] [CrossRef]
- Tulu, I.B.; Esterhuizen, G.S.; Gearhart, D.; Klemetti, T.M.; Mohamed, K.M.; Su, D.W.H. Analysis of global and local stress changes in a longwall gateroad. Int. J. Min. Sci. Technol. 2018, 28, 127–135. [Google Scholar] [CrossRef]
- Li, Z.; He, X.; Dou, L. Control measures and practice for rock burst induced by overburden fracture in top-coal caving mining. J. China Univ. Min. Technol. 2018, 47, 162–171. [Google Scholar]
- Skrzypkowski, K. Laboratory testing of a long expansion rock bolt support for energy-absorbing applications. In Proceedings of the E3S Web of Conferences, Szklarska Poreba, Poland, 23–26 May 2017; Volume 29. [Google Scholar] [CrossRef]
- Skrzypkowski, K. Roof bolting in terms of dynamic hazards. Gospodarka Surowcami Miner. Miner. Resour. Manage. 2008, 24, 305–316. [Google Scholar]
- Xie, H.; Li, L.; Peng, R.; Ju, Y. Energy analysis and criteria for structural failure of rocks. J. Rock Mech. Geotech. Eng. 2009, 1, 11–20. [Google Scholar] [CrossRef]
- Wang, G.; Dou, L.; Wu, C.; Wang, Z.; Gong, S.; Jiang, H.E.; Li, Z. Unstable energy triggering mechanism of rock burst. J. China Univ. Min. Technol. 2018, 47, 190–196. [Google Scholar]
- Lama, R.D.; Bodziony, J. Management of outburst in underground coal mines. Int. J. Coal Geol. 1998, 35, 83–115. [Google Scholar] [CrossRef]
- Lama, R.D.; Bodziony, J. Outburst of Gas, Coal and Rock in Underground Coal Mines; Lama & Associates: Evesham Township, NJ, USA, 1996; p. 400. [Google Scholar]
- Yang, W.; Lin, B.Q.; Yan, Q.; Zhai, C. Stress redistribution of longwall mining stope and gas control of multi-layer coal seams. Int. J. Rock Mech. Min. Sci. 2014, 72, 8–15. [Google Scholar] [CrossRef]
- Thompsonb, D.; Bawdenw, F.; Grabinskym, W. In situ measurements of cemented paste backfill at the cayeli mine. Can. Geotech. J. 2012, 49, 755–772. [Google Scholar] [CrossRef]
- Xue, Y.; Dang, F.; Fang, S.; Li, R.; Cao, Z. Evaluation of Gas Migration and Rock Damage Characteristics for Underground Nuclear Waste Storage Based on a Coupled Model. Sci. Technol. Nucl. Install. 2018, 2018, 2973279. [Google Scholar] [CrossRef]
- Corkum, A.G.; Damjanac, B.; Lam, T. Variation of horizontal in situ stress with depth for long-term performance evaluation of the deep geological repository project access shaft. Int. J. Rock Mech. Min. Sci. 2018, 107, 75–85. [Google Scholar] [CrossRef]
- Aubertin, M.; Li, L. An analytical solution for the nonlinear distribution of effective and total stresses in vertical backfilled stopes. Géoméch. Geoengin. 2010, 5, 237–245. [Google Scholar] [CrossRef]
- Shen, W.L.; Bai, J.B.; Wang, X.Y.; Yu, Y. Response and control technology for entry loaded by mining abutment stress of a thick hard roof. Int. J. Rock Mech. Min. Sci. 2016, 90, 26–34. [Google Scholar] [CrossRef]
- Xue, Y.; Dang, F.; Cao, Z.; Du, F.; Liu, F.; Ren, J.; Gao, F. Numerical Analysis of Heat and Gas Transfer Characteristics during Heat Injection Processes Based on a Thermo-Hydro-Mechanical Model. Energies 2018, 11, 1722. [Google Scholar] [CrossRef]
- Robertson, E.P.; Christiansen, R.L. A permeability model for coal and other fractured, sorptive-elastic media. In Proceedings of the SPE Eastern Regional Meeting, Canton, OH, USA, 11–13 October 2006. [Google Scholar]
- Seidle, J.P.; Jeansonne, M.W.; Erickson, D.J. Application of matchstick geometry to stress dependent permeability in coals. In Proceedings of the SPE rocky Mountain Regional Meeting, Casper, WY, USA, 15–21 May 1992. [Google Scholar]
- Shi, J.Q.; Durucan, S. Drawdown induced changes in permeability of coalbeds: A new interpretation of the reservoir response to primary recovery. Transp. Porous Media 2004, 56, 1–16. [Google Scholar] [CrossRef]
- Cui, X.; Bustin, R.M. Volumetric strain associated with methane desorption and its impact on coalbed gas production from deep coal seams. AAPG Bull. 2005, 89, 1181–1202. [Google Scholar] [CrossRef]
- Dong, C.; Pan, Z.; Ye, Z. Dependence of gas shale fracture permeability on effective stress and reservoir pressure: Model match and insights. Fuel 2015, 139, 383–392. [Google Scholar] [CrossRef]
- Hosking, L.J.; Thomas, H.R.; Sedighi, M. A dual porosity model of high-pressure gas flow for geoenergy applications. Can. Geotech. J. 2017, 55, 839–851. [Google Scholar] [CrossRef]
- Peng, Y.; Liu, J.; Pan, Z.; Connell, L.D.; Chen, Z.; Qu, H. Impact of coal matrix strains on the evolution of permeability. Fuel 2017, 189, 270–283. [Google Scholar] [CrossRef]
- Sander, R.; Pan, Z.; Connell, L.D. Laboratory measurement of low permeability unconventional gas reservoir rocks: A review of experimental methods. J. Nat. Gas Sci. Eng. 2017, 37, 248–279. [Google Scholar] [CrossRef]
- Xue, Y.; Ranjith, P.G.; Gao, F.; Zhang, D.; Cheng, H.; Chong, Z.; Hou, P. Mechanical behaviour and permeability evolution of gas-containing coal from unloading confining pressure tests. J. Nat. Gas Sci. Eng. 2017, 40, 336–346. [Google Scholar] [CrossRef]
- Jiang, C.; Duan, M.; Yin, G.; Wang, J.G.; Lu, T.; Xu, J.; Zhang, D.; Huang, G. Experimental study on seepage properties, ae characteristics and energy dissipation of coal under tiered cyclic loading. Eng. Geol. 2017, 221, 114–123. [Google Scholar] [CrossRef]
- Yin, G.; Li, M.; Wang, J.; Xu, J.; Li, W. Mechanical behavior and permeability evolution of gas infiltrated coals during protective layer mining. Int. J. Rock Mech. Min. Sci. 2015, 80, 292–301. [Google Scholar] [CrossRef]
- Li, M.; Yin, G.; Xu, J.; Cao, J.; Song, Z. Permeability evolution of shale under anisotropic true triaxial stress conditions. Int. J. Coal Geol. 2016, 165, 142–148. [Google Scholar] [CrossRef]
- Liu, W.; Li, Y.; Wang, B. Gas permeability of fractured sandstone/coal samples under variable confining pressure. Transp. Porous Media 2010, 83, 333–347. [Google Scholar] [CrossRef]
- De Silva, G.P.D.; Ranjith, P.G.; Perera MS, A.; Chen, B. Effect of bedding planes, their orientation and clay depositions on effective re-injection of produced brine into clay rich deep sandstone formations: Implications for deep earth energy extraction. Appl. Energy 2016, 161, 24–40. [Google Scholar] [CrossRef]
- Zhai, J.; Wang, J.; Lu, G.; Qin, X.; Wang, W. Permeability characteristics of remolded tectonically deformed coal and its influence factors. J. Nat. Gas Sci. Eng. 2018, 53, 22–31. [Google Scholar] [CrossRef]
- Chen, H.D.; Cheng, Y.P.; Li, W. Damage and permeability development in coal during unloading. Rock Mech. Rock Eng. 2013, 46, 1377–1390. [Google Scholar] [CrossRef]
- Xie, H.; Zhao, X.; Liu, J.; Zhang, R.; Xue, D. Influence of different mining layouts on the mechanical properties of coal. Int. J. Min. Sci. Technol. 2012, 22, 749–755. [Google Scholar] [CrossRef]
- Zhang, Z.; Zhang, R.; Xie, H.; Gao, M.; Xie, J. Mining-induced coal permeability change under different mining layouts. Rock Mech. Rock Eng. 2016, 49, 3753–3768. [Google Scholar] [CrossRef]
- Liu, X.; Dai, F.; Zhang, R.; Liu, J. Static and dynamic uniaxial compression tests on coal rock considering the bedding directivity. Environ. Earth Sci. 2015, 73, 5933–5949. [Google Scholar] [CrossRef]
- Zhang, Z.; Zhang, R.; Xie, H.; Liu, J.; Were, P. Differences in the acoustic emission characteristics of rock salt compared with granite and marble during the damage evolution process. Environ. Earth Sci. 2015, 73, 6987–6999. [Google Scholar] [CrossRef]
- Perfect, E. Fractal models for the fragmentation of rocks and soils: A review. Eng. Geol. 1997, 48, 185–198. [Google Scholar] [CrossRef]
Figure 1.
Abutment pressure evolution characteristics during mining process (modified after [36]).
Figure 1.
Abutment pressure evolution characteristics during mining process (modified after [36]).

Figure 2.
Schematic of the experimental system.
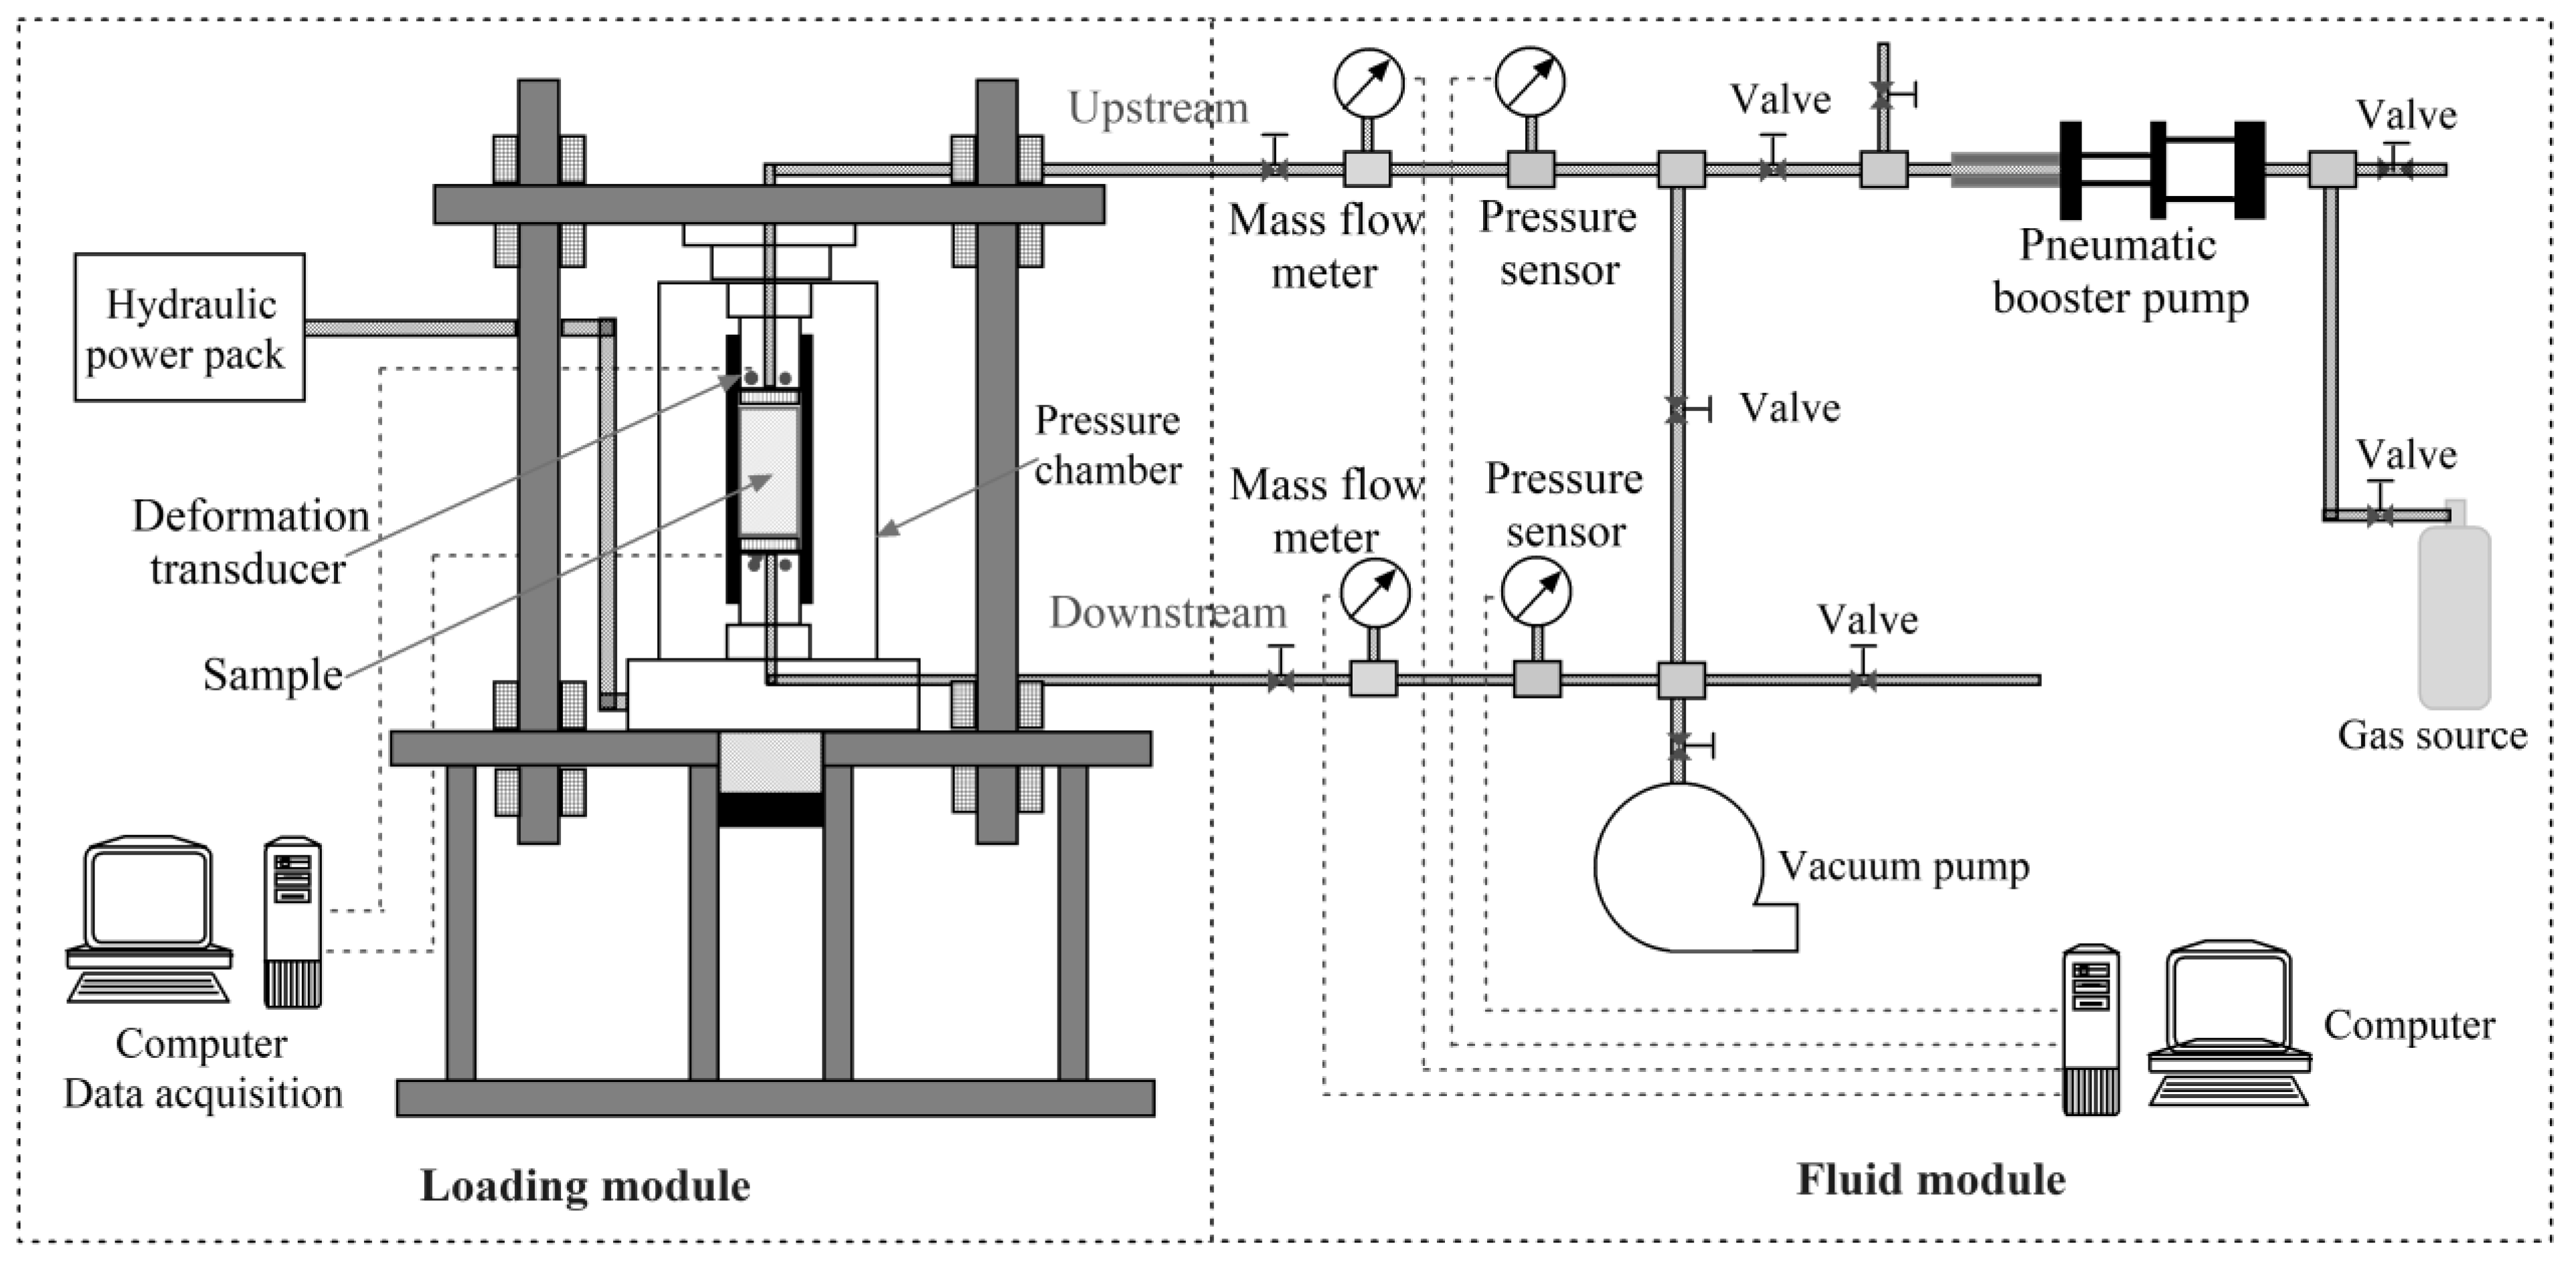
Figure 3.
Images of the test equipment.

Figure 4.
Loading schemes under different mining paths.
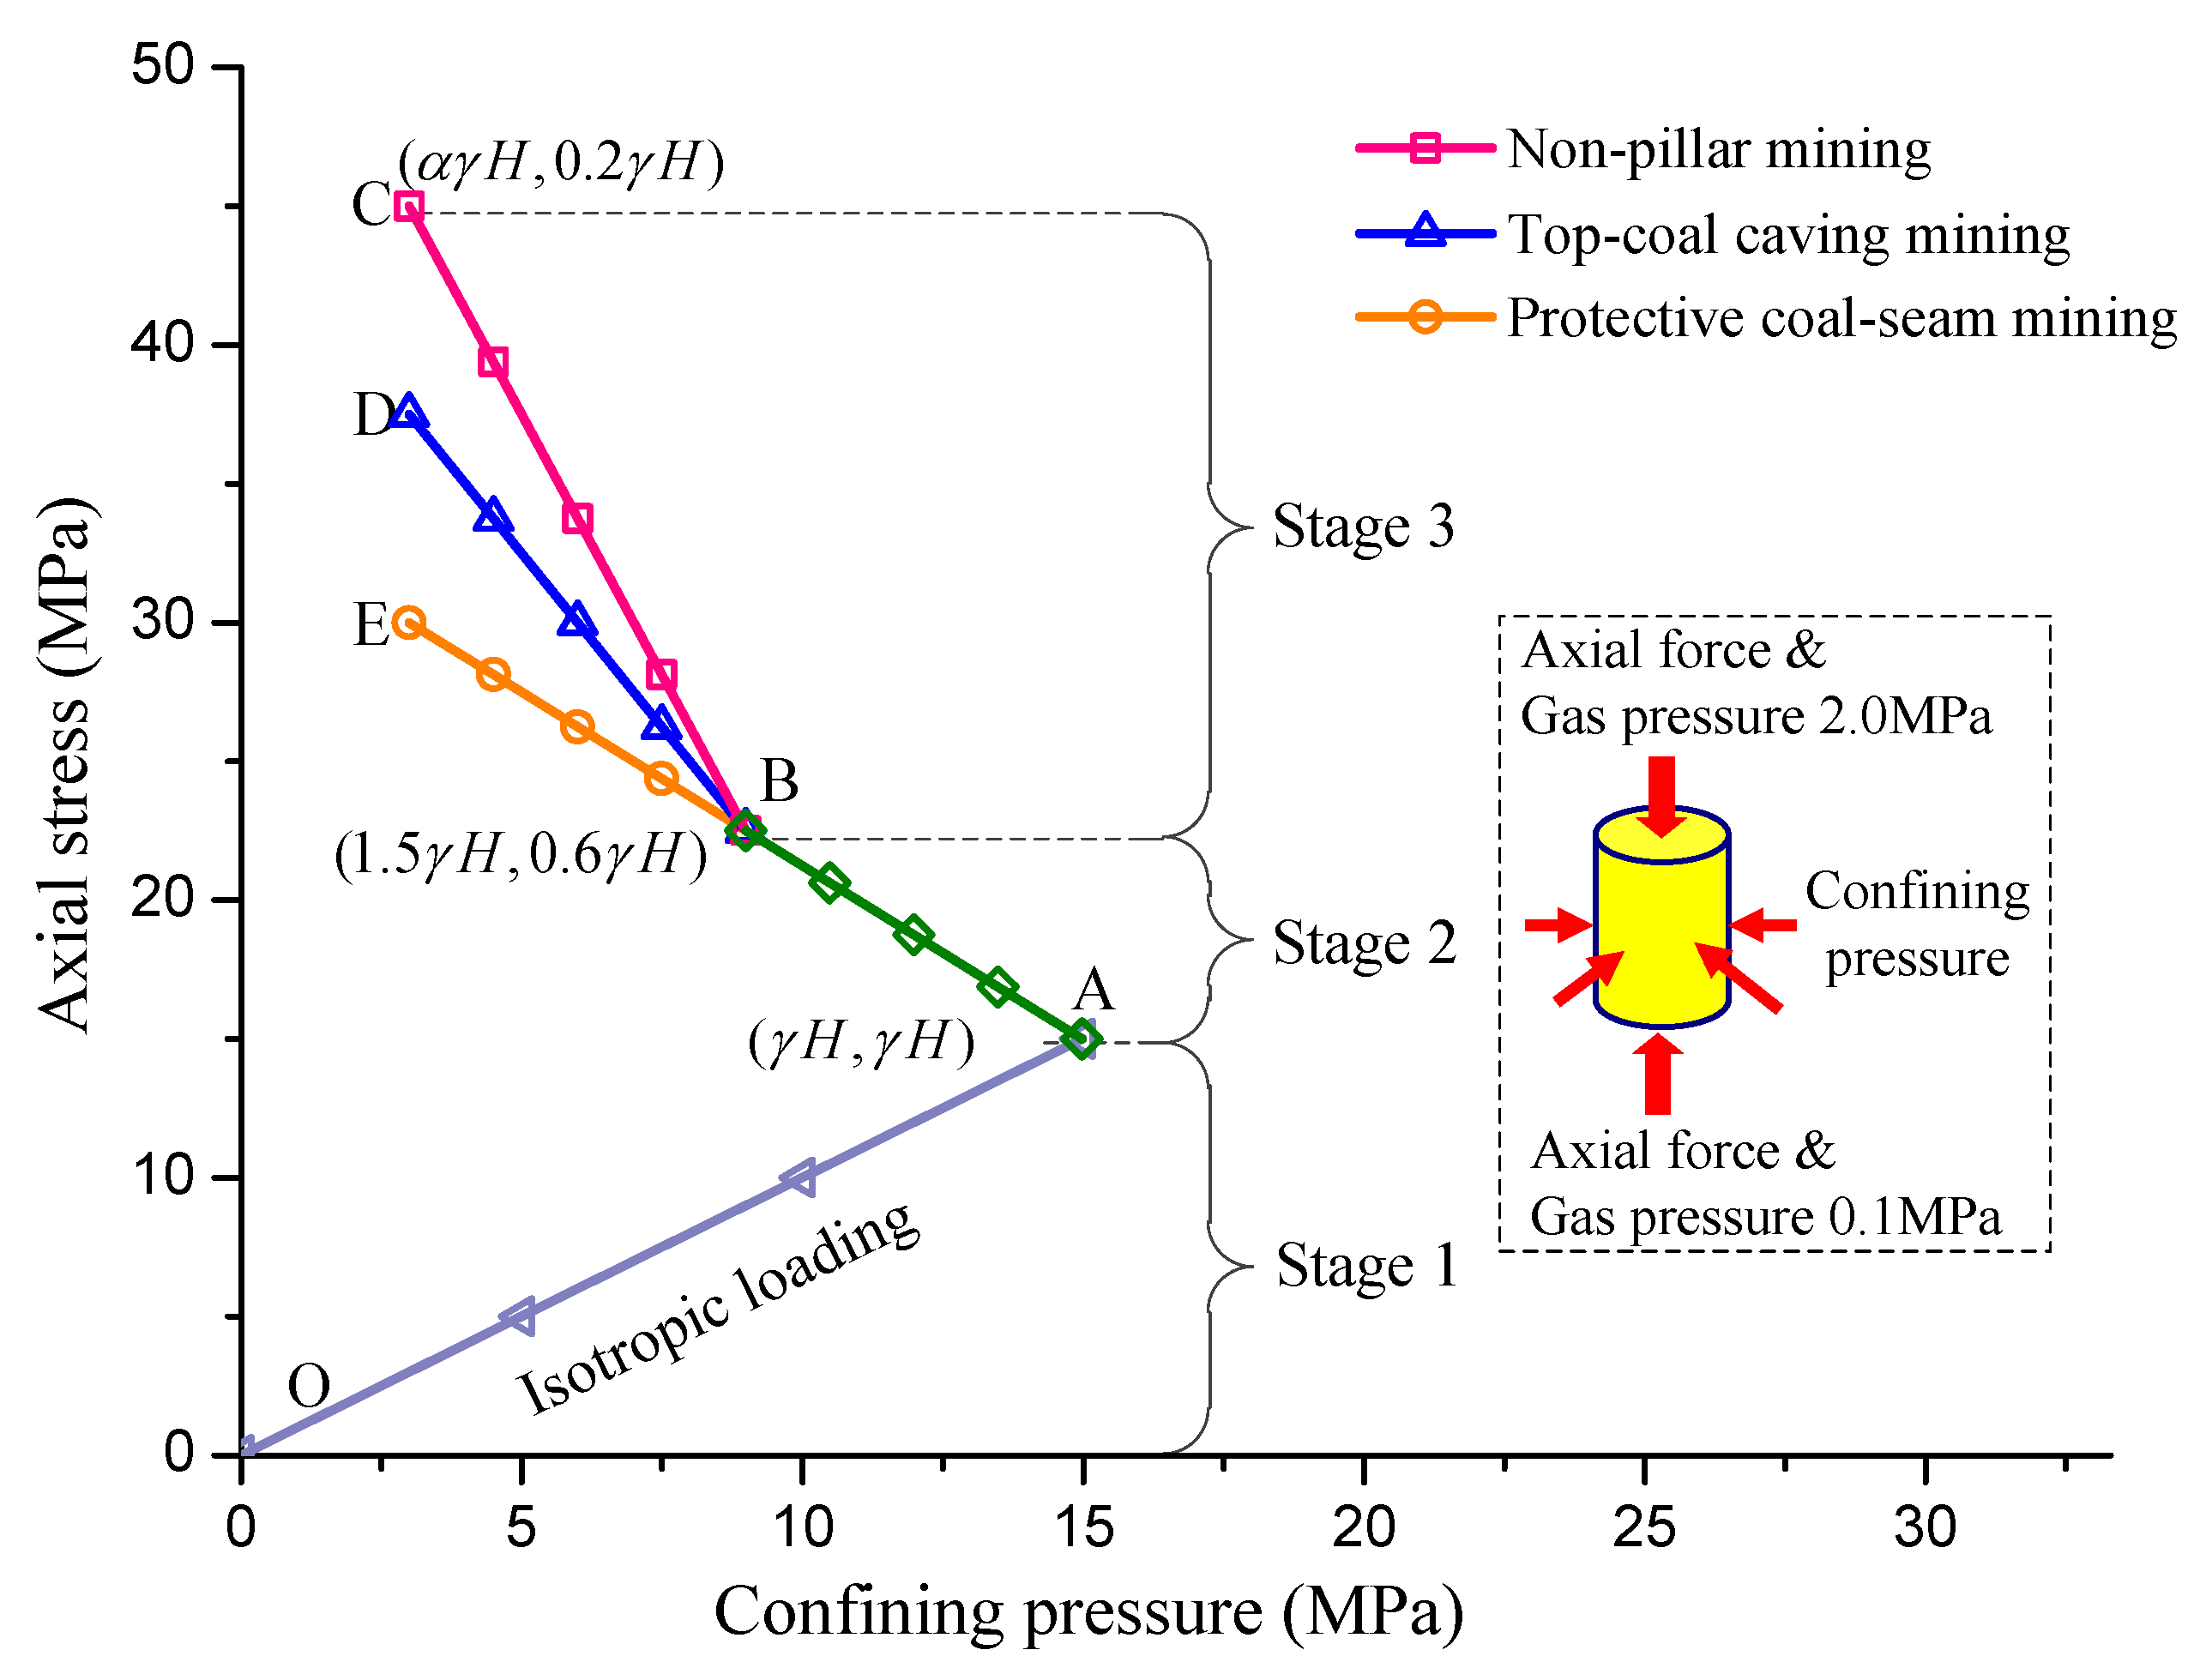
Figure 5.
SEM image of the sample.
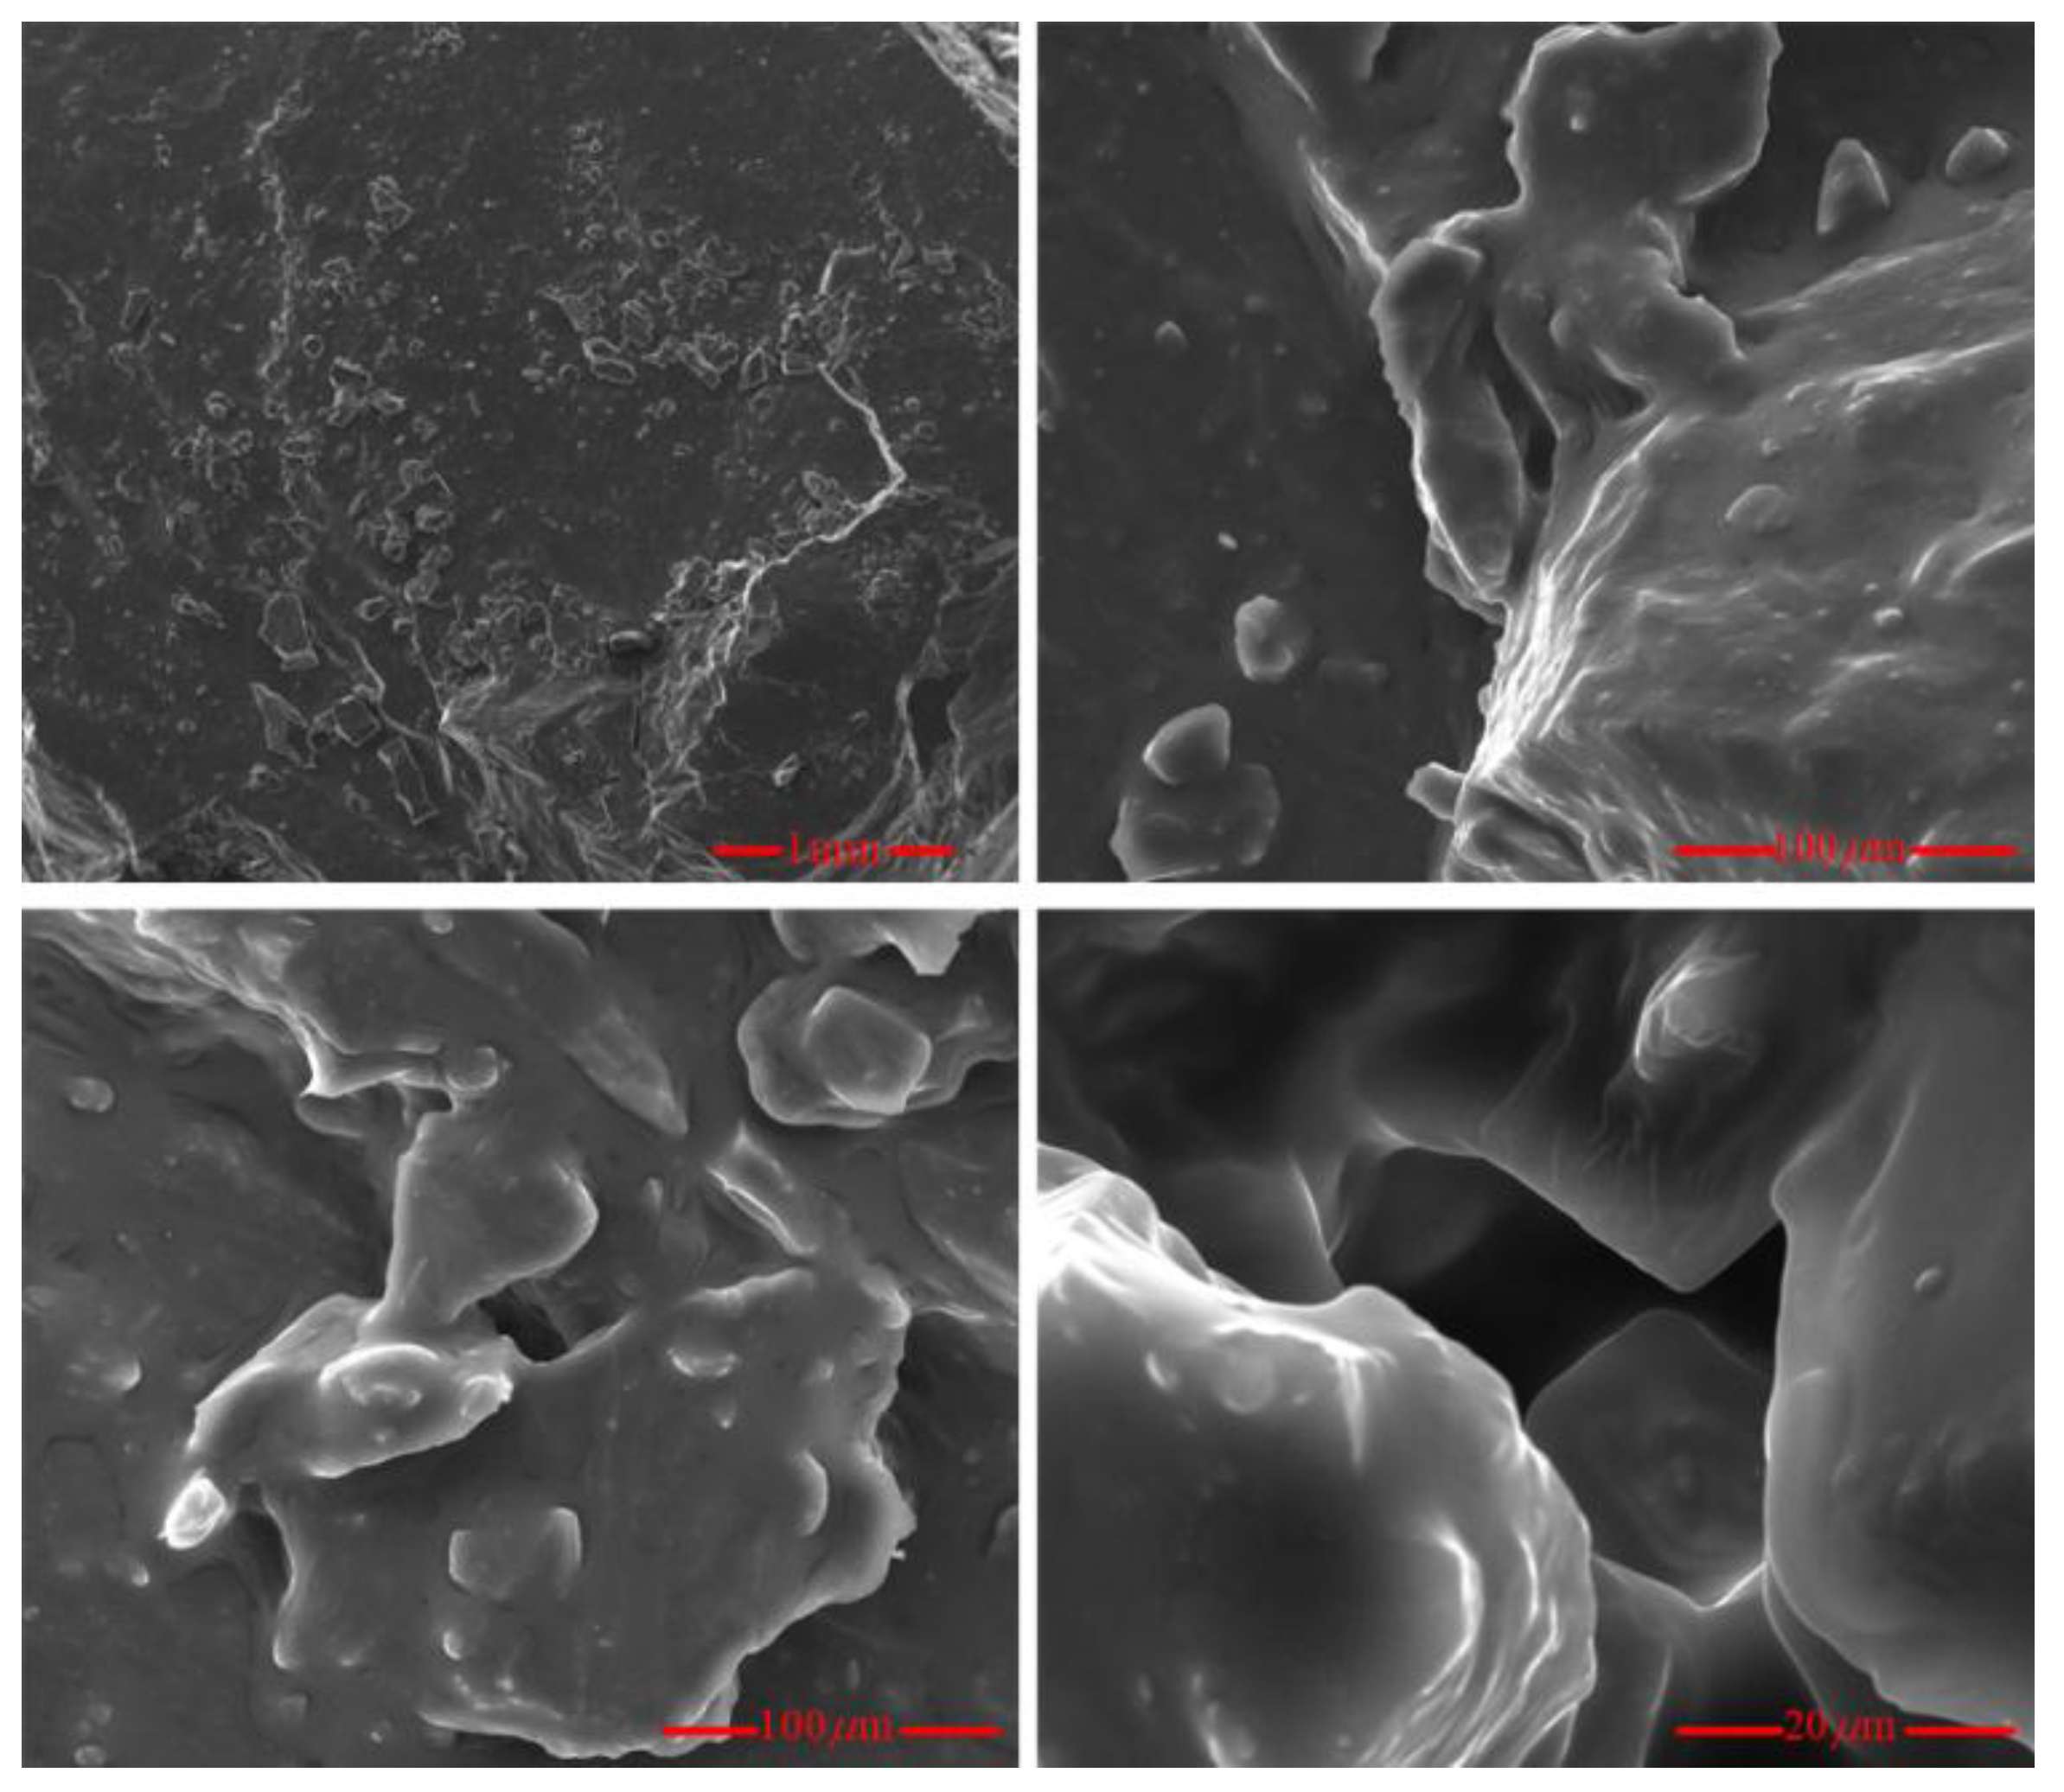
Figure 6.
Deviatoric stress–strain process of coal samples. (a) coal samples C-1, C-2 and C-3; and (b) coal samples C-4, C-5 and C-6.
Figure 6.
Deviatoric stress–strain process of coal samples. (a) coal samples C-1, C-2 and C-3; and (b) coal samples C-4, C-5 and C-6.

Figure 7.
Different energy components obtained from the stress–strain curve (modified after [9]).
Figure 7.
Different energy components obtained from the stress–strain curve (modified after [9]).
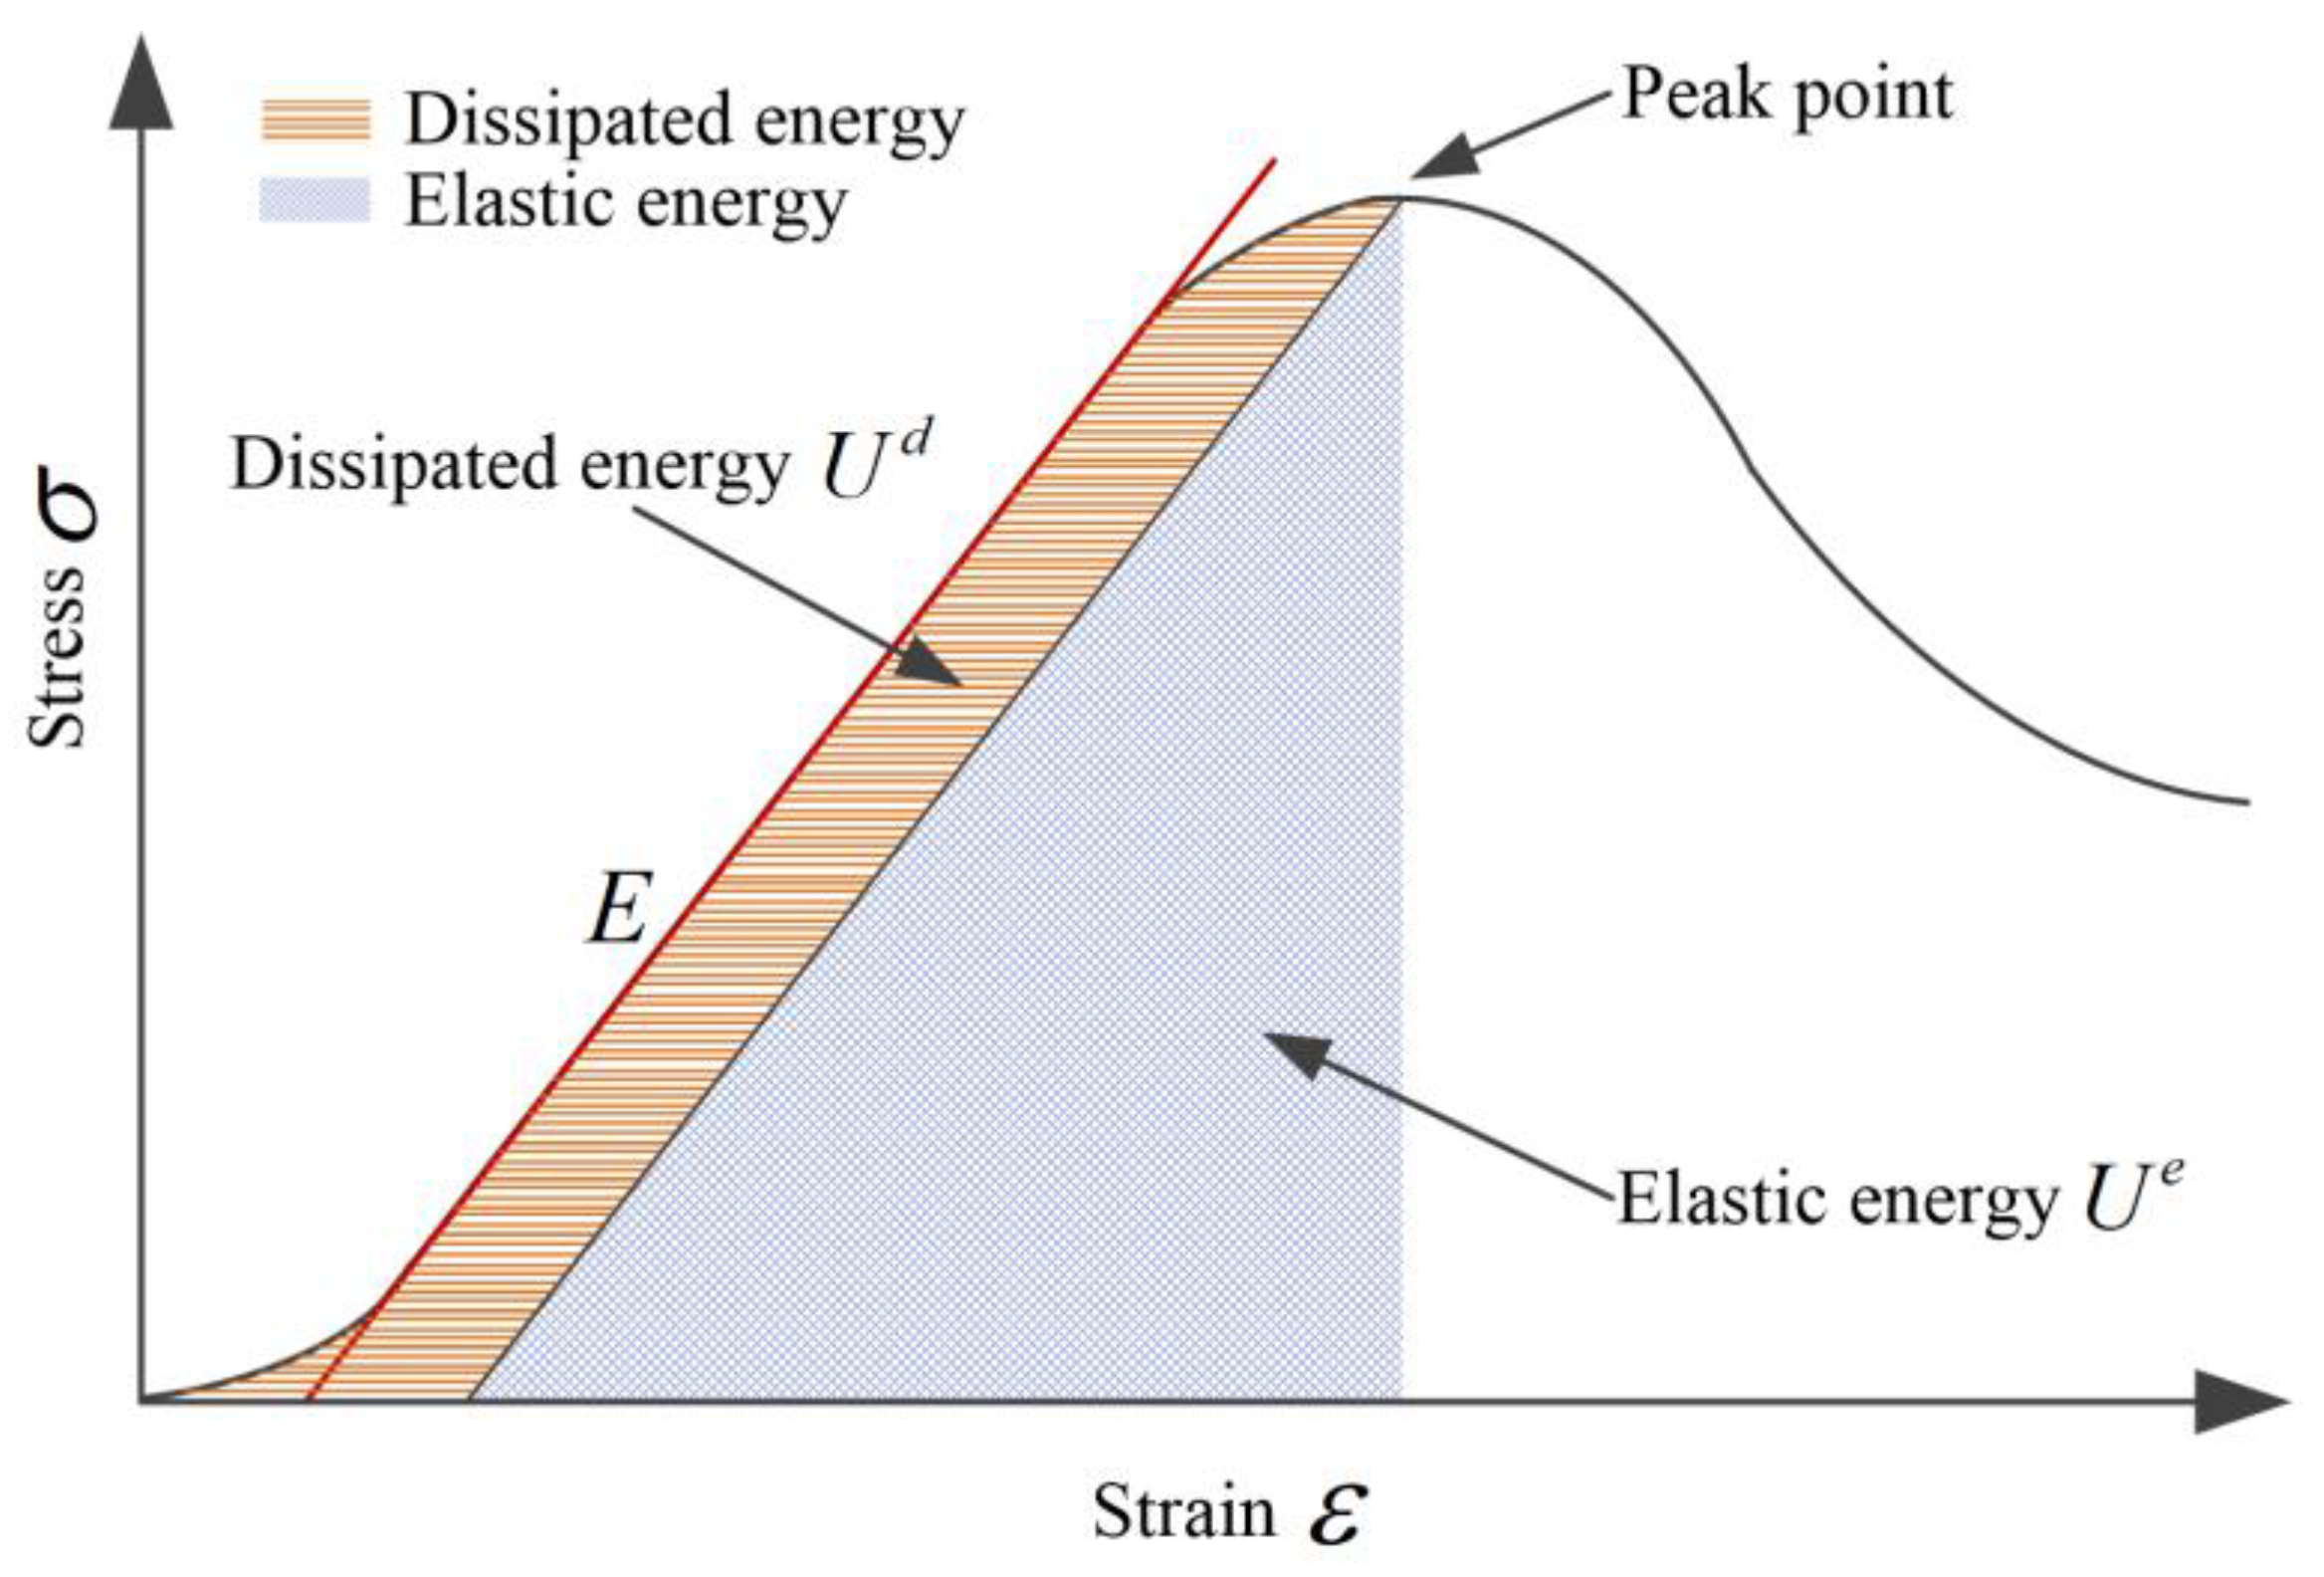
Figure 8.
Curves of the energy evolution of coal samples during loading. (a) coal sample C-1, C-2 and C-3; and (b) coal sample C-4, C-5 and C-6.
Figure 8.
Curves of the energy evolution of coal samples during loading. (a) coal sample C-1, C-2 and C-3; and (b) coal sample C-4, C-5 and C-6.

Figure 9.
Relationship between volumetric strain, permeability and deviatoric stress of coal sample. (a) coal sample C-1, C-2 and C-3; (b) coal sample C-4, C-5 and C-6.
Figure 9.
Relationship between volumetric strain, permeability and deviatoric stress of coal sample. (a) coal sample C-1, C-2 and C-3; (b) coal sample C-4, C-5 and C-6.
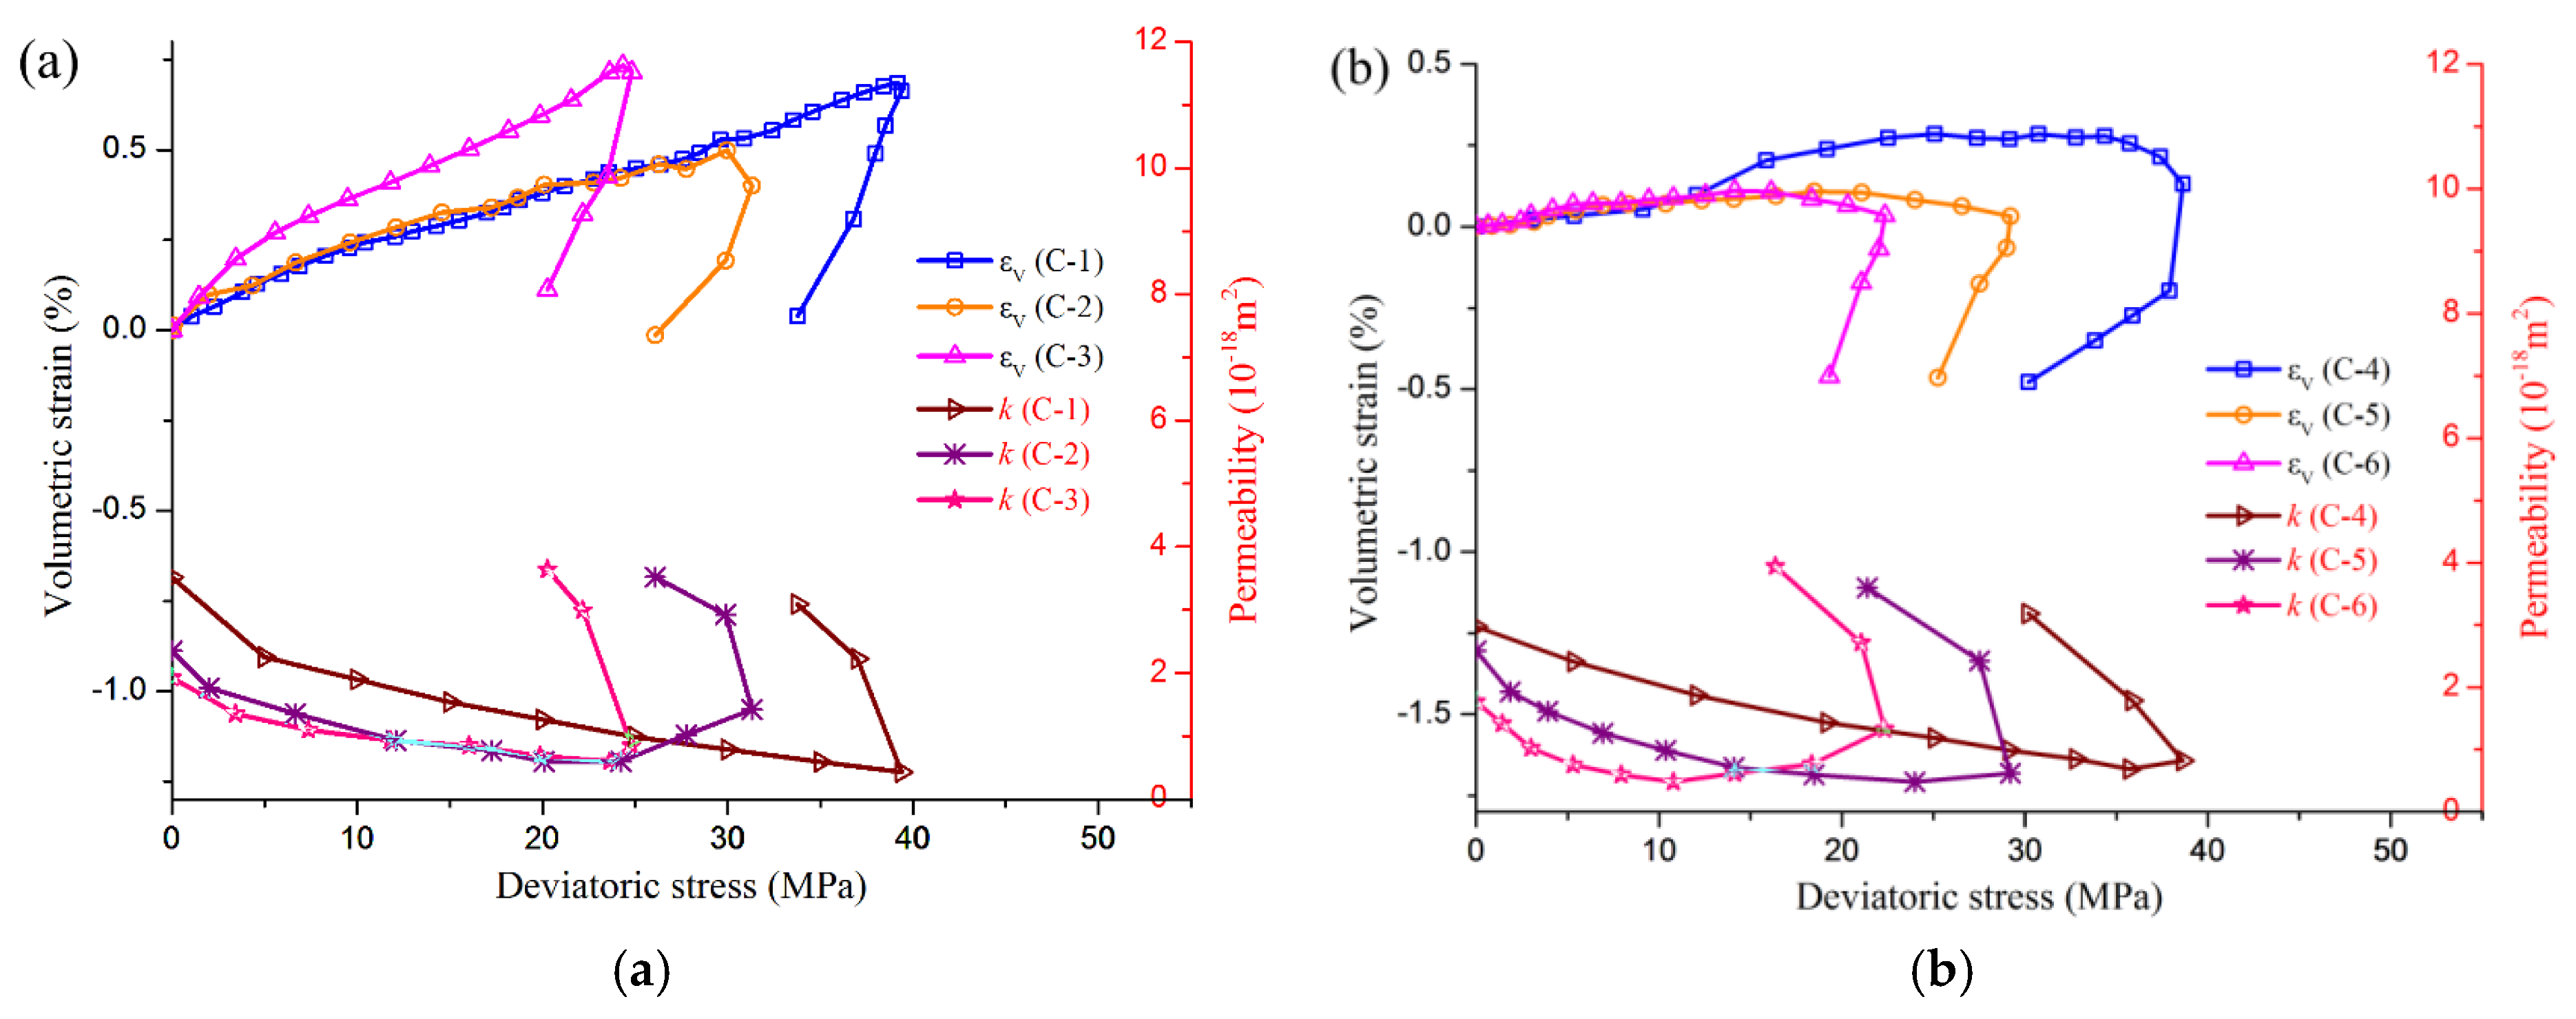
Figure 10.
Representative curves of cumulative AE energy with the axial strain of coal specimens under different mining paths. (a) Sample C-1; (b) Sample C-2; (c) Sample C-3.
Figure 10.
Representative curves of cumulative AE energy with the axial strain of coal specimens under different mining paths. (a) Sample C-1; (b) Sample C-2; (c) Sample C-3.
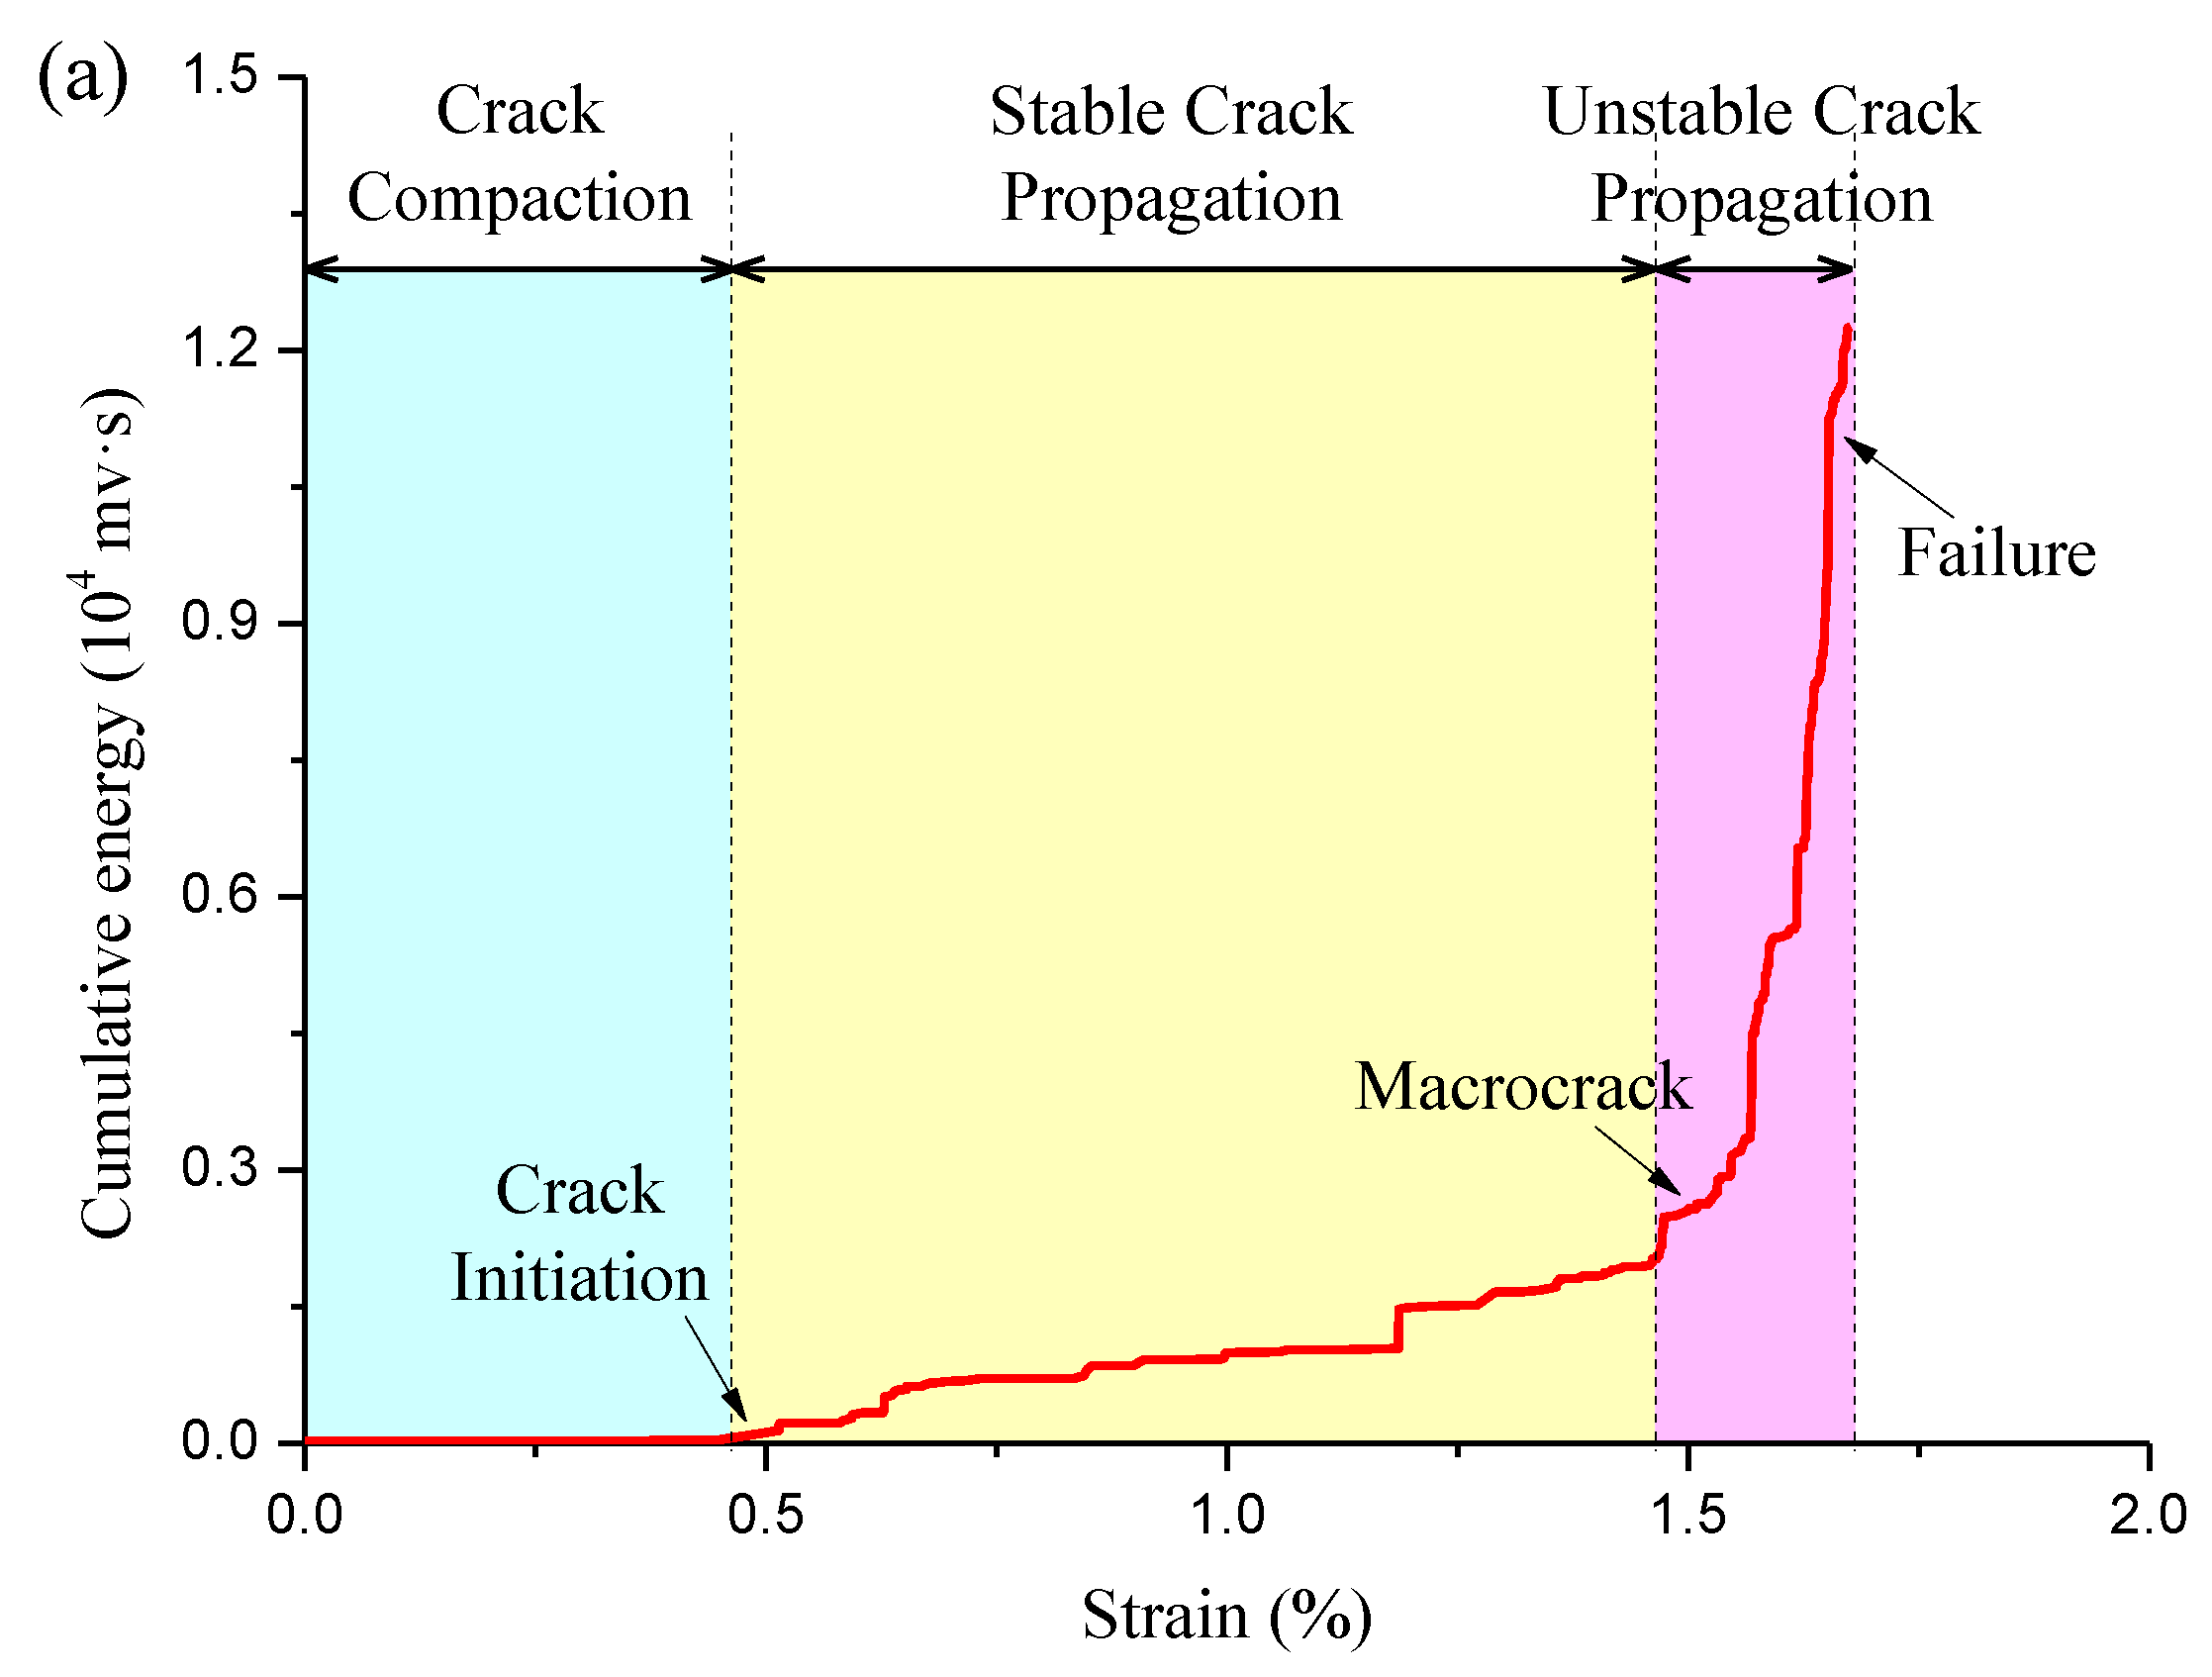

Figure 11.
b value of the AE of coal samples under different mining paths.

Figure 12.
Influence of mining paths on the evolution of P-wave velocity.
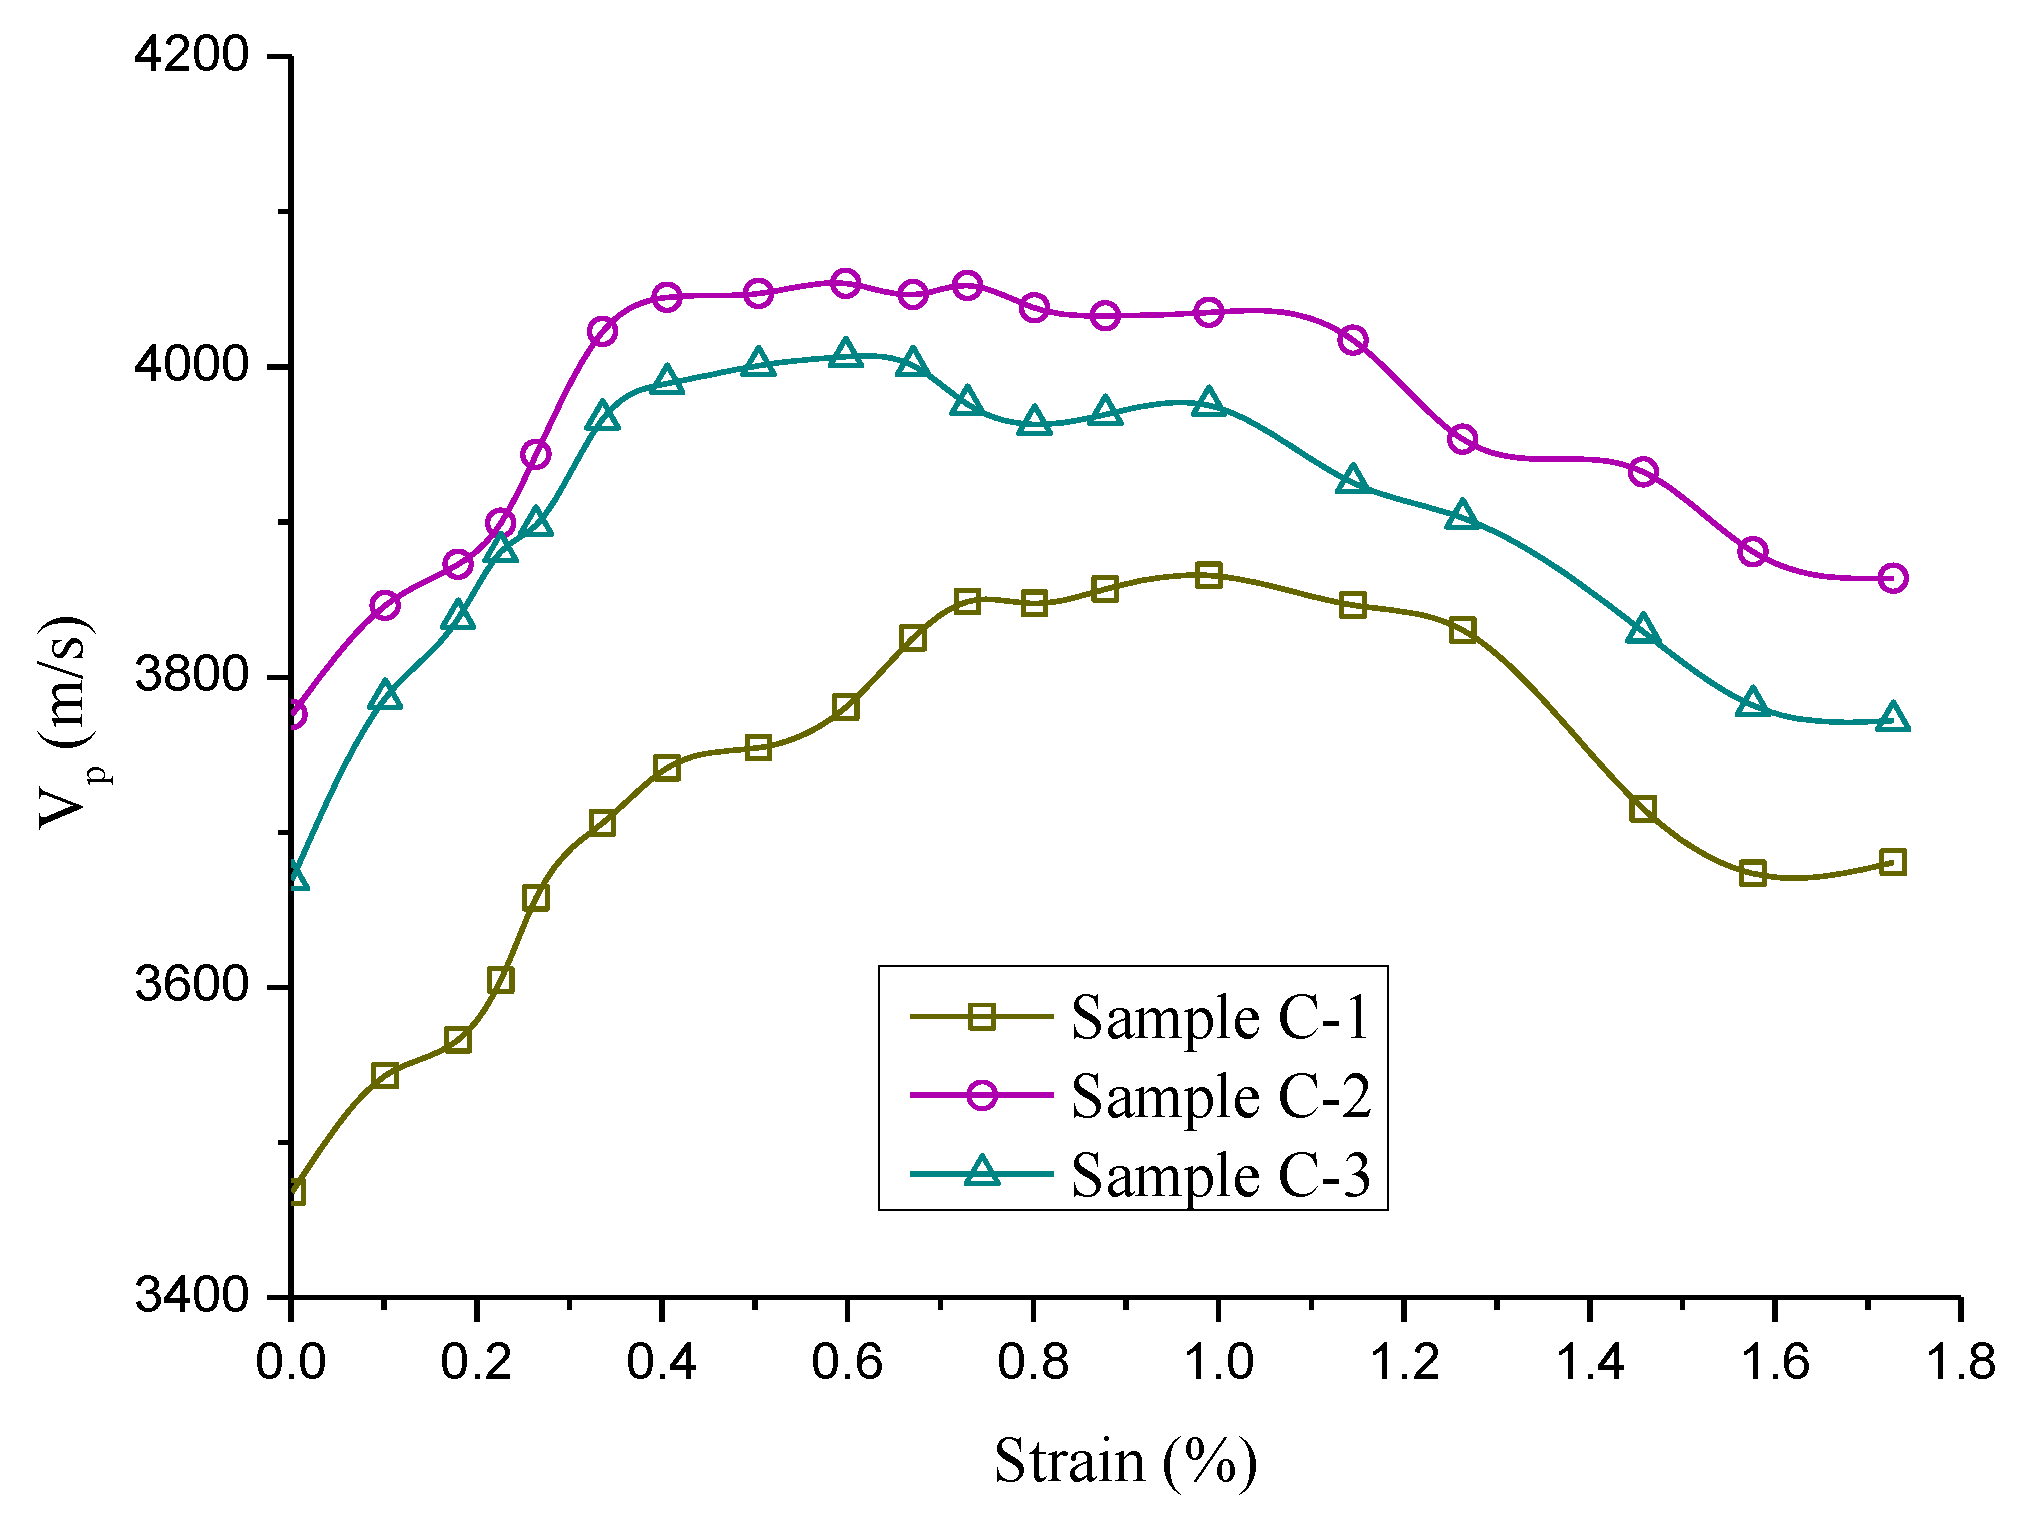
Figure 13.
AE event evolution charateristics of coal samples during loading.

Figure 14.
PSD of coal fragments under different mining paths (I. >15 mm; II. 10–15 mm; III. 5–10 mm; IV. 2–5 mm; V. <2 mm).
Figure 14.
PSD of coal fragments under different mining paths (I. >15 mm; II. 10–15 mm; III. 5–10 mm; IV. 2–5 mm; V. <2 mm).

Figure 15.
Relationship between the permeability and fractal dimension of fractured coal with different mining paths.
Figure 15.
Relationship between the permeability and fractal dimension of fractured coal with different mining paths.

Table 1.
Experimental parameters of coal specimens.
| Sample No. | Length (mm) | Density (g/cm3) | Peak Deviatoric Stress (MPa) | Peak Stress Point | Mining Method | ||||
|---|---|---|---|---|---|---|---|---|---|
| σ3 (MPa) | ε1 (%) | ε3 (%) | εv (%) | Permeability (10−18m2) | |||||
| C-1 | 99.1 | 1.35 | 39.39 | 6.47 | 1.46 | −0.4 | 0.66 | 0.28 | NM |
| C-2 | 100.3 | 1.42 | 31.32 | 6.05 | 1.28 | −0.44 | 0.4 | 0.3 | TCM |
| C-3 | 100.8 | 1.42 | 24.81 | 5.73 | 1.17 | −0.26 | 0.65 | 0.19 | PCM |
| C-4 | 101.3 | 1.41 | 38.63 | 6.63 | 0.5 | −0.18 | 0.14 | 0.36 | NM |
| C-5 | 100.3 | 1.42 | 29.21 | 6.15 | 0.43 | −0.2 | 0.03 | 0.33 | TCM |
| C-6 | 100.4 | 1.36 | 22.34 | 5.93 | 0.44 | −0.2 | 0.04 | 0.21 | PCM |
Table 2.
PSD and fractal dimensions measured in the experiments.
| Sample | Peak Stress (MPa) | Confining Pressure (MPa) | Size (mm) | Mass (g) | Fractal Dimension D |
|---|---|---|---|---|---|
| C-1 | 45.86 | 6.47 | >15 | 215.4 | 2.178 |
| — | — | — | 10–15 | 9.2 | — |
| 5–10 | 9.1 | ||||
| 2–5 | 7.8 | ||||
| <2 | 19.5 | ||||
| C-2 | 37.37 | 6.05 | >15 | 233.2 | 2.341 |
| — | — | — | 10–15 | 10.7 | — |
| 5–10 | 9.1 | ||||
| 2–5 | 6.3 | ||||
| <2 | 8.2 | ||||
| C-3 | 30.54 | 5.73 | >15 | 244.2 | 2.409 |
| — | — | — | 10–15 | 7.2 | — |
| 5–10 | 6.7 | ||||
| 2–5 | 7.1 | ||||
| <2 | 4.9 | ||||
| C-4 | 45.26 | 6.63 | >15 | 177.7 | 2.172 |
| — | — | — | 10–15 | 33.1 | — |
| 5–10 | 23.6 | ||||
| 2–5 | 10.8 | ||||
| <2 | 13.1 | ||||
| C-5 | 35.36 | 6.15 | >15 | 229.6 | 2.296 |
| — | — | — | 10–15 | 9.5 | — |
| 5–10 | 15.5 | ||||
| 2–5 | 9.6 | ||||
| <2 | 8.4 | ||||
| C-6 | 28.27 | 5.93 | >15 | 239.5 | 2.371 |
| — | — | — | 10–15 | 16.9 | — |
| 5–10 | 8.9 | ||||
| 2–5 | 5.9 | ||||
| <2 | 6.7 |
© 2018 by the authors. Licensee MDPI, Basel, Switzerland. This article is an open access article distributed under the terms and conditions of the Creative Commons Attribution (CC BY) license (http://creativecommons.org/licenses/by/4.0/).
Share and Cite
MDPI and ACS Style
Xue, Y.; Dang, F.; Cao, Z.; Du, F.; Ren, J.; Chang, X.; Gao, F. Deformation, Permeability and Acoustic Emission Characteristics of Coal Masses under Mining-Induced Stress Paths. Energies 2018, 11, 2233. https://doi.org/10.3390/en11092233
AMA Style
Xue Y, Dang F, Cao Z, Du F, Ren J, Chang X, Gao F. Deformation, Permeability and Acoustic Emission Characteristics of Coal Masses under Mining-Induced Stress Paths. Energies. 2018; 11(9):2233. https://doi.org/10.3390/en11092233
Chicago/Turabian StyleXue, Yi, Faning Dang, Zhengzheng Cao, Feng Du, Jie Ren, Xu Chang, and Feng Gao. 2018. "Deformation, Permeability and Acoustic Emission Characteristics of Coal Masses under Mining-Induced Stress Paths" Energies 11, no. 9: 2233. https://doi.org/10.3390/en11092233
Note that from the first issue of 2016, this journal uses article numbers instead of page numbers. See further details here.