1. Introduction
Electricity demand is steadily increasing globally as the world develops and technology advances. This increase in demand is not unique to any one country. Developed nations’ technologies are advancing electricity requirements and developing countries’ population and electricity demand is continuously increasing. World power demand will increase 1.4 times from 19,562 TWh in 2012 to 26,761 TWh in 2025 mainly in developing countries [
1]. Worldwide capacity is expected to increase by a factor of 1.4 from 6117 GW in 2014 to 8370 GW in 2025 to meet these demands. Newly added capacity in developing countries is expected to account for 70% of this increase [
1]. While smart grid technologies and various renewable energy sources have been developed, they are insufficient for meeting the increasing demand and cannot replace traditional power-intensive generation [
1]. Thus, the development of traditional power generation methods’ demand is expected to grow.
In particular, coal-fired power plants are expected to experience significant growth within developing countries such as China and India [
1]. Despite international air-pollution regulations, coal-fired power generation is the most realistic alternative to ensure a stable supply of electricity [
2,
3]. To meet worldwide environmental standards, it is still necessary to reduce greenhouse gases and air pollutants. While carbon dioxide capture and storage and an integrated coal-gasification combined cycle represent some of the potential solutions, they are yet to become economically feasible [
4,
5,
6]. Thus, the most effective and realistic way to solve future global energy demands is to increase the efficiency and equate to a greenhouse gas reduction of coal-fired power-generation systems [
7]. To support the growth within this industry, this paper presents the most profitable way for newly constructed coal-fired power plants to use said efficiencies through analyses of power-cycles and associated life-cycle costs.
Coal-fired power-generation market conditions have deteriorated in recent years due to declining contracts, falling oil prices, and increased competition due to market saturation. Depending on the price competitiveness of natural gas, gas plants may replace coal and nuclear power plants in the future. In the renewable energy sector, policy support is reduced, but the price of power generation is lowered due to a decrease in system price, which increases its competitiveness [
3]. Furthermore, markets that have historically been dominated by a domestic engineer, construction (EPC) companies are experiencing competition from international developing countries with lower labor costs [
3]. Other countries (such as Japan) are securing the market by becoming independent power producers (IPP) and self-performing the EPC work. Due to these factors, the number of Korean EPC companies awarded overseas construction projects have steadily decreased in recent years. The total overseas power-generation projects awarded has declined from
$17.4 billion in 2012 to
$4 billion in 2016 [
3,
8]. First world countries such as Korea have stricter labor laws, which makes them unable to compete with countries such as China. Thus, most EPC companies in Korea may soon fail if they do not adapt and convert to the Japanese investment and development business model such as IPP [
8].
With the necessary transition into project development, there is a greater need for understanding and contracting with financial institutions. Due to lowering interest rates, financial institutions are choosing alternative investments more frequently [
9]. “Alternative investment” refers to all investments except for stocks and bonds and has higher returns than bonds with less risk than stocks. Alternative investments in Korea began with investments in private equity funds and infrastructure assets. As the alternative investment market grew, project financing became more active. Private alternative investments are most frequent with investments within the energy sector gaining the spotlight [
9].
With the need for Korean EPC contractors to evolve their business models to include the development of projects, their risk and financial analyses become much more complicated. One such complication is the need to accurately analyze the feasibility of a project within the initial stages of development [
10]. Early-stage decision-making determines the success or failure of a project [
11]. To increase project profitability, early cost analyses of coal-fired power plants must be highly accurate and more accurate than the existing models. It is necessary to incorporate technical elements’ impact on investment costs, increased productivity, etc. into the financial model. Existing reports, published by the National Energy Technology Laboratory of the U.S. Department of Energy, provide methods of estimating the equipment costs [
12]. In addition, CEPCI (Chemical Engineering Plant Cost Index) serve as an important tool for professionals when adjusting plant construction costs. The index is updated regularly to reflect current prices [
13]. However, each tool has been developed and used to calculate the total investment, but it has had a limited impact on project profitability. These factors are implemented into the project’s cash flow analyses within this paper, which increases the accuracy of existing coal-fired power plant investment models.
2. Coal-Fired Power Plant: Reheat Cycle Steam Power Production
Concerning coal-fired power plants, the main technical factors and power production of the plant are based on a thermodynamic cycle called the Rankine cycle. This cycle is depicted in
Figure 1 and consists of a turbine, boiler, pump, and condenser. The thermal efficiency of the Rankine cycle can be increased by a regeneration cycle, reheat cycle, and a combined regenerative reheat cycle. The thermal efficiency can be adjusted by changing factors such as the main steam pressure, the main steam temperature, and the turbine outlet pressure [
14].
The thermal efficiency of the Rankine cycle is the ratio of the specific network output (
wturb,out) and the specific heat input (
qin)
. The thermal efficiency is determined by the steam enthalpy of the turbine inlet and the enthalpy of steam at the turbine outlet. To improve the efficiency of the Rankine cycle, which is the basis of the coal power cycle, the steam temperature and pressure at the turbine inlet and the pressure at the turbine outlet should be optimized [
15,
16].
Increasing the efficiency of the power generating cycle is typically accomplished one of three ways: increasing the boiler pressure, increasing input steam temperature, and/or decreasing condenser pressure. Increasing the main steam pressure at the turbine inlet (boiler) raises the temperature at which boiling takes place, which raises the heat added to the steam. Though an efficiency solution, it also increases the system pressure (increasing condenser pressure) and increases the wet steam at the turbine outlet, which equates to turbine blade corrosion and reduces efficiency. A reheat cycle in which a second turbine and reheat-cycle are added mitigates these inefficiencies. With the reheat cycle, there is no wet steam build up at the high-pressure turbine outlet and the larger second turbine (requires less pressure, so-called low-pressure turbine) decreases the damages caused by moisture and has a lower pressured output, which increases system efficiencies.
The next option to increase efficiency is raising the heat of the boiler’s steam input. As the temperature of the feedwater is raised, the amount of heat input required of the boiler is reduced. A feedwater heater is used to heat the wet steam leaving the condenser (feedwater) and the steam that is expanding in the turbine (extraction steam). This system is called the regeneration cycle (
Figure 1c in red) and includes a deaerator for heating and removing air and several low and high-pressure feedwater heaters. The cycle efficiency is improved by increasing the number of feedwater heaters. However, in practice, the optimum number of feedwater heaters is determined by considering the economics. This paper will study the impact of the system based on the use of six, seven, or eight re-heaters but most thermal power plants typically have eight water heaters installed.
The use of the regeneration cycle increases the thermal efficiency and the use of a reheat cycle has the advantage of avoiding corrosion and frictional losses in the turbine. Therefore, combining these two cycles (shown in
Figure 1c) can be very advantageous in terms of the facility operation as well as efficiency. The last method of decreasing the condenser pressure equates to a lowering of the temperature at which heat is rejected, which increases the temperature of the feed water and increases cycle efficiency. This can be achieved by decreasing the main steam pressure or the reheat steam pressure. This can be achieved through the above cycles and/or manipulating equipment designs and is, therefore, not shown in
Figure 1, but its impact on cycle efficiency is studied within this paper. The efficiency improvement methods presented above are based on theoretical cycles and losses due to irreversibility should be considered when considering actual cycles. The causes of irreversibility are fluid friction and heat loss to the surroundings. Fluid friction causes a pressure drop in the boiler, condenser, and piping between the various equipment [
14].
In addition to the method of improving the steam cycle, various methods for increasing the power generation efficiency have been developed. There is a combined cycle power plant (CCPP) type that reuses waste heat from a gas turbine and a cogeneration or combined heat and power plant (CHP) type that produces commercial steam in that type. This change in power generation has further improved the thermal efficiency of existing coal-fired power. Gas power generation using this type is also widely used. In addition, there are other methods such as heat recovery from flu gases (economizer), preheating of combustion air, optimizing the air-fuel excess ratio, the mixing of fuel and air, and more [
15].
3. Existing Literature
Many scholars have studied and observed changes in the plant efficiency caused by different system parameters such as the boiler temperature, boiler pressure, mass-fraction ratio, and work output. Dincer et al. [
17,
18] observed the energy and exergy efficiencies with the aforementioned parameters, which confirms the possibility of further improving the plant efficiency. The impact of technical factors and related efficiencies on project costs have also been presented in previous studies, which is discussed below.
As a project becomes larger and additional funding becomes necessary, it becomes increasingly important to determine the investment cost of the project early on in the project. Esty [
19] investigates project financing on mega-projects and Hastak et al. [
20] presents an innovative cost management strategy, which aids decision-makers in their project cost control strategies and planning. However, as presented by Abadie [
21], when the cutting-edge and first time technology is used in the project, it becomes more difficult for project developers, contractors, and financiers to understand it. Existing cost-analysis models that derive project profitability have mainly identified the financial aspects [
11]. Technical factors have had a limited impact when calculating the total investment cost in existing practice. This equates to more time and effort required to reflect the various technical factors’ impact on cost during the initial investment decision stage. Conventionally, in the case of a power generation project, a design model with the highest efficiency or the lowest cost was selected and the project was conducted. The focus was only on calculating the project profitability for this model [
22].
Alternatively, when calculating power plant investment costs, an accurate estimation of the equipment constitutes that the plant is required. This cost estimation involves risk due to future prediction markets [
23], which can be reduced through the use of parametric estimation [
24]. Parametric estimates use historical data to predict future costs. The assumption of parameter estimates is that the same factors that affected past costs affect future costs. The main advantage of using parametric methodologies is that estimations can be performed quickly [
25]. This approach has been studied extensively in the field of oil and chemical engineering and renewable power generation [
26,
27]. By applying this method to high-capacity power generation, this paper has tried to estimate the cost of the balance-of-plant (BOP) part among the equipment, which constitutes the power plant using a top-down estimating approach [
28]. The existing literature review for the research topic of power plant design efficiency and engineering economics is summarized in
Table 1 as the initiation of the study introduced in this paper.
4. Point of Departure
As can be seen in
Table 1, existing literature often discusses financial and technical optimization separately. Financial models have too many variables and are too complex to reflect technological changes. At the investment stage, rapid decision-making is required and including these factors can be burdensome. In addition, financial variables are known to have a more significant impact on project profitability than some technical factors [
29]. The design that achieves maximum efficiency is often set as a fixed value in practice and literature. As such, often in the investment stage, financial and technical factor assessments are separated.
The uniqueness of this study is the inclusion of both technical and financial variables in a singular model, which allows decision makers to better understand the financial implications of design configurations. The complexities of the costs associated with design configurations are reduced through a less precise yet less burdensome parametric estimation. The model considers all design configuration variations and their impact on profitability. This allows these two steps to be unified and the power plant sponsors to optimize the design’s financial capability. This model is designed to reflect changes in the heat consumption rate, the power capacity, and the total investment, according to technological variables using Thermoflex simulation software.
5. Data Collection & Research Methodology
The goal of this paper is to discover the conditions of which a coal-fired steam power plant can receive the highest profitability, which reflects various technical and financial factors. The input data for the modeling was collected from a case study of one operational 600-MW Philippines coal-fired power plant.
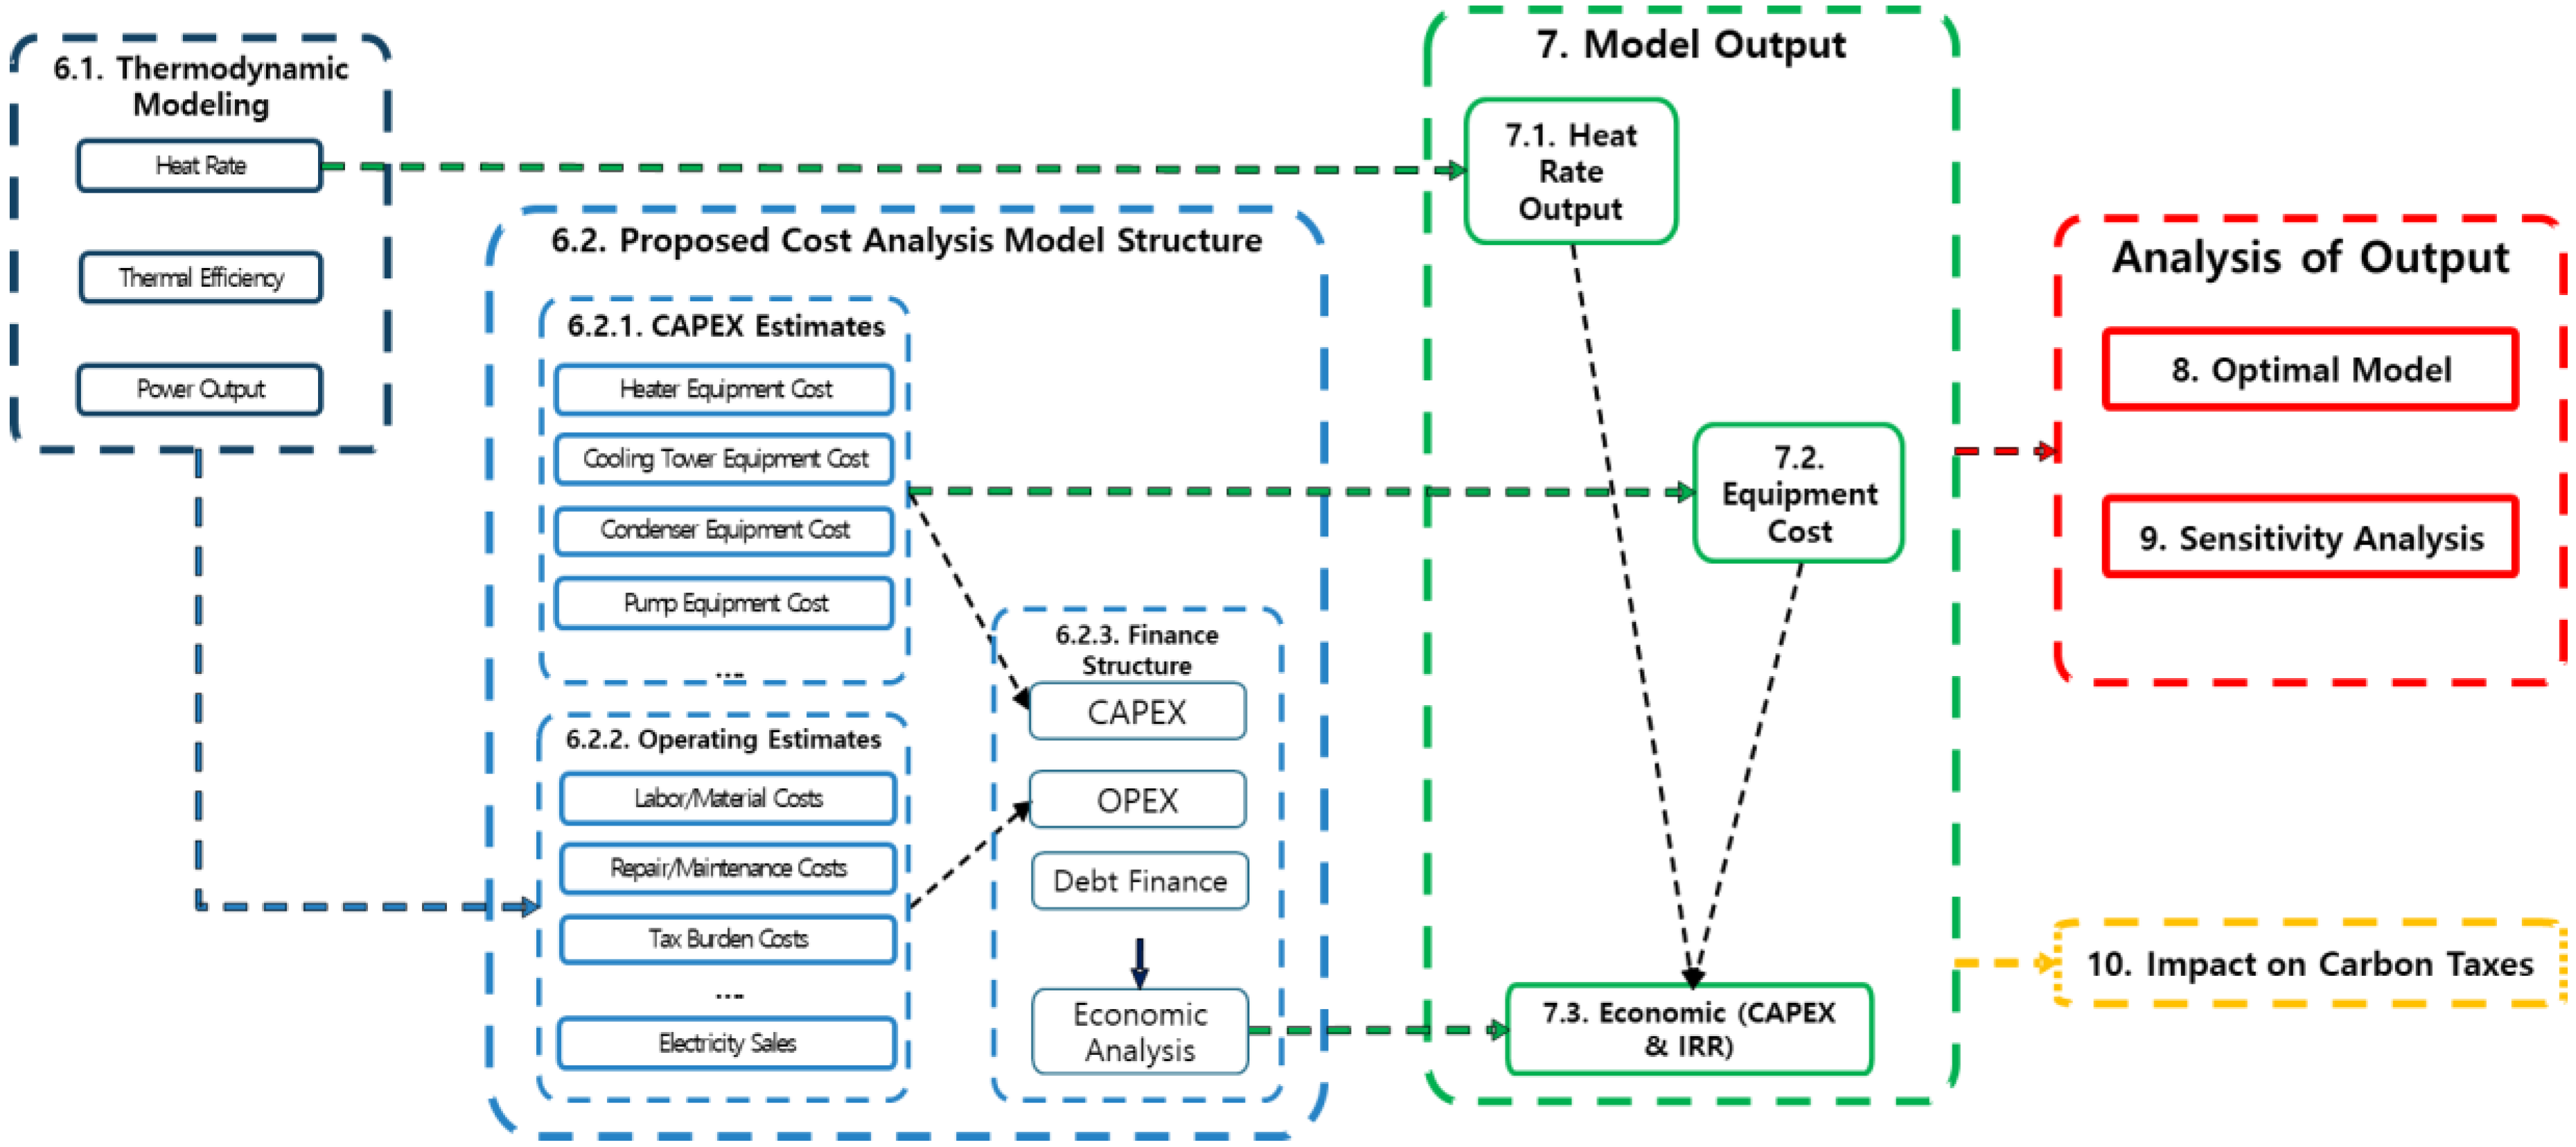
Figure 2 depicts the flow of the research methodology (referencing paper section numbers for ease of reader), which is described in greater detail below.
(1) Model Development:
Thermodynamic Modeling: The simulation software, Thermoflex (developed by Thermoflow, headquartered in Jacksonville, FL), calculated coal-fired power plant performance and heat rates using input variables that affect plant efficiency (ex. temperature and pressure of the steam conditions). The outputs of this step are used in
Section 6.2.2 to calculate the operating costs and electricity sales revenue.
Proposed Financial Model: The proposed financial model using Thermoflex to simulate technological changes is presented. Cost considerations include capital expenditures (CAPEX), operational expenditures (OPEX), and financial data.
Equipment Costs (CAPEX): The total investment costs are calculated for the simulated power plant consisting of the equipment and installation costs. Equipment costs are calculated using methods developed by the US National Energy Technology Laboratory (NETL) [
12]. The findings are presented in
Section 7.2 Equipment Costs.
Operating Costs (OPEX): Using the outputs of the Thermoflex simulation (
Section 6.1) and the Cost and Performance Assumptions for Modeling Electricity Generation Technologies issued by the US National Renewable Energy Laboratory of the U.S. Department of Energy [
28].
Financial Inputs: The model financial inputs are presented. The assumed values are collected from an operational Philippines power plant. The analysis is based on the Recommended Project Finance Structures for the Economic Analysis of Fossil-Based Energy Projects published by the US National Renewable Energy Laboratory of the U.S. Department of Energy [
29].
(2) Model Outputs: The outputs from
Section 6 are presented for further analysis. This includes
Section 7.1 Heat Rate Output and
Section 7.2 Equipment Cost which are, along with
Section 6.2.3 Financial Inputs, used as inputs for
Section 7.3 Economic Analysis. The CAPEX and the internal rate of return are presented for different heat rate output models.
(3) Optimal Model: From 19,440 simulations, the model with the greatest profitability is shown. The conditions, IRR, and net present value of the said model are presented.
(4) Sensitivity Analysis: A sensitivity analysis was conducted on the most profitable model identified in
Section 8 to examine the change in profitability of the project with a variable heat rate. The sensitivity analysis was based on the impacts of a heat rate change between −10% and +10%.
(5) Carbon Cost Impact on Project Profitability: Using a range of carbon costs (based on international policies), said costs’ impact on project profitability is presented.
6. Model Development
6.1. Thermodynamic Modeling
Using Thermoflex, the main factors affecting the efficiency of the power plant were used to simulate their effect on the heat rate, the thermal efficiency, and the power output. These factors were identified as a main steam temperature and a pressure and reheat steam temperature, a main steam pressure drop, a reheat steam pressure drop, the number of feed water heaters in the process (feedwater heating stages), condensed temperature rise, and the resultant final feedwater temperature. From the factors, input variables with values based on the case study’s operational data were created. All combinations of the variable values were used as inputs to the Thermoflex process model, which result in 19,440 simulations. For all simulations, it was assumed that a surface-type condenser and a wet-type cooling tower were used. To reach the desired final feedwater temperatures, 2/3 of the simulations applied a heater above the reheat point (HARP) on top of the 6/7/8 heaters (4320 simulations applied a HARP to six, seven, and eight stages equating to 12,960 simulations in total applying a HARP). The variations of each variable (9 × 3 × 4 × 4 × 5 × 9 = a total of 19,440 cases) are shown in
Table 2 and are described in greater detail below.
The most basic and most impactful step in optimizing a steam cycle is modifying the main steam pressure and temperature. As the main steam pressure increases, the heat-consumption rate (measure of efficiency) improves. However, this results in the steam expanding and increasing the steam pressure in the condenser. This increases the temperature at which heat is rejected within the condenser (more heat is released), which decreases the temperature of the feedwater and decreases efficiencies gained. This means that, with each incremental degree, the increase of the steam temperature is a diminishing increase in efficiency. To mitigate this diminishing rate of return, the reheat cycle can be used with benefits described in
Section 2. Logically, there exists a main and reheat steam temperature that equate to an optimal efficiency. In this study, suitable temperatures of 566, 588, and 600 °C were used under subcritical or supercritical conditions. Furthermore, the steam power-cycle is designed for either subcritical (<220 bar) or supercritical (>220 bar) pressures [
15,
16,
30]. As such, this study tests efficiencies of both a subcritical (160 bar) and supercritical (240 bar) power plant. In combining the factors into logical combinations of values (ex. 566/600 °C is unlikely), there were nine input variables defined.
After the main and reheated steam goes through the turbine(s) and condenser (now feedwater), a significant amount of energy is lost. Thus, it is necessary to increase the feedwater supply heat to maximize the final feedwater temperature. As stated above, most plants use eight heating stages for maximum cycle efficiency, but this paper focuses on testing the fiscal impact of all reasonable design solutions and, therefore, the number of heater stages was set to six, seven, and eight. Cycle efficiency is also improved when the HARP is used as the HARP increases system temperature. However, the HARP is not a chosen variable and is only one factor that impacts the variable of the final feed water temperature.
Another way to increase efficiencies is to decrease pressure or increase temperature of the condenser, which results in less heat escaping the cycle through the condensation process. The pressure can be modified by regulating the temperature through a multitude of equipment design choices. As such, the researchers inputted ranges of pressure drops into the Thermoflex process model to study the impact that resultant design outputs had on economic efficiency [
30]. The authors chose pressure drops typically desired by designers based on the case study data. The main steam pressure drop was 2% to 5% and the reheat steam pressure was 7% to 10%. Each factor has four input variables with a 1% difference between variables. Lastly, there is a condenser design choice, which results in a lower condensation temperature. Based off case study data, the condenser temperature factor increases across five variables between 7 and 11 K with 1 K increments.
The last variable is the final feedwater temperature. This can be impacted by a multitude of design choices including all of the above and nine variables between 260 °C and 300 °C with 5 °C increments were created. From the 19,440 simulations of these variables, Thermoflex output the heat rate (indicating how much heat is required per kW of the unit power [
31]), efficiency of the plant (gross power from the generator end and net power including auxiliary power measured at the power end) and the design choices of each piece of equipment. These impact costs, sales revenue, and fuel consumption in the economic analysis.
6.2. Proposed Cost Analysis Model Structure
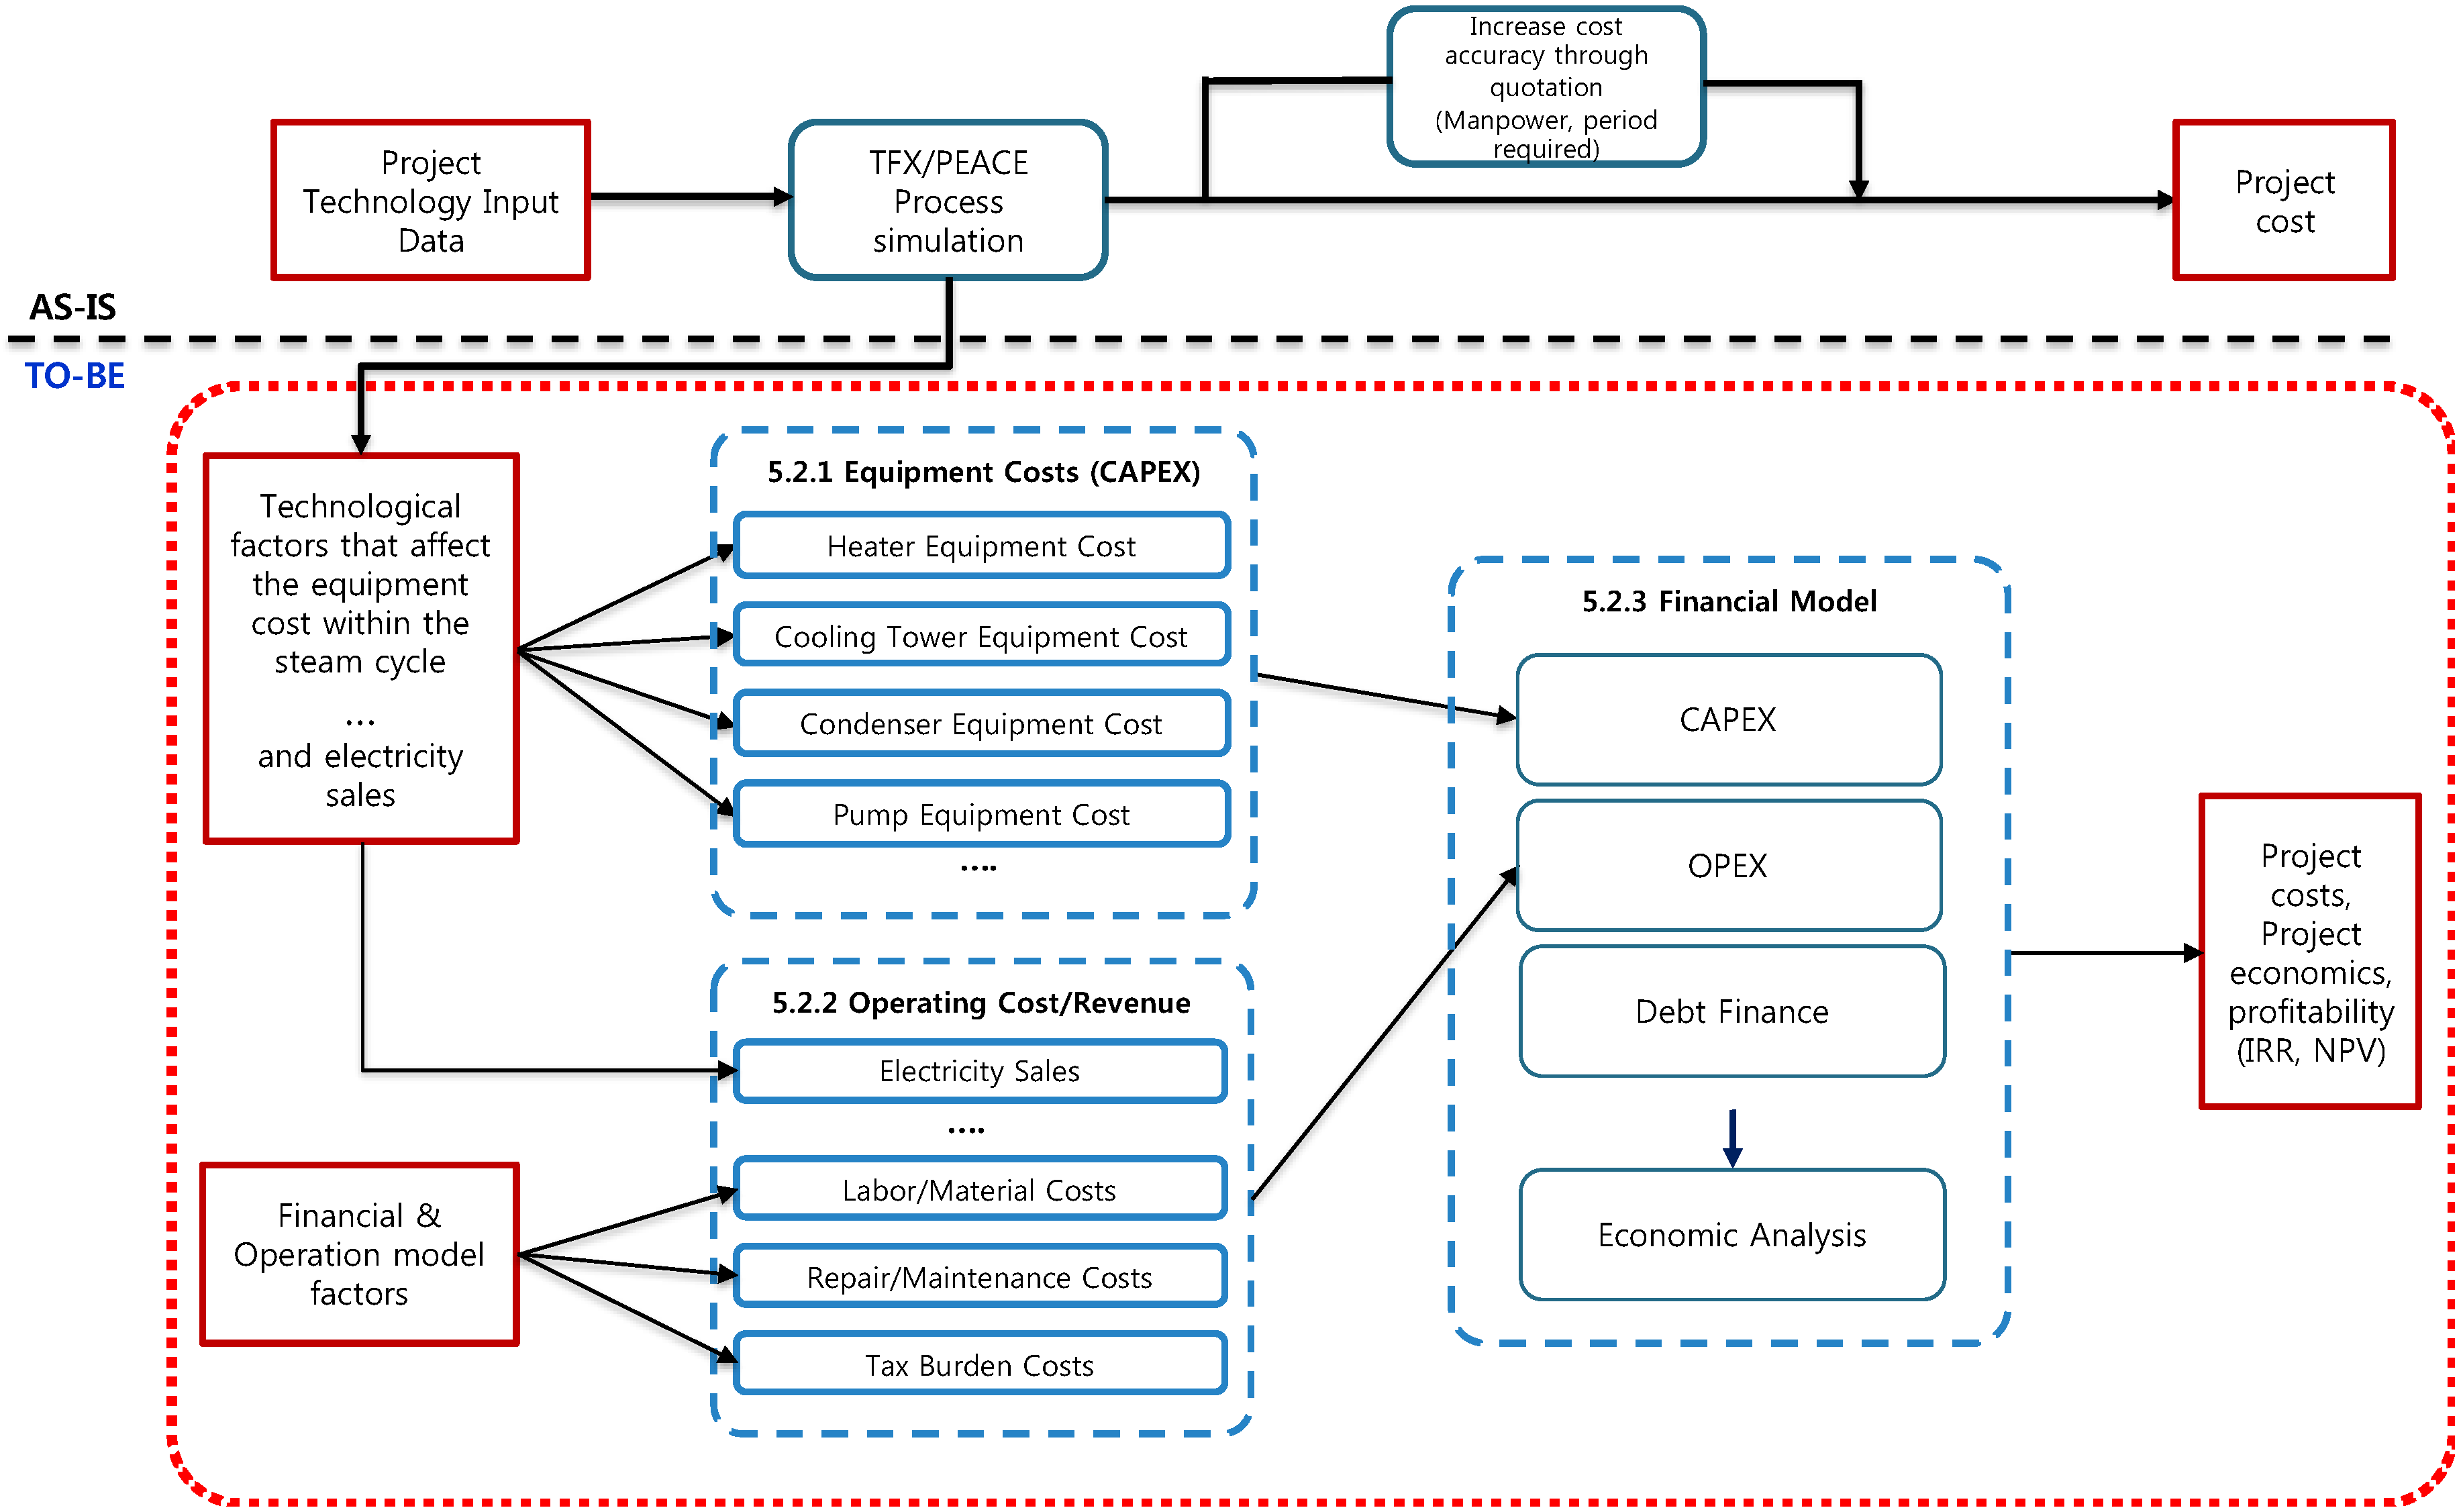
The financial models currently in use perform a Thermoflex (TFX) and plant engineering and cost estimation (PEACE) simulation by finding the most efficient power plant design and its associated cost. The technological choices are considered as one fixed input into the financial review. Furthermore, the financial model generally used at the investment stage does not adequately reflect the heat consumption of the power plant and thus did not reflect the changes in electricity sales revenue or fuel costs [
32]. In an attempt to improve upon these points, a financial model that reflects technical factors as well as financial factors has been proposed, which is depicted in
Figure 3 below.
In general, the conventional method finds a design configuration with the highest power generation efficiency. Then, based on said configuration, a project investment cost is obtained through a quote based on fixed technical factors. The financial analysis is performed based on this investment cost. Alternatively, the financial model presented in this paper enables us to find the optimal return in a short period of time in determining the investment of the project. If the technical decisions and the financial decision making steps are separated, the model can combine the separate processes to quickly find the project profitability.
The proposed financial model consists of four parts: capital expenditure (CAPEX), operations expenditure (OPEX), debt finance, and economic analysis. CAPEX, which is the investment cost for the power-generation project, mainly consists of the equipment supply cost and installation cost. The equipment cost is estimated using base equipment costs, design factors, and reference factors from NETL [
12]. OPEX is the expenditures and revenue incurred during the project period. The project performance and the heat rate resulting from the thermodynamic model simulation affect the income and expenditure of OPEX. Debt finance is structured based off the case study data and are used to calculate the costs of project financing. The CAPEX, OPEX, and debt finance are used to perform an economic analysis of the net income, cash flow, NPV (Net Present Value), and IRR (Internal rate of return). The proposed financial model is designed to obtain a project profitability index across multiple simulated design solutions with an output of an optimal design through the consideration of both technical and financial factors.
6.2.1. CAPEX Estimates
CAPEX refers to the cost spent to create future profits, which is usually the total investment cost of a project in the plant construction period and consists of the equipment and installation costs [
33]. The CAPEX of the financial model of the paper is composed of direct and overhead costs experienced from the project inception to construction, operation, and plant decommissioning. The supply cost part of the direct cost is composed of the cost of the equipment installed in the power plant. The proposed model is different from current power plant CAPEX calculations since the equipment costs are variable and reflect technical factors. As such, a cost-estimation formula was required based on the technical factors. This was accomplished using referenced costs from NETL and the parametric estimation [
12]. For example, in the case of the LP (low pressure) heater, which is a steam cycle equipment, cost estimation was performed using technical factors such as enthalpy and heat duty and values of the existing project. As shown in Equation (1), a cost estimation formula was made for each piece of equipment using the technical factor and reference factors. The total cost of the simulated project is the summation of all equipment (using Equation (1)) plus the equipment of non-steam cycle equipment, which is estimated as a ratio of the similar projects that were actually performed.
where:
Equipment Cost = Cost of a singular piece of equipment;
Ref. Cost = Base Equipment Cost;
Technical Factor = Impact desired design characteristic has on cost;
Ref. Factor = Actual design value used in a previous project;
a, b, … = Scale factor found through equipment cost trend analysis.
The authors analyzed the technical design factors that had the greatest impact on equipment cost through NETL data [
12]. For each piece of equipment, the top two to six variables effecting equipment were chosen and used as the technical factor for Equation (1) above.
Table 3 depicts all of the technical factors.
6.2.2. OPEX Estimates
OPEX is the cost of operating an equipped facility and consists of the direct costs (ex. labor, material, repair/maintenance, etc.) as indirect costs such as the tax burden and revenue [
34]. The revenue of power plants are usually electricity, steam, and water sales. In this paper, it is assumed that only electricity is sold. Among the input values of the cost model, the value corresponding to the power-generation amount of the power plant comes from the result of Thermoflex and the determined electricity sales amount is the revenue of the cost-model power plant. Usually expenditure is composed of fixed costs, variable costs, and working capital, but, in the case of power-generation projects, it involves a large portion of the fuel cost so it is common to separate them from variable costs [
34]. In the case of thermal power generation, the fuel cost depends on coal consumption. The correlation between the coal consumption and the heat rate of the power plant is shown in the following equation.
where:
As shown above, variable and fixed costs were referenced to data of Cost and Performance Assumptions for Modeling Electricity Generation Technologies issued by the National Renewable Energy Laboratory (NREL) of the U.S. Department of Energy [
28]. These are also changed depending on the plant capacity. The earnings before interest, taxes, depreciation, and amortization (EBITDA), as the representative result of OPEX, are calculated by adding the annual income and expenditure during the operating period.
6.2.3. Finance Structure and Economic Analysis
Due to the large capital required for power plants, external funding acquired from institutions such as investment banks are required. As such, a financial cost is incurred to procure capital (ex. interest) [
33]. To calculate the cost of procuring investment, which is the CAPEX of the power plant, many factors are required. These factors were pulled from the case study project and summarized in
Table 4. Not shown in
Table 4, this paper assumes that the project capital is partially procured by project financing. The discount rate was calculated through the capital asset pricing model (CAPM) [
35].
These assumptions were used to calculate a cash flow by adding finance costs and tax to the EBITDA generated by operating a power plant. The discount rate to convert the calculated future value to the present value was obtained through the weighted average cost of capital (WACC) [
36]. The NPV and IRR were derived by adding the calculated present values, which enabled us to judge the profitability of the project. The project profitability index of each case was obtained by using data from all Thermoflex simulations as the input value of the 19,440 cost models. By comparing the profitability by case, an optimal model of 600 MW coal-fired power plant was found.
7. Model Outputs
The heat rate trend, equipment costs, and economic analysis of all 19,440 configurations are presented below. Since the plant efficiency is most significantly affected by the main steam and reheat steam conditions [
37], the data is presented in nine groups per the nine main/reheat steam condition variables. In addition, because the results vary significantly depending on the heater configuration, each group is sub-divided into three groups of 6/7/8 stages.
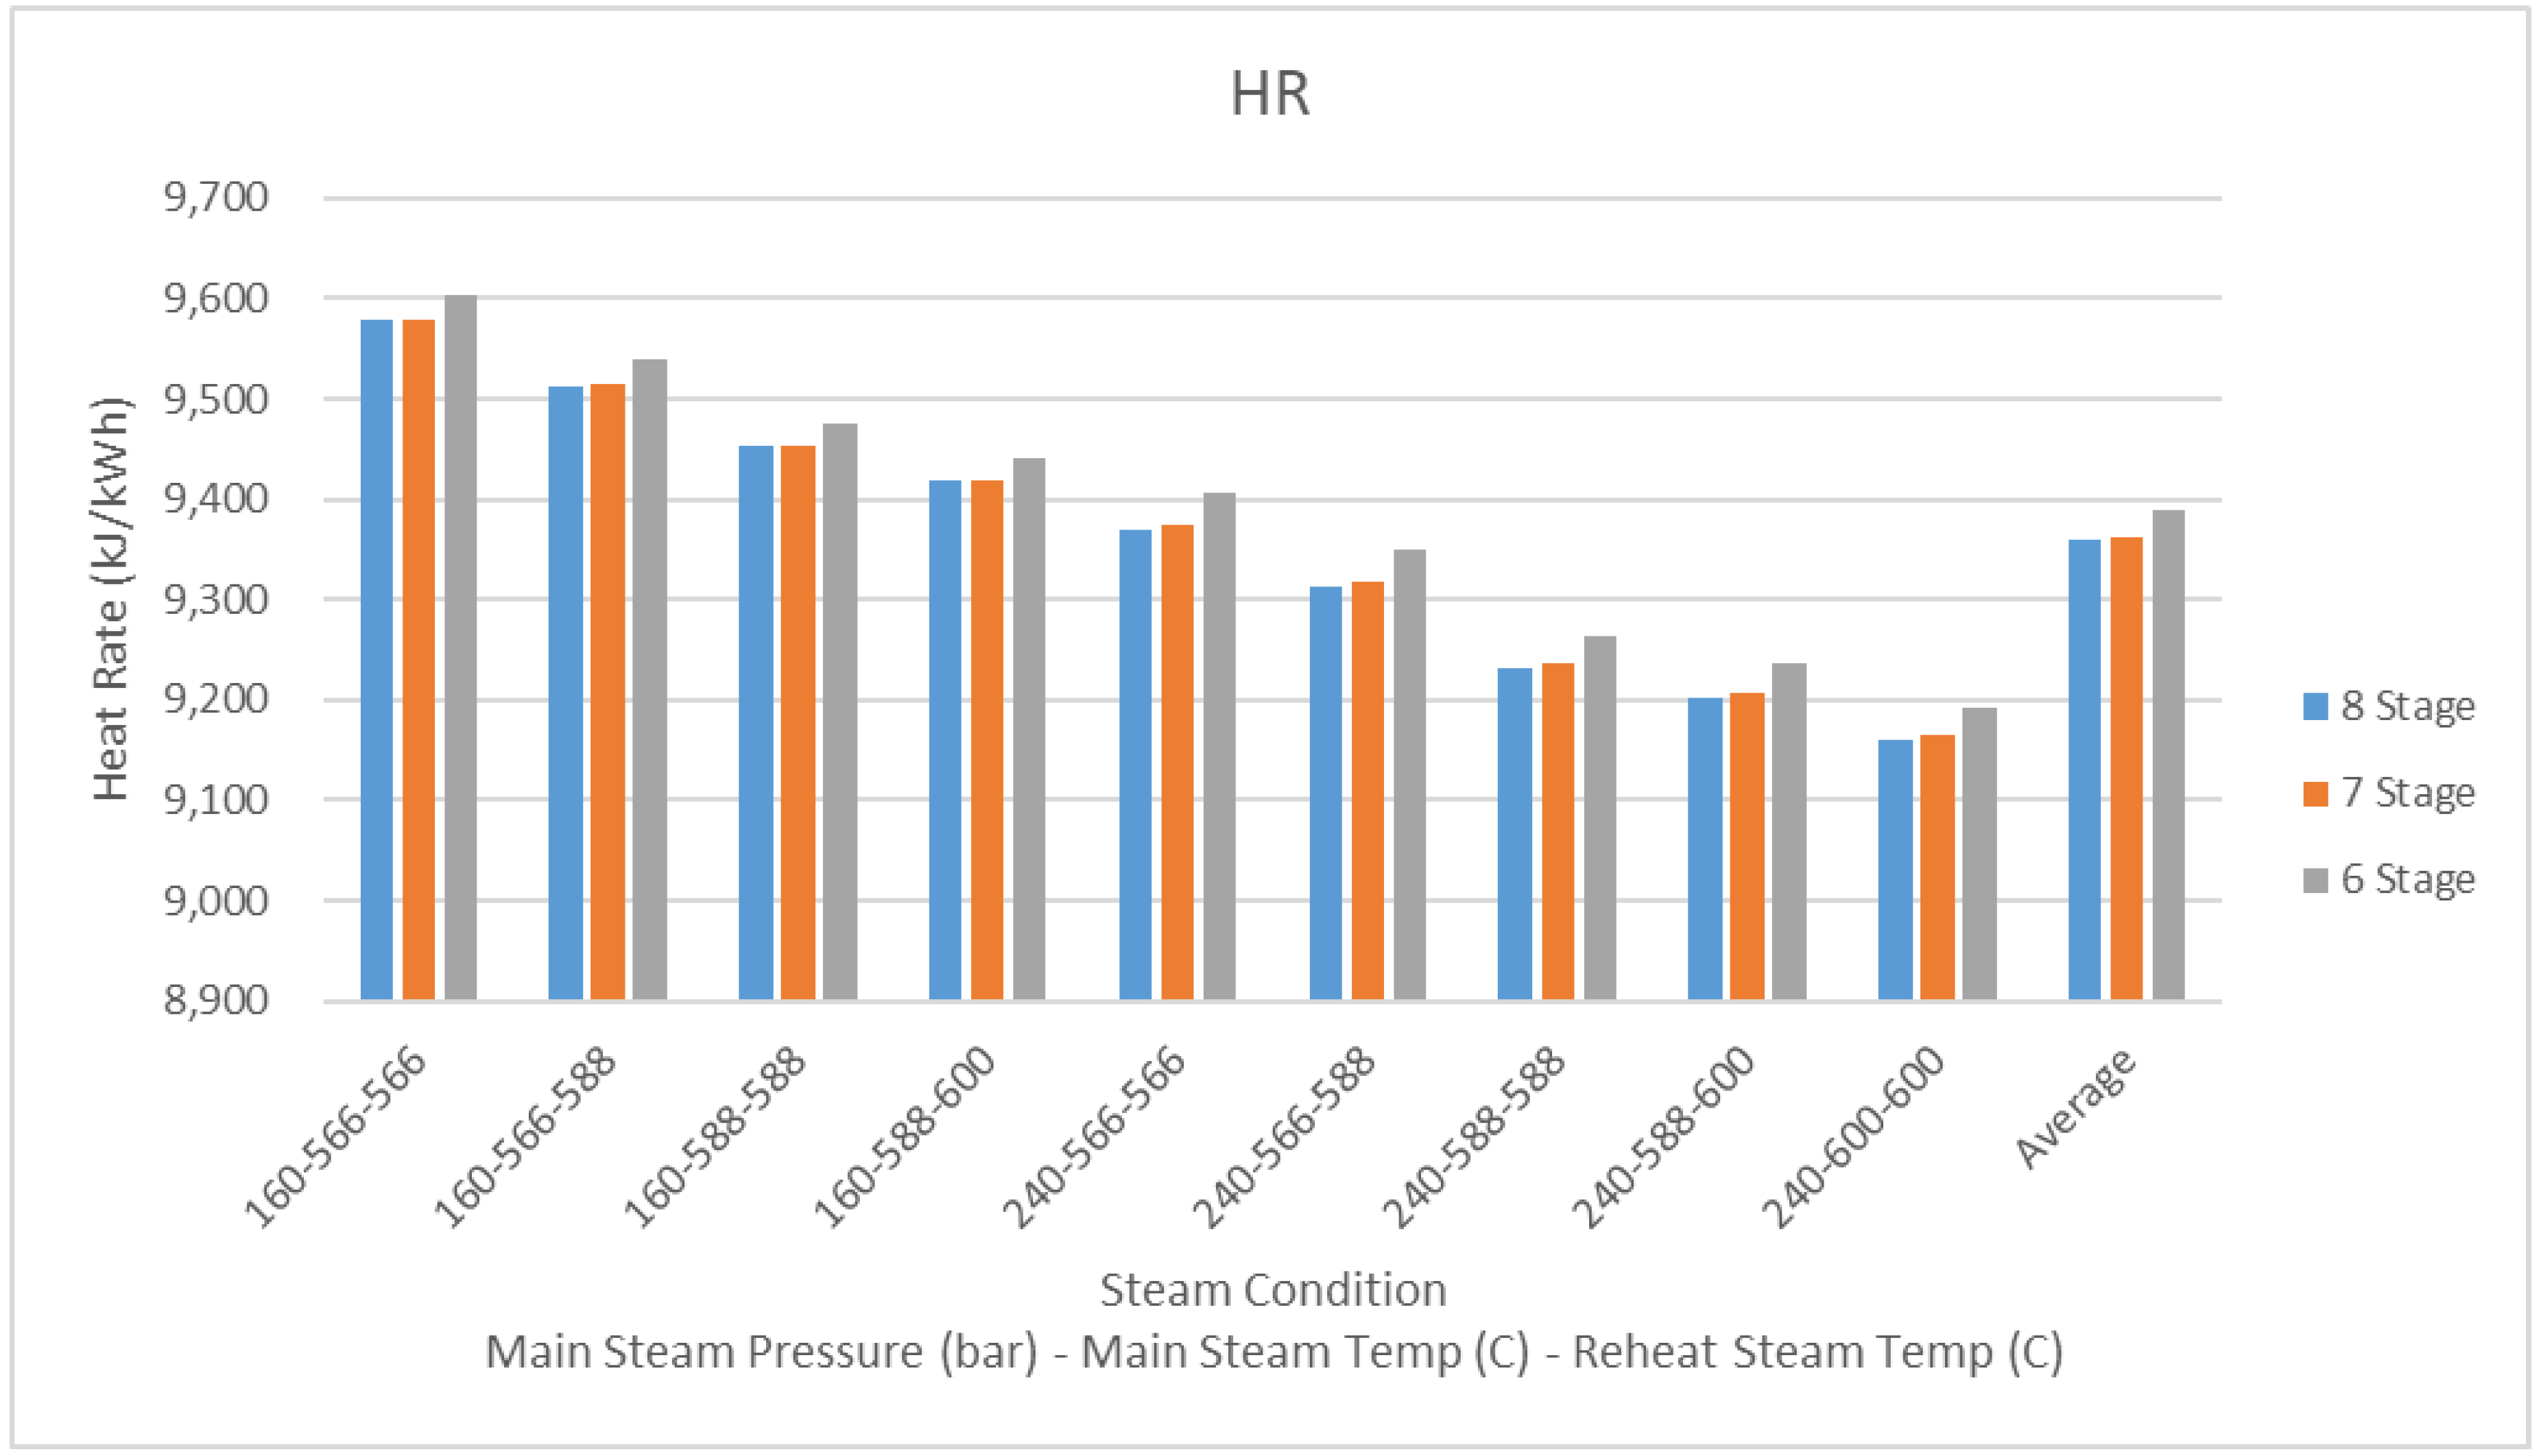
7.1. Heat Rate Trend Output
Figure 4 depicts the average heat rate (heat required per kW) outputs of the 19,440 configurations, which were separated into the steam condition and the number of feed water heaters used. As can be seen, the heat rate lowers as the main and reheat steam temperature and main steam pressure are increased, which is expected based on the Rankin Cycle and basic thermodynamics. The efficiency change is noticeable in the graph between the sixth and seventh stages of the heater configuration. Between stage 7 and stage 8, the efficiency change due to the regeneration cycle is small. As the heat-consumption rate decreases, coal consumption will decrease and expenditure will decrease. It is expected that the increase in the amount of power generation will increase the profit.
7.2. Equipment Cost Output
This paper proposes that the equipment costs are greatly affected by technical factors. The inability to account for this is the current model’s failing. Thus, an illustration of the range of effect in each equipment’s range of technical factor choices has on the CAPEX is shown below (
Figure 5). The maximum, minimum, and average impact on CAPEX of each piece of major equipment within the steam-cycle are shown. As can be seen, an equipment’s maximum impact as small as 0.04% of the CAPEX (LP heater 4) to as large as 1.498% (condenser) and 1.766% (cooling tower). Since these two pieces of equipment have the maximum impact, an investigation and discussion of their impact on project success (IRR) is shown below.
The choice of condenser design factors equated to an impact range of 0.048% on the IRR (
Table 5) and the cooling tower had an impact range of up to 0.12% on the IRR (
Table 6). As you can see, this equates to a swing of about
$2.6 M for the condenser and
$6.4 M for the cooling tower. These findings exemplify the major impact the design decisions of just one piece of equipment can have on a project’s cost/benefit analyses.
7.3. Economic Output
From the variable inputs described above, the authors conducted an economic analyses. In this section, the impact of each steam condition has on CAPEX and IRR are presented. The CAPEX was most significantly impacted by the main steam pressure. This indicates that the price to execute a supercritical (>220 bar) power generation cycle requires much more expensive equipment than a subcritical one. Furthermore, it was found that CAPEX increases as the number of stages of heater increases. This difference comes from the price of each additional feedwater heater. The difference in CAPEX between 8 stages and 7 stages was the price difference, according to the presence or absence of an LP heater, and the CAPEX difference between 7 stages and 6 stages occurred due to the price difference with the presence or absence of an HP heater.
As the steam conditions get hotter, the CAPEX decreases. This is of interest since it requires more equipment to increase the heat of the system, which should equate to a higher CAPEX instead of a lower CAPEX. This event may be caused by the fact that, when heat enters into the system, it naturally creates pressure. However, with a lower heat, the pressure is required to be added through costly design choices (ex. design choice that equates to significant maintenance).
The results from
Figure 4 (heat rate output, which should be an indicator of revenue) and
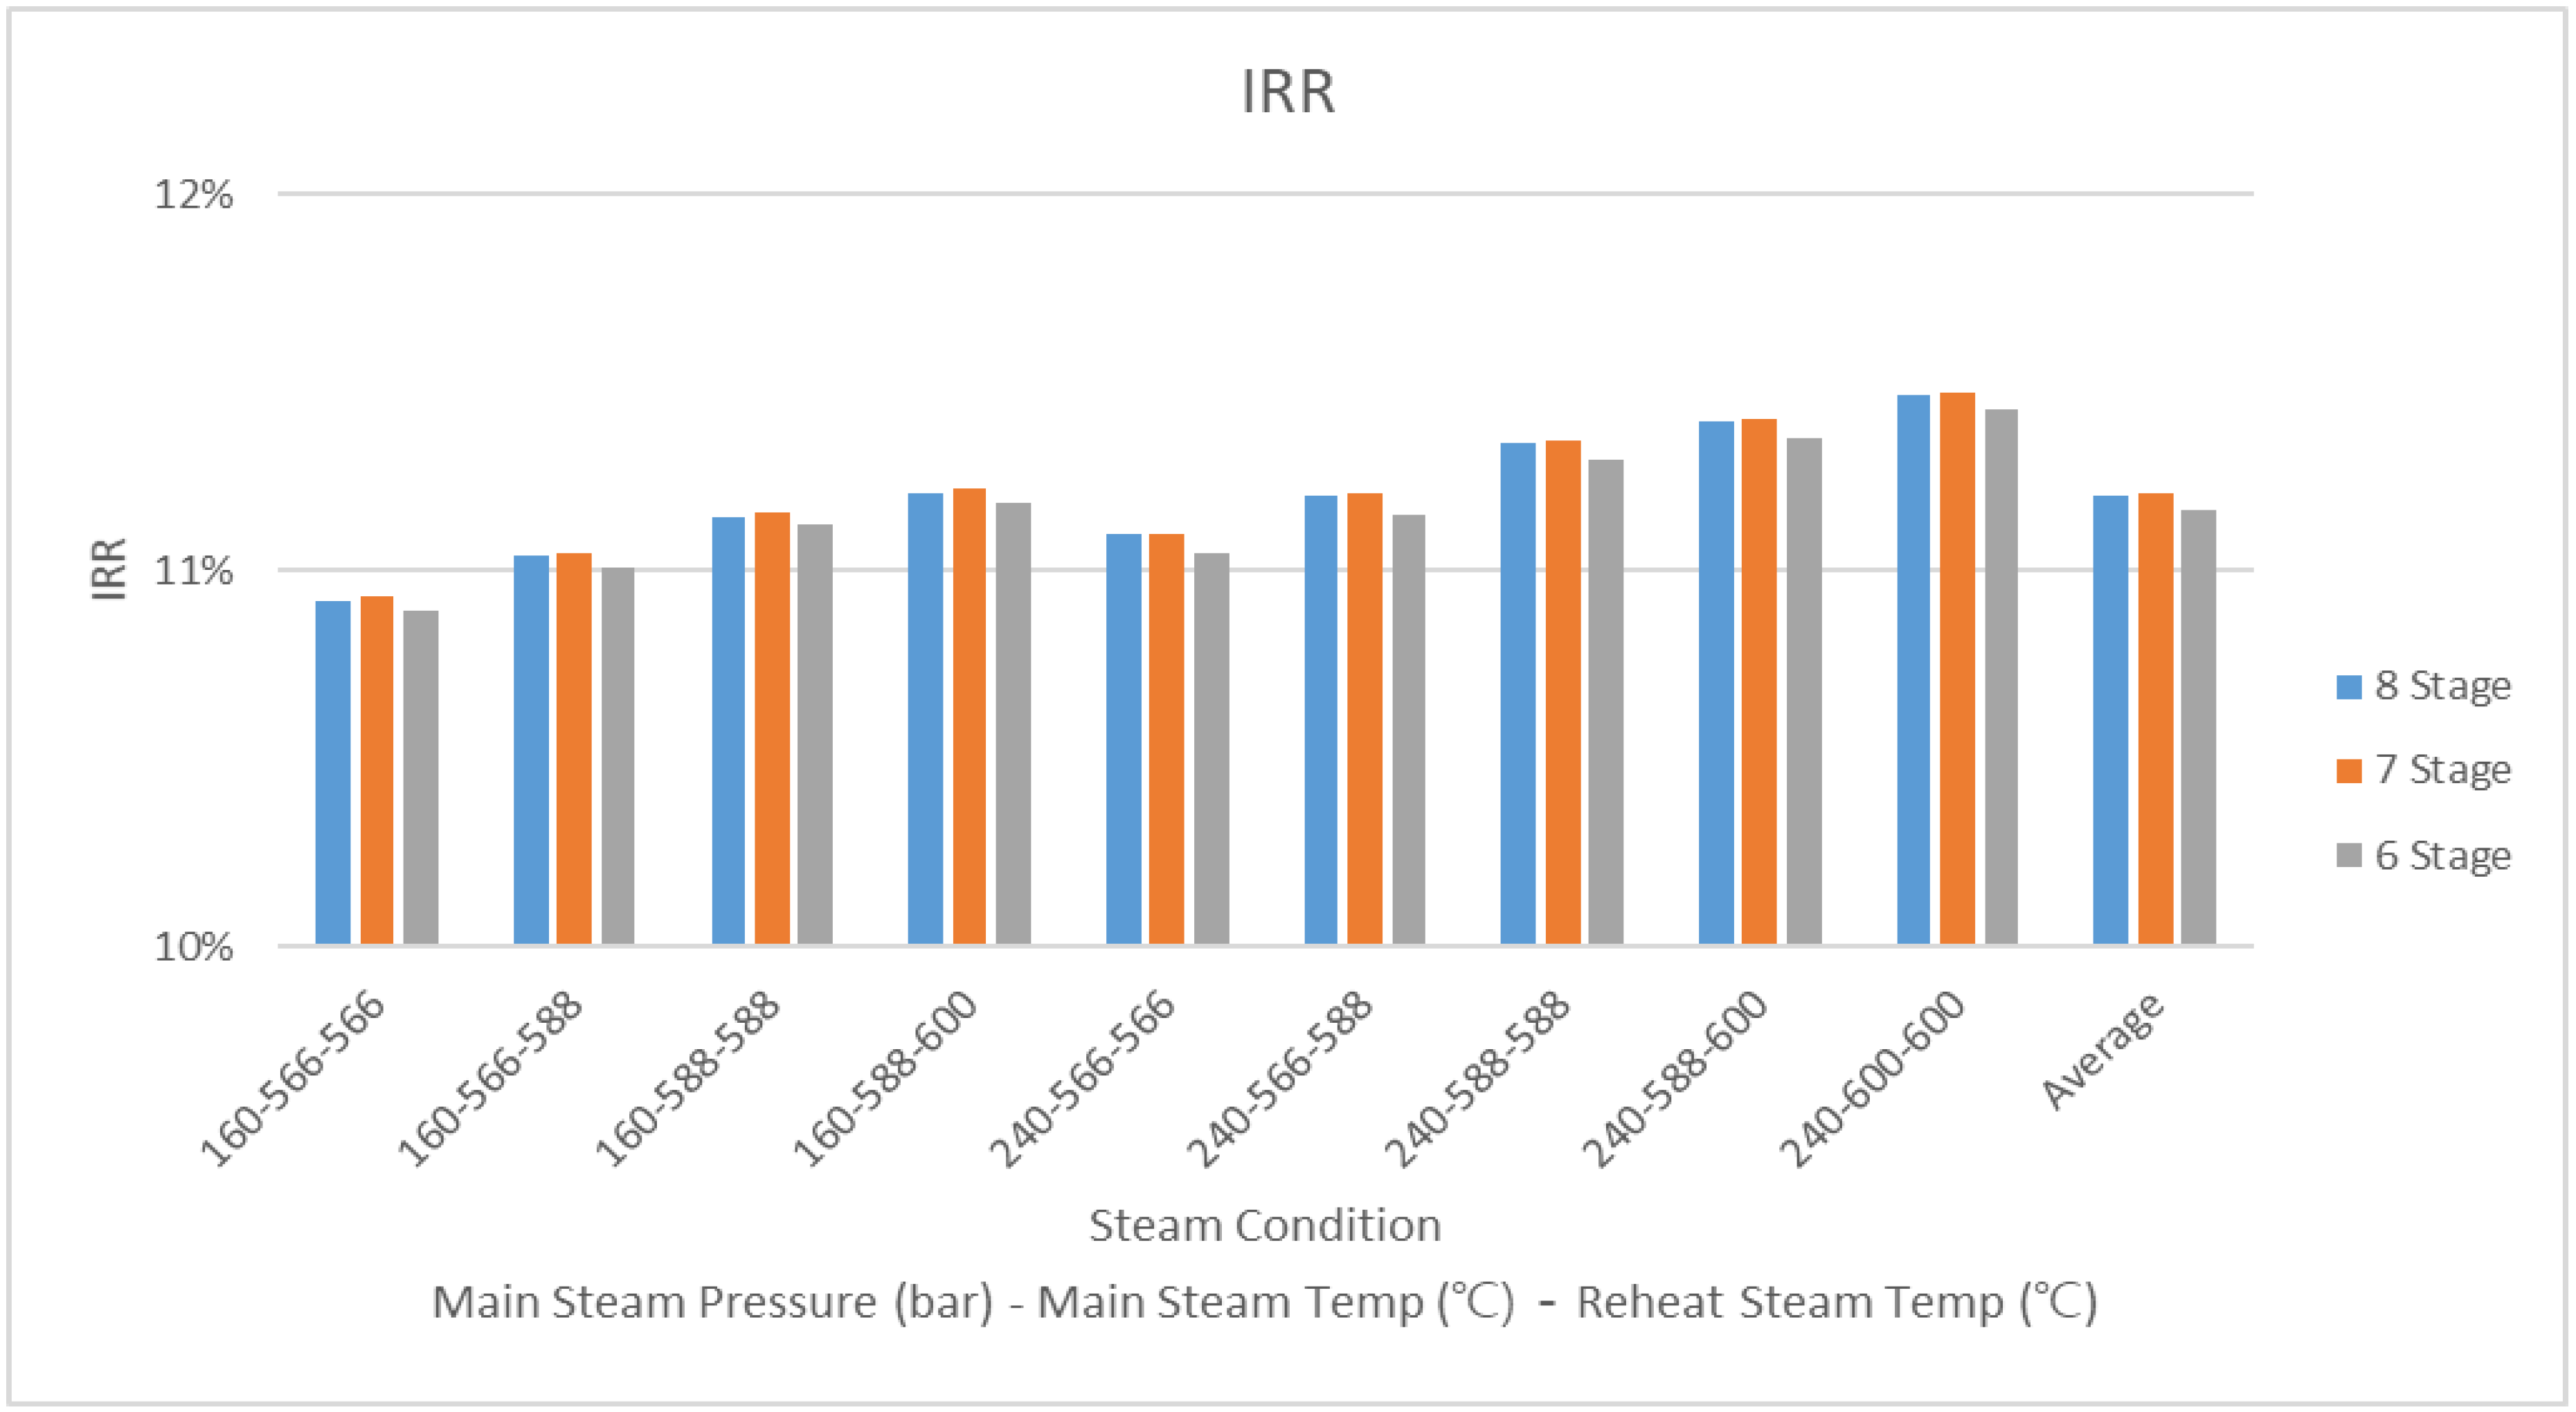
Figure 6 (CAPEX, indicator of cost) give us a possible indication of the profitability of each steam condition. However, the IRR is a much more exact and economically accepted method of presenting profitability. The steam conditions’ impact on IRR is, therefore, presented below in
Figure 7. The average IRR for each steam condition increases per reheaters in order from 7-stage, 8-stage, and 6-stage heater. From
Figure 4, showing 6-stage as the greatest earner and
Figure 6 showing the 6-stage requiring the least investment, it is seen that factors other than CAPEX and heat rate such as power capacity influence the IRR. While
Figure 7 shows, on average, the 7-stage has the greatest IRR. The case with the highest IRR among all simulations had an 8-stage heater. This is discussed in
Section 8 below.
The authors also performed an analysis on the impact the CAPEX and heat rate had on the IRR. The variable CAPEX has a range of impact (CAPEX’s maximum–minimum impact) equating to 0.02% of the IRR, which is rather negligible. On the other hand, the heat rate has a much greater effect with a range of impact equating to 0.9% of the IRR. This confirms what has been stated in literature that the heat rate has a close relationship with profitability. The relationship was studied further in
Section 9. The sensitivity analysis is shown below.
8. Optimal Case Selection
From the 19,440 simulations, an optimal project was chosen, which had the greatest IRR, the best profitability, and thus the optimal configuration of technological factors.
Table 7 depicts the configuration of Case 3856, which was the optimal configuration with an IRR of 11.683% and NPV of
$325,426,000 but is only the eighth most efficient from the perspective of the thermal efficiency. In comparison, the model with the highest thermal efficiency was equated to an NPV of
$324,141,000. From data collected from the 600 MW power plant, the chosen technical/financial optimized configuration would have saved the project sponsor (owner)
$1,284,000, present value (i.e., NPV difference of Case 3856 and Case 4016).
The NPV saving (difference) corresponds to 1.02% of the annual fuel cost for the highest IRR case (Case 3856). This value of about $1.3 M is 0.16% of the total CAPEX, which is an insignificant value. However, it is 0.42% of annual revenue and 0.67% of annual expenditure. This supports the value of including technical variations into a financial assessment, which is the unique contribution of the proposed model.
9. Sensitivity Analysis
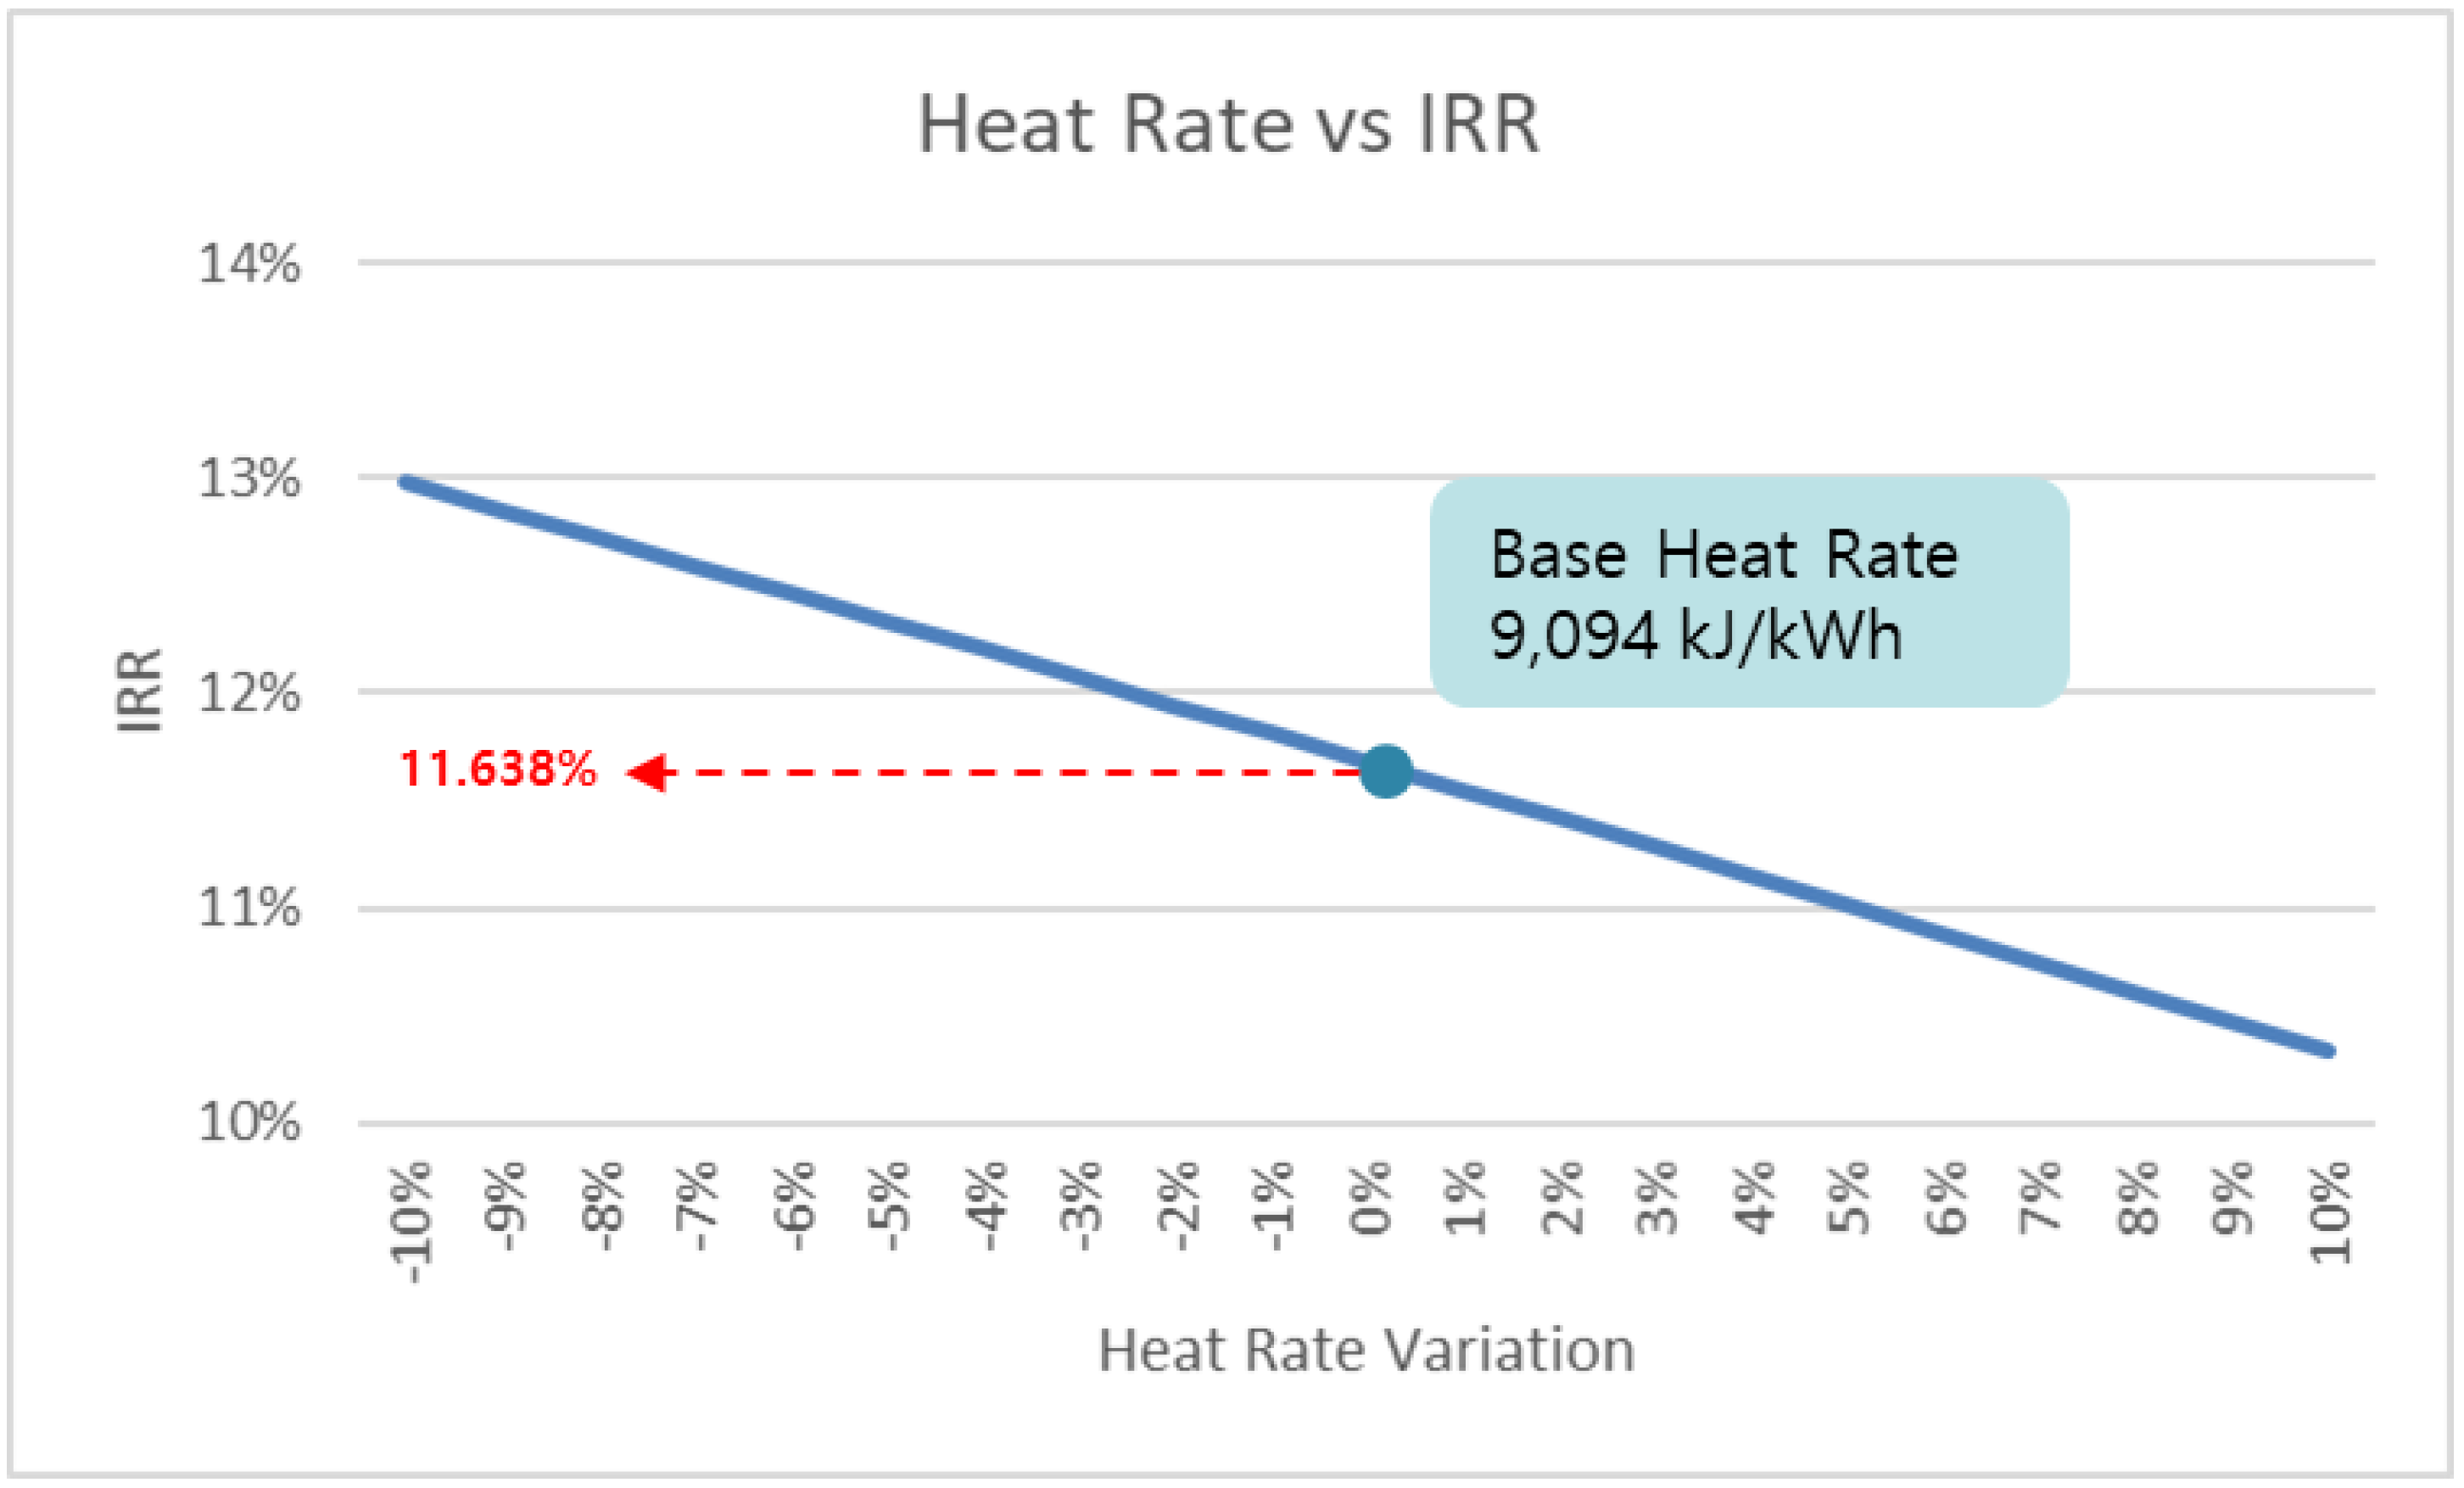
Although multiple configurations were analyzed, the costs and revenue of each configuration was fixed. This does not take into account any risks of variations in execution from the estimate. As such, a sensitivity analysis was conducted in the most profitable case to examine the change in profitability (IRR) based on variations in the heat rate.
As a result of the sensitivity analysis, if the heat rate varies between −10% and +10%, the IRR varies between 10.3% and 13.0%. The IRR sensitivity due to a heat rate change is presented in
Figure 8 below. As the heat rate changes, the project profitability was significantly affected.
A further extensive sensitivity analysis was conducted with factors that have the most significant impact on profitability, which is shown as IRR. The factors were identified as follows: (1) variance of electricity tariff rate, (2) volatility of the fuel (mainly coals) cost, (3) heat rate (duplicated from above), and (4) the change of CAPEX. Similar to the heat rate trend sensitivity above, the impacts to IRR were calculated with the change of the parameter range from −10% to +10% for the reference case (case 3856). As summarized in
Table 8 below, the result of the extensive sensitivity analysis shows the IRR variation range from a minimum of 2.514% (from the CAPEX change) to a maximum of 6.412% (from the electricity tariff change) as the maximum. Please note, the sensitivity analysis was limited to the deterministic approach versus probabilistic due to limited information available to define the input parameters’ shape (i.e., so-called probabilistic distribution, function) and a high number of simulation cases.
10. Impact of Carbon Taxes
Global warming is strengthening regulations on the environment, which equate to costs associated with producing excess carbon (carbon taxes). Many countries have signed climate change agreements to address climate change [
38]. The characteristic of the power generation industry especially coal-fired power plants is their burning of fossil fuels, which release significant quantities of carbon dioxide and affect global warming. Using the above-presented financial findings, this study presents the impacts carbon policies may have on project profitability.
To present the impacts carbon (CO2) restricting policies may have, this study presents three scenarios (Low, Base, and High) to determine profitability. The low scenario is the amount proposed by the Korean government to stabilize the market (8.0 $/ton). The base is the current price of carbon trading (18.3 $/ton). The high scenario is based on the estimated price of the IEA (International Energy Agency) emission allowance (35.8 $/ton).
Figure 9 depicts the differing steam conditions impact on CO
2 emissions. As can be seen, the higher the temperature/pressure is (the steam conditions that make the plant more efficient), the lower the CO
2 emissions are. It can be seen that, as the efficiency of generating the same capacity increases (if the heat consumption rate is lowered), the amount of coal consumption decreases and the amount of carbon emissions decreases accordingly. As a result of comparing the simulation results with the actual reference, it was found that the average of the experiment was 0.82 t/MWh and that of Mainz in Germany was 0.76 t/MWh, which includes a slight difference of 7.3% [
39].
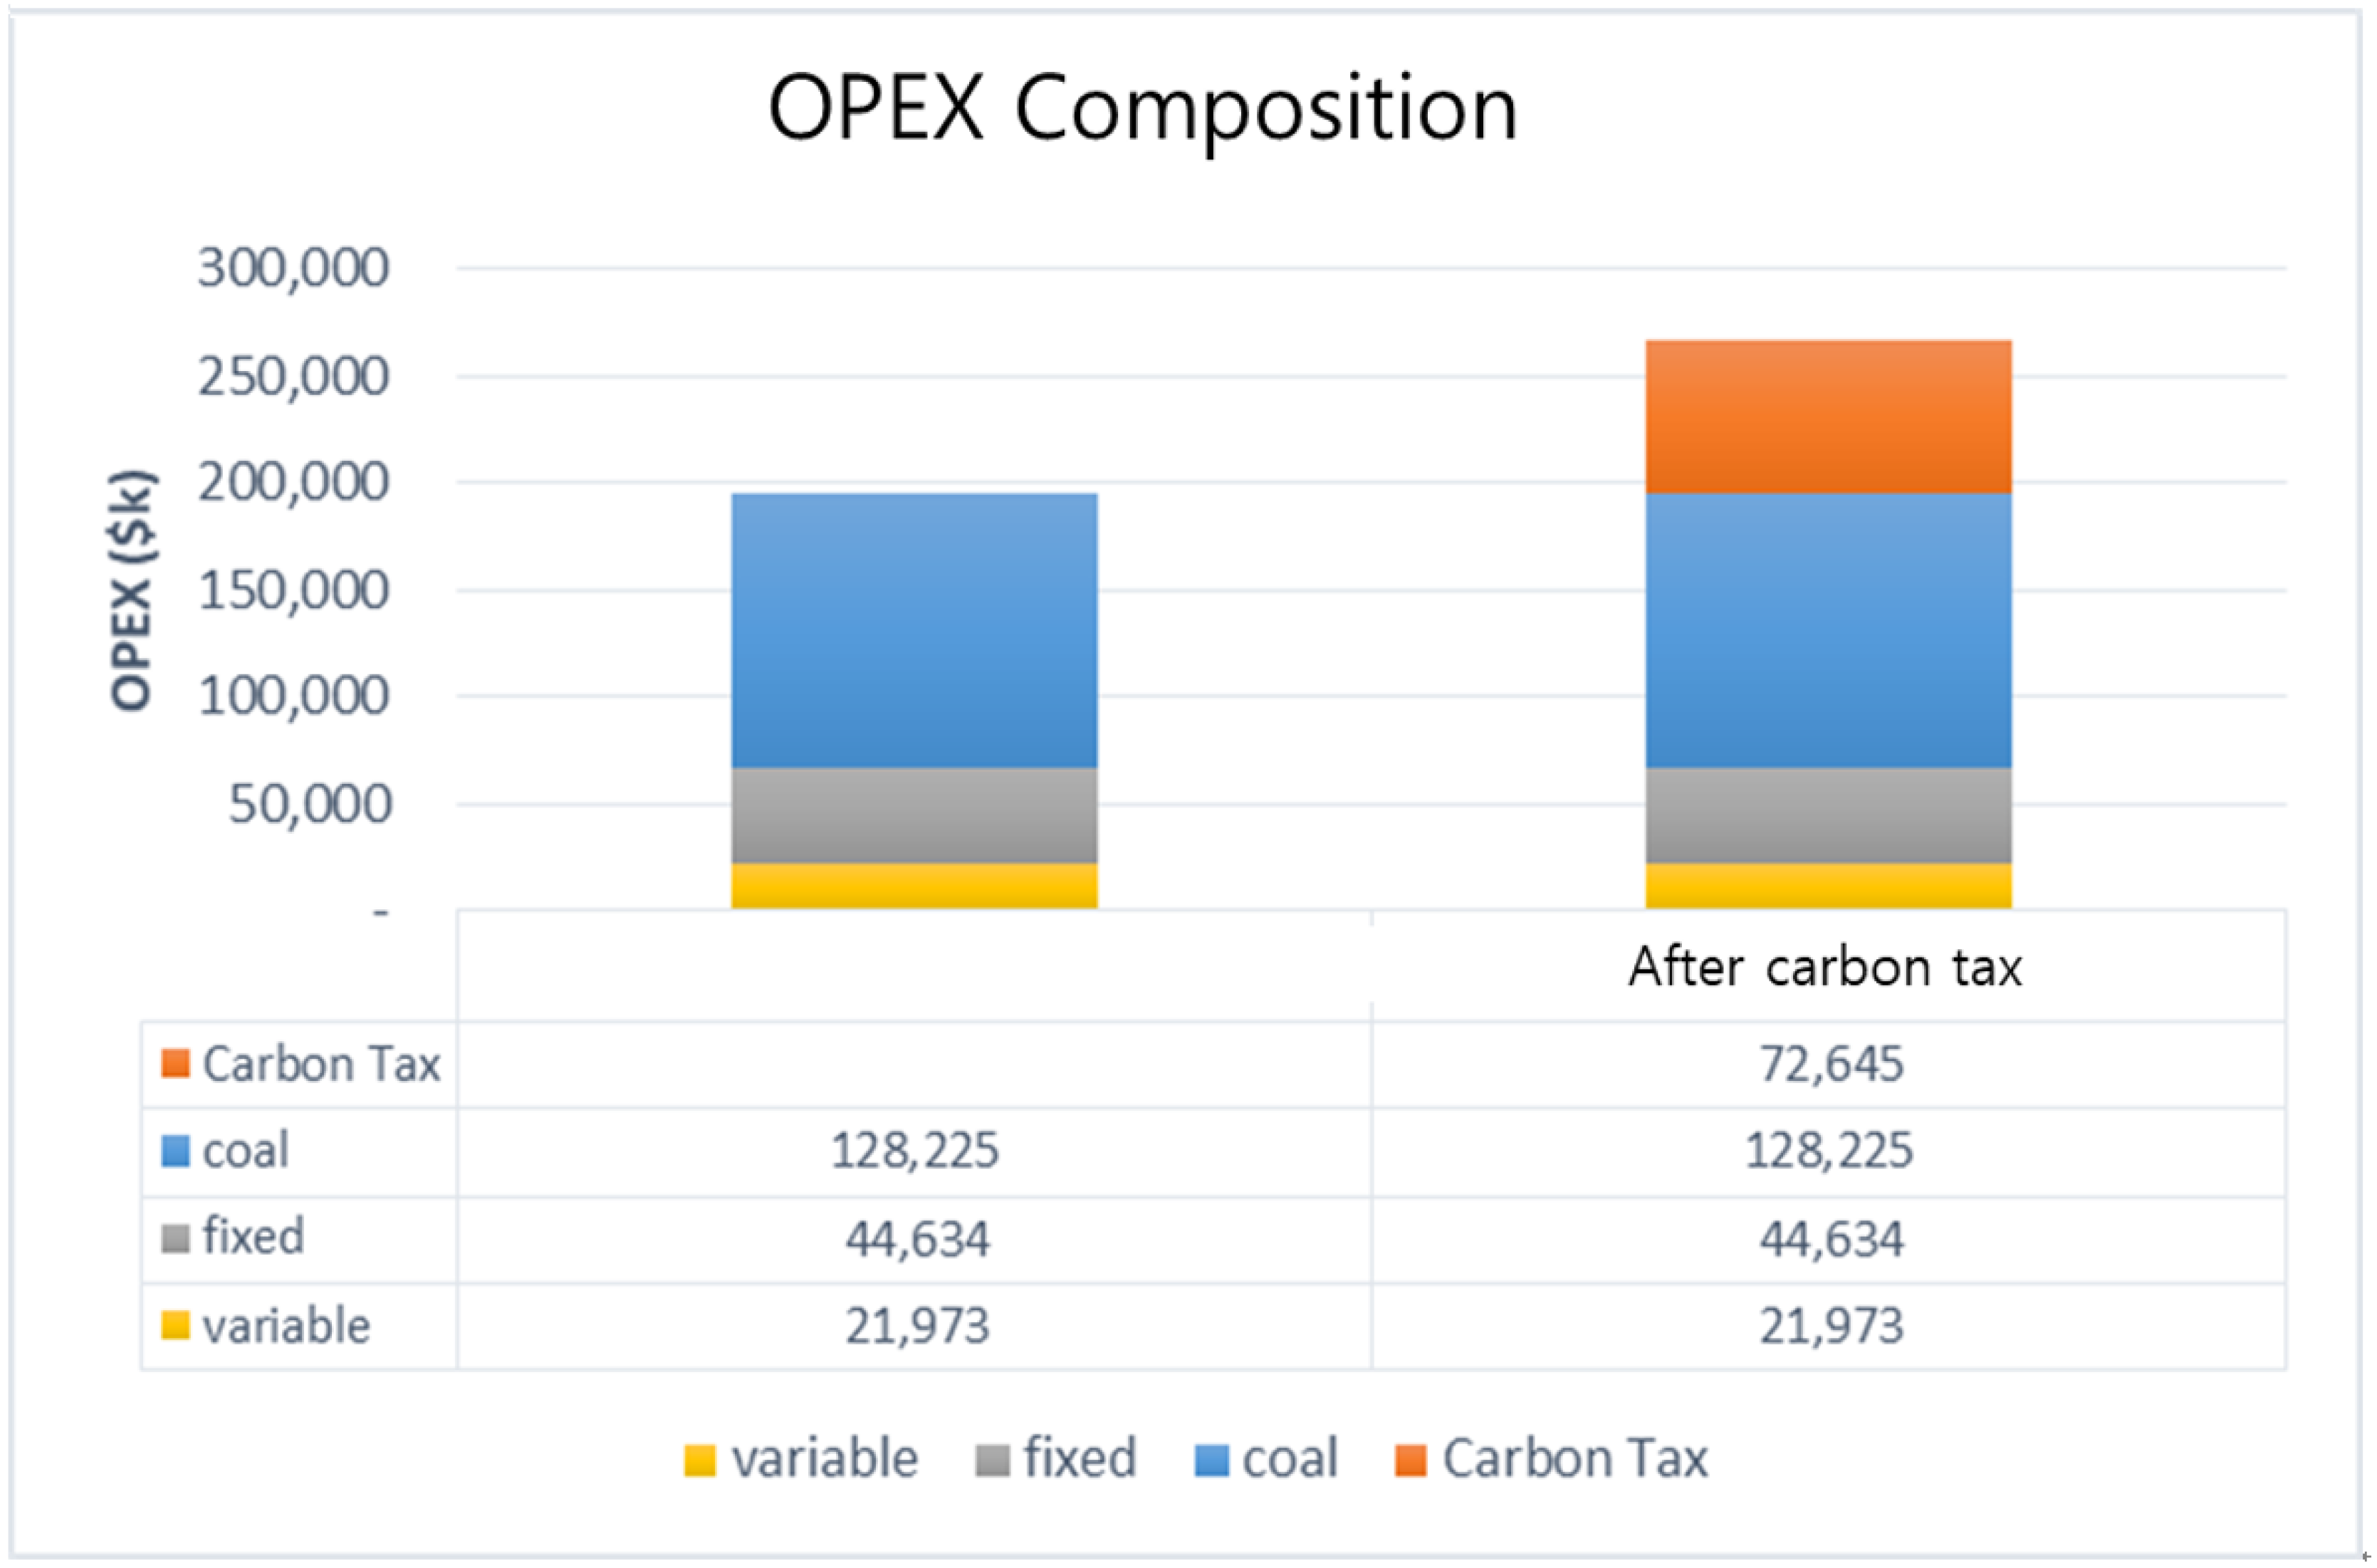
Next, the carbon tax costs were calculated in comparison to variable, fixed, and fuel costs (
Figure 10). When the base case of 18.3
$/ton was applied, CO
2 costs accounted for 27.16% of the total OPEX. In this scenario, the average IRR was 0.019%, which means that the plant would not be economically feasible given the unit price of electricity applied. When the electric sales was applied at 0.090
$/kW, the IRR was 12.488% (a difference of about 12.5% compared to
$0.070). Therefore, if the carbon tax is applied, a raise in the electricity sales unit price is required to ensure that the power plant is economically feasible.
Figure 11 shows the impact of the IRR by the CO
2 costs (assuming an electricity sales of 0.090
$/kW). It is inevitable to raise the unit price of electric power sales for the project. Since the profitability of the project is changed, according to the carbon cost, it is applied to the scenario of carbon cost to grasp the profitability of the project. IRR results of 4.3%, 12.5%, and 16.3% are meant for the low, base, and high scenarios, respectively.
It should be noted that the above presented model allows a basic discussion of CO2 costs for illustrative purposes. For proper incorporation into the decision-making process, further research and deeper policy investigation is required.
11. Conclusions
A simulation model of the steam cycle of a 600 MW coal-fired power plant was developed and a cost-analysis model that can reflect the technical factors of the simulation result was suggested. Project economic analysis was conducted using the proposed cost-analysis model and the project case with the highest profitability was selected. In the steam-cycle modeling process, the input variables were selected as factors that could affect the power plant efficiency. These factors were identified as the main and reheat steam conditions, the man and reheat steam pressure drop, the number of feed water heaters used, the condenser temperature rise, and the final feed water temperature. From all possible combinations of the technical factors, 19,440 configurations were identified.
Using these configurations, Thermoflex simulated resultant design requirements, heat rates, and power outputs. Using the technical factors from the Thermoflex simulation results, the cost of the equipment in the steam cycle was estimated. The capital expenditures (CAPEX) was constructed by collecting the equipment costs influenced by the technical factors and operational expenditures (OPEX) were constructed using operational factors and projected electricity sales. Lastly, an economic analysis was performed on 19,440 cases by estimating the internal rate of return (IRR) and net present value (NPV), which are both indicators of profitability.
From the results, the proposed model was found to equate to a $1.284 M increase in NPV versus the most thermal-efficient technical configuration. Furthermore, the condensers and cooling towers were found to be the highest cost-estimated equipment with a 1.4% and 1.7% impact on CAPEX, respectively. Their cost had an impact of up to 0.12% on the IRR. Most existing financial models are based on a fixed design model that has the greatest thermal efficiency. The above results show that you can have the best profit in other situations not only and not always when maximum thermal efficiency is achieved. Multiple variables that could affect the outcome were not considered in this study. However, in isolating only the steam-cycle design configuration, this study found differences between the existing practice and the proposed model.
Although the findings are of value to academia and industry alike, there were limitations to this study. First, the boiler was excluded from the simulation modeling range of the steam cycle. The technical factors of the boiler per the case study were applied collectively to each case. If additional studies are performed on the boiler, more accurate results will be obtained by considering more variables in modeling. Second, the model subject to cost estimation excluded the main equipment (turbine, boiler) in the steam cycle. In power-generation projects, the price of the main equipment is a large proportion and there are many additional facilities in addition to the steam cycle. By considering these facilities, CAPEX will be more accurate. Moreover, if the reference value of the cost estimation is used for many project values that were actually executed, a more accurate CAPEX value will be obtained. The financial assumption will also be more accurate if the actual value is used. Additionally, the parametric estimation method used in this paper can shorten the time to obtain the equipment cost, but it cannot be adjusted very precisely. There may be several errors and the sum of these errors can affect the result. In addition, there are many variables that can affect profitability in the financial model so more time will be required to make the investment cost more accurate.
In the case of mega projects, there is a growing need for capital from other stakeholders not just at the time of the project with only the sponsor’s capital. In the early stages of an investment project, decisions about progress are important and the methods proposed in this paper will help make these decisions.


