Article

Modelling, Parameter Identification, and Experimental Validation of a Lead Acid Battery Bank Using Evolutionary Algorithms

1
Grupo de Investigación en Sistemas Inteligentes, Corporación Universitaria Comfacauca, Popayán CP 190003, Colombia
2
Instituto de Automática e Informática Industrial-ai2, Universitat Politècnica de València, CP 46022 Valencia, Spain
3
Instituto Universitario de Ingeniería Energética—IUIIE, Universitat Politècnica de València, CP 46022 Valencia, Spain
*
Authors to whom correspondence should be addressed.
Energies 2018, 11(9), 2361; https://doi.org/10.3390/en11092361
Submission received: 17 August 2018 / Revised: 5 September 2018 / Accepted: 6 September 2018 / Published: 7 September 2018

Abstract

:
Accurate and efficient battery modeling is essential to maximize the performance of isolated energy systems and to extend battery lifetime. This paper proposes a battery model that represents the charging and discharging process of a lead-acid battery bank. This model is validated over real measures taken from a battery bank installed in a research center placed at “El Chocó”, Colombia. In order to fit the model, three optimization algorithms (particle swarm optimization, cuckoo search, and particle swarm optimization + perturbation) are implemented and compared, the last one being a new proposal. This research shows that the identified model is able to estimate real battery features, such as state of charge (SOC) and charging/discharging voltage. The comparison between simulations and real measures shows that the model is able to absorb reading problems, signal delays, and scaling errors. The approach we present can be implemented in other types of batteries, especially those used in stand-alone systems.

1. Introduction

Renewable and distributed energy generation are trendy research topics that have to go hand-in-hand with energy storage research. Therefore, researchers from many areas are developing the topic from different technologies [1]: hydrogen-based, flow batteries, supercapacitors [2,3], pumped hydro, superconducting magnetic energy, compressed air, flywheels, and batteries. Among them, the most often used devices are batteries due to their cost, portability, and replacement facility [4,5,6,7,8]. Batteries are used as power sources for electric vehicles (EV), communication systems, electrical and electronic devices, renewable energy systems (RES), etc. In RES, such as stand-alone photovoltaic and wind power, the battery type commonly used is the lead acid battery due to their maturity and low cost [9]. These batteries are composed of two-volt elements that connect in series and they provide a configurable voltage (12 V, 24 V, 48 V, etc.). However, lead acid batteries have a high impact on the lifetime costs of stand-alone power-supply systems [9]. Some studies [10,11] reveal that batteries may account for up to 40% of the overall system cost over its lifetime.
Accurate and efficient battery modeling is essential to maximize the performance of a system and its battery lifetime. However, due to its non-linear nature [12] the battery charging and discharging process is too complex to be accurately modeled. Moreover, many aging phenomena take place inside the battery during its life cycle, such as corrosion, gassing effect, self-discharging, diffusion processes, etc. [13]. Different models have been developed and implemented to capture the battery performance for various purposes [14,15,16,17,18]. In order to effectively fit a specific mathematical model to a real system, highly accurate modeling [19] and parameter tuning is required. Since system function depends on a high number of variable factors, such as environmental variables, life cycle, or type of facility, among others, some method has to be applied to tune the model parameters.
Different methods have been proposed in the literature to identify the battery parameters [20,21,22,23,24,25,26]. Among them, evolutionary algorithms (EA) have shown great performance. EA is a stochastic search technique usually used for learning and optimization [27]. EA defines strategies to generate possible solutions to test. Each solution (an individual) is a set of variables (called chromosomes) that can be grouped in a larger set called the population. EAs have wide applications in bioinformatics, engineering, physics, computational science, mathematics, and other related fields [28,29,30,31,32].
Regarding the optimization of hybrid energy systems with battery, particle swarm optimization (PSO) is considered as one of the most used EAs due to its good performance, flexibility, and simplicity [33]. Previous studies show the use of PSO for the electrochemical model parameter identification of a li-ion batteries for automotive applications [34,35,36,37,38]. Regarding RES, the application of EA for parameter identification of lead acid batteries is scarce. Guasch et al. [39] used the battery model proposed by [40] and they added two extra parameters: the level of energy and the state of health. These new parameters are able to predict the degradation of the battery capacity and the increase of self-discharge current in the long-term. In order to fit the model, they applied a Levenberg-Marquardt algorithm to achieve a mean voltage error around 1%. In addition to the 21 parameters identified in [40], Blaifi et al. [41,42,43] propose the addition of four parameters for the estimation of the gassing and the saturation levels. Simulation results show that the mean error with parameters given by [40] was 1.49%, while the mean error with EA identification was 0.45%. However, one disadvantage of the model is the high calculation time due to the large number of samples required for a good identification.
Another interesting EA that can be used in parameter identification is cuckoo search (CS) [44,45]. In this EA, the random walk is generated via Lévy flights as the search strategy. CS is considered as a modern meta-heuristic algorithm able to solve complex optimization problems with high accuracy [46,47,48].
This paper explores the use of EA to fit a battery mathematical model in order to represent the real function in a research center. This research uses an extended version of the model developed by [40] because of its ability to cope with a wide range of lead acid batteries. The extension we propose includes four extra parameters, which allow a better adjustment of the curves of charging/discharging voltage of the lead-acid battery. Additionally, three EA (PSO, PSO + Perturbation, and CS) are implemented and compared to identify the parameters of a lead-acid OPzS battery bank. The PSO + Perturbation EA is a new proposal for parameter identification. Equivalent circuit models and EAs are simulated under LabVIEW® (V2011, National Instruments, Austin, TX, USA). The simulation results are validated with experimental data obtained from the research center Centro de Investigación en Energías Renovables del Departamento del Chocó (Colombia)—CIERCHOCÓ [49].
Figure 1 shows the building integrated photovoltaic system (BIPVS) scheme of CIERCHOCÓ. The system is able to operate in grid-connected mode or in island mode; the solar generator is composed of 80 polycrystalline silicon modules (Amerisolar ASP-6P30; 250 W, Worldwide Energy and Manufacturing USA Co., Ltd., San Francisco, CA, USA). Solar panels are connected to a SMA multicluster box (220 V, 60 Hz) through a 20 kW DC/AC inverter and six SMA Sunny Island AC/DC chargers-inverters (SMA Solar Technology AG, Kassel, Germany). Moreover, a data acquisition system stores data with a sampling time of 15 min. The battery energy storage system (BESS) is composed of 48 TECHNO SUN 2V-OPzS-TCH2765 electrochemical accumulators (Techno Sun, Valencia, Spain) divided into two branches of 24 cells connected in series, ref. [49] presenting a complete system description.
This paper is organized as follows: Section 2 presents the battery model, the parameters proposed by Copetti and the addition of four new parameters to the model. Section 3 describes the EAs and their implementation. The results obtained are presented in Section 4. Finally, the conclusions are presented in Section 5.

2. Battery Model Test

The Copetti model [40,50,51] describes four operation modes for the battery system: a charging zone, a discharging zone, an overcharging zone and an intermediate zone representing a soft transition between charging/discharging modes [52]. Figure 2 illustrate the model proposed by [39]. A voltage source (Voc) represents the open circuit between battery terminals. The value of Voc depends on the battery state of charge (SOC). SOC can be defined as the relationship between the amount of available energy and the capacity of the battery. It is an indicator of the electrical charge stored in the battery. The other main element in the model is a resistor (Ri) that represents the resistance to energy flow. This resistance depends on the current (Ibat) and on the temperature (T).
According to Figure 2, Vbat is computed with Equation (1):
  V b a t = V o c   ±   I b a t R i  
where Ibat is the current circulating through the battery. Ibat < 0 when charging, and Ibat > 0 when discharging.
The discharge voltage is simulated through Equation (2), while the charge voltage is simulated with Equation (3):
V d c ( t ) = n s [ V b o d c K b o d c ( 1   S O C ( t ) ) ] n s | I b a t ( t ) | C 120 k c 120 d c ( P 1 d c 1 + | I b a t ( t ) | P 2 d c + P 3 d c S O C ( t ) P 4 d c + P 5 d c ) · ( 1 α r d c Δ T ( t ) )  
  V c ( t ) = n s ( V b o c + K b o c S O C ( t ) ) + n s I b a t ( t ) C 120 k c 120 c ( P 1 c 1 + I b a t ( t ) P 2 c + P 3 c ( 1 S O C ( t ) ) P 4 c + P 5 c ) · ( 1 α r c Δ T ( t ) )  
where ns is the electrochemical accumulator’s number, and ΔT is the temperature variation expressed as: Δ T = T T r e f
where the reference temperature (Tref) is 25 °C.
The terms P1dc, P2dc, P3dc, P4dc, and P5dc are losses associated with the internal resistance and depend on the duty point [39]. The terms P1c, P2c, P3c, P4c, and P5c are charge parameters. The terms Vbodc is the remaining voltage when the battery is discharged, Kbodc and Kboc relate the battery Voc with its SOC in the discharge and charge cycles, respectively. Kc120c and Kc120dc are gains associated with battery capacity. αrdc and αrc provides the relationship with temperature [39].
SOC is understood as the fraction or percentage of the capacity still available in the battery and it is estimated with Equation (4). SOCo corresponds to the battery initial SOC and Cbat is the battery capacity in Ah:
  S O C   ( t ) = S O C o 0 t I b a t ( t ) C b a t d t  
where 0 S O C   ( t ) 1 . Equation (5) discrete implementation is:
  S O C   ( k + 1 ) = k s o c · [   k I · Δ t ( I ( k + 1 ) I ( k ) 2 + I ( k ) ) · 1 · k c _ b a t C b a t ]  
where ksoc is an overall gain of SOC, kI is related to coulomb efficiency, Δt is the sampling period, and kc_bat is an associated parameter to battery aging. Equation (5) includes new parameters (kc120, ksoc, kI, kc_bat) in order to find a better fit. They have an initial value of 1 to maintain the original model performance.
Table 1 compares the parameters identified by [40] with the values published by [39] and [41,42,43] showing a high dispersion between the different authors.
The model is able to choose the discharging equation when the input signal has a positive sign (+A); otherwise, the model chooses the charging equation when the current sign is negative (−A). Current and temperature are taken as input signals.
Figure 3 shows a comparison between the experimental system performance and the battery model using the parameter sets in Table 1. It can be seen that most of the parameter sets follow the system dynamics, but they need to be fit in order to adjust the real system performance.

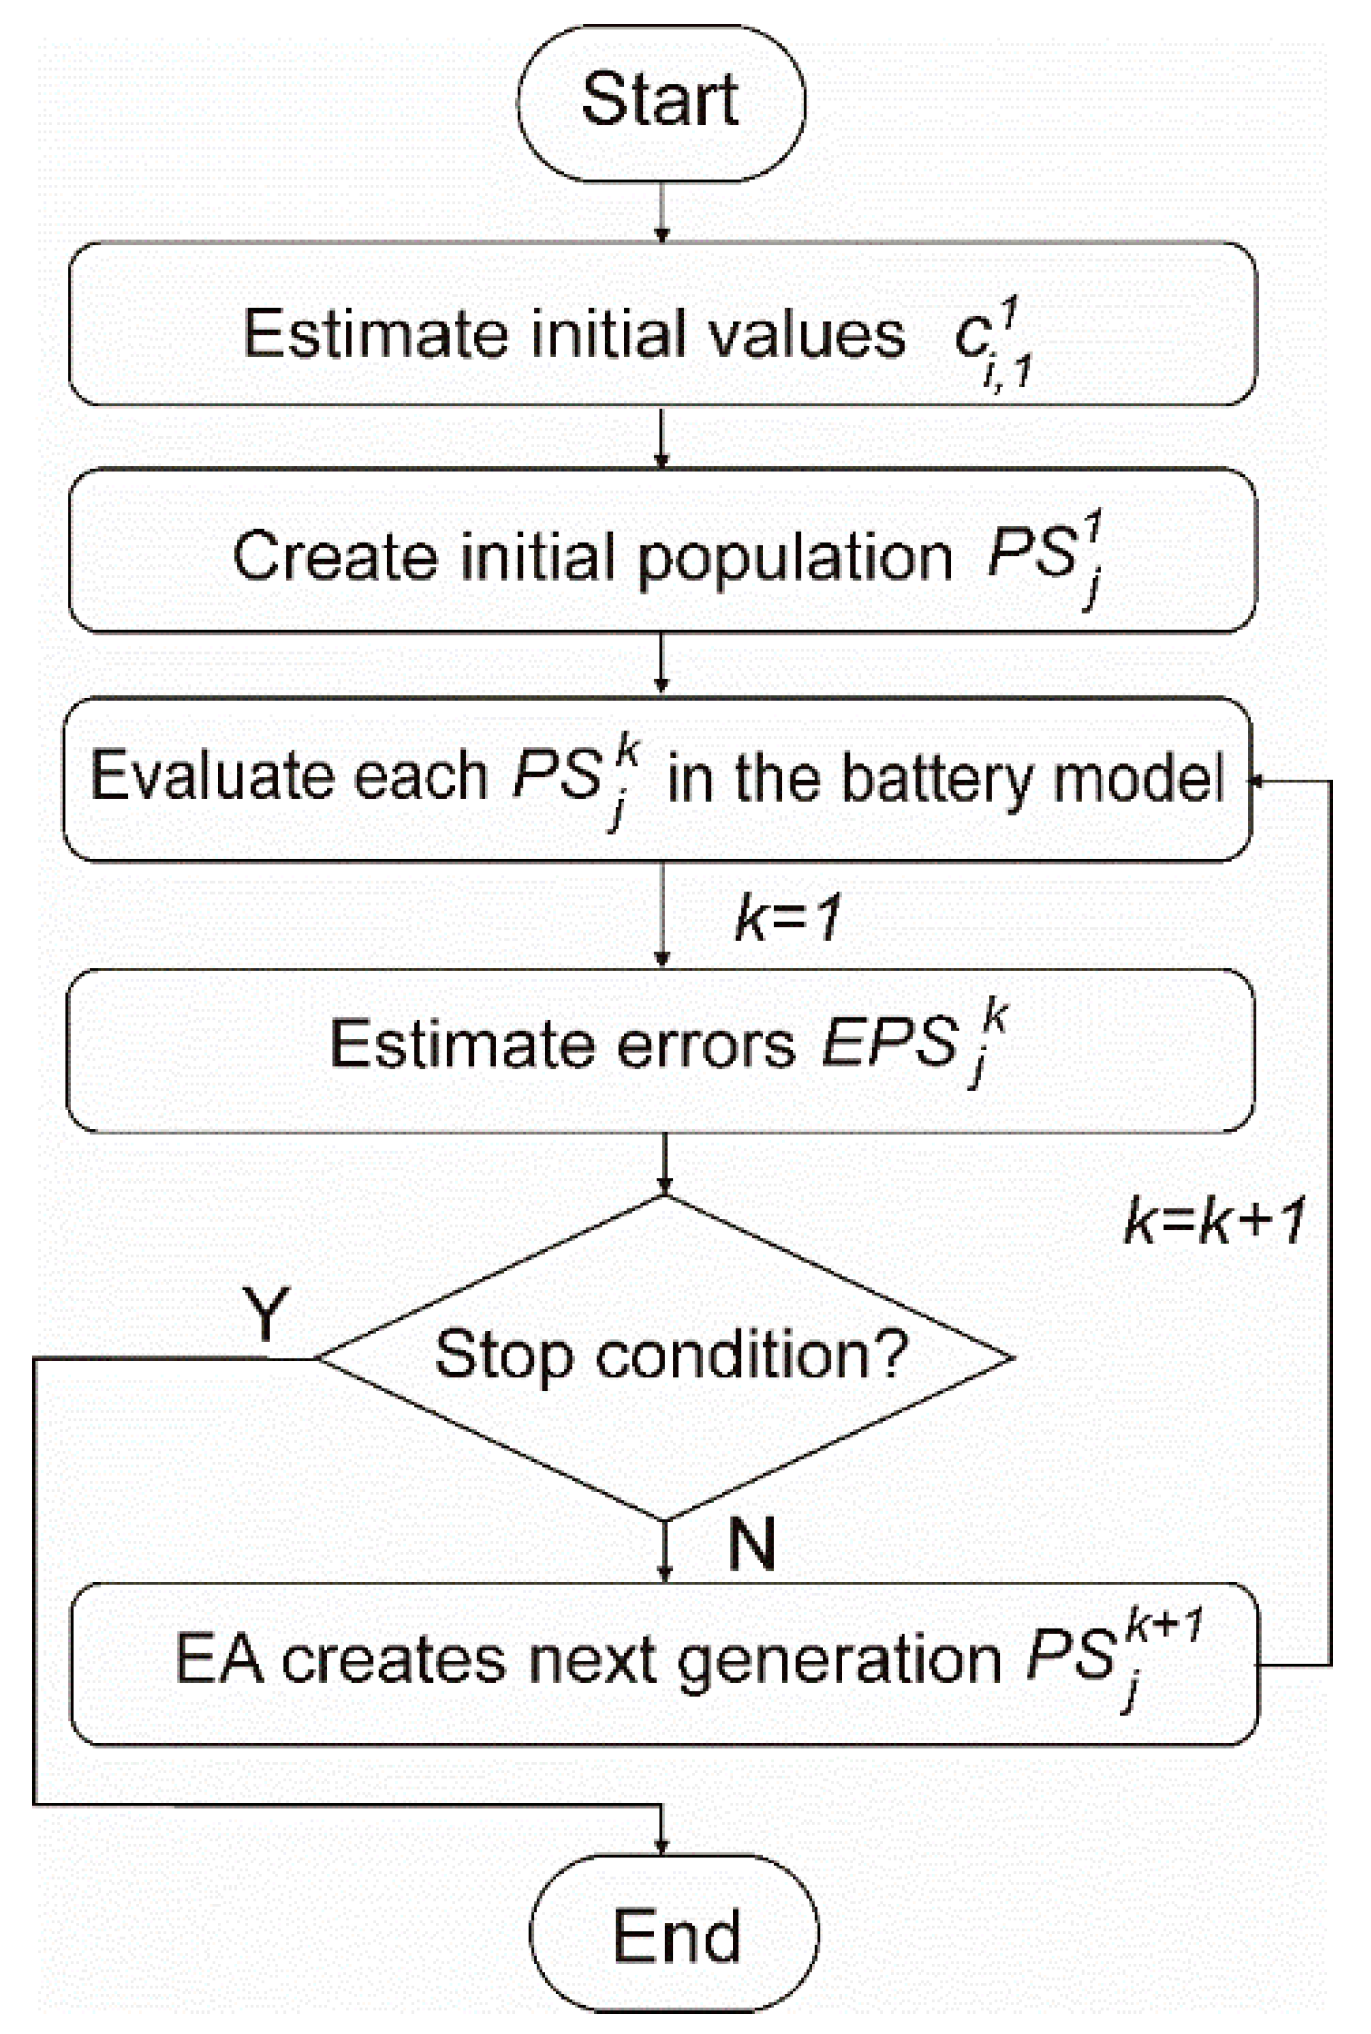
3. Parameter Identification

Due to the nonlinearity and complexity of the battery model, this proposal uses EA to find one possible optimal solution that belongs to a Pareto’s front. Parameter identification was carried out in the same conditions with different EA in order to compare the algorithms. The general identification process for all EA is shown in Figure 4, which starts with the estimation of initial coefficient values that are grouped in a parameter set (PS), in the second step, the initial PS is used to create a random population of size j. In the third step, each single PS is evaluated into the model using inputs signals taken from a real system. In the fourth step, the simulated outputs are compared with real outputs to estimate the PS error. Next, if the stop condition is fulfilled the process ends, otherwise, the EA creates a new population using specific criteria and back to the fourth step for a second iteration. The stop condition could be a defined iteration number or obtain an error lower than a defined threshold.
The model describes both charging and discharging processes with different equations. The input current signal may change from a positive sign (discharge) to a negative sign (charge) several times in the same simulation, then the identification a PS that represents the real BESS with accuracy requires the identification of one PS for each working mode. Therefore, a particular PS in the battery model consists of:
P S = | I ( A ) < 0 ; P S = { V b o c , K b o c , P 1 c , P 2 c , P 3 c , P 4 c , P 5 c , α r c , k c 120 c , k s o c c , k I c , k c _ b a t c } I ( A ) 0 ; P S = { V b o d c , K b o d c , P 1 d c , P 2 d c , P 3 d c , P 4 d c , P 5 d c , α r d c , k c 120 d c , k s o c d c , k I d c , k c _ b a t d c } |  
A general PS is defined as:
P S j k = { c 1 , j k , c 2 , j k , c 3 , j k , c i , j k , }  
where cki,j represents any parameter of the PS; e.g., c 1 , 2 8 is the value of first parameter (Vbo) in the second parameter set of the eighth population PS28. This parameter involve both Vboc and Vbodc.
In the first step, the initial values coefficients were taken from literature (Table 1). In the second step, the initial population (k = 1) of size j is an array of PS that is creates following the rules below:
P S j 1 = | j = 1 ; c i , 1 1 = c i , 1 1 j 1 ; c i , j 1 = ( c i , j 1 z v d ) + c i , j 1 |  
j = 1 ensures that the first population keeps the initial coefficients. For j ≥ 1, the coefficient values change in a random way, where z represents a random number (z ∈ [1, 1]) and vd is a value which generates a possible dispersion of the parameters ci,j1 in the initial population such that ci,j1 ∈ [−vd*ci,j1, vd*ci,j1].
In the third step, each PSj1 is evaluated in battery model, and for the next step, different error EPSj1 is calculated for charging/discharging operation mode for system signals, battery voltage, and battery SOC, and the battery voltage error EVPSj1 is calculated as:
E V P S j k = ( E V c + E V d c ) / 2  
where EVc and EVdc are the battery voltage error (charging/discharging). The mean errors are calculated as:
E V c   = 1 l c ( i = 1 l c | V c m V c s | V c m )   and   E V d c   =   1 l d c ( i = 1 l d c | V d c m V d c s | V d c m )  
where Vm and Vs are the measured and simulated battery voltage, respectively, and lc and ldc are the total number of data input files that belong to the charge mode and to the discharge, mode respectively. In a similar way, the battery SOC error ESOCPSj1 is calculated as:
E S O C P S j k = ( E S O C c + E S O C d c ) / 2  
where ESOCc and ESOCdc are the battery voltage error (charging/discharging). The mean errors are calculated as:
E S O C c   = 1 l c ( i = 1 l c | S O C c m S O C c s | S O C c m )   and   E S O C d c   =   1 l d c ( i = 1 l d c | S O C d c m S O C d c s | S O C d c m )  
where SOCm and SOCs are the measured and simulated battery SOC, respectively, and lc and ldc are the input data quantity in the file that belong to charge mode and to discharge mode respectively.
The goal is to minimize both errors so the model will be able to follow the SOC and the voltage. The optimization process ends when a stop condition is met. If the stop condition is not fulfilled, the EA creates a new population P S k + 1 . This new population is evaluated again, thus repeating the process. Therefore, at each step k, the system runs the model n times. Each time the systems use a row (j) of PSk. Simulation results are compared with real data so there is a simulation error for each PSjk. This error is used to generate the next population to be tested or to decide if it is small enough to finish the process. The stop condition is usually defined as a threshold for the minimum EPSjk or as a maximum number of iterations.
Each EA uses a particular policy to create the new population from the previously evaluated one. The goal is converging to the optimal solution in a minimum number of steps. In order to perform this operation, EAs include random components to search for the global best solution, which include values of dispersion to spread or to focus the offspring near a possible solution. The model parameter identification was set with initial dispersion values between [−5, 5] from the initial value.

3.1. EAs’ Descriptions

The PSO algorithm is an EA that emulates the behavior of a swarm in the action of the crop [34]. The swarm moves around a particle that finds a possible good place (solution) and explores this location; if another particle finds a better solution, the swarm moves to this new place. PSO also includes a gradual reduction of the movement distance at each step (ω) to focus the research on a small area and the capacity to keep the better solution found at each step in the swarm memory (PBest) and the best solution of the overall process (Gbest). The algorithm uses two coefficients in order to modulate the influence of Pbest and Gbest in the new swarm step (iteration).
On the other hand, one of the most recent published EAs is CS [44,45,46]. CS emulates the behavior of cuckoo birds related to their aggressive strategy of reproduction that colonize and parasitize the nests of another bird. The cuckoo chooses a nest with eggs, and leaves its own egg; if the egg is accepted and hatches, the brood will be fed by the foster birds. In CS, the probability that the egg be found out and rejected is configurable as Pa ∈ [0, 1]. The CS movement strategy follows the Lévy flights, and each step has a random distance and an angular movement conditioned by configurable values: α (α > 0), and λ (λ ∈ [1, 3]).

3.2. New Proposal

One important feature of PSO is its ability to gradually focus the search around the local minimum. However, when the algorithm falls around a local minimum it is difficult to obtain a better solution. This paper proposes the introduction of periodic perturbations inside the population in order to force PSO reactivation. The perturbation will consist of a new population PSjl based on the best global solution:
c i , j l = ( c i G B e s t z p ) + c i G B e s t  
where ciGBest is a coefficient belonging to GBest at iteration l, and p is the perturbation value. Since the use of perturbations in this proposal is named PSO + P, the perturbation must be introduced after the stabilization of PSO, so it is necessary to first run PSO.

3.3. Algorithms Configuration Criteria

Different criteria currently exist for the algorithms’ configurations. This paper works with the more common configuration [34,47,53,54] as is shown in Table 2. Population size, number of iterations, and initial dispersion (vd) take equal values in all the algorithms.

4. Results and Discussion

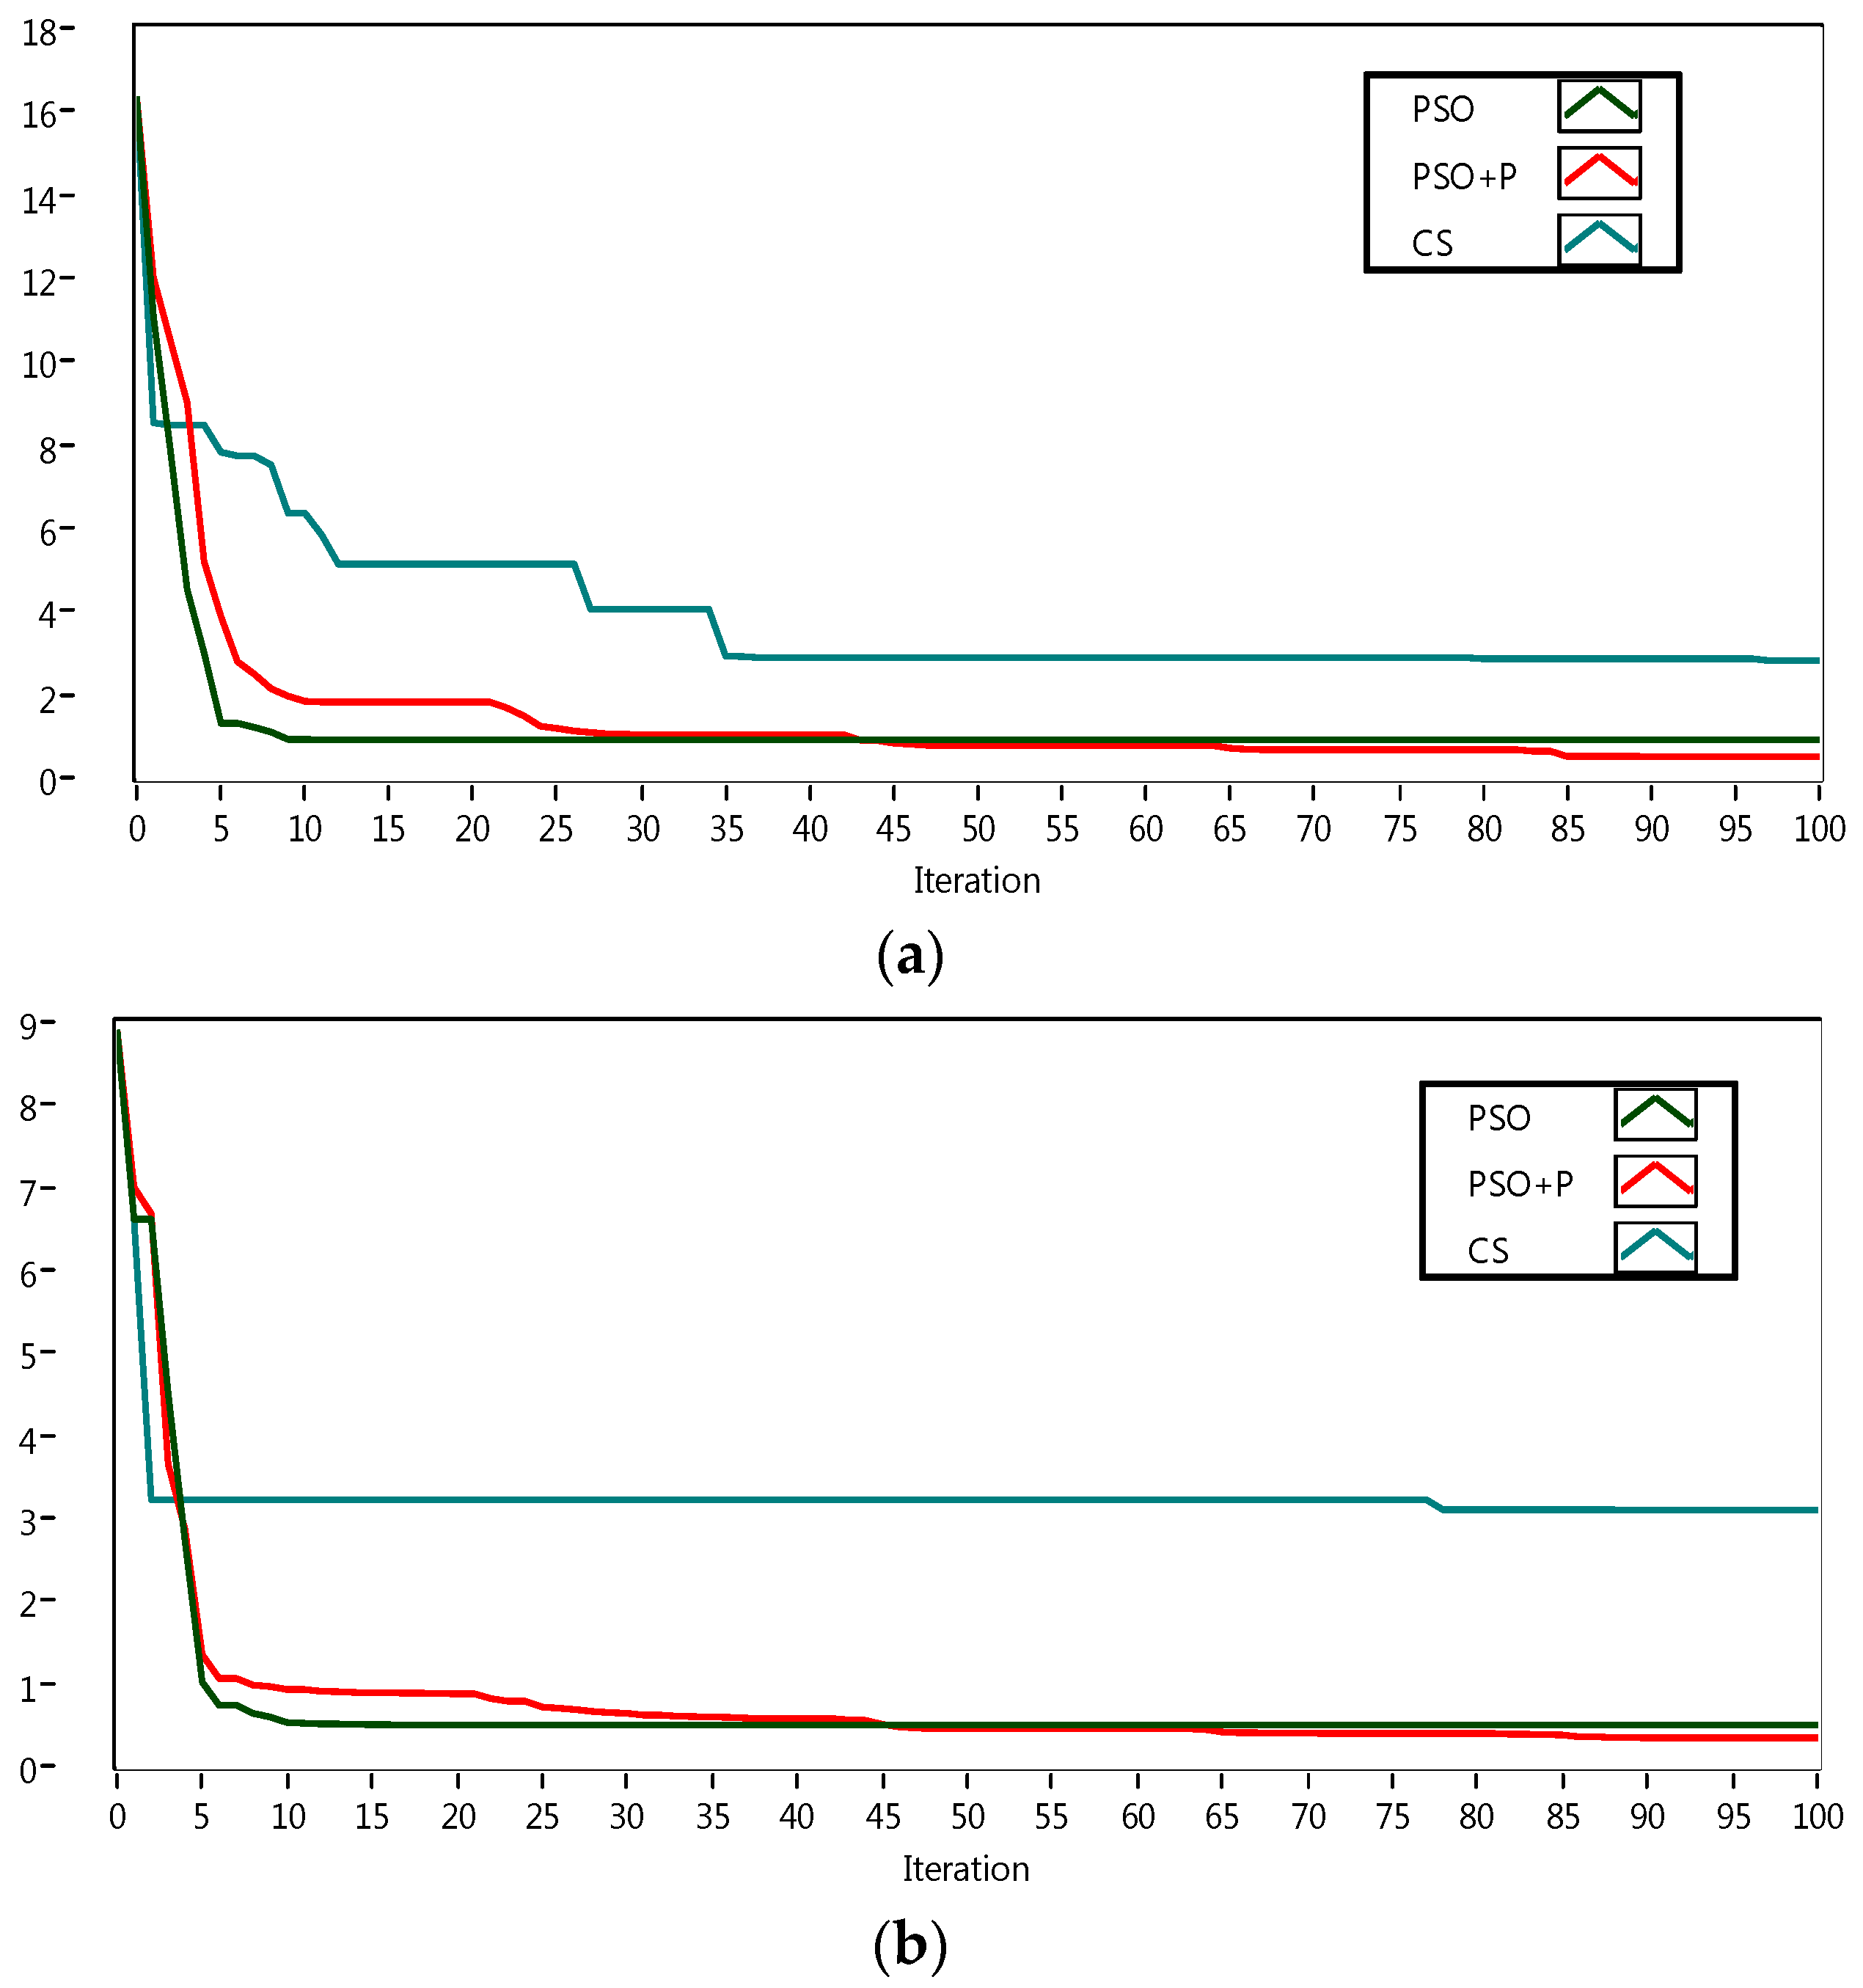
4.1. Optimization Results

Model duality allows the use of different errors for both battery operation modes (charging/discharging). Therefore, we can study separately each behavior. Figure 5 shows both. In the charge mode, CS does not find an optimal value of error and its last change takes place near the 80th iteration. PSO and PSO + P achieve similar error values. Despite PSO presenting a fast search, it presents an early jam around a non-optimal solution. On the other hand, the perturbation feature of PSO + P allows a wide search and the achieving of better results.
Regarding discharge mode, EA performances show similar results as in the charge mode. CS presents a more dynamic behavior that obtains stabilization in iteration 36th, but with a non-adequate optimization value. The fastest algorithm is PSO, which reaches an acceptable value less than 1.0% around the 10th iteration. PSO + P show a slightly slower behavior, but it obtains better results from the 43rd iteration onwards.
Results discard CS as a suitable method to fit the battery behavior. Therefore, only PSO and PSO + P need a closer look in order to select the best algorithm. A fast analysis over the curves shows that PSO is the faster algorithm, but it falls into local minima, so it loses search ability, thus confirming its known limitations. PSO + P obtain the best results, but it requires more iterations to achieve it. A quantitative comparison is shown in Table 3. The criteria used to evaluate each algorithm include precision, velocity, and computational cost. First, the precision value is measured as the lowest error value reached by an EA. Second, the optimization speed is measured with the iteration when the algorithm makes its last improvement. Finally, computational cost is measured as the average time used by the computer to make a single optimization iteration. Scores are calculated in each operation mode (charging/discharging) through the ratio between the obtained value by the algorithm and the lowest value achieved by algorithm. Therefore, a value of 1.00 represents the best result and a value of 2.00 stands for a 100% deviation from the best result. The algorithms were run under a PC with and Intel Core i5-3200, 3.1 GHz, 8 GB RAM, and Windows 7 64-bit operating system.

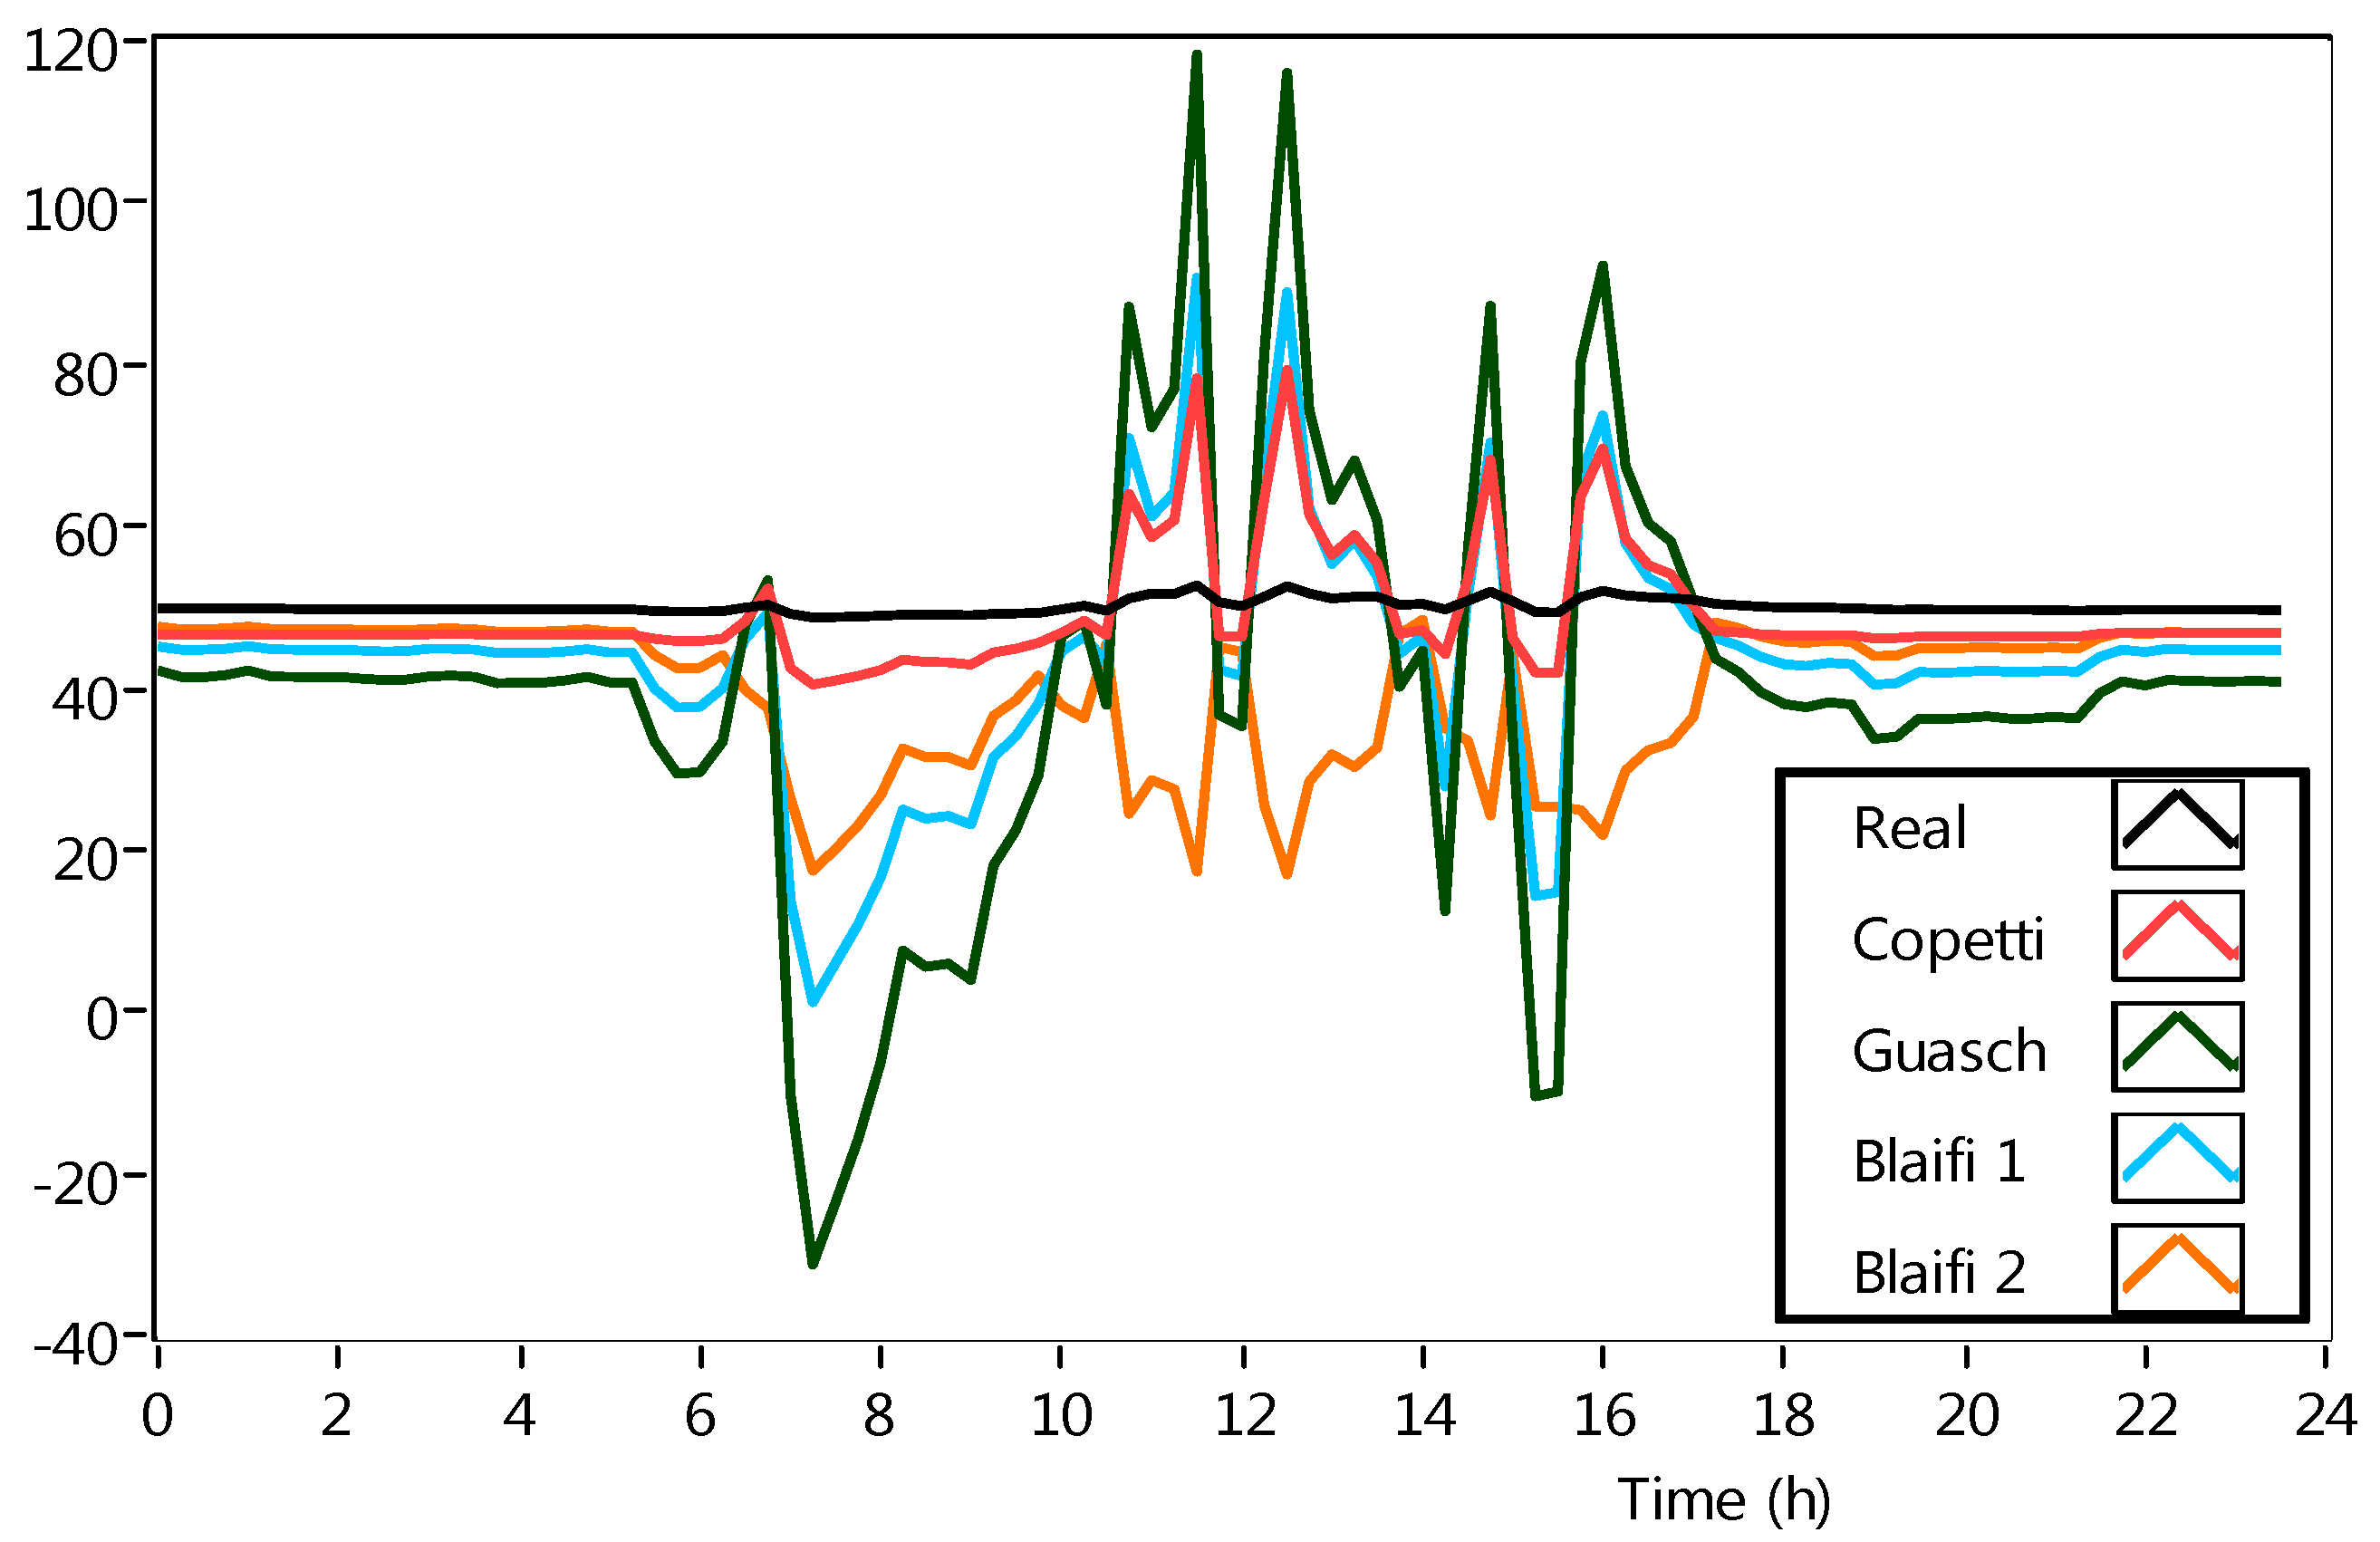
4.2. Model Performance and Validation

Data in Table 3 describes PSO as the best algorithm regarding velocity and computational cost. However, PSO + P shows the most accurate fit. Therefore, the model is fit with PSO + P results. These parameters are shown in Table 4.
Figure 6 shows the results of the identification process with PSO + P. The simulated plot follows the real plot of the battery voltage with high accuracy. The battery model with new extracted parameters presents a good match with the real measurements obtained from the research center.
The mean errors achieved with this method were 0.29% and 0.44% for the battery voltage signal (discharging/charging, respectively) for an average between the two signals of 0.365%.

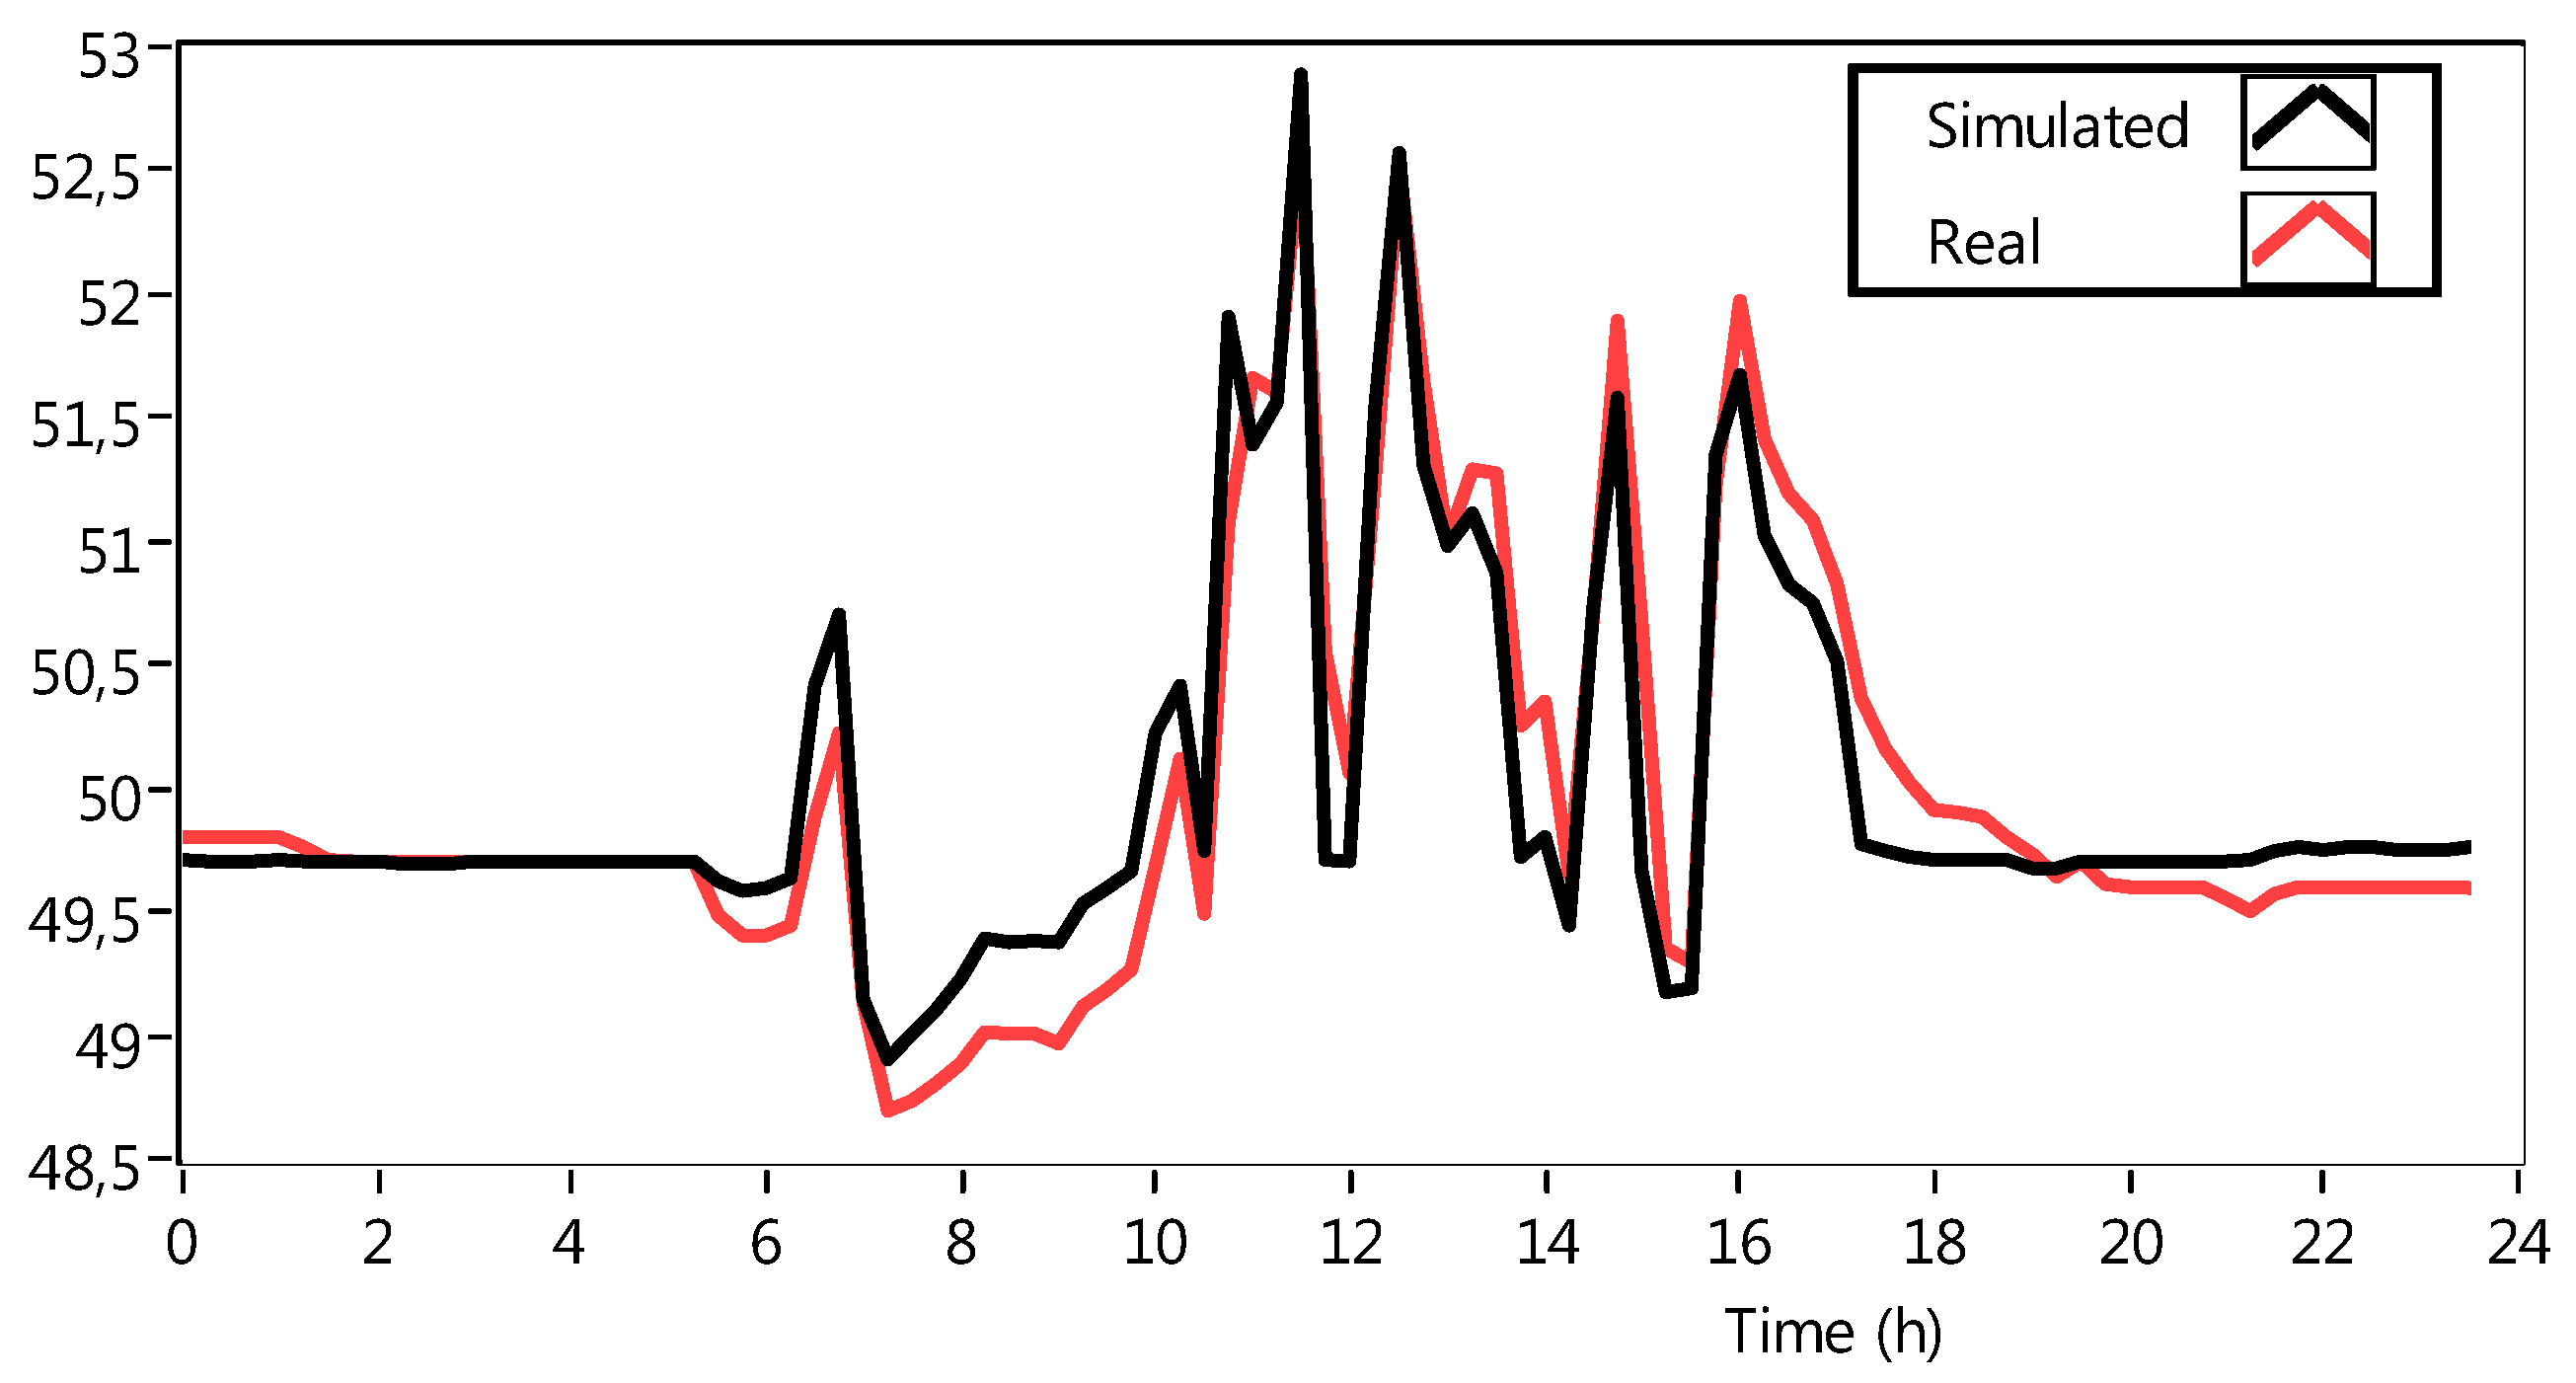
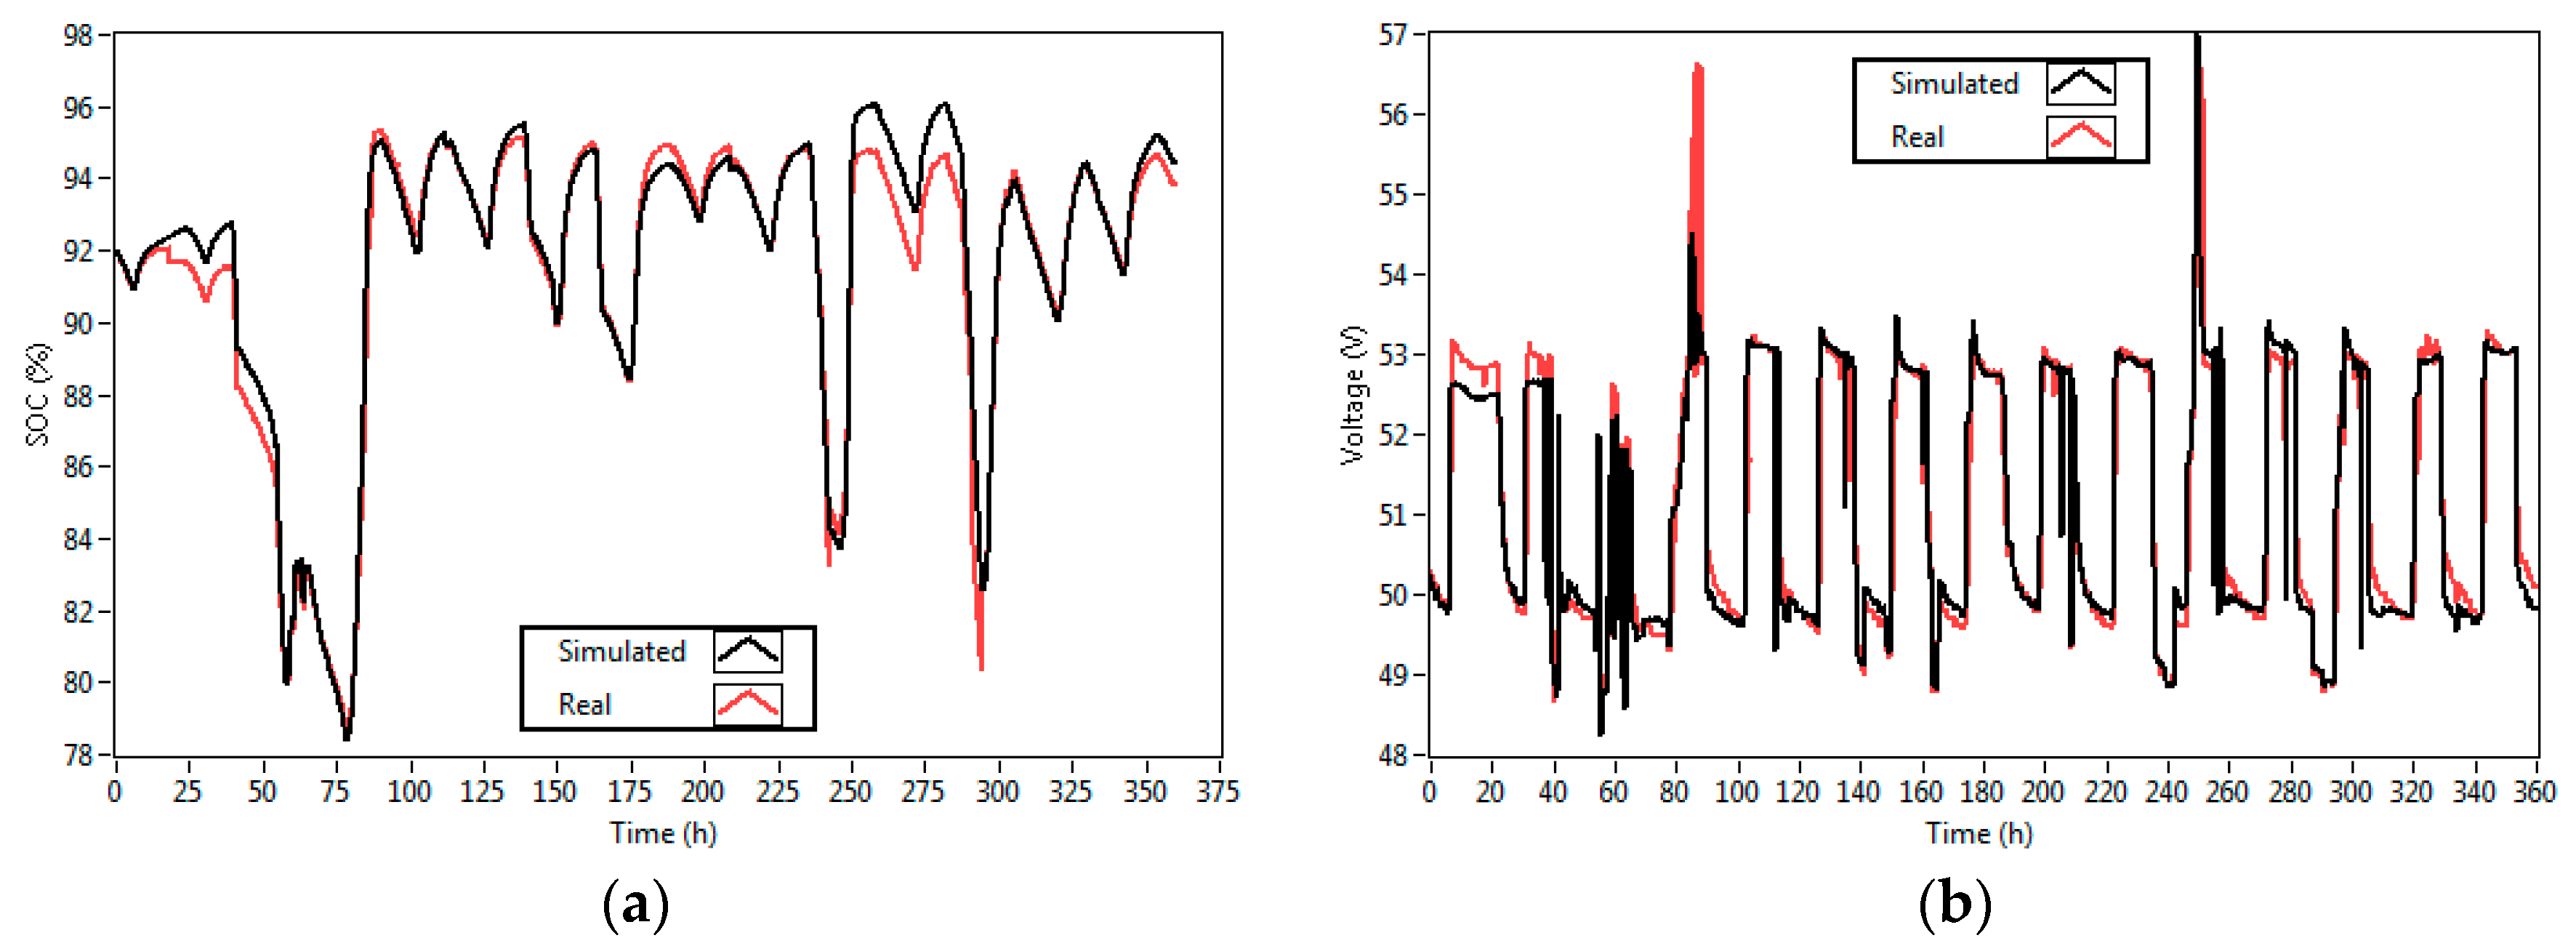
4.3. Experimental Validation

Model validation is carried out with data from three months divided into four-day packages to be compared with the results presented in [41,42,43]. In order to validate the developed model under real conditions, this paper uses the parameters shown in Table 4. Figure 7 shows the results of the experimental validation of several data packages for different months; the left side shows the simulation of SOC and the right side presents the voltage signal.
Validations 1 to 3 show that the model is able to follow the dynamics of the battery, despite some mistakes in signal reading. Those errors are shown as vertical falls and peaks without physical explanation due to the sampling period of 15 min. The mean error of each simulation is shown in Table 5.
When the battery model is validated for a 15-day package with the parameters shown in Table 5 the SOC mean error was 0.46% and the voltage mean error 0.45% (see Figure 8). Again, the model presents a good matching with the measured signal. However, on the 4th and 11th days overcharging events occurred, and the model was only able to represent the second event.

5. Conclusions

The battery model proposed by Copetti shows good performance in representing battery dynamics. However, when tested with real measurements, this model presents problems of scaling and delay in the signal, so this paper has proposed the inclusion of four new parameters to improve its modelling capabilities.
The model has been fit to represent the real behavior of a BESS placed at “El Chocó”, Colombia. The complexity of the model justifies the use of EA to perform the optimization, so this paper has tested three EAs in order to find the best approach. In addition, some well-known algorithms like CS and PSO, a new proposed algorithm (particle swarm optimization + perturbation) has been tested to identify the parameters of the lead acid OPzS battery. The inclusion of the disturbance makes PSO + P more accurate than PSO.
The battery model with the new extracted parameters presents a good match with the real measurements obtained from the research center. The main advantage of the developed model is its low computational cost and its ability to absorb reading problems and scaling errors. The validation with real measurements shows low errors. The model and its fitting approach presented in this paper may be applied to other types of batteries, especially those used in stand-alone systems.
The present proposal has the ability to find a PS that fits the model without caring about the start point. However, to continue the present work is necessary to make a sensibility analysis of the parameters to define the influence of each parameter in the simulation results, and to establish its adequate boundaries.
The fitting process presented at this paper gives goods results in terms of model accuracy. Therefore, this model could be used for other purposes, such as simulation, fault diagnosis, condition monitoring, or model predictive control. One key parameter for developing applications in these areas is SOC. Since battery voltage equations include SOC and the fitting process show low error, it will be possible to use the model to predict values of SOC. Thus, future works will explore the potential of the model in all of these areas in order to design a better battery energy management system for the research center at “El Chocó”, Colombia.

Author Contributions

The present work was developed with following contributions: conceptualization: methodology, software, validation, formal analysis, research, writing—original draft preparation, and data curation: H.E.A.C., E.B., and A.C.; writing—review and editing, and supervision: Á.P.-N. and F.M.

Funding

This research was supported by “Implementación de un programa de desarrollo e investigación de energías renovables en el departamento del Chocó”—BPIN:20130000100285; COLCIENCIAS (Administrative Department of Science, Technology and Innovation of Colombia) scholarship program PDBCEx, COLDOC 586, and the support provided by the Corporación Universitaria Comfacauca, Popayán—Colombia.

Acknowledgments

The authors would like to thank the editorial board as well as the anonymous reviewers for their valuable comments that have greatly increased the quality of this document.

Conflicts of Interest

Authors declare no conflict of interest. The founding sponsors had no role in the design of the study; in the collection, analyses, or interpretation of data; in the writing of the manuscript, or in the decision to publish the results.

References

  1. Banguero, E.; Correcher, A.; Pérez-Navarro, Á.; Morant, F.; Aristizabal, A. A Review on Battery Charging and Discharging Control Strategies: Application to Renewable Energy Systems. Energies 2018, 11, 1021. [Google Scholar] [CrossRef]
  2. Genc, R.; Alas, M.O.; Harputlu, E.; Repp, S.; Kremer, N.; Castellano, M.; Colak, S.G.; Ocakoglu, K.; Erdem, E. High-Capacitance Hybrid Supercapacitor Based on Multi-Colored Fluorescent Carbon-Dots. Sci. Rep. 2017, 7, 11222. [Google Scholar] [CrossRef] [PubMed]
  3. Repp, S.; Harputlu, E.; Gurgen, S.; Castellano, M.; Kremer, N.; Pompe, N.; Wörner, J.; Hoffmann, A.; Thomann, R.; Emen, F.M.; et al. Synergetic effects of Fe3+ doped spinel Li4Ti5O12 nanoparticles on reduced graphene oxide for high surface electrode hybrid supercapacitors. Nanoscale 2018, 10, 1877–1884. [Google Scholar] [CrossRef] [PubMed]
  4. Díaz-González, F.; Sumper, A.; Gomis-Bellmunt, O.; Villafáfila-Robles, R. A review of energy storage technologies for wind power applications. Renew. Sustain. Energy Rev. 2012, 16, 2154–2171. [Google Scholar] [CrossRef]
  5. Evans, A.; Strezov, V.; Evans, T.J. Assessment of utility energy storage options for increased renewable energy penetration. Renew. Sustain. Energy Rev. 2012, 16, 4141–4147. [Google Scholar] [CrossRef]
  6. Ferreira, H.L.; Garde, R.; Fulli, G.; Kling, W.; Lopes, J.P. Characterisation of electrical energy storage technologies. Energy 2013, 53, 288–298. [Google Scholar] [CrossRef]
  7. Koohi-Kamali, S.; Tyagi, V.V.; Rahim, N.A.; Panwar, N.L.; Mokhlis, H. Emergence of energy storage technologies as the solution for reliable operation of smart power systems: A review. Renew. Sustain. Energy Rev. 2013, 25, 135–165. [Google Scholar] [CrossRef]
  8. Kousksou, T.; Bruel, P.; Jamil, A.; el Rhafiki, T.; Zeraouli, Y. Energy storage: Applications and challenges. Sol. Energy Mater. Sol. Cells 2014, 120, 59–80. [Google Scholar] [CrossRef]
  9. Kaiser, R. Optimized battery-management system to improve storage lifetime in renewable energy systems. J. Power Sources 2007, 168, 58–65. [Google Scholar] [CrossRef]
  10. Sayigh, A. Renewable Energy in the Service of Mankind Vol I: Selected Topics from the World Renewable Energy Congress WREC 2014; Springer: New York, NY, USA, 2015. [Google Scholar]
  11. Armstrong, S.; Glavin, M.E.; Hurley, W.G. Comparison of battery charging algorithms for stand alone photovoltaic systems. In Proceedings of the 2008 IEEE Power Electronics Specialists Conference, Rhodes, Greece, 15–19 June 2008; pp. 1469–1475. [Google Scholar]
  12. Yin, Y.; Luo, X.; Guo, S.; Zhou, Z.; Wang, J. A battery charging control strategy for renewable energy generation systems. In Proceedings of the World Congress on Engineering, London, UK, 2–4 July 2008; Volume 1, pp. 2–4. [Google Scholar]
  13. Saiju, R.; Heier, S. Performance analysis of lead acid battery model for hybrid power system. In Proceedings of the 2008 IEEE/PES Transmission and Distribution Conference and Exposition, Chicago, IL, USA, 21–24 April 2008; pp. 1–6. [Google Scholar]
  14. Tsang, K.M.; Chan, W.L.; Wong, Y.K.; Sun, L. Lithium-ion battery models for computer simulation. In Proceedings of the 2010 IEEE International Conference on Automation and Logistics (ICAL), Hong Kong/Macau, China, 16–20 August 2010; pp. 98–102. [Google Scholar]
  15. Nikdel, M. Various battery models for various simulation studies and applications. Renew. Sustain. Energy Rev. 2014, 32, 477–485. [Google Scholar]
  16. Zhu, W.H.; Zhu, Y.; Tatarchuk, B.J. A simplified equivalent circuit model for simulation of Pb-acid batteries at load for energy storage application. Energy Convers. Manag. 2011, 52, 2794–2799. [Google Scholar] [CrossRef]
  17. Fendri, D.; Chaabene, M. Dynamic model to follow the state of charge of a lead-acid battery connected to photovoltaic panel. Energy Convers. Manag. 2012, 64, 587–593. [Google Scholar] [CrossRef]
  18. Hittinger, E.; Wiley, T.; Kluza, J.; Whitacre, J. Evaluating the value of batteries in microgrid electricity systems using an improved Energy Systems Model. Energy Convers. Manag. 2015, 89, 458–472. [Google Scholar] [CrossRef]
  19. Ansari, A.B.; Esfahanian, V.; Torabi, F. Discharge, rest and charge simulation of lead-acid batteries using an efficient reduced order model based on proper orthogonal decomposition. Appl. Energy 2016, 173, 152–167. [Google Scholar] [CrossRef]
  20. Achaibou, N.; Haddadi, M.; Malek, A. Modeling of lead acid batteries in PV systems. Energy Procedia 2012, 18, 538–544. [Google Scholar] [CrossRef]
  21. Achaibou, N.; Haddadi, M.; Malek, A. Lead acid batteries simulation including experimental validation. J. Power Sources 2008, 185, 1484–1491. [Google Scholar] [CrossRef]
  22. Wei, Z.; Meng, S.; Xiong, B.; Ji, D.; Tseng, K.J. Enhanced online model identification and state of charge estimation for lithium-ion battery with a FBCRLS based observer. Appl. Energy 2016, 181, 332–341. [Google Scholar] [CrossRef]
  23. Devarakonda, L.; Hu, T. Algebraic method for parameter identification of circuit models for batteries under non-zero initial condition. J. Power Sources 2014, 268, 928–940. [Google Scholar] [CrossRef]
  24. Selmani, A.; Outanoute, M.; Lachhab, A.; Guerbaoui, M.; Bouchikhi, B. Performance Evaluation of Modelling and Simulation of Lead Acid Batteries for Photovoltaic Applications. Int. J. Power Electron. Drive Syst. 2016, 7, 472–480. [Google Scholar] [CrossRef]
  25. Wei, Z.; Zhao, J.; Ji, D.; Tseng, K.J. A multi-timescale estimator for battery state of charge and capacity dual estimation based on an online identified model. Appl. Energy 2017, 204, 1264–1274. [Google Scholar] [CrossRef]
  26. Wei, Z.; Bhattarai, A.; Zou, C.; Meng, S.; Lim, T.M.; Skyllas-Kazacos, M. Real-time monitoring of capacity loss for vanadium redox flow battery. J. Power Sources 2018, 390, 261–269. [Google Scholar] [CrossRef]
  27. Thirugnanam, K.; Ezhil TP, E.R.J.; Singh, M.; Kumar, P. Mathematical modeling of Li-ion battery using genetic algorithm approach for V2G applications. IEEE Trans. Energy Convers. 2014, 29, 332–343. [Google Scholar]
  28. Chen, Z.; Mi, C.C.; Fu, Y.; Xu, J.; Gong, X. Online battery state of health estimation based on Genetic Algorithm for electric and hybrid vehicle applications. J. Power Sources 2013, 240, 184–192. [Google Scholar] [CrossRef]
  29. Liu, W.; Liu, L.; Chung, I.-Y.; Cartes, D.A. Real-time particle swarm optimization based parameter identification applied to permanent magnet synchronous machine. Appl. Soft Comput. 2011, 11, 2556–2564. [Google Scholar] [CrossRef]
  30. Guo, L.; Meng, Z.; Sun, Y.; Wang, L. Parameter identification and sensitivity analysis of solar cell models with cat swarm optimization algorithm. Energy Convers. Manag. 2016, 108, 520–528. [Google Scholar] [CrossRef]
  31. Nyarko, E.K.; Scitovski, R. Solving the parameter identification problem of mathematical models using genetic algorithms. Appl. Math. Comput. 2004, 153, 651–658. [Google Scholar] [CrossRef]
  32. García-Triviño, P.; Gil-Mena, A.J.; Llorens-Iborra, F.; García-Vázquez, C.A.; Fernández-Ramírez, L.M.; Jurado, F. Power control based on particle swarm optimization of grid-connected inverter for hybrid renewable energy system. Energy Convers. Manag. 2015, 91, 83–92. [Google Scholar] [CrossRef]
  33. Al-Falahi, M.D.A.; Jayasinghe, S.D.G.; Enshaei, H. A review on recent size optimization methodologies for standalone solar and wind hybrid renewable energy system. Energy Convers. Manag. 2017, 143, 252–274. [Google Scholar] [CrossRef]
  34. Rahman, M.A.; Anwar, S.; Izadian, A. Electrochemical model parameter identification of a lithium-ion battery using particle swarm optimization method. J. Power Sources 2016, 307, 86–97. [Google Scholar] [CrossRef]
  35. Hu, X.; Li, S.; Peng, H. A comparative study of equivalent circuit models for Li-ion batteries. J. Power Sources 2012, 198, 359–367. [Google Scholar] [CrossRef]
  36. Malik, A.; Zhang, Z.; Agarwal, R.K. Extraction of battery parameters using a multi-objective genetic algorithm with a non-linear circuit model. J. Power Sources 2014, 259, 76–86. [Google Scholar] [CrossRef]
  37. Brand, J.; Zhang, Z.; Agarwal, R.K. Extraction of battery parameters of the equivalent circuit model using a multi-objective genetic algorithm. J. Power Sources 2014, 247, 729–737. [Google Scholar] [CrossRef]
  38. Zhang, L.; Wang, L.; Hinds, G.; Lyu, C.; Zheng, J.; Li, J. Multi-objective optimization of lithium-ion battery model using genetic algorithm approach. J. Power Sources 2014, 270, 367–378. [Google Scholar] [CrossRef]
  39. Guasch, D.; Silvestre, S. Dynamic battery model for photovoltaic applications. Prog. Photovolt. Res. Appl. 2003, 11, 193–206. [Google Scholar] [CrossRef] [Green Version]
  40. Copetti, J.B.; Lorenzo, E.; Chenlo, F. A general battery model for PV system simulation. Prog. Photovolt. Res. Appl. 1993, 1, 283–292. [Google Scholar] [CrossRef]
  41. Blaifi, S.; Moulahoum, S.; Colak, I.; Merrouche, W. An enhanced dynamic model of battery using genetic algorithm suitable for photovoltaic applications. Appl. Energy 2016, 169, 888–898. [Google Scholar] [CrossRef]
  42. Blaifi, S.; Moulahoum, S.; Colak, I.; Merrouche, W. Monitoring and enhanced dynamic modeling of battery by genetic algorithm using LabVIEW applied in photovoltaic system. Electr. Eng. 2017, 100, 1021–1038. [Google Scholar] [CrossRef]
  43. Blaifi, S.; Moulahoum, S.; Kabache, N.; Colak, I. An improved dynamic battery model suitable for photovoltaic applications. In Proceedings of the 2015 International Conference on Renewable Energy Research and Applications (ICRERA), Palermo, Italy, 22–25 November 2015; pp. 694–698. [Google Scholar]
  44. Yang, X.S.; Deb, S. Cuckoo Search via Lévy flights. In Proceedings of the 2009 World Congress on Nature Biologically Inspired Computing (NaBIC), Coimbatore, India, 9–11 December 2009; pp. 210–214. [Google Scholar]
  45. Berrazouane, S.; Mohammedi, K. Parameter optimization via cuckoo optimization algorithm of fuzzy controller for energy management of a hybrid power system. Energy Convers. Manag. 2014, 78, 652–660. [Google Scholar] [CrossRef]
  46. Yang, X.-S.; Deb, S. Engineering optimisation by cuckoo search. Int. J. Math. Model. Numer. Optim. 2010, 1, 330–343. [Google Scholar] [CrossRef]
  47. Gandomi, A.H.; Yang, X.-S.; Alavi, A.H. Cuckoo search algorithm: A metaheuristic approach to solve structural optimization problems. Eng. Comput. 2013, 29, 17–35. [Google Scholar] [CrossRef]
  48. Fister, I., Jr.; Yang, X.-S.; Fister, I.; Brest, J.; Fister, D. A Brief Review of Nature-Inspired Algorithms for Optimization. arXiv 2013, arXiv:13074186. [Google Scholar]
  49. Aristizabal, A.; Banguero, E.; Murillo, W. A Verification Study for Grid-Connected 20 kW Solar PV System Operating in Chocó, Colombia. Energy Procedia 2017, 141, 96–101. [Google Scholar]
  50. Chan, H.L. A new battery model for use with battery energy storage systems and electric vehicles power systems. In Proceedings of the 2000 IEEE Power Engineering Society Winter Meeting, Conference Proceedings (Cat. No.00CH37077), Singapore, 23–27 January 2000; Volume 1, pp. 470–475. [Google Scholar]
  51. Szumanowski, A.; Chang, Y. Battery management system based on battery nonlinear dynamics modeling. IEEE Trans. Veh. Technol. 2008, 57, 1425–1432. [Google Scholar] [CrossRef]
  52. Burgos, C.; Sáez, D.; Orchard, M.E.; Cárdenas, R. Fuzzy modelling for the state-of-charge estimation of lead-acid batteries. J. Power Sources 2015, 274, 355–366. [Google Scholar] [CrossRef]
  53. Li, Q.; Chen, W.; Wang, Y.; Liu, S.; Jia, J. Parameter Identification for PEM Fuel-Cell Mechanism Model Based on Effective Informed Adaptive Particle Swarm Optimization. IEEE Trans. Ind. Electron. 2011, 58, 2410–2419. [Google Scholar] [CrossRef]
  54. Ye, M.; Wang, X.; Xu, Y. Parameter identification for proton exchange membrane fuel cell model using particle swarm optimization. Int. J. Hydrog. Energy 2009, 34, 981–989. [Google Scholar] [CrossRef]
Figure 1. Block diagram of the Centro de Investigación en Energías Renovables del Departamento del Chocó, Colombia (CIERCHOCÓ) building integrated photovoltaic system (BIPVS).
Energies 11 02361 g001
Figure 2. Equivalent circuit battery model.
Energies 11 02361 g002
Figure 3. Model test using the parameters published in Table 1.
Energies 11 02361 g003
Figure 4. Global identification process algorithm.
Energies 11 02361 g004
Figure 5. Optimization algorithms. (a) Charge mode algorithm performance, and (b) discharge mode algorithm performance.
Energies 11 02361 g005
Figure 6. Simulation using identified parameters by particle swarm optimization (PSO) + P algorithm with one day data files.
Energies 11 02361 g006
Figure 7. Battery voltage measurements (red plot) and simulation (black plot) results obtained by PSO + P algorithm identified parameters. 13a represent the battery state of charge (SOC) signals, and 13b represent the battery voltage signals.
Energies 11 02361 g007
Figure 8. Battery voltage measurements and simulation results obtained by PSO + P algorithm for 15 days. (a) represents the battery SOC signals; and (b) represents the battery voltage Signals.
Energies 11 02361 g008
Table 1. Nominal values of the identified parameters by some authors.
ParametersGuasch [39]Copetti [40]Blaifi [41,42]Blaifi [43]
Vbodc (V)2.1472.0852.1482.1612
Kbodc (V)0.2840.120.1270.219
P1dc (VAh)4.08340.4069.5044
P2dc−6.6341.33.0414.9361
P3dc (Vh)0.270.271.2180.9311
P4dc1.51.50.78120.037
P5dc (Vh)0.020.020.4841.8837
αrdc (°C−1)0.0070.0070.01970.0167
Vboc (V)1.9821.7811.9016
Kboc (V)0.1490.160.53130.16
P1c (VAh)5.92367.2346.0809
P2c0.0240.860.6671.6701
P3c (Vh)0.480.480.0780.3375
P4c1.21.20.4920.9853
P5c (Vh)0.0360.0360.74211.7838
αrc (°C−1)0.0250.0250.430.01
Table 2. Optimization algorithms’ configurations.
CriteriaPSOPSO + PCS
Population size100010001000
Iterations100100100
Weight initial (ω1)0.90.9-
Weight final (ω2)0.10.1-
c111-
c211-
vd555
Iteration to perturb-10-
Pa--0.5
α--1
λ--2
Table 3. Algorithm comparison using the minimal mean error reached. d * = discharge mode; c * = charge mode.
Criteria/AlgorithmPSOPSO + PCuckoo
d *c *d *c *d *c *
Precision (error)Value0.500.910.340.513.092.81
Score1.481.781.001.009.235.53
Velocity (iteration)Value17.0011.0091.0090.0089.0097.00
Score1.001.005.358.185.248.82
Computational cost (ms/iteration)Value0.410.410.420.420.710.71
Score1.001.001.031.031.721.72
Table 4. Parameters from particle swarm optimization (PSO) + P identification in daily data files.
DischargeCharge
Vbodc (V)2.3003Vboc (V)2.2823
Kbodc (V)0.1898Kboc (V)1.0227
P1dc (VAh)20.4751P1c (VAh)2.4048
P2dc0.9282P2c1.1928
P3dc (Vh)0.1481P3c (Vh)0.0061
P4dc2.3350P4c0.0285
P5dc (Vh)0.0362P5c (Vh)0.0054
αrdc (°C−1)0.0365αrc (°C−1)0.1008
kIdc *2.2087kIc *0.3254
kc_batdc *2.5517kc_batc *0.3603
ksocdc *2.5509ksocc *16.7918
kc120dc *0.0470kc120c *0.3097
*: corresponce to new parameters included in the model.
Table 5. Mean error of simulated vs. measured signals for the four-day package and three months.
SignalSOCVoltage
Month(1)(2)(3)(1)(2)(3)
Charge mode error (%)0.06060.08270.17870.21630.25040.2446
Discharge mode error (%)0.12230.13350.13830.38240.33470.5242
Mean (%)0.09560.10760.16020.30750.29040.3582

