Correlation Analysis between Wind Speed/Voltage Clusters and Oscillation Modes of Doubly-Fed Induction Generators


1
School of Electronic Information and Electrical Engineering, Shanghai JiaoTong University, Shanghai 200240, China
2
Department of Electronic and Electrical Engineering, University of Bath, Bath BA2 7AY, UK
*
Author to whom correspondence should be addressed.
Energies 2018, 11(9), 2370; https://doi.org/10.3390/en11092370
Submission received: 13 August 2018
/
Revised: 28 August 2018
/
Accepted: 5 September 2018
/
Published: 8 September 2018
(This article belongs to the Special Issue Sustainable Energy Systems)
Abstract
:Potential machine-grid interactions caused by large-scale wind farms have drawn much attention in recent years. Previous work has been done by analyzing the small–signal modeling of doubly-fed induction generators (DFIGs) to obtain the oscillation modes. This paper, by making use of the metered power data of wind generating sets, studies the correlation between oscillation modes of the DFIG system and influence factors which includes wind speed and grid voltage. After the metered data is segmented, the Prony algorithm is used to analyze the oscillation modes contained in the active power. Then, the relevant oscillation modes are extracted in accordance with the small-signal analysis results. Meanwhile, data segments are clustered according to wind speed and grid voltage. The Apriori algorithm is finally used to discuss the association rules. By training the mass of data of wind generating sets, the inevitable association rules between oscillation modes and influence factors can be mined. Therefore, the prediction of oscillation modes can be achieved based on the rules. The results show that the clustering number quite affects the association rules. When the optimal cluster number is adopted, part of the wind speed/voltage clusters can analyze the certain oscillation modes. The predicted results are quite consistent with the practical data.
1. Introduction
According to the 2016 Global Wind Power Development Outlook Report, the wind power market will reach 100 GW by 2020, and the cumulative wind power market will reach 879 GW [1]. With the continuous increase of wind power penetration, the machine-grid interaction has attracted increasing attention. It is found that the interaction is usually reflected in the oscillation of active power [2]. The oscillation modes can be divided into sub-synchronous interaction and low frequency oscillation. The former can be categorized into sub-synchronous control interaction (SSCI) and sub-synchronous torque interaction (SSTI). SSTI includes sub-synchronous oscillation (SSO) [3] and sub-synchronous resonance (SSR) [4]. Since the 1960s, accidents caused by machine-grid interactions have occurred in Europe, America and other countries. The first SSCI accident caused by an interaction between the rotor-side converter and the fixed string compensation system of the doubly-fed induction generator (DFIG) happened in Texas (USA). It resulted in damage to the wind turbines and internal lever circuits [5].
At present, research on the machine-grid interaction is mainly based on modeling and simulation. For instance, Reference [6] proposes a unified modularized small signal dynamic model of wind farm based on an induction motor. It can simulate a random number of fixed speeds, some variable speed (doubly-fed) induction motor wind turbine, providing a lot of flexibility for wind turbines and their controllers. In [7], a small-signal model of the direct-drive permanent magnet synchronous generator is established to study the stability of the grid-connected wind generating sets after the small disturbance, and the parameters of the controller are designed effectively. Reference [8] aimed at the suppression of torsional vibrations caused by small electrical disturbances from the grid side in a DFIG-based wind turbine system. The Prony algorithm is a complementary method used in the time-domain model system. It decomposes time-domain signals into damped sinusoids with four parameters per mode: frequency, damping, amplitude and phase. Compared with small-signal analysis, the Prony analysis shows an advantage when the system turns complicated because the former has difficulty solving high-order matrix [9,10]. All the papers above investigated the wind power oscillation mechanism and suppression method by modeling methods. However, the operation of wind generating sets is affected by factors which are more complex than the modeling simulation. A more direct and convenient way is to directly use the metered data.
With the advent of the big data era, the vast amounts of data collected from wind farms conceals vast information [11]. Data mining and machine learning theory including correlation analysis, cluster analysis, classification analysis, have brought new ideas to power research [12]. Among them, the Apriori algorithm, one of the correlation algorithms, provides an effective solution for exploring the association relationship between large data item-sets. In the power industry, correlation analysis is mainly used for transformer fault diagnosis. The Apriori algorithm is a common tool of correlation analysis. The Apriori algorithm is a hierarchical algorithm, which seeks frequent item-sets in the increasing item number order. The algorithm can be divided into two steps. The first step is to generate frequent item-sets with minimum support condition. The second step is to produce association rules with minimum confidence condition [13,14]. In [15], a data-driven method of association rule mining for transformer state parameters is proposed by combining the Apriori algorithm and probabilistic graphical model. Paper [16] proposes a new fault diagnosis method based on Set Pair Analysis and association rules. Via analyzing the relationship of fault symptoms and fault types, the corresponding association rules are established. In addition, cluster analysis, as an unsupervised classification method, provides a solution for the information mining of large quantity unknown data [17]. Reference [18] clusters the photovoltaic power station according to the geographical space and analyzes the evolution characteristics of cluster center and cluster radius to predict the spatio-temporal expansion of photovoltaic power supply. Based on new wind pattern recognition technologies, Reference [19] proposes a short-term wind power predicting method for a wind power farm. The correlation between wind power data and numerical weather prediction is used to cluster the meteorological grid data first, and then to construct artificial neural network and support vector machine model for each cluster to improve the accuracy of prediction. However, limited research has been done into the oscillation of wind generating sets through big data technology.
In this paper, metered actual output power data of wind generating sets will be used to mine the association rules between oscillation modes and influence factors. Based on the mode analyzing results via the small-signal modeling of DFIG, the information of the machine-grid interaction embedded in the actual operation data will be mined. The Prony algorithm will be used as the fundamental signal analysis method to do the preliminary signal decomposition. As a big data analysis technology, the Apriori algorithm will be introduced to make further efforts on the association rules mining and oscillation prediction. The association rules between clusters and oscillation modes through the analysis of metered data will be obtained. The prediction reveals the comprehensive impact of wind speed and voltage factors on the oscillation modes that may be contained in wind power.
The novelty of this paper is that it: (i) combines the modeling method and data analysis method to mine the oscillation information in the practical data of wind power; (ii) establishes the association analyzing modeling based on the Apriori algorithm to analyze the association rules between wind speed/voltage fluctuation clusters and oscillation modes; (iii) proposes a prediction method for the wind power oscillation modes.
The rest of the paper is organized as follows: Section 2 introduces the research methods of the oscillation modes of wind generating sets from two aspects: modeling and data analysis. Section 3 establishes the data correlation analysis model of the wind generating sets. The data is segmented by the wind speed and the segments are clustered according to the wind speed and the voltage fluctuation. Section 4 is a case analysis, where the impact of cluster number set on association rules is analyzed, and the predict is done according to the association rules between wind power and wind speed/voltage clusters, and the conclusion is given finally.
2. Study of Oscillation Modes of Grid-Connected DFIG System
Based on the structure of a grid-connected DFIG system, the small-signal system of DFIG has been established and used to analyze the oscillation modes to obtain the results of the modeling analysis. Meanwhile, the Prony algorithm is introduced to analyze the metered power data and the result is compared with the characteristic frequencies obtained from the modeling analysis.
2.1. Oscillation Modes Analysis Based on the Small-Signal Model
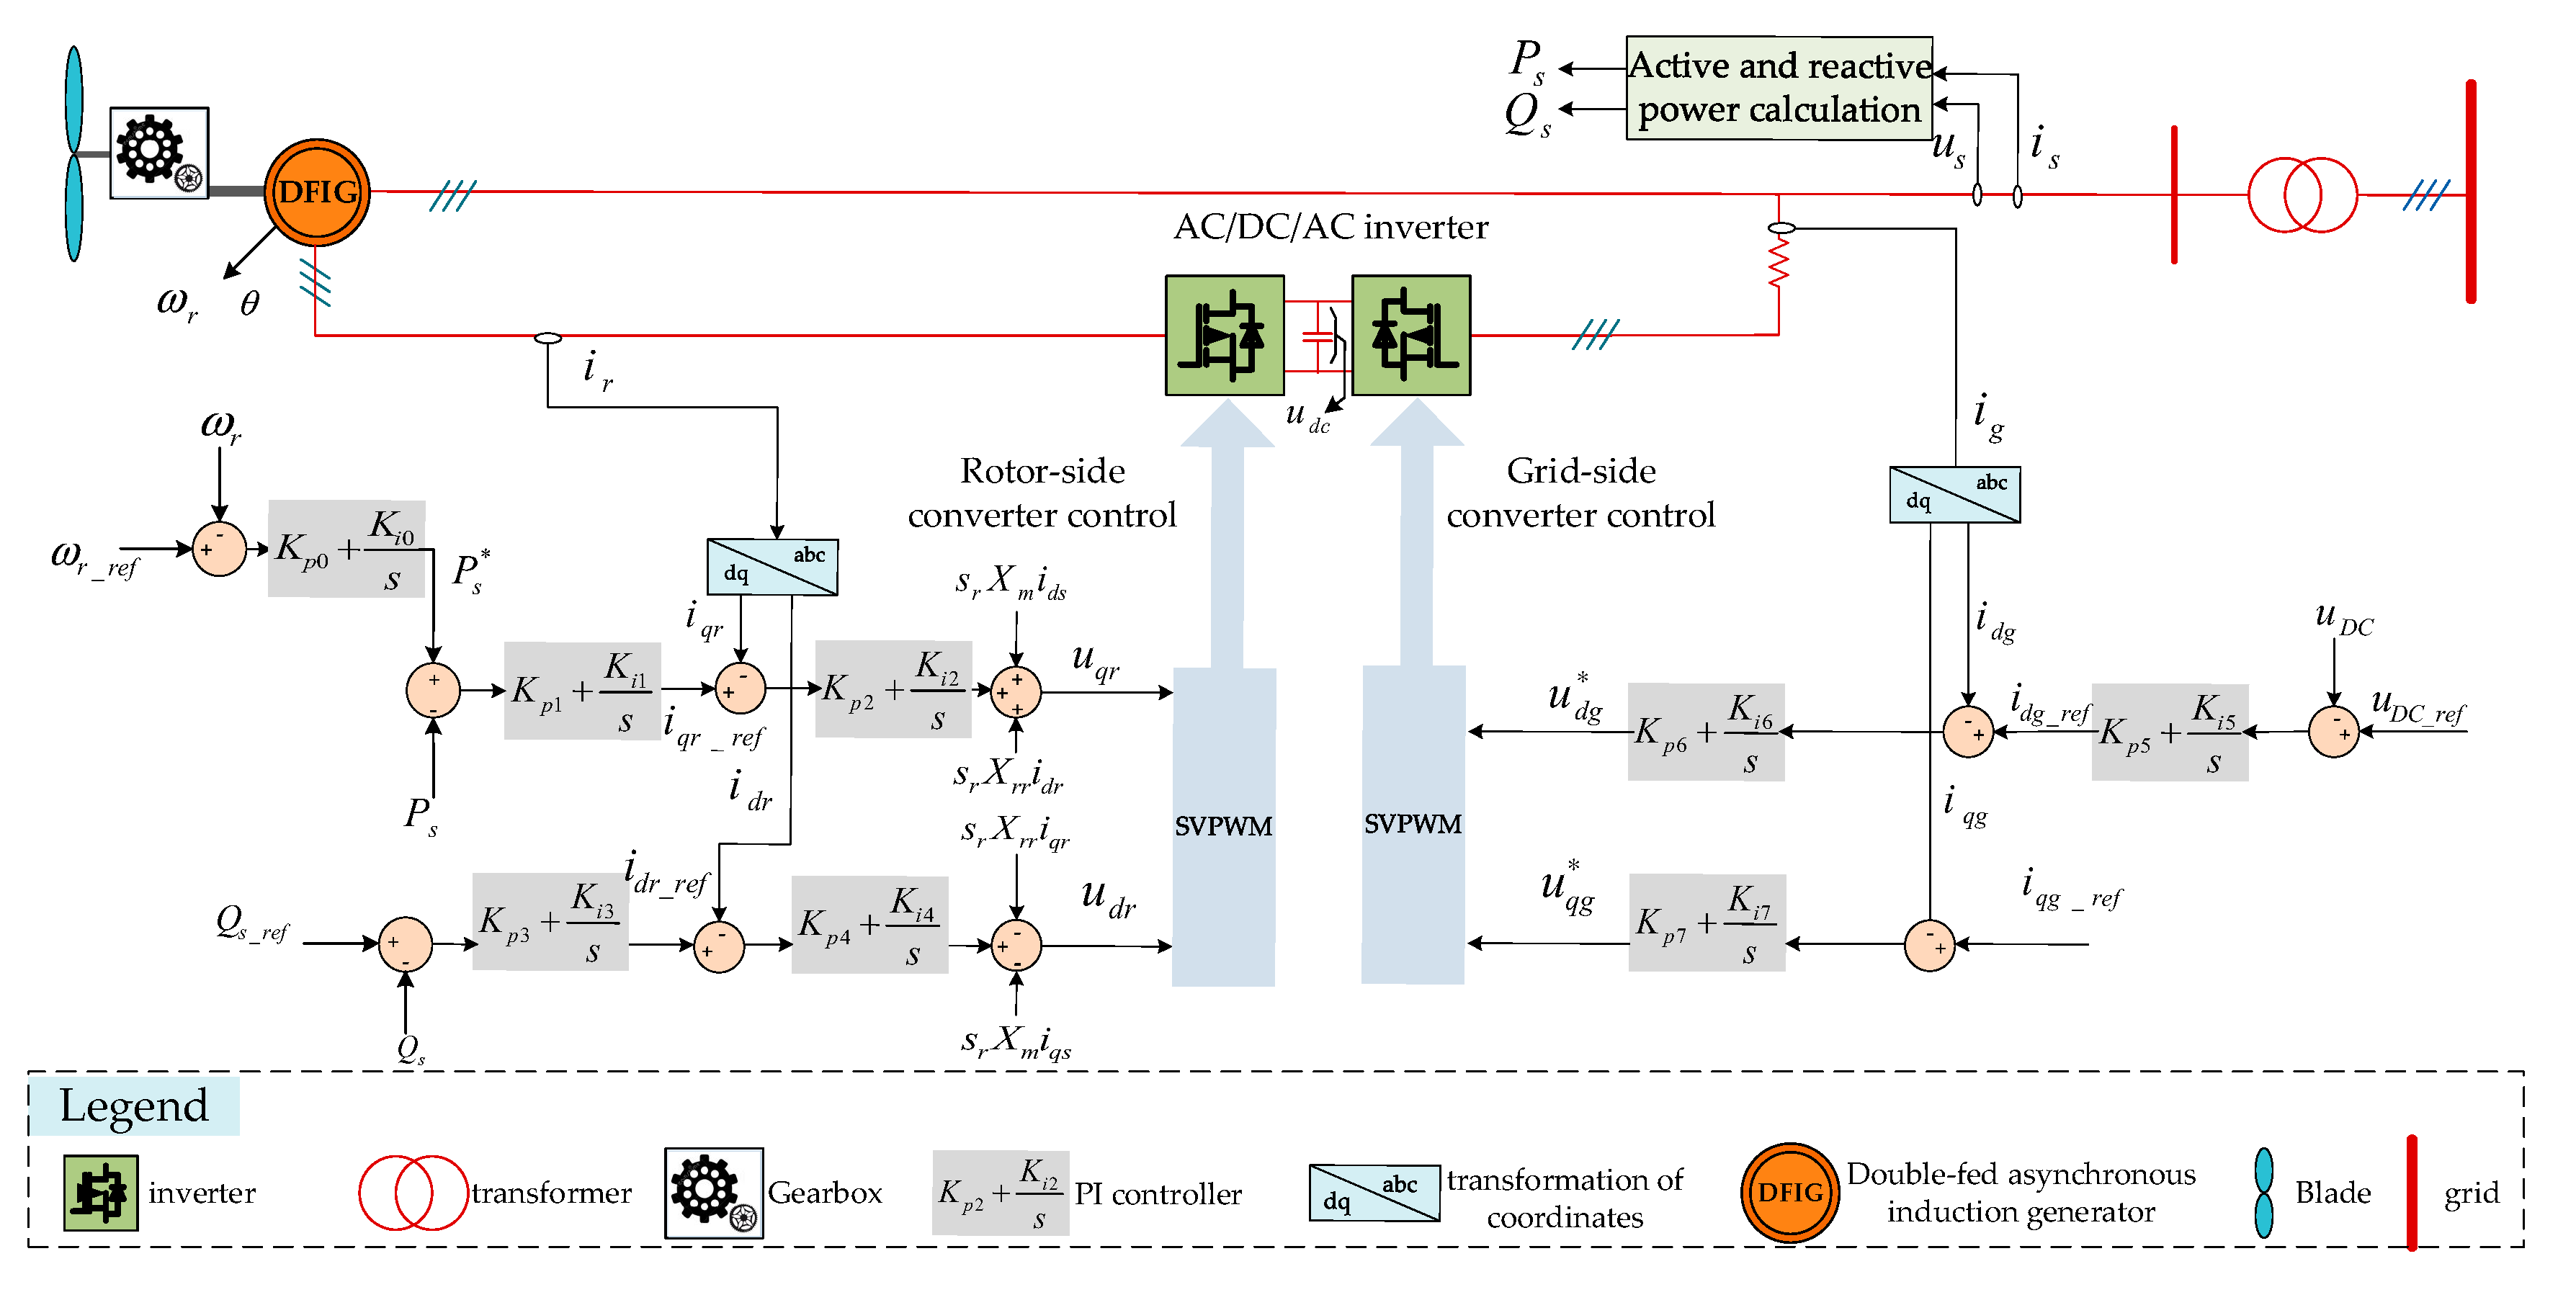
The detailed structure of the grid-connected DFIG system is shown in Figure 1.
Three-mass block model, which is more suitable for dynamic analysis, is applied here. The mechanical rotation system of the DFIG can be divided into three parts namely blade, low-speed shaft and high-speed shaft. The low-speed shaft connects the blades to the gearbox, and the high-speed shaft connects the gearbox to the induction generator unit. In addition, the output of the rotor circuit enters the power grid via the converter device, while the stator circuit is directly connected to the external power grid [8,20].
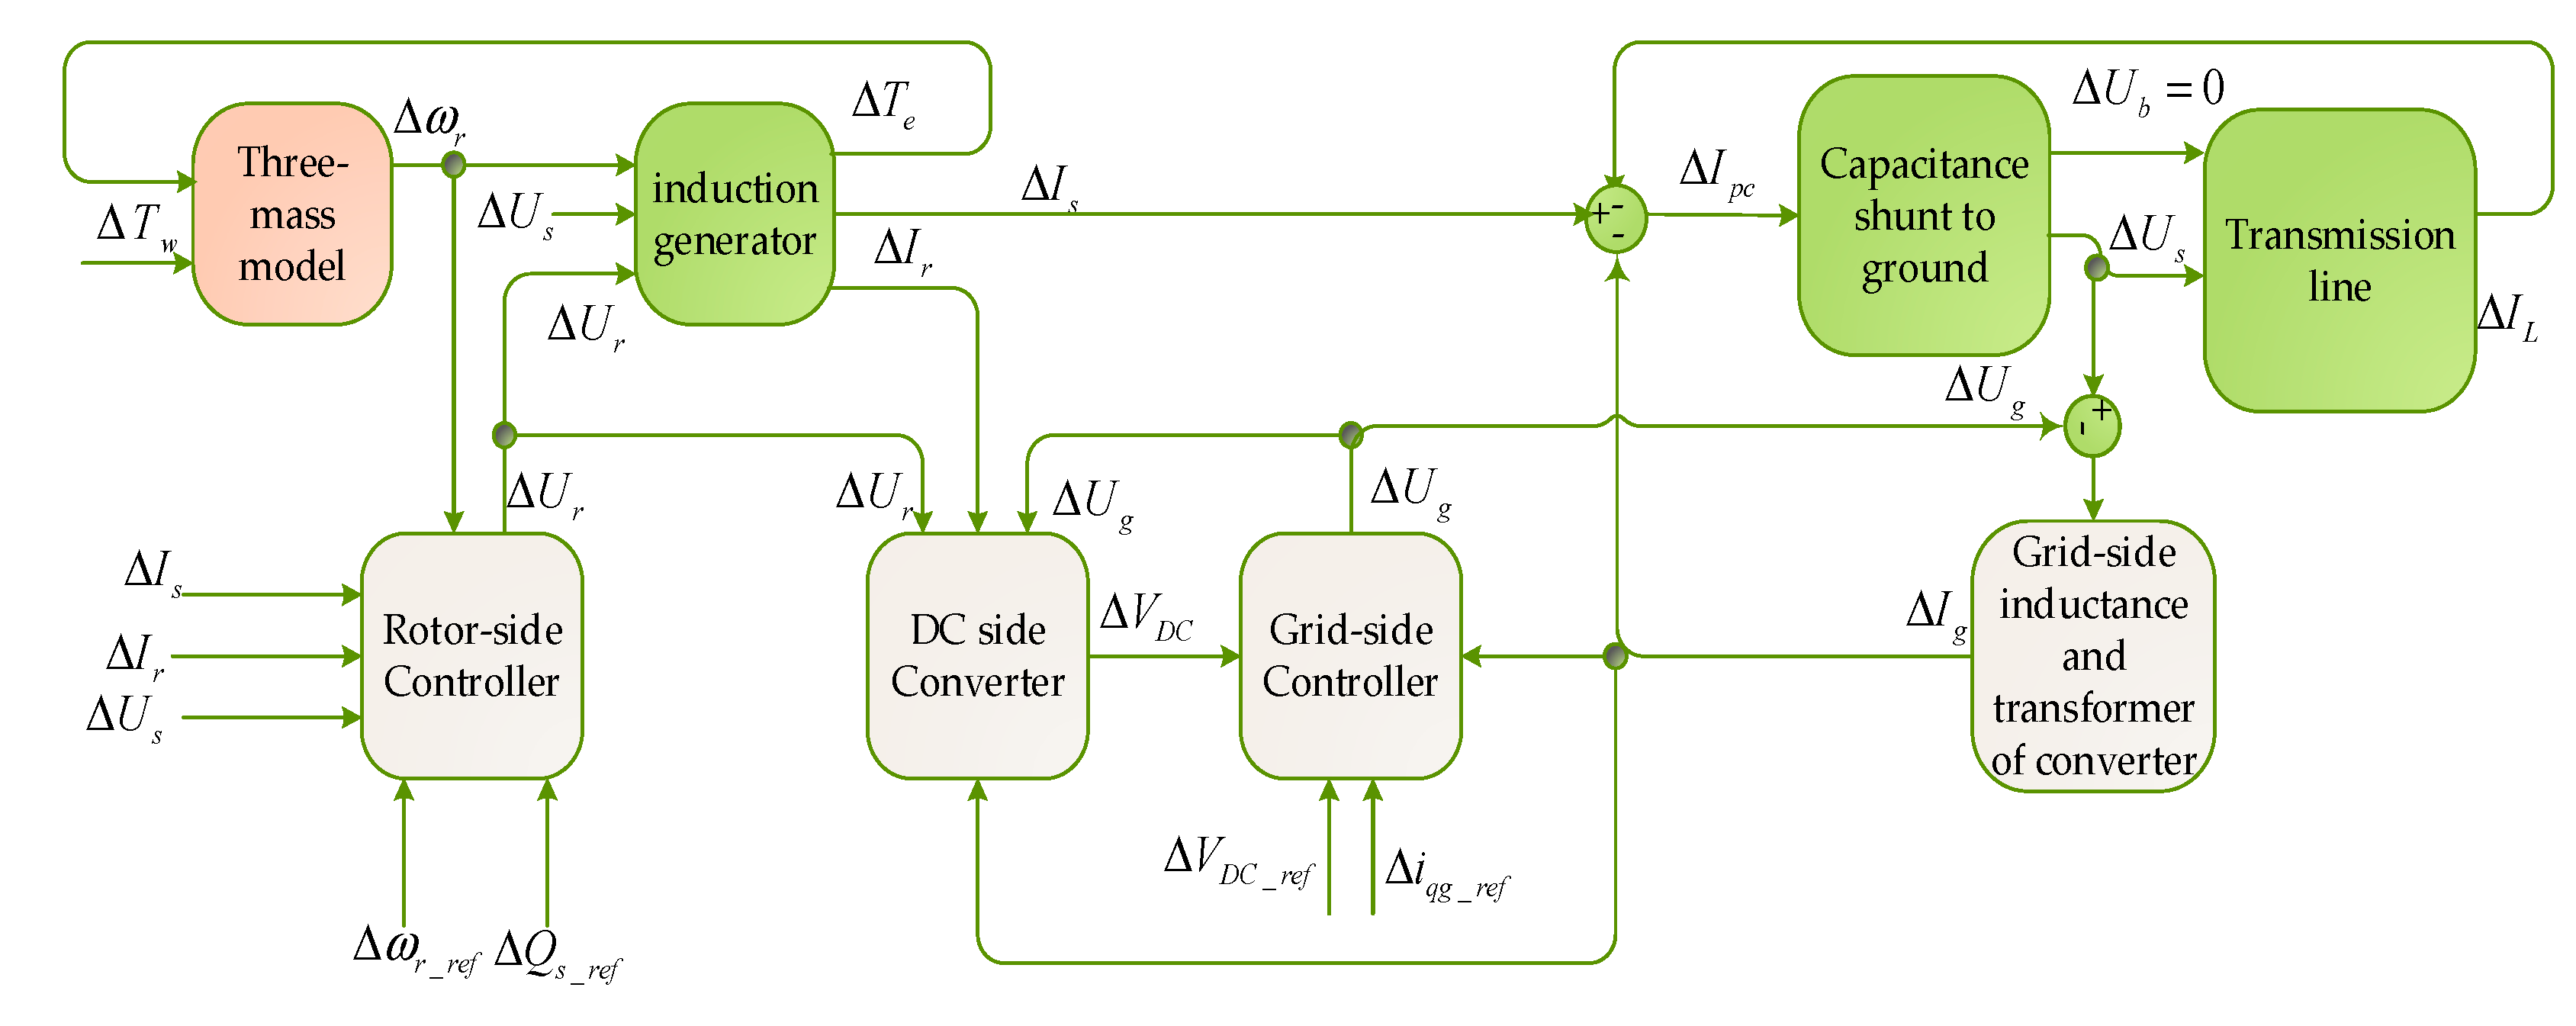
The main objective of the machine-side converter control is to stabilize the active power and machine voltage of DFIG. Vector control is adopted based on stator flux orientation, and the coordinate system of which d-axis and stator flux are coincident is introduced. The active power and voltage are controlled by uqr and udr, respectively. The control goal of the network-side converter is to stabilize the DC side voltage and reactive power. The current component idg and iqg are used to realize the control respectively by the grid-side converter. The rotating coordinate system is consistent with the generator. The symbols of electric parameters do not make a distinction in the coordinate system. The control block diagrams of the machine-side converter and network-side converter are shown in Figure 1. Based on the system structure above, the small-signal model of grid-connected DFIG is shown in Figure 2.
By using the small-signal model, the distribution of the system eigenvalue can be analyzed. The characteristic values corresponding to non-oscillatory form and high-frequency resonance are eliminated to focus on the machine-grid interaction. The characteristic frequency to be reserved is between 0 and 100 Hz. The result is shown in Table 1 [20].
In the analysis below, these mode frequencies will be used as reference values for frequency screening to classify metered data.
2.2. Study of Oscillation Modes Based on Metered Data
2.2.1. Prony Algorithm
For time series generated by interval sampling, Prony algorithm is commonly used for curve fitting with the linear combination of exponent items [10]. Its discretization expression is:
in which:
where, Ai, αi, fi, ϕi (i = 1, 2, …, n) respectively represent the amplitude, attenuation factor, frequency and initial phase Angle of the ith fitting component; p is the component number of fitting functions; n = 1, 2, ..., N − 1, N is the number of fitting points.
The Prony algorithm is a fitting algorithm, and the objective function is the error function shown in (3):
Using the least squares method, the value of the unknown parameter in Equation (1) can be obtained. The original sequence can be decomposed into attenuation components and DC components.
2.2.2. The Oscillation Modes Analysis under Fixed Wind Speed Using the Prony Algorithm
Based on the metered data of the wind generating sets, the output power curve is plotted in Figure 3.
The analysis results of the Prony algorithm are shown in Table 2. The oscillation frequencies higher than 100 Hz are eliminated for exceeding the frequency range between 0 and 100 Hz of machine-grid interactions.
It can be concluded from the above data that the low frequency oscillation, SSCI, SSO, and SSR exist in the process of actual system operation. However, the frequencies obtained by the metered data slightly deviate from the characteristic frequency calculated by the small-signal model. Therefore, frequency filtrating rules are designed in Table 3.
When the oscillation frequency in the Prony analysis result appears in a certain screening range in Table 3, it can be considered that the analyzed object contains the corresponding oscillation mode component.
3. Modeling of the Correlation Analysis of Wind Speed/Voltage Factors and Oscillation Modes
3.1. K-Means Clustering
According to the project observation, the machine-grid interaction of the wind turbine often occurs at low wind speeds. Meanwhile, the voltage change at the PCC point also has the same effect. Thus, the K-Means algorithm is used to find out the influence of both two factors on the oscillation mode by clustering the metered data according to wind speed and voltage. As a result, influence factors in the same cluster have the same characteristics.
The K-Means algorithm is an iterative clustering algorithm. The given data set is divided into the specified k clusters [11]. In the data transformation process, influencing factors include wind speed and three-phase voltage fluctuation. To explore the effects of these whole factors on the oscillation modes, clustering can be done first for the same cluster has the same characteristics and influence on the oscillation modes. When the factors number to be considered is d, the input object is the d-dimensional point set and the output is to assign each point to one cluster. The entire analysis object can be represented by the set C, and one element in C can be expressed as (4):
in which, xij (j = 1, 2, …, d) represents wind speed, three-phase voltage fluctuation and so on. The Euclidean distance between two d-dimensional vectors is shown in (5):
The K-Means algorithm minimizes the total Euclidean distance between each point and the cluster center. In this paper, the optimal cluster number is first selected with fewer sampling data. It is necessary to record the cluster center of the optimal cluster number to be set as the initial cluster center in the later analysis, which ensures the consistency of clustering results.
3.2. Association Rules and the Improved Apriori Algorithm
Assume that set D represents the wind power data set, which is the input data of the correlation analysis. If there is association rule “Cluster1SSTI”, it means that when the influencing factors are clustered in cluster 1, it is very likely that the output power oscillation mode contains “SSTI”. “Cluster1” and “SSTI” are both wind power data item set. The item set is also likely to be the clustering combination like “Cluster1& Cluster2” or oscillation modes like “SSR”.
According to [14,15], for the association rule “Cluster1SSTI”, the support degree “support(Cluster1SSTI)” is the percentage of transactions that “Cluster1” and “SSTI” occurs at the same time to the total transactions, shown in (6):
Confidence coefficient confidence(Cluster1SSTI) is the proportion of appearance of “SSTI” given that “Cluster1” happens, shown in (7):
In transaction set D, the rule satisfying the minimum support condition minsup and the minimum confidence condition minconf is the strong association rule.
In this paper, the time cost of scanning can be reduced because the preceding item is limited in the cluster item-set and the subsequent item is limited in oscillating mode item-set. The first step is to use the hierarchical sequential search method which is the same as the Apriori algorithm.
The difference is that the frequent 1 item-set is searched in the oscillating modes, while from frequent 2 item-set, the search area is reduced to the cluster item-set. The frequent k item-set are then used to generate frequent (k + 1) item-set. The circulation is done until the new frequent sets cannot be found. When producing frequent k item-set, Apriori mainly accomplishes two tasks, connecting and cutting. The connection process happens when a candidate item-set is generated by connecting the frequent k − 1 item-sets. The cutting process is to get rid of nonfrequent item-set according to the minimum support threshold. Thus, the frequent k item-set is obtained.
Due to the limitation in the first step, the frequent item set contains only one oscillation mode as consequent denoted by q. After all the frequent item-sets are found, the second step is to generate association rules by corresponding the different subset pji (i = 1, 2, ..., n) of frequent preceding item-set pj (j = 1, 2, ... m) with q exclusive to different subsequent item-set qj, and then calculating the confidence level by (8):
when the inequality is satisfied, the rule “”can be output. The improved algorithm flow is shown in Figure 4. To show the advantages of the Improved algorithm more clearly, comparison tabulation between ‘Improved Apriori Algorithm’ and ‘Apriori algorithm’ is given by Table 4.
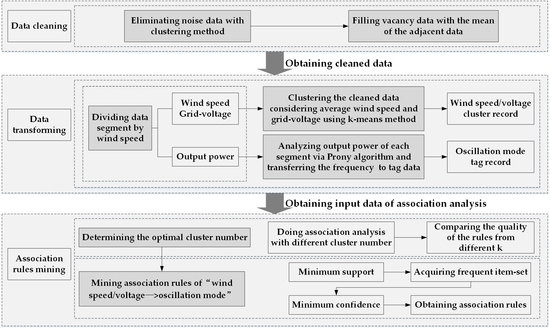
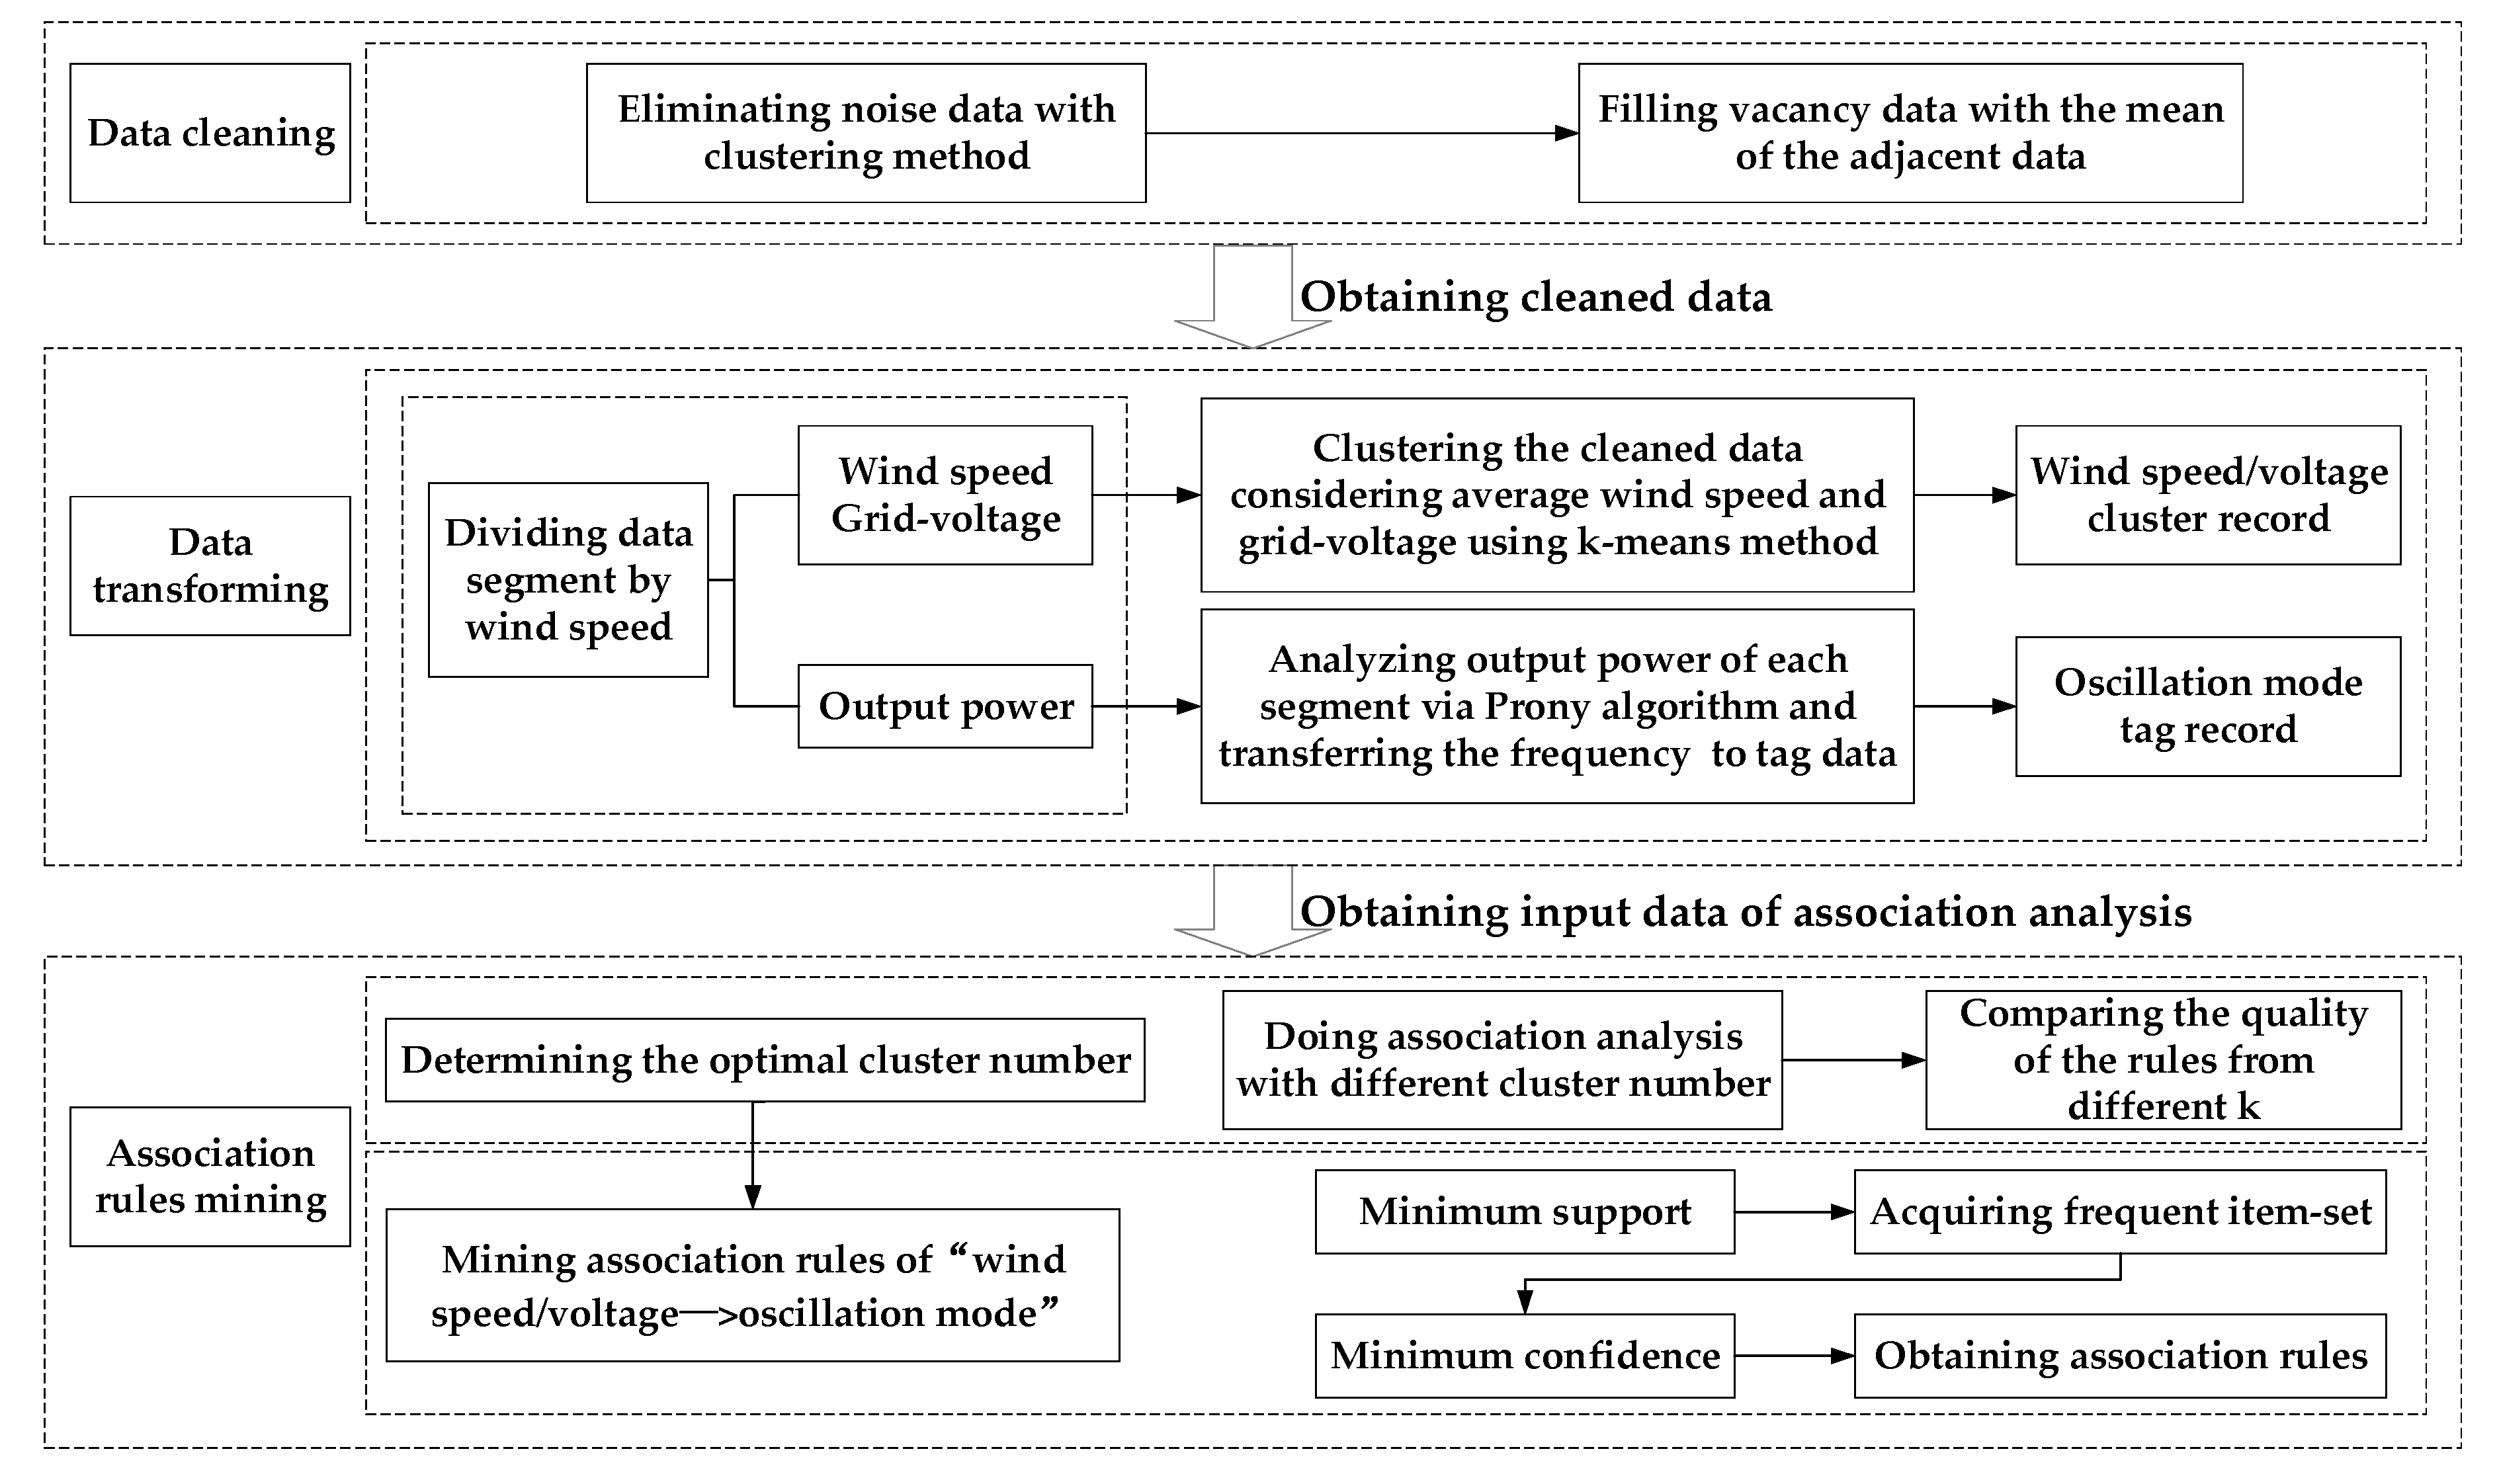
3.3. Modeling of the Correlation Analysis
Based on the algorithm above, the correlation analysis model of wind speed/voltage fluctuation clusters and oscillation modes is established. The modeling process is shown in Figure 5.
In this paper, the data wind generating sets of is based on the sampling frequency of 4000 Hz, including wind speed, grid-connected voltage and current information.
Firstly, the raw data is cleaned, and then the original data is clustered by K-Means cluster algorithm to find out and eliminate the noise data. Then, the mean of the data before and after the vacant is used to fill the empty data.
To study the influence of wind speed and voltage on the oscillation modes of wind generating sets, the preprocessed data was firstly divided into segments according to the wind speed, and the sectional flow chart is shown in Figure 6.
Original data is read and written into a data segment according to wind speed value in sampling sequence. When wind speed change rate is more than 0.05 m/s, a new data segment is built and used to record the subsequent data. This circulation is done until the final data segment is obtained. The sampling point of each data segment is approximately 4000. The sampling data in the same data segment is analyzed. Records can be extracted from each data segment time sequence, and act as the input of correlation analysis. After the data is segmented according to wind speed, the mean of wind speed in each segment is recorded in the corresponding record.
The voltage effective value is calculated according to the sliding window principle. The influence of voltage fluctuation on the power oscillation modes is required to be observed, so in each data segment, the difference between the maximum and the minimum of the three phase rms voltage is used as the indicator of the voltage fluctuations is shown in (9). Total voltage fluctuation takes the average of three phase fluctuations as is shown in (10):
Thus, each data segment record stores a wind speed value, three phase voltage fluctuation indicators, and a total voltage fluctuation value. In order to study the combined effects of these factors, the data segments studied were clustered according to wind speed, , , , and . The clustering results are recorded in are the corresponding data segment. When k = 6, if a data segment is clustered in cluster 1, the cluster tag of this data segment is [cluster 1, cluster 2, cluster 3, cluster 4, cluster 5, cluster 6] = [1, 0, 0, 0, 0, 0].
Meanwhile, Prony analysis is performed on each data segment. The mode analysis results of the small-signal model in the second part are used to filtrate oscillation frequency within a certain error range and the filtering rules are shown in Table 3.
The oscillation mode tag data and the cluster tag data are summarized to be the input data of correlation analysis. Then the association rules can be analyzed. Finally, the association rules can be obtained.
4. Correlation Analysis between Wind Speed/Voltage Cluster and Oscillation Modes of Wind Generating Sets
In this part, 807 data segments are chosen to be the sampling segments to select an optimal clustering number. Association results using different k values are compared first and the optimal one is chosen for further analysis.
4.1. Influence of Cluster Number k on Correlation Analysis Result
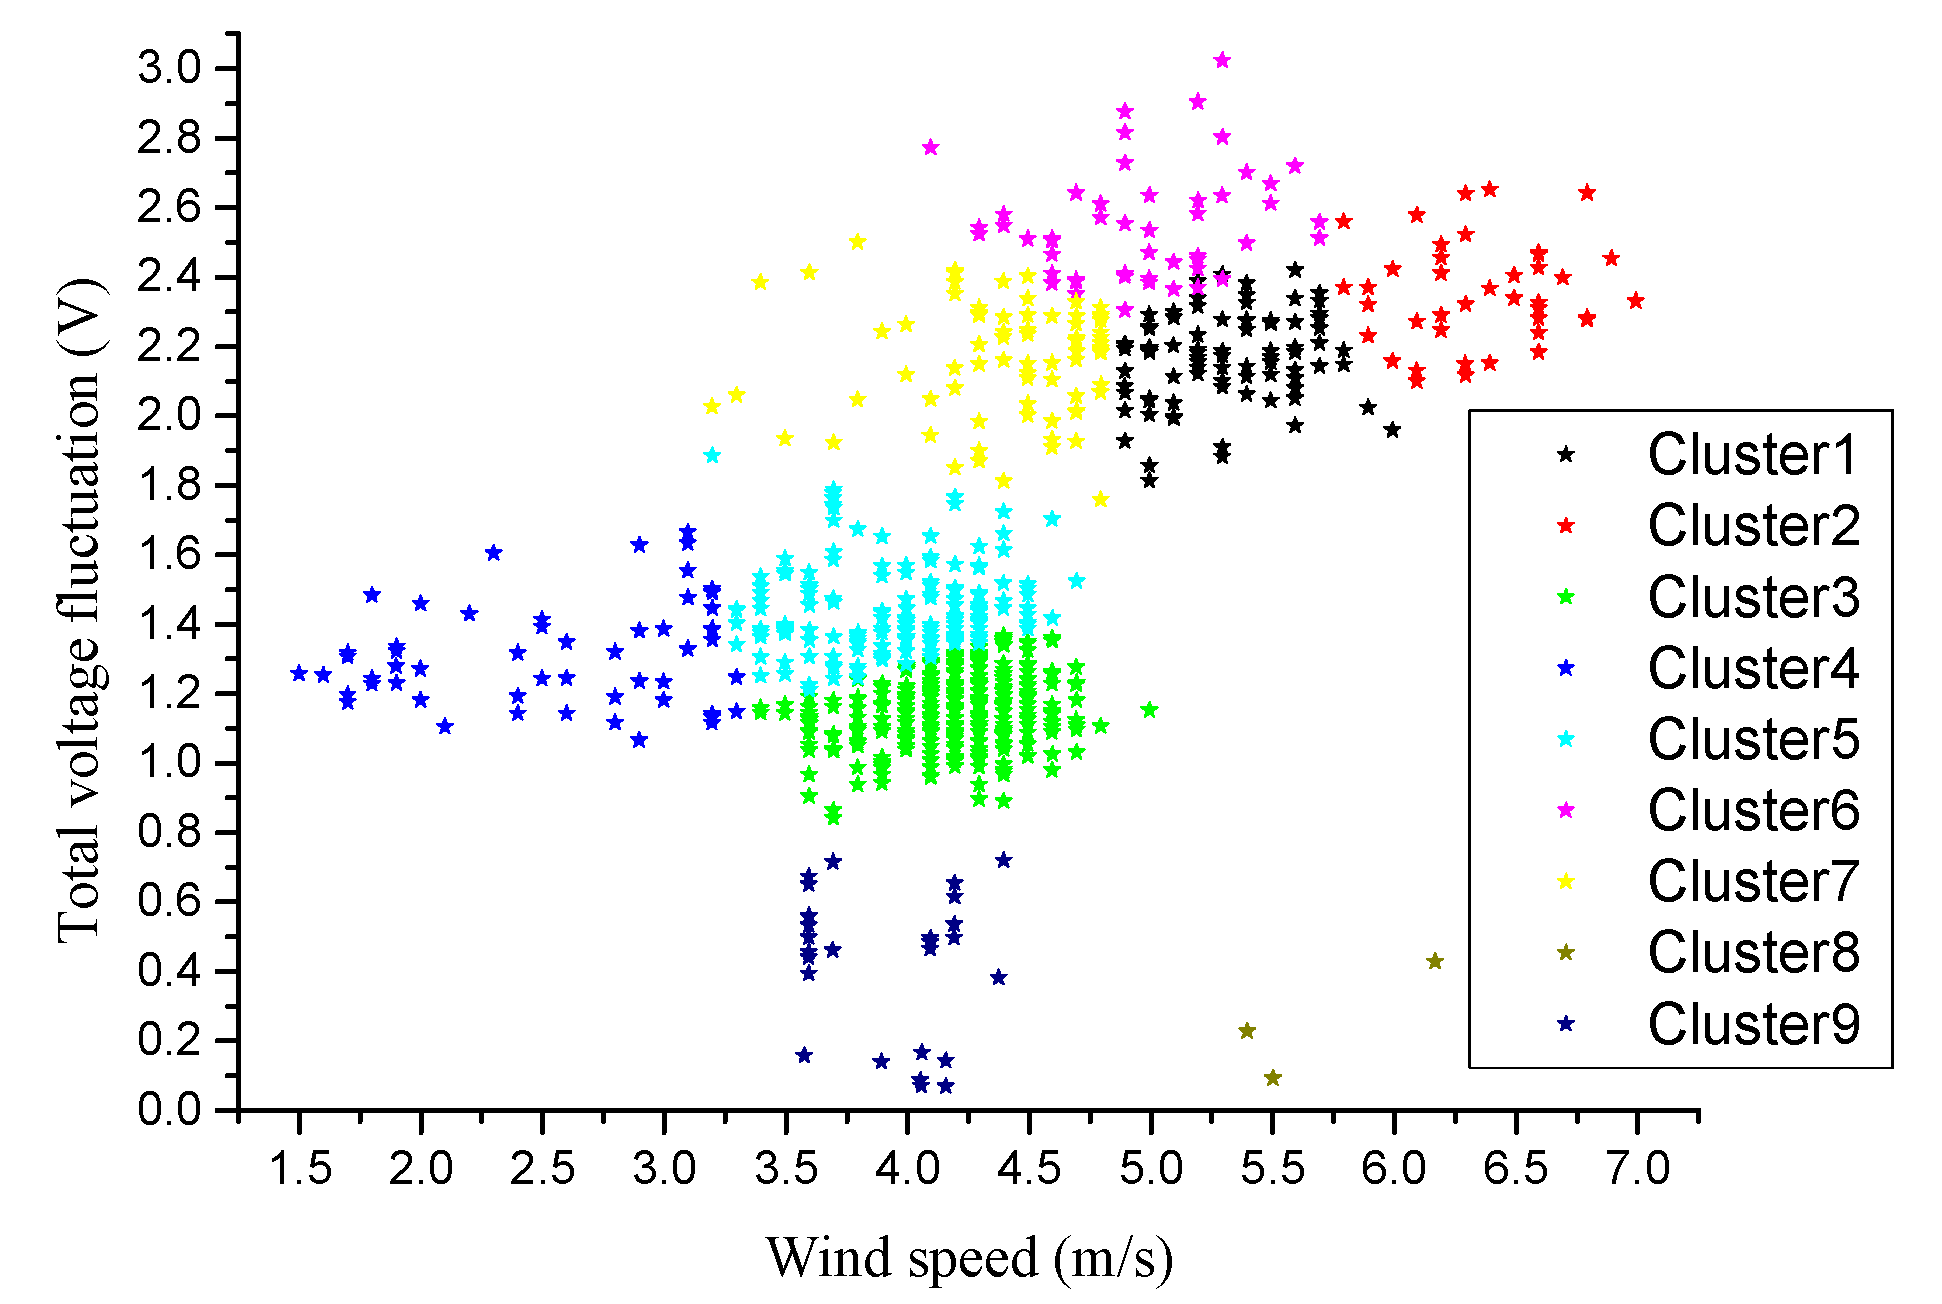
807 data segments are used as a sample to seek the optimal k value. The data segments are clustered by different k values namely k = 6, k = 8, and k = 10. The clustering results are shown in Figure 7 below.
When k = 6, it can be seen from Figure 7a that the 807 5-dimensional data points are divided into six clusters. Cluster 1 is the black data point set in the graph, which has the characteristics of 3~5 m/s wind speed and 1.7~2.5 V total voltage fluctuation. Cluster 2 is the red data point set in the figure, which has the characteristics of more than 3.5 m/s wind speed and 0~0.8 V voltage fluctuation. Cluster 3 is the green data point set in the graph. This cluster has the characteristics of wind speed greater than 5 m/s and the voltage fluctuation greater than 2 V. Cluster 4 is the dark blue data point set in the picture, and it is also the most abundant cluster and is the state that occurs most often. The wind speed of cluster 4 is 3.5~4.5 m/s, and the voltage fluctuation is normal 1~1.7 V. Cluster 5 is the light blue data point set in the figure. The wind speed of the cluster is less than 3.5 m/s and the voltage fluctuation is between 1~1.7 V. Cluster 6 is the red data point set in the graph. The cluster has the characteristics of voltage fluctuation greater than 2.2 V and wind speed of 4~5.5 m/s. Therefore, after clustering, data points with the same characteristics of wind speed and voltage fluctuation are clustered into the same cluster.
When k = 8, as shown in Figure 7b, clusters 1, 3, and 6 in Figure 7a are subdivided into 4 clusters. The cluster 4 and 5 in Figure 7a are subdivided into three clusters. And when k = 10, as is shown in Figure 7c, the cluster 2 in Figure 7b is further subdivided into two clusters, clusters 2 and cluster 3 respectively. There are only three points in cluster 3, and the voltage fluctuation is less than 0.4 V, which can be considered as the abnormal data point. These points are filtered out and ignored in subsequent correlation analysis under minimal support condition. In addition, the cluster 9 in Figure 7b is further subdivided into clusters 8 and 9 in Figure 7c, and the range of cluster 8 and 9 is intersected. The wind speed, three-phase voltage fluctuation and total voltage fluctuation are considered in the clustering, but the subdivision is not necessary in terms of the total voltage fluctuation and wind speed. Therefore, nine clusters scene is likely to be the best case from the clustering result. The data is clustered again with k = 9 and the clustering results are shown in Figure 8.
To further determine the optimal cluster number, a new comparison is made by comparing the correlation analysis results of different k values namely k = 8, k = 9 and k = 10.
4.1.1. The Same Data Segment Correspondence
To study the effect of wind speed and voltage fluctuation on the oscillation frequency in the same data segment, the cluster tag data is set as input and the oscillation mode tag in the same data segment is the target. Different clustering numbers namely k = 8, k = 9 and k = 10 achieve different association rules as is shown in Table 5.
The threshold is adjusted so that the associated rules of output will have higher confidence and support. The support value should not be set too large, or it will result in missing some strong association rules. Therefore, a small support threshold is set at first, and the output rules are sorted by confidence level. The rules with high confidence level are selected and the lowest support value among them is chosen as the support threshold. And the confidence threshold can be set as the minimum confidence value among the selected rules. After the adjusting, the minsup is set as 4, and minconf is 30. For comparison convenience, the main parameters of the rules with different k are presented in Table 6, including the number of rules, minimum support and confidence, maximum support and confidence, mean percentage of support and confidence, the standard deviation percentage of support and confidence, and so on.
From the view of the rule number, both k = 8 and k = 9 can produce 12 rules, involving the relationship between multiple frequency components and speed as well as voltage. When the cluster number is 10, there are only five rules, and these five rules only involve three frequency components. Therefore, k = 10 is excluded. Then k = 8 and k = 9 are compared. From the perspective of the support level, their statistical indicators are very close, and their standard deviations are large too which means both of them are not centralized. From the point of confidence level, compared with k = 8, k = 9 has smaller minimum confidence, almost the same maximum confidence and a larger standard deviation. This indicates that considering rules with a confidence level, k = 9 has a higher confidence level than k = 8. Hence, k = 9 brings higher quality association rules.
4.1.2. The Adjacent Data Segments Correspondence (for Prediction)
When studying the factor influence of the previous data segment on the oscillation mode of the next data segment, the target data becomes the oscillation modes in the next segment. Input data is still the cluster tag. Like the analysis of the same segment, correlation analysis is done under different clustering numbers, namely k = 8, k = 9 and k = 10. After adjusting, the minsup is set as 6, and the minconf is 29. Results are shown in Table 7.
The same comparison is given in Table 8.
From the view of rule number, k = 10 produces the least number of rules and can be excluded; k = 8 can generate 16 rules, where the first three rules both have the previous item with two Clusters; k = 9 produces 13 association rules, less than k = 8, and the statistics of the rule confidence are all less than k = 8. Therefore, in the adjacent segment analysis, k = 8 brings higher quality association rules.
4.2. Association Rule Analysis of Wind Speed/Voltage Cluster And Oscillation Modes
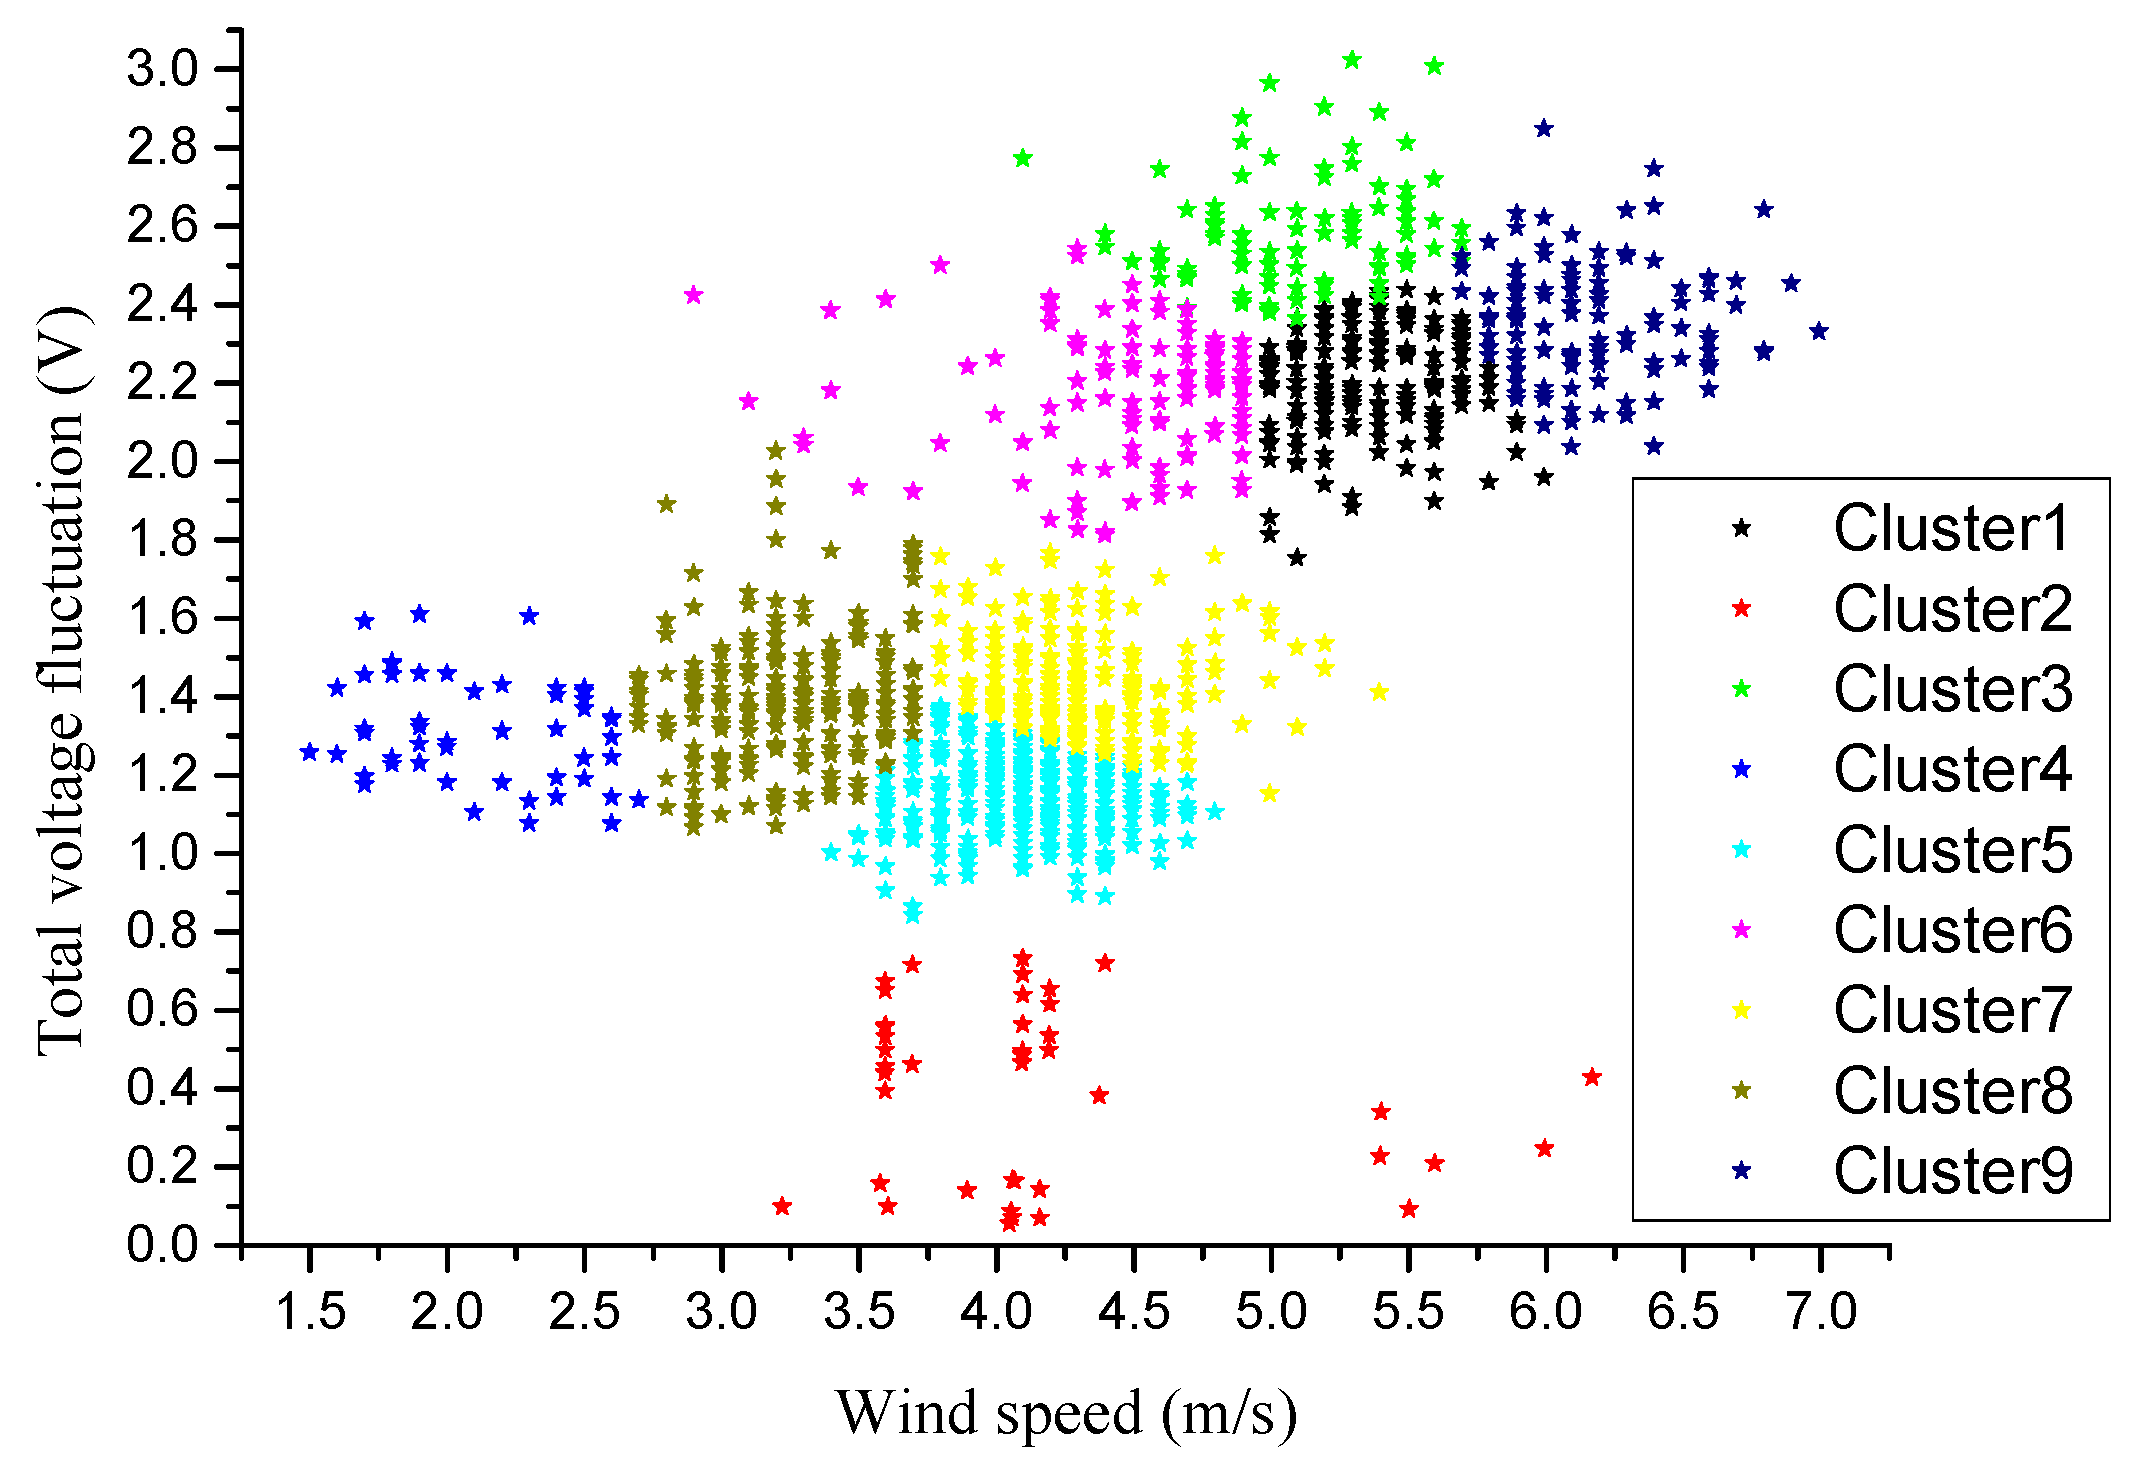
Further analysis of the association rules between wind speed/voltage clusters and oscillation modes of wind generating sets is carried out with 1500 data segments. According to the analysis in Section Section 4.1.1, k = 9 is taken. The clustering results are shown in Figure 9.
The clustering result is basically consistent with 807 points. The cluster center parameters of these nine clusters are shown in Table 9. The clustering center will affect the result of clustering. In the subsequent analysis with more data segments, the initial values of the cluster center should be set consistently to achieve the same clustering effect.
The clustering results are transformed into tag data, and the final association input data is obtained. After the Apriori correlation analysis, the association rules are achieved and are shown in Table 10.
As Table 10 indicates, the association rules are mainly concentrated in the three modes: 45.37 Hz, 23 Hz and 12.41 Hz. In the correlation analysis results, there is no association rule of 1.92 Hz, 79 Hz and 4.37 Hz. It shows that in the output power of the wind generating sets, the oscillation components of these three frequencies occupy less.
Among the 14 association rules, rule “cluster 945.37 Hz” has the maximum confidence level which is 41.67%. According to the clustering results, the “cluster 9” has the characteristics of 5.5~6.75 m/s wind speed and 2.0~2.6 V voltage fluctuation. This rule indicates that the wind speed and voltage fluctuation cluster will rapidly cause the 45.37 Hz frequency component, and the probability of occurrence is over 40%. The confidence level of the rule “cluster 312.41 Hz” ranks the second, 41.11%. The clustering results show that the “cluster 3” has the characteristics of high voltage fluctuation and 4~5.75 m/s wind speed. The rule states that such a combination will quickly lead to a 12.41 Hz frequency component, and the probability of occurrence is over 40%. The confidence level of the rule “cluster 845.37 Hz” also reaches over 40%. According to the clustering results, the “cluster 8” has the characteristics of 1~1.8 m/s voltage fluctuation and the 2.5~3.5m/s wind speed. The rule states that such a combination will quickly cause the 45.37 Hz frequency component, and the probability of occurrence is up to 40%. Meanwhile, the rules with anterior “cluster 4” with the characteristics of the wind speed less than 2.5 m/s, voltage fluctuation among 1~1.6 m/s never show up in the result.
4.3. Prediction of Oscillation Mode Based on the Apriori Algorithm
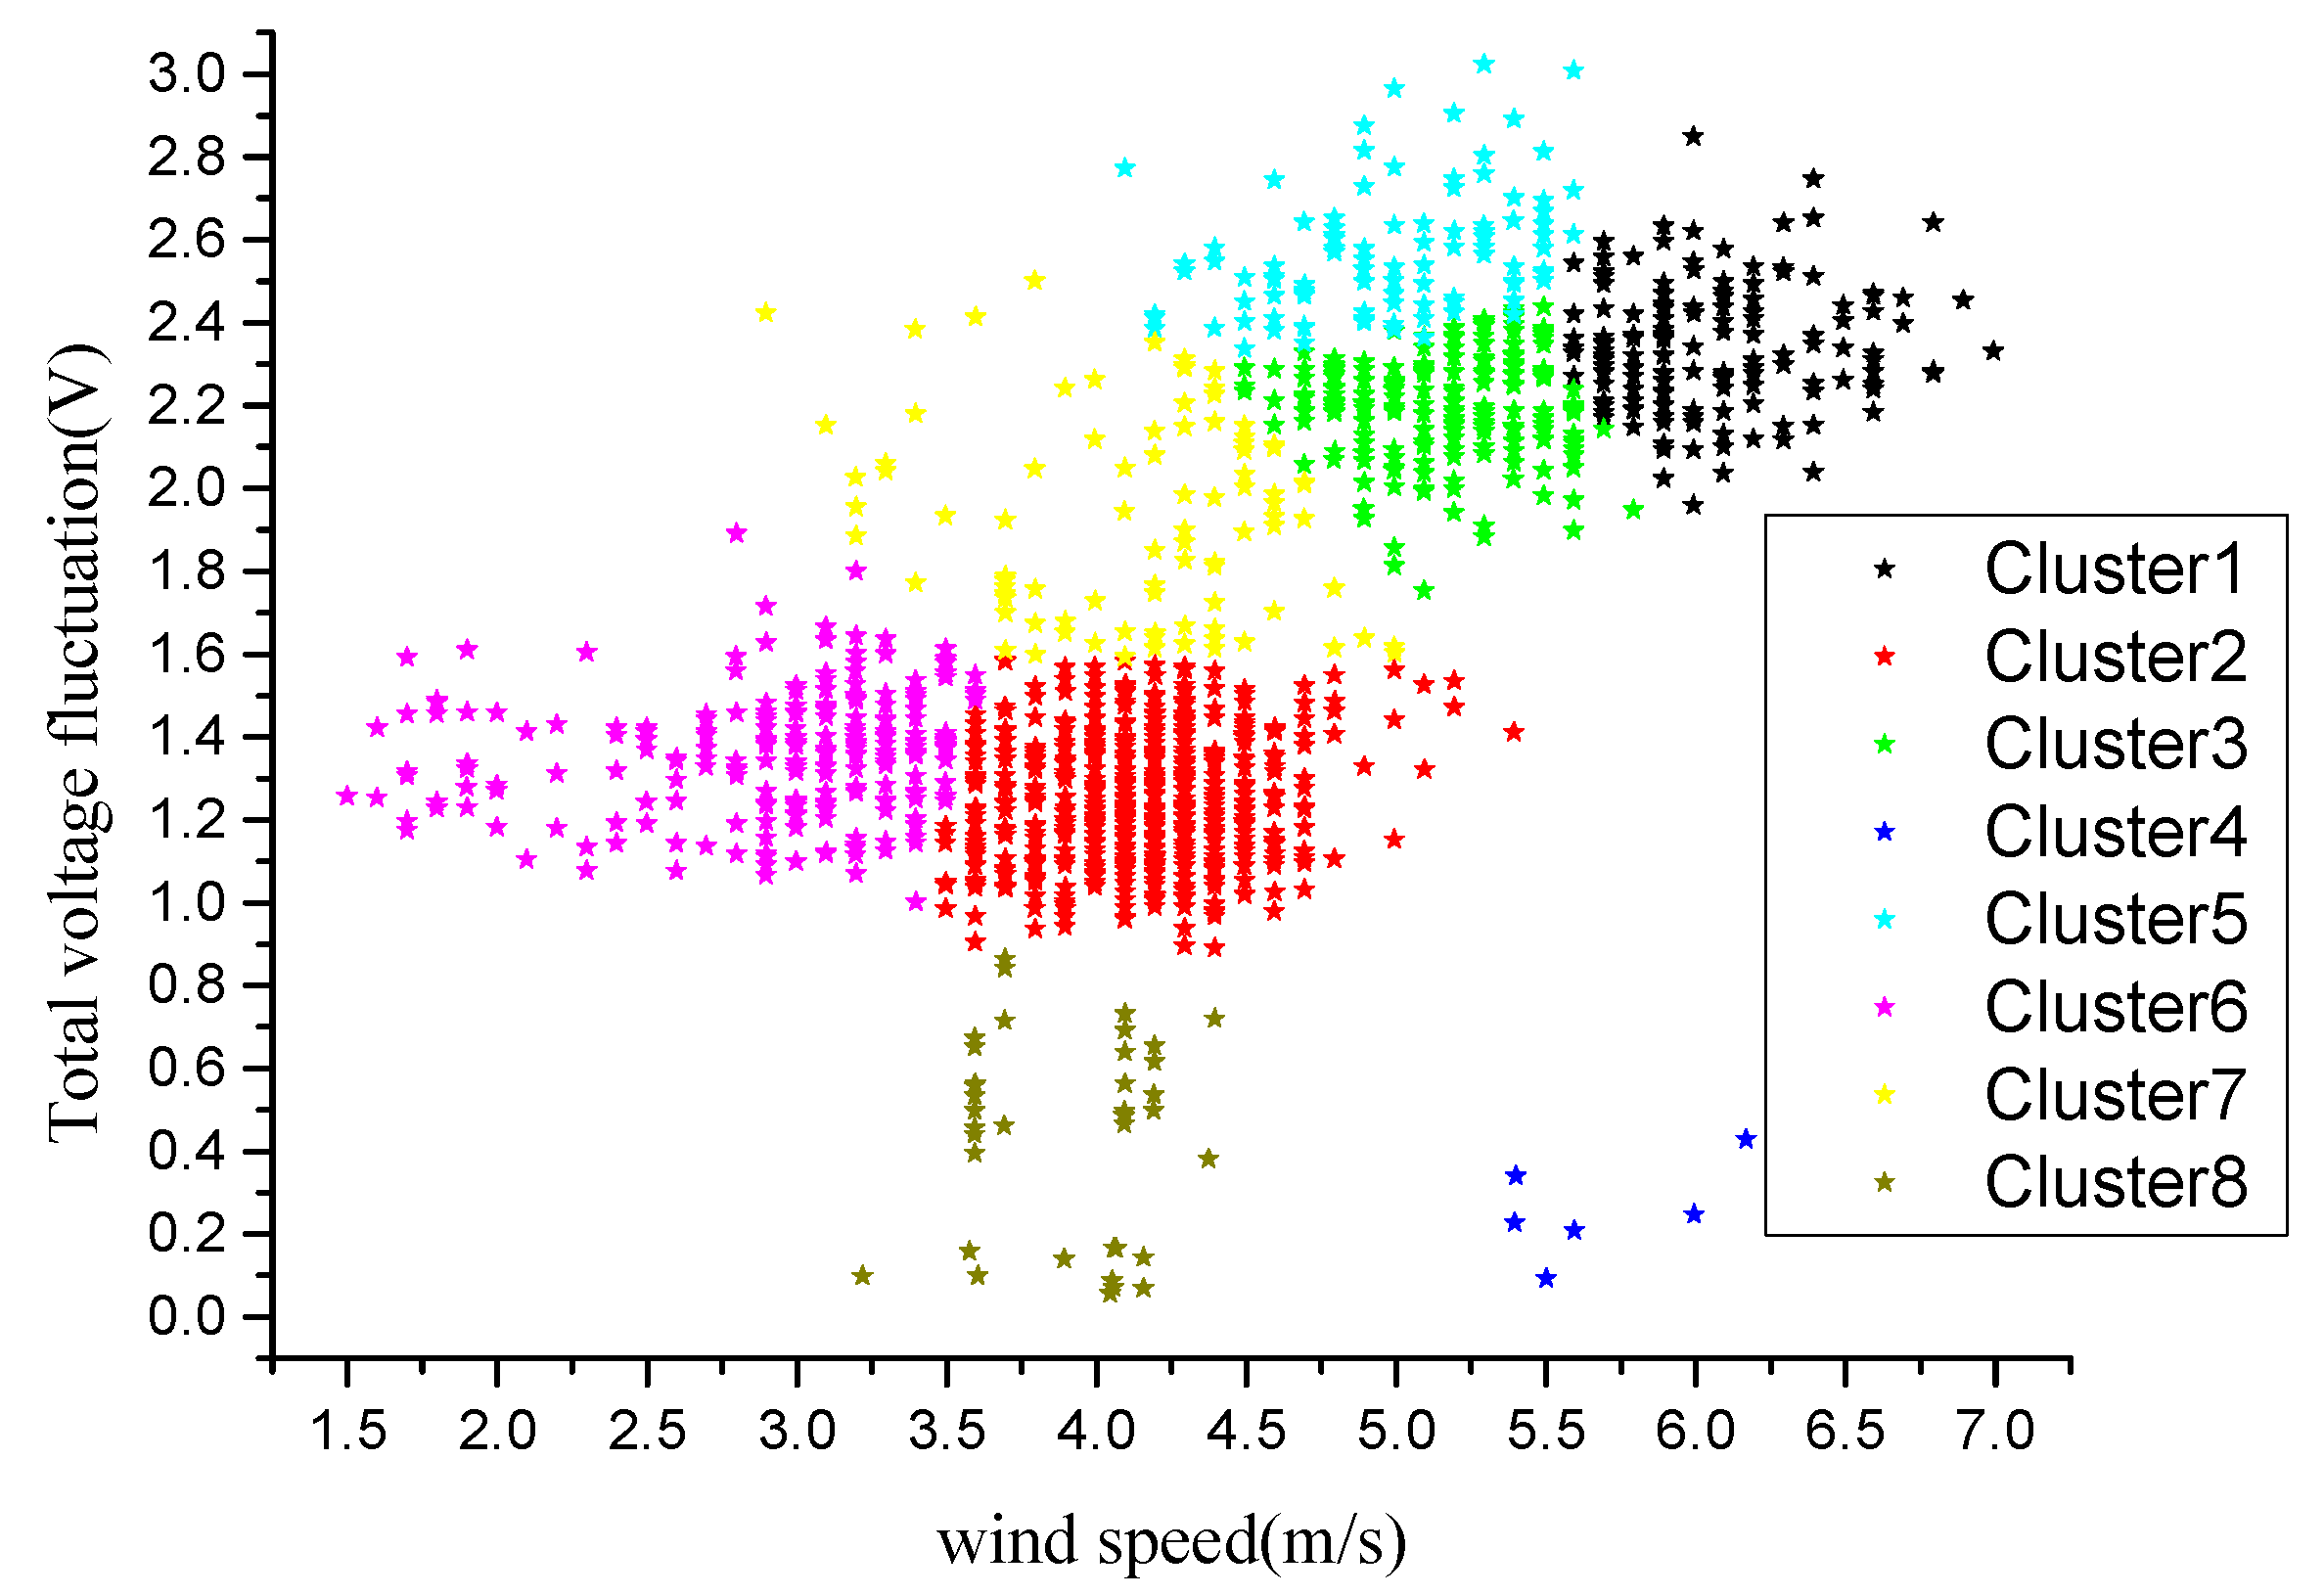
To predict the oscillation mode, input becomes the combination of the clustering tag data in the previous data segment corresponding to the oscillation frequency tag segment in the next. 1500 data segments are taken for analysis. According to the above analysis in 4.1.2, k is given the value of 8, and the clustering result is shown in Figure 10.
The clustering result is consistent with 807 points. Among all the clusters, cluster 2 is the largest and cluster 4 is the smallest, which is different from the result in part A above because different cluster centers are selected. When cluster centers are chosen like Figure 10, the elements of cluster 4 can be considered as outliers and will be ignored by the minimum support condition in the correlation analysis.
The cluster center parameters of these 8 clusters are shown in Table 11. In this part, the cluster center will affect the result of the cluster which means it also affects the final mode judgment. Therefore, when the association rules are applied to oscillation mode prediction, initial values of the cluster center must be consistent with the training condition to achieve the same clustering effect.
The clustering result is tag-converted to obtain the final associated input data. After correlation analysis, the association rules are shown in Table 12.
From the results in Table 12, the wind speed and voltage fluctuation of the previous data segment mainly affect partial oscillation modes of the next data segment, including 45.37 Hz, 23 Hz, and 12.41 Hz. As the same with the result in the same data segment analysis, the wind speed and voltage fluctuation of the previous data segment are irrespective with mode 1.92 Hz, 79 Hz, and 4.37 Hz of the next data segment. Different from the same data segment analysis result, the association between the wind speed and voltage of the previous data segment and the low-frequency oscillation mode of the next data segment is weakened, indicating that the two factors have less influence on the low-frequency oscillation mode of the next data segment.
The support degree is related to the number of clusters, so we use it only as a threshold for rule screening. The analysis of rules mainly depends on the confidence level. Among all the rules, rule “cluster 845.37 Hz” has the highest confidence level of 41.5%.
As can be seen from Figure 10, the wind speed of the cluster 8 is between 3.2 m/s and 4.5 m/s, and the voltage fluctuation is low. Meanwhile, the mode 45.37 Hz is a SSCI mode, which means the controller acts to stable the output power but at the same time interacts with the fixed series compensation, resulting in the SSCI mode in the next data segment.
Then, 200 data segments are selected to predict the three modes of 45.37 Hz, 23 Hz, and 12.41 Hz. These 200 points are clustered in the same cluster center of Table 10. Most of these points belong to clusters 2, 3, 6, and 7. Rules 4, 5, 6 and 9, 10, 11 can be extracted from Table 11 as the oscillation mode prediction result, namely “cluster 645.37 Hz”, “cluster 623 Hz”, “clustering” 723Hz”, “cluster 712.41Hz”, “cluster 323Hz”, “cluster 745.37 Hz”. The confidence levels of these six rules are taken as the predicted value, which means that when the previous item occurs, the occurrence probability of the latter item is the corresponding confidence value. Prony analysis is performed on the actual power curve of the 200 data segments to obtain the actual oscillation modes. The actual value is the segment number percentage. Statistical prediction errors are obtained in Table 13.
Figure 11 is a line graph comparing the confidence level of predicted results and practical results.
From the prediction results, the maximum confidence level error between the predicted value and the actual value does not exceed 8%, and the association rules related to the clustering results of 200 predicted data segments are all confirmed, indicating that prediction rules obtained by training 1500 data segments are already highly credible. Among them, the rule “cluster 645.37 Hz” has the smallest error, which means the probability that the wind speed/voltage combination of cluster 6 induces the 45.37 Hz mode is very close to 0.3391; the rule “cluster 745.37 Hz” has the largest error, indicating that the probability that the wind speed/voltage combination of the cluster 7 induces the 45.37 Hz mode is around 0.2952. The prediction and actual confidence percentage here are statistical values. As the sample size increases, the statistical value will be close to the probability value, and the prediction result will have higher credibility.
5. Conclusions
In this paper, association analyzing model of correlation between wind speed/voltage fluctuation clusters and oscillation modes is established. The traditional power signal processing method is combined with a data mining algorithm to mine association rules between the oscillation modes and main influencing factors, using metered data of wind generating sets. The conclusions are as follows.
- The association rules between clusters and oscillation modes can be obtained by analyzing the metered data via improved Apriori algorithm. The rules are denoted by “Wind speed/voltage fluctuation clusteringoscillation mode”. The higher the confidence level of an association rule is, the greater the probability of corresponding oscillation modes occurrence is.
- In association rule analysis, support level does not need to be set too high. Low support and high confidence can reflect the strong correlation between a cluster and the corresponding mode. Even when the cluster contains few elements, it is also easy to cause the corresponding oscillation mode in the power.
- Wind speed/voltage fluctuation cluster number has a great influence on association rules. Optimal cluster number corresponds to highest support and confidence level. The results of correlation analysis show that different clusters can lead to different oscillation components, and large voltage fluctuation may quickly induce SSCI component in power.
- The association rule of adjacent data segments can be used to predict the oscillating mode of the wind generating sets. The error between the prediction result and the actual situation is small, indicating that the confidence level is very close to the probability value. As the sample capacity increases, the statistical value will be close to the probability value, and the prediction result will be more credible.
Based on the result, it is possible to directly judge whether there is an oscillation mode under the corresponding conditions directly from the clustering category of voltage fluctuation and wind speed, which provides convenience for the monitor of the wind farm. Besides, the proposed correlation analysis model is also universal and can also be used to analyze oscillation problems of other systems, or harmonic problems, which means the model has a certain reference value for the scientific community too.
Author Contributions
Conceptualization, J.M. and D.X.; Methodology, J.M. and D.X.; Software, J.M.; Validation, D.X., C.G. and X.W.; Formal Analysis, J.M.; Investigation, J.M.; Resources, D.X. and X.W.; Data Curation, J.M.; Writing-Original Draft Preparation, J.M.; Writing-Review & Editing, J.M.; Visualization, J.M.; Supervision, D.X., C.G. and X.W.; Project Administration, D.X.; Funding Acquisition, D.X. and X.W.
Acknowledgments
This work was supported in part by the National Natural Science Foundation of China (51677114) & State Grid project (SGTYHT/16-JS-198).
Conflicts of Interest
The authors declare no conflict of interest.
Nomenclature
| DFIG | Doubly-fed Induction Generator | |
| SSR | Sub-Synchronous Resonance | |
| SSO | Sub-Synchronous Oscillation | |
| SSTI | Sub-Synchronous Torque Interaction | |
| SSCI | Sub-Synchronous Control Interaction | |
| DC | Direct Current | |
| SVPWM | Space Vector Pulse Width Modulation | |
| Subscript s | The mark of stator side parameter | |
| Subscript r | The mark of rotor side parameter | |
| Subscript g | The mark of grid side parameter | |
| Subscript d | The mark of d axis parameter | |
| Subscript q | The mark of q axis parameter | |
| Confidence | The confidence level in the Apriori algorithm | |
| Support | The support level in the Apriori algorithm | |
| Cluster i | i = 1, 2, 3, … | The ith cluster in the k-means result |
| minsup | The minimum support in the Apriori algorithm | |
| minconf | The minimum confidence in the Apriori algorithm | |
| Ai | w | The amplitude |
| αi | dimensionless | The attenuation factor |
| fi | Hz | The frequency |
| ϕi | rad | The initial phase angle of the ith fitting component |
| p | 1 | The component number of fitting functions |
| N | 1 | The number of fitting points |
| pj | The jth frequent preceding item-set | |
| pji | The ith subset of the jth frequent preceding item-set | |
| qj | The jth subsequent item-set corresponding to Pj | |
| ΔVA | V | The voltage fluctuation of phase A |
| VArmsmax | V | The minimum rms voltage of phase A |
| VArmsmin | V | The minimum rms voltage of phase A |
| ΔV | V | The total voltage fluctuation |
| k (in Section 4) | The cluster number | |
References
- Global Wind Energy Council. Global Wind Power Development Outlook Report—2016; Global Wind Energy Council: Brussels, Belgium, 2016. [Google Scholar]
- Liu, P.; Li, Z.; Zhuo, Y.; Liu, X.; Ding, S.; Khalid, M.S.; Adio, O.S. Design of wind turbine dynamic trip-off risk alarming mechanism for large-scale wind farms. IEEE Trans. Sustain. Energy 2017, 8, 1668–1678. [Google Scholar] [CrossRef]
- Zhang, J.; Xiao, X.; Zhang, P.; Luo, C.; Wu, Y.; Lu, J.; Ren, L. Suppressing intermittent subsynchronous oscillation via subsynchronous modulation of reactive current. IEEE Trans. Power Deliv. 2015, 30, 2321–2330. [Google Scholar] [CrossRef]
- IEEE Subsynchronous Resonance Working Group. Terms, definitions and symbols for subsynchronous oscillations. IEEE Trans. Power Appar. Syst. 1985, PAS–104, 1326–1334. [Google Scholar]
- Ren, W.; Larsen, E. A refined frequency scan approach to sub-synchronous control interaction (SSCI) study of wind farms. IEEE Trans. Power Syst. 2016, 31, 3904–3912. [Google Scholar] [CrossRef]
- Tabesh, A.; Iravani, R. Small-signal model and dynamic analysis of variable speed induction machine wind farms. IET Renew. Power Gener. 2008, 2, 215–227. [Google Scholar] [CrossRef]
- Huang, H.; Mao, C.; Lu, J.; Wang, D. Small-signal modelling and analysis of wind turbine with direct drive permanent magnet synchronous generator connected to power grid. IET Renew. Power Gener. 2012, 6, 48–58. [Google Scholar] [CrossRef]
- Liu, L.; Xie, D.; Chu, H.; Gu, C. A damping method for torsional vibrations in a DFIG wind turbine system based on small-signal analysis. Electr. Power Compon. Syst. 2017, 45, 560–573. [Google Scholar] [CrossRef]
- Grund, C.E.; Paserba, J.J.; Hauer, J.F.; Nilsson, S.L. Comparison of Prony and eigenanalysis for power system control design. IEEE Trans. Power Syst. 1993, 8, 964–971. [Google Scholar] [CrossRef]
- Qi, L.; Woodruff, S.; Qian, L.; Cartes, D. Prony analysis for time-varying harmonics. In Time-Varying Waveform Distortions in Power Systems; Ribeiro, P.F., Ed.; Wiley: Hoboken, NJ, USA, 2009; pp. 317–380. [Google Scholar] [CrossRef]
- Gaddam, S.R.; Phoha, V.V.; Balagani, K.S. K-Means+ID3: A novel method for supervised anomaly detection by cascading K-means clustering and ID3 decision tree learning methods. IEEE Trans. Knowl. Data Eng. 2007, 19, 345–354. [Google Scholar] [CrossRef]
- Haupt, S.E.; Kosović, B. Variable generation power forecasting as a big data problem. IEEE Trans. Sustain. Energy 2017, 8, 725–732. [Google Scholar] [CrossRef]
- Xu, X.; He, X.; Ai, Q.; Qiu, R.C. A correlation analysis method for power systems based on random matrix theory. IEEE Trans. Smart Grid 2017, 8, 1811–1820. [Google Scholar] [CrossRef]
- Zhang, C.S.; Yan, L. Extension of local association rules mining algorithm based on apriori algorithm. In Proceedings of the 5th International Conference on Software Engineering and Service Science, Beijing, China, 27–29 June 2014; pp. 340–343. [Google Scholar]
- Sheng, G.; Hou, H.; Jiang, X.; Chen, Y. A novel association rule mining method of big data for power transformers state parameters based on probabilistic graph model. IEEE Trans. Smart Grid 2016, 9, 695–702. [Google Scholar] [CrossRef]
- Li, L.; Yong, C.; Xie, L.J.; Jiang, L.Q.; Ma, N.; Lu, M. An integrated method of set pair analysis and association rule for fault diagnosis of power transformers. IEEE Trans. Dielectr. Electr. Insul. 2015, 22, 2368–2378. [Google Scholar] [CrossRef]
- Nguyen, H.K.; Khodaei, A.; Han, Z. A big data scale algorithm for optimal scheduling of integrated microgrids. IEEE Trans. Smart Grid 2016, 9, 274–282. [Google Scholar] [CrossRef]
- Zhao, T.; Zhou, Z.; Zhang, Y.; Ling, P.; Tian, Y. Spatio-temporal analysis and forecasting of distributed PV systems diffusion: A case study of Shanghai using a data-driven approach. IEEE Access 2017, 5, 5135–5148. [Google Scholar] [CrossRef]
- Buhan, S.; Özkazanç, Y.; Çadırcı, I. Wind pattern recognition and reference wind mast data correlations with NWP for improved wind-electric power forecast. IEEE Trans. Ind. Inform. 2016, 12, 991–1004. [Google Scholar] [CrossRef]
- Wu, W.; Xie, D.; Zhao, Z.; Lu, Y.; Chu, H. Analysis of influence of doubly fed wind power system PI converter control parameter on oscillation mode. Electr. Mach. Control Appl. 2017, 44, 98–107. [Google Scholar]
Figure 1.
The structure of grid-connected DFIG system. Subscript s and r is the mark of the stator side parameter and the rotor side respectively. Subscript g is the mark of the grid side parameter. Subscript d and q is the mark of d axis parameter and q axis respectively.
Figure 1.
The structure of grid-connected DFIG system. Subscript s and r is the mark of the stator side parameter and the rotor side respectively. Subscript g is the mark of the grid side parameter. Subscript d and q is the mark of d axis parameter and q axis respectively.

Figure 2.
Small-signal model of DFIG connected to grid.

Figure 3.
Operation data of the DFIG.

Figure 4.
The flowchart of the improved Apriori algorithm.

Figure 5.
Correlation Analysis Modeling Process.

Figure 6.
Flowchart of data division by wind speed.

Figure 7.
Clustering results with different k values. (a) k = 6; (b) k = 8; (c) k = 10.


Figure 8.
The clustering result (k = 9).

Figure 9.
The clustering result with 1500 data segments (k = 9).

Figure 10.
Clustering result with 1500 data segments (k = 8).

Figure 11.
The comparison of the results.


Table 1.
Eigenvalues of DFIG connected to grid.
| Type | Eigenvalues | Mode Frequency (Hz) | Damping Ratio |
|---|---|---|---|
| SSR | −23.63 ± 498i | 79.25 | 0.0474 |
| −16.75 ± 147i | 23.40 | 0.1132 | |
| SSO | −1.477 ± 77.97i | 12.41 | 0.0189 |
| −11.72 ± 12.08i | 1.92 | 0.6963 | |
| SSCI | −51.17 ± 285.1i | 45.37 | 0.1767 |
| −8.91 ± 27.45i | 4.37 | 0.3087 | |
| Low frequency oscillation | −0.319 ± 3.177i | 0.51 | 0.1 |
Table 2.
Results of the Prony analysis.
| Amplitude | Frequency (Hz) | Damping Ratio (%) |
|---|---|---|
| 190,696 | 0.143 (low-frequency oscillation) | −37.127 |
| 75,562 | 19.466 | 3.712 |
| 63,194 | 40.545 | 4.535 |
| 62,034 | 50.307 | 6.586 |
| 36,437 | 0 | 100 |
| 34,919 | 35.2 | 2.06 |
| 28,455 | 6.748 | 6.501 |
| 26,792 | 20.582 | 1.218 |
| 24,909 | 10.449 | 11.286 |
| 24,175 | 40.556 | 1.65 |
| 22,959 | 15.242 | 2.607 |
| 16,312 | 8.433 | 5.332 |
| 14,049 | 26.189 | 2.883 |
| 13,875 | 17.107 | −0.473 |
| 12,269 | 32.948 | 0.082 |
| 11,490 | 63.518 | 0.154 |
| 10,384 | 68.174 | 1.121 |
| 9987 | 3.107 | −2.071 |
| 9528 | 23.523 (SSR) | 0.008 |
| 9465 | 12.404 (SSO) | 0.865 |
Table 3.
Frequency filtrating rules.
| Machine-Grid Interaction Type | Oscillation Modes from Small Signal Model (Hz) | Filtrate Range of Prony Analysis Result (Hz) | Correlation Analysis Mark Tag |
|---|---|---|---|
| Low-frequency oscillation | 0.1–1.8 Hz | [0.1, 1.8] | 1 |
| other | 0 | ||
| SSCI | 4.37 Hz | [4.17, 4.57] | 1 |
| other | 0 | ||
| 45.37 Hz | [44.57, 46.17] | 1 | |
| other | 0 | ||
| SSO | 12.41 Hz | [11.91, 12.91] | 1 |
| other | 0 | ||
| 1.92 Hz | [1.82, 2.02] | 1 | |
| other | 0 | ||
| SSR | 79 Hz | [77.5, 80.5] | 1 |
| other | 0 | ||
| 23 Hz | [22.4, 23.6] | 1 | |
| other | 0 |
Table 4.
Comparison between ‘Improved Apriori Algorithm’ and ‘Apriori algorithm’.
| Comparison Item | Search Method | Item Restriction | Time Cost |
|---|---|---|---|
| Apriori Algorithm | Traverse the data set | The preceding item and subsequent item are unrestricted | High |
| Improved Apriori Algorithm | Search in the appointed data set | The preceding item and subsequent item are restricted | Low |
Table 5.
Association rules (the same data segment correspondence).
| k | No. | Preceding Item | Subsequent Item | Support (%) | Confidence (%) |
|---|---|---|---|---|---|
| 8 | 1 | 0.1–1.8 Hz | cluster 3 | 6.1958 | 42.0000 |
| 2 | 23 Hz | cluster 4 | 18.0917 | 41.0959 | |
| 3 | 45.37 Hz | cluster 7 | 9.7893 | 39.2405 | |
| 4 | 12.41 Hz | cluster 3 | 6.1958 | 38.0000 | |
| 5 | 45.37 Hz | cluster 1 | 4.9566 | 37.5000 | |
| 6 | 23 Hz | cluster 8 | 42.2553 | 36.9501 | |
| 7 | 45.37 Hz | cluster 8 | 42.2553 | 36.6569 | |
| 8 | 23 Hz | cluster 3 | 6.1958 | 36.0000 | |
| 9 | 0.1–1.8 Hz | cluster 4 | 18.0917 | 34.9315 | |
| 10 | 23 Hz | cluster 7 | 9.7893 | 34.1772 | |
| 11 | 0.1–1.8 Hz | cluster 5 | 4.2131 | 32.3529 | |
| 12 | 45.37 Hz | cluster 5 | 4.2131 | 32.3529 | |
| 9 | 1 | 0.1–1.8 Hz | cluster 6 | 6.0719 | 42.8571 |
| 2 | 23 Hz | cluster 5 | 20.4461 | 41.8182 | |
| 3 | 45.37 Hz | cluster 7 | 9.4176 | 40.7895 | |
| 4 | 12.41 Hz | cluster 6 | 6.0719 | 38.7755 | |
| 5 | 45.37 Hz | cluster 2 | 4.9566 | 37.5000 | |
| 6 | 23 Hz | cluster 7 | 9.4176 | 36.8421 | |
| 7 | 45.37 Hz | cluster 3 | 37.6704 | 35.8553 | |
| 8 | 23 Hz | cluster 3 | 37.6704 | 35.8553 | |
| 9 | 23 Hz | cluster 6 | 6.0719 | 34.6939 | |
| 10 | 0.1–1.8 Hz | cluster 5 | 20.4461 | 34.5455 | |
| 11 | 45.37 Hz | cluster 4 | 6.9393 | 33.9286 | |
| 12 | 23 Hz | cluster 4 | 6.9393 | 30.3571 | |
| 10 | 1 | 45.37 Hz | cluster 5 | 8.4263 | 42.6471 |
| 2 | 23 Hz | cluster 1 | 20.4461 | 41.8182 | |
| 3 | 45.37 Hz | cluster 4 | 4.9566 | 37.5000 | |
| 4 | 23 Hz | cluster 5 | 8.4263 | 36.7647 | |
| 5 | 0.1–1.8 Hz | cluster 1 | 20.4461 | 34.5455 |
Table 6.
Statistics comparison of association rules with different k values (the same data segment correspondence).
Table 6.
Statistics comparison of association rules with different k values (the same data segment correspondence).
| Comparison Item | k = 8 | k = 9 | k = 10 |
|---|---|---|---|
| Rule number | 12 | 12 | 5 |
| Minimum support | 4.213% | 4.957% | 4.957% |
| Maximum support | 42.255% | 37.67% | 20.446% |
| Average support (%) | 14.3536 | 14.3432 | 12.5403 |
| the standard deviation of support | 13.8834 | 12.1143 | 7.3547 |
| Mid-value of support | 7.9926 | 8.1784 | 8.4263 |
| Minimum confidence | 32.353% | 30.357% | 34.545% |
| Maximum confidence | 42.0% | 42.857% | 42.647% |
| Average confidence (%) | 36.7715 | 36.9848 | 38.6551 |
| standard deviation of confidence | 3.0745 | 3.6034 | 3.4546 |
| Mid-value of confidence | 36.8035 | 36.3487 | 37.5000 |
Table 7.
Association rules (the adjacent data segments correspondence).
| k | No. | Preceding Item | Subsequent Item | Support (%) | Confidence (%) |
|---|---|---|---|---|---|
| 8 | 1 | 45.37 Hz | cluster 4 & cluster 8 | 4.71464 | 47.3684 |
| 2 | 12.41 Hz | cluster 4 & cluster 8 | 4.71464 | 42.1053 | |
| 3 | 23 Hz | cluster 4 & cluster 8 | 4.71464 | 42.1053 | |
| 4 | 23 Hz | cluster 4 | 18.1141 | 37.6712 | |
| 5 | 23 Hz | cluster 8 | 42.1836 | 37.0588 | |
| 6 | 45.37 Hz | cluster 8 | 42.1836 | 36.4706 | |
| 7 | 45.37 Hz | cluster 4 | 18.1141 | 35.6164 | |
| 8 | 23 Hz | cluster 7 | 9.8015 | 35.4430 | |
| 9 | 45.37 Hz | cluster 1 | 4.9628 | 35 | |
| 10 | 45.37 Hz | cluster 7 | 9.8015 | 32.9114 | |
| 11 | 45.37 Hz | cluster 5 | 4.2184 | 32.3529 | |
| 12 | 23 Hz | cluster 5 | 4.21836 | 32.3529 | |
| 13 | 45.37 Hz | cluster 3 | 6.2035 | 32 | |
| 14 | 23 Hz | cluster 3 | 6.2035 | 32 | |
| 15 | 12.41 Hz | cluster 6 | 10.67 | 31.3953 | |
| 16 | 23 Hz | cluster 1 | 4.9628 | 30 | |
| 9 | 1 | 23 Hz | cluster 5 | 20.4715 | 38.7879 |
| 2 | 23 Hz | cluster 3 | 37.7171 | 38.1579 | |
| 3 | 23 Hz | cluster 7 | 9.4293 | 36.8421 | |
| 4 | 45.37 Hz | cluster 4 | 6.9479 | 35.7143 | |
| 5 | 45.37 Hz | cluster 2 | 4.9628 | 35 | |
| 6 | 45.37 Hz | cluster 5 | 20.4715 | 33.9394 | |
| 7 | 45.37 Hz | cluster 7 | 9.4293 | 32.8947 | |
| 8 | 23 Hz | cluster 6 | 6.0794 | 32.6531 | |
| 9 | 45.37 Hz | cluster 3 | 37.7171 | 32.5658 | |
| 10 | 12.41 Hz | cluster 1 | 10.6700 | 31.3953 | |
| 11 | 45.37 Hz | cluster 6 | 6.0794 | 30.6122 | |
| 12 | 12.41 Hz | cluster 5 | 20.4715 | 30.3030 | |
| 13 | 23 Hz | cluster 2 | 4.9628 | 30 | |
| 10 | 1 | 23 Hz | cluster 1 | 20.4715 | 38.7879 |
| 2 | 23 Hz | cluster 5 | 8.43672 | 38.2353 | |
| 3 | 45.37 Hz | cluster 4 | 4.9628 | 35 | |
| 4 | 45.37 Hz | cluster 1 | 20.4715 | 33.9394 | |
| 5 | 45.37 Hz | cluster 5 | 8.4367 | 33.8235 | |
| 6 | 12.41 Hz | cluster 1 | 20.4715 | 30.3030 | |
| 7 | 12.41 Hz | cluster 6 | 10.6700 | 30.2326 | |
| 8 | 23 Hz | cluster 4 | 4.9628 | 30 |
Table 8.
Statistics comparison of association rules with different k values (the adjacent data segments correspondence).
Table 8.
Statistics comparison of association rules with different k values (the adjacent data segments correspondence).
| Comparison Item | k = 8 | k = 9 | k = 10 |
|---|---|---|---|
| Rule number | 16 | 13 | 8 |
| Minimum support | 4.218% | 4.963% | 4.963% |
| Maximum support | 42.184% | 37.717% | 20.471% |
| Average support (%) | 12.2364 | 15.0315 | 12.3604 |
| the standard deviation of support | 12.5273 | 11.6484 | 6.9741 |
| Mid-value of support | 6.2035 | 9.4293 | 9.5533 |
| Minimum confidence | 30.0% | 30.0% | 30.0% |
| Maximum confidence | 47.368% | 38.788% | 38.788% |
| Average confidence (%) | 35.7407 | 33.7589 | 33.7902 |
| the standard deviation of confidence | 4.7163 | 2.9510 | 3.4930 |
| Mid-value of confidence | 35.2215 | 32.8947 | 33.8815 |
Table 9.
Cluster center (k = 9).
| Cluster | Wind Speed | V-A | V-B | V-C | Voltage Fluctuation |
|---|---|---|---|---|---|
| cluster 1 | 5.3710 | 2.2746 | 2.1476 | 2.1994 | 2.2072 |
| cluster 2 | 4.1656 | 0.4119 | 0.3693 | 0.4125 | 0.3979 |
| cluster 3 | 5.0864 | 2.7239 | 2.5004 | 2.5306 | 2.5850 |
| cluster 4 | 2.1246 | 1.3252 | 1.2975 | 1.3173 | 1.3133 |
| cluster 5 | 4.0849 | 1.1553 | 1.1468 | 1.1374 | 1.1465 |
| cluster 6 | 4.4625 | 2.2289 | 2.1224 | 2.1684 | 2.1732 |
| cluster 7 | 4.3226 | 1.4596 | 1.4068 | 1.4241 | 1.4302 |
| cluster 8 | 3.2341 | 1.4214 | 1.3658 | 1.3975 | 1.3949 |
| cluster 9 | 6.1592 | 2.4109 | 2.3131 | 2.3499 | 2.3580 |
Table 10.
Association rules of 1500 data segments.
| No. | Preceding Item | Subsequent Item | Support (%) | Confidence (%) |
|---|---|---|---|---|
| 1 | 45.37 Hz | cluster 9 | 8.1142 | 41.6667 |
| 2 | 12.41 Hz | cluster 3 | 6.7618 | 41.1111 |
| 3 | 45.37 Hz | cluster 8 | 15.9279 | 40.0943 |
| 4 | 0.1–1.8 Hz | cluster 3 | 6.7618 | 36.6667 |
| 5 | 23 Hz | cluster 7 | 15.7776 | 35.7143 |
| 6 | 45.37 Hz | cluster 5 | 24.1172 | 35.2025 |
| 7 | 23 Hz | cluster 5 | 24.1172 | 34.5794 |
| 8 | 23 Hz | cluster 3 | 6.7618 | 34.4444 |
| 9 | 23 Hz | cluster 6 | 8.6401 | 33.9130 |
| 10 | 45.37 Hz | cluster 6 | 8.6401 | 33.0435 |
| 11 | 45.37 Hz | cluster 1 | 13.7491 | 32.2404 |
| 12 | 23 Hz | cluster 1 | 13.7491 | 30.6011 |
| 13 | 23 Hz | cluster 9 | 8.1142 | 30.5556 |
| 14 | 45.37 Hz | cluster 7 | 15.7776 | 30.4762 |
Table 11.
Cluster center (k = 8).
| Cluster | Wind Speed | V-A | V-B | V-C | Voltage Fluctuation |
|---|---|---|---|---|---|
| cluster 1 | 2.42045 | 2.28851 | 2.30949 | 2.33949 | 6.04808 |
| cluster 2 | 1.25799 | 1.23799 | 1.23884 | 1.24494 | 4.14762 |
| cluster 3 | 2.24225 | 2.14732 | 2.20835 | 2.19931 | 5.17199 |
| cluster 4 | 0.26148 | 0.2329 | 0.27851 | 0.25763 | 5.67557 |
| cluster 5 | 2.68967 | 2.48604 | 2.52175 | 2.56582 | 4.97684 |
| cluster 6 | 1.38416 | 1.33245 | 1.36456 | 1.36039 | 2.92717 |
| cluster 7 | 2.00854 | 1.87115 | 1.91066 | 1.93011 | 4.14033 |
| cluster 8 | 0.46793 | 0.41485 | 0.44918 | 0.44399 | 3.90241 |
| cluster 9 | 2.42045 | 2.28851 | 2.30949 | 2.33949 | 6.04808 |
Table 12.
Association rules of 1500 data segments (the adjacent data segments correspondence).
| No. | Preceding Item | Subsequent Item | Support (%) | Confidence (%) |
|---|---|---|---|---|
| 1 | 45.37 Hz | cluster 8 | 15.9398 | 41.5094 |
| 2 | 23 Hz | cluster 5 | 24.1353 | 37.3832 |
| 3 | 45.37 Hz | cluster 5 | 24.1353 | 34.2679 |
| 4 | 45.37 Hz | cluster 6 | 8.6466 | 33.9130 |
| 5 | 23 Hz | cluster 6 | 8.6466 | 33.9130 |
| 6 | 23 Hz | cluster 7 | 15.7895 | 33.8095 |
| 7 | 12.41 Hz | cluster 1 | 13.7594 | 32.7869 |
| 8 | 23 Hz | cluster 1 | 13.7594 | 30.6011 |
| 9 | 12.41 Hz | cluster 7 | 15.7895 | 30.4762 |
| 10 | 23 Hz | cluster 3 | 6.6917 | 30.3371 |
| 11 | 45.37 Hz | cluster 7 | 15.7895 | 29.5238 |
Table 13.
Confidence level analysis of prediction and reality.
| No. | Preceding Item | Subsequent Item | Predict Confidence (%) | Actual Confidence (%) | Error |
|---|---|---|---|---|---|
| 1 | 23 Hz | cluster 6 | 33.91 | 38.98 | 5.07 |
| 2 | 45.37 Hz | cluster 7 | 29.52 | 36.97 | 7.45 |
| 3 | 23 Hz | cluster 3 | 30.34 | 33.33 | 2.99 |
| 4 | 45.37 Hz | cluster 6 | 33.91 | 32.20 | −1.71 |
| 5 | 23 Hz | cluster 7 | 33.81 | 28.57 | −5.24 |
| 6 | 12.41 Hz | cluster 7 | 30.48 | 26.89 | −3.59 |
© 2018 by the authors. Licensee MDPI, Basel, Switzerland. This article is an open access article distributed under the terms and conditions of the Creative Commons Attribution (CC BY) license (http://creativecommons.org/licenses/by/4.0/).
Share and Cite
MDPI and ACS Style
Miao, J.; Xie, D.; Gu, C.; Wang, X. Correlation Analysis between Wind Speed/Voltage Clusters and Oscillation Modes of Doubly-Fed Induction Generators. Energies 2018, 11, 2370. https://doi.org/10.3390/en11092370
AMA Style
Miao J, Xie D, Gu C, Wang X. Correlation Analysis between Wind Speed/Voltage Clusters and Oscillation Modes of Doubly-Fed Induction Generators. Energies. 2018; 11(9):2370. https://doi.org/10.3390/en11092370
Chicago/Turabian StyleMiao, Jierong, Da Xie, Chenghong Gu, and Xitian Wang. 2018. "Correlation Analysis between Wind Speed/Voltage Clusters and Oscillation Modes of Doubly-Fed Induction Generators" Energies 11, no. 9: 2370. https://doi.org/10.3390/en11092370
Note that from the first issue of 2016, this journal uses article numbers instead of page numbers. See further details here.