Wireless Power Charger Based on Class E Amplifier with the Maximum Power Point Load Consideration


1
College of Internet of Things Engineering, Hohai University, Changzhou 213022, China
2
Jiangsu Key Laboratory of Power Transmission and Distribution Equipment Technology, Hohai University, Changzhou 213022, China
*
Author to whom correspondence should be addressed.
Energies 2018, 11(9), 2378; https://doi.org/10.3390/en11092378
Submission received: 21 August 2018
/
Revised: 31 August 2018
/
Accepted: 4 September 2018
/
Published: 9 September 2018
(This article belongs to the Special Issue Wireless Power Transfer 2018)
Abstract
:The construction of an electromagnetic coupling power transfer system is introduced in this paper. Considering the characteristics of the battery charger, a novel parameter design method based on the load of the maximum power transfer point is proposed. Then, the compensator, resonant circuits, and some key parameters of the electromagnetic coupler are discussed in detail by constructing a mutual inductance model to carry out impedance calculation and analysis. Coupling coefficient influenced by different magnetic circuits and coil distribution were analyzed by building a finite element model and an equivalent magnetic circuit. Moreover, impedance matching and compensation network parameters were theoretically calculated and simulated. Finally, a wireless power charger based on an open-loop class E amplifier with the maximum power point load consideration was manufactured. Simulation and experiments were done to verify the analyses, and the capability of 4.2 W power delivery at a distance of 10 mm and a peak system efficiency exceeding 72% were demonstrated.
1. Introduction
In recent years, wireless power transfer (WPT), also known as contactless power transfer, has aroused the wide concern of many experts and scholars for its safety and convenience. WPT technology has been applied in contactless chargers for electric vehicles [1,2,3], medical electronics [4,5], portable communication equipment [6,7], biological monitoring [8], and underwater power delivery [9,10,11]. Moreover, WPT technology has also been adopted in the fields of wireless communication networks and the Internet of Things for energy collection [12,13] and transmission. In these application fields, some experts mainly focus on how to optimize energy-efficient resource management and allocation according to the requirements of different mobile devices [14,15] and different communication technologies [16]. Generally, WPT can be realized by strongly coupled magnetic resonances [17], electromagnetic inductive coupling, and radio frequency (RF) power technology [8,18], depending on the transfer distance.
Electromagnetic coupling power transfer technology has been widely adopted in portable electronic equipment and subcutaneous implantable electronic devices because of its short power transmission distance. Moreover, considering the situation of low power delivery in these fields, the application of class E amplifiers in WPT systems is attracting increasing attention. The class E amplifier was proposed by Sokals in 1975 [19], and has the merits of high efficiency and simple circuits. Subsequently, in order to ensure the class E amplifier would work at the ideal efficiency of 100%, Raab obtained some formulas for optimizing component values by adopting Fourier techniques and a high-Q assumption [20]. He also studied the influence of circuit variations on the class E amplifier (e.g., load reactance, shunt capacitance, frequency, and duty cycle) [21].
Figure 1 shows the configuration diagram of a wireless power transfer system, which can be divided into three parts: inverter, electromagnetic coupler, and rectifier. Specially, the coupler can consist of two coils with air or a separated-type transformer with a ferrite core. In Reference [6], considering a class E amplifier circuit as the DC/AC (direct current/alternating current) inverter, with a distance of 10 mm between the transmitter coils and the receiver coils, the system had a maximum transmission power of 3.7 W and a peak efficiency of 66%. Reference [7] presents an open-loop system selection technique based on numerically scanning component values until the drain voltage and impedance meet certain constraints.
This paper presents our research on an electromagnetic coupling power transfer charger (ECPTC). The impedance matching was analyzed and a parameter calculation method based on the maximum power transfer point load is proposed on the basis of a mutual inductance model of the electromagnetic coupler and Raab’s theory. Considering the charging characteristics of the battery, a separated-type transformer comprising a pot-type ferrite core was selected to improve the coupling coefficient between the primary and secondary coils (the primary side is the transmitter side and the secondary side is the receiver side). Meanwhile, a compensation circuit for the coupler with a parallel capacitor on the secondary side and several series capacitors on the primary side were adopted to develop the power delivery ability. Moreover, the effects of transmitter and receiver coils layout and core size of the coupler on coupling efficiency are discussed by analyzing the power delivery efficiency and constructing a magnetic circuit model of the coupler. Finally, a simulation model and experiments were carried out to verify the theoretical analysis and design methods. The experimental results showed that the system had a maximum transfer power of 4.2 W and a peak efficiency of more than 72% with an input voltage of 30 VDC (volts direct current) and a transfer distance of 10 mm.
2. Impedance Analysis and Parameter Design
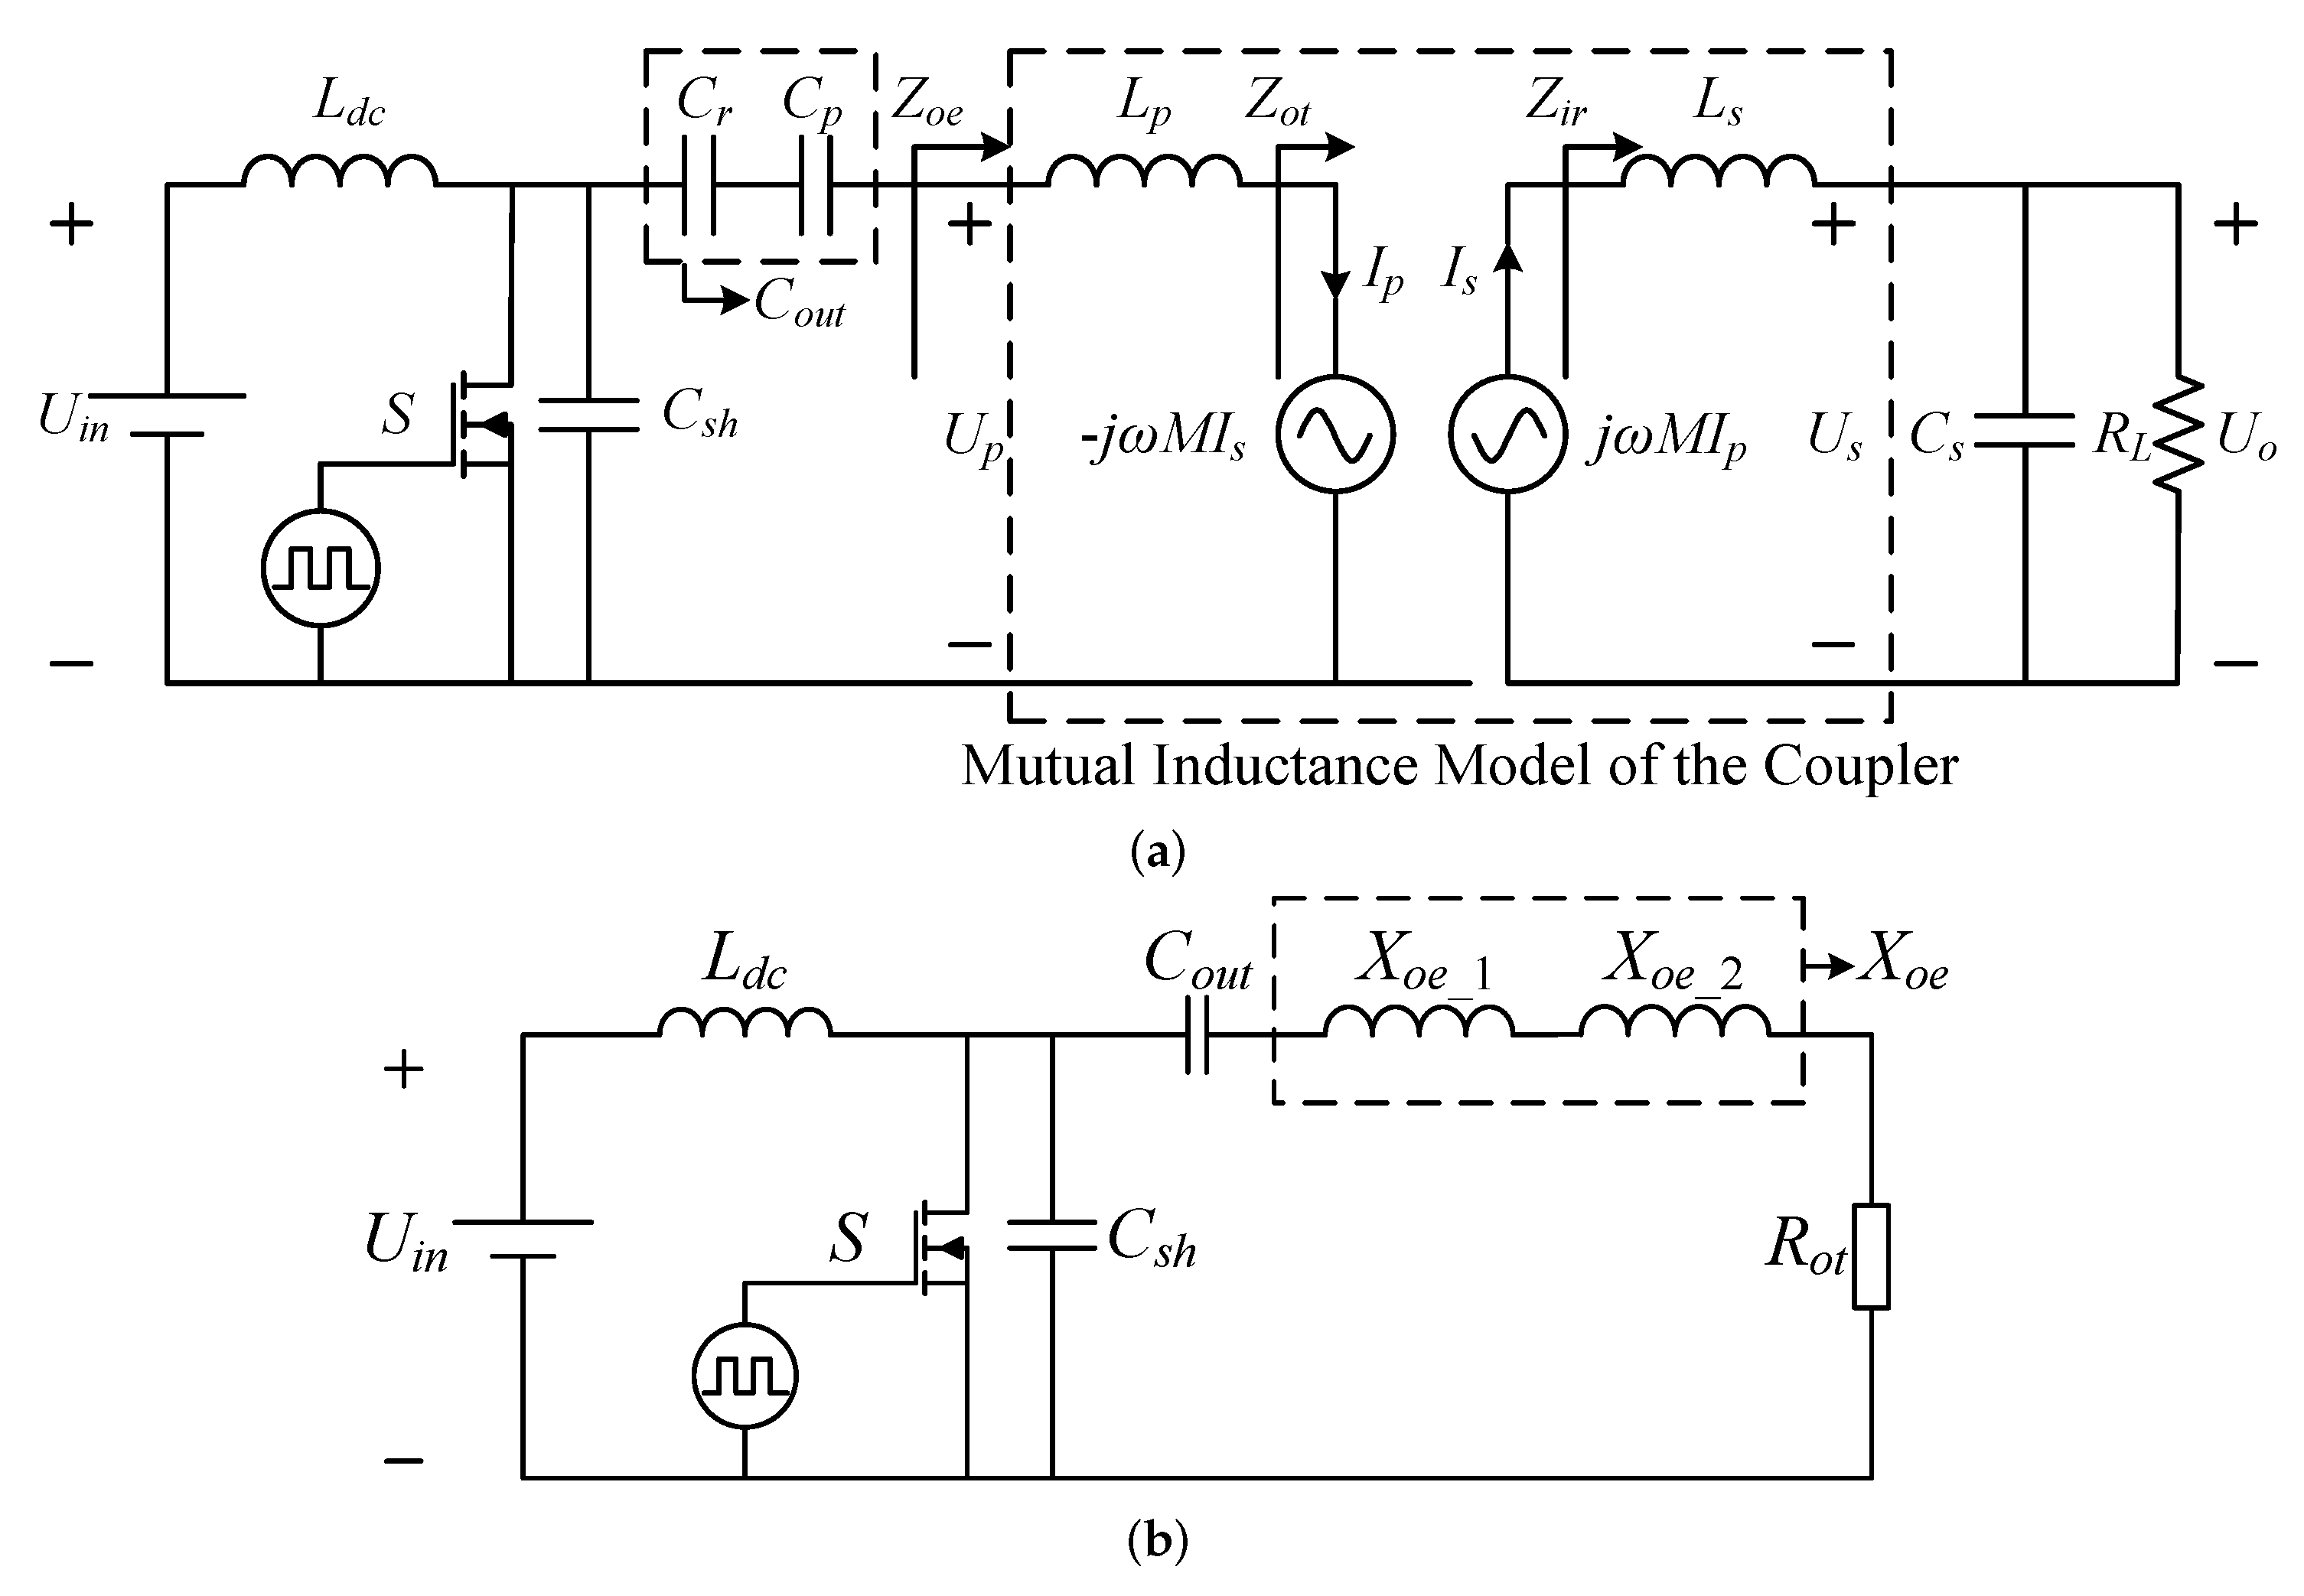
Figure 2 shows an ECPTC system based on a class E amplifier. In Figure 2, an electromagnetic coupler is represented by a mutual inductance model and the rectifier at the secondary side is omitted to simplify analysis process. As shown in Figure 2, represents the input voltage of the charger, is the inductance smoothing input current, and and are the resonant capacitor and compensation capacitor of the transmitter coils (in real circuits, these two series capacitors can be replaced with ). and are the inductances of the transmitter and receiver coils, respectively. is a parallel compensation capacitor on the secondary side, and is the load resistor.
2.1. Mutual Inductance Model of the Coupler
To analyze the effects of the coupler parameters on the WPT system, the corresponding mutual inductance mathematical model is built as follows:
where and are the terminal voltage of the transmitter and receiver coils, respectively, and are current flow through the transmitter and receiver coils, M is the mutual inductance between the transmitter and receiver coils, and k is a coupling coefficient.
For the convenience of parameter calculation and power transmission capability analysis, the input impedance of the receiver side, , the output impedance of the transmitter side, , and the output impedance of the class E amplifier, , should be analyzed clearly.
As shown in Figure 2a, can be expressed as:
While can be expressed as follows:
Then, is just with an additional series reactance from :
2.2. Power Transfer Capability Analysis
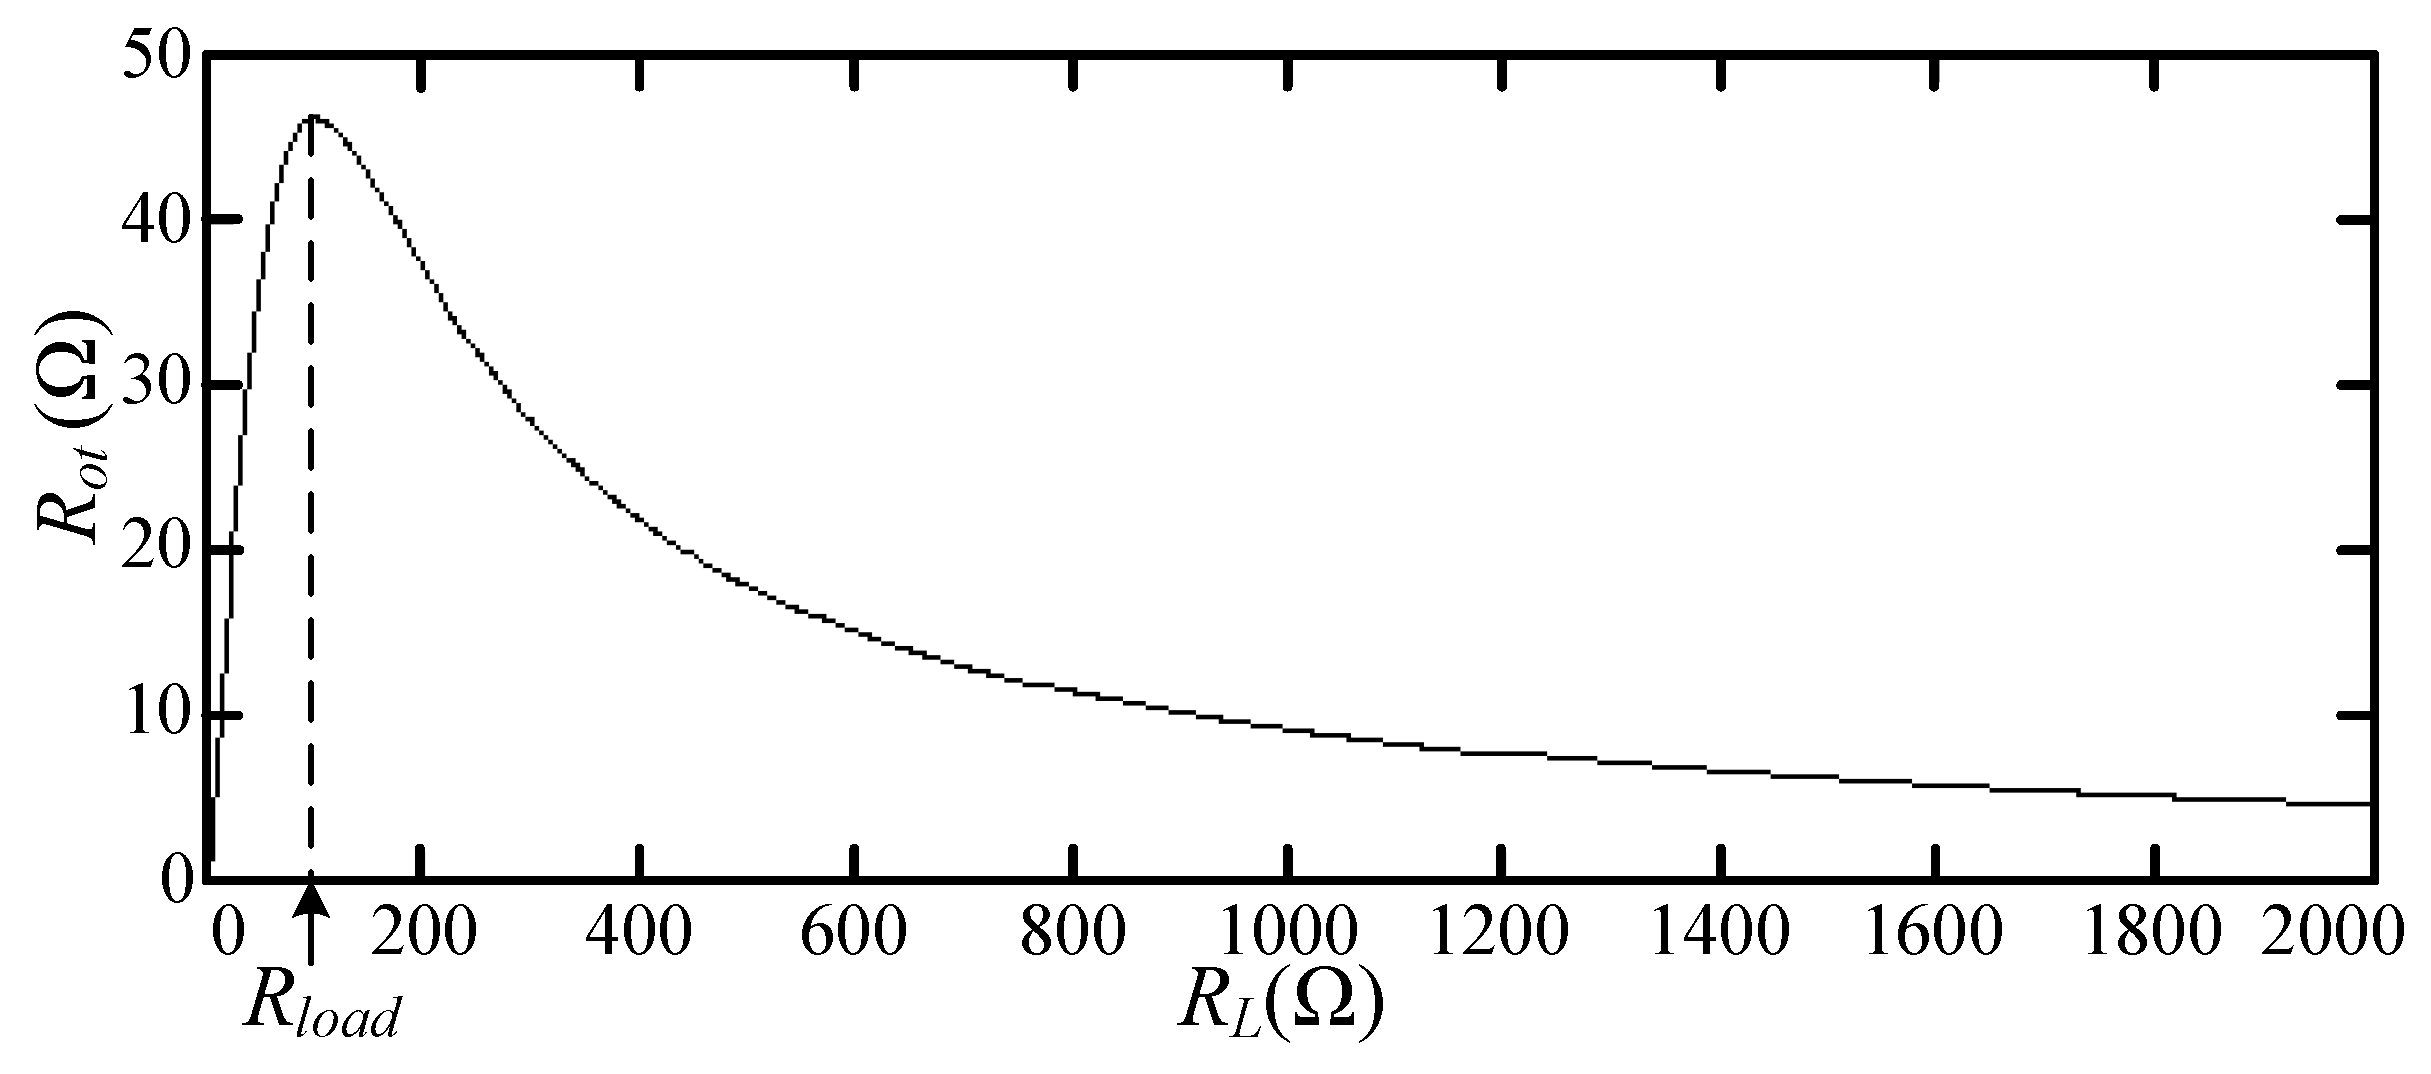
As seen from the equivalent circuits model of the ECPTC, the power transfer capability of the system depends on . That is to say, it is proportional to the real part of the output impedance looking out from the transmitter, . For known coupler parameters (H, H, H and nF), we can acquire the trend of versus the load according to Equation (6), as shown in Figure 3. From the variational trend of , we can deduce that the transfer power will rise sharply initially, it will reach the maximum value as the load resistor , then it will decline with the increasing load resistor . The above trend is similar to the battery charging process: At the beginning of charging, the voltage of the battery is very low and the charging current is larger (meaning that the inner resistance of the battery is very small), and the charging power increases quickly in order to achieve fast charge. When the voltage increases to a certain value, trickle charge is needed, and the charging power is reduced.
2.3. Parameter Design
To increase the transfer power and reduce the reactive power, the system adopts series compensation capacitors and parallel compensation capacitors on the primary and secondary sides, respectively. Meantime, the optimum load resistance point, , was selected to be 100 in order to achieve the maximal transfer power. Assuming that the derivative of the real part of output impedance, , is set to be zero,
If is set and the parameters of the coupler are known, compensation capacitance, , can be acquired from Equation (10):
According to Equation (10), when the value of is set to be , the value of can be infinite, and the transfer power can be unrestricted, but it is not allowed.
Reflecting the circuit on the receiver side to that on the transmitter side, we can acquire the equivalent circuit of the class E amplifier as shown in Figure 2b. For analysis, should be divided into two parts: and . When the reactance, , and the capacitor, , are completely resonant, the difference between and is , which is used for adjusting the phase angle of load impedance in the class E amplifier in order to ensure that the class E amplifier works in ZVS (zero voltage switch) and ZDS (zero derivative switch) modes, and this analysis method is called Rabb’s theory [20]. According to the analysis above,
When the class E amplifier works in ZVS and ZDS modes and is optimized, the angle of the load impedance is . Then,
In order to ensure that the class E amplifier works in ZVS and ZDS modes, The capacitance can be calculated by the following equation:
In order to smooth the input current, is designed by the following considerations. When is large enough, –, the input impedance is inductive and then the fluctuation of the input current is small. Considering the design requirements of , the coefficient value was taken as 10.
3. Magnetic Circuit of the Coupler
From the above analysis, the power transfer ability of the system is related to the value. From Equation (6), we can deduce that if increases, we must keep mutual inductance of the coupler larger and inductance of the receiver coils smaller. Meanwhile, the parameters of the coupler are related to the magnetic circuits’ structure and winding distribution. Hence, it is very important for us to build the relationships among electromagnetic parameters, the structure of the coupler, and the winding distribution.
3.1. Magnetic Circuit Model Analysis
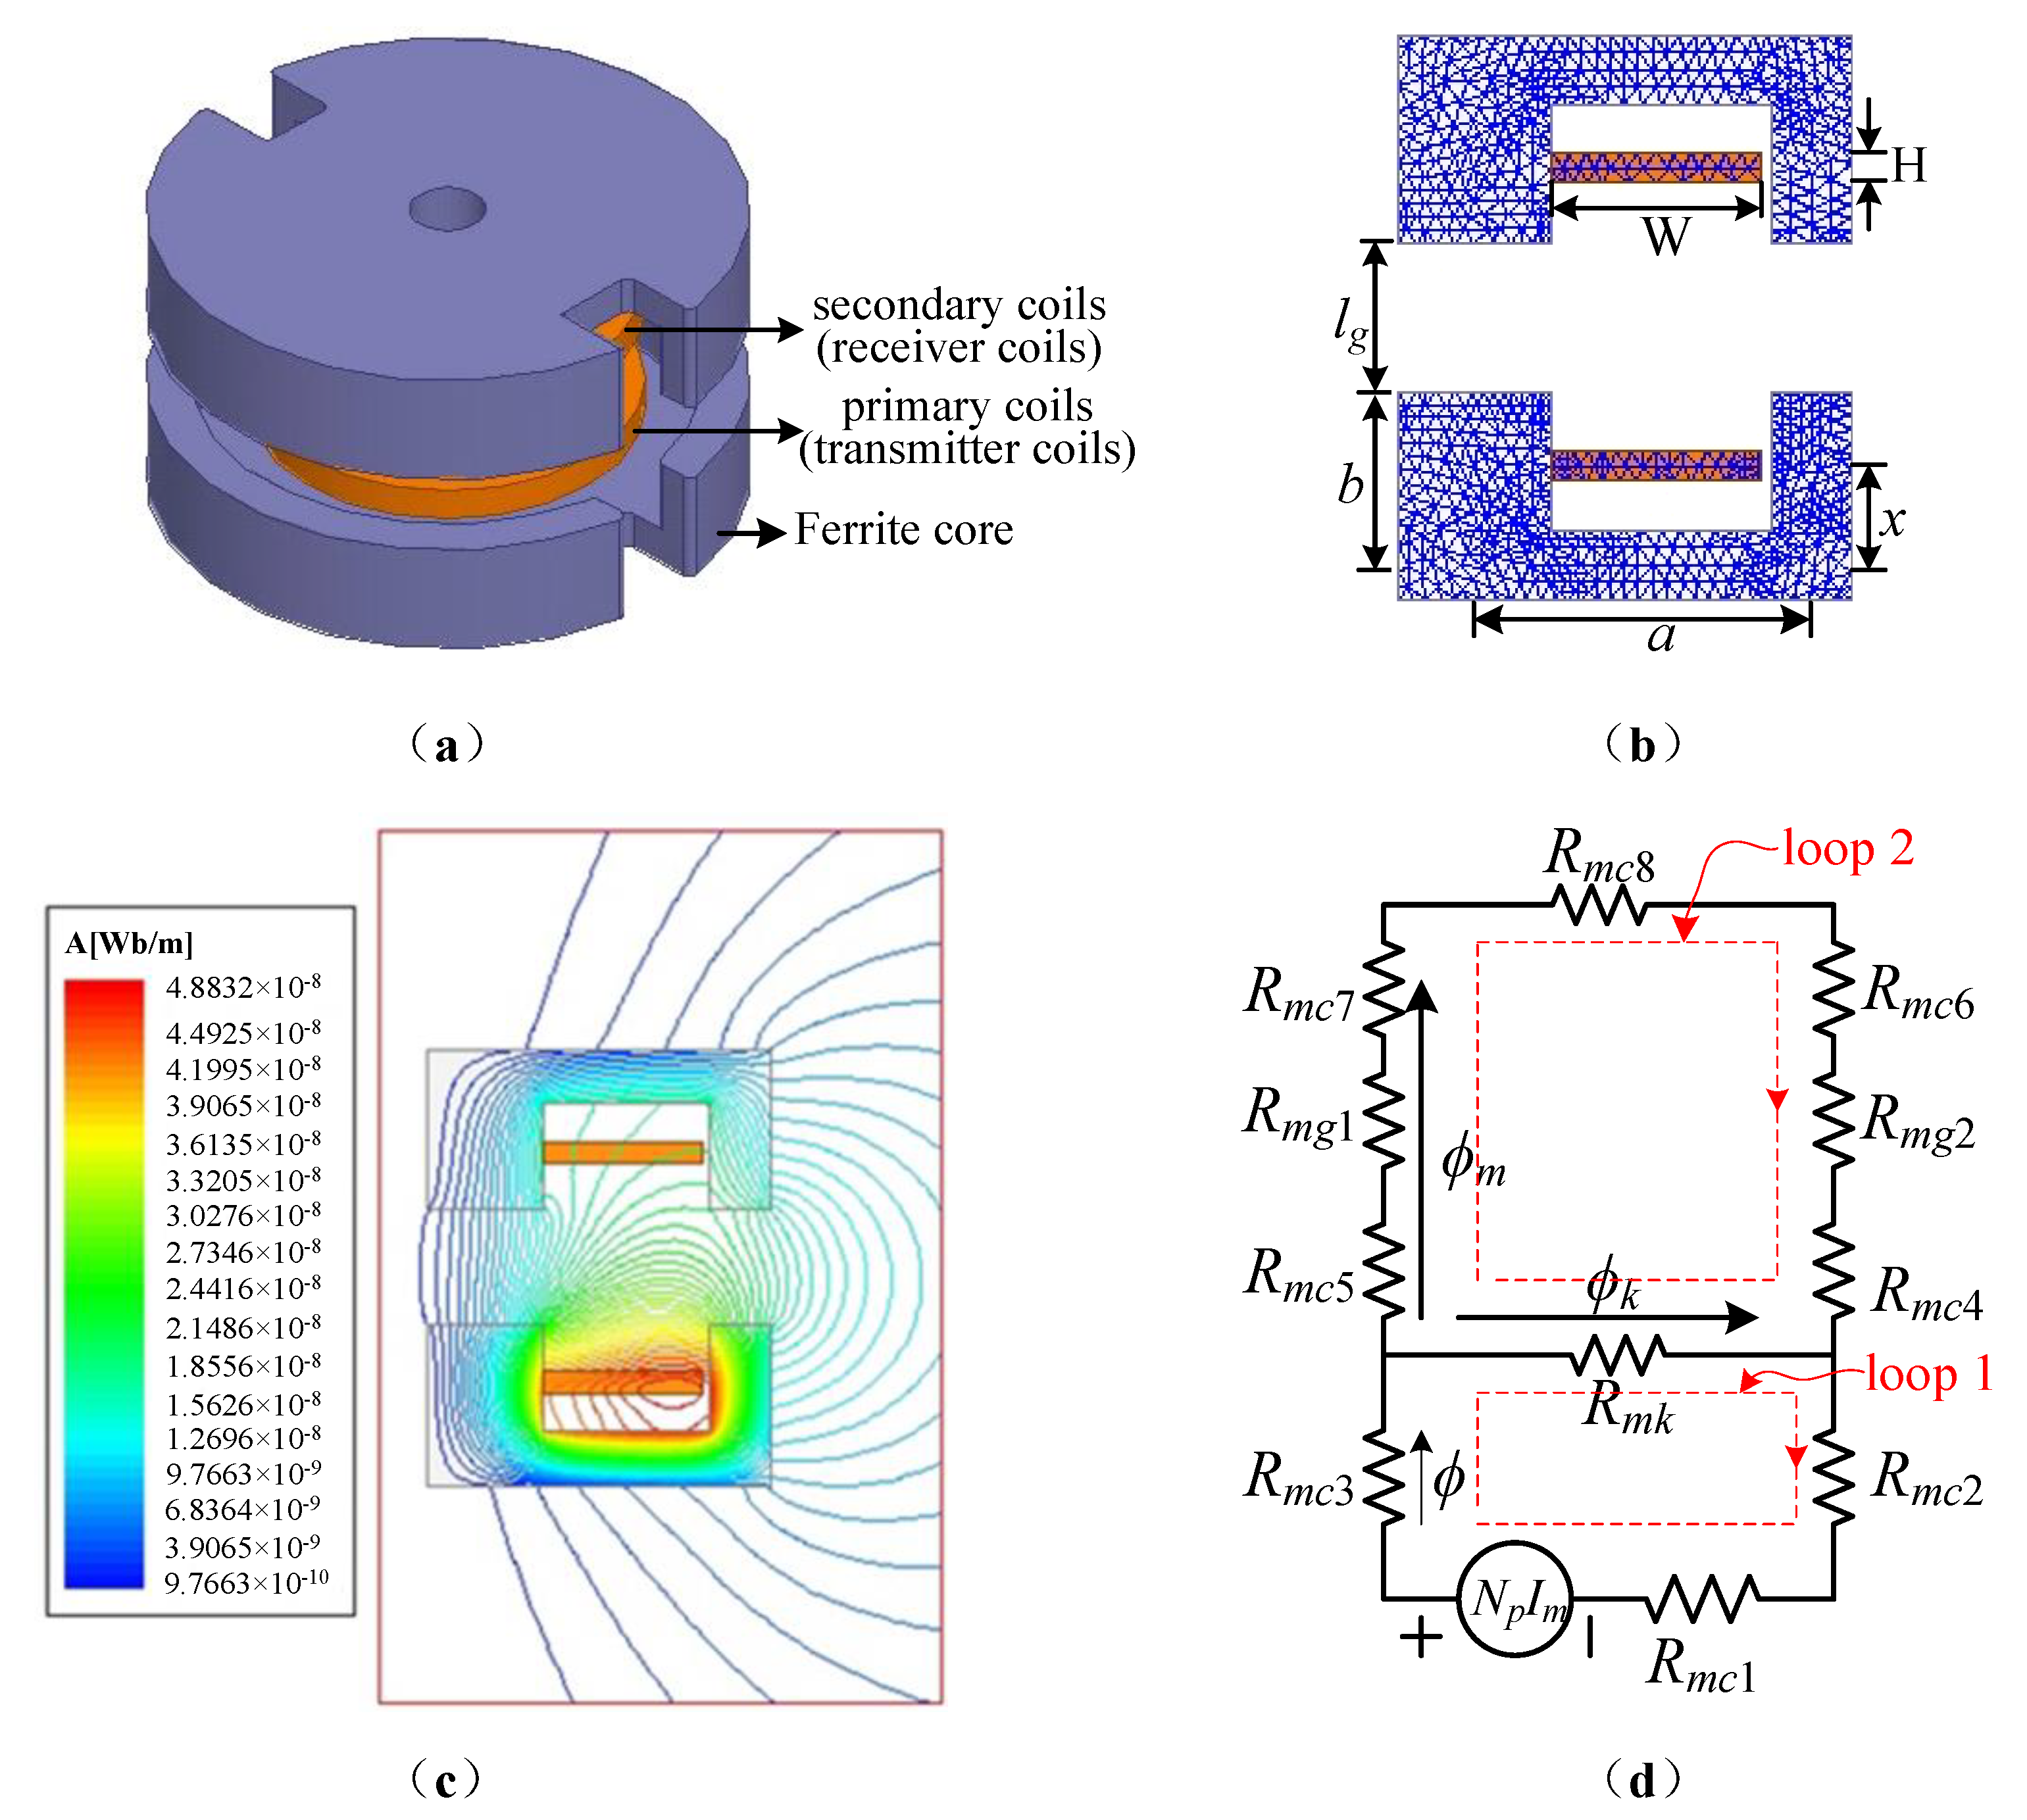
We can analyze the relationships between coupling coefficient, magnetic circuit structure, and winding distribution in detail. In this paper, we adopt a pot-type magnet core as the electromagnetic coupler, as shown in Figure 4a. Figure 4b is a 2D finite element model based on the rotational coordinate system. Figure 4c shows the flux distribution of the coupler. As seen from Figure 4c, the main magnetic flux produced by magnetomotive force, , is divided into two parts: one is the magnetic flux coupling with the secondary side of the coupler, , while the other is the magnetic flux only coupling with the primary side, which is also called magnetic flux leakage, . So, a magnetic resistance model was built based on the magnetic flux distribution, as shown in Figure 4d.
As we know, when the current flows through the transmitter coils and receiver coils, the magnetomotive force balance equation is founded:
where is the magnetizing current, and and represent the current of the transmitter and receiver coils, respectively.
Considering the two independent closed-loop magnetic paths shown in Figure 4d, the magnetomotive force and the magnetic pressure drop across can be acquired according to magnetic circuit theory:
Meanwhile, the relation of magnetic flux in Figure 4d can be derived according to magnetic circuit theory:
To simplify the analysis, we assume that the cross-sectional area of the flux path is the same, . Then, reluctance per unit length can be expressed as follows:
where and are air-gap permeability and the relative permeability of the ferrite.
The reluctance of each part of the flux paths can be given as:
where x is the length of the effective magnetic circuits between the transmitter coils and the bottom of the magnet core. are defined in Figure 4b.
Substituting Equation (20) into Equations (18) and (19) and considering Equations (22)–(27), and can be calculated:
where .
Hence, the coupling coefficient of the coupler is:
3.2. Impact of Gap Length and Magnet Core Size
In general, is very large, and is far smaller than . Equation (30) can be changed to:
From Equation (31), when the permeability is very large, the coupling coefficient k has nothing to do with magnetic materials, and it is only related to transfer distance and the radius of magnetic core (the value of a). When , the size of the magnetic core will become the main factor affecting the coupling coefficient. Otherwise, is the main factor.
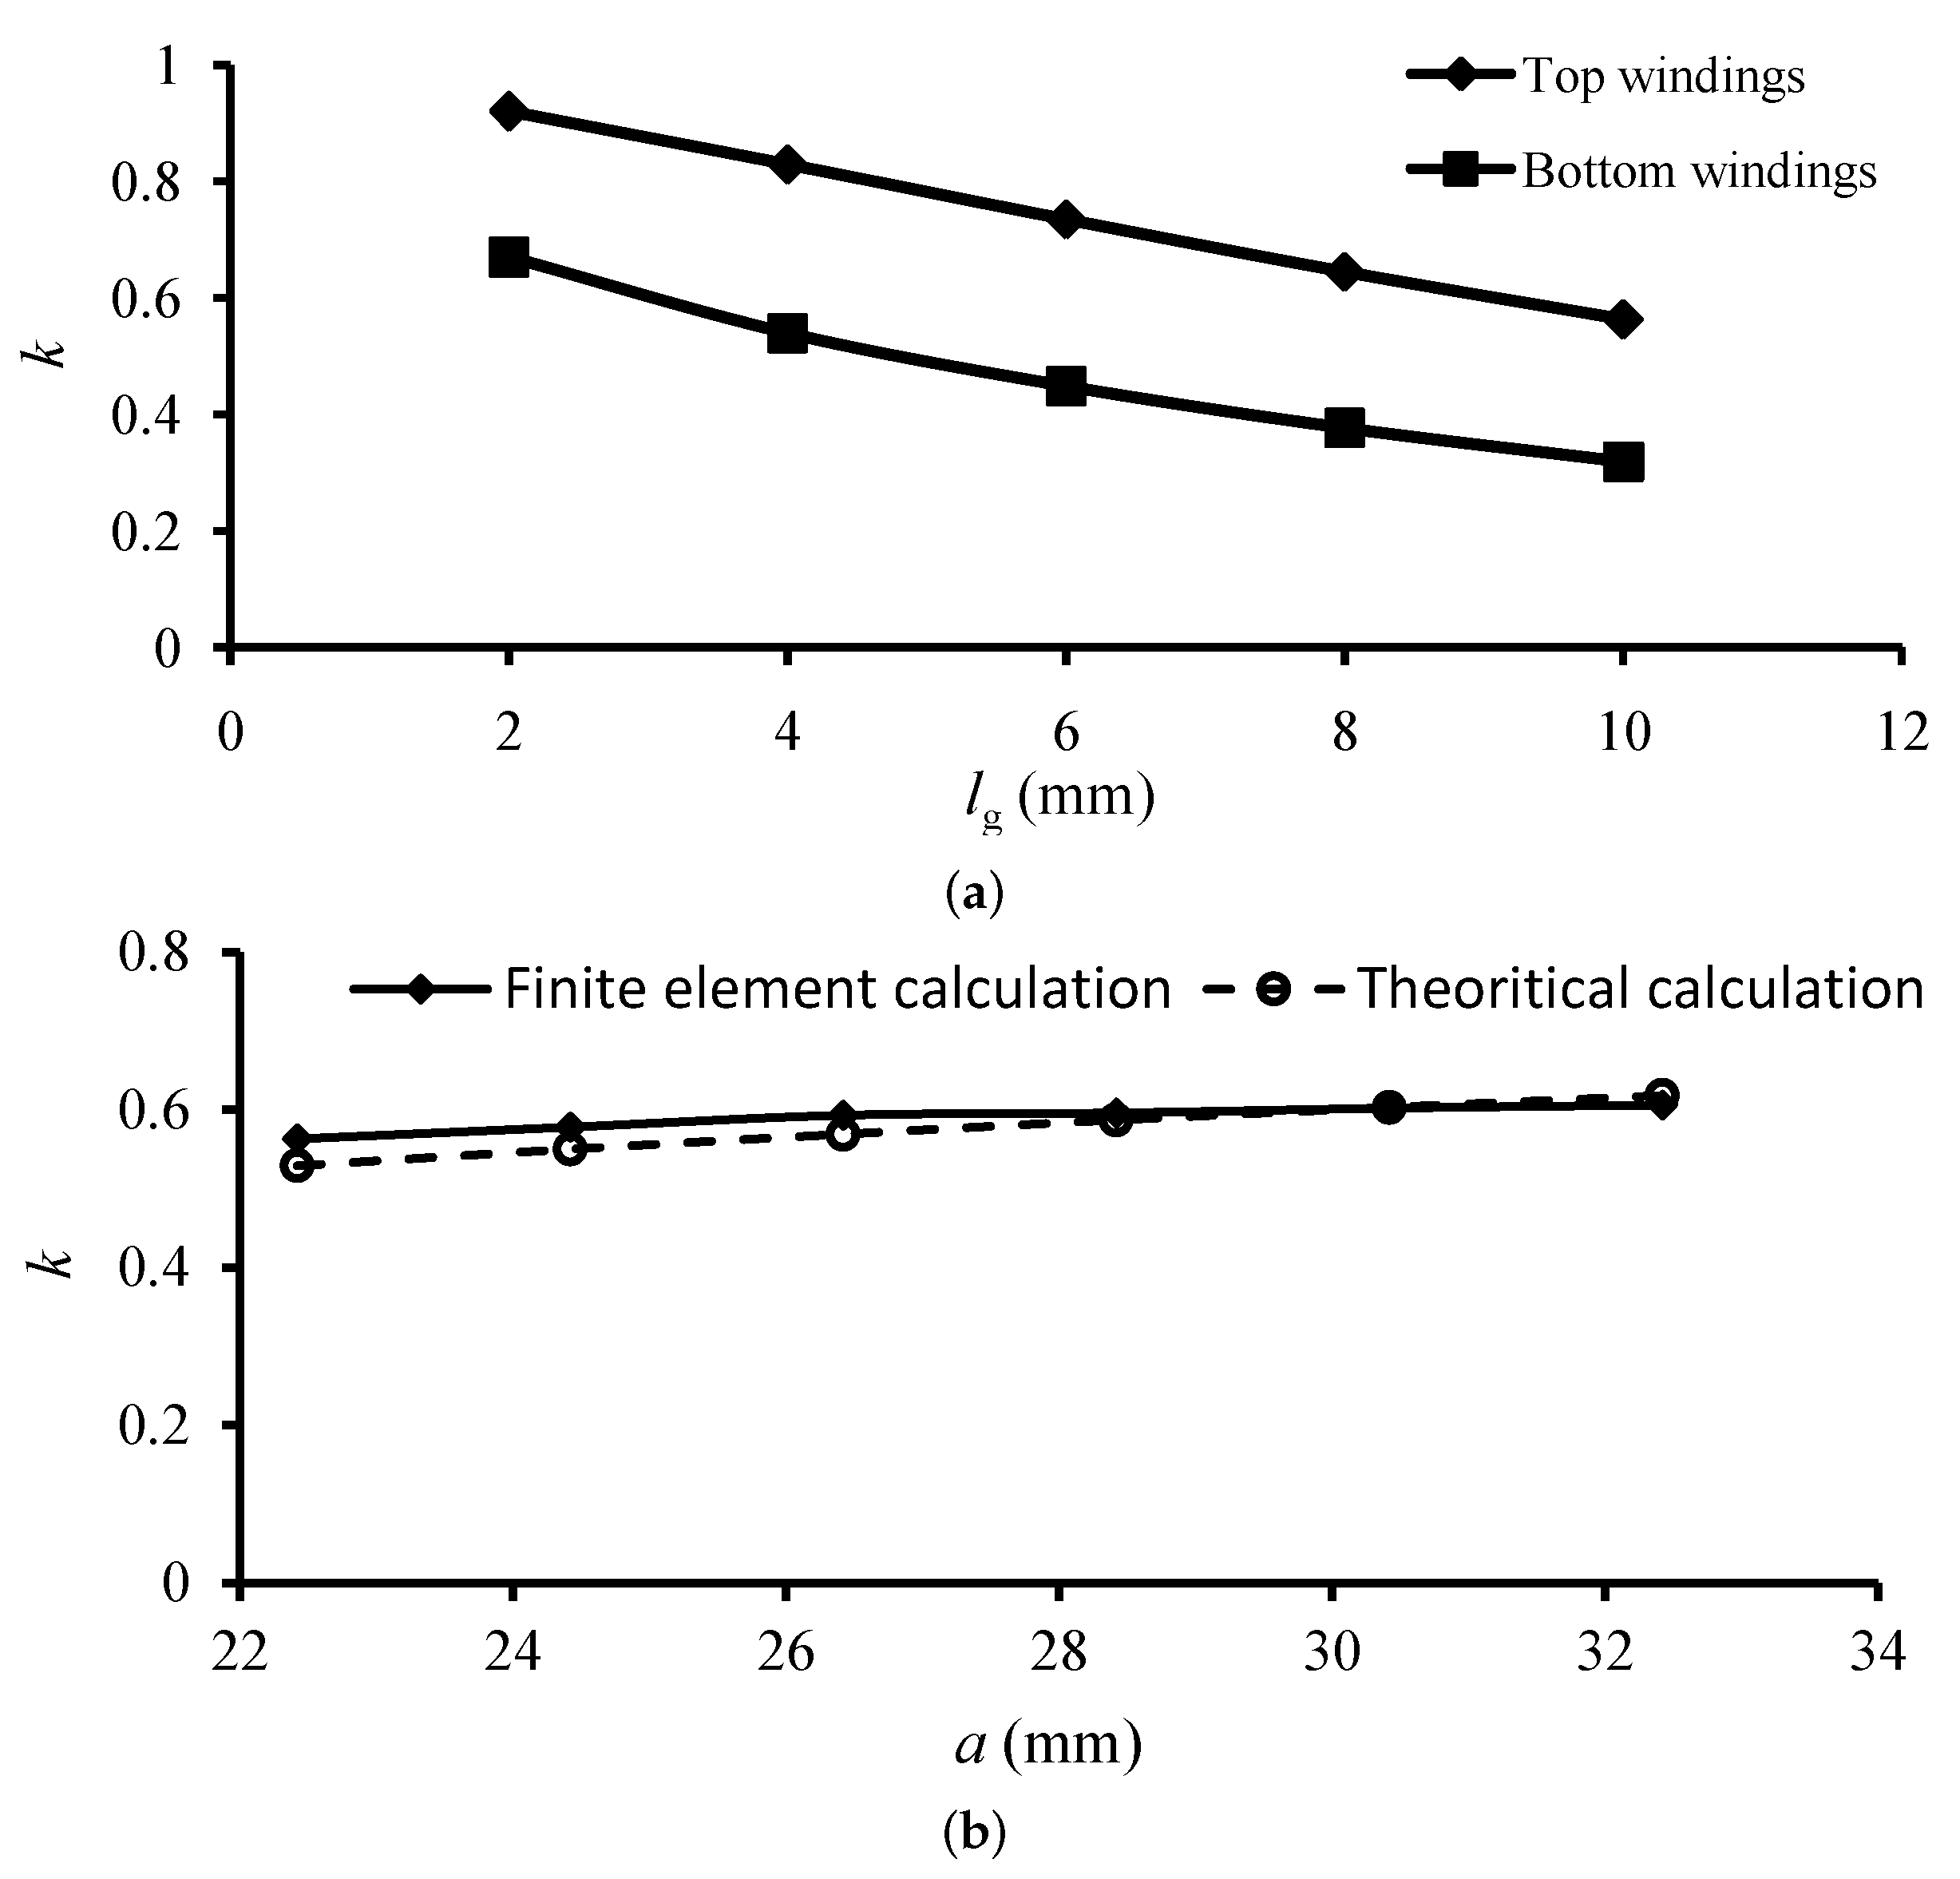
As shown in Figure 5a, regardless of where the coils are, with the number of primary and secondary coils and core dimension unchanged, is larger, and k is smaller. Figure 5b shows the curve of coupling coefficient versus the radius of the core when the air gap length is 10 mm. As seen from the figure, the values calculated according to Equation (31) are close to the ones by finite element calculation, while the coupling coefficient will increase gradually with increase of the dimension of a (but the increment is not large). The reason is that the radius of the pot-type core, a, is approximately , so k is less affected by the size of the core.
3.3. Impact of Coils’ Position
The coils’ position is also an important factor affecting the electromagnetic parameters of the coupler. As shown in Figure 4b, assuming that the coils lie in a certain position, the distance between the coils and the bottom of the core is x, the height and the width of the coils are H and W, respectively. Keeping the current density j constant and H × W unchanged (H × W = 28 mm), the finite element model of the coupler (the detailed diameters of the finite element model can be seen clearly in Figure 6) was constructed to calculate some electromagnetic parameters under different H and coil positions, and the results are shown in Table 1.
From the data shown in Table 1, if H is smaller, then W and x are bigger, and the mutual inductance and the coupling coefficient are larger. The coupling coefficient of the electromagnetic coupler winding at the top is higher than that at the bottom under the same conditions. So, the layout of the coils should be designed carefully.
4. Simulation and Experimental Results
Based on the above design method and a series of initial parameters in the Table 2 (the maximum power point load , the inductances of transmitter coils and receiver coils and , the mutual inductance between primary and secondary coils M), some other important parameters in the wireless power transfer system were calculated and are shown in Table 3. The basic parameters of the electromagnetic coupler (e.g., primary inductance, secondary inductance, mutual inductance, and parasitic resistance) could be obtained by measuring the separated-type transformer with an impedance analyzer or by analyzing with an electromagnetic simulation tool.
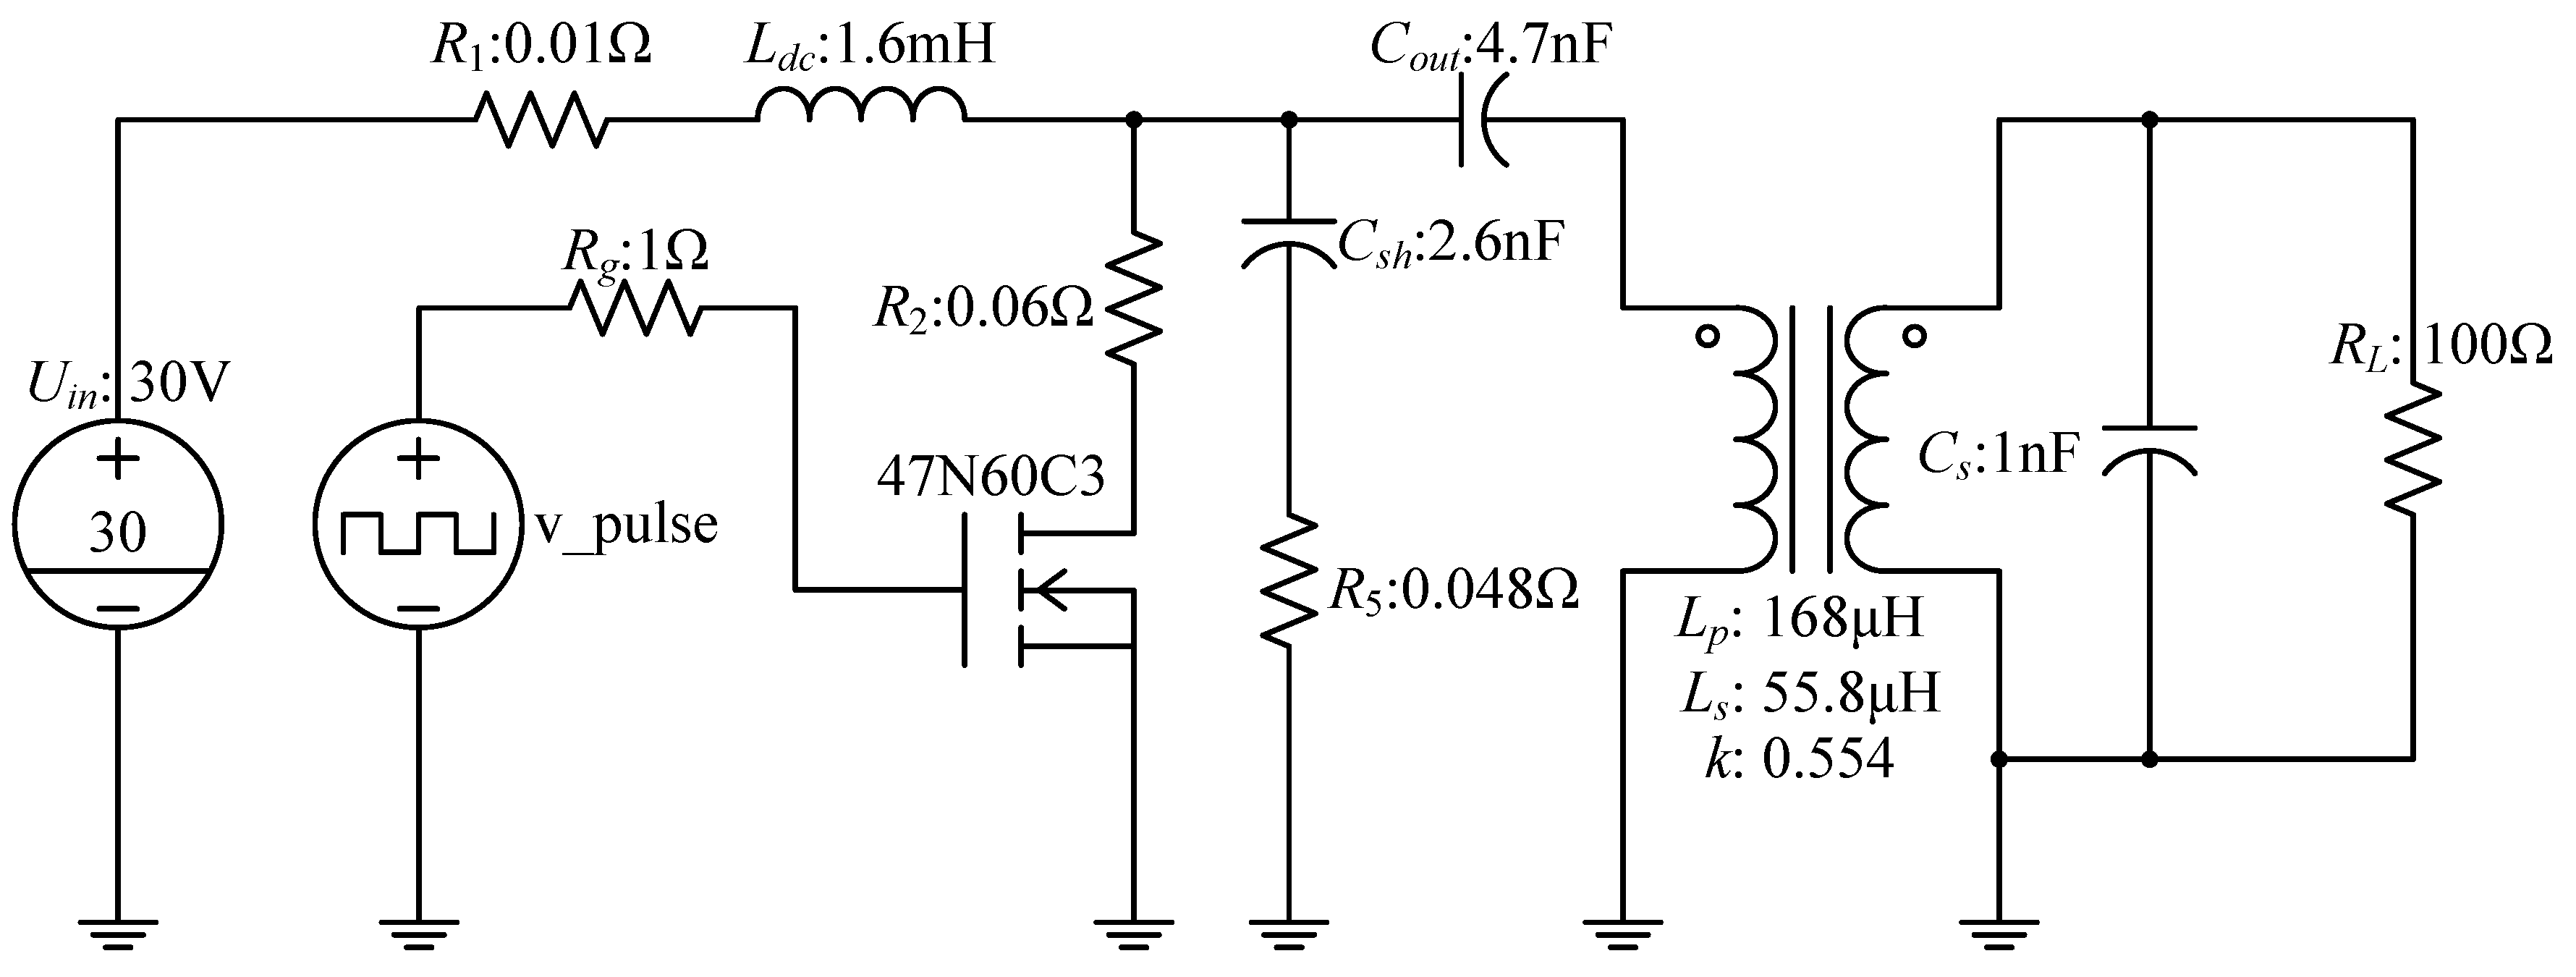
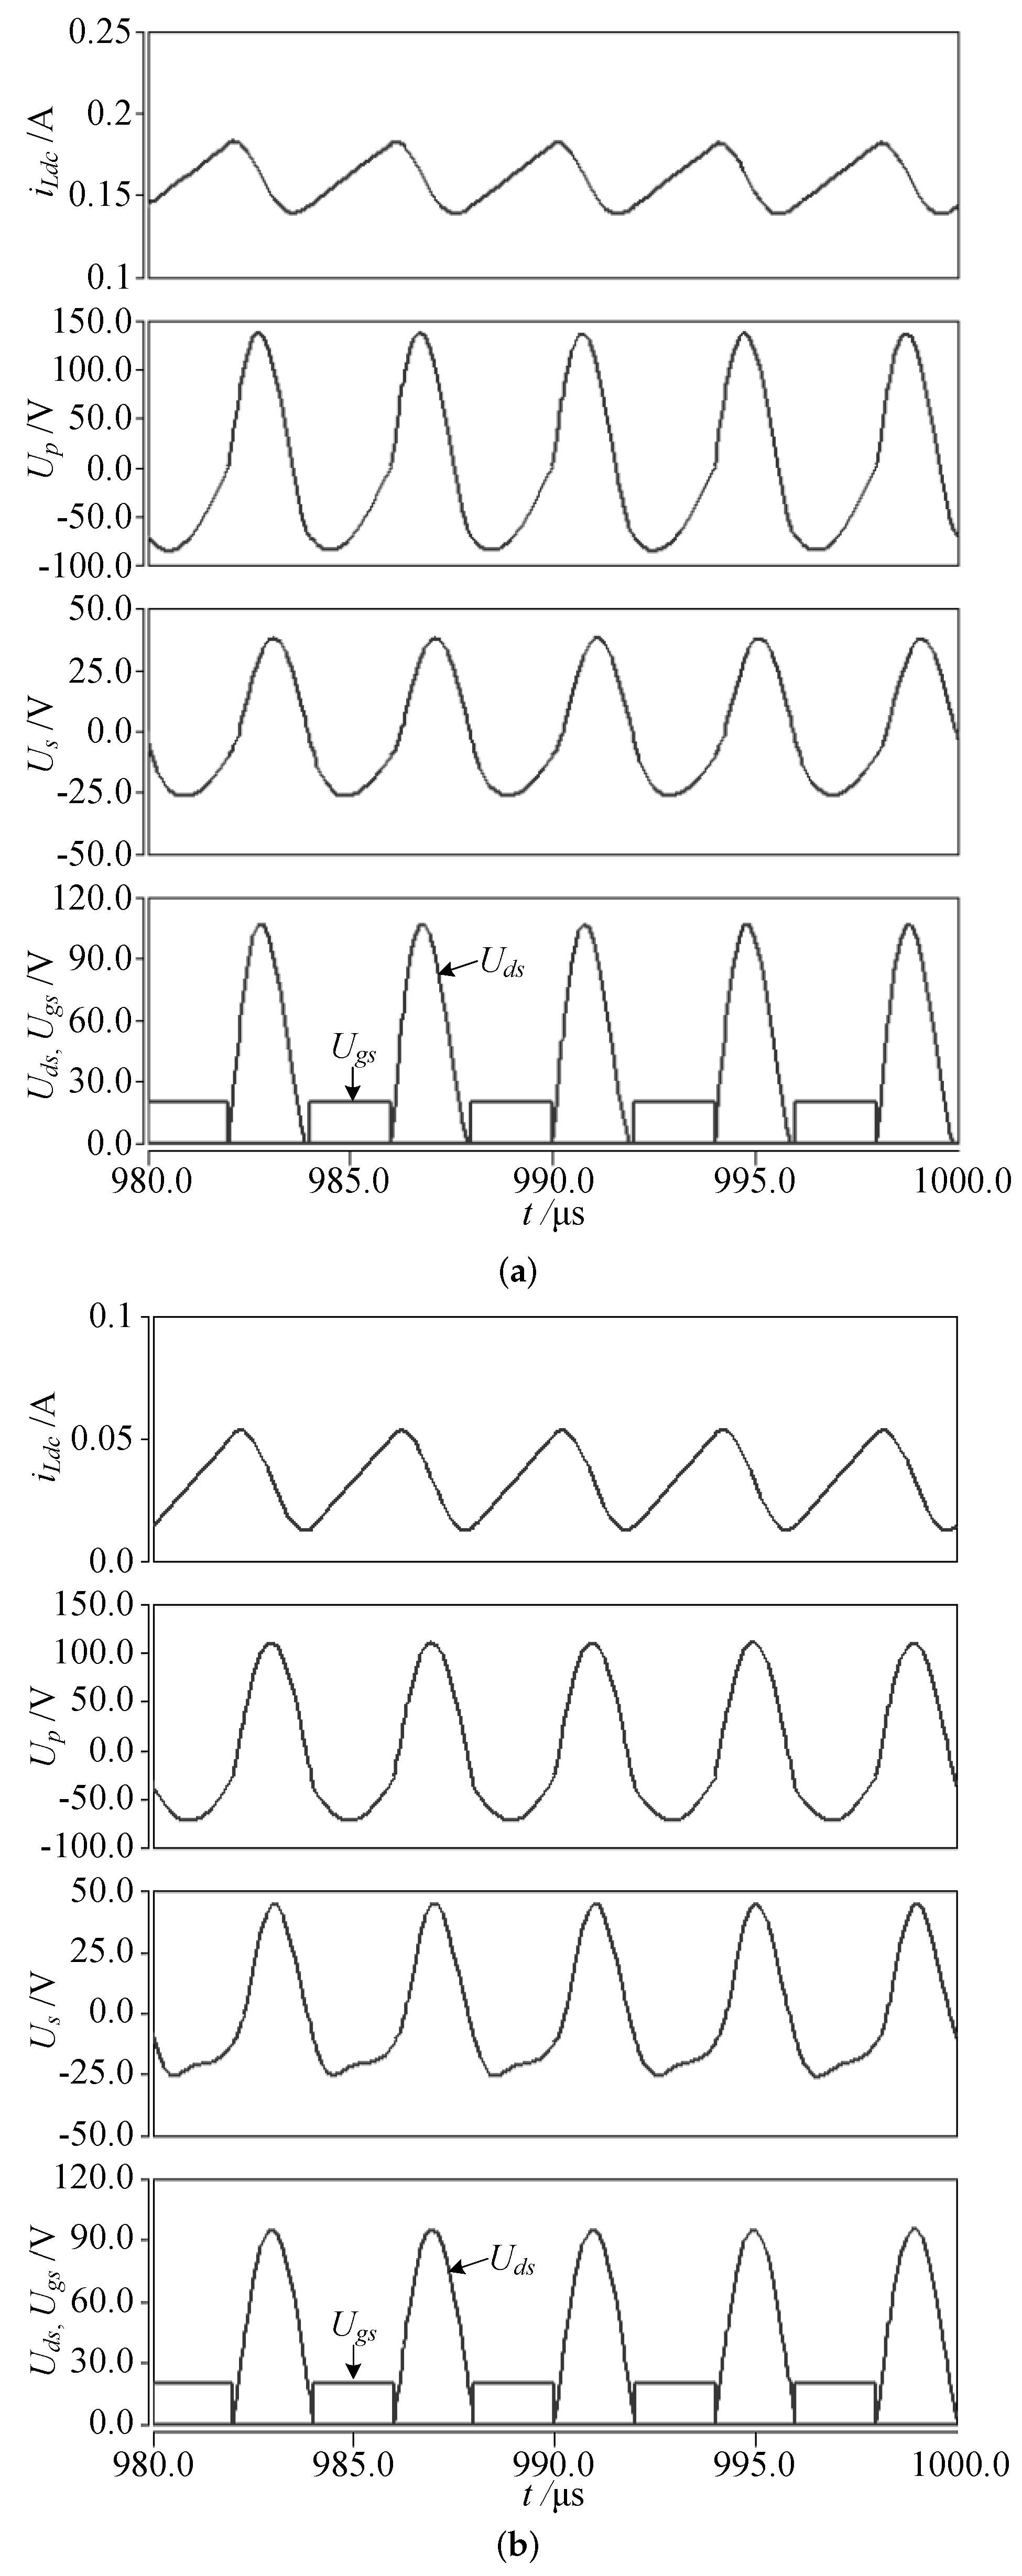
As shown in Figure 7, a simplified wireless power transfer system model was constructed and simulated by adopting Saber software to verify the calculated values of the critical parameters. Simulation waveforms under different load are shown in Figure 8a,b. As seen from drain-source voltage and driving signal waveforms of the switch in the figure, the class E amplifier works in ZVS and ZDS modes to achieve high efficiency.
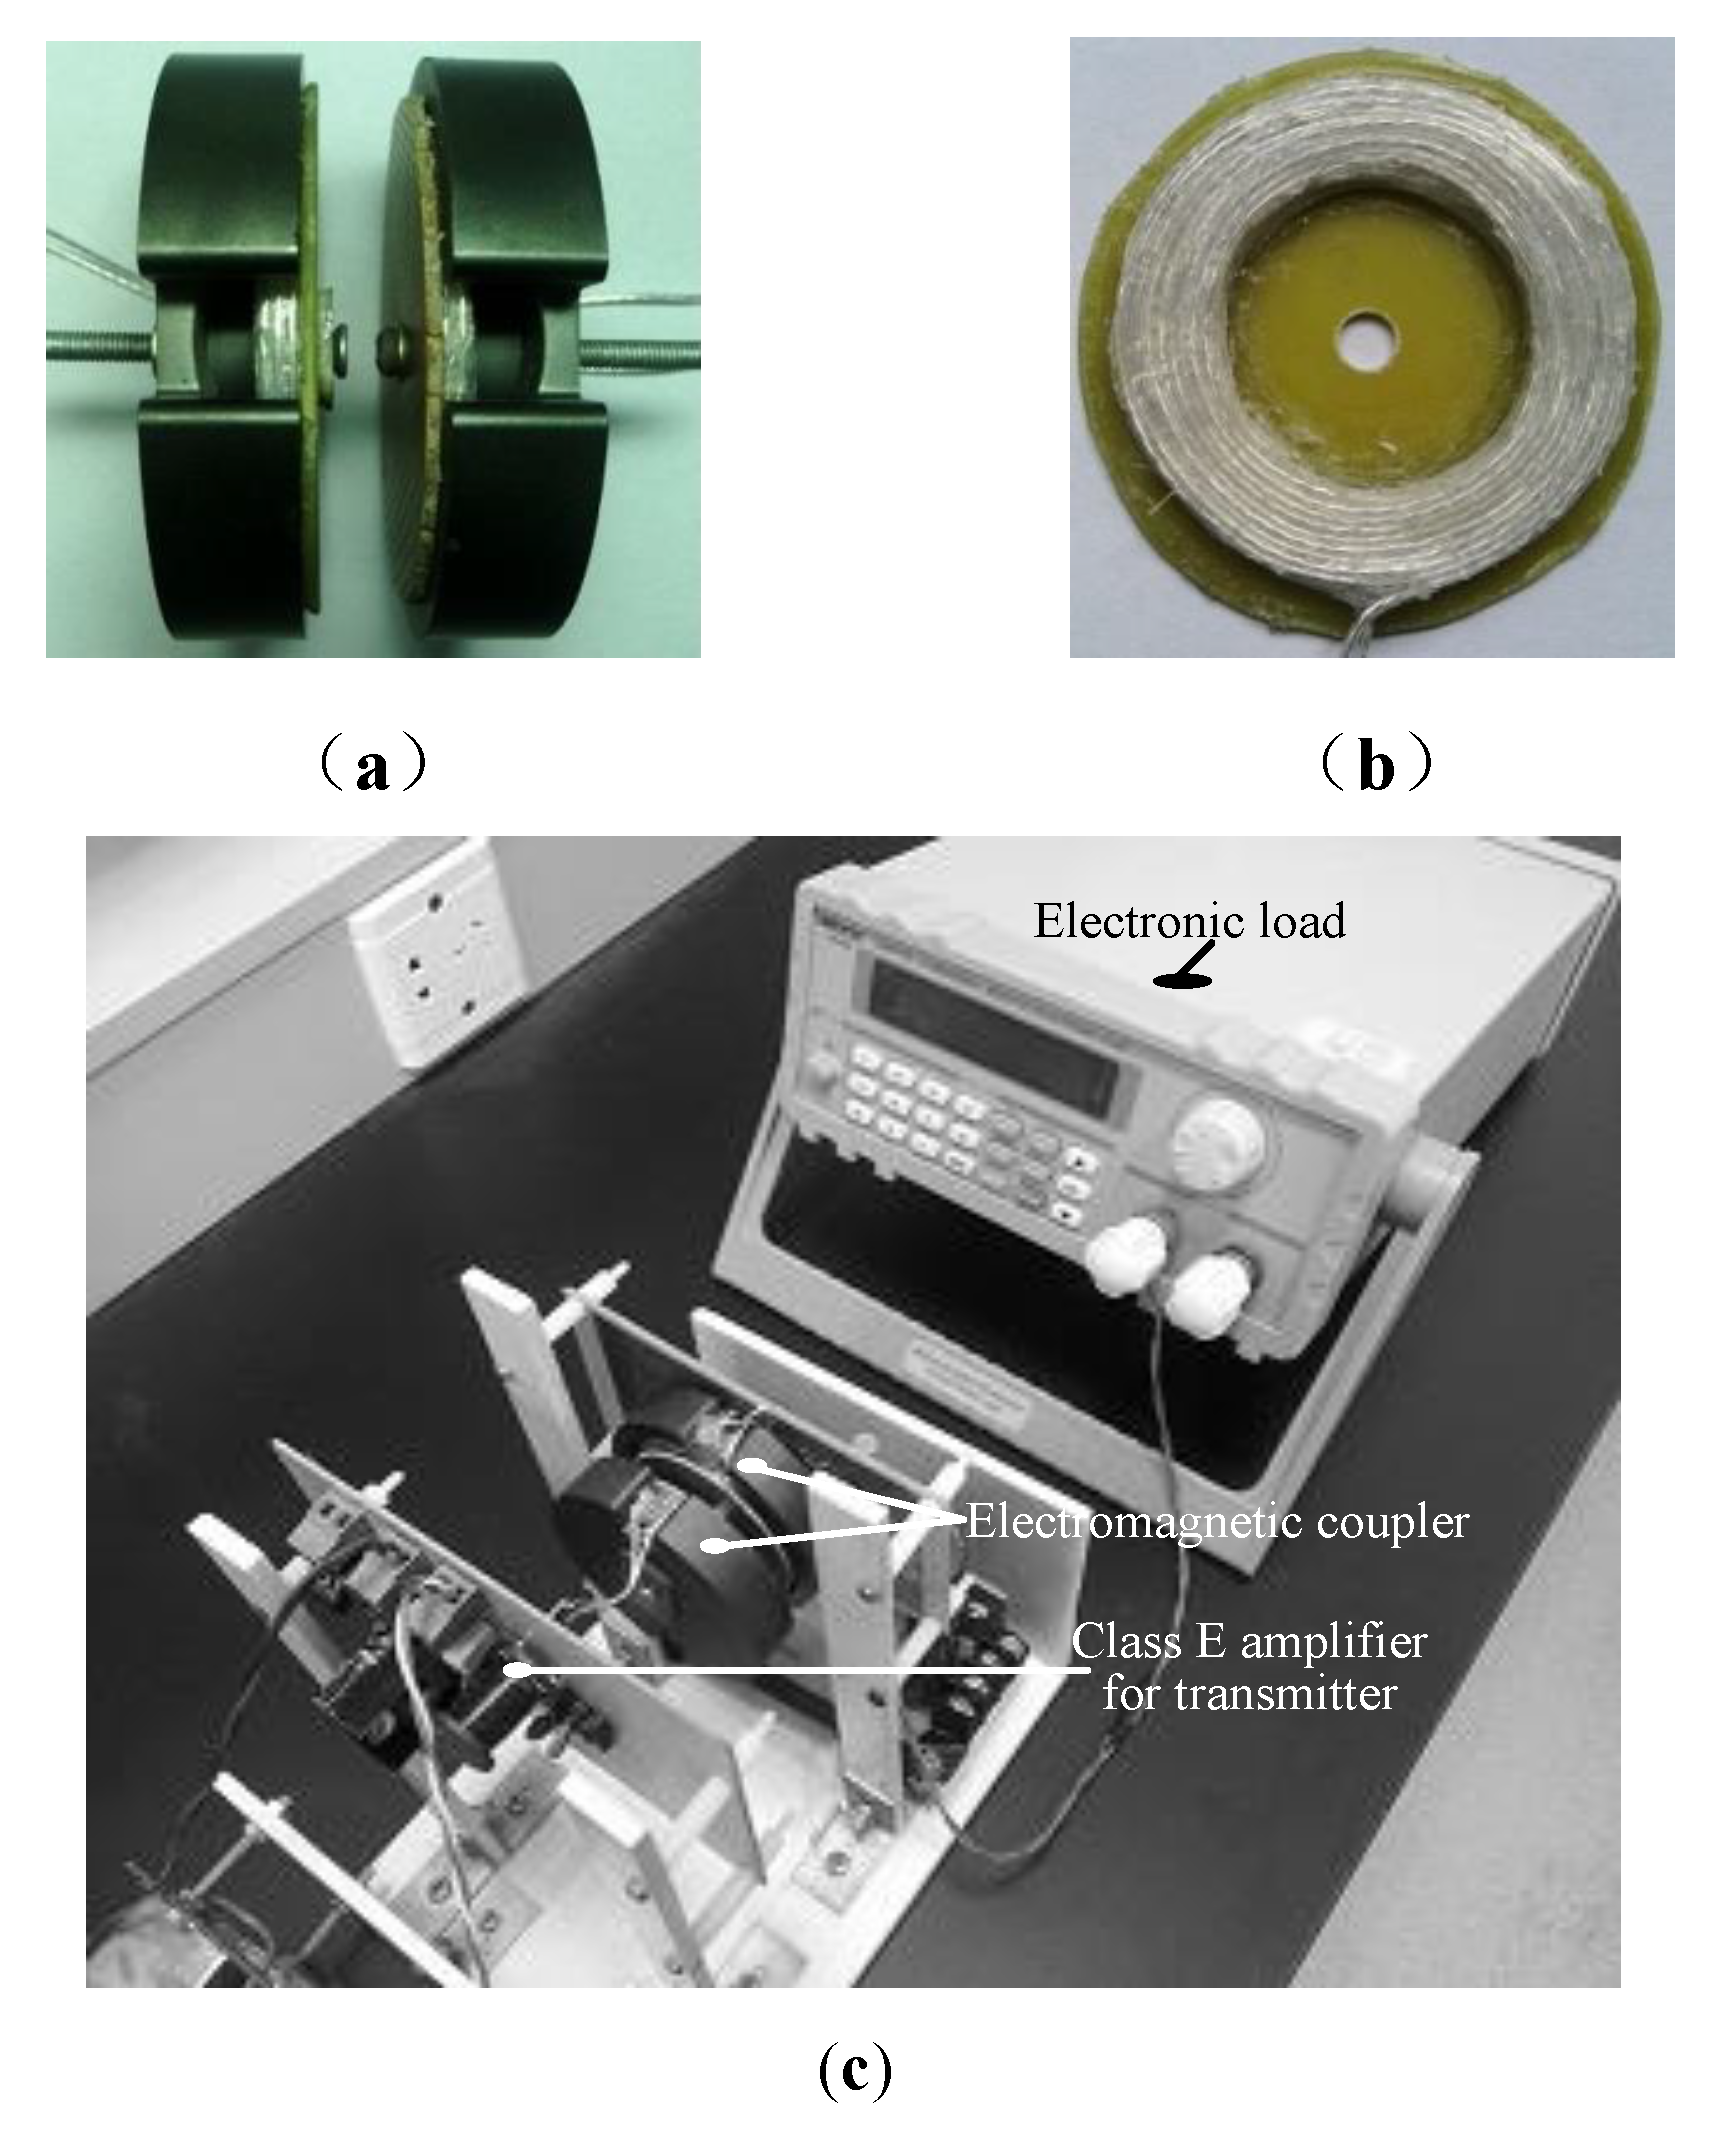
Finally, a prototype of the wireless power charging system based on a class E amplifier with consideration of the maximum power point load was designed and manufactured as shown in Figure 9. As we know, the layout of the coils, as shown in Figure 9a,b, was beneficial for the improvement of the coupling coefficient. The coils were made of Litz wires to minimize parasitic parameters, and a pot-type ferrite core P69 × 14 A was adopted in a separated-type transformer, which was manufactured by Hengdian Group DMEGC Magnetic Co., Ltd in Zhejiang province, China. The MOSFET (Metal-Oxide-Semiconductor Field-Effect Transistor) 47N60C3 manufactured by Infineon Corporation was adopted as the power switch S. The number of primary coils was 35 and the number of secondary coils was 20. On the secondary side, AC power was converted to DC power by a full-bridge rectifier, which was composed of four HER508 diodes.
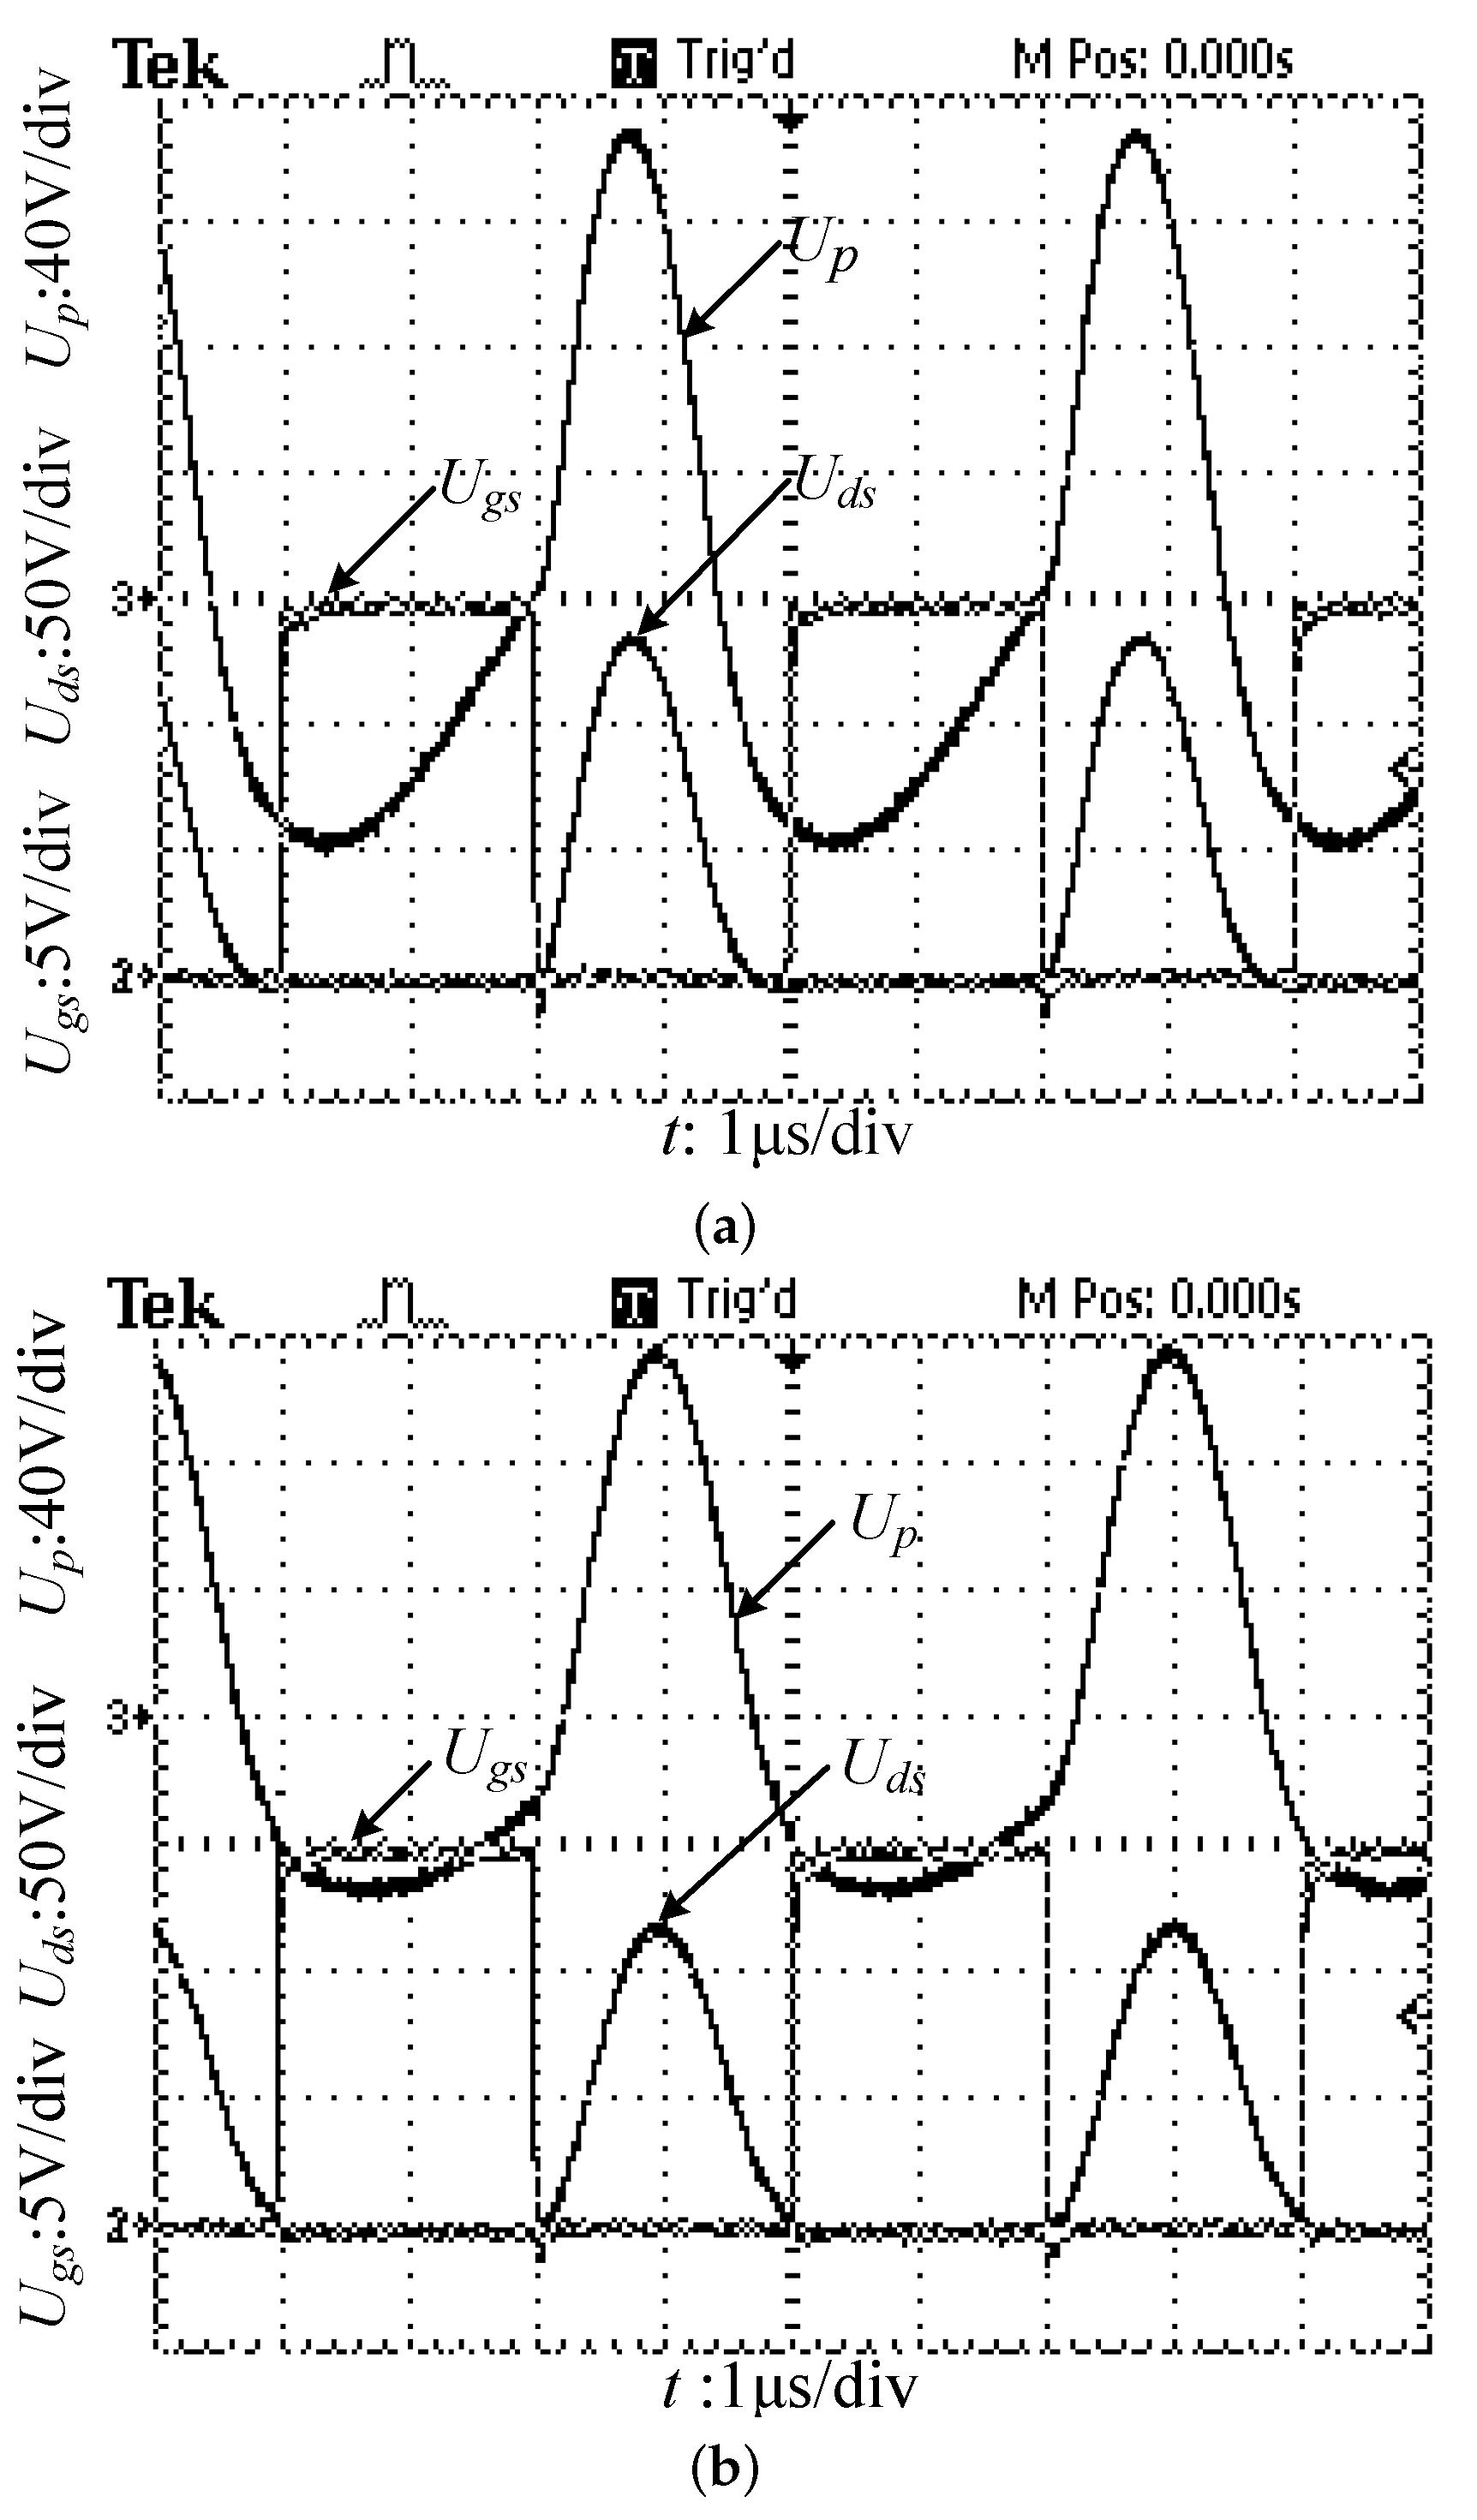
Figure 10a,b show the experimental waveforms with input voltage 30 VDC and 250 kHz operating frequency under 100 and 600 resistor loads, respectively. From the figure, we can see that the voltage waveform of the transmitter coils was generally consistent with the simulation results. When the load resistance was 100 , the experimental waveforms showed that the drain-source peak voltage of the switch was about 130 V, and the turn-on and turn-off of the switch under ZVS were basically realized. This meant that class E amplifier operated in the optimum conditions, satisfying Raab’s theory. Moreover, the voltage waveform acting on the primary inductance was approximately sinusoidal, and it indicated that class E amplifier could achieve a high quality factor.
In some experiments, transmission power and system efficiency were tested when the transfer distance was 10 mm and the system’s input voltage was 30 VDC. Transmission power was measured by an electronic load instrument, and the related data were recorded. Then, a varying trend diagram was made according to the above data by adopting a high-order polynomial data fitting technique (considering an N-order polynomial as the fitting function, the appropriate coefficients of the polynomial were selected to fit the corresponding data into the curve), as shown in Figure 11a,b. The maximum power delivery was 4.2 W and the peak efficiency was over 72%. Compared with the results showing that the maximum power transfer was 3.7 W and the peak efficiency was 66% from Reference [6], the ECPTC introduced in this paper had better performance.
5. Conclusions
In this paper, a mutual inductance model of an electromagnetic coupler is constructed, and a series of design equations for optimizing the performance of a class E amplifier are presented. To achieve the desirable characteristics, the components were selected by constraining the real part and phase angles of the output impedance to the transmitter coils based on the load resistance of the maximum power transfer point and the measured inductance values of the coupler. Meanwhile, a finite element analysis model of electromagnetic coupler was built to analyze the relationship between the coupling coefficient and electromagnetic structure. Finally, the proposed method for optimization was verified by simulation and experiments in a system consisting of a separated-type transformer using pot-type ferrite magnetic core with a variable load. Experimental results showed that the system had a power transmission capacity of 4.2 W and a peak efficiency of over 72%, and a desirable trend to reduce power and efficiency in respect of increasing load resistance.
Author Contributions
W.D. proposed the parameter design method of the circuit based on the maximum power point load for wireless power transfer, performed the methodology using the mutual inductance model of the couple and electromagnetic field finite element analysis, planned corresponding experiments, and wrote the original draft. W.T. finished the experiment and analyzed the experimental data. C.C. and L.D. provided assistance in the experimental raw materials and the coupler manufacturing process. X.Z. completed the revision and edition.
Funding
This work was supported in part by the Fundamental Research Funds for the Central Universities under Grant No. 2018B23414, in part by the National Natural Science Foundation of China under Grant No. 51207043 and No. 51607057, and in part by the Open Funds for Jiangsu Key Laboratory of Power Transmission and Distribution Equipment Technology under Grant No. 2017JSSPD05.
Acknowledgments
The authors thank all those involved in the study program and in the preparation of this paper. Moreover, the authors thank the anonymous reviewers for their useful comments that improved the quality of the paper.
Conflicts of Interest
The authors declare no conflict of interest.
References
- Sakamoto, H.; Harada, K.; Washimiya, S.; Takehara, K. Large air-gap coupler for inductive charger [for electric vehicles]. IEEE Trans. Magn. 1999, 35, 3526–3528. [Google Scholar] [CrossRef]
- Sugimori, K.; Sakamoto, H.; Harada, K. A one-converter contactless charger for electric vehicles. Electr. Eng. Jpn. 2000, 132, 73–81. [Google Scholar] [CrossRef]
- Wang, C.S.; Stielau, O.H.; Covic, G.A. Design Considerations for a Contactless Electric Vehicle Battery Charger. IEEE Trans. Ind. Electron. 2005, 52, 1308–1314. [Google Scholar] [CrossRef]
- Watada, M.; Iwawaki, K.; Tamada, T.; Ouchi, K.; Takatani, S.; Um, Y.S. The development of core-type Transcutaneous Energy Transmission System for artificial heart. IEEE Eng. Med. Biol. Soc. 2005, 4, 3849–3852. [Google Scholar]
- Lim, H.G.; Yoon, Y.H.; Lee, C.W.; Park, I.Y.; Song, B.S.; Cho, J.H. Implementation of a Transcutaneous Charger for Fully Implantable Middle Ear Hearing Device. IEEE Eng. Med. Biol. Soc. 2005, 7, 6813–6816. [Google Scholar]
- Casanova, J.J.; Low, Z.N.; Lin, J.S. Design and Optimization of a Class-E Amplifier for a Loosely Coupled Planar Wireless Power System. IEEE Trans. Circuits Syst. Express Briefs 2009, 56, 830–834. [Google Scholar] [CrossRef]
- Low, Z.N.; Chinga, R.A.; Tseng, R.; Lin, J. Design and test of a high-power high-efficiency loosely coupled planar wireless power transfer system. IEEE Trans. Ind. Electron. 2009, 56, 1801–1812. [Google Scholar]
- Chaimanonart, N.; Olszens, K.R.; Zimmerman, M.D.; Ko, W.H.; Young, D.J. Implantable RF Power Converter for Small Animal In Vivo Biological Monitoring. IEEE Eng. Med. Biol. Soc. 2005, 5, 5194–5197. [Google Scholar]
- Bradley, A.M.; Feezor, M.D.; Singh, H.; Sorrell, F.Y. Power systems for autonomous underwater vehicles. IEEE J. Ocean. Eng. 2001, 26, 526–538. [Google Scholar] [CrossRef]
- Li, Z.S.; Li, D.J.; Lin, L.; Chen, Y. Design Considerations for electromagnetic couplers in contactless power transmission systems for deep-sea applications. J. Zhejiang Univ. Sci. C 2010, 11, 824–834. [Google Scholar] [CrossRef]
- Manikandan, J.; Akash, S.; Vishwananth, A.; Nandakumar, R.; Agrawal, V.K.; Manu, K. Design and development of contactless battery charger for underwater vehicles. In Proceedings of the Michael Faraday IET International Summit, Kolkata, India, 12–13 September 2015; pp. 362–367. [Google Scholar]
- Zoran, H.V.; Nikola, Z.; Trung, Q.D.; Schober, R. Rate Maximization of Decode-and-Forward Relaying Systems With RF Energy Harvesting. IEEE Commun. Lett. 2015, 19, 2290–2293. [Google Scholar] [Green Version]
- Tsiropoulou, E.E.; Mitsis, G.; Papavassiliou, S. Interest-aware Energy Collection & Resource Management in Machine to Machine Communications. Ad Hoc Netw. 2018, 68, 48–57. [Google Scholar]
- Vamvakas, P.; Tsiropoulou, E.E.; Vomvas, M.; Papavassiliou, S. Adaptive Power Management in Wireless Powered Communication Networks: A User-Centric Approach. In Proceedings of the 38th IEEE Sarnoff Symposium, Newark, NJ, USA, 18–20 September 2017; pp. 1–6. [Google Scholar]
- Le, T.A.; Vien, Q.T.; Nguyen, H.X.; Ng, D.W.K.; Schober, R. Robust Chance-Constrained Optimization for Power-Efficient and Secure SWIPT Systems. IEEE Trans. Green Comm. Netw. 2017, 1, 333–346. [Google Scholar] [CrossRef] [Green Version]
- Wu, Q.Q.; Chen, W.; Ng, D.W.K.; Schober, R. Spectral and Energy-Efficient Wireless Powered IoT Networks: NOMA or TDMA? IEEE Trans. Veh. Technol. 2018, 67, 6663–6667. [Google Scholar] [CrossRef] [Green Version]
- Kurs, A.; Karalis, A.; Moffatt, R.; Joannopoulos, J.D.; Fisher, P.; Soljacic, M. Wireless Power Transfer via Strongly Coupled Magnetic Resonances. Science 2007, 317, 83–85. [Google Scholar] [CrossRef] [PubMed]
- Baker, M.W.; Sarpeshkar, R. Feedback analysis and design of RF power links for low-power bionic system. IEEE Trans. Biomed. Circuits Syst. 2007, 1, 28–38. [Google Scholar] [CrossRef] [PubMed]
- Sokal, N.O.; Sokal, A.D. Class E-A new class of high-efficiency tuned single-ended switching power amplifiers. IEEE J. Solid-State Circuits 1975, 10, 168–176. [Google Scholar] [CrossRef]
- Raab, F.H. Idealized operation of the class E tuned power amplifier Class. IEEE Trans. Circuits Syst. 1977, 24, 725–735. [Google Scholar] [CrossRef]
- Raab, F.H. Effects of Circuit Variations on the Class E Tuned Power Amplifier. IEEE J. Solid-State Circuits 1978, 13, 239–247. [Google Scholar] [CrossRef]
Figure 1.
Configuration diagram of a wireless power transfer (WPT) System.

Figure 2.
Equivalent circuit model of the electromagnetic coupling power transfer charger (ECPTC). (a) Simplified schematic circuit of the charger; (b) Schematic circuit reflected to the transmitter side.
Figure 2.
Equivalent circuit model of the electromagnetic coupling power transfer charger (ECPTC). (a) Simplified schematic circuit of the charger; (b) Schematic circuit reflected to the transmitter side.

Figure 3.
The real part of varying with the load.

Figure 4.
Structure and magnetic circuit of the coupler. (a) Structure; (b) 2D finite element model; (c) Magnetic flux distribution; (d) Magnetic circuit model.
Figure 4.
Structure and magnetic circuit of the coupler. (a) Structure; (b) 2D finite element model; (c) Magnetic flux distribution; (d) Magnetic circuit model.

Figure 5.
Relation to coupler parameters and coupling coefficient. (a) The relation between coupling coefficient and gap length; (b) Coupling coefficient versus effective radius of the magnet core.
Figure 5.
Relation to coupler parameters and coupling coefficient. (a) The relation between coupling coefficient and gap length; (b) Coupling coefficient versus effective radius of the magnet core.

Figure 6.
Position of the coils. (a) Top position; (b) Bottom position.

Figure 7.
Simulation model of WPT based on a class E amplifier.

Figure 8.
Simulation waveforms under different loads: (a) ; (b) .

Figure 9.
Prototype of the coupler and ECPTC: (a) Electromagnetic coupler; (b) Coils of the coupler; (c) Prototype.
Figure 9.
Prototype of the coupler and ECPTC: (a) Electromagnetic coupler; (b) Coils of the coupler; (c) Prototype.

Figure 10.
Experimental waveforms under different loads: (a) ; (b) .

Figure 11.
Power transfer and efficiency curves of ECPTC: (a) Output power versus the load; (b) System efficiency versus the load.
Figure 11.
Power transfer and efficiency curves of ECPTC: (a) Output power versus the load; (b) System efficiency versus the load.


Table 1.
Electromagnetic parameters of the coupler. ().
| Coils Position | H (mm) | (H) | (H) | M (H) | k |
|---|---|---|---|---|---|
| 2 | 160.4 | 52.4 | 54.9 | 0.598 | |
| 3 | 164.4 | 53.6 | 51.6 | 0.549 | |
| Top | 4 | 171.1 | 55.9 | 49.8 | 0.509 |
| 5 | 178.5 | 58.3 | 48.9 | 0.479 | |
| 6 | 186.0 | 60.7 | 48.5 | 0.456 | |
| 2 | 258.0 | 84.3 | 53.7 | 0.364 | |
| 3 | 256.1 | 83.7 | 52.3 | 0.357 | |
| Bottom | 4 | 256.7 | 83.8 | 52.3 | 0.356 |
| 5 | 253.0 | 82.6 | 50.8 | 0.351 | |
| 6 | 246.2 | 80.4 | 50.4 | 0.358 |
Table 2.
Initial parameters used in the design procedure.
| Parameters | Measured | Parasitic Resistance |
|---|---|---|
| 100 | ||
| 168 H | 0.38 | |
| 55.8 H | 0.19 | |
| M | 53.66 H |
Table 3.
Critical parameters of the charger.
| Components | Calculated | Simulation Value | Experimental Value |
|---|---|---|---|
| 1.6 mH | 1.6 mH | 1.6 mH | |
| 3.6 nF | 4.7 nF | 4.7 nF | |
| 0.9 nF | 1 nF | 1 nF | |
| 2.5 nF | 2.6 nF | 2 nF |
© 2018 by the authors. Licensee MDPI, Basel, Switzerland. This article is an open access article distributed under the terms and conditions of the Creative Commons Attribution (CC BY) license (http://creativecommons.org/licenses/by/4.0/).
Share and Cite
MDPI and ACS Style
Dai, W.; Tang, W.; Cai, C.; Deng, L.; Zhang, X. Wireless Power Charger Based on Class E Amplifier with the Maximum Power Point Load Consideration. Energies 2018, 11, 2378. https://doi.org/10.3390/en11092378
AMA Style
Dai W, Tang W, Cai C, Deng L, Zhang X. Wireless Power Charger Based on Class E Amplifier with the Maximum Power Point Load Consideration. Energies. 2018; 11(9):2378. https://doi.org/10.3390/en11092378
Chicago/Turabian StyleDai, Weili, Wei Tang, Changchun Cai, Lihua Deng, and Xiaofeng Zhang. 2018. "Wireless Power Charger Based on Class E Amplifier with the Maximum Power Point Load Consideration" Energies 11, no. 9: 2378. https://doi.org/10.3390/en11092378
Note that from the first issue of 2016, this journal uses article numbers instead of page numbers. See further details here.