Numerical Study of the Respirable Coal Dust Removal Performance of a Vortex Ventilation System at an Excavation Face


1
State Key Laboratory of Coal Resources and Safe Mining, China University of Mining and Technology, Xuzhou 221116, China
2
Department of Mining Engineering and Metallurgical Engineering, WA School of Mines: Minerals, Energy and Chemical Engineering, Curtin University, Kalgoorlie, WA 6430, Australia
3
School of Safety Engineering, China University of Mining and Technology, Xuzhou 221116, China
*
Author to whom correspondence should be addressed.
Energies 2018, 11(9), 2449; https://doi.org/10.3390/en11092449
Submission received: 6 August 2018
/
Revised: 11 September 2018
/
Accepted: 12 September 2018
/
Published: 14 September 2018
(This article belongs to the Special Issue Computational Fluid Dynamics (CFD) 2018)
Abstract
:Coal dust is one of the most serious issues in coal mines. The miners at an excavation face have a high potential for exposure to high concentrations of coal dust. The main method for removing coal dust is by ventilation. To better control the coal dust at the excavation face, it is important to understand the coal dust movement patterns and distribution characteristics. This paper used the computational fluid dynamics (CFD) approach to simulate coal dust movement under two different ventilation systems. The Eulerian-Lagrange method was used to study the gas‒solid two-phase fluid behavior. The coal dust concentration distributions under the two ventilation systems are presented and further compared. From the comparison results, it is found that a vortex ventilation system has better coal dust removal performance. This ventilation system is recommended for excavation for better coal dust control and miners’ health protection.
1. Introduction
Coal is an important energy source around the world. With the development of total mechanization in the mining industry, coal production has increased rapidly in recent years. Large amounts of coal dust have also been generated during mining activities. Coal dust not only has the potential to affect the performance of mining equipment, but also creates safety issues for the mining industry. In addition, most of the dust is respirable, so it could penetrate the human respiratory system and enter the lungs. Studies have shown that long-term exposure to high concentrations of coal dust can lead to pneumoconiosis and lung cancers [1,2]. Such lung diseases contribute to a high mortality rate in miners [3,4,5]. It has been reported that more than 80% of all coal dust is generated at the excavation face during the excavation activity [6]. The miners who work in this area have a high potential for exposure to high concentrations of coal dust. In order to provide a safe working environment for miners, it is necessary to control the coal dust effectively at the excavation face.
Currently, there are three main methods to control coal dust at the excavation face. The first one is ventilation, which is also the most popular method. The other two methods are water spraying and foam technology [7,8]. However, the control performance is limited by the single usage of each method. For example, water spraying requires a large amount of water and the high pressure may affect the mining equipment. For the foam technology, the foam injecting machine is usually large, so it is difficult to settle the device properly at the space-limited excavation face. Ventilation is still the main approach to reducing coal dust. Currently, long blowing and short suction is a commonly used ventilation method at the excavation face. However, the limitations of this method are apparent. Under this ventilation system, it is hard to balance the methane control and coal dust control at the same time. The shorter the distance between the blowing duct outlet and the heading face, the better the methane control that can be achieved. However, under this ventilation, only a small part of the coal dust is sucked into the duct; most of the coal dust moves to the back of the excavator and diffuses slowly to the whole development face. Basically, the dust collector is installed at the outlet of the suction duct, which is on the exhaust fan. For this reason, most of the coal dust cannot be collected by the dust collector and vice versa. Thus, it is important to find a better ventilation system to control the coal dust. Previous research [9] illustrated a ventilation system, called a vortex ventilation system, to better control the coal dust. For the vortex ventilation system, under the current ventilation system (long blowing and short suction ventilation system), a rotating annular disk is usually installed in the duct head face, thus generating a vortex at the front of the suction duct when it is working.
The pressuring wind, produced by long blowing and short suction, is a restricted wall-attached jet and arrives at the heading face at a rather high speed. The dust generated by the excavating operation are spread by jet flow and some of it is purified by a vacuum cleaner. The other dust diffuses onto the roadway after the excavator and is difficult to control completely. With a rotating annular disk, the vortex ventilation changes the restricted wall-attached jet into an axial rotating wind, a rotated air curtain is formed in the heading face. The dusty air flow is controlled by the air curtain and most of the dust is restricted to a small area, meaning it is easily collected by the dust collector and discharged at the working face. Theoretically, a vortex ventilation system has better performance in dust control and has three main advantages compared to the long blowing and short suction ventilation. First, with a large diffusion angle, the swirling vortex can generate an air curtain at the front of the excavator, which prevents the coal dust from moving to the deep part of the excavation face and diffusing outward. Second, the vortex ventilation system generates a big negative pressure area at the front of the suction duct, which helps with carrying the coal dust to the dust collector. Third, the vortex decreases the air velocity in the tunnel axis direction, which increases the duct collect efficiency. Thus, the vortex ventilation performs better at duct control than the long blowing and short suction ventilation. However, how the vortex is generated, where the generated vortex is located, and how the dust control performance compares to the long blowing and short suction ventilation are still not clear from the previous study. For these reasons, it is important to understand the coal dust distribution characteristics and the mechanism of coal dust control by vortex ventilation at the excavation face.
With the development of computer technology, the computational fluid dynamics (CFD) approach has been widely used to study the gas-solid two-phase flows in the mining industry. Collecutt et al., [10] used the CFD method to examine the performance of the explosion barriers after a coal dust explosion. Hu et al., [11,12] conducted two studies to analysis the coal dust dispersion patterns in a roadway after a blasting. Fan et al., [13] studied the dust dispersion characteristics under a hybrid ventilation system by CFD simulation. Torano et al., [14] compared the dust behavior in an underground roadway under two auxiliary ventilations. Ren et al., [15,16] applied the modeling method to analyze the dust flow behavior above an underground bin and evaluate the dust removal efficiency of an innovative dust mitigation system. Glushkov et al., [17] applied the CFD approach to simulate the heat and mass transfer processes at low-temperature ignition of coal particles, analyzed the boundary ignition conditions of components (volatiles and carbon), and gathered results on coal particle thermal decomposition. All these studies demonstrated that CFD has become a powerful tool to simulate coal dust behavior in underground mines.
The objective of this paper is to simulate the coal dust distributions at an excavation face in an underground mine. The Eulerian-Lagrangian method is used to simulate the air-solid two-phase flow. The dust distributions under two ventilation systems are evaluated. One is a long blowing and short suction ventilation system (long-short ventilation system). The other one is a vortex ventilation system. Both the distribution of total dust size and respirable size are analyzed in this work. The obtained simulation data under two ventilation systems are further compared. The results showed that the vortex ventilation system performed better in term of coal dust removal.
2. Model Description
2.1. Physical Model
The physical model built in this paper is based on an underground excavation face in Dongtan Coal Mine, located in Shandong Province, China. The length of the working face is about 40 m and the cross-sectional dimensions are 4 m (width) × 3 m (height), as shown in Figure 1. For the long blowing and short suction ventilation system, the long blowing duct is close to the right-side wall and around 0.2 m away from the roof; the short suction duct is located in the middle of the working face, 2 m and 1.5 m away from the right side wall and roof, respectively. The diameter of both the blowing duct and suction is 0.5 m. The meshes for the model are generated by tetrahedral meshes, as shown in Figure 2. The number of volumes for the mesh is around 0.2 million. The mesh independence study has been conducted in previous research. The same size of mesh is used in this study for the simulation [18]. The total element quality for the mesh is above 0.4; all the mesh has passed the Gambit grid check utility, which is acceptable for most of the solvers in Fluent.
2.2. Mathematical Model
The Eulerian-Lagrangian approach is used to simulate the gas-solid coupled flows in this paper. In this method, the airflow is first simulated to steady-state by the Eulerian method, then the airflow field is frozen before emitting the particles. After tis the Lagrangian approach is applied to calculate the motion of dust particles.
The gas phase is considered incompressible and is governed by Navier-Stokes Equation [19]. The continuity and momentum equations are given by:
where is the air velocity, is the air density, is the static pressure, is the gravity acceleration, is the molecular viscosity, is the turbulent viscosity, k is the turbulent kinetic energy and is the unit tensor.
The motion of dust particles is governed by the Lagrangian method [20], which is calculated by Newton’s second law. The one-way coupling method (only considering the effect of air flow on the particles’ motion) is selected as the particles’ volume fraction is less than 10−6 [21]. With a low particle volume fraction, the interaction between particles is less significant compared to other forces, and thus could be ignored in this study. In the airflow field, many forces act on the motion of particles, like gravity, lift force, buoyancy force, drag force, pressure gradient force, etc. However, only gravity, drag force, and buoyancy force are considered because other forces do not affect the particles significantly. The equation for the particles’ motion is given by:
where is the particle mass, is the particle velocity, is the buoyancy force, and is the drag force. The drag force is given by:
where is the particle diameter and is the drag force coefficient, which is given by:
where Re is the Reynolds number. In addition, the particle diffusion effect of turbulence is also accounted for.
2.3. Boundary Conditions and Numerical Schemes
ANSYS Fluent was used for all the simulations in this paper. The density and viscosity of the air flow are 1.225 kg/m3 and 1.7894 × 10⁻⁵ Pa∙s, respectively. The gravity acceleration is 9.8 m/s2. No heat transfer considered during the simulation. The air flow field was first simulated to steady-state by a standard k-ε turbulent model. The pressure velocity coupled equations were solved by a SIMPLEC algorithm. The numerical schemes for the solver and the simulation boundary conditions are given in Table 1, Table 2 and Table 3. It is assumed that the particles are stored at the heading face. The size distribution obeys Rosin‒Rammler distribution. The dust size distributions for total dust and respirable dust are presented in Table 4. Rosin‒Rammler distribution assumes a relationship between the particle’s diameter d and the particle’s mass fraction Yd, which is given by [22]:
where is the mean diameter for all particles, n is the spread parameter. In this study, the and is 59 μm and 4.4 μm, respectively. The spread parameter for total dust and respirable dust is 2.42 and 3.47, respectively. The mass flow rate for total dust and respirable dust is 0.0044 kg/s and 0.0034 kg/s, respectively. The density of coal dust used in this study is 1000 kg/m3.
The wall collision boundary conditions are summarized in Table 5. Three wall collision boundary conditions are used in this simulation. Reflecting boundary condition is used for the tunnel wall, roof and the duct wall. Trap boundary condition is used for the tunnel floor, which means the calculation would stop after the particle was trapped on the floor. Escape boundary condition is used for the duct inlet and outlet, and the roadway inlet outlet.
3. Result and Discussion
3.1. Airflow Field Distribution
The coal dust distributions are significantly affected by the airflow behaviors, thus it is important to understand the airflow field velocity and vortex distributions of different ventilation systems.
3.1.1. Long Blowing and Short Suction Ventilation System
Figure 3, Figure 4, Figure 5 and Figure 6 represent the airflow velocity vector at different positions of the excavation face. As can be seen, the fresh air injected from the blowing duct with high velocity and toward to the heading face. The direction of airflow velocity reversed after it rebounded on the heading. As can be seen in Figure 3 and Figure 4, the rebounded airflow still had a relatively high velocity and most of the airflow moved to the non-duct side of the wall. Then the airflow velocity gradually decreased. It is noted that a large vortex area was generated between the heading face and suction duct due to the combined effects of the fresh air from the blowing ducts and the reversed airflow. The air velocity in this area was quite low, about 0.3 m/s. The center of the vortex is about 2 m, 1 m, and 1.2 m away from the heading face, floor, and suction duct head, respectively. Due to the recirculating airflow in the vortex, coal dust may accumulate in this area. Due to the negative pressure near the suction duct head, a high-velocity zone was generated in this area. The velocity around this area decreased rapidly far from the duct head, as shown in Figure 5 and Figure 6.
3.1.2. Vortex Ventilation System
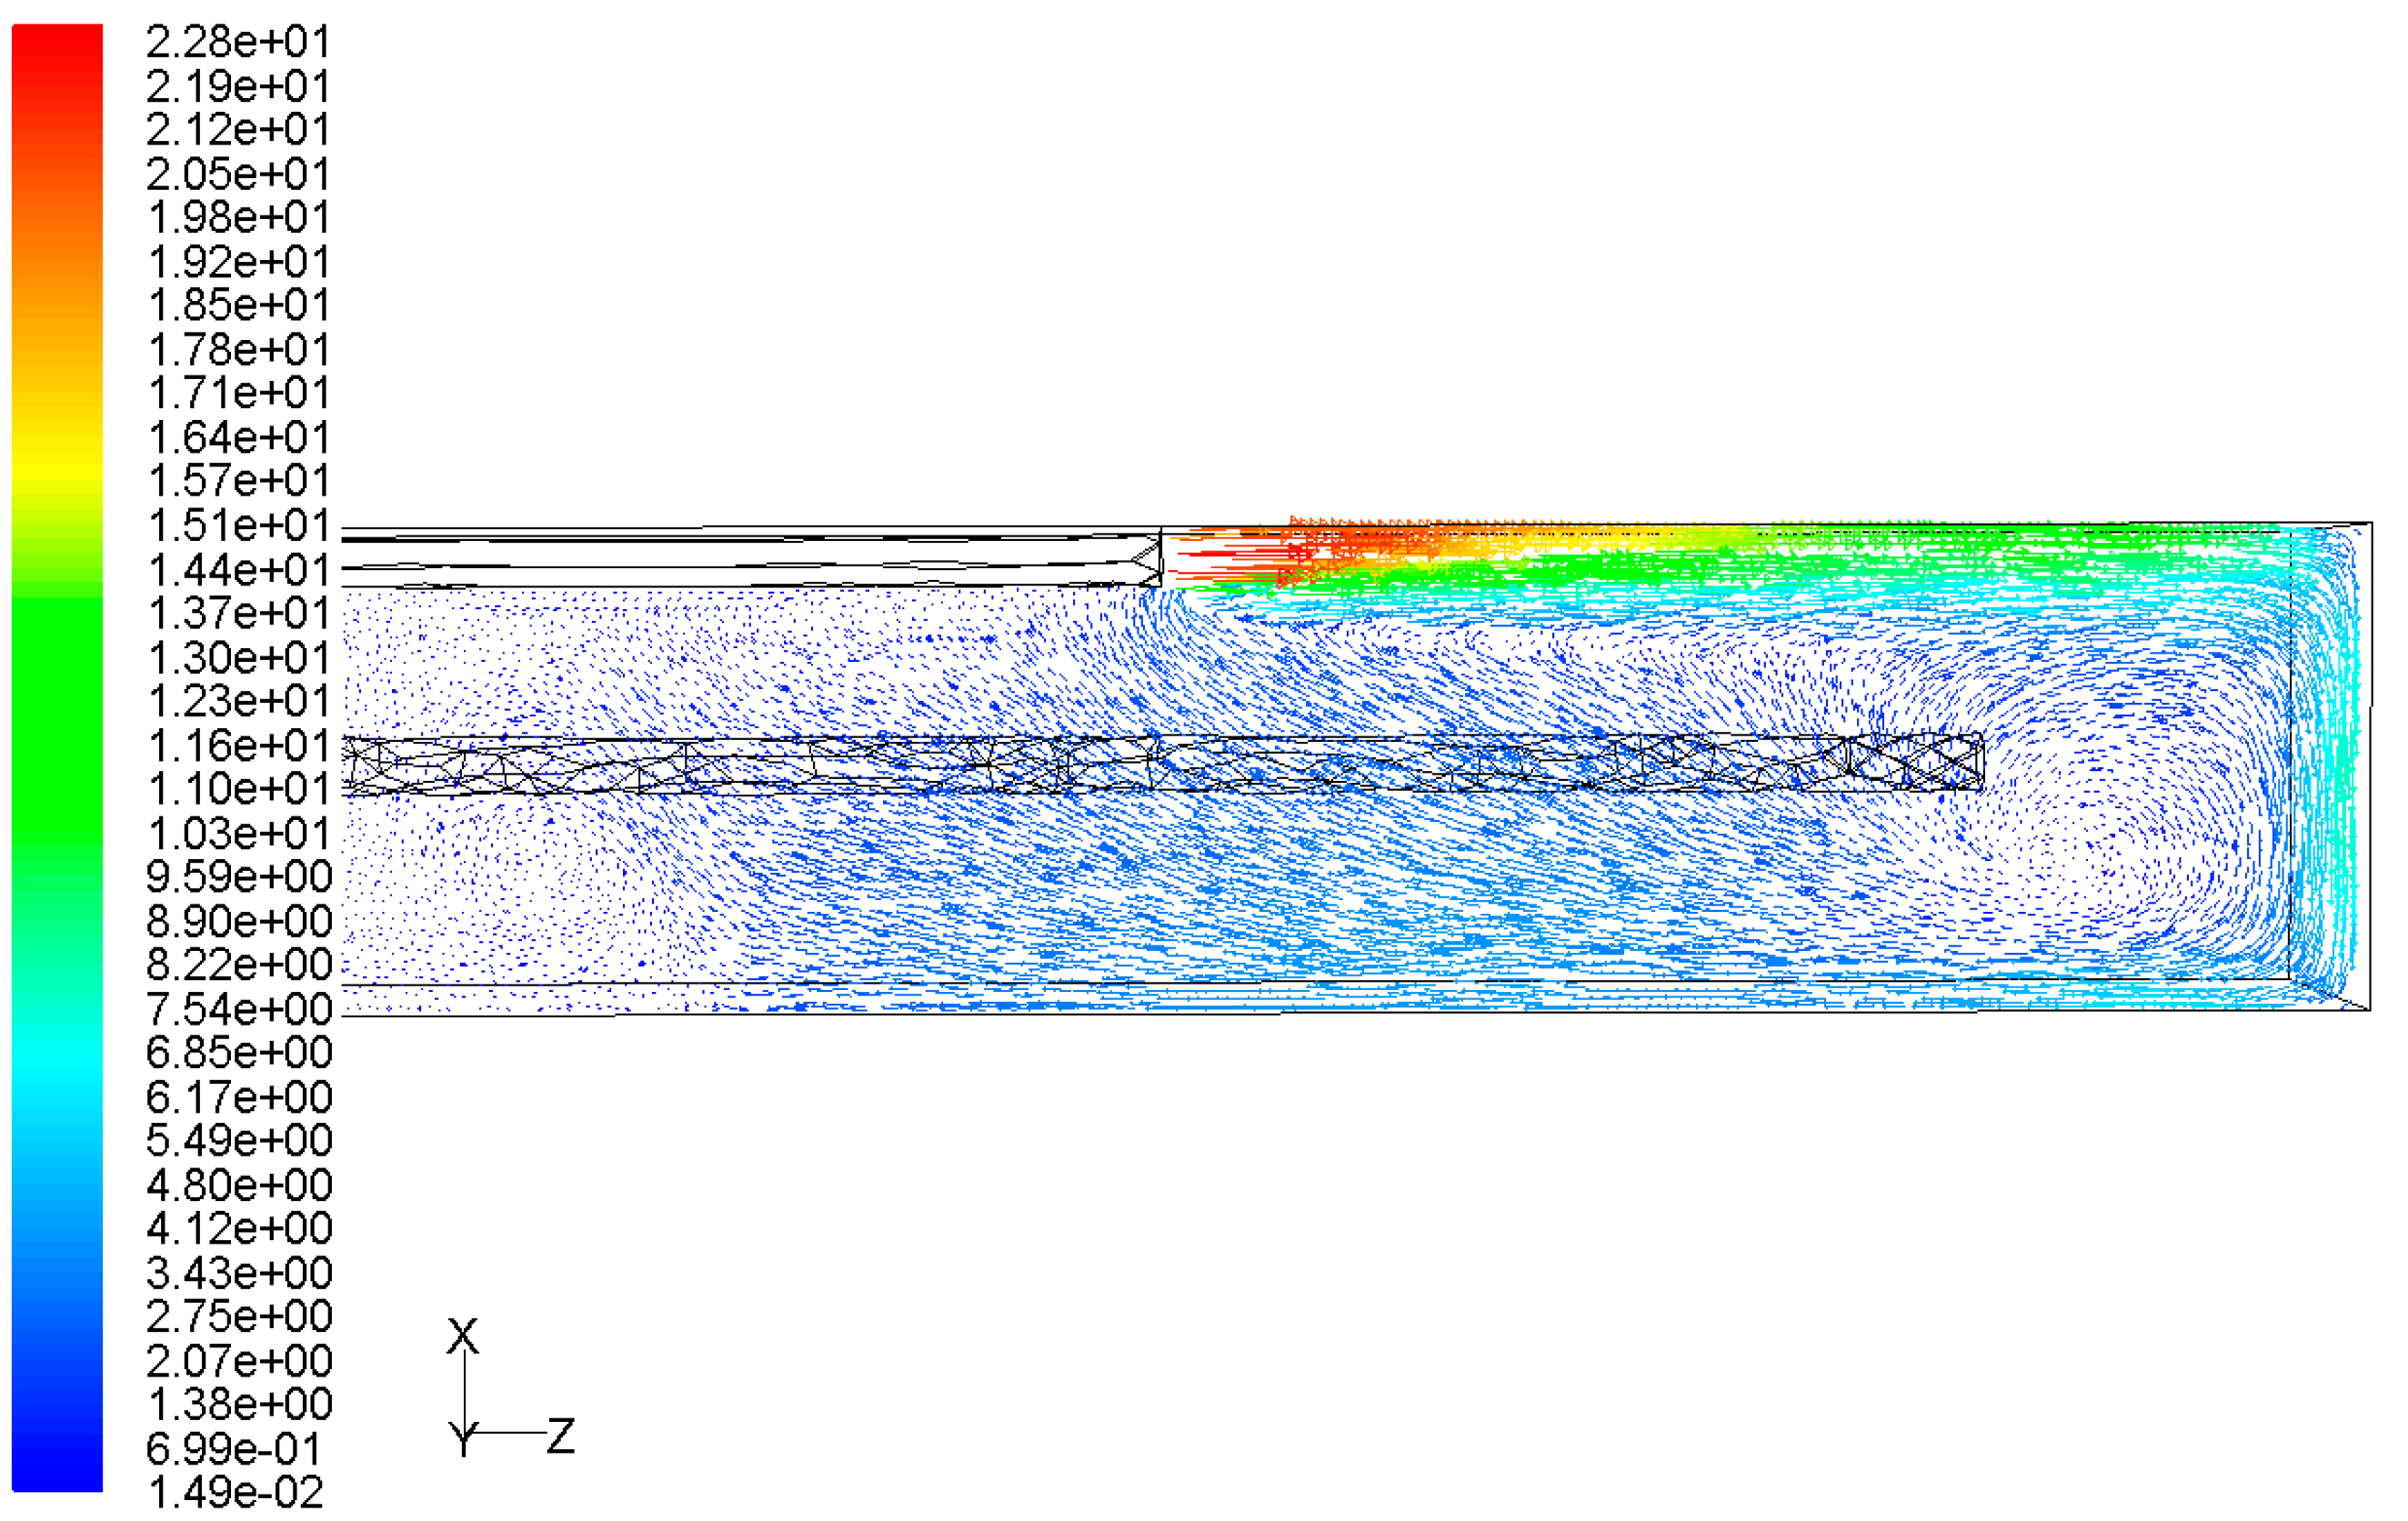
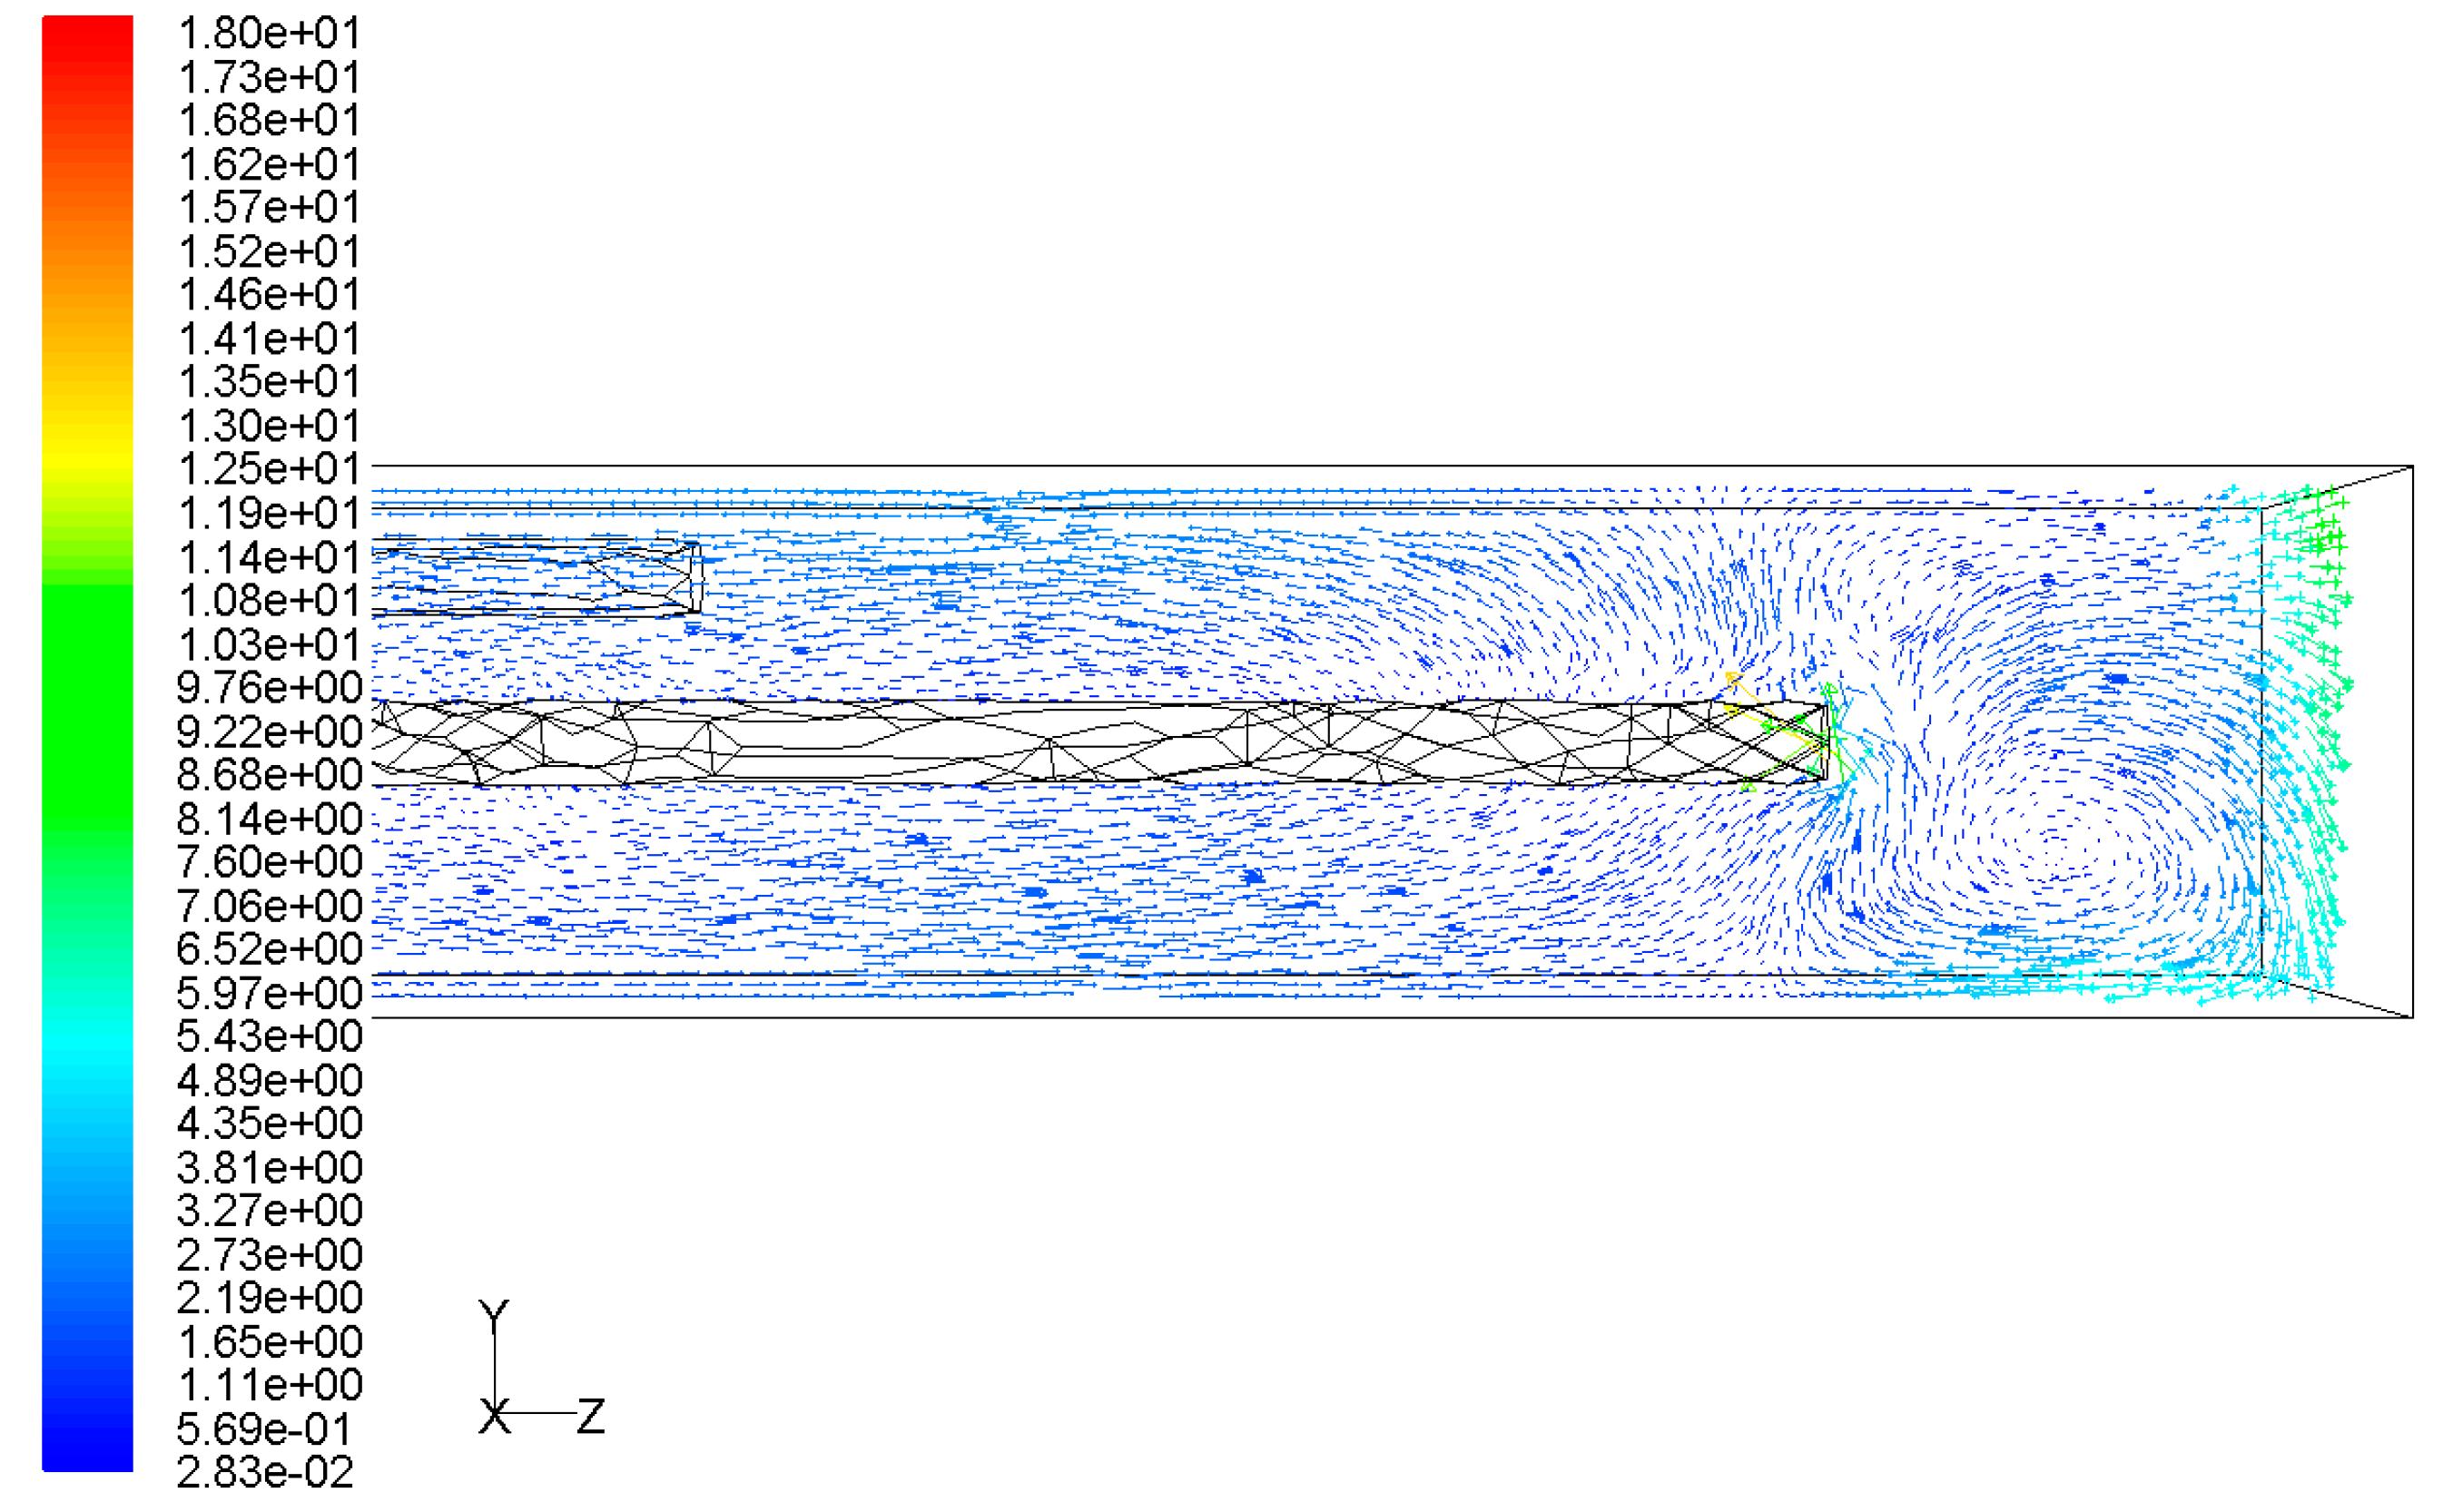
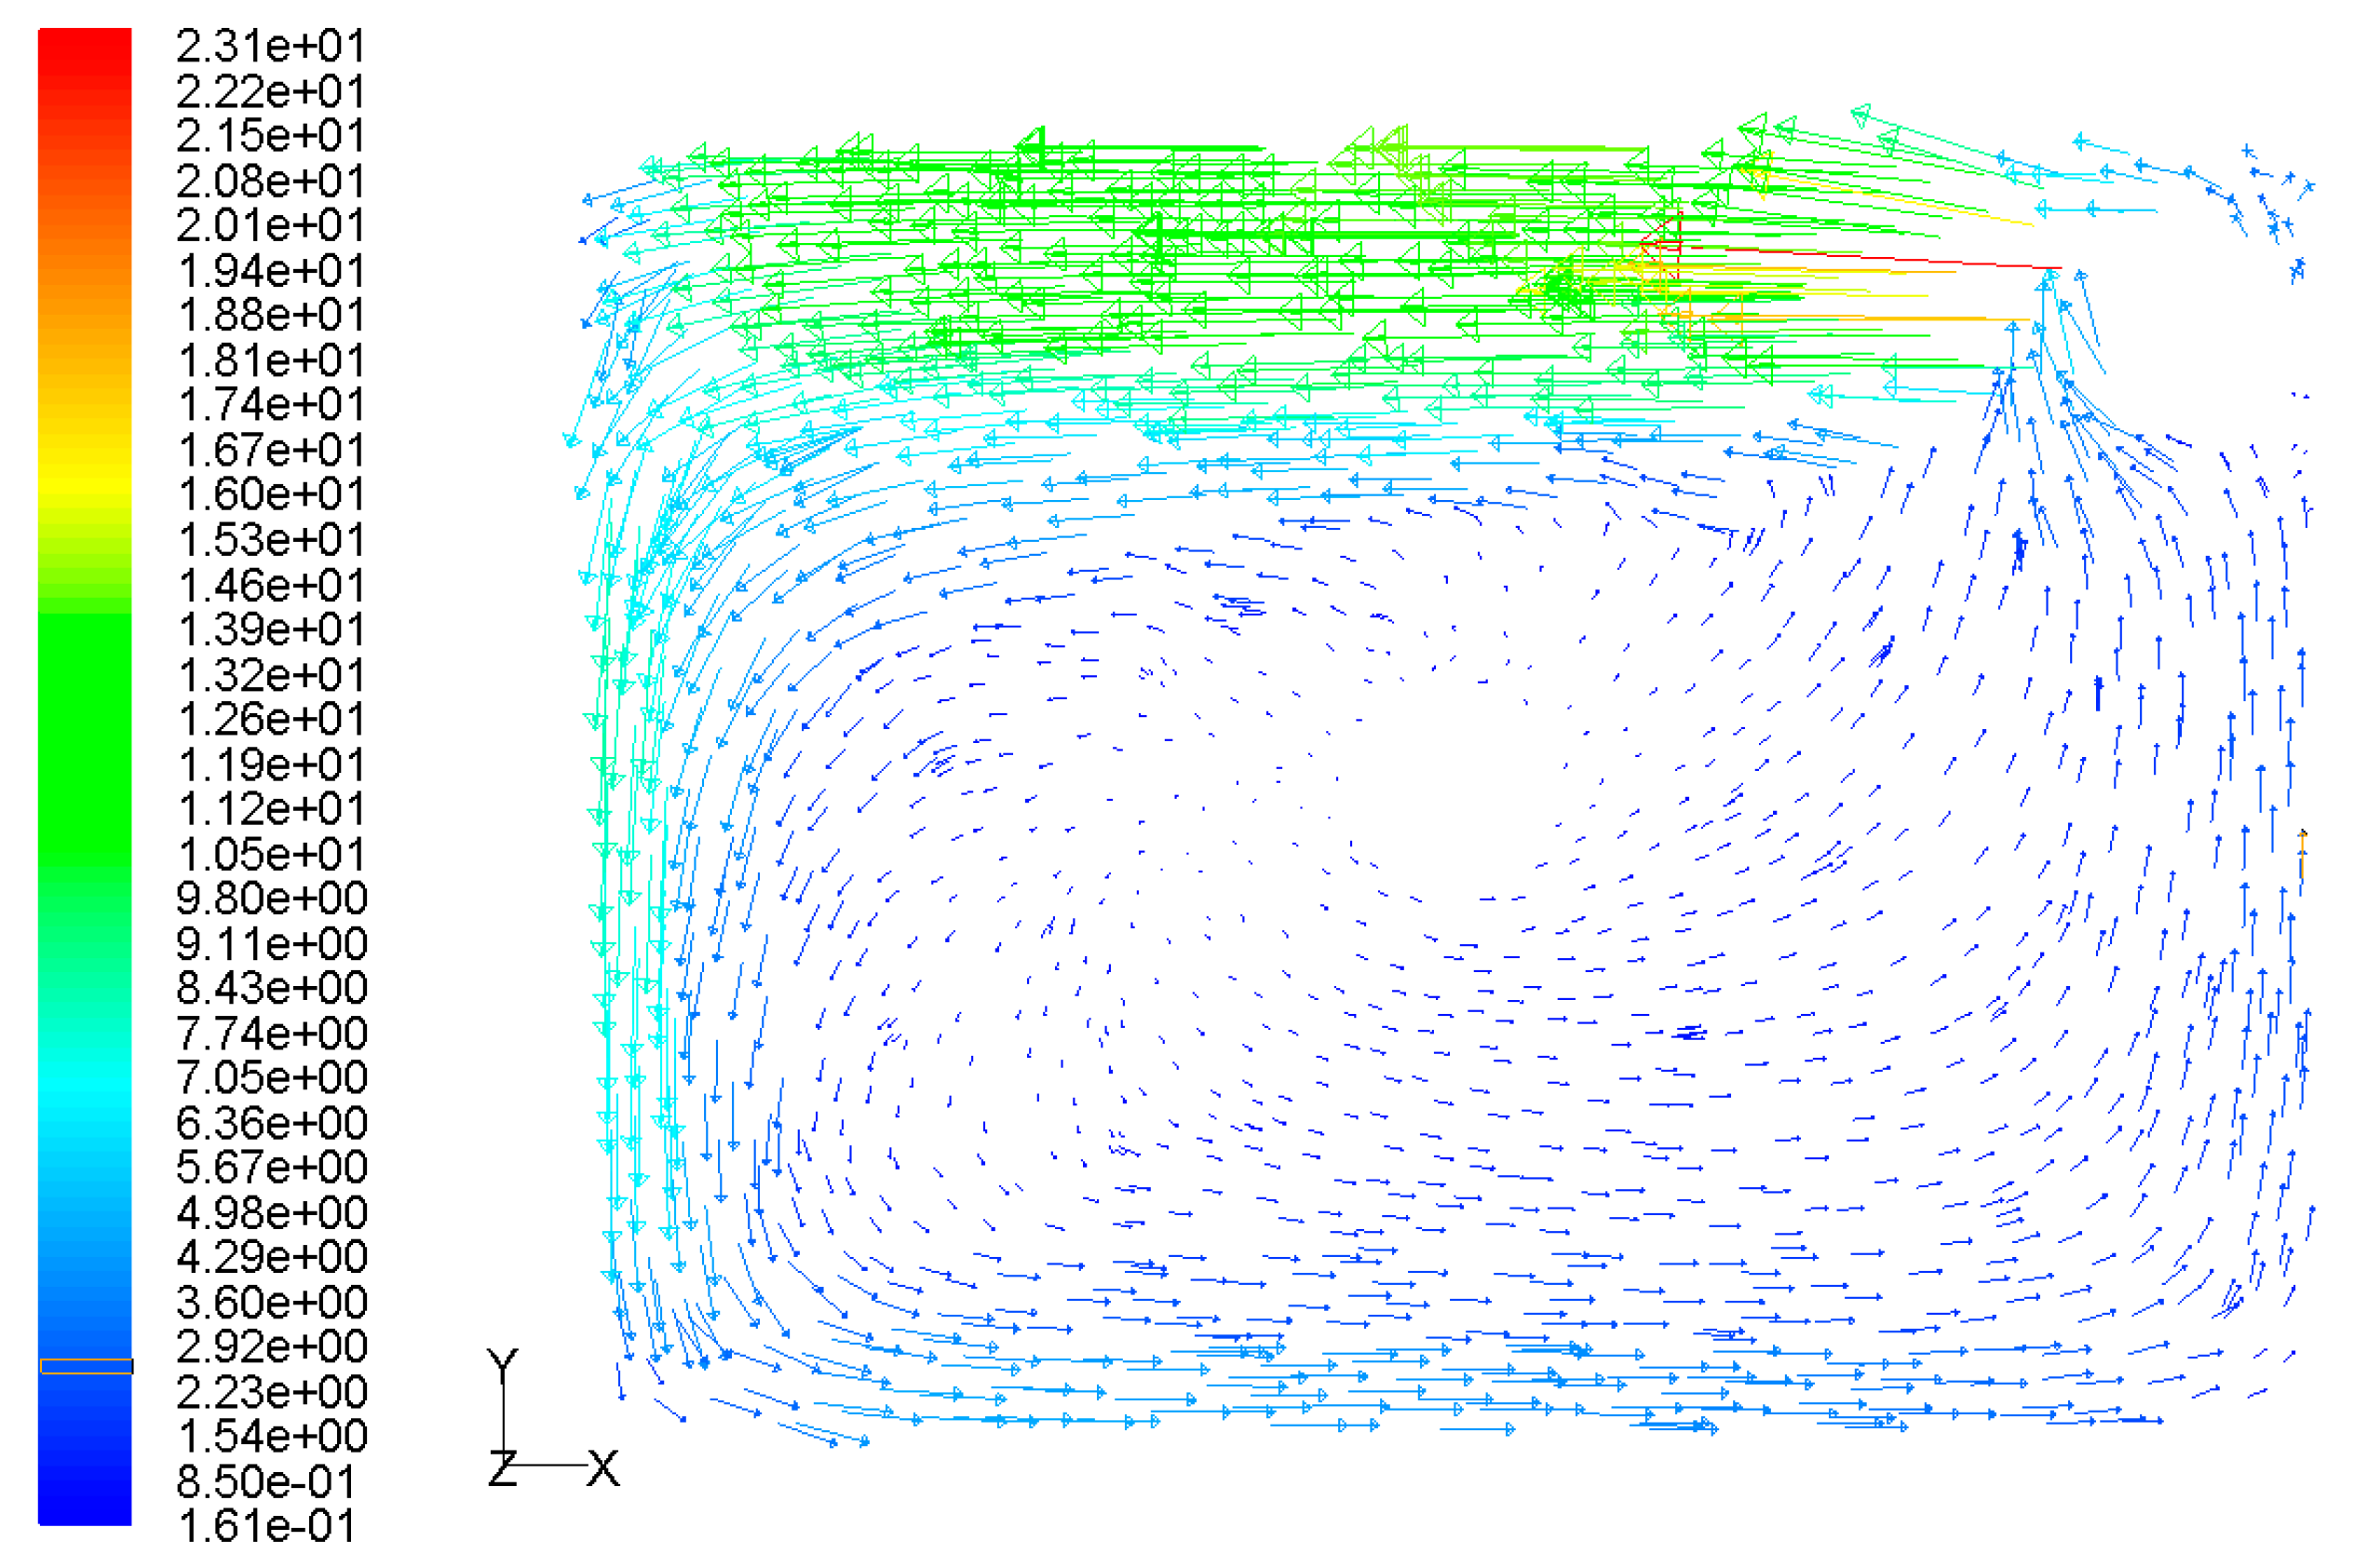
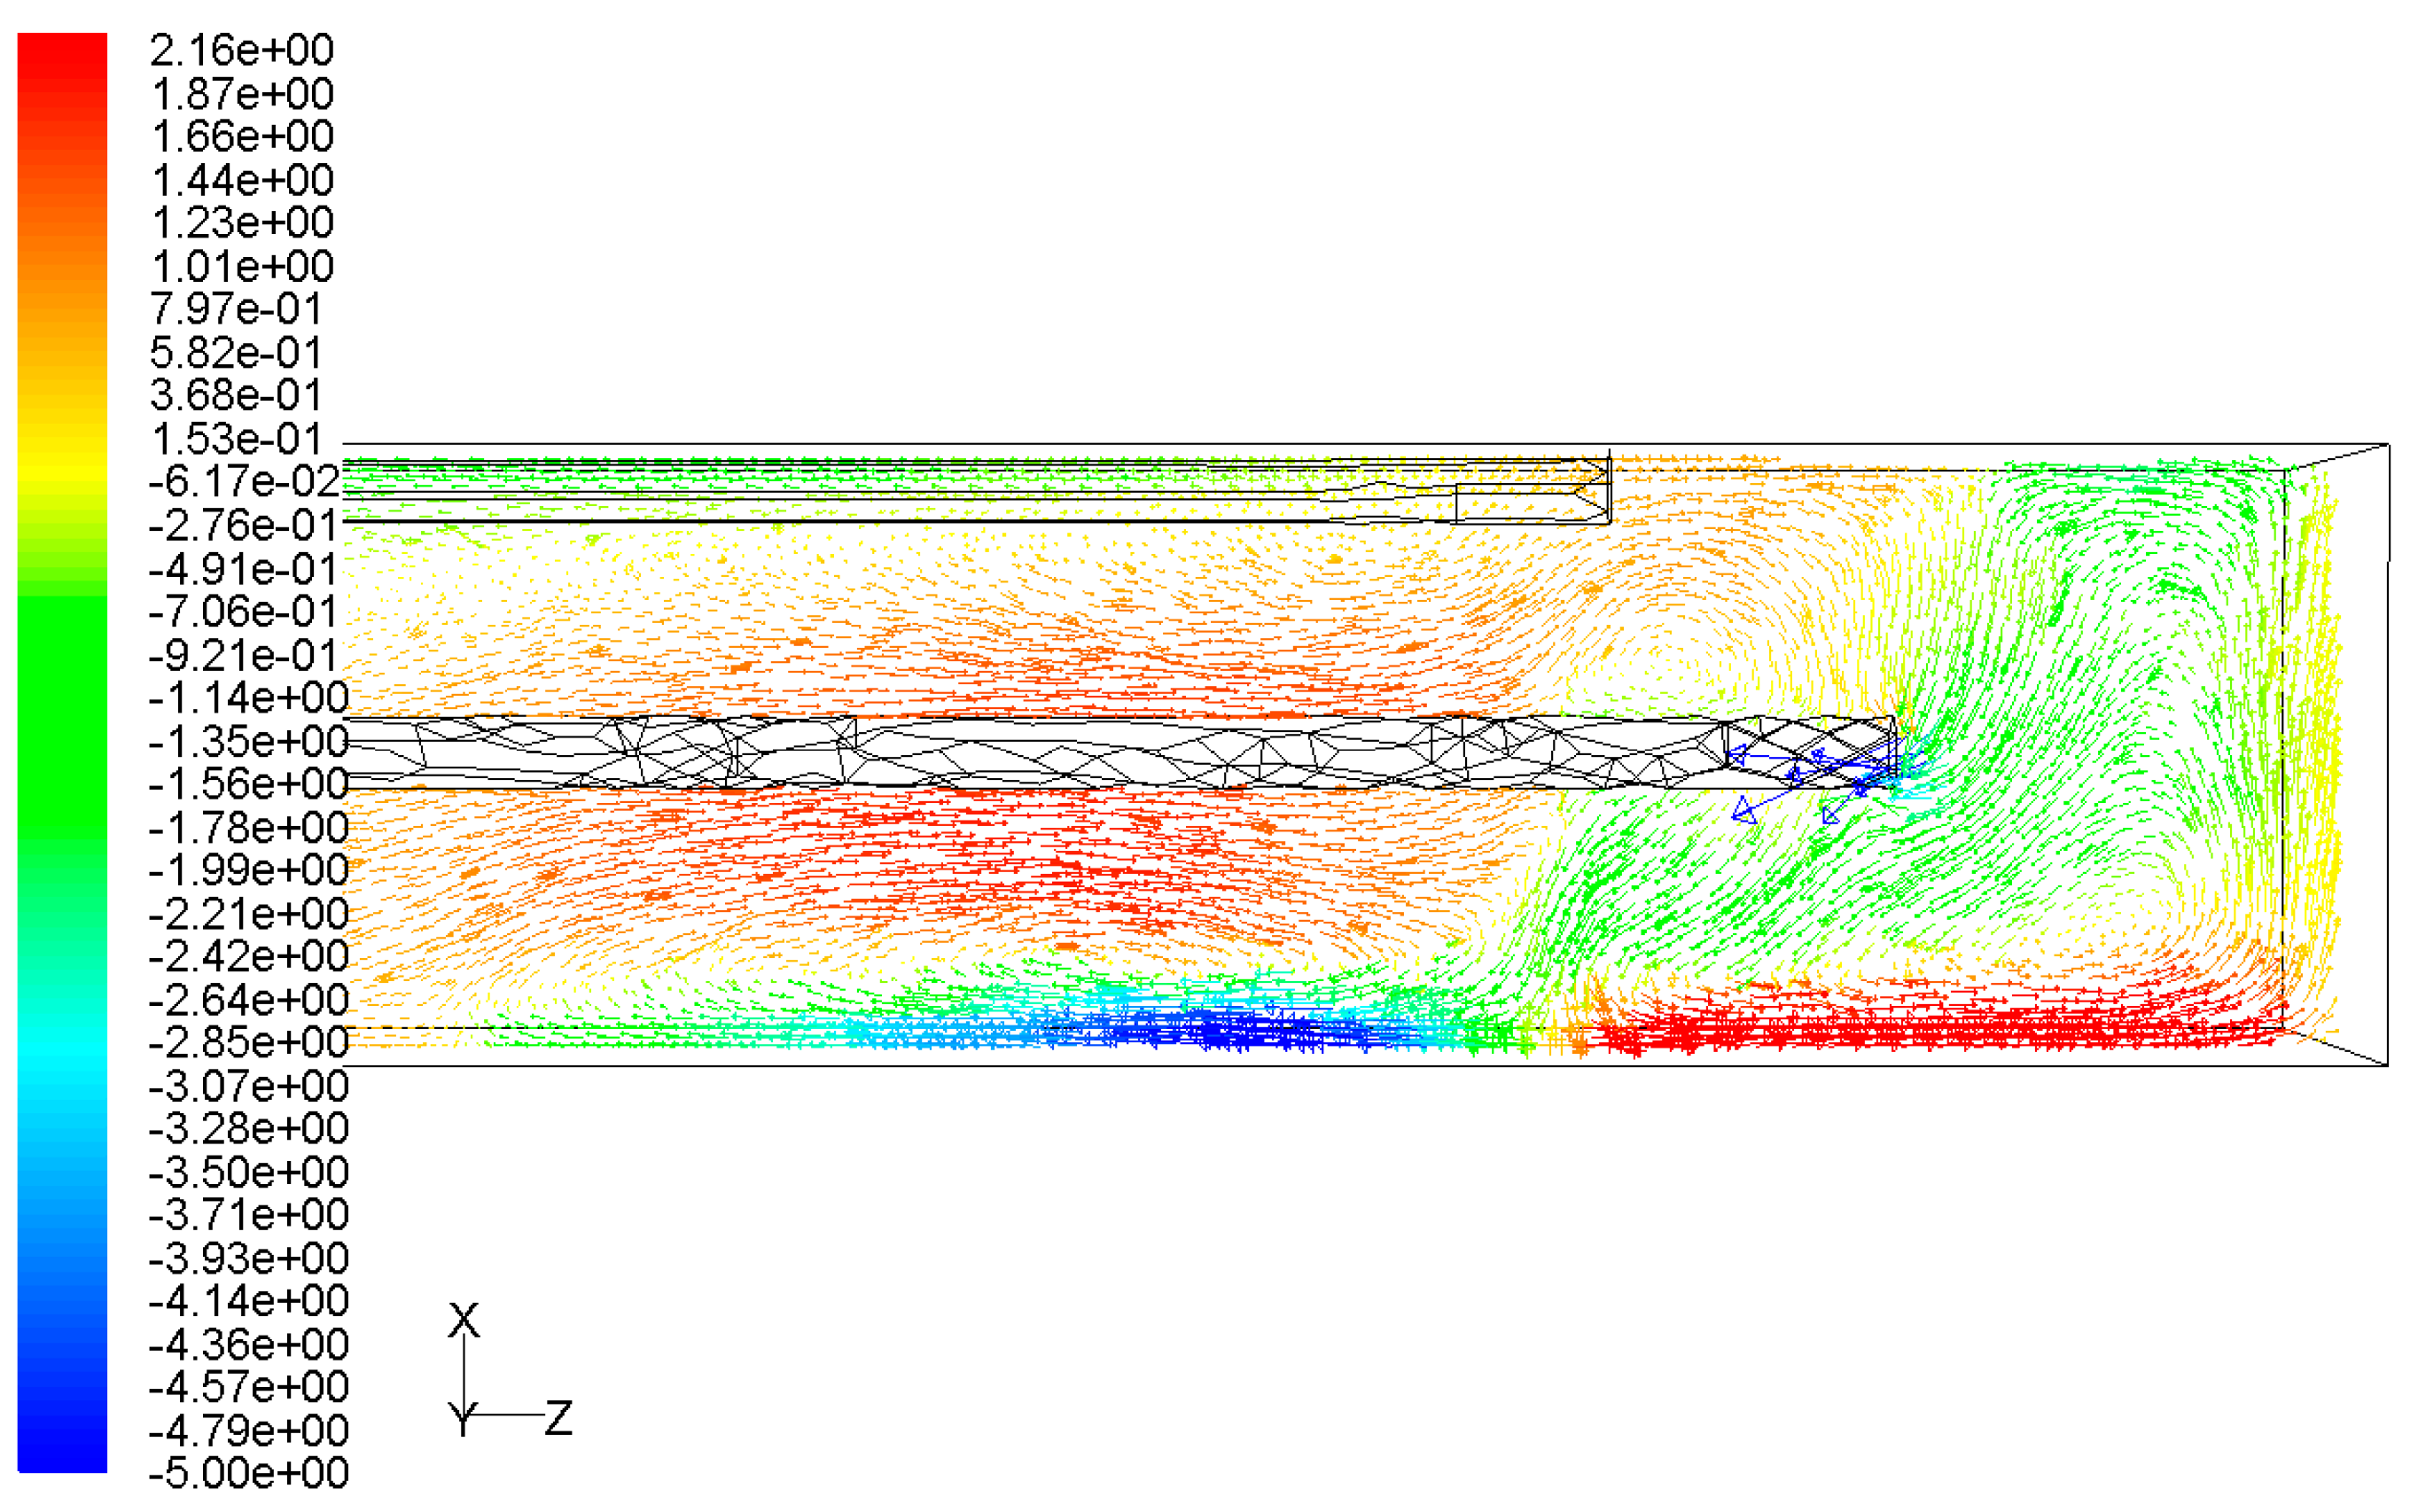
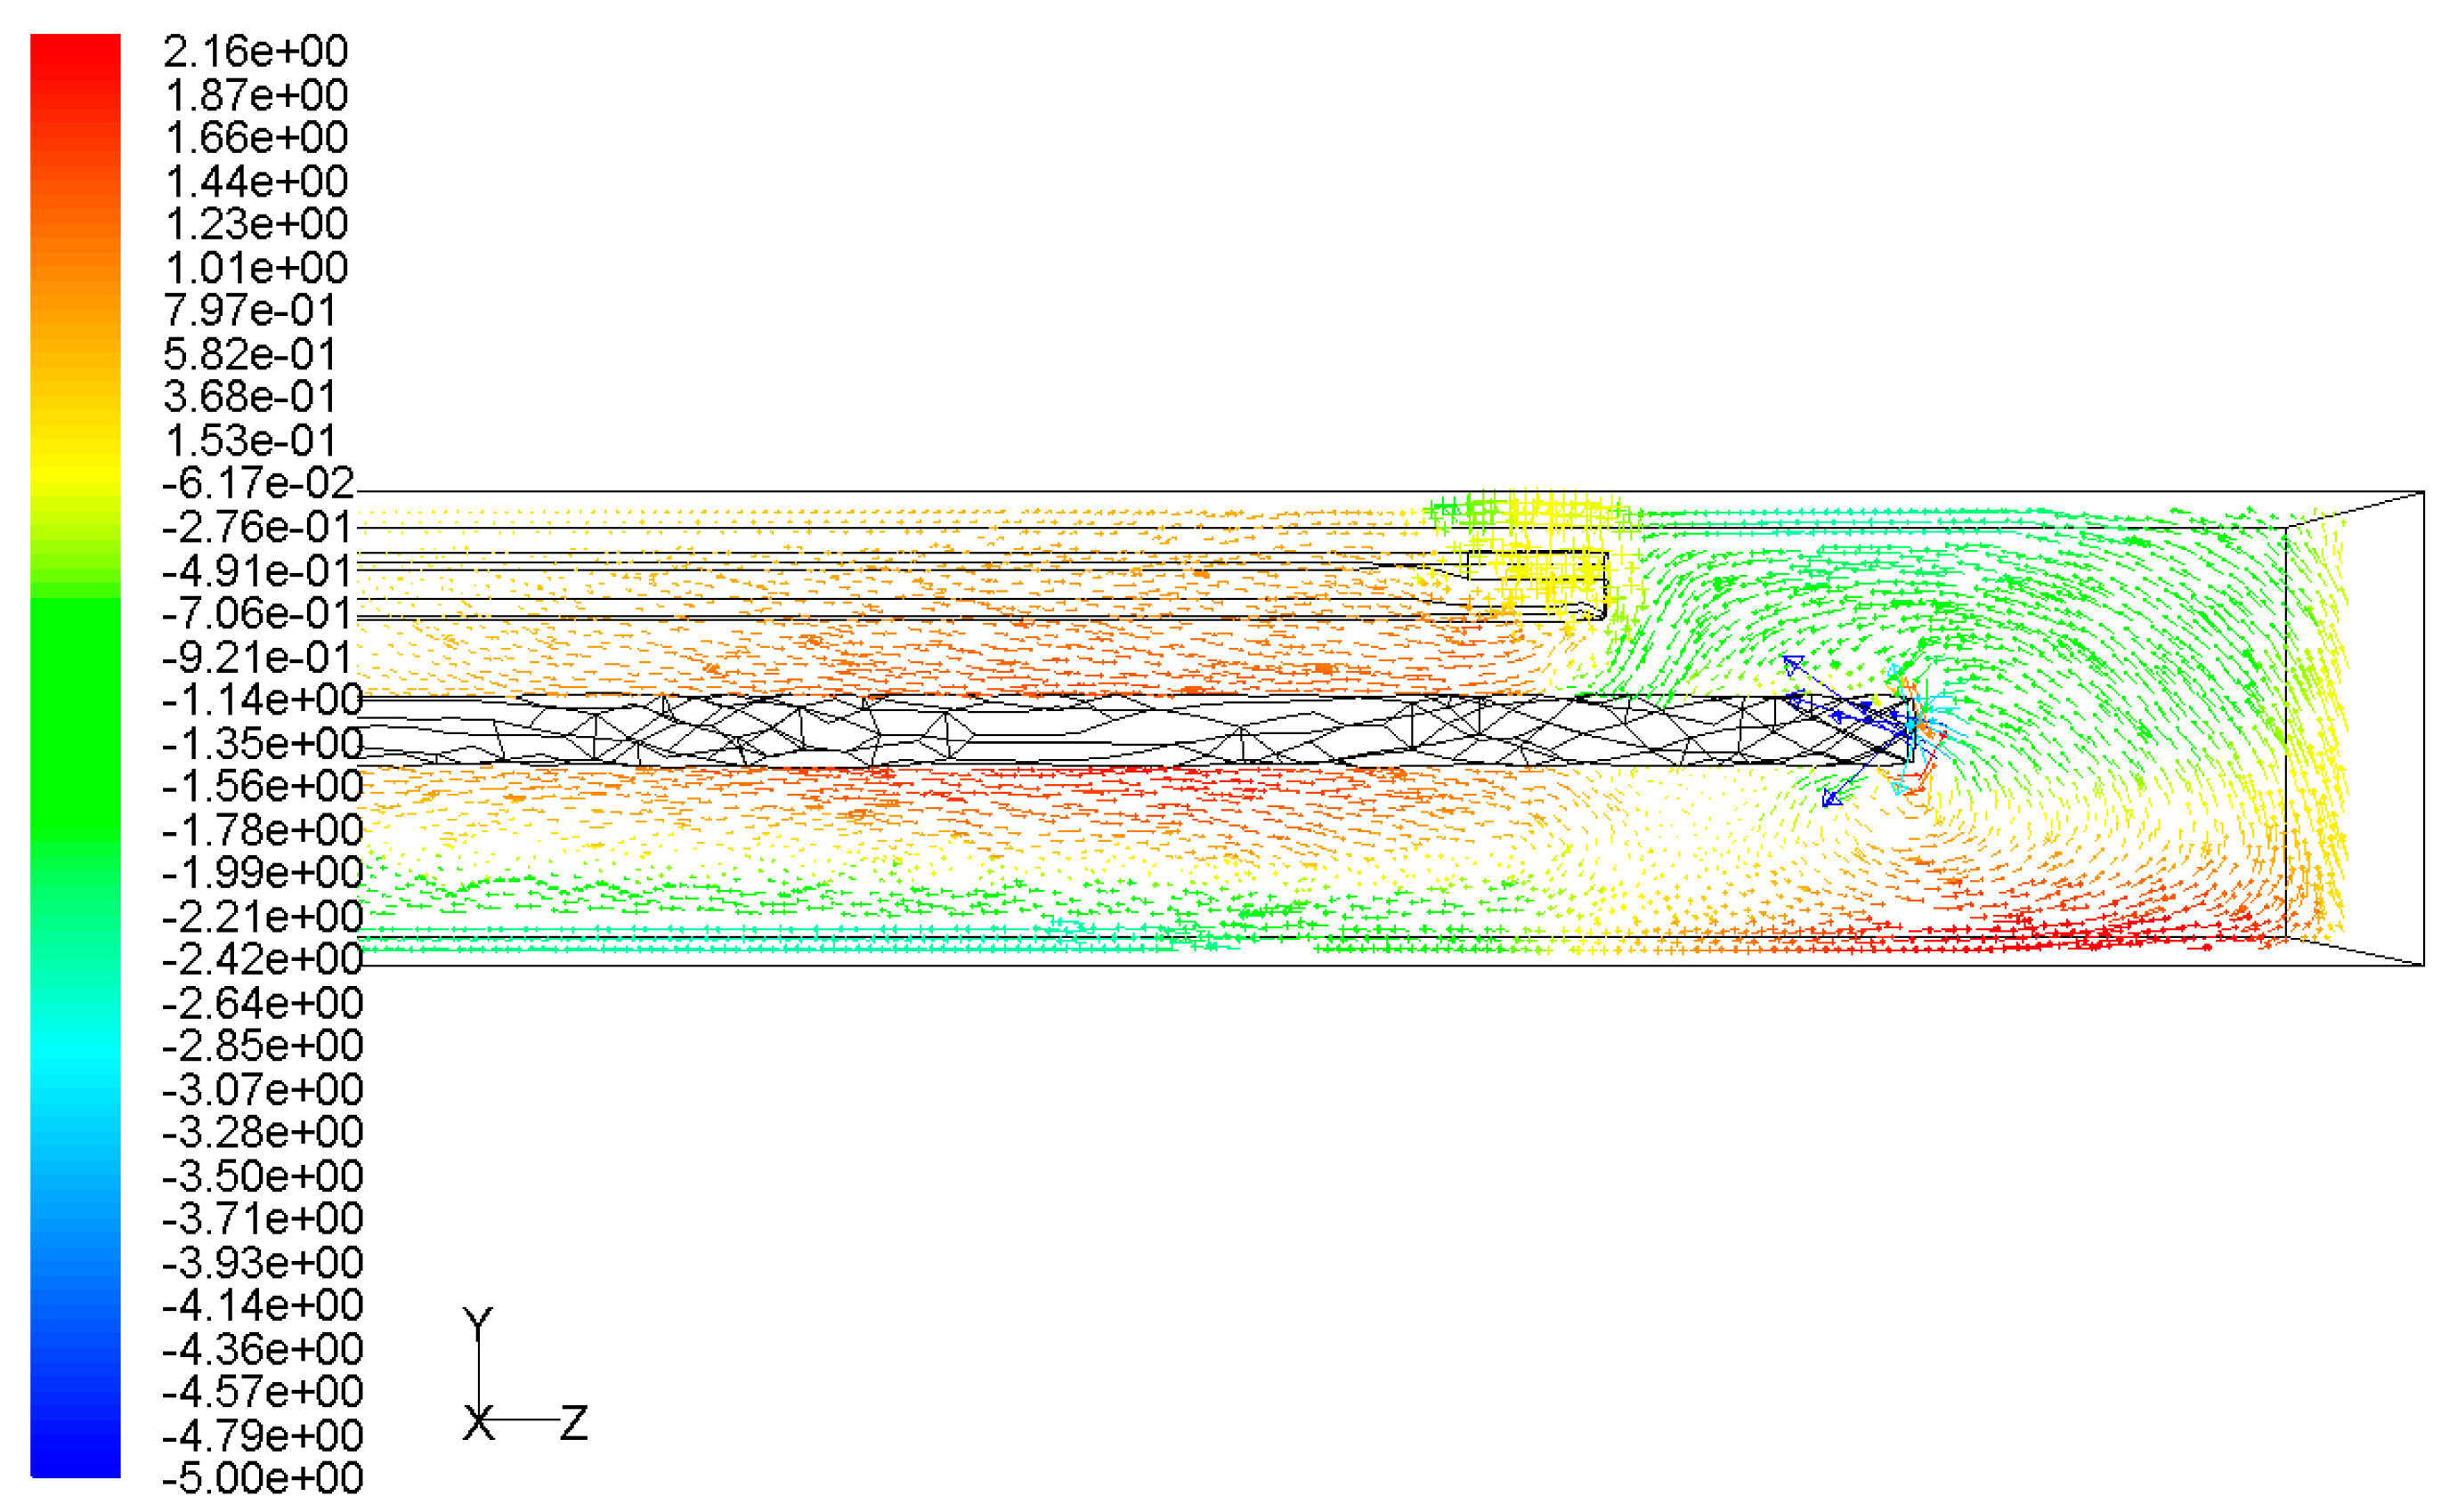
Figure 7 and Figure 8 illustrate the pressure contour at different positions of the working face. As can be seen, a low-pressure zone was generated at the front of the suction duct due to the effect of the exhaust fan. The pressures at areas close to the suction fan are lower than at areas near the walls. The velocity vectors are presented in Figure 9, Figure 10 and Figure 11. At 5 m from the heading face, a large vortex was formed around the suction duct. The airflow velocity near the wall had a decreasing trend. The velocity near the roof, left-side wall, floor, and right-side wall was about 14.25 m/s, 8.15 m/s, 3.75 m/s and 2.55 m/s, respectively, as shown in Figure 9. The velocity near the vortex center was around 0.28 m/s. With such a velocity, the airflow was not able to blow the dropped dust to the bottom again. As shown in Figure 10 and Figure 11, the airflow velocity direction changed about 5 m from the heading face. When the distance was less than 5 m, most of the airflow went towards the suction duct head. When the distance was greater than 5 m, the airflow went towards the outlet of the working face. This helps to control the coal dust in the 5 m from the heading face and protects the operator of the excavator from the coal dust. On the other hand, such airflow distribution also contributes to the high efficiency of coal dust collection.
3.2. Coal Dust Distribution
3.2.1. Coal Dust Distribution under Two Ventilation Systems
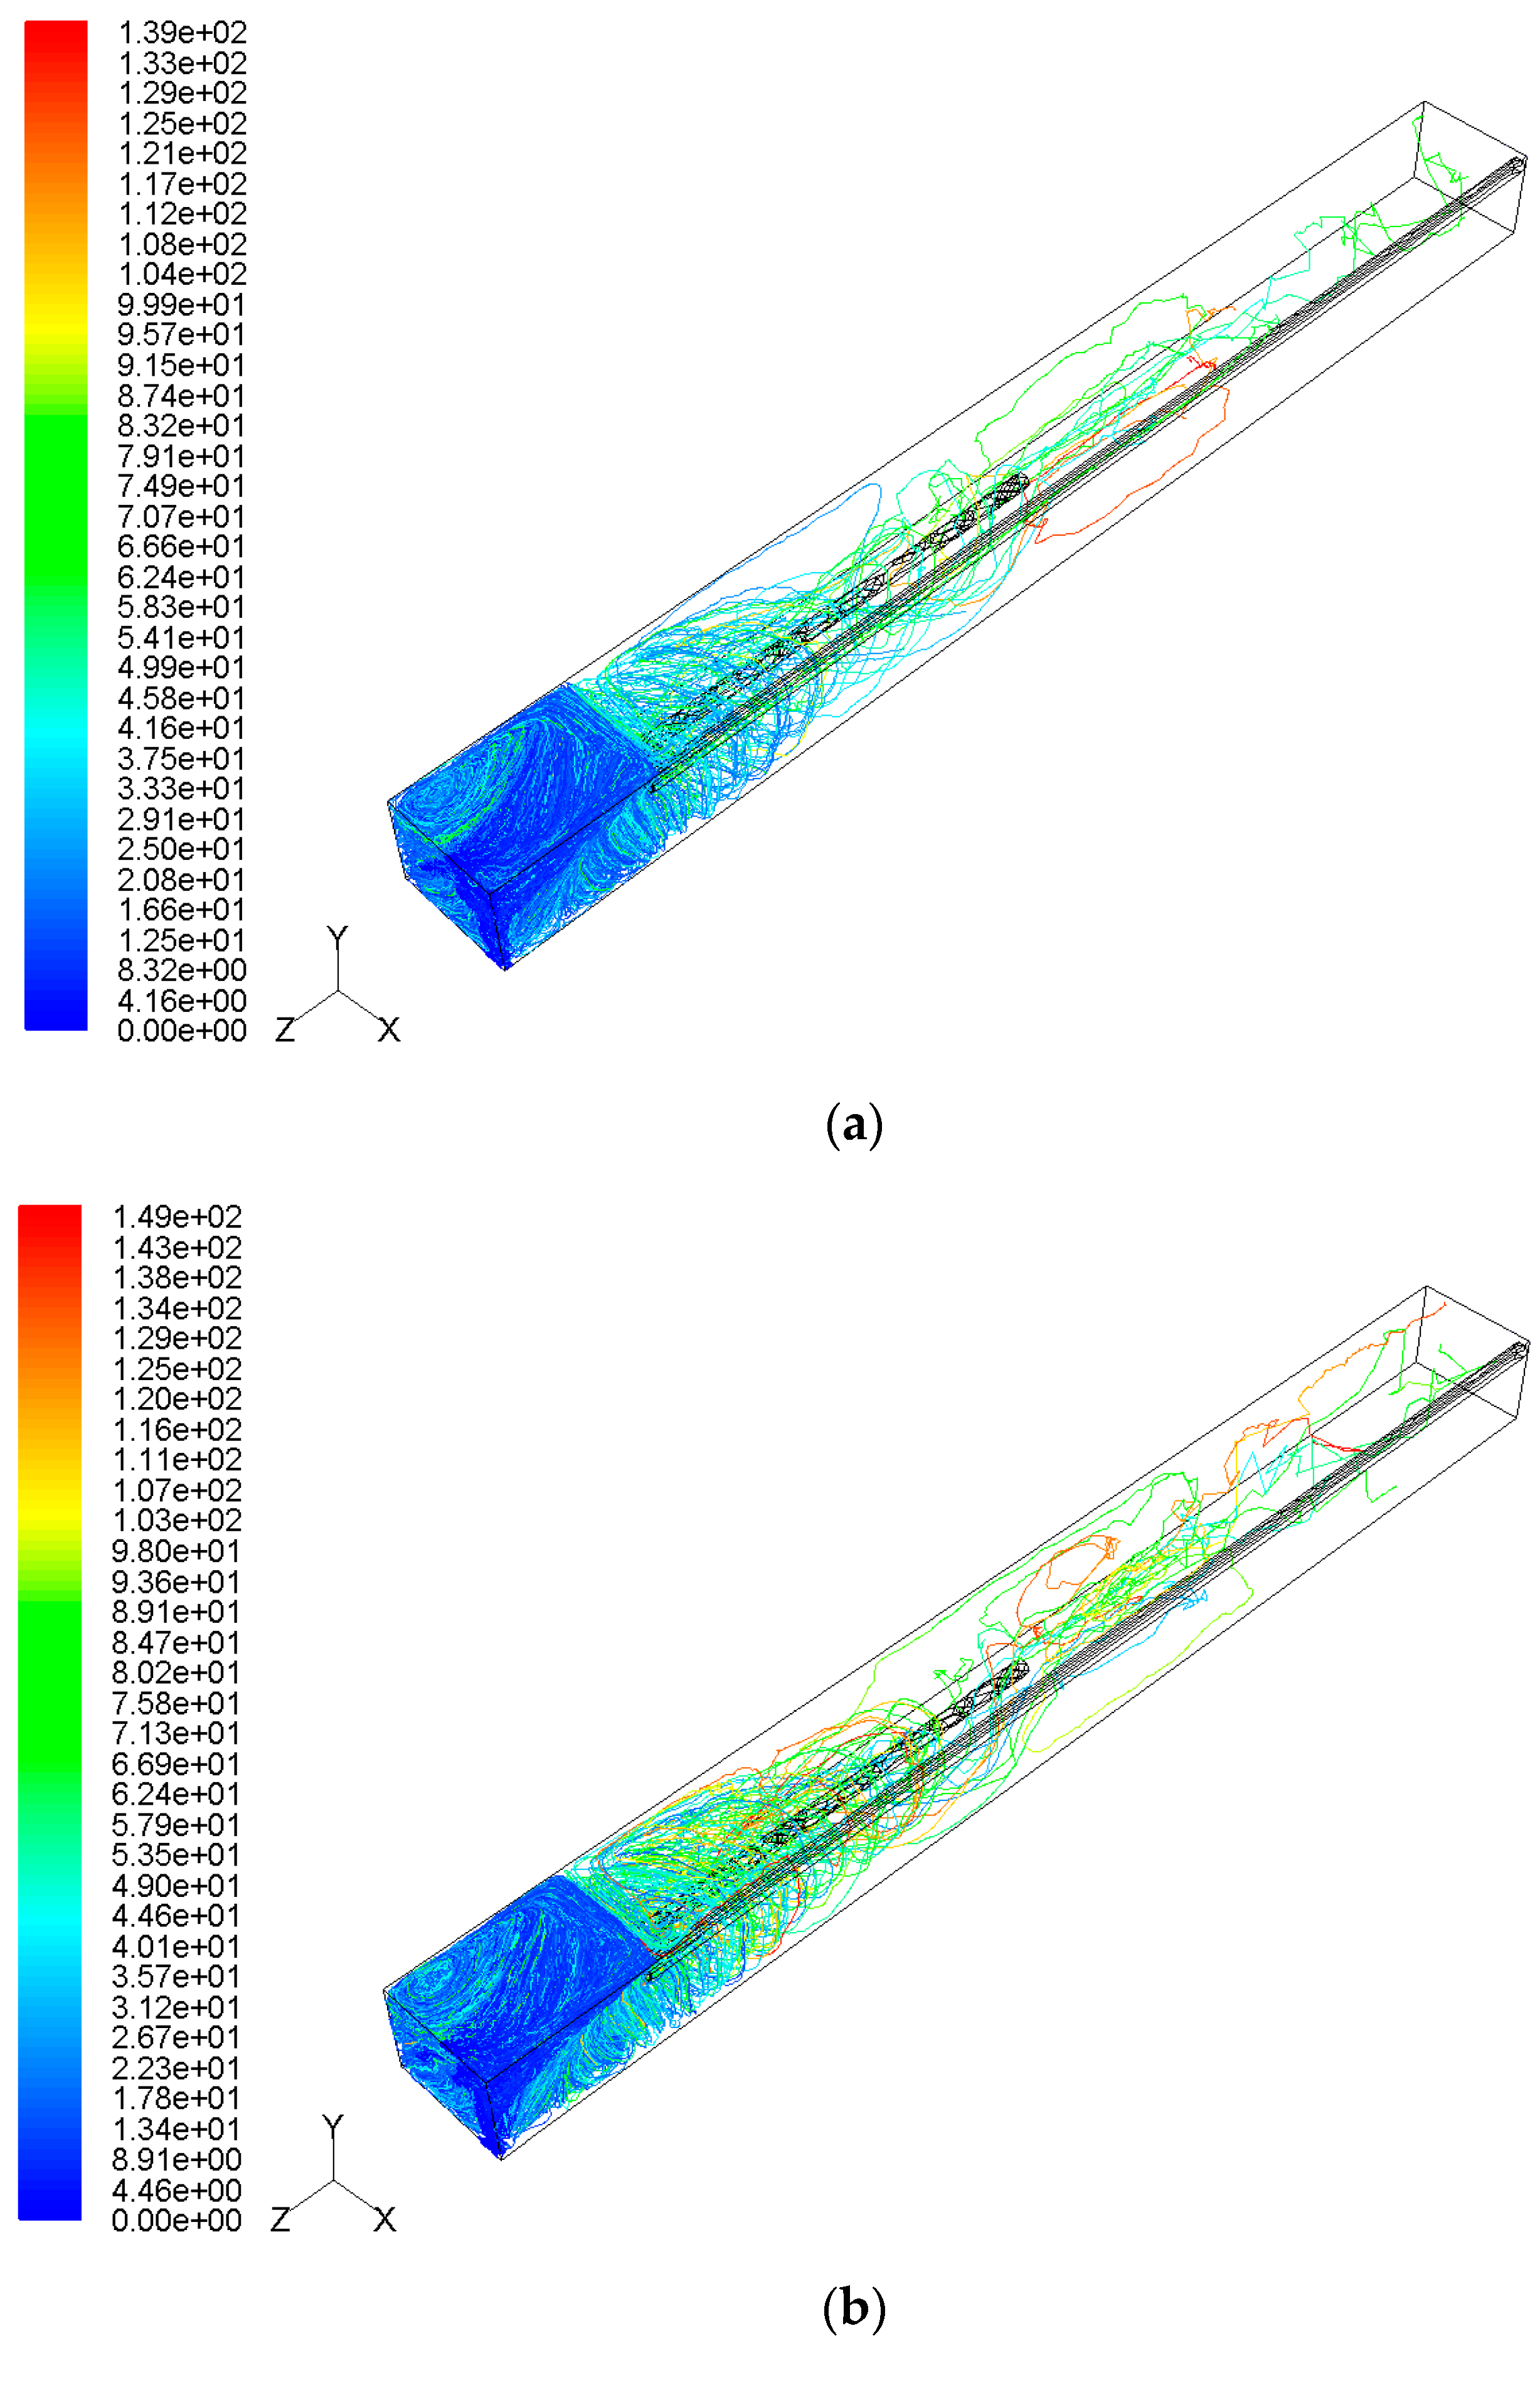
Figure 12 and Figure 13 show the coal dust residence time under two different ventilation systems. It is obvious from the figures that most of the particles accumulated at the front of the heading face. Under the long blowing and short suction ventilation system, although most particles were carried to the suction duct and captured by the dust collector, there were still a great number of particles transported to the middle section of the heading face with the airflow. This phenomenon is more significant for the respirable dust because the respirable dust has a relatively small diameter. Such small particles are more easily suspended in the air and thus be affected by the airflow. Thus, the miners who work in this area should be given protective gear to avoid exposing them to high concentrations of coal dust. However, this situation does not exist under the vortex ventilation. Most of the particles were sucked into the suction duct and few particles moved to the middle section of the working face. It seems the vortex ventilation system has better coal dust removal performance.
The total coal dust and respirable coal dust concentration distribution are illustrated in Figure 14 and Figure 15. As can be seen, the high coal dust concentration area formed at the front of the heading face due to the existing vortex area under the long blowing and short suction ventilation system. This area expanded to the further distance with airflow towards the downstream. This phenomenon is even more obvious for the respirable dust because a respirable high dust concentration zone was generated behind the suction duct head. It is worth noting that almost no respirable dust accumulated at the center of the vortex. This is due to the large air velocity at the front of the duct head; most of the particles at this area went into the duct with the airflow. Because of the high dust concentration area at the back of the suction duct head, it is believed that the small particles (respirable dust) are more easily affected by the airflow. In addition, the highest dust concentration zone occurred at the right side of the heading face. This is caused by two things. Firstly, a low-velocity zone was generated at this area. Secondly, after hitting the heading face, much of the dust dropped in this area due to gravity. The high dust concentration area under the vortex concentration is much smaller than that of the long blowing and short suction ventilation system. However, the average concentration in this area is higher than that of the long-short ventilation system. For vortex ventilation, most particles accumulated at the front of the suction duct head due to the vortex airflow. This generated a higher dust concentration area. It is noticed that the dust concentrations behind the suction head were quite low.
3.2.2. Dust Concentration Comparison between Two Ventilation Systems
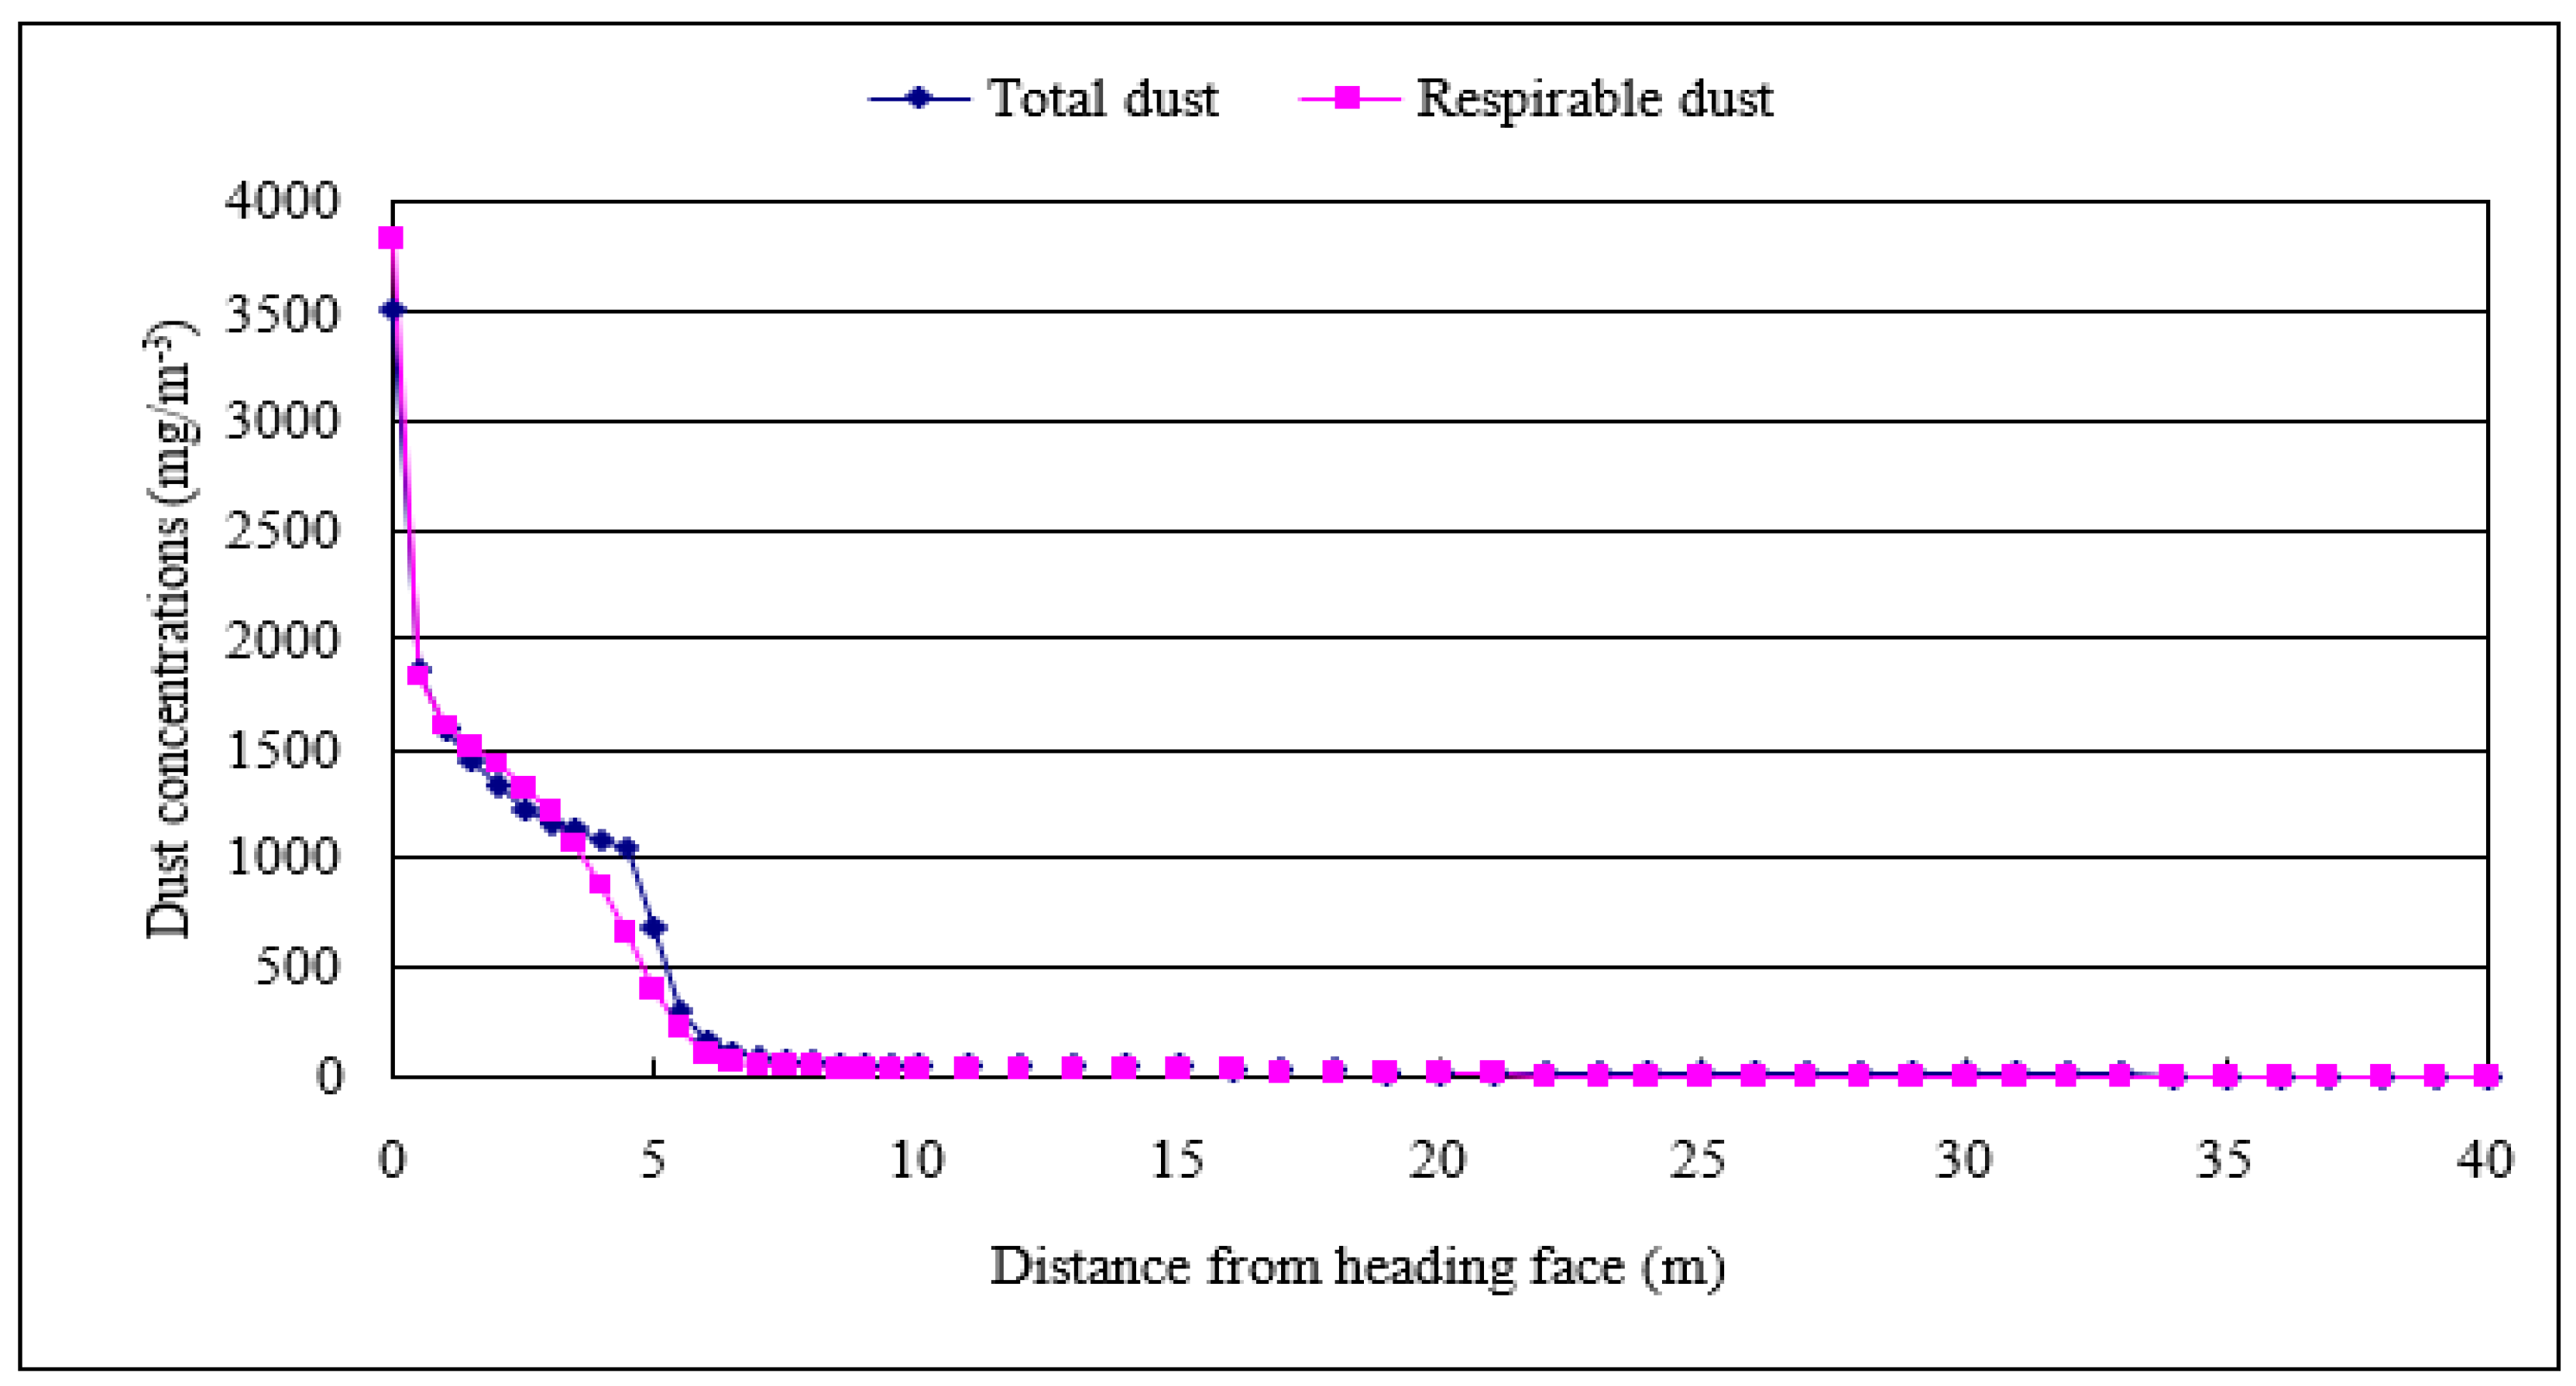
The average dust concentration at different cross sections for two ventilation systems are presented in Figure 16 and Figure 17. As can be seen, the dust concentration at different positions of the working face is close for total dust and respirable dust. For a long blowing and short suction ventilation system, the highest dust concentration occurs near the heading face; the concentration dropped sharply to around 580 mg/m3 and 240 mg/m3, respectively, for total dust and respirable dust. Then the concentration arrived at another peak point 10 m away from the heading face for the total dust and 13 m for the respirable dust. After that, the dust concentration dropped gradually with the particles moving downstream. It is worth noting that the total dust concentration is almost double that of the respirable dust concentration under this ventilation system, as shown in Figure 16. For a vortex ventilation system, the highest dust concentration for both total dust and respirable dust also occurs at the front of the heading face, then the concentration decreases rapidly to less than 50 mg/m3 at 5 m, where the suction duct inlet is also located. After that, the concentration keeps stable after 6 m. It is clearly seen that in the 5 m away from the heading face, the dust concentration of a vortex ventilation system is higher than that of a long-short ventilation system, but this concentration is much lower after 5 m for vortex ventilation system. This means that the vortex ventilation system could better keep the particles at the front of the suction duct and moved them to the suction duct.
To better analyze the dust removal efficiency of two ventilation systems, the histograms of dust concentration distribution at the working face outlet for the two systems are compared in Figure 18. As can be seen, under the long-short ventilation system, most of the total dust concentration is allocated between 10 and 30 mg/m3. The concentrations of respirable dust mainly fall in the range of 30 to 130 mg/m3. By comparison, most of the concentrations of the total dust and respirable dust are below 10 mg/m3 under the vortex ventilation system. Based on the onsite data, the total dust concentration and respirable concentration at the outlet of the working face under the long-short ventilation system are 16.4 mg/m3 and 58.8 mg/m3, respectively. However, these values for the vortex ventilation system are 4.1 mg/m3 and 4.1 mg/m3, respectively. This indicates that most particles went into the suction duct and were collected by the dust collector for the vortex ventilation system. Thus, the vortex ventilation system has better dust control performance.
3.3. Limitations and Perspectives
This study intends to evaluate a new ventilation system’s dust removal performance. However, there are still some limitations. The numerical simulation model in the manuscript is based on a low-gas coal mine and the gas parameters are not considered in the simulation calculation. However, in a field situation, there are many high-gas coal seams and coal and gas outburst seams in China. In these mines, the balance between gas concentration and ventilation parameters should be considered in the design of ventilation and dust control systems. Numerical simulation coupled with dust and gas is an important part of our future research work.
In addition, the design of a rotating annular disk is the key to vortex ventilation. A rotating annular disk with different shapes and design parameters can have varied dust control performance, especially for respirable dust. It is also necessary to study the optimum design of a rotating annular disk by modeling and computing the dust control effect and dust distribution law with different design schemes. A further study will be conducted to resolve all of the above limitations and provide a more comprehensive ventilation system.
4. Conclusions
A CFD simulation study has been conducted based on an on-site excavation in this paper. Two ventilation systems, a long blowing and short suction ventilation system and a vortex ventilation system, have been modeled to evaluate their performance on coal dust removal. The Eulerian-Lagrange approach was used to analyze the coal dust movement pattern in the airflow field. The coal dust distribution and concentration data were obtained from the simulation results under two ventilation systems. For both ventilation systems, dust accumulated between the heading face and suction duct head due to the combined effects of the excavation activity and the large negative pressure near the suction duct head. In this area, it was noted that both the total dust and respirable dust concentrations under the vortex ventilation system were higher than those of the long-short ventilation system. For the long-short ventilation system the high dust concentration area expanded to the middle area of the working face, whereas this did not occur under the vortex ventilation system. It is believed that the vortex ventilation system has a stronger dust capture ability. Under this ventilation system, most of the dust was captured into the suction duct by the generated vortex airflow before traveling downstream. The dust concentration at the outlets for the vortex ventilation system were also much lower than those of the long–short ventilation system, which indicates that the vortex ventilation system has the capacity to remove coal dust efficiently. To better control coal dust and protect miners’ health, the vortex ventilation system is recommended for excavation.
Author Contributions
Conceptualization, X.L.; Formal analysis, P.C. and S.Y.; Funding acquisition, X.L.; Investigation, Z.Z.; Methodology, X.L.; Project administration, E.W.; Resources, E.W.; Software, Z.Z.; Supervision, E.W.; Writing—original draft, X.L.; Writing—review & editing, P.C.
Funding
This research was funded by the National Natural Science Foundation of China (51774280), “Double First-Class” Initiative Project for Cultural Evolution and Creation of CUMT (2018WHCC03), and an Independent Research Project of State Key Laboratory of Coal Resources and Safe Mining, CUMT (SKLCRSM18X011).
Acknowledgments
The authors are grateful to all the people who helped us with this paper.
Conflicts of Interest
The authors declare no conflict of interest.
References
- Xu, G.; Chen, Y.; Eksteen, J.; Xu, J. Surfactant-aided coal dust suppression: A review of evaluation methods and influencing factors. Sci. Total Environ. 2018, 639, 1060–1076. [Google Scholar] [CrossRef] [PubMed]
- Ayoglu, F.N.; Acikgoz, B.; Tutkun, E.; Gebedek, S. Descriptive characteristics of coal workers’ pneumoconiosis cases in Turkey. Iran. J. Public Health 2014, 43, 389–390. [Google Scholar] [PubMed]
- Pollock, D.; Potts, J.; Joy, G. Investigation into dust exposures and mining practices in mines in the southern Appalachian Region. Min. Eng. 2010, 62, 44–49. [Google Scholar]
- Ross, M.; Murray, J. Occupational respiratory disease in mining. Occup. Med. 2004, 54, 304–310. [Google Scholar] [CrossRef] [PubMed] [Green Version]
- Weeks, J.L. Occupational health and safety regulation in the coal mining industry: Public health at the workplace. Annu. Rev. Public Health 1991, 12, 195–207. [Google Scholar] [CrossRef] [PubMed]
- Wang, Q.; Wang, D.; Wang, H.; Han, F.; Zhu, X.; Tang, Y.; Si, W. Optimization and implementation of a foam system to suppress dust in coal mine excavation face. Process Saf. Environ. Prot. 2015, 96, 184–190. [Google Scholar] [CrossRef]
- Ren, X.W.; Wang, M.D.; Kang, H.Z.; Lu, X.X. Engineering case report: A new method for reducing the prevalence of pneumoconiosis among coal miners: Foam technology for dust control. J. Occup. Environ. Hyg. 2012, 9, D77–D83. [Google Scholar] [CrossRef] [PubMed]
- Netting, D.I. Method for Reducing the Amount of Coal Dust in the Environment Surrounding Coal Mining. U.S. Patent 4,380,459, 19 April 1983. [Google Scholar]
- Lee, S.-M.; Lee, J.-W. A New Local Ventilation System Using a Vortex Flow Generated with a Finned Rotating Annular Disk. ASHRAE Trans. 2005, 111, 149–158. [Google Scholar]
- Collecutt, G.; Humphreys, D.; Proud, D. CFD simulation of underground coal dust explosions and active explosion barriers. In Proceedings of the 7th International Conference on CFD in the Minerals and Process Industries CSIRO, Melbourne, Australia, 9–11 December 2009. [Google Scholar]
- Hu, S.; Feng, G.; Ren, X.; Xu, G.; Chang, P.; Wang, Z.; Zhang, Y.; Li, Z.; Gao, Q. Numerical study of gas–solid two-phase flow in a coal roadway after blasting. Adv. Powder Technol. 2016, 27, 1607–1617. [Google Scholar] [CrossRef]
- Hu, S.; Wang, Z.; Feng, G. Temporal and Spatial Distribution of Respirable Dust After Blasting of Coal Roadway Driving Faces: A Case Study. Minerals 2015, 5, 679–692. [Google Scholar] [CrossRef] [Green Version]
- Geng, F.; Luo, G.; Zhou, F.; Zhao, P.; Ma, L.; Chai, H.; Zhang, T. Numerical investigation of dust dispersion in a coal roadway with hybrid ventilation system. Powder Technol. 2017, 313, 260–271. [Google Scholar] [CrossRef]
- Toraño, J.; Torno, S.; Menéndez, M.; Gent, M. Auxiliary ventilation in mining roadways driven with roadheaders: Validated CFD modelling of dust behaviour. Tunn. Undergr. Space Technol. 2011, 26, 201–210. [Google Scholar] [CrossRef]
- Ren, T.; Wang, Z.; Cooper, G. CFD modelling of ventilation and dust flow behaviour above an underground bin and the design of an innovative dust mitigation system. Tunn. Undergr. Space Technol. 2014, 41, 241–254. [Google Scholar] [CrossRef]
- Wang, Z.; Ren, T. Investigation of airflow and respirable dust flow behaviour above an underground bin. Powder Technol. 2013, 250, 103–114. [Google Scholar] [CrossRef]
- Glushkov, D.; Strizhak, P.; Vysokomornaya, O. Numerical research of heat and mass transfer during low-temperature ignition of a coal particle. Therm. Sci. 2015, 19, 285–294. [Google Scholar] [CrossRef]
- Zhang, Z. Study and Application of Integrated Eddy Current Ventilation and Dust Removal System in Mechanized Excavation Face. Master’s Thesis, China University of Mining and Technology, Xuzhou, China, 2010. [Google Scholar]
- Blazek, J. Computational Fluid Dynamics: Principles and Applications; Butterworth-Heinemann: Oxford, UK, 2015. [Google Scholar]
- Sokolichin, A.; Eigenberger, G.; Lapin, A.; Lübert, A. Dynamic numerical simulation of gas-liquid two-phase flows Euler/Euler versus Euler/Lagrange. Chem. Eng. Sci. 1997, 52, 611–626. [Google Scholar] [CrossRef]
- Van der Hoef, M.; Ye, M.; van Sint Annaland, M.; Andrews, A.; Sundaresan, S.; Kuipers, J. Multiscale modeling of gas-fluidized beds. Adv. Chem. Eng. 2006, 31, 65–149. [Google Scholar]
- Macı́as-Garcı́a, A.; Cuerda-Correa, E.M.; Dı́az-Dı́ez, M. Application of the Rosin-Rammler and Gates-Gaudin-Schuhmann models to the particle size distribution analysis of agglomerated cork. Mater. Charact. 2004, 52, 159–164. [Google Scholar] [CrossRef]
Figure 1.
Geometry of working face for two different ventilation systems. (a) long blowing and short suction ventilation system; (b) vortex ventilation system.
Figure 1.
Geometry of working face for two different ventilation systems. (a) long blowing and short suction ventilation system; (b) vortex ventilation system.

Figure 2.
Meshes for the physical model.
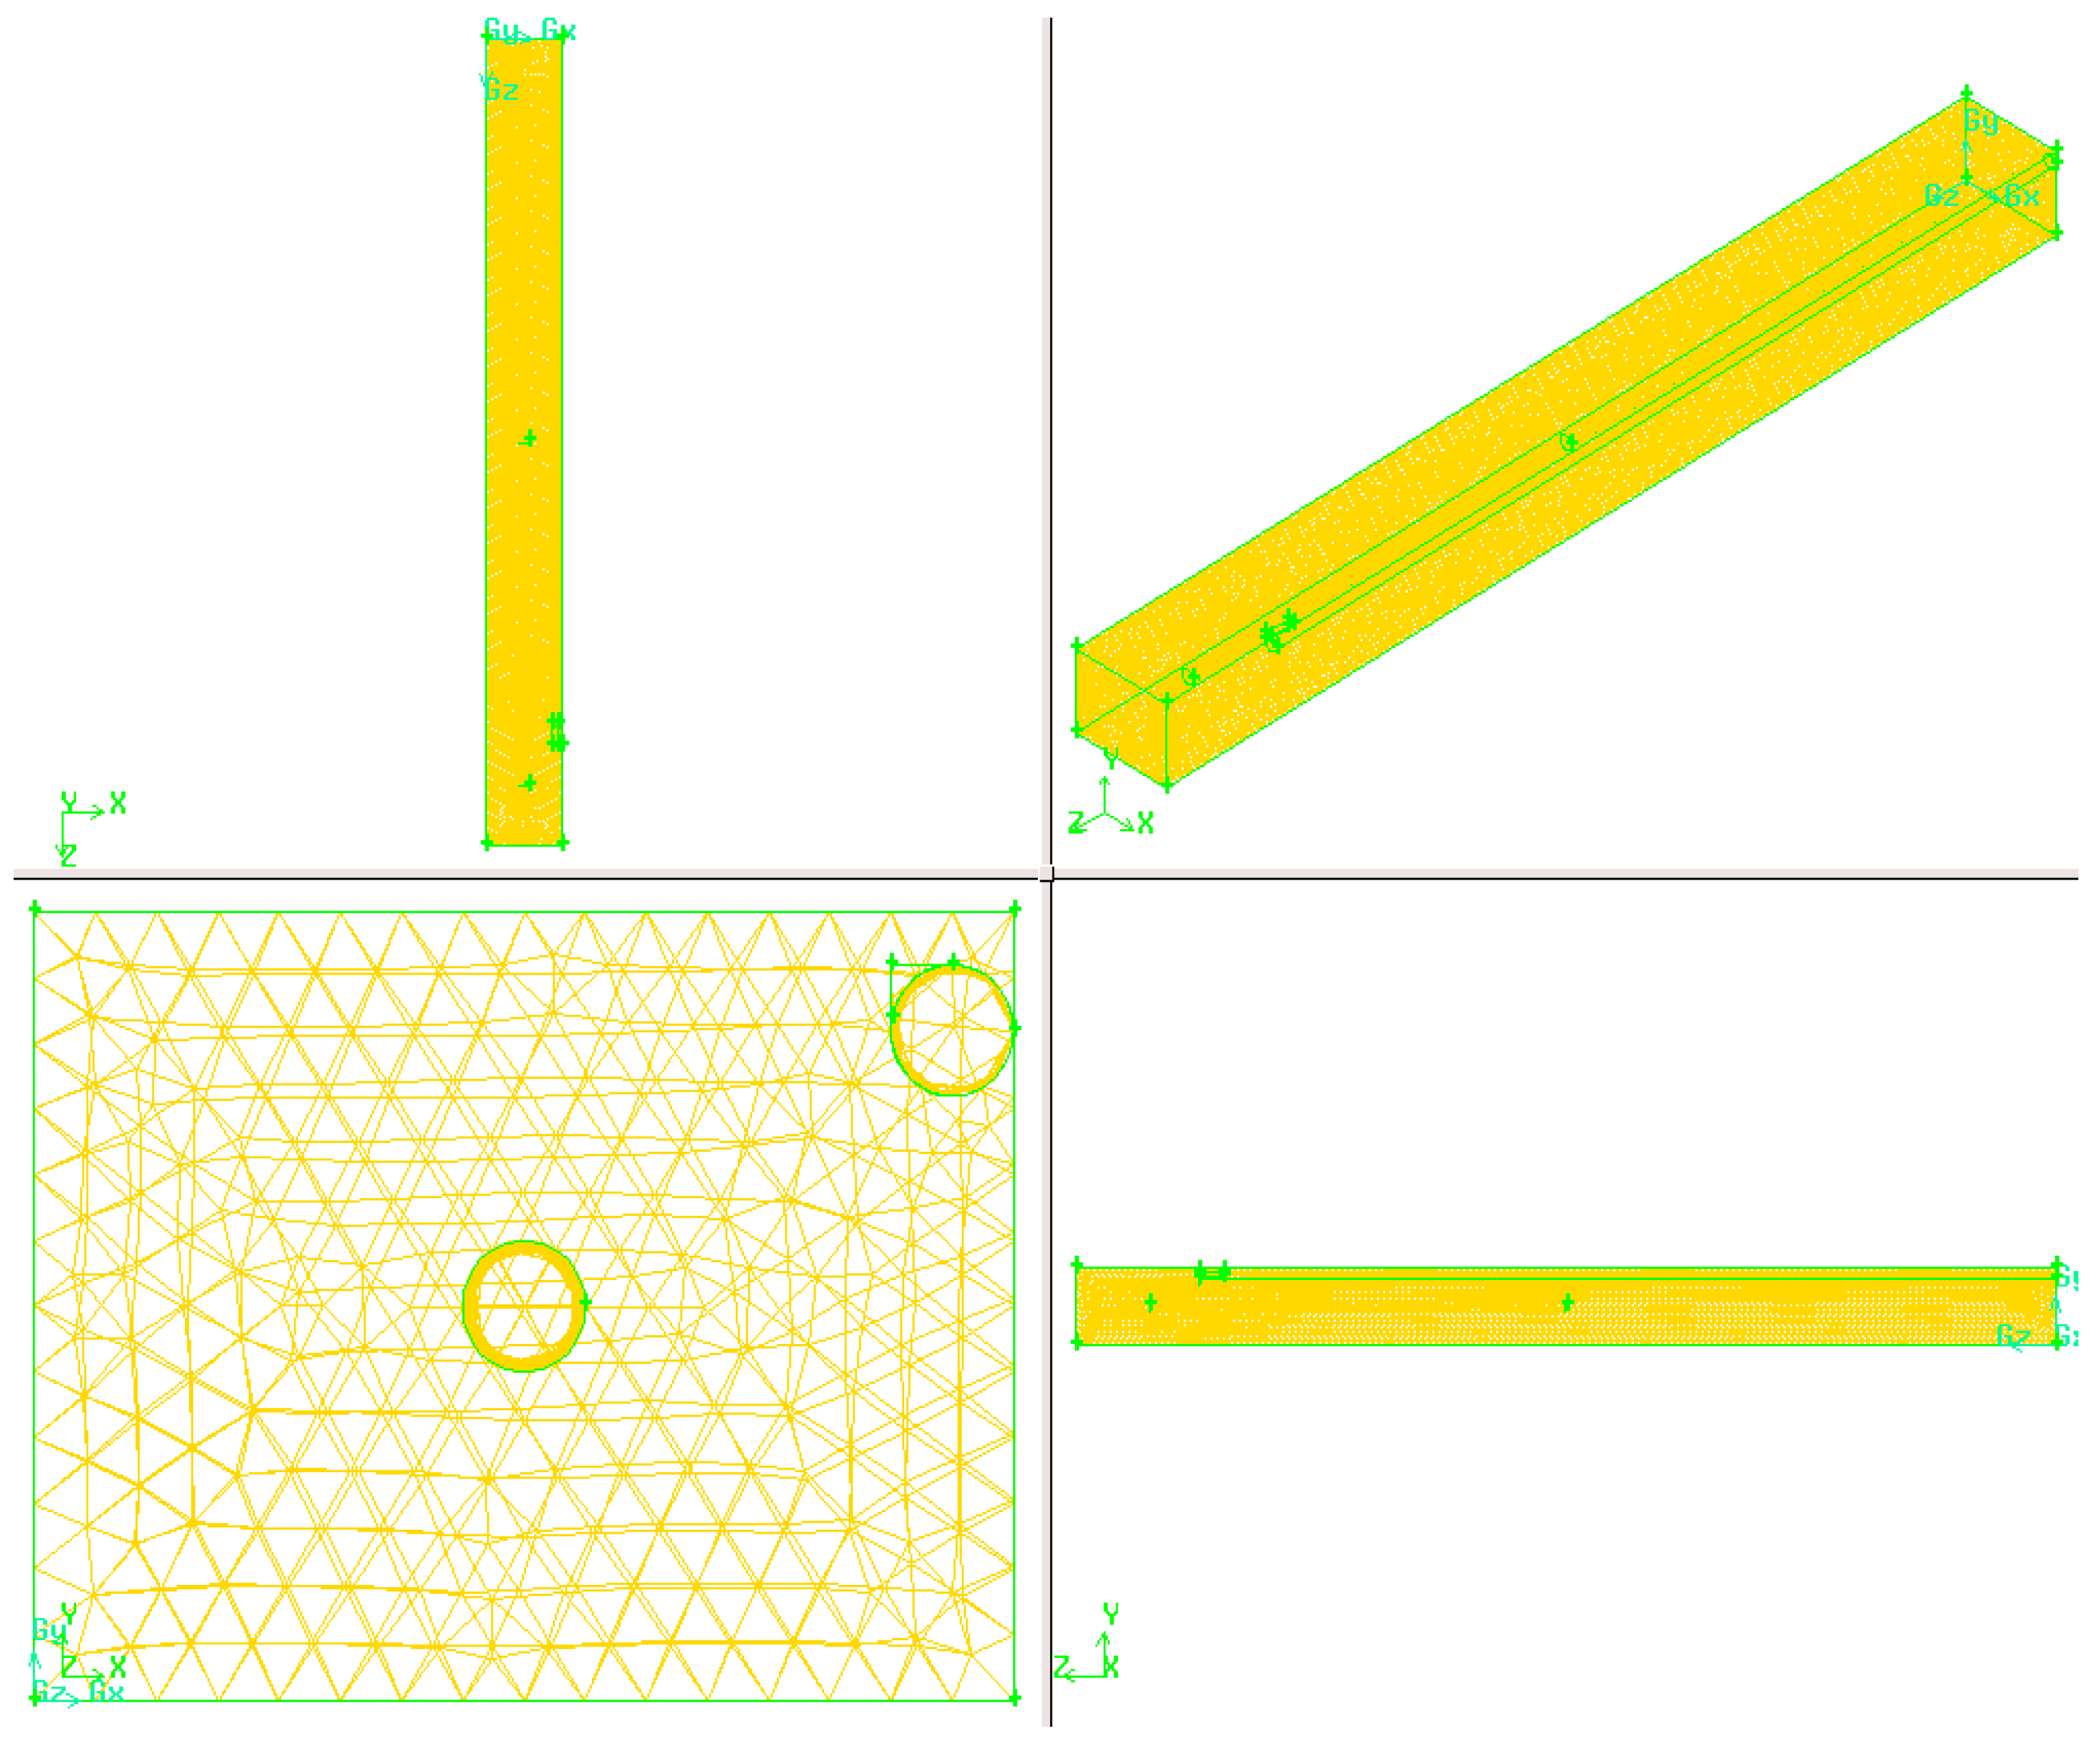
Figure 3.
Airflow velocity vector at 2.55 m above the floor (m/s).

Figure 4.
Airflow velocity vector at 1.5 m above the floor (m/s).

Figure 5.
Airflow velocity vector 2 m away from the side wall (m/s).

Figure 6.
Airflow velocity contour 2 m away from the side wall (m/s).

Figure 7.
Pressure contour 10 m from the heading face (Pa).

Figure 8.
Pressure contour 2 m from the side wall (Pa).

Figure 9.
Airflow velocity vector 5 m away from the heading face (m/s).

Figure 10.
Airflow velocity vector at 1.5 m above the floor (m/s).

Figure 11.
Airflow velocity vector 2 m away from the side wall (m/s).

Figure 12.
Coal dust trajectories for long blowing and short suction ventilation system colored by particle residence time(s). (a) Total coal dust particle trajectories; (b) respirable coal dust trajectories.
Figure 12.
Coal dust trajectories for long blowing and short suction ventilation system colored by particle residence time(s). (a) Total coal dust particle trajectories; (b) respirable coal dust trajectories.

Figure 13.
Coal dust trajectories for vortex ventilation system colored by particle residence time(s). (a) Total coal dust particle trajectories; (b) respirable coal dust trajectories.
Figure 13.
Coal dust trajectories for vortex ventilation system colored by particle residence time(s). (a) Total coal dust particle trajectories; (b) respirable coal dust trajectories.

Figure 14.
Coal dust concentration distribution near heading face under long blowing and short suction ventilation system. (a) Total dust concentration distribution (kg/m3); (b) respirable dust concentration distribution (kg/m3).
Figure 14.
Coal dust concentration distribution near heading face under long blowing and short suction ventilation system. (a) Total dust concentration distribution (kg/m3); (b) respirable dust concentration distribution (kg/m3).
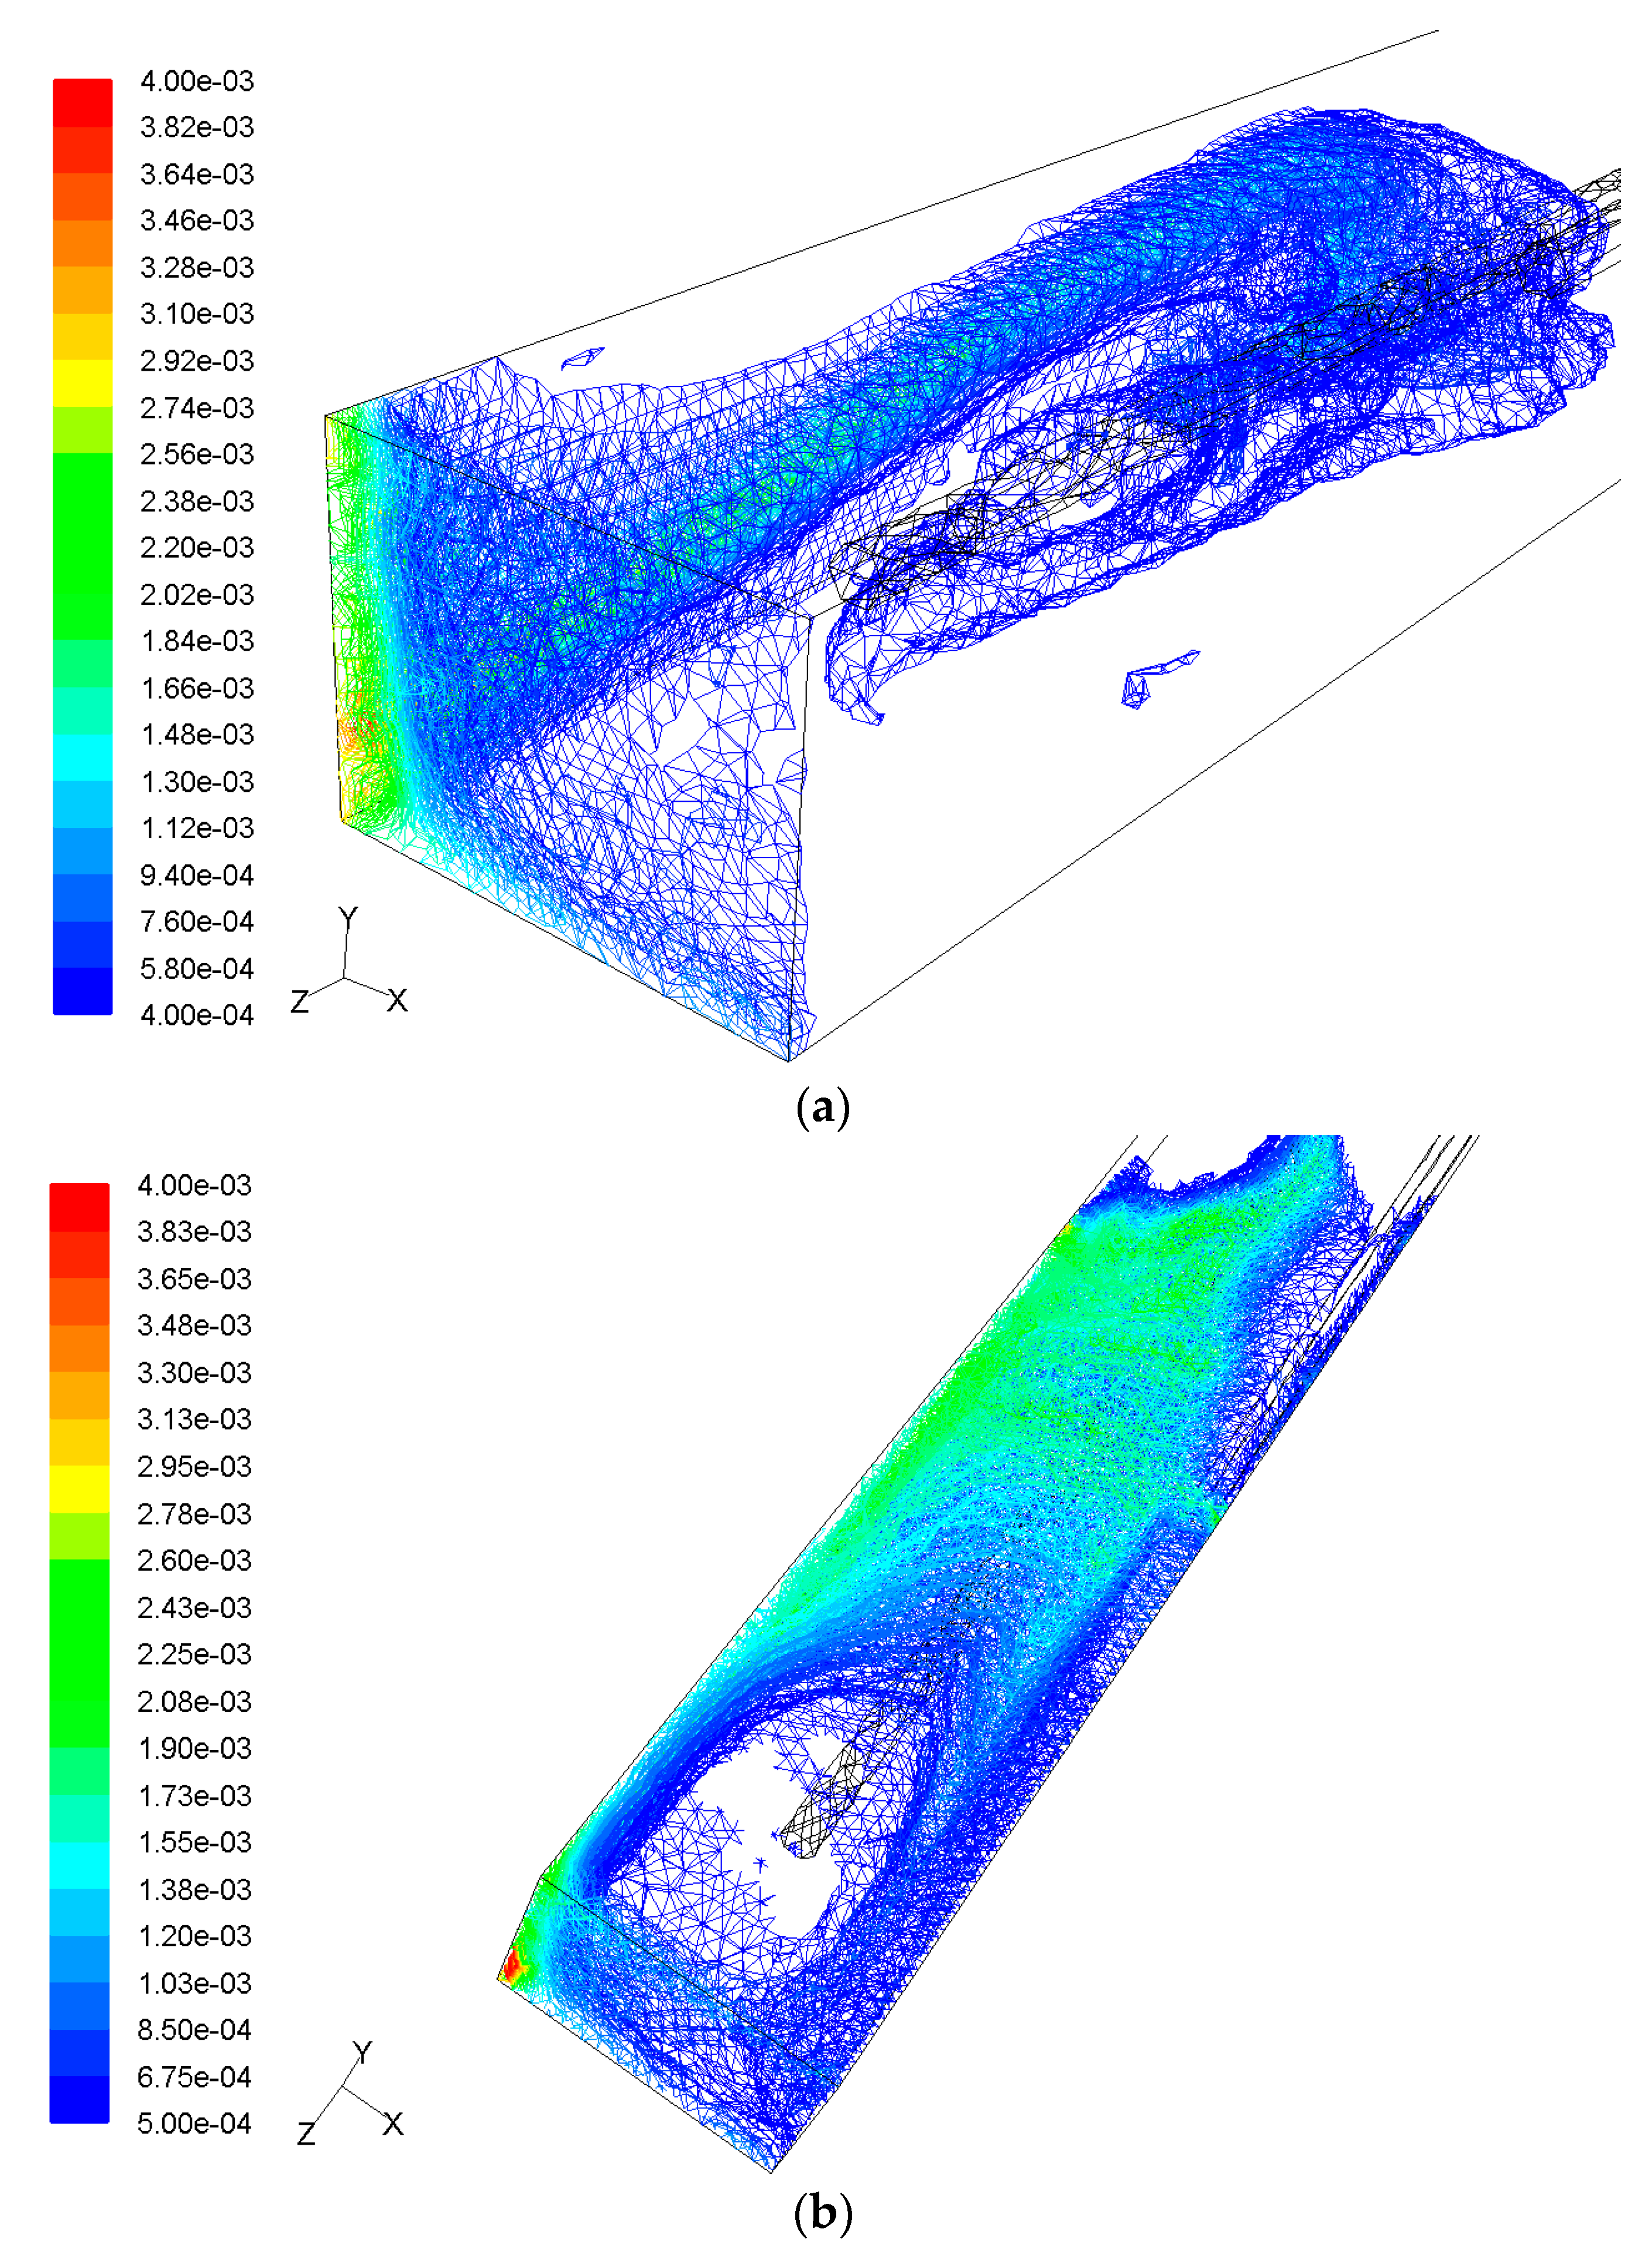
Figure 15.
Coal dust concentration distribution near heading face under vortex ventilation system. (a) Total dust concentration distribution (kg/m3); (b) respirable dust concentration distribution (kg/m3).
Figure 15.
Coal dust concentration distribution near heading face under vortex ventilation system. (a) Total dust concentration distribution (kg/m3); (b) respirable dust concentration distribution (kg/m3).

Figure 16.
Face averaged dust concentration under long blowing and short suction ventilation system.
Figure 16.
Face averaged dust concentration under long blowing and short suction ventilation system.

Figure 17.
Face averaged dust concentration under vortex ventilation system.

Figure 18.
Dust concentration distribution histogram at the working face outlet: (a) total dust for long-short ventilation system; (b) respirable dust for long-short ventilation system; (c) total dust for vortex ventilation system; (d) respirable dust for vortex ventilation system.
Figure 18.
Dust concentration distribution histogram at the working face outlet: (a) total dust for long-short ventilation system; (b) respirable dust for long-short ventilation system; (c) total dust for vortex ventilation system; (d) respirable dust for vortex ventilation system.


Table 1.
Solver setup.
| Model | Parameter |
|---|---|
| Solver | Pressure-Based |
| Implicit | |
| Steady | |
| Viscous Model | k-epsilon |
| Energy | off |
Table 2.
Solution schemes.
| Solution Controls | Parameters |
|---|---|
| Pressure-Velocity Coupling | SIMPLEC |
| Pressure Discretization | Standard |
| Discretization | Second Order Upwind |
| Convergence criterion | 0.001 |
Table 3.
Boundary conditions.
| Boundary | Boundary Conditions | Parameter |
|---|---|---|
| Blowing duct | Inlet Boundary Type | Velocity-inlet |
| Inlet Velocity (m/s) | 22 | |
| Hydraulic Diameter (m) | 0.5 | |
| Turbulence Intensity | 3.0% | |
| Suction duct outlet | Outlet Boundary Type | Velocity-outlet |
| Outlet Velocity (m/s) | 17 | |
| Hydraulic Diameter (m) | 0.5 | |
| Turbulence Intensity | 3.1% | |
| Roadway outlet | Outlet Boundary Type | Outflow |
| Wall | Shear Condition | No Slip |
Table 4.
Dust size distributions for full dust and respirable dust.
| Total Dust | Respirable Dust | ||
|---|---|---|---|
| Diameter (μm) | Mass Fraction | Diameter (μm) | Mass Fraction |
| 1~10 μm | 0.05 | 1~2 μm | 0.05 |
| 10~30 μm | 0.10 | 2~3 μm | 0.15 |
| 30~50 μm | 0.35 | 3~4 μm | 0.30 |
| 50~70 μm | 0.30 | 4~5 μm | 0.30 |
| 70~90 μm | 0.15 | 5~6 μm | 0.15 |
| 90~100 μm | 0.05 | 6~7.07 μm | 0.05 |
Table 5.
Wall collision boundary conditions.
| Boundary Condition | Boundary |
|---|---|
| Reflecting | Roadway wall Roadway roof Duct wall |
| Trap | Roadway floor |
| Escape | Duct inlet Duct outlet Roadway inlet Roadway outlet |
© 2018 by the authors. Licensee MDPI, Basel, Switzerland. This article is an open access article distributed under the terms and conditions of the Creative Commons Attribution (CC BY) license (http://creativecommons.org/licenses/by/4.0/).
Share and Cite
MDPI and ACS Style
Liu, X.; Chang, P.; Wang, E.; Zhang, Z.; Yang, S. Numerical Study of the Respirable Coal Dust Removal Performance of a Vortex Ventilation System at an Excavation Face. Energies 2018, 11, 2449. https://doi.org/10.3390/en11092449
AMA Style
Liu X, Chang P, Wang E, Zhang Z, Yang S. Numerical Study of the Respirable Coal Dust Removal Performance of a Vortex Ventilation System at an Excavation Face. Energies. 2018; 11(9):2449. https://doi.org/10.3390/en11092449
Chicago/Turabian StyleLiu, Xiaofei, Ping Chang, Enyuan Wang, Zhenguo Zhang, and Shuai Yang. 2018. "Numerical Study of the Respirable Coal Dust Removal Performance of a Vortex Ventilation System at an Excavation Face" Energies 11, no. 9: 2449. https://doi.org/10.3390/en11092449
Note that from the first issue of 2016, this journal uses article numbers instead of page numbers. See further details here.