Pseudo-Elastic Response of Gas Bearing Clastic Formations: An Italian Case Study


1
Stogit Division, Snam S.p.A. (Società per Azioni), 20097 San Donato Milanese, Italy
2
Department of Environment, Land and Infrastructure Engineering, Faculty of Engineering, Politecnico di Torino, Corso Duca degli Abruzzi 24, 10129 Torino, Italy
3
Dream srl (società a responsabilità limitata)—Corso Trento, 5, 10129 Torino, Italy
*
Author to whom correspondence should be addressed.
Energies 2018, 11(9), 2488; https://doi.org/10.3390/en11092488
Submission received: 12 July 2018
/
Revised: 17 September 2018
/
Accepted: 18 September 2018
/
Published: 19 September 2018
(This article belongs to the Section D: Energy Storage and Application)
Abstract
:The research presented in this paper focuses on the analysis of land movements induced by underground gas storage operations in a depleted reservoir in Northern Italy with the aim of increasing the understanding of the deformation response of deep formations via a real case study. The a priori knowledge of the pseudo-elastic parameters showed a substantial discrepancy between static values from triaxial lab tests and dynamic values obtained via the interpretation of sonic data at wellbore scale. The discrepancy is not surprising for the formations under investigation: a thousand meters of a silty to shaly sequence intercalated with arenaceous banks above a reservoir formation, which is basically made up of sandstone intercalated with shale intervals and conglomerates. Information collected for over more than ten years of seasonal production/injection cycles (i.e., time and space evolution of the reservoir fluid pressure and of the induced land surface movements) was then combined in a 3D numerical geomechanical model to constrain and update the a priori knowledge on the pseudo elastic model parameters via a back analysis approach. The obtained calibrated model will then be used for reliable prediction of system safety analyses, for example in terms of induced ground movements.
1. Introduction
The compaction/expansion of hydrocarbon-bearing formations due to fluid withdrawal/injection is a major social concern, especially in high urbanized areas, such as the Po Plain area in Northern Italy [1,2,3]. From the early 1950s onwards, numerous hydrocarbon fields were discovered and produced in this area, several of which were converted into, and operated as, underground gas storage (UGS) systems. Natural gas storage in underground formations is a widespread practice which serves to meet today’s growing energy need as well as daily and seasonal oscillation demands. UGS basically consists of injecting gas during the summer season and producing it during the winter months. This cyclical pressure fluid variation induces reservoir deformation (compaction & expansion) with a consequent seasonal subsidence and rebound of the ground surface, the so-called ‘earth breathing’ phenomenon [4].
The effects of hydrocarbon exploitation and UGS operations, in terms of underground deformations and surface movements, have been the focus of various investigations in the Italian context and abroad [4,5,6,7,8,9]. In fact, reliable prediction of time-evolution subsidence phenomena is essential to prevent or at least mitigate system failure (such as wellbore and casing damage) as well as ensure urban settlement safety [10,11,12] according to good practice and in agreement with a sustainable oil industry approach [13].
Regardless of the methodological approach taken (such as: analytical, semi-analytical or numerical models), a representative mechanical characterization of the compacting sediments is an essential requirement for the reliability of forecast system behavior. Mechanical properties are generally defined according to laboratory analysis performed on cores, usually retrieved from the reservoir and cap rock sequences, together with information from well logs and seismic surveys [14,15]. As it is well known, formation stiffness is closely related not only to the nature and the structure of the porous media, its saturated fluids and the in situ conditions, but it is also closely dependent on factors like strain amplitude and scale effects. Therefore, the pseudo-elastic parameter values determined from laboratory analyses can be substantially different for values obtained by well log interpretation, increasing the uncertainty in defining the real deformation behavior of the formation affected by fluid exploitation and its surroundings [16]. Furthermore, mechanical behavior of clastic formations at a depth of around 1000 m (as the reservoir in this case study) could be within rock mechanics and/or soil mechanics. However, assimilation of different information, such as lab data and well log data together with surface displacement monitoring and the evolution of fluid pressure in time and space, can help in obtaining an indirect estimate of formation mechanical parameters [15].
This paper focuses on the analysis of land movements induced by UGS operations in a depleted reservoir in Northern Italy with the aim of increasing the understanding of the deformation response of deep formations via a real case study. The a priori knowledge of the pseudo-elastic parameters showed a substantial discrepancy between lab values and well log ones, not surprising for the formation under investigation. Different information (such as pressure variation in the reservoir and monitored land movements) was then combined in the numerical approach to constrain and update the a priori knowledge on model parameters, thus improving the geomechanical characterization of the system and, in particular, the reliability of the model prediction for future system safety analyses.
2. Formation Stiffness and Pseudo—Elastic Parameters
Pseudo-elastic parameters which quantify formation stiffness are principally evaluated via standard lab tests (such as: uniaxial/triaxial compression tests and oedometric tests) or determined by acoustic sound speed measurements and density data. Standard nomenclature defines this as “static moduli”—ES the values obtained from stress and strain measurements in a rock mechanical test and as “dynamic moduli”—ED those obtained from acoustic velocities and density data. It is interesting to notice that the static and dynamic moduli are equal for a homogeneous, elastic material like steel; on the other hand, a wide range of experimental evidence on rock/soil materials shows a substantial discrepancy between static and dynamic values [16]. This discrepancy has been explained by the nature of the porous media and its saturated fluids as well as by external factors, such as in situ conditions, scale effect or strain amplitude. In particular, dynamic and static measurements differ in terms of the frequency and the amplitude of strains. Material stiffness decreases as frequency of the induced strain decreases; under identical stress conditions, transition from ultrasonic to acoustic and seismic frequencies to static measurement conditions is accompanied by a decrease in the Young’s modulus of rocks. Frequency dependence is related to strain rate dependence; the observed decrease in Young’s modulus at lower frequencies is consistent with the idea of a higher viscoelastic contribution at lower strain rates [17]. On the other hand, several authors [16,17,18,19] agree in identifying strain amplitude as one of the main reasons for the discrepancy between static and dynamic values. In a velocity measurement the strain amplitude is typically 10−6–10−7, while a static acquisition involves a strain amplitude in the order of 10−2–10−3. The well-known qualitative relation shown in Figure 1 highlights the non-linear deformation behavior of geologic materials and the consequent pseudo-elastic parameters variation as a function of the strain amplitude.
The physical origin of this discrepancy is likely to be related to the heterogeneous microstructure of the rocks and to different physical mechanisms of deformations which arise at different strain levels; much of the effects concerning plasticity and nonlinear effects originate at the grain contacts, where elastic threshold can be overtaken even at moderate external stress [16]. This particularly applies in weak rocks, where the difference between static and dynamic moduli can even be an order of magnitude or more; the discrepancy is interpreted as being caused by a series of local failure processes at a microscopic scale (such as crushing of asperities at the grain contacts as well as sliding along contact points or closed micro-cracks) occurring during the entire loading sequence. The discrepancy is reduced with increasing confining stress [17,20]; generally speaking, all pseudo-elastic parameters of rocks normally increase due to the closure of cracks and micro-cracks with increasing hydrostatic pressure, but ultimately as a result of different trends.
Experimental evidence on dry sandstone [21] showed that the elastic modulus derived from the slope of the stress-strain curve approaches the corresponding elastic modulus derived from velocity measurements in case of unloading-reloading cyclical static tests when the amplitude of the cycles approaches zero. In this test condition the material could experience similar stress cycles (with low amplitudes) when an acoustic wave passes by.
3. Case Study
3.1. Geological Setting
The structural and stratigraphic evolution of the Po Plain subsurface, where the reservoir under analysis is located, was controlled until the Upper Miocene by the South-Alpine orogenetic belt development. The entire Mesozoic and Tertiary sedimentary sequences were involved through the development of folds and thrusts dipping to the north (Figure 2). In particular, the extensional Triassic-Jurassic inf. structures characterizing the carbonatic platform were re-actived and inverted; differently, new compressive structures were activated inside the tertiary clastic sequence associated to the formation of anticline structures [22,23,24].
The reservoir is located at an average depth of 1200 m TVD ss and it is defined by a stratigraphic trap resulting by the combination of erosional and depositional closures typically occurring in marginal marine depositional settings. Reservoir lithology is defined by the alternation of sandstones and conglomerates, locally interbedded by marls or shaly limestones (the Sergnano Formation). The cap rock is represented by the overlying Argille del Santerno Formation.
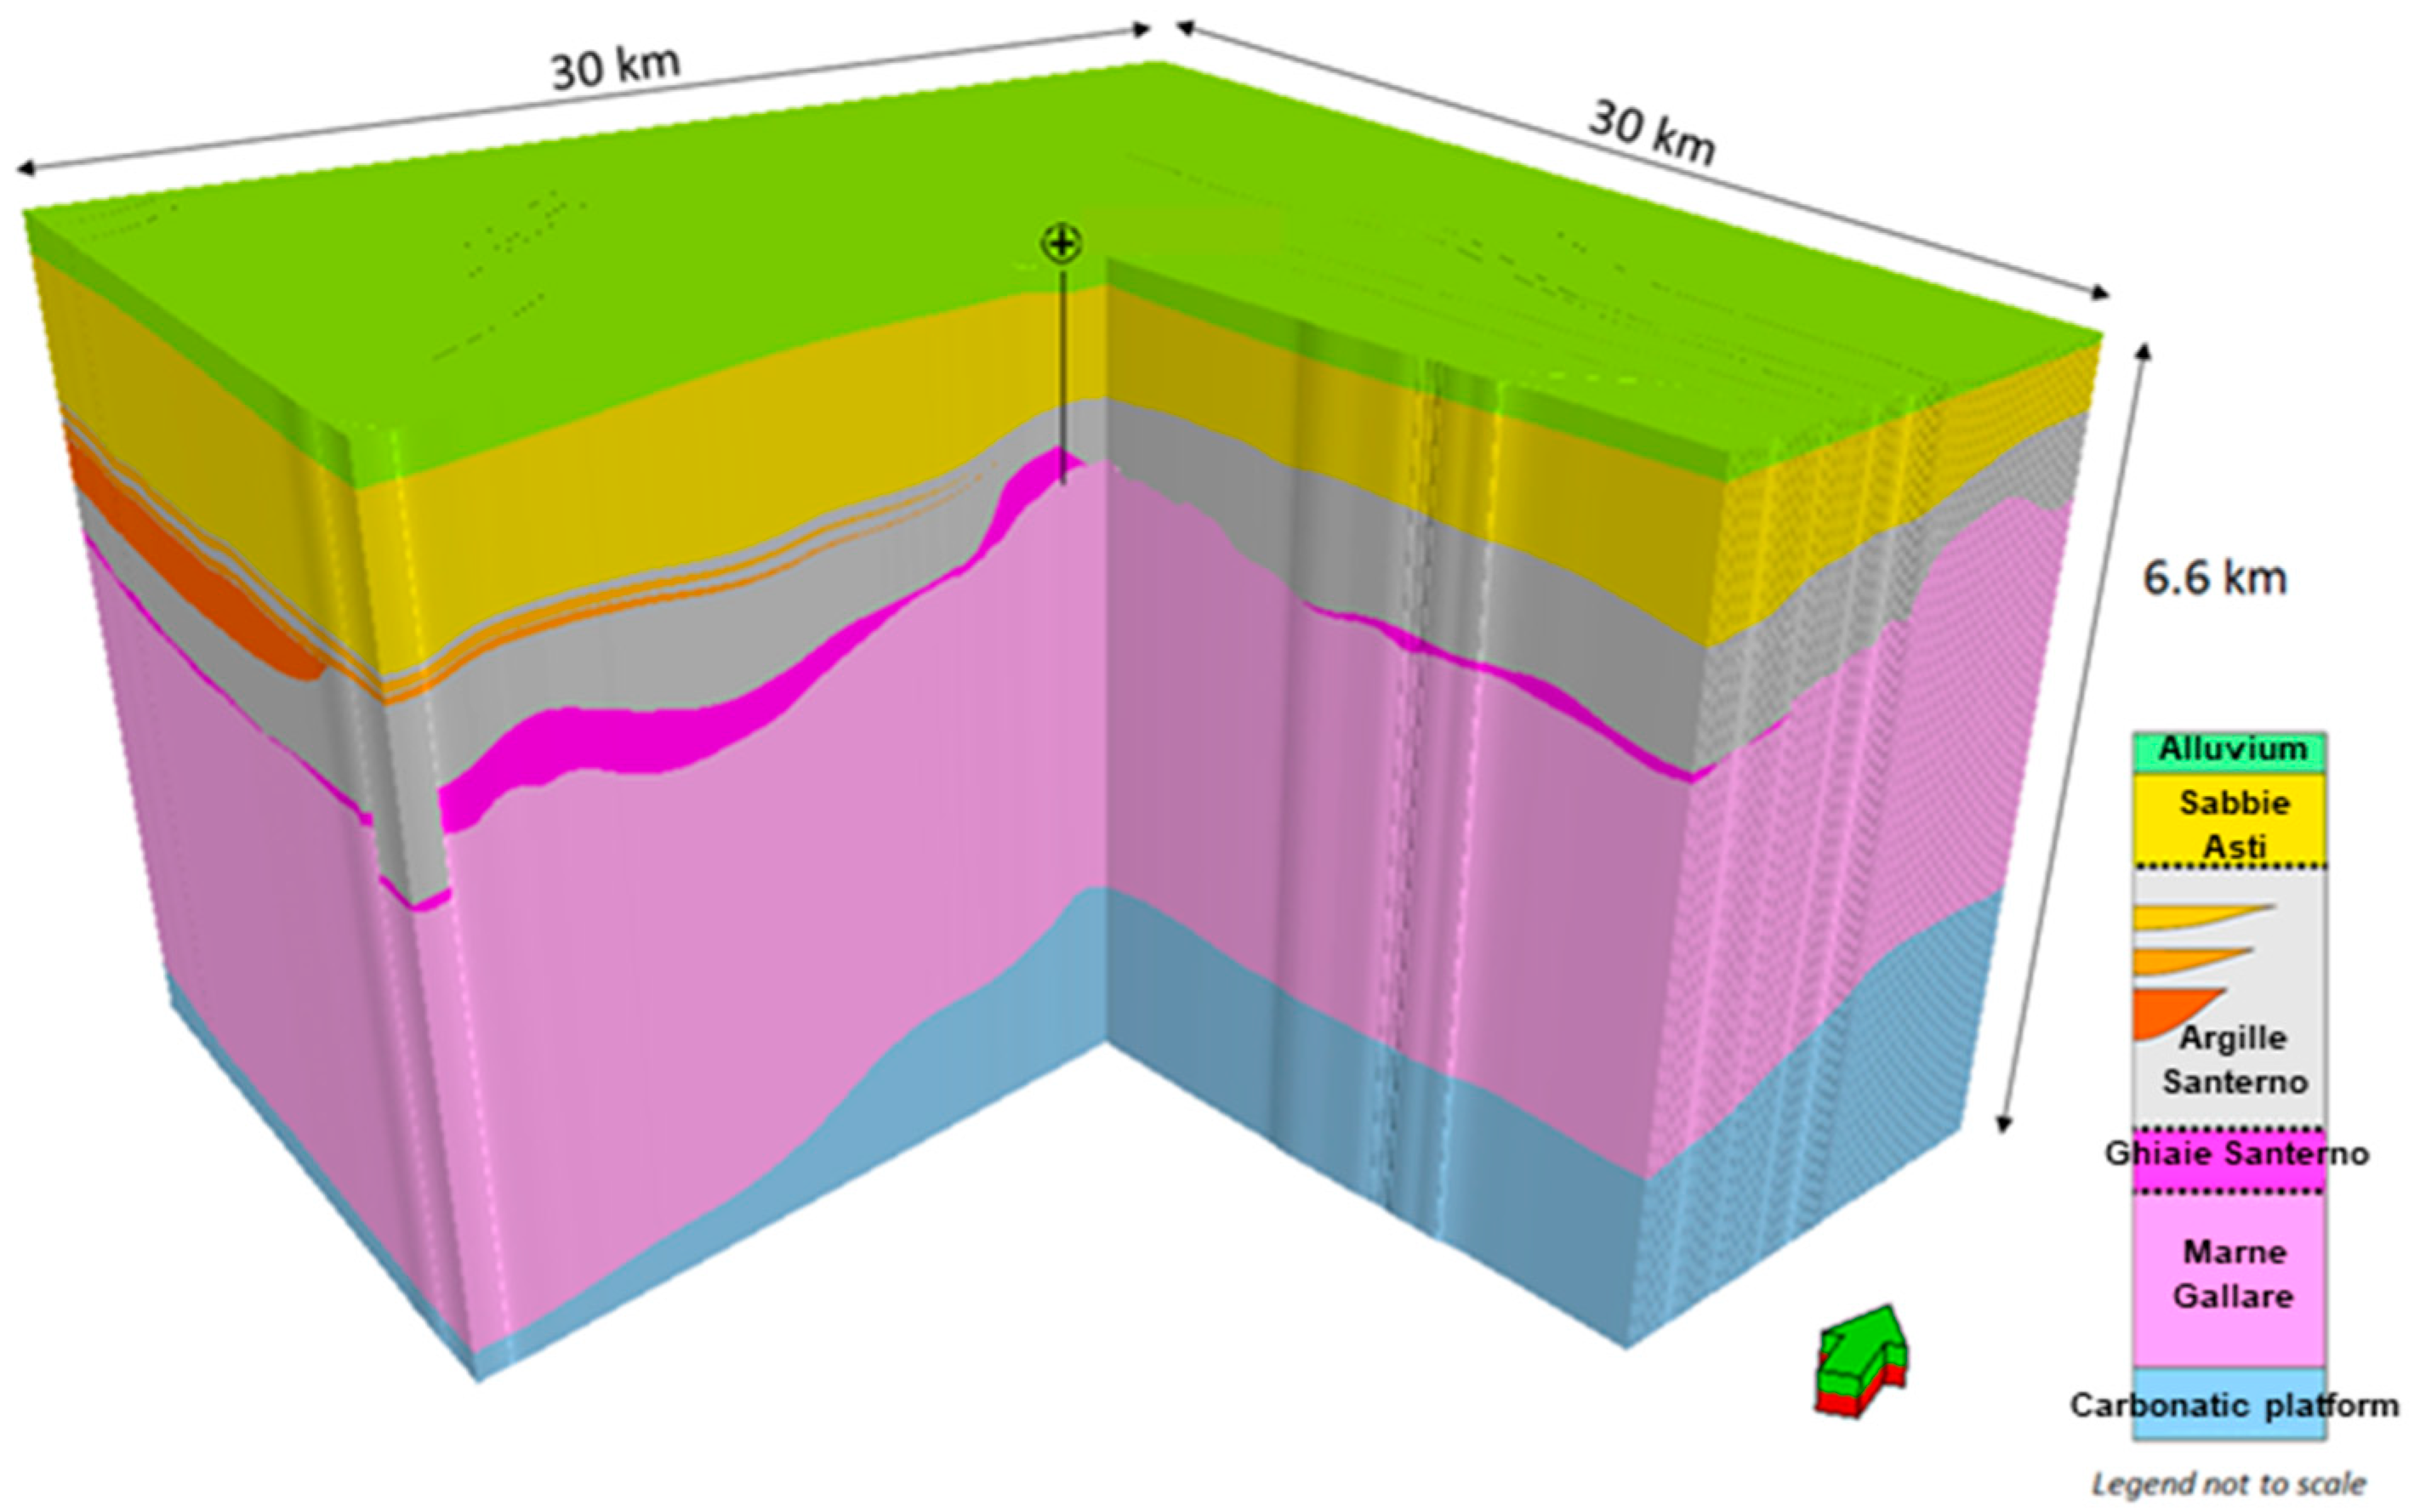
A 3D geological model at regional scale was set up to target land movement analysis (Figure 3). The model adequately reproduced the key stratigraphic and structural features in the domain of investigation (the reservoir, its surrounding formations and the overburden up to the surface).
3.2. Stratigraphy & Lithology
The stratigraphic sequence of the Po Plain subsurface is made up of (from bottom to top): (1) platform dolomites (Triassic–Jurassic Inf.) and limestones (Jurassic Inf.–Mid. Eocene); (2) the Marne di Gallare Formation (Mid. Eoc.–Mioc. Sup.), constituted by marls and arenaceous marls typical of an external platform or slope; (3) the Ghiaie di Sergnano Formation (Mess.–Sup–Plioc. Inf.) (hosting the reservoir under analysis), conglomeratic–arenaceous sequence representing delta fan deposits; (4) the Argille del Santerno Formation (Pliocene–Pleistocene), silty–shales deposited inside the Pliocene foredeep in alternation to (5) turbiditic sequences composed of sandy layers alternating with shales; (6) the Sabbie di Asti Formation, Quaternary deposits (mainly sands) deposited in the subsea to continental environment; (7) recent alluvium (Holocene).
From a lithological standpoint, the stratigraphic record can be divided into five main zones corresponding to the main formations: (1) an upper zone mainly composed of sands (2) a shale zone, (3) a conglomeratic zone, (4) a marl zone and (5) a lower carbonate zone.
4. Data Analysis: Static and Dynamic Elastic Moduli Determination
A coherent and full dataset for rock characterization in terms of deformation parameters is available. It consists of triaxial compression tests performed by a private reservoir laboratory on the rock samples retrieved at well-A from the cap rock formation (shale) and the gas-bearing formation (only sandstone samples) and sonic and density log measurements acquired at the same well-A.
Undrained triaxial compression tests (CIU) were performed on 9 shale samples, retrieved in the cap rock at a depth of around 1100 m (TVD ssl) Due to the homogeneity of the cap rock, the number of samples allowed an adequate representation of the system. The hydrostatic consolidation phases of 18–20 h were performed imposing 2.0, 7.5, 10 or 20 MPa of confining pressure; then the samples were compressed imposing an axial displacement rate of 3.0 mStrain/h. Regarding the 5 sandstone samples (retrieved at the bottom of the reservoir formation at around 1500 m TVD ssl), hydrostatic stress levels equal to 2, 10 or 20 MPa were imposed at a loading rate of 0.8 MPa/min; the consolidation phases last 30–45 min. Then, a drained triaxial compression was performed with an axial deformation rate of 10 mStrain/h. Because of the high heterogeneity of reservoir formation (conglomeratic-arenaceous sequence representing delta fan deposits), the accuracy of formation description could be increased via retrieving of some samples in the other lithologies.
Figure 4 shows an example of a shale and a sandstone specimen, and Figure 5 shows the results of triaxial compression phases on both specimens.
The static Young’s modulus, ES, was interpreted using linear regression in the 40–60% range of the peak axial stresses. Results from lab tests on shale were interpreted as drained parameters.
Figure 6 shows static elastic moduli values in relation to confined pressure, where 7.5 to 20 MPa can be assumed as representing the initial in situ conditions. Static modulus values are quite dispersed for both lithologies: shale Young moduli vary from 0.2 to 1.3 GPa; whereas sandstone Young moduli vary from 3 to 9 GPa and they increase with depth, in agreement with theoretic behavior.
As a general rule, during primary production deformation behavior of the normally consolidated formations is controlled by the loading static elastic modulus EI (in the case presented in this paper, EI are the values obtained from the CIU and CID lab tests). In this phase the stress-strain path follows the critical state line (CSL). Due to compaction, the formations could become slightly over-consolidated and their deformation response during the storage phase is usually ruled by the unloading/reloading static elastic modulus EII, around 3 times higher than EI. Because no unloading-reloading cyclical phase was performed during triaxial tests, a direct estimation of the increment in rock stiffness due to initial loading (i.e., primary production) was not available. Furthermore, as already mentioned [21], in the case of unloading-reloading cyclical static test conditions, the material could experience similar stress cycles (with low amplitudes) when an acoustic wave passes by, so this test condition could allow for filling the gap between static and dynamic modulus values.
The interpretation of sonic and density logs acquired at well-A showed substantial discrepancy between static and dynamic values, ED. Log measurements were acquired for the reservoir and its cap rock, their overburden formations (Argille del Santerno Formations and intercalated turbiditic deposits) and the underburden formations (Marne di Gallare Formation.). Figure 7 shows the variation of the dynamic elastic modulus in relation to depth. The following distinctive features can be highlighted:
- (1)
- The upper clastic sequence, i.e, from 800 m TVD ssl to the cap rock (around 1200 m TVD ssl), is made up of a silty to shaley sequence intercalated with arenaceous banks (10 s meter thick); in these formations dynamic values, ED, vary from (5–6) GPa to (12–14) GPa and the effect of lithology variation on the elastic modulus values can be considered negligible compared to the influence of depth. This behavior was already pointed out by Ferronato et al. [26] and Teatini et al. [27] by statistically analyzing several in situ deformation measurements carried out in the offshore portion of the Po River basin by radioactive marker technique.
- (2)
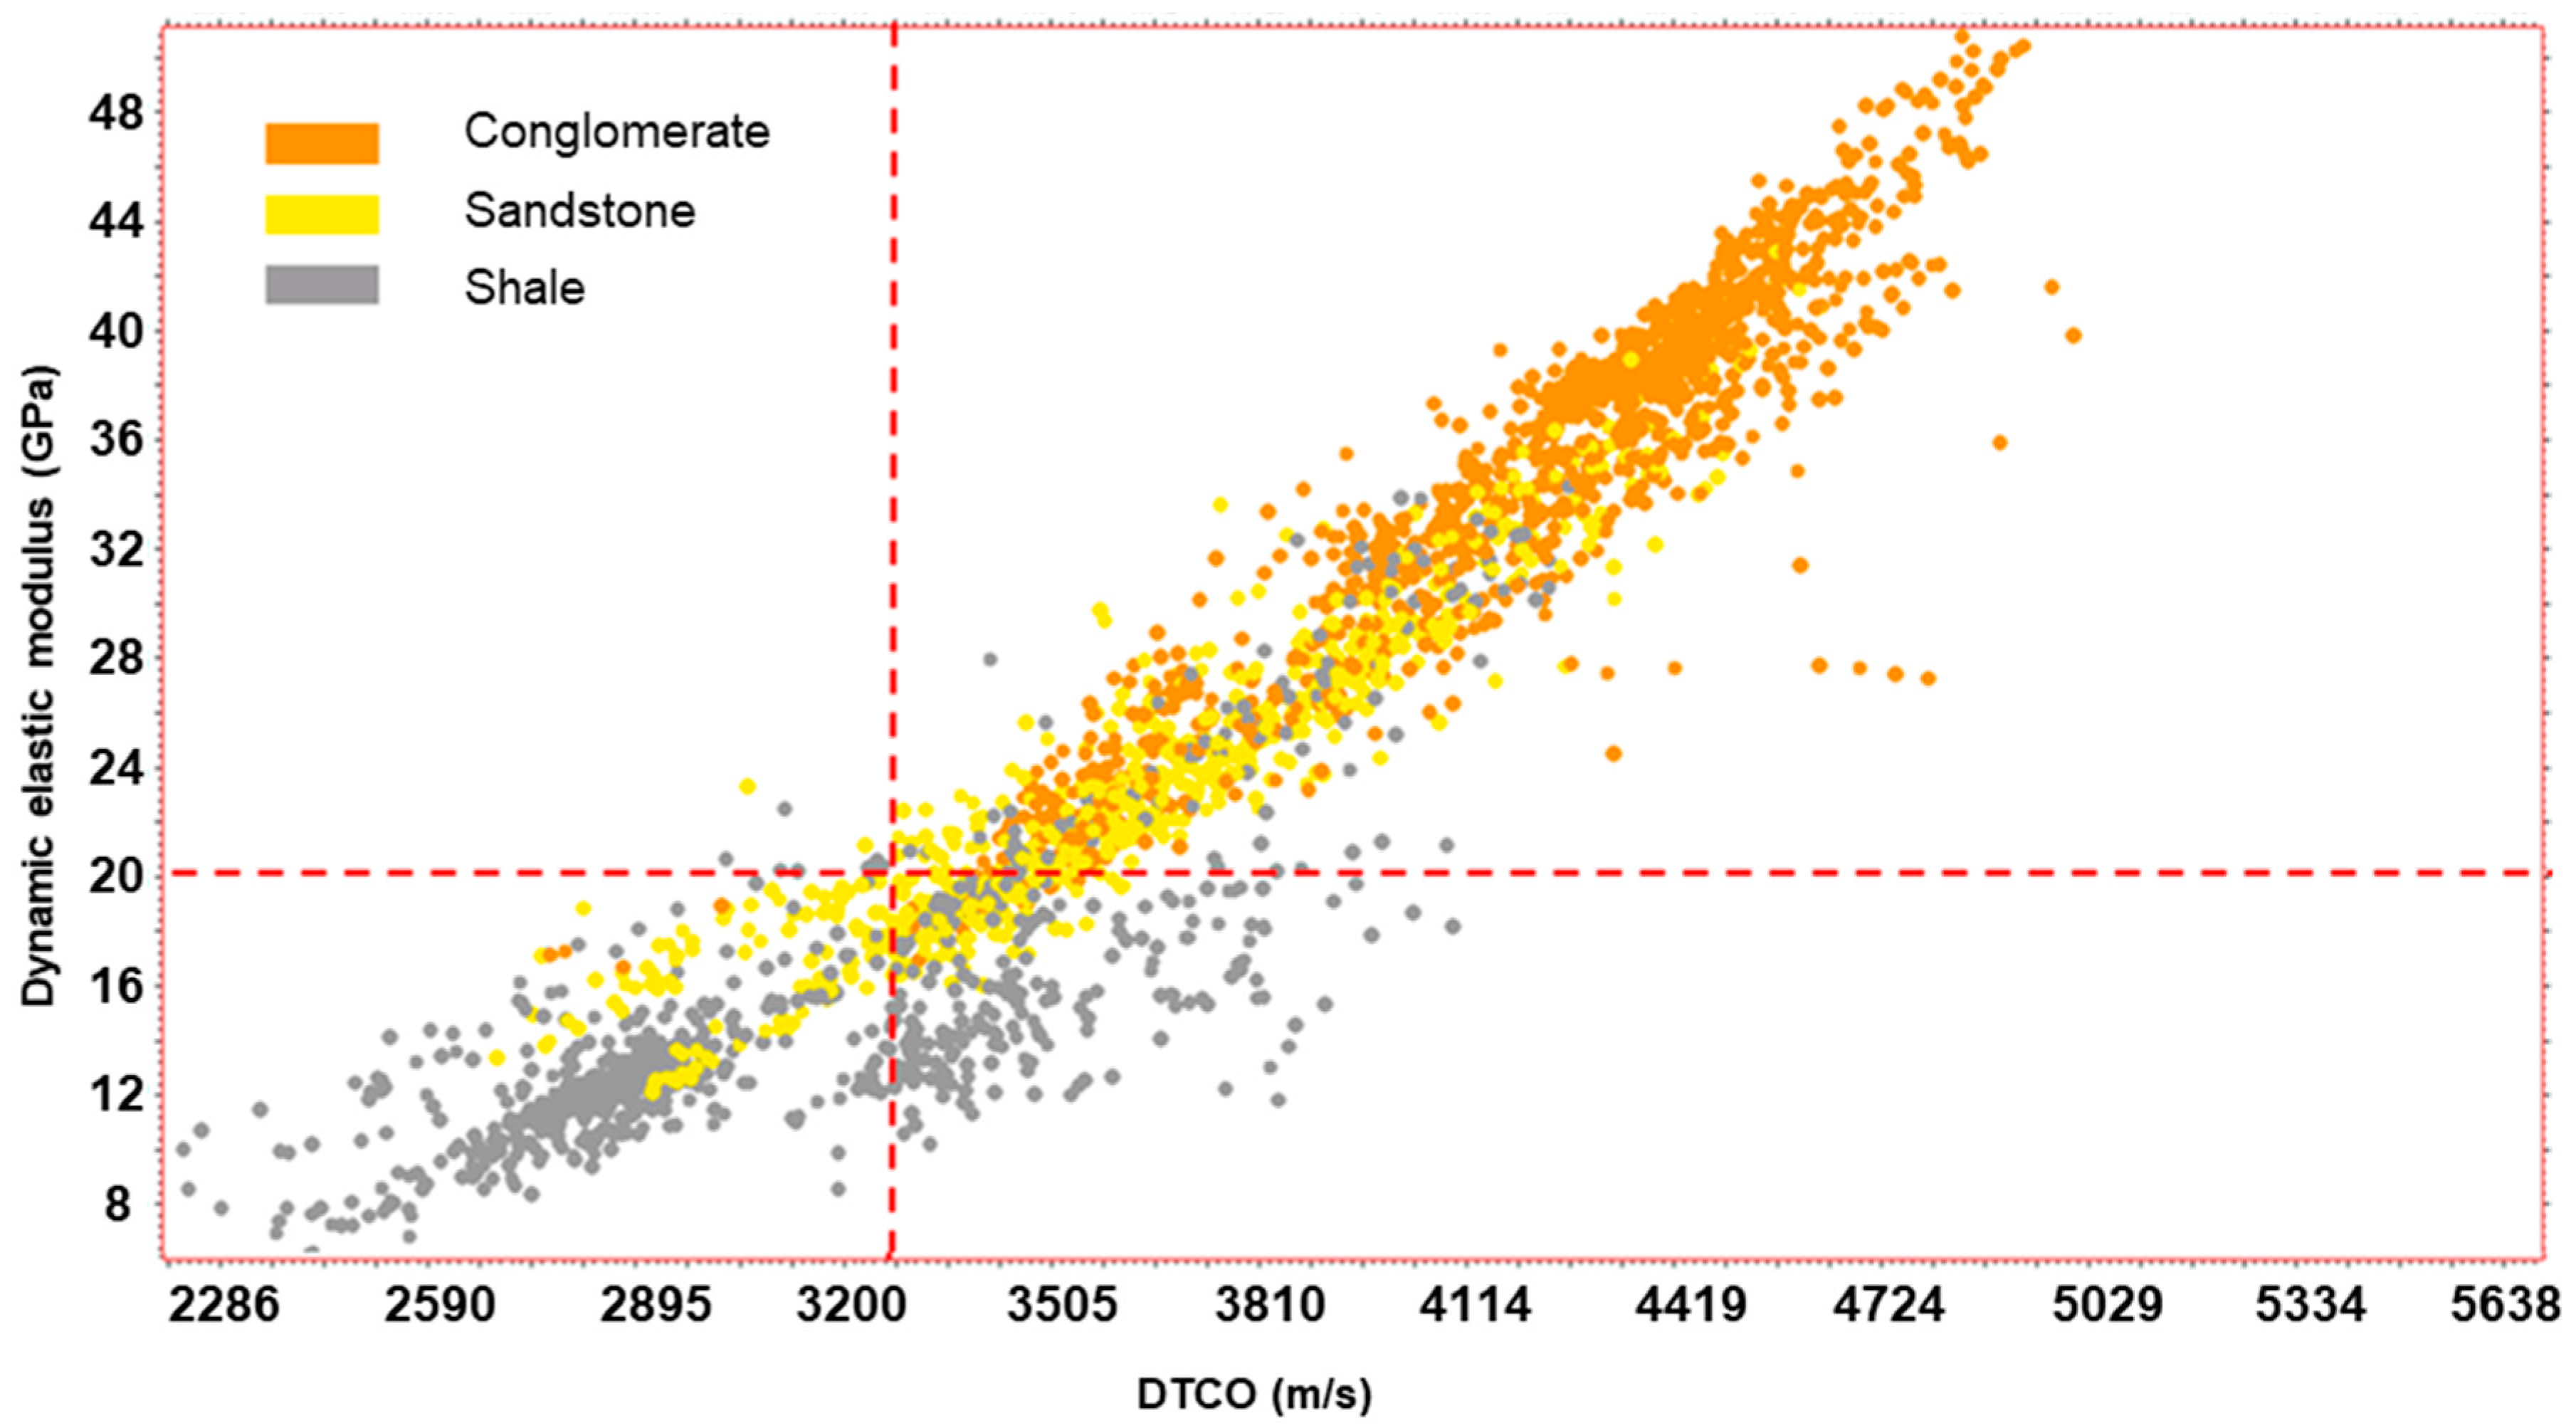
- Conversely, the lithological change between the upper shaley-sandy formations and the gas bearing formation, basically sandstone intercalated with shale intervals and conglomerates, has a substantial impact on the deformation properties; dynamic modulus changes from 12 GPa up to 40 GPa basically in relation with lithology. The cross-plot between dynamic elastic modulus and compressional wave velocity—DTCO (Figure 8) represents another way to highlight the effect of lithological variation on sonic log.
- (3)
- The discrepancy between static values from triaxial tests performed on shale samples and the corresponding dynamic values from log interpretation (considering the same depth) reaches even one order of magnitude; instead, in the more compact sandstone the difference is reduced to a ratio of 2–4.
5. Modelling and Back Analysis
The physical phenomena under analysis, i.e., stress-strain variation induced by seasonal injection/withdrawal operations in a UGS system and its effect in terms of ground movements, was mathematically described with the aid of a 3D numerical model (FEM). The available geological and structural features together with key formation petrophysical and mechanical properties was the basis for rock mechanics modelling set up and characterization. Rock mechanics engineering analyses were developed according to the elastic-purely plastic constitutive law and by adopting the Mohr-Coulomb failure criteria. Although the geomechanics of deep rocks could be governed by non-associated elasto-plastic and rate-dependent laws, a simplified model, supported by available measurements and able to capture the main deformation effects, would still be preferable, at least as basic indication of the phenomena under analysis [28].
Information about pressure evolution and ground movements collected over nearly 12 years of monitoring in the region under investigation was combined in the numerical approach to constrain and update the a priori knowledge on model parameters, thus improving the geomechanical characterization of the system and, mainly, the reliability of the model prediction. The historical pore pressure evolution in time and space due to UGS operations was derived via a calibrated multiphase flow numerical model (FDM) and it is the forcing function applied to the geomechanical system. The occurrence, pattern and magnitude of land displacement above the field was provided by analysis of satellite images (PSInSARTM). Based on synthetic aperture radar (SAR) data acquired over the same area at different times, the PSInSARTM methodology provides millimeter-scale movements of large zones [4,29,30].
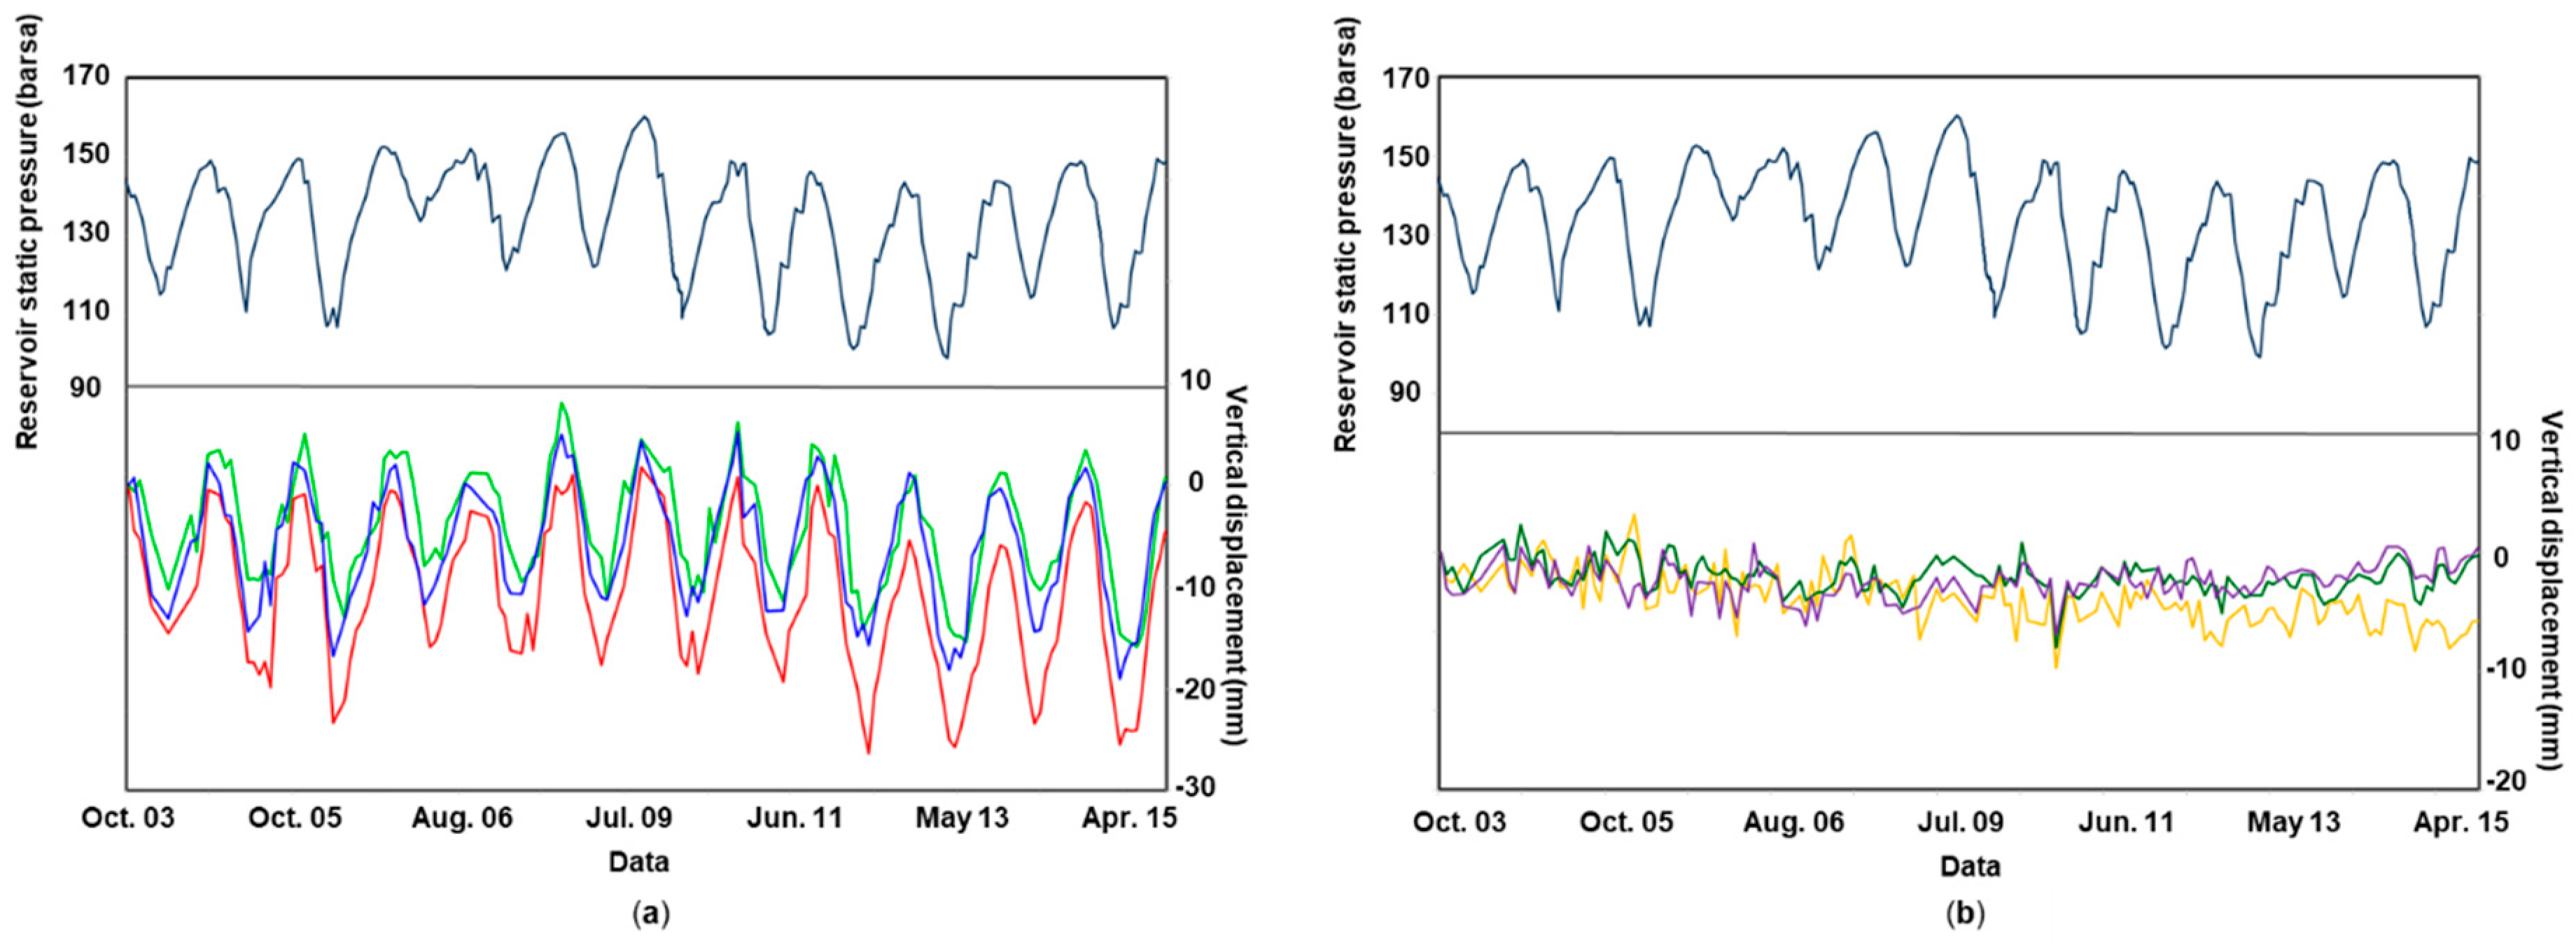
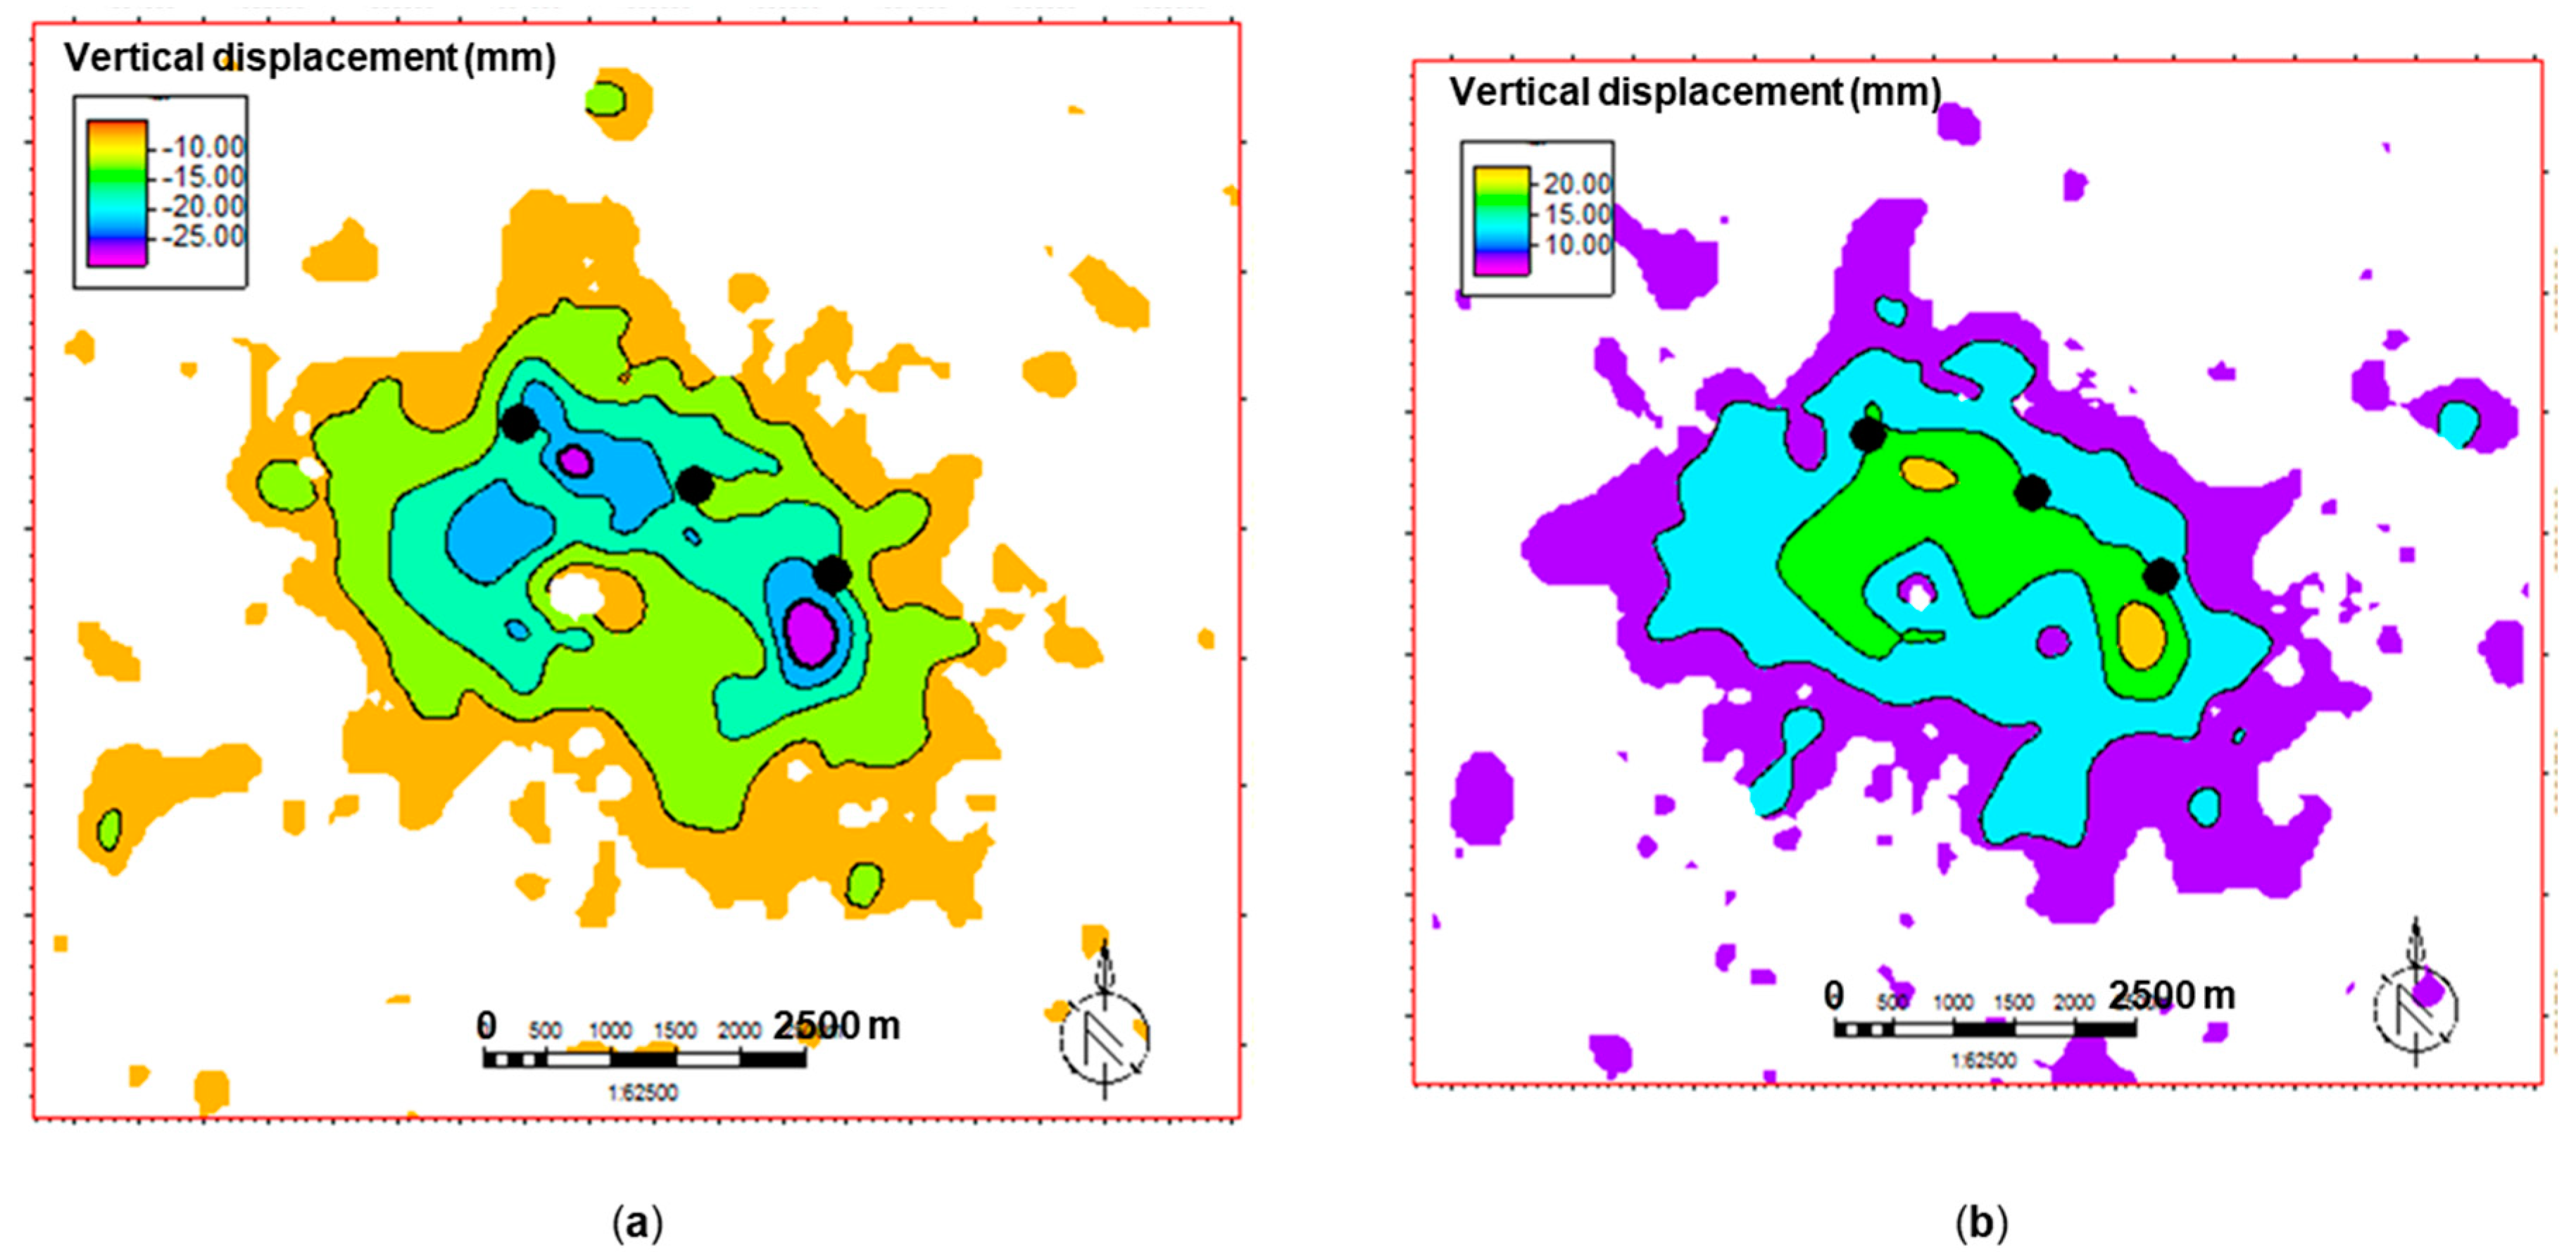
Generally speaking, the pressure variation induced by storage activities alters the effective original stress field predominantly in the reservoir and slightly in the cap rock. Consequently, the formations compact due to winter gas productions (usually from March to October) and expand due to summer gas injections (usually from March to October), according to their deformation parameters. The induced deformations propagate through the overburden sequence, which mainly underwent rigid movements, up to the surface originating the characteristic cyclical seasonal subsidence and rebound of the ground, almost constant throughout the years. The trend related to the ‘earth breathing’ phenomenon often facilitates identifying the effects (in terms of ground movements) of UGS operations from those related to natural processes and/or other anthropogenic activities. This is true for the system under analysis where the vertical ground movements overlying the reservoir (considering, for example, three representative monitored points) closely follow the pressure cyclical oscillations induced by storage operations (Figure 9a). Whereas if we consider the vertical displacement of other monitored points at 3–5 km outside the boundary of the gas-bearing formation (with respect to the original gas-water contact position), the trend is not present (Figure 9b); they are positioned outside the influence cone of the pressure variation induced by storage activities and their vertical movements can be ascribed, for example, to thermic and meteoric effects. As a consequence, the analysis of the InSAR (differential interferometric synthetic aperture radar) data allowed the identification not only of the vertical magnitude but also of the areal extension of the ground surface cyclically affected by the UGS activities (Figure 10).
The analysis of the horizontal rate of movements does not highlight any trend within the reservoir zone nor outside it; a mean value close to zero was estimated for the investigated period.
A series of preliminary sensitivity analyses confirmed that the ground movements due to storage activities were mainly affected by the stress-strain behavior of the gas-bearing formation and, secondly, by the stress-strain behavior of the cap rock. Consequently, during the calibration phase of the 3D numerical geomechanical model, the adopted pseudo-elastic parameters of the reservoir and the cap rock were tuned so that the simulated vertical ground movements matched the measured values, and in particular: Young modulus values were equal to 12 and 15 GPa in the cap rock and gas-bearing formations, respectively. The values are coherent with both the lithologies under analysis and also with the in situ condition during UGS operations; in fact, during the unloading/reloading conditions imposed by production/injection the formation deformation response is ruled by the EII modulus, larger than the EI modulus and approaching dynamic value, ED. Moreover, even if a certain simplification was introduced in the characterization of reservoir formation via a ‘mean’ deformation parameter, a more than satisfactory match between simulated and measured data was reached. As an example of the quality of the back analysis results, Figure 11 shows the comparison between simulated and measured vertical movements (in terms of relative variations within a single withdrawal/injection cycle) for each of the three internal monitored points during the monitored time frame.
6. Conclusions
The aim of the paper is to improve the understanding of the deformation response of deep formations via a real case study. A common issue that arises in the analysis of stress-strain evolution induced by pressure variation in underground formations is the potential high range variability of pseudo-elastic parameters determined a-priori via different methods. These mechanical properties are an essential requirement for the reliability of forecast system behavior. As common and good practice, the deformation parameters are obtained via laboratory analysis performed on cores, usually retrieved from the reservoir and the cap rock sequences (static pseudo-elastic parameters), together with information from well logs and seismic surveys (dynamic pseudo-elastic parameters). As well documented in the technical literature via experimental evidence, the difference between static and dynamic moduli can be significant, reaching even an order of magnitude or more in weak rocks. Needless to say, high variability of input parameters leads to low reliability of the results.
The case study presented in the paper refers to an underground gas storage operated in a depleted reservoir in Northern Italy. The a priori knowledge of pseudo-elastic parameters of the underground formations showed a discrepancy between static and dynamic values reaching even one order of magnitude in the clastic sequence (a silty to shaley sequence intercalated with arenaceous banks) overlaying the reservoir. This difference is reduced to a ratio of 2–4 in the more compact gas-bearing formation (basically sandstone intercalated with shale intervals and conglomerates).
Assimilation of information of different nature and characterized by different spatial and temporal distributions was adopted to reduce the uncertainty parameter by conditioning a forward model so as to describe in a realistic way rock deformation behavior. According to this approach, time and space evolution of reservoir fluid pressure and induced land surface movements measured during a 12-year period of seasonal production/injection cycles were combined in a mechanical 3D numerical FEM model to constrain and update the a priori knowledge on the model parameters via a back analysis approach. The cap rock and the reservoir pseudo-elastic parameter values (about 12–15 GPa) obtained at the end of the back analysis process are coherent with both the lithologies under study and also with the in situ condition during UGS operations (in the order of 10 GPa), which correspond to unloading/reloading conditions. Moreover, the values are in between the unloading/reloading EII modulus (about 6–10 GPa) and the dynamic modulus, ED (from 12 to 40 GPa according to the lithology).
The obtained calibrated model is an important tool for reliable prediction of system stress-strain behavior according to different storage scenarios, giving the key input for safety analyses in terms of UGS system integrity and potential impacts on existing construction projects and infrastructure.
Author Contributions
Investigation, V.R.; Methodology, C.C., V.R. and Q.S.; Writing-original draft, V.R. and Q.S.; Writing-review & editing, C.C.
Acknowledgments
The authors wish to thank Stogit Division, Snam S.p.A., for permission to publish the data presented in this paper.
Conflicts of Interest
The authors declare no conflicts of interest.
Note
Sensitive permissions requests may be sent to [email protected]. Requests do not imply permissions will be automatically granted, each request will be assessed separately.
References
- Stright, D.H.; Settari, A.; Walters, D.A.; Aziz, K. Characterization of the Pliocene gas reservoir aquifers for predicting subsidence on the Ravenna coast. Pet. Sci. Technol. 2008, 26, 1267–1281. [Google Scholar] [CrossRef]
- Gambolati, G.; Ricceri, G.; Bertoni, W.; Brighenti, G.; Vuillermin, E. Mathematical simulation of the subsidence of Ravenna. Water Resour. Res. 1991, 27, 2899–2918. [Google Scholar] [CrossRef]
- Settari, A.; Walters, D.A.; Stright, D.H.; Azi, K. Numerical techniques used for predicting subsidence due to gas extraction in the North Adriatic Sea. Pet. Sci. Technol. 2008, 26, 1205–1223. [Google Scholar] [CrossRef]
- Castelletto, N.; Ferronato, M.; Gambolati, G.; Janna, C.; Teatini, P.; Marzoati, D.; Cairo, E.; Colombo, D.; Feretti, A.; Bagliani, A.; et al. 3D geomechanics in UGS projects. A comprehensive study in Northern Italy. In Proceedings of the 44th US Rock Mechanics Symposium and 5th U.S.—Canada Rock Mechanics Symposium, Salt Lake City, UT, USA, 27–30 June 2010. [Google Scholar]
- Ferronato, M.; Castelletto, N.; Gambolati, G.; Janna, C.; Teatini, P. II cycle compressibility from satellite measurements. Geotechnique 2013, 63, 479–486. [Google Scholar] [CrossRef]
- Benetatos, C.; Rocca, V.; Sacchi, Q.; Verga, F. How to approach subsidence evaluation for marginal fields: A case history. Open Pet. Eng. J. 2015, 8, 214–234. [Google Scholar] [CrossRef]
- Giani, G.P.; Gotta, A.; Marzano, F.; Rocca, V. How to address subsidence evaluation for a fractured carbonate gas reservoir through a multi-disciplinary approach. Geotech. Geol. Eng. 2017, 35, 2977–2989. [Google Scholar] [CrossRef]
- Benetatos, C.; Codegone, G.; Deangeli, C.; Giani, G.; Gotta, A.; Marzano, F.; Rocca, V.; Verga, F. Guidelines for the Study of Subsidence Triggered by Hydrocarbon Production. Geoingegneria Ambientale e Mineraria 2017, 152, 85–96. [Google Scholar]
- Rodrigues, C.; Dinis, M.; de Sousa, M. Review of European energy policies regarding the recent “carbon capture, utilization and storage” technologies scenario and the role of coal seams. Environ. Earth Sci. 2015, 74, 2553–2561. [Google Scholar] [CrossRef]
- Rocca, V. Development of a fully coupled approach for evaluation of wellbore stability in hydrocarbon reservoirs. Am. J. Environ. Sci. 2009, 5, 781–790. [Google Scholar] [CrossRef]
- Baú, D.; Gambolati, G.; Teatini, P. Residual land subsidence near abandoned gas fields raises concern over Northern Adriatic coastland. EOS Trans. AGU 2000, 81, 245–249. [Google Scholar] [CrossRef]
- Baú, D.; Ferronato, M.; Gambolati, G.; Teatini, P. Basin-scale compressibility of the Northern Adriatic by the radioactive marker technique. Geotechnique 2002, 52, 605–616. [Google Scholar] [CrossRef]
- Rocca, V.; Viberti, D. Environmental sustainability of oil industry. Am. J. Environ. Sci. 2013, 9, 210–217. [Google Scholar] [CrossRef]
- Cardu, M.; Giraudi, A.; Rocca, V.; Verga, F. Experimental laboratory tests focused on rock characterisation for mechanical excavation. Int. J. Min. Reclam. Environ. 2012, 26, 199–216. [Google Scholar] [CrossRef]
- Codegone, G.; Rocca, V.; Verga, F.; Coti, C. Subsidence modeling validation through back analysis for an Italian gas storage field. Geotech. Geol. Eng. 2016, 34, 1749–1763. [Google Scholar] [CrossRef]
- Fjær, E.; Holt, R.M.; Horsrud, P.; Raaen, A.M.; Risnes, R. Petroleum Related Rock Mechanics, 2nd ed.; Elsevier: Amsterdam, The Netherlands, 2008; ISBN 978-0-444-50260-5. [Google Scholar]
- Mashinsky, E.I. Differences between static and dynamic elastic moduli of rocks: Physical causes. Russi. Geol. Geophys. 2003, 44, 953–959. [Google Scholar]
- Lancellotta, R. Geotecnica, 3rd ed.; Via Irnerio 34: Bologna, Italy, 2004; Available online: https://www.zanichelli.it/chi-siamo/via-irnerio-34 (accessed on 11 July 2018).
- Foti, S. Comportamento Dinamico dei terreni e Prove di Laboratorio; Università degli Studi di Messina: Politecnico di Torino, Italy, 2015. [Google Scholar]
- King, M.S. Static and dynamic elastic moduli of rocks under pressure. In Proceedings of the 11th US Symposium on Rock Mechanics, Berkeley, CA, USA, 16–19 June 1969. [Google Scholar]
- Plona, T.J.; Cook, J.M. Effects of Stress Cycles on Static and Dynamic Young’s Moduli in Castlegate Sandstone; Daemen, J.J.K., Schultz, R.A., Eds.; Balkema: Rotterdam, The Netherlands, 1995; ISBN 90 5410 5526. [Google Scholar]
- Pieri, M.; Groppi, G. Subsurface geological structure of the Po Plain, Italy. Verlag Nicht Ermittelbar 1981. [Google Scholar] [CrossRef]
- Castellarin, A. Alps-Apennines and Po Plain-frontal Apennines relationships. In Anatomy of an Orogeny. The Apennines and Adjacent Mediterranean Basin; Vai, G.B., Martini, I.P., Eds.; Kluvert Academy Publisher: London, UK, 2001; pp. 177–196. [Google Scholar]
- Fantoni, R.; Massari, F.; Minervini, M.; Rogledi, S.; Rossi, M. Il Messiniano del margine sudalpino-padano: Relazioni tra contesto strutturale e stratigrafico-deposizionale. Geol. Insubrica 2001, 6, 95–108. [Google Scholar]
- Casero, P. Structural setting of petroleum exploration plays in Italy. Available online: http://www.pierocasero.it/dowload/V-Structural%20Setting.pdf (accessed on 11 July 2018).
- Ferronato, M.; Gambolati, G.; Teatini, P. Unloading-reloading uniaxial compressibility of deep reservoirs by marker measurements. In Proceedings of the 11th International FIG Symposium on Deformation Measurements, Santorini Island, Greece, 25–28 May 2003; pp. 341–346. [Google Scholar]
- Teatini, P.; Castelletto, N.; Ferronato, M.; Gambolati, G.; Janna, C.; Cairo, E.; Marzorati, D.; Colombo, D.; Ferretti, A.; Bagliani, A.; et al. Geomechanical response to seasonal gas storage in depleted reservoirs: A case study in the Po River basin, Italy. J. Geophy. Res. 2011, 116, 1–21. [Google Scholar] [CrossRef]
- Zoccarato, C.; Ferronato, M.; Teatini, P. Formation compaction vs land subsidence to constrain rock compressibility of hydrocarbon reservoirs. Geomech. Energy Environ. 2018, 13, 14–24. [Google Scholar] [CrossRef]
- Berardino, P.; Costantini, M.; Franceschetti, G.; Iodice, A.; Pietranera, L.; Rizzo, V. Use of differential SAR interferometry in monitoring and modelling large slope instability at Maratea (Basilicata, Italy). Eng. Geol. 2003, 68, 31–51. [Google Scholar] [CrossRef]
- Ferretti, A.; Prati, C.; Rocca, F. Permanent scatterers in SAR interferometry. IEEE Trans. Geosci. Remote Sens. 2001, 39, 8–20. [Google Scholar] [CrossRef] [Green Version]
Figure 1.
(a) Qualitative relation between shear stress, τ, and shear strain, γ and (b) normalized shear modulus Gsec/G0 (where G0 is at small strain) and shear strain, γ.
Figure 1.
(a) Qualitative relation between shear stress, τ, and shear strain, γ and (b) normalized shear modulus Gsec/G0 (where G0 is at small strain) and shear strain, γ.

Figure 2.
(a) Simplified structural map of the Po Valley around the modelled area. (b) SO-NE section through the alpine thrust structures. (c) SSE-NNO section intersecting the Apennine (SSE) and Alpine (NNO) thrust belts (after Reference [25]).
Figure 2.
(a) Simplified structural map of the Po Valley around the modelled area. (b) SO-NE section through the alpine thrust structures. (c) SSE-NNO section intersecting the Apennine (SSE) and Alpine (NNO) thrust belts (after Reference [25]).

Figure 3.
Regional model (scale: 100–1000 s m) of studied area integrating reservoir model (scale: 1–10 s m). Reservoir is located in central zone (see well location).
Figure 3.
Regional model (scale: 100–1000 s m) of studied area integrating reservoir model (scale: 1–10 s m). Reservoir is located in central zone (see well location).

Figure 4.
(a) Shale specimen and (b) stone specimen.

Figure 5.
(a) CIU on shale specimen and (b) CID on sandstone specimen.

Figure 6.
Lab test results: static elastic moduli values in relation to confined pressure.

Figure 7.
Well log analysis results: variation of the dynamic elastic modulus in relation to depth.

Figure 8.
Cross-plot: dynamic elastic modulus and compressional wave velocity—DTCO.

Figure 9.
Comparison between reservoir average static pressure and measured vertical displacement (a) at control points overlying the reservoir and (b) at control points outside the UGS influence area.
Figure 9.
Comparison between reservoir average static pressure and measured vertical displacement (a) at control points overlying the reservoir and (b) at control points outside the UGS influence area.

Figure 10.
Areal extension of the ground surface cyclically affected by UGS activities from InSAR data analysis: (a) vertical displacement within a production cycle and (b) an injection cycle.
Figure 10.
Areal extension of the ground surface cyclically affected by UGS activities from InSAR data analysis: (a) vertical displacement within a production cycle and (b) an injection cycle.

Figure 11.
Comparison between simulated and measured vertical movements for three control points overlying the reservoir.
Figure 11.
Comparison between simulated and measured vertical movements for three control points overlying the reservoir.

© 2018 by the authors. Licensee MDPI, Basel, Switzerland. This article is an open access article distributed under the terms and conditions of the Creative Commons Attribution (CC BY) license (http://creativecommons.org/licenses/by/4.0/).
Share and Cite
MDPI and ACS Style
Coti, C.; Rocca, V.; Sacchi, Q. Pseudo-Elastic Response of Gas Bearing Clastic Formations: An Italian Case Study. Energies 2018, 11, 2488. https://doi.org/10.3390/en11092488
AMA Style
Coti C, Rocca V, Sacchi Q. Pseudo-Elastic Response of Gas Bearing Clastic Formations: An Italian Case Study. Energies. 2018; 11(9):2488. https://doi.org/10.3390/en11092488
Chicago/Turabian StyleCoti, Christian, Vera Rocca, and Quinto Sacchi. 2018. "Pseudo-Elastic Response of Gas Bearing Clastic Formations: An Italian Case Study" Energies 11, no. 9: 2488. https://doi.org/10.3390/en11092488
Note that from the first issue of 2016, this journal uses article numbers instead of page numbers. See further details here.