Article

Performance Evaluation of CO2 Huff-n-Puff Gas Injection in Shale Gas Condensate Reservoirs

1
Petroleum Engineering, China University of Petroleum (East China), Qingdao 266000, China
2
Petroleum Systems Engineering, Faculty of Engineering and Applied Science, University of Regina, Regina, SK S4S 042, Canada
3
PetroChina Huabei Oilfield Company, Renqiu 062552, China
*
Author to whom correspondence should be addressed.
Energies 2019, 12(1), 42; https://doi.org/10.3390/en12010042
Submission received: 6 November 2018 / Revised: 10 December 2018 / Accepted: 18 December 2018 / Published: 24 December 2018
(This article belongs to the Special Issue Development of Unconventional Reservoirs)

Abstract

:
When the reservoir pressure is decreased lower than the dew point pressure in shale gas condensate reservoirs, condensate would be formed in the formation. Condensate accumulation severely reduces the commercial production of shale gas condensate reservoirs. Seeking ways to mitigate condensate in the formation and enhance both condensate and gas recovery in shale reservoirs has important significance. Very few related studies have been done. In this paper, both experimental and numerical studies were conducted to evaluate the performance of CO2 huff-n-puff to enhance the condensate recovery in shale reservoirs. Experimentally, CO2 huff-n-puff tests on shale core were conducted. A theoretical field scale simulation model was constructed. The effects of injection pressure, injection time, and soaking time on the efficiency of CO2 huff-n-puff were examined. Experimental results indicate that condensate recovery was enhanced to 30.36% after 5 cycles of CO2 huff-n-puff. In addition, simulation results indicate that the injection period and injection pressure should be optimized to ensure that the pressure of the main condensate region remains higher than the dew point pressure. The soaking process should be determined based on the injection pressure. This work may shed light on a better understanding of the CO2 huff-n-puff- enhanced oil recovery (EOR) strategy in shale gas condensate reservoirs.

1. Introduction

Unconventional resources, especially shale reservoirs, have been widely developed with the techniques of hydraulic fracturing and drilling horizontal wells, and shale gas condensate reservoirs play an important role in regards to unconventional resources. When the reservoir pressure is decreased lower than the dew point pressure in shale gas condensate reservoirs, condensate can be formed near the wellbore or near/in the fracture as shown in Figure 1. This condensate blockage can reduce gas permeability. In addition, the productivity is reduced. Studies indicate that condensate blockage is much more severe when the permeability is low [1,2]. Also, as the condensate is formed by the heavy components of the reservoir fluid, it has a very high economic value. Therefore, it is important to find effective techniques to mitigate condensate blockage. Also, by mitigating condensate blockage in formation, gas permeability can be increased and the productivity can be greatly improved.
Several techniques are used to mitigate the condensate blockage for condensate reservoirs. Drilling horizontal wells and hydraulic fracturing have been widely used. Though the press drop in a horizontal well may be higher, it is distributed over a larger area, and the smaller pressure drop could help to reduce the accumulation of the condensate blockage [3,4,5]. Hydraulic fracturing can also help to reduce the pressure drop and reduce the formation of condensate blockage around the wellbore [6,7,8,9,10]. Drilling horizontal wells and hydraulic fracturing are two main techniques to enhance commercial production from shale reservoirs with ultra-low permeability. Hence, these two techniques are discussed in the follow discussion in this paper.
Chemical treatment techniques such as solvent injection and wettability-alteration treatment are also applied to mitigate condensate. By injecting solvent, the interfacial tension between condensate and gas can be reduced, and the solvent could help to dissolve part of the condensate into gas stream. Consequently, the condensate could be mitigated and the productivity of condensate reservoirs could be increased [11,12,13]. The injection of wettability chemicals can help to change the wettability from liquid wetting to gas wetting and the productivity of condensate reservoirs can be increased [14,15,16,17]. However, because of the low permeability of shale reservoirs, chemical treatment is not a suitable technique, as the efficiency of the injection process can be very low.
Gas injection is widely applied to mitigate the condensate recovery. By applying gas injection, pressure could be maintained at a higher rate than the dew point pressure. The accumulation of the condensate can also be prevented. Furthermore, gas injection can revaporize the condensate into a gas state. The accumulated condensate can be produced during the puff process [18,19]. The efficiency of different gas injection modes has been investigated [20,21,22,23,24,25,26,27,28,29]. The huff-n-puff process consists of three stages: huff (injection), soaking, and puff (production). The well is operated as both an injection well and a production well. As Figure 2 shows, there is only one well used as both an injection well and a production well in a huff-n-puff well. For wells of this type, the condensate region is located near the injection well. As the function of the well is changed by gas injection, the pressure of near wellbore region can be increased quickly. Consequently, the condensate is revaporized and recovered.
The EOR techniques mentioned above are widely investigated in conventional gas condensate reservoirs. However, based on the studies on shale reservoirs [30,31,32,33,34,35], because of the ultra-low permeability of shale formations, the techniques such as water flooding and chemical flooding are difficult to be applied in shale formations. So far very few studies on EOR in shale gas condensate reservoirs have been conducted. Recently, solvent injection has been investigated to mitigate condensate blockage in shale gas condensate reservoir. Solvent injection could reduce the overall dew point pressure to delay the formation of condensate [36]. However, the efficiency and cost of solvent injection is questionable. Until now, CO2 huff-n-puff has gained more and more attention in the literature [37,38,39,40,41]. However, the enhanced condensate performance of CO2 huff-n-puff in shale reservoirs have not been investigated, especially in experimental aspects. The novelty of this study is to evaluate EOR performance of CO2 huff-n-puff in shale gas condensate reservoirs using experiments and numerical analysis. Experimental work on shale rocks is different because of the ultra-low permeability. It is very difficult to conduct the core-flooding experiments to measure pressure drop or visually observe condensate flow as in sand rocks. In our study, the condensate saturation in shale rock was determined by CT and then the efficiency of huff-n-puff method could be quantified.
In this paper, first, experiments were conducted on shale core. The performance of CO2 huff-n-puff to enhance condensate recovery in shale gas condensate reservoir was evaluated in core scale study. Then, field scale simulation was performed to investigate the performance of CO2 huff-n-puff in shale gas condensate reservoir. Finally, the enhanced condensate recovery performance of CO2 huff-n-puff has been evaluated by analyzing the experimental and simulation results. In addition, the optimization principles of CO2 huff-n-puff are discussed.

2. Materials and Methods

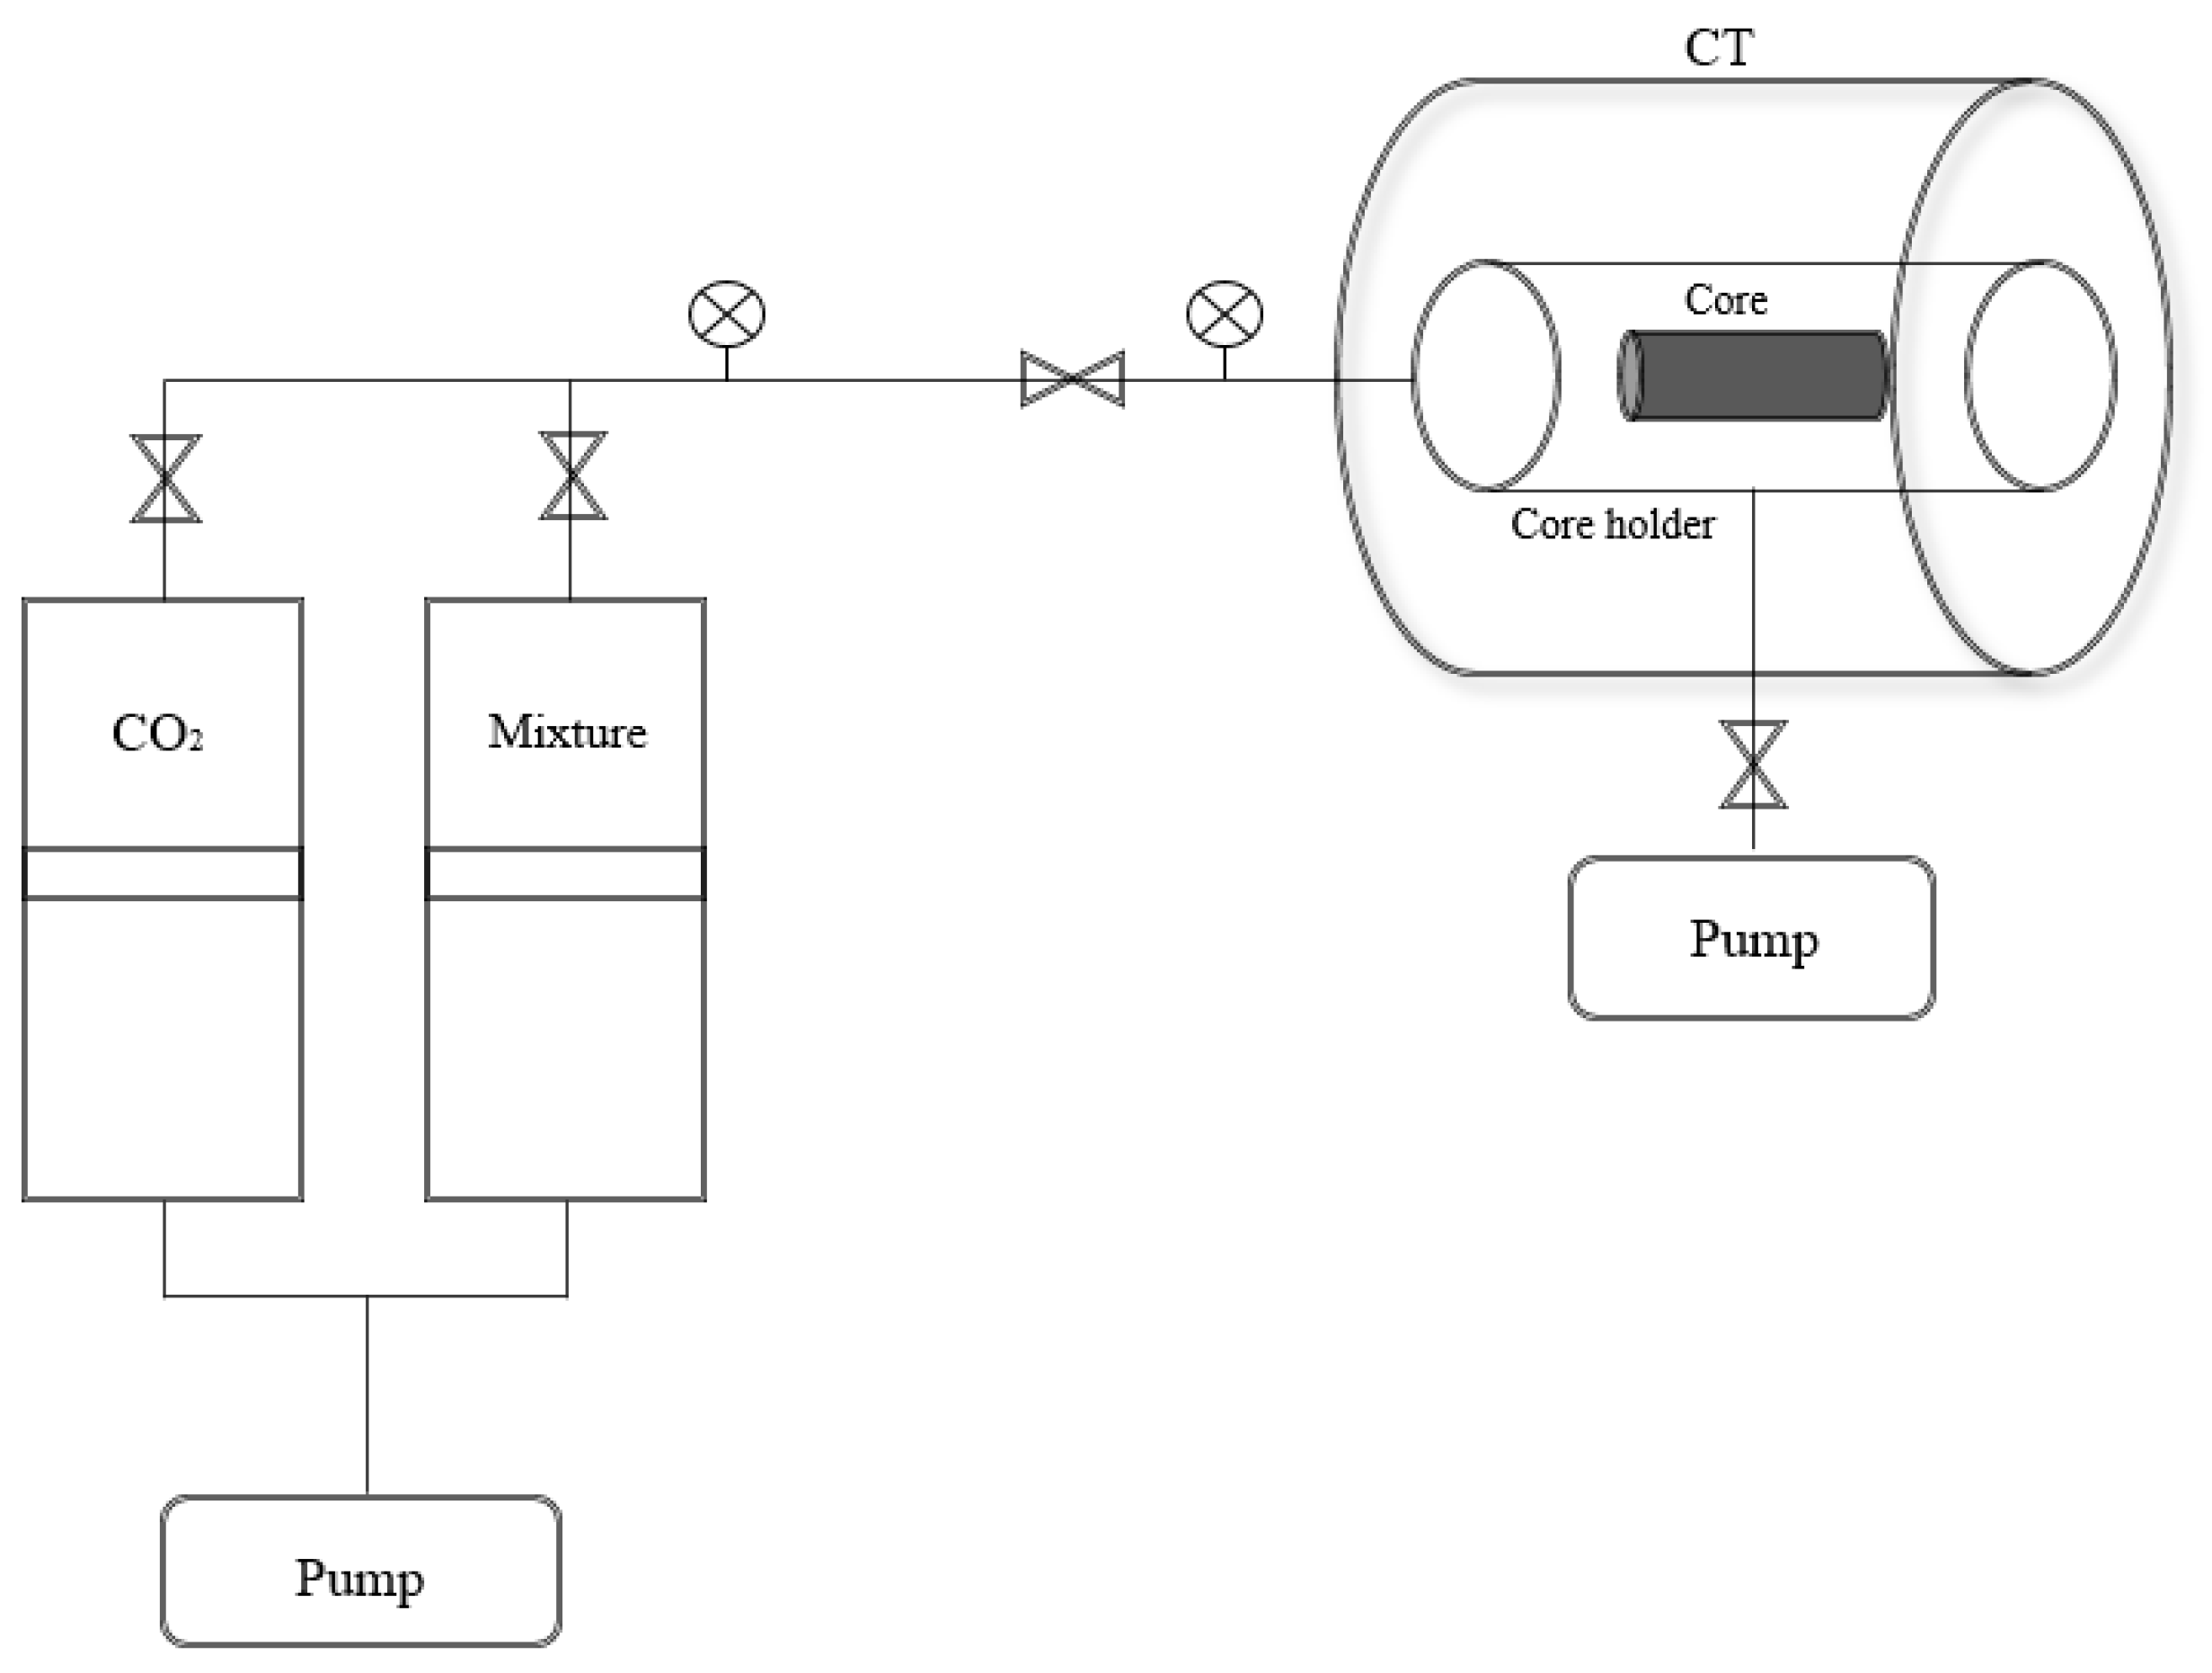
2.1. Experimental Setup

2.1.1. Experiment Materials

Experiment of CO2 huff-n-puff was operated on a shale core with 3.8 cm (1.5 in) in diameter and 10.2 cm (4 in) in length. The core was dried first and then the porosity and permeability was measured. Table 1 shows the properties of the core.
The initial gas mixture used in the experiment was formed of methane and n-butane with a pressure of 2200 psi and a temperature 20 °C (68 °F). Figure 3 shows the phase diagram of the mixture. At 68 °F, this gas mixture has the property of a gas condensate fluid. The liquid drop curve of this gas condensate mixture at 68 °F is shown in Figure 4. As can be seen the methane-butane gas mixture has a wide condensate region, with a dew point of 1860 psi at 20 °C (68 °F).

2.1.2. Experiment Procedure

A schematic of the experiment is shown in Figure 5. Based on the properties of the gas mixture, the gas mixture has a wide condensate region at room temperature. Thus, the experiment was conducted at 20 °C (68 °F). The core holder was placed in the CT scanner during the whole experiment to evaluate the core saturating process and measure the condensate saturation. The general procedure for CO2 huff-n-puff gas injection experiment is described as follows:
(1)
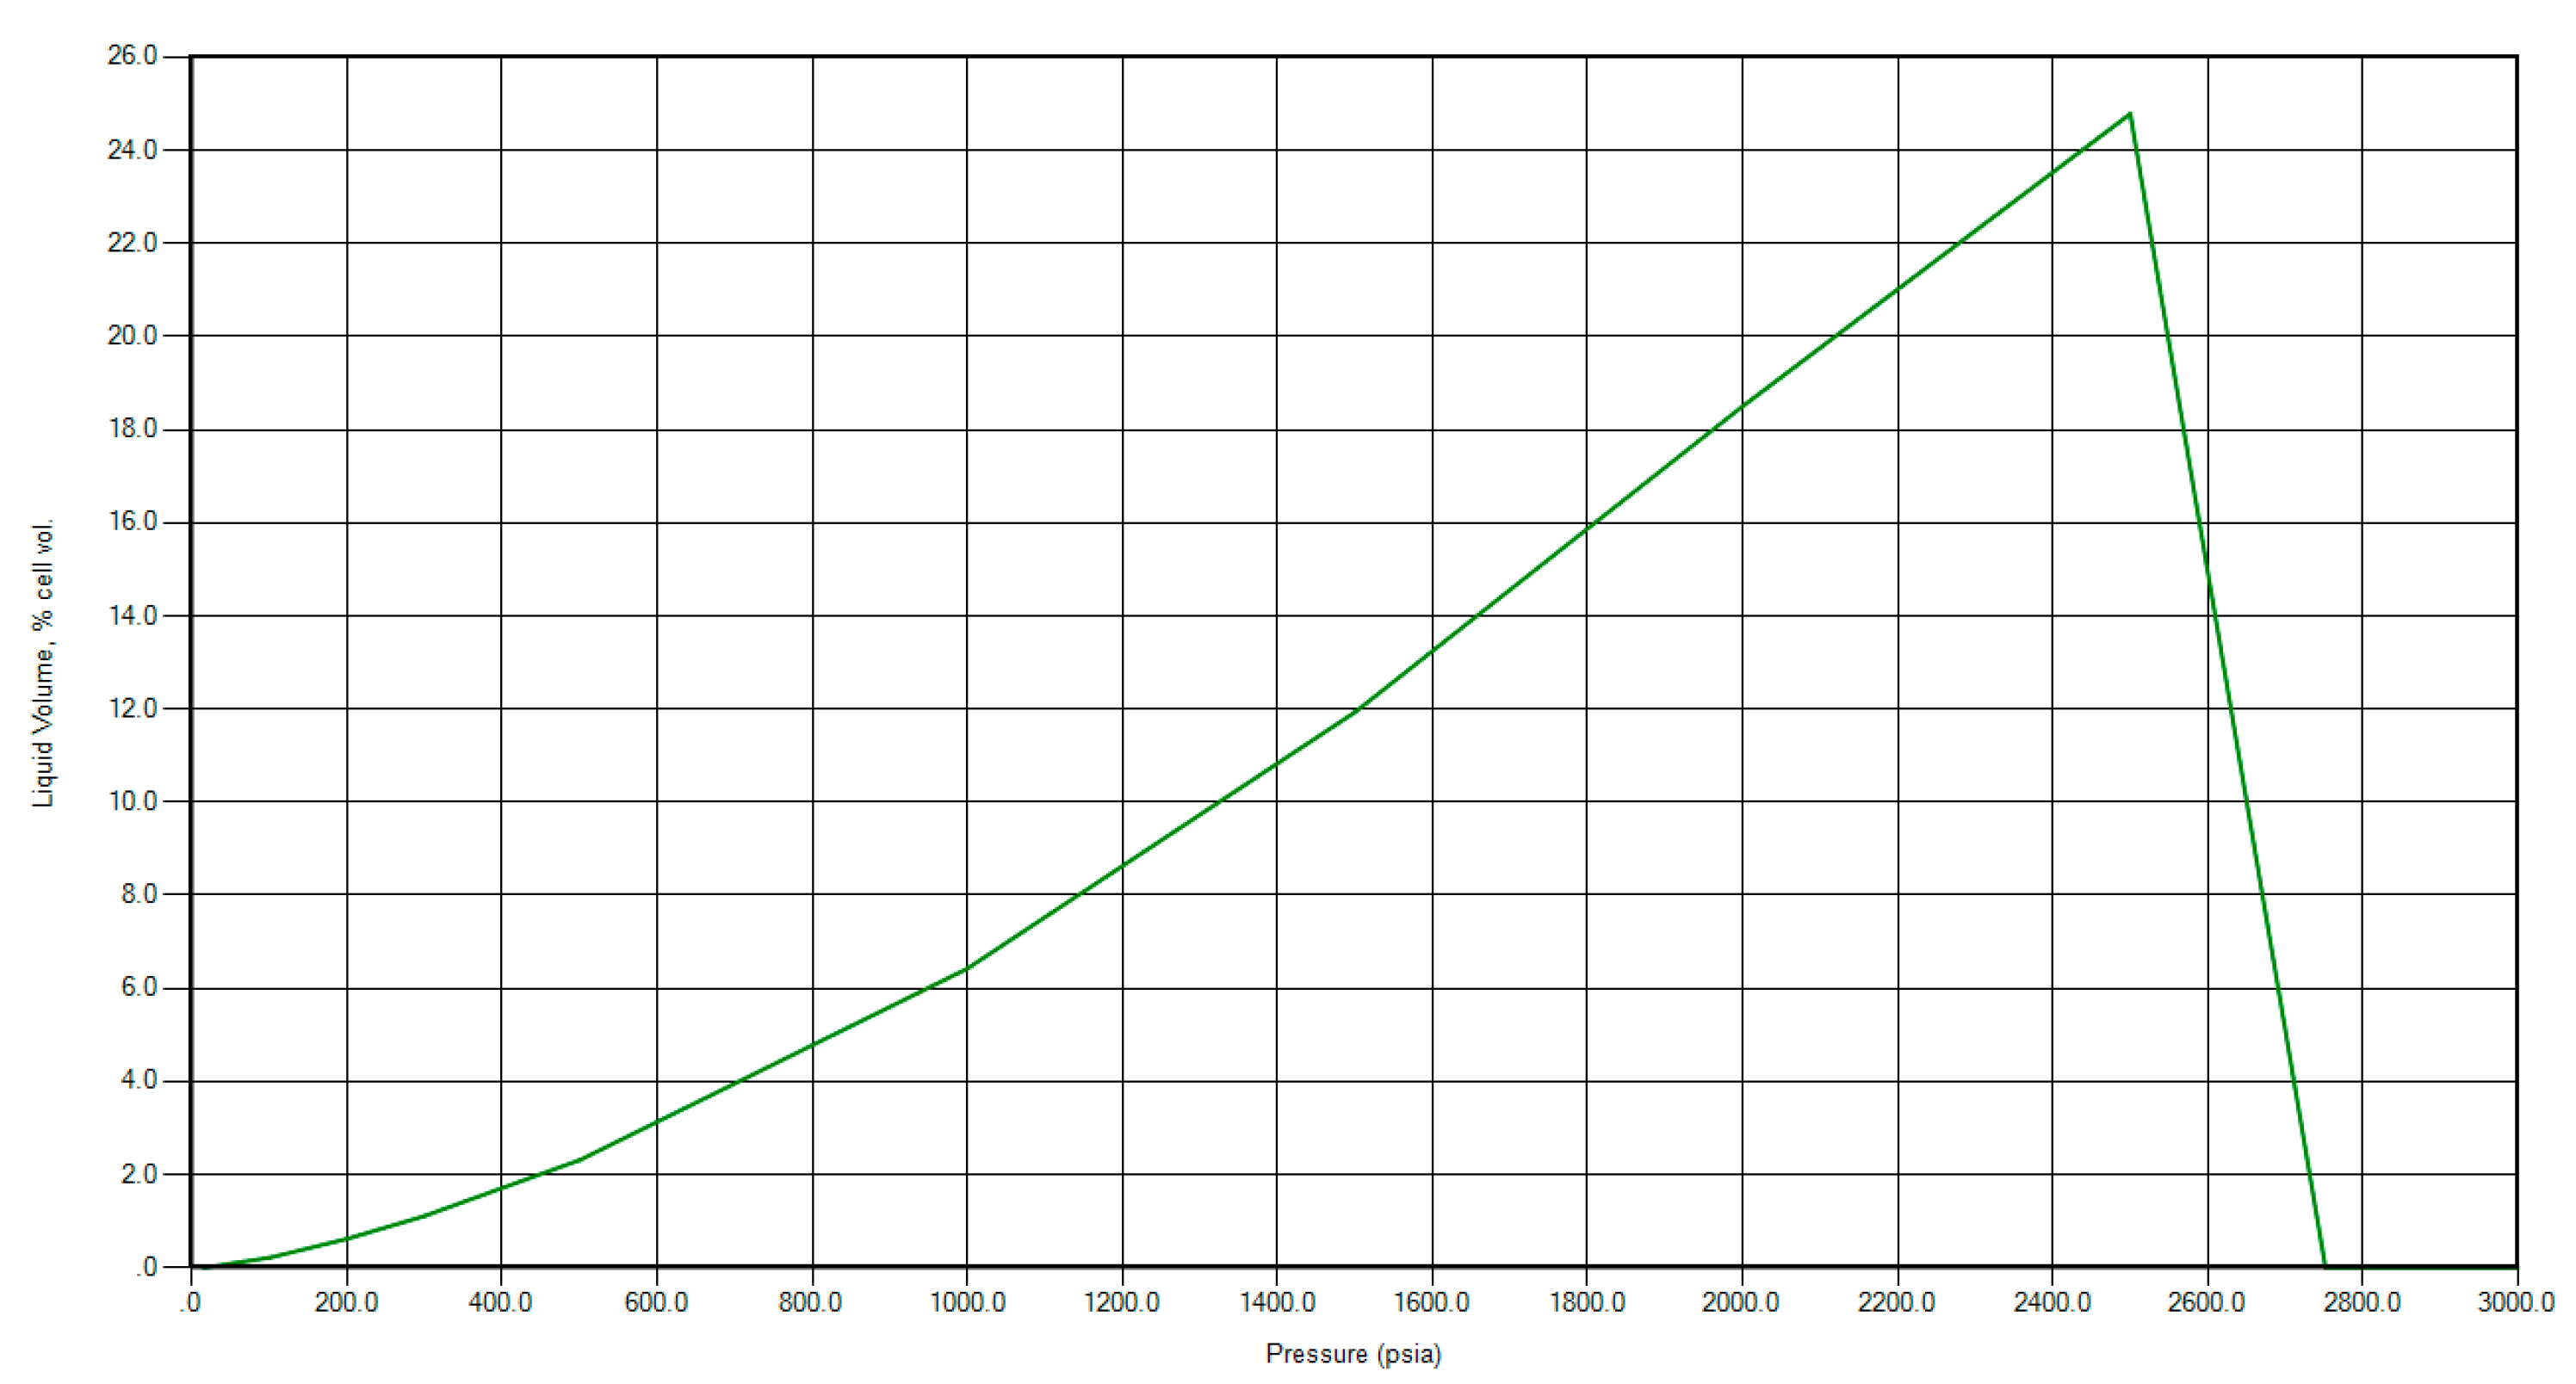
During the experiment, the injection pressure should be higher than 1860 psi (dew point pressure). And the confining pressure should be higher than the injection pressure. The initial gas condensate mixture was injected into the core holder at 2200 psi with a confining pressure of 2500 psi. The CT number was measured during the whole saturating process. When the CT number stopped changing, the core was assumed to be fully saturated with the gas condensate mixture.
(2)
After the saturation process, the valve on the left side of core holder was opened and the pressure was decreased to 1460 psi. This step was used to simulate the primary depletion process, with the CT scanner measuring the condensate saturation in the core. Condensate saturation was calculated by using the following equation [42]:
S c = C T e x p C T g r C T c r C T g r
CTexp represents the CT number during the experiment. CTgr represents the CT number when the core is full of C1. CTcr is the CT number when the core is full of nC4.
(3)
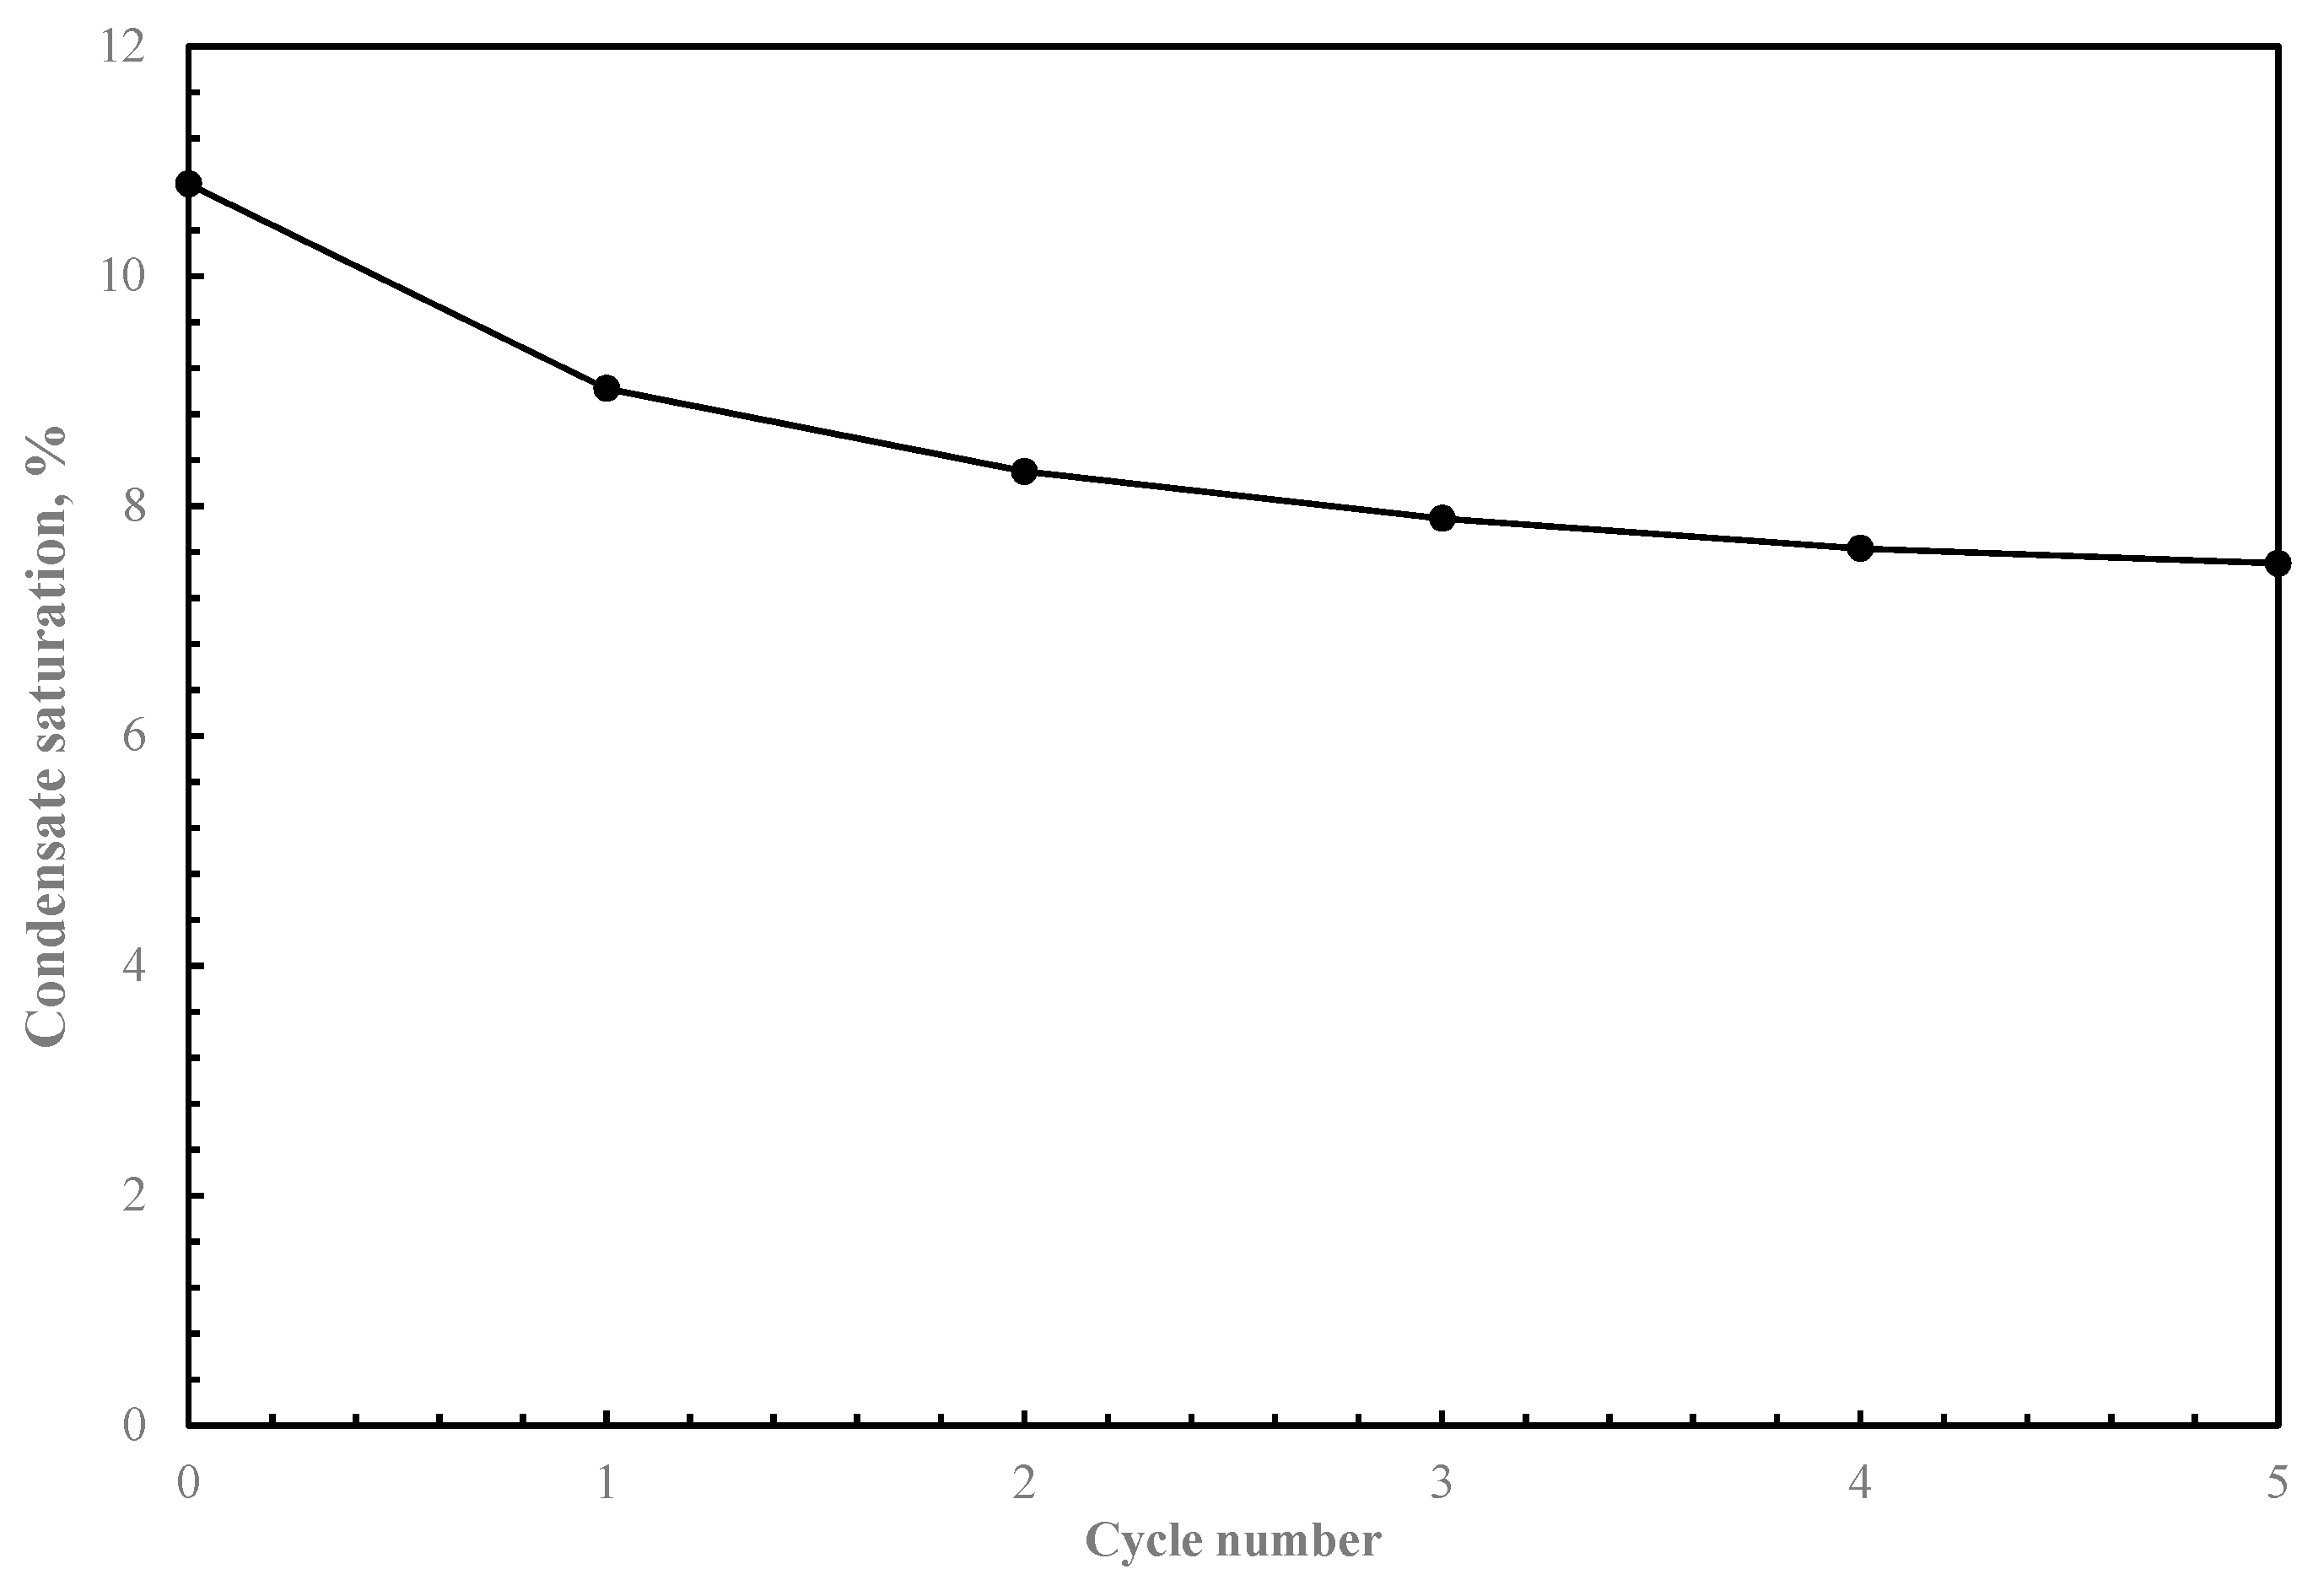
Afterwards, the CO2 huff-n-puff process was applied on the core. Injection pressure was set to 2200 psi and injection time was set to 2 hours. After injection, a soaking time of 1 hour was applied. After the soaking process, depletion process was applied again. The pressure was decreased to 1460 psi. This process represents one cycle of CO2 huff-n-puff and 5 cycles were operated in total. The condensate saturation in the core was measured after every cycle.
(4)
By analyzing the change in condensate saturation after the CO2 huff-n-puff, the enhanced condensate recovery could be obtained and evaluated in laboratory.

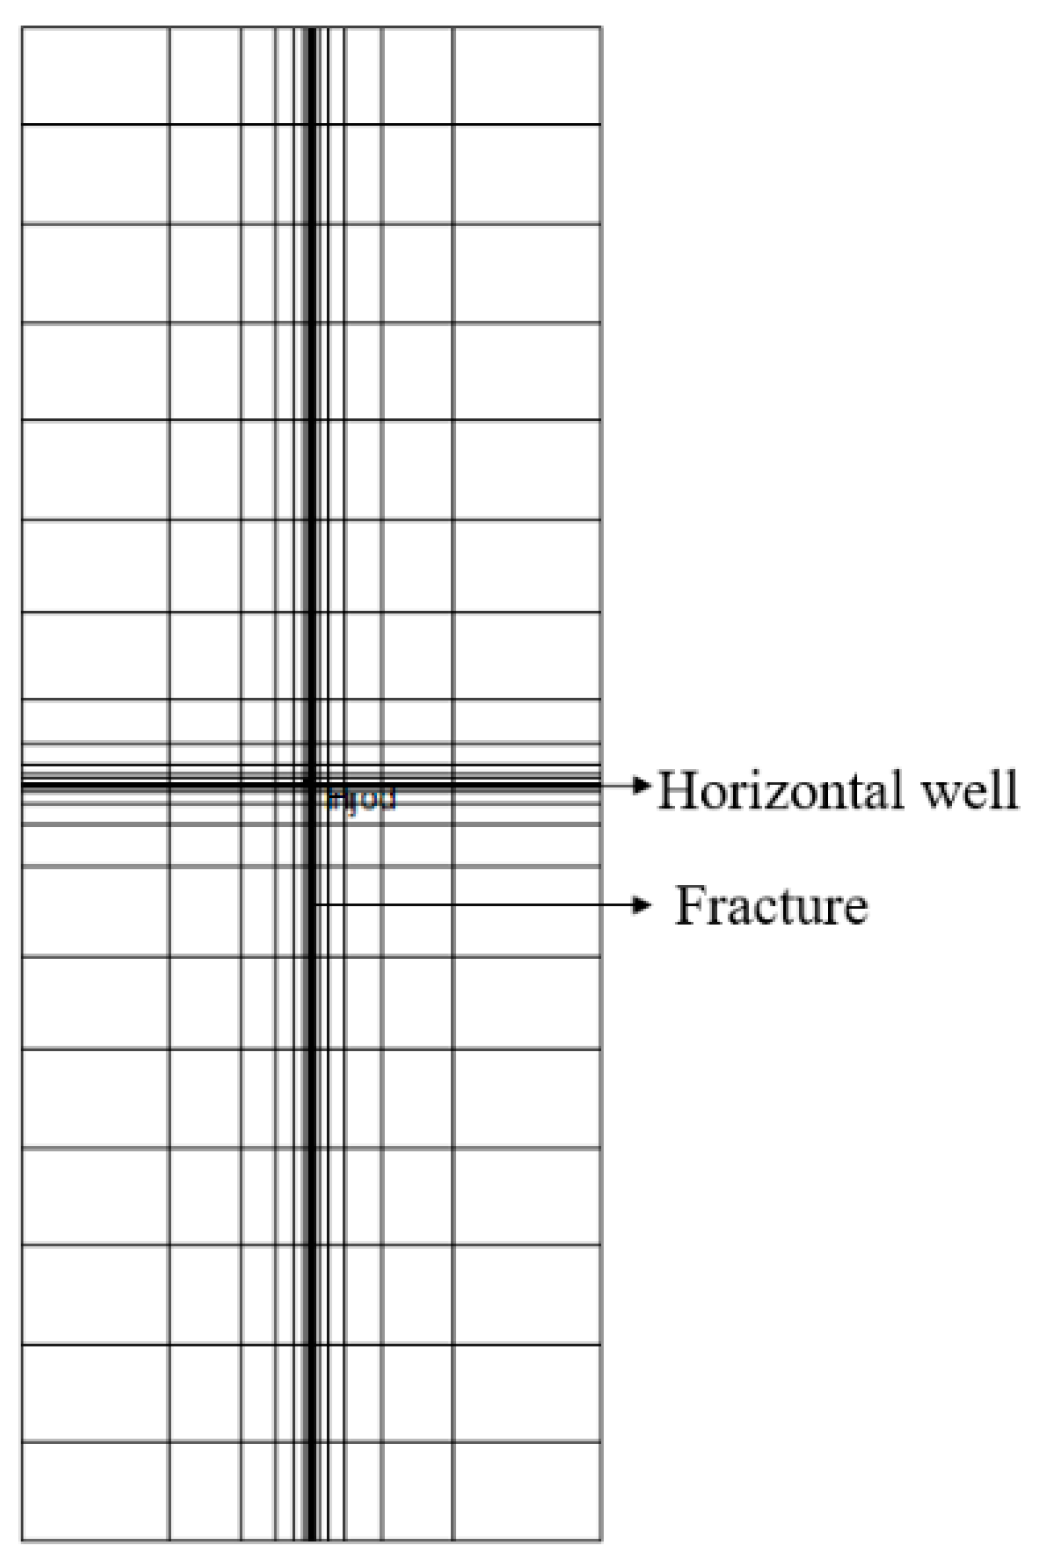
2.2. Simulation Model Description

A field scale simulation model was built to investigate the enhanced condensate recovery performance of CO2 huff-n-puff. The simulation work was conducted by using CMG-2015 (Computer Management Group Ltd, Calgary, Canada). Figure 6 shows this simulation model. The reservoir rock properties and gas condensate fluid properties were obtained from published data, as shown in Table 2 [43]. The dimension of the model was 180.44 m (592 ft) × 470.61 m (1544 ft) × 15.24 m (50 ft). In this model, only one fracture was set. Based on the studies [44,45,46,47], fracture propagation plays an important role for the development of shale plays. However, the main purpose of this simulation study was to evaluate the enhanced condensate recovery performance of CO2 huff-n-puff in shale gas condensate reservoirs. In order to make the simulation work more effective, we just set one simple fracture and the fracture propagation was not taken into account. The fracture half-length was 110.34 m (362 ft) and the fracture width was 0.15 m (0.5 ft).
The reservoir condensate composition data is presented in Table 3, with the data obtained from published data [48]. The dew point pressure of the reservoir fluid is 2750 psi as shown in Figure 7, and when the pressure is decreased below the dew point pressure, condensate is formed. As the pressure continues to be decreased to 2460 psi, the liquid volume increases to a maximum value. Following this, the condensate is revaporized as the pressure continues to decrease. Based on the study of the effect of nano-pores on fluid flow, the fluid properties, especially gas condensate fluid properties in nano-pores could be different [49,50,51,52]. Whether the condensate saturation could be less or more with the confinement effect is not exactly known. However, it is certain that condensate blockage does exist in shale gas condensate reservoirs. As the objective of this study is to evaluate the enhanced condensate recovery performance of CO2 huff-n-puff, confinement in our model would not have an impact on our study objective. Confinement is not taken into account.
As Figure 6 shows, only one well was set in the reservoir. The well was used as both an injection well and a production well. During primary depletion, the well was used as a production well. Afterwards, the well was used to inject CO2. When the injection process was finished, the well was closed to allow for a period of soaking. Following this, the well was opened again as a production well. In our model, the maximum injection pressure was set to 4000 psi when the well was used as an injection well; the minimum bottom-hole pressure was set to 1500 psi when the well was used as a production well.

3. Results and Discussion

3.1 Experimental Results

As was mentioned in the previous experiment procedure, five cycles of CO2 huff-n-puff process were performed on the shale core. After primary depletion, the pressure was decreased to 1460 psi. The accumulated condensate saturation was 10.8% after primary depletion. The condensate saturation was decreased to 7.5% after 5 cycles.
Condensate recovery was obtained by analyzing the condensate saturation decrease as shown in Figure 8 and Figure 9. The condensate recovery was enhanced to 30.36% after 5 cycles of CO2 huff-n-puff. The experiment results indicate CO2 huff-n-puff can effectively enhance the condensate recovery from the shale core. In addition, the first cycle of CO2 huff-n-puff had the highest condensate recovery, at 16.25%. Condensate recovery was reduced significantly after the first cycle, with the 5th cycle only having a 1.2% recovery increment as shown in Figure 10.
Therefore, it is important to set proper cycle numbers during the application of CO2 huff-n-puff process. Efficiency of CO2 huff-n-puff can be very low when the number of cycles reaches a critical value.

3.2. Simulation Results

3.2.1. Base Case

A base CO2 huff-n-puff case study was conducted with two scenarios and a total exploration time of 8255 days. In the first scenario, the primary depletion period was 8255 days, and the production pressure was 1500 psi. In the second one, the primary depletion time period was 5475 days, after which, CO2 huff-n-puff was performed. The injection pressure was set to 4000 psi. The production pressure was set to 1500 psi. Four cycles of CO2 huff-n-puff were performed. The comparison of cumulative condensate recovery is shown in Figure 11. After 8255 days of primary depletion, the condensate recovery was 17.7%. However, after the CO2 huff-n-puff was applied, the condensate recovery was increased to 24.7%. The condensate recovery was effectively enhanced after the operation of CO2 huff-n-puff.

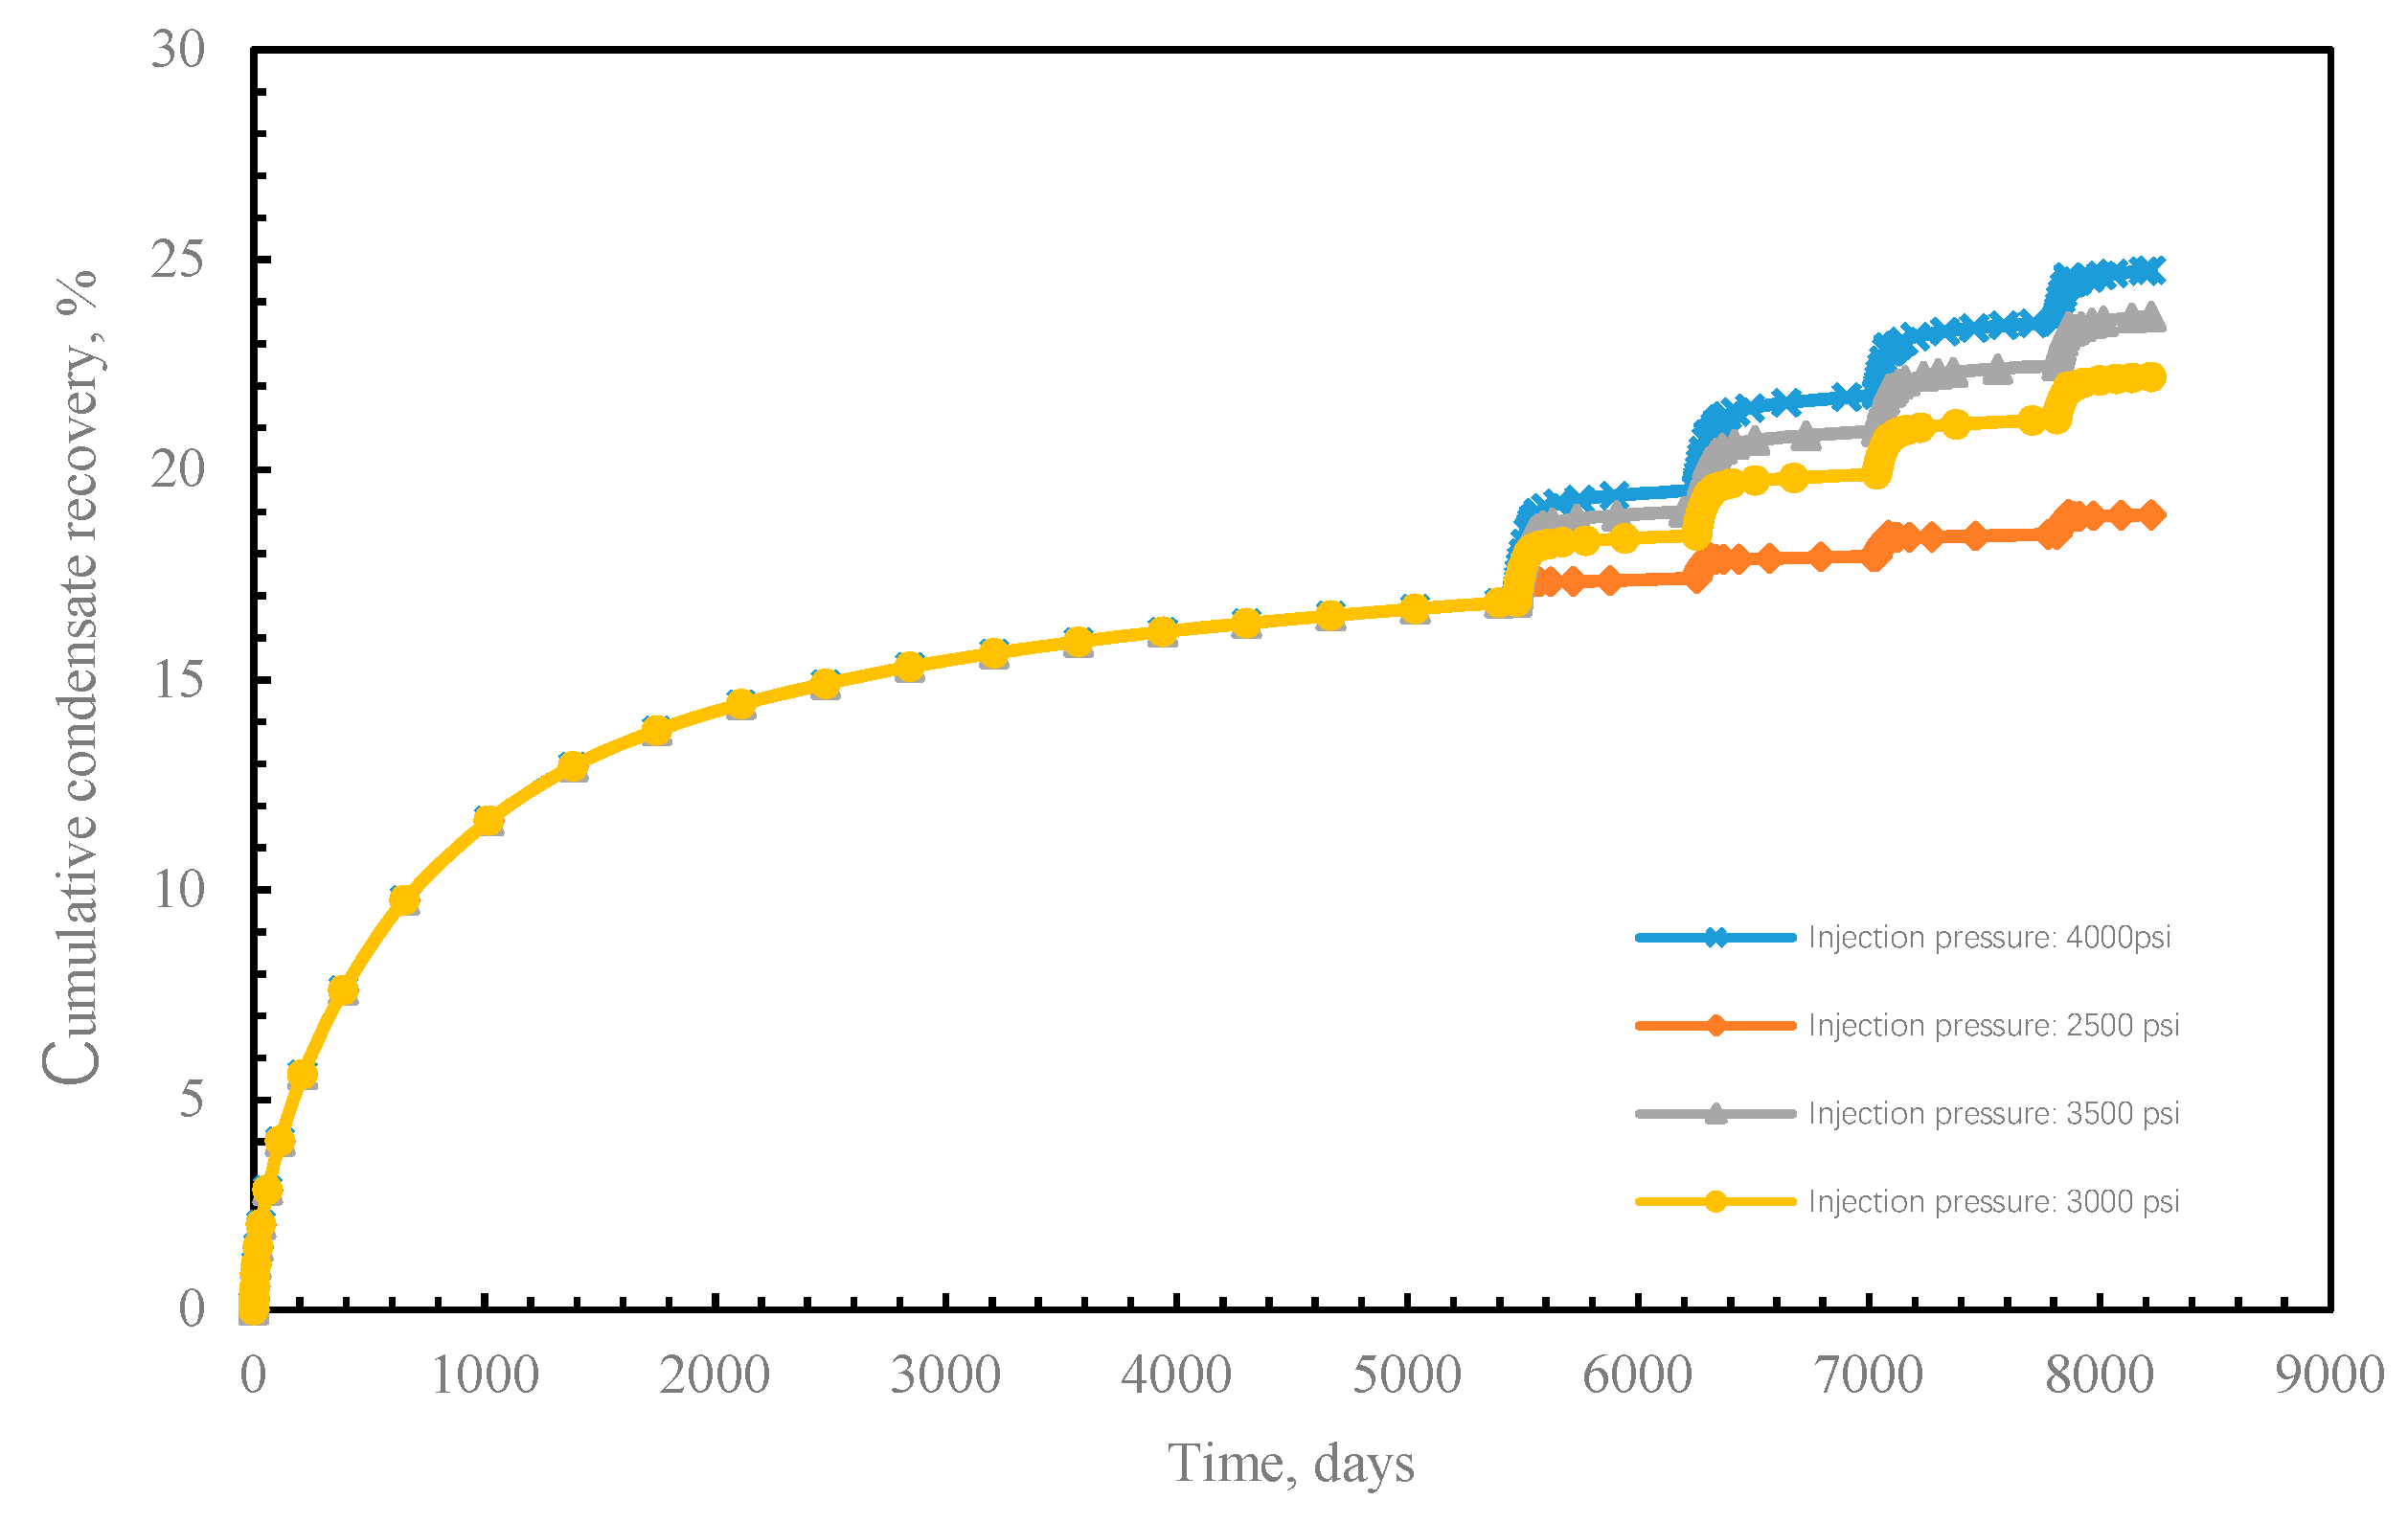
3.2.2. Effect of Injection Pressure and Injection Period

Four different cases were conducted in this section, and the effect of injection pressure on the enhanced condensate recovery performance of CO2 huff-n-puff gas injection is shown in Figure 12. Higher condensate recovery was obtained when the injection pressure was higher, with cumulative condensate recovery factors of 19%, 22%, 24%, and 24.7% corresponding to the injection pressures of 2500 psi, 3000 psi, 3500 psi, and 4000 psi, respectively. The cumulative condensate recovery was increased by 3% when the injection pressure was increased from 2500 psi to 3000 psi. However, the cumulative condensate recovery was only increased by 0.7% when the injection pressure was from 3500 psi to 4000 psi.
As Figure 13 shows, the main condensate region was near the fracture region. After injecting the CO2, the pressure of condensate region was increased with part of the condensate being revaporized. Thus the condensate could be produced during the puff process. Figure 14 shows pressure distribution of four cases after the huff process of the first cycle. When CO2 was injected into the formation at 2500 psi, only the minor condensate could be revaporized. Thus, the efficiency of the CO2 huff-n-puff was low. For case 3 (injection pressure: 3500 psi) and case 4 (injection pressure 4000 psi), it was found that condensate recovery was highly enhanced in both cases, and the condensate recovery of these two cases were similar. As shown in Figure 14, the pressure of the condensate region was increased. Most of the condensate near the fracture could be revaporized and recovered.
Three cases with different injection time were conducted to investigate the effect of injection time on the performance of CO2 huff-n-puff as shown in Figure 15. The production was same in three cases. Figure 15 indicates the cumulative condensate recovery for the three cases, being 18.6%, 22.7%, and 24.8%. During the puff process, more condensate could be recovered as the injection period was longer. However, it can be found that during the same reservoir exploitation period, the efficiency of 100 days injection period was similar as the efficiency of 50 days injection period. Figure 16 shows the pressure distribution of the condensate region. After 50 days of injection, the pressure was already higher than 2750 psi. Thus, in this model, a 50 days injection period was long enough to revaporize the condensate into a gas state and increase the condensate recovery.
It can be concluded from the above discussion that the design of the huff process should be based on the pressure variation of the main condensate region. Applying higher injection pressure or a longer injection period did not result in higher condensate recovery. The optimal huff process occurs when the pressure of condensate region is increased higher than the dew point pressure.

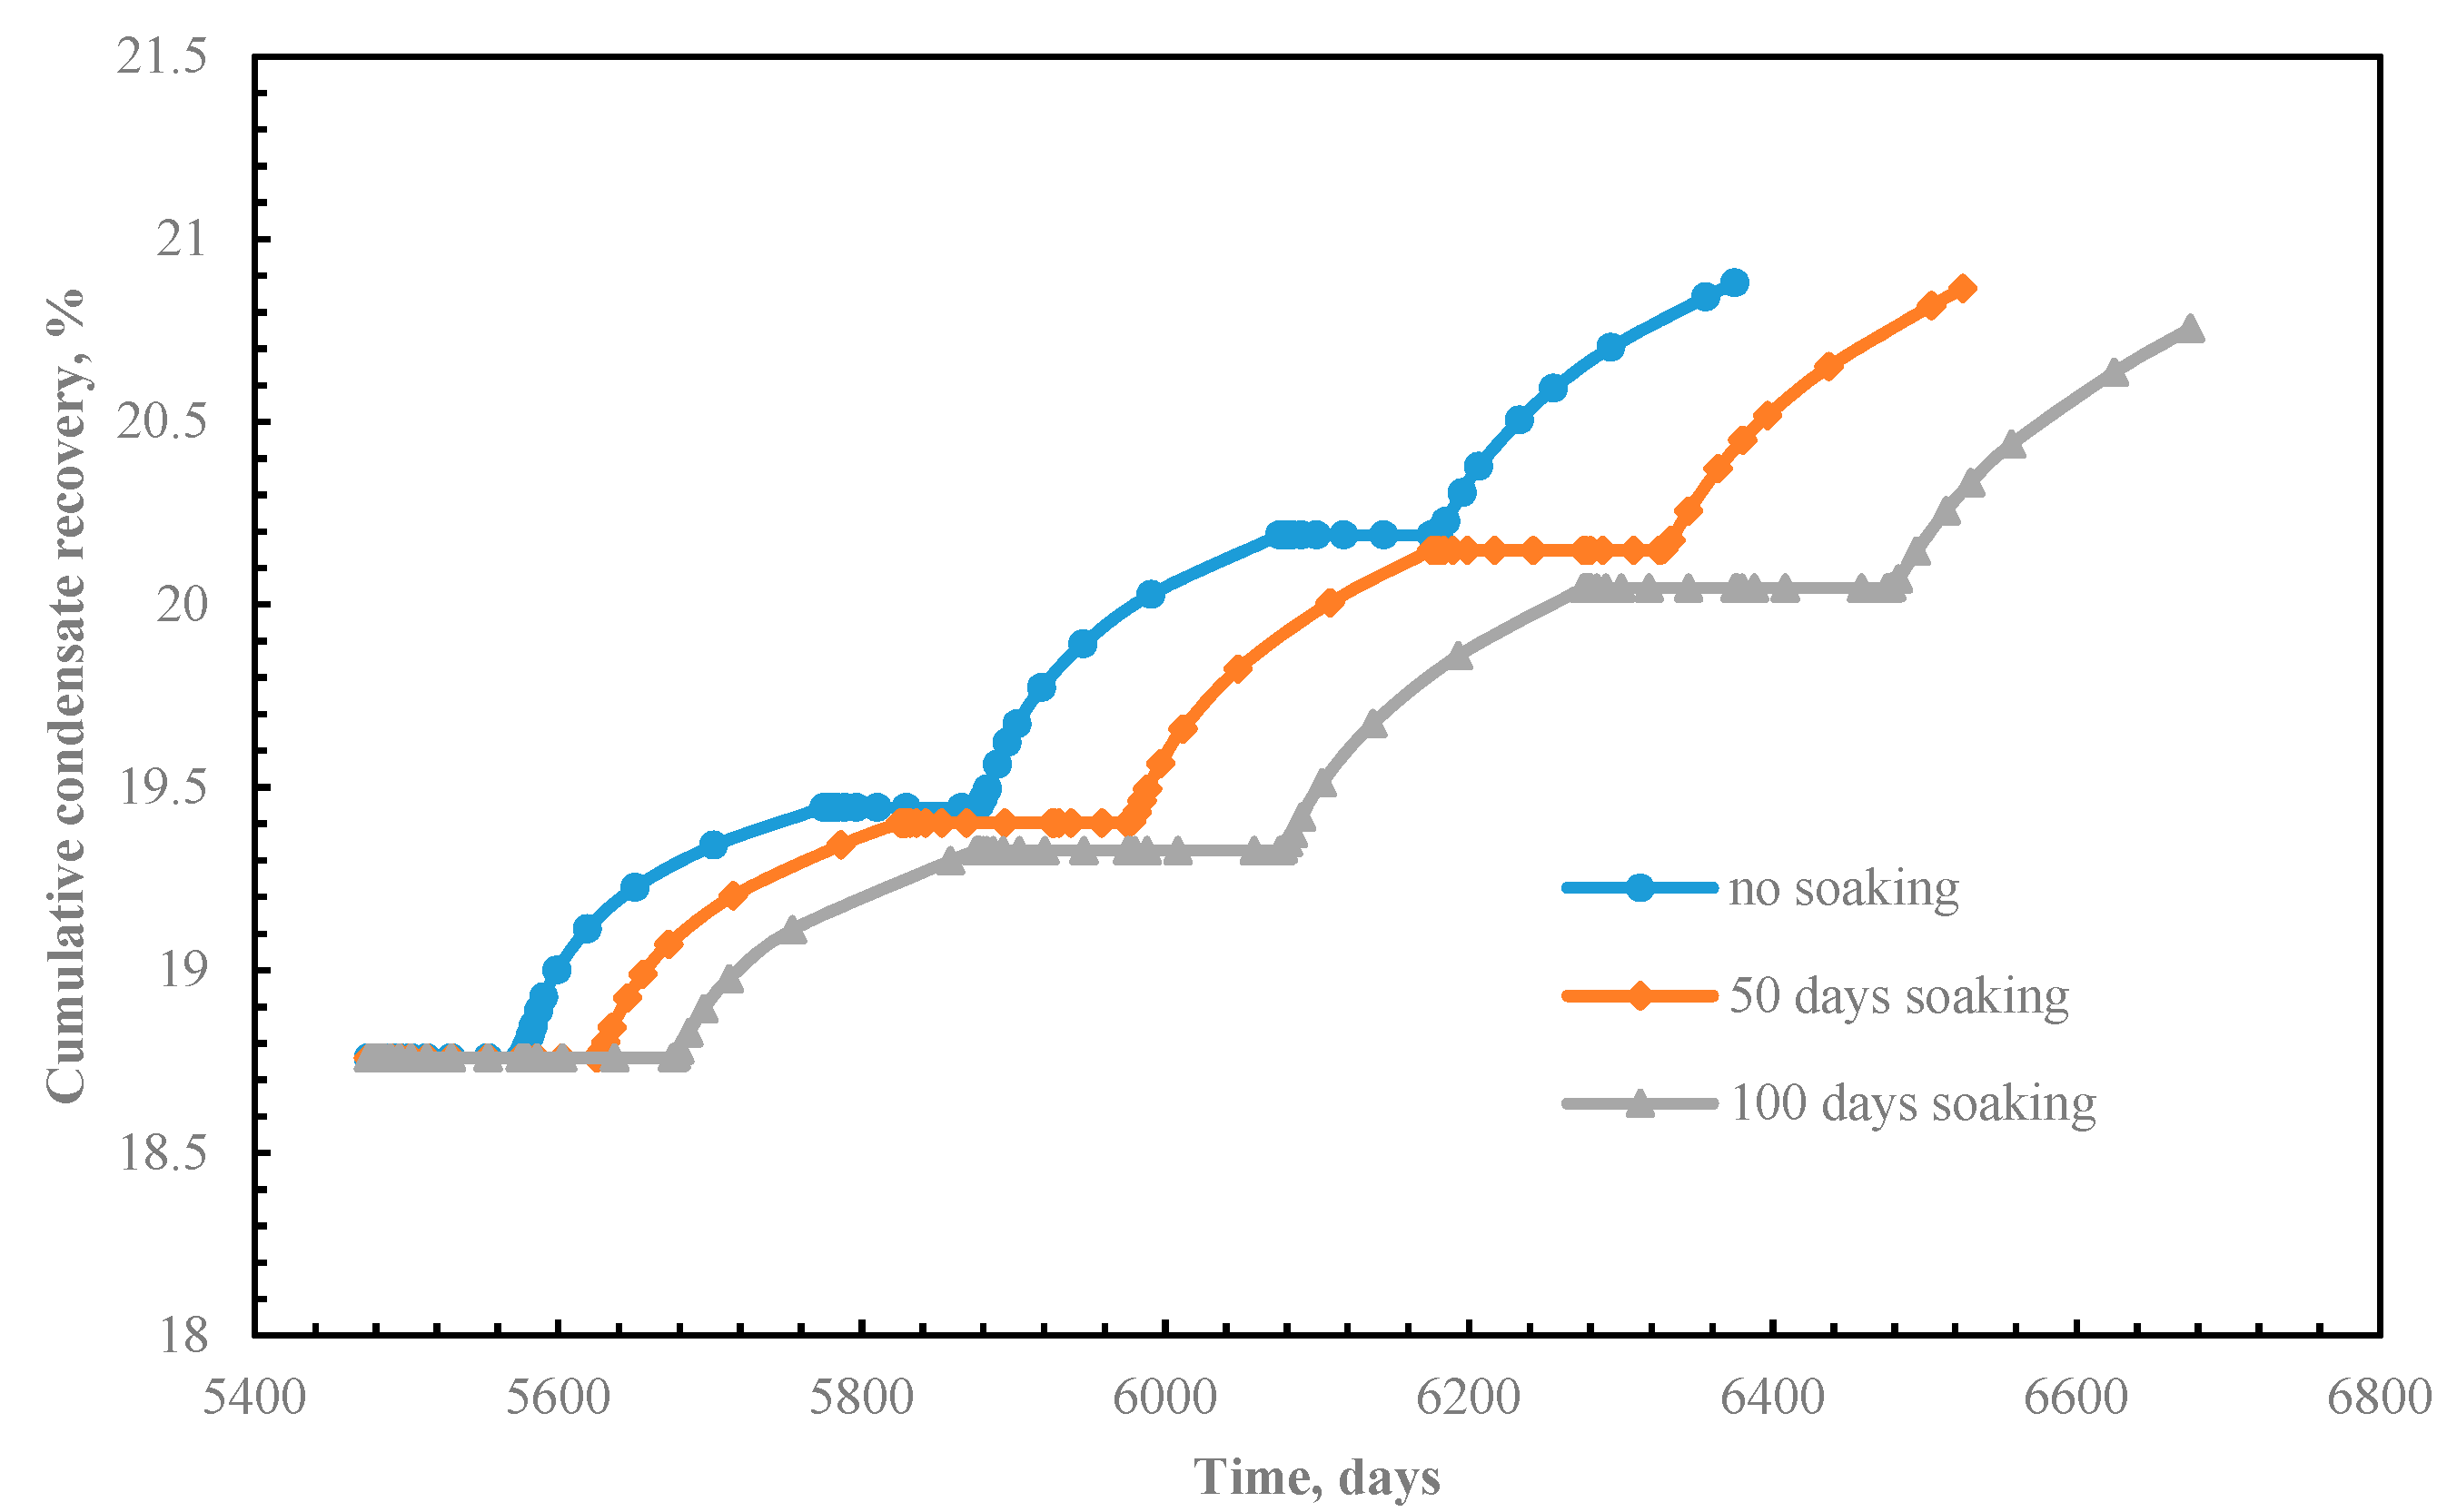
3.2.3. Effect of Soaking Period

A series of simulation work was conducted by applying different soaking time at different pressures. Table 4 shows the different scenarios. For all cases, the injection time was 100 days. The production period was 200 days and production pressure was 1460 psi. Three cycles of CO2 huff-n-puff were operated.
The results show two different trends of cumulative condensate recovery as shown in Figure 17. When the injection pressure was 3000 psi, cumulative condensate recovery was decreased when the soaking time was increased. However, when the injection pressure was 5000 psi, cumulative condensate recovery was increased when the soaking time was increased (Figure 18).
Figure 19 shows the pressure distribution of condensate region when the injection pressure was 3000 psi. After initial injection, the pressure of the near wellbore region was higher than 2750 psi. However, after a 50 days soaking period, the pressure was decreased and the liquid condensate was accumulated again near the fracture. This is because during the soaking process, the pressure was transferred to the distal region of the reservoir. In this situation, the condensate was still formed near the fracture during the soaking period and it had a negative effect on the efficiency of CO2 huff-n-puff gas injection.
However, when the pressure was 5000 psi, the soaking period had a positive effect on the performance of CO2 huff-n-puff. The pressure was still higher than 2750 psi after 50 days of soaking as shown in Figure 20. More condensate could be revaporized into a gas state. Thus, more condensate could be recovered during the puff process.
It can be concluded that whether a soaking process should be applied or not depends on the injection pressure. When the injection pressure is similar as the dew point pressure, a soaking process could have a negative effect on the efficiency of CO2 huff-n-puff. However, when the injection pressure is much higher, a soaking process is recommended. The determination of soaking time depends on the area of the condensate region. In general, during the soaking process, the pressure of the main condensate region should be remained higher than the dew point pressure again, otherwise the condensate could be formed again and the efficiency of huff-n-puff would be decreased.

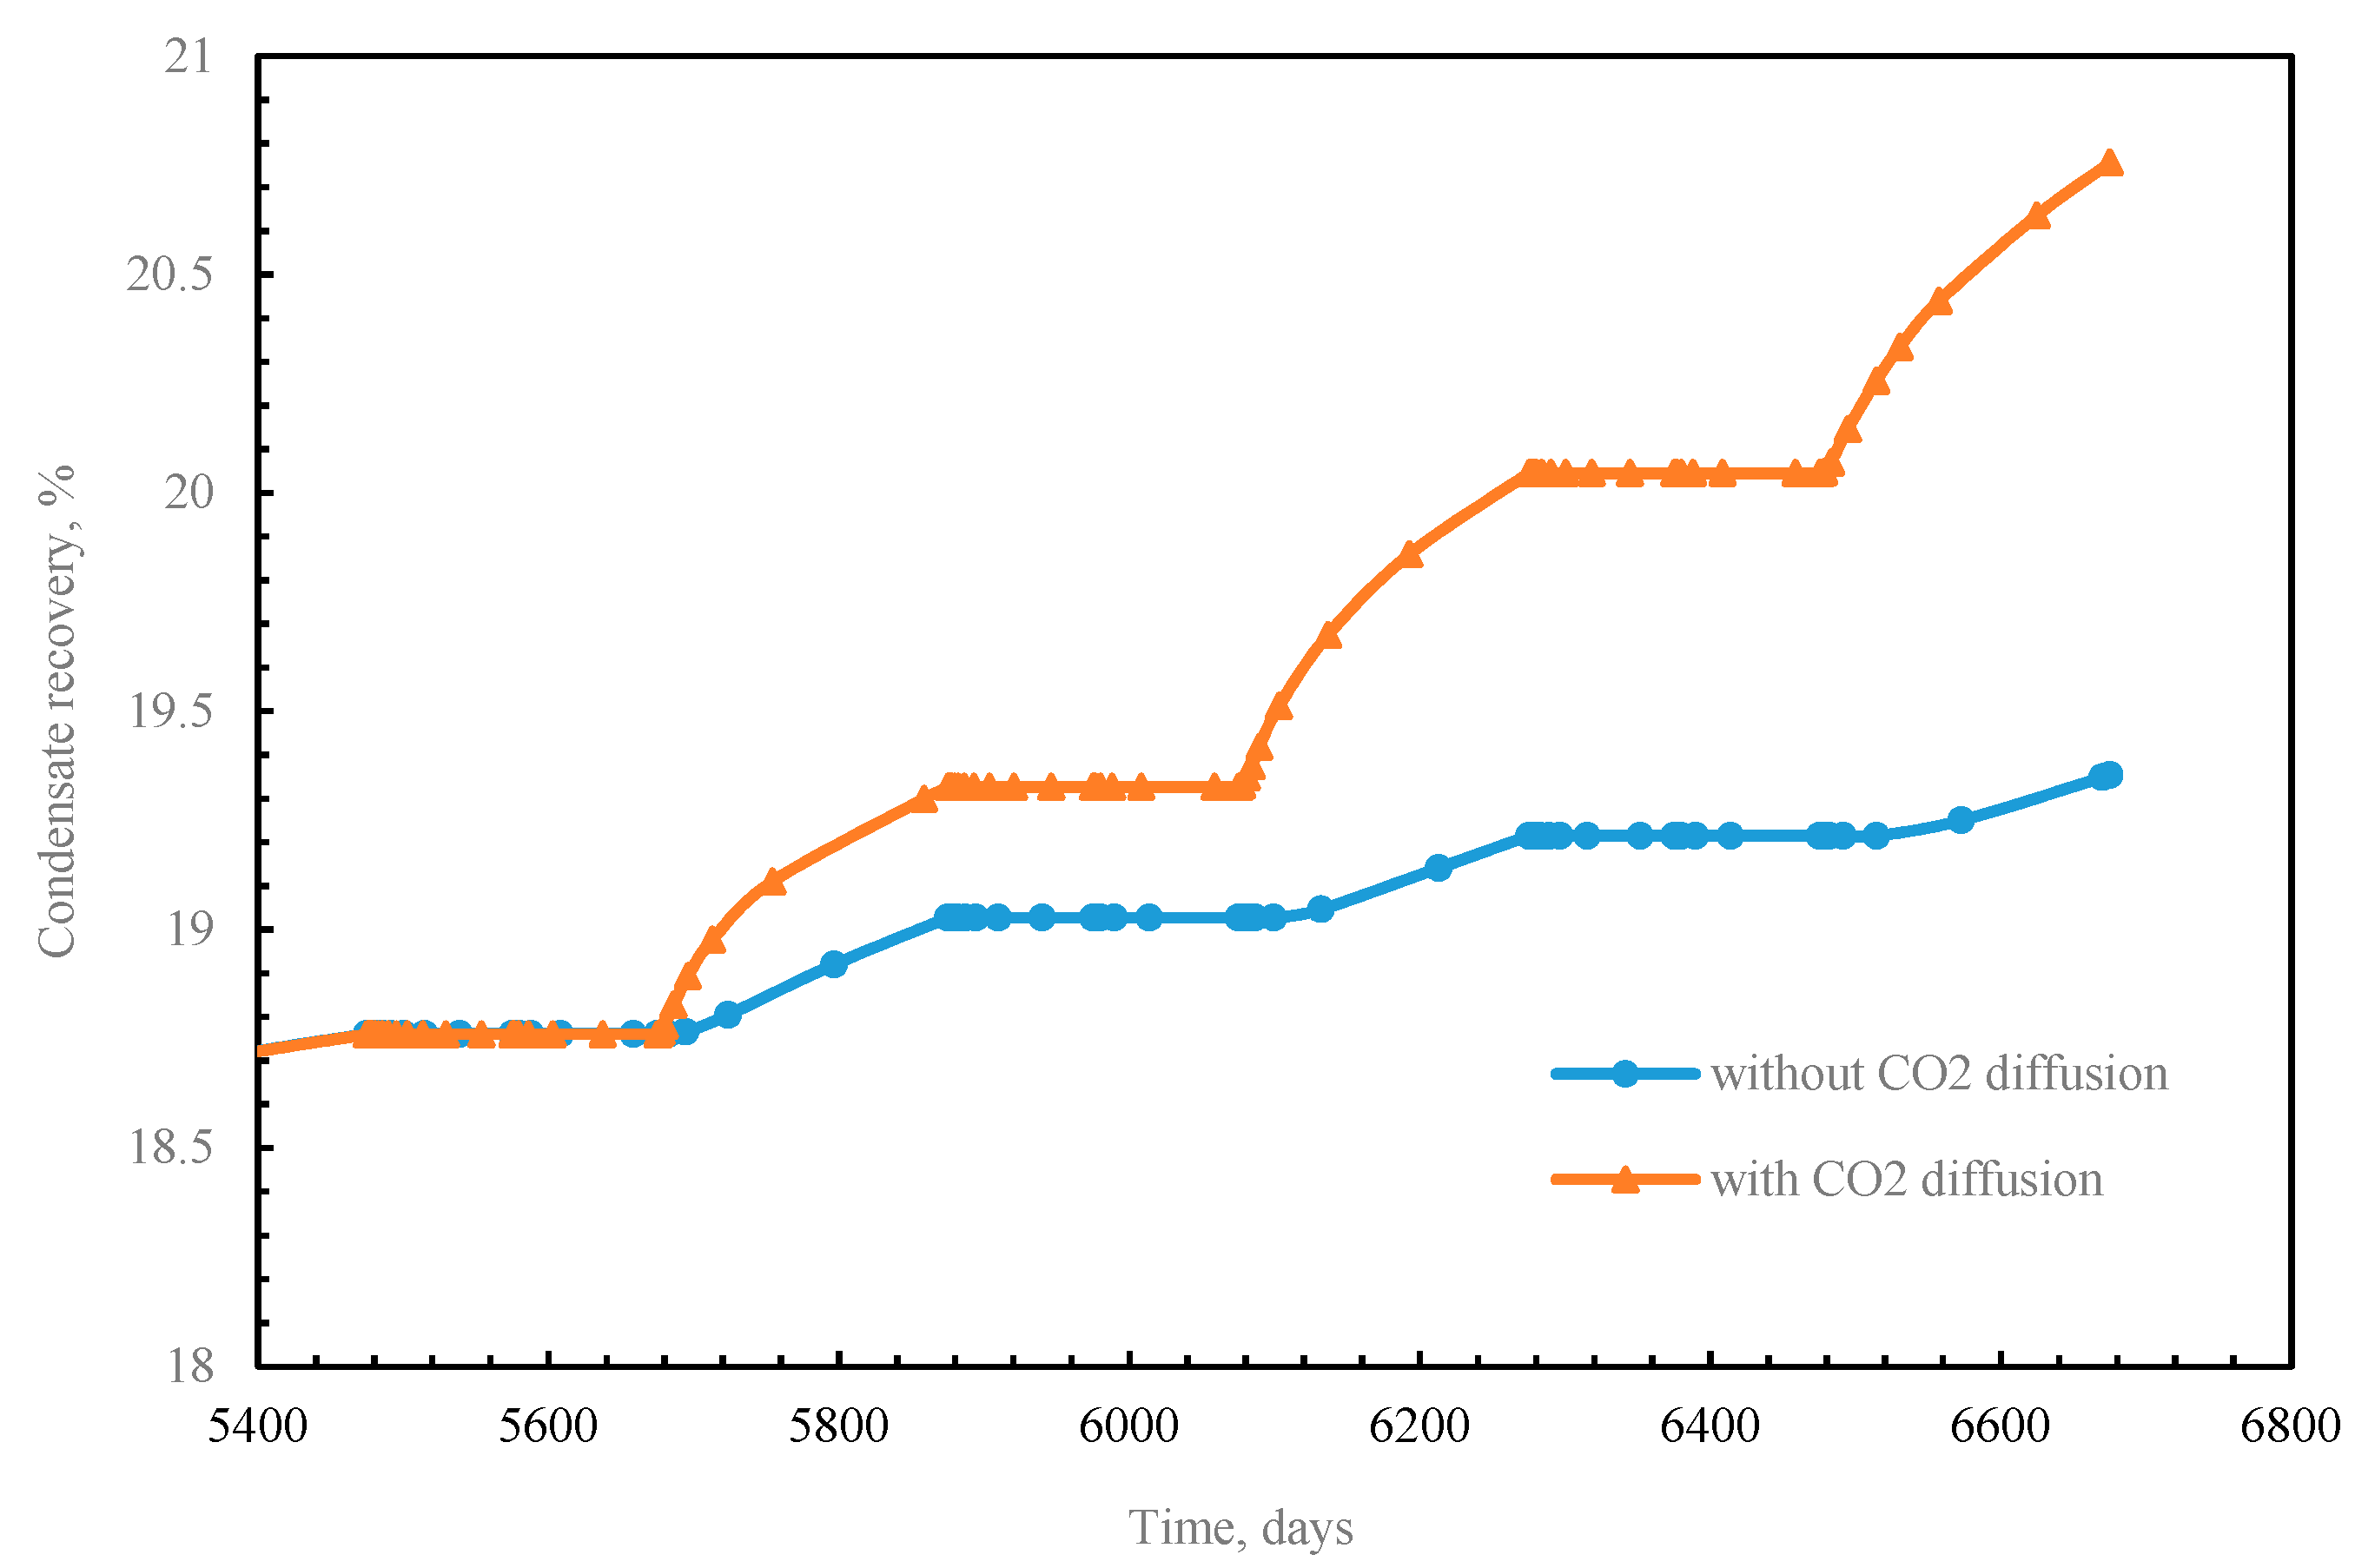
3.2.4. Effect of CO2 Diffusion

Figure 21 shows the effect of CO2 diffusion on the performance of CO2 huff-n-puff. Two cases were conducted in this section. The injection time, soaking time and production time were the same in both cases. Results show that when the CO2 diffusion coefficient was taken into account in the simulation, the condensate would be lower. When the CO2 diffusion coefficient was considered in the model, CO2 could be flowed into the distal region during the 100 days soaking period. The pressure could be decreased and the condensate could be formed again. Thus. CO2 diffusion plays an important role in enhancing condensate recovery during the application of CO2 huff-n-puff.

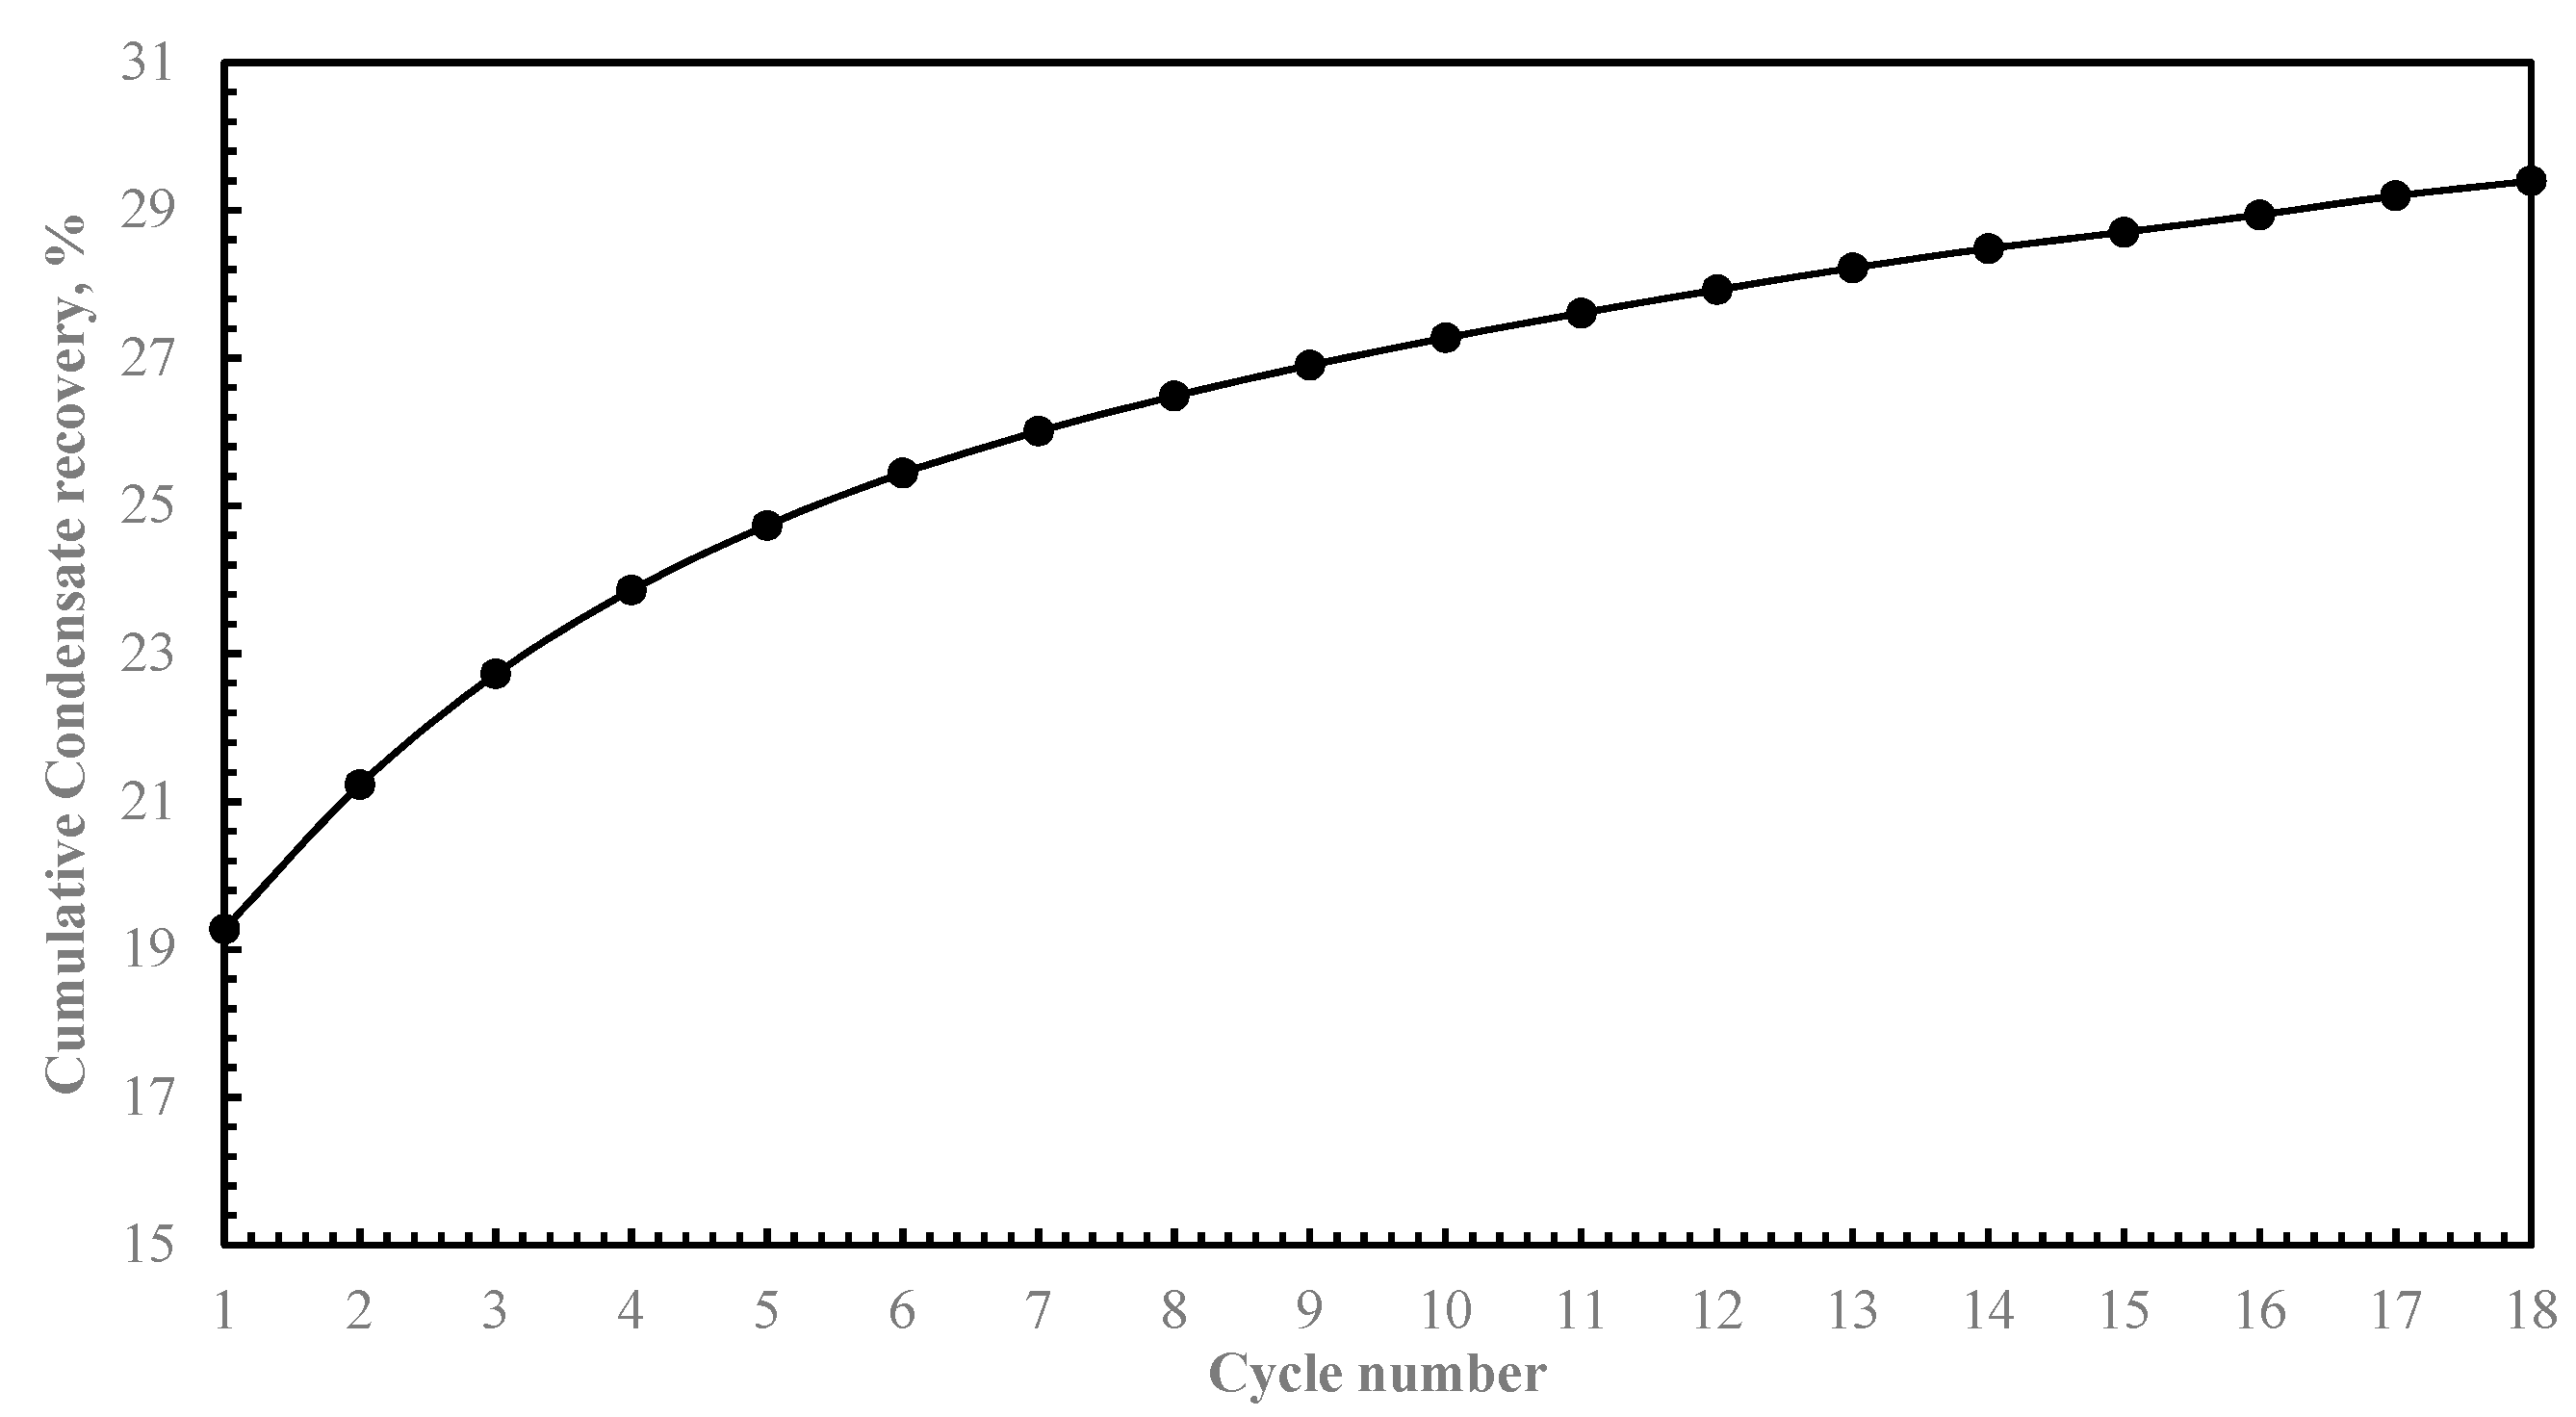
3.2.5. Effect of Cycle Numbers

Figure 22 indicates the effect of the cycle number on cumulative condensate recovery. As the cycle number of CO2 huff-n-puff was increased, cumulative condensate recovery increased. The cumulative condensate recovery was enhanced to 27.2% after 10 cycles. Compared with primary condensate recovery, the increment of condensate recovery after 10 cycles was 9%. However, the recovery was increased to 29.3% after 18 cycles. The increment of the recovery was 1.4%. The latter cycles of CO2 huff-n-puff gas injection resulted in lower efficiency of enhanced condensate recovery. By considering these simulation and experimental results, it can be concluded that the number of cycle numbers of CO2 huff-n-puff gas injection are important. When the cycle number of CO2 huff-n-puff gas injection reaches a critical value, the efficiency of CO2 huff-n-puff could be decreased.

3.3. Recommended Future Work

In this work, a binary gas mixture was used in the experiment. It was used because this gas condensate mixture has a wide condensate region at the room temperature. Thus, the experiment could be handled in a more convenient way and the accuracy of the experiment could be improved. This study indicates the efficiency of the CO2 huff-n-puff to enhance condensate recovery in shale gas condensate reservoirs. In future work, gas condensate mixture from a real reservoir is recommended to be used in the experiment. The experiment can be conducted using the reservoir condition.
In addition, the experiment was conducted on the small cores and the results show an impressive high condensate recovery. The core-scale laboratory results cannot be directly applied to predict the field-scale recovery of a practical shale condensate well. Due to the extremely low permeability of shale formation, the injected gas can only penetrate a limited depth of the formation. For the field conditions, if the shale matrix is intersected by high density hydraulic and natural fractures, then the proportion of penetrated matrix by injected gas will be much higher, which yields a higher recovery. However, if only the several main fractures are formed (not forming fracture networks) after the hydraulic fracturing operation, only a near fracture matrix can be invaded by the injection gas, which yields a much lower recovery. Therefore, the size effect plays a significant role for the condensate recovery factor, which is recommended for future work.

4. Conclusions

An experimental study on shale core was operated to evaluate the enhanced condensate recovery efficiency of CO2 huff-n-puff. Also, a field scale numerical simulation model was built to investigate the performance of CO2 huff-n-puff. The purpose of this study was to evaluate the enhanced condensate recovery performance of CO2 huff-n-puff in shale gas condensate reservoirs. The conclusions of this study are drawn as follows:
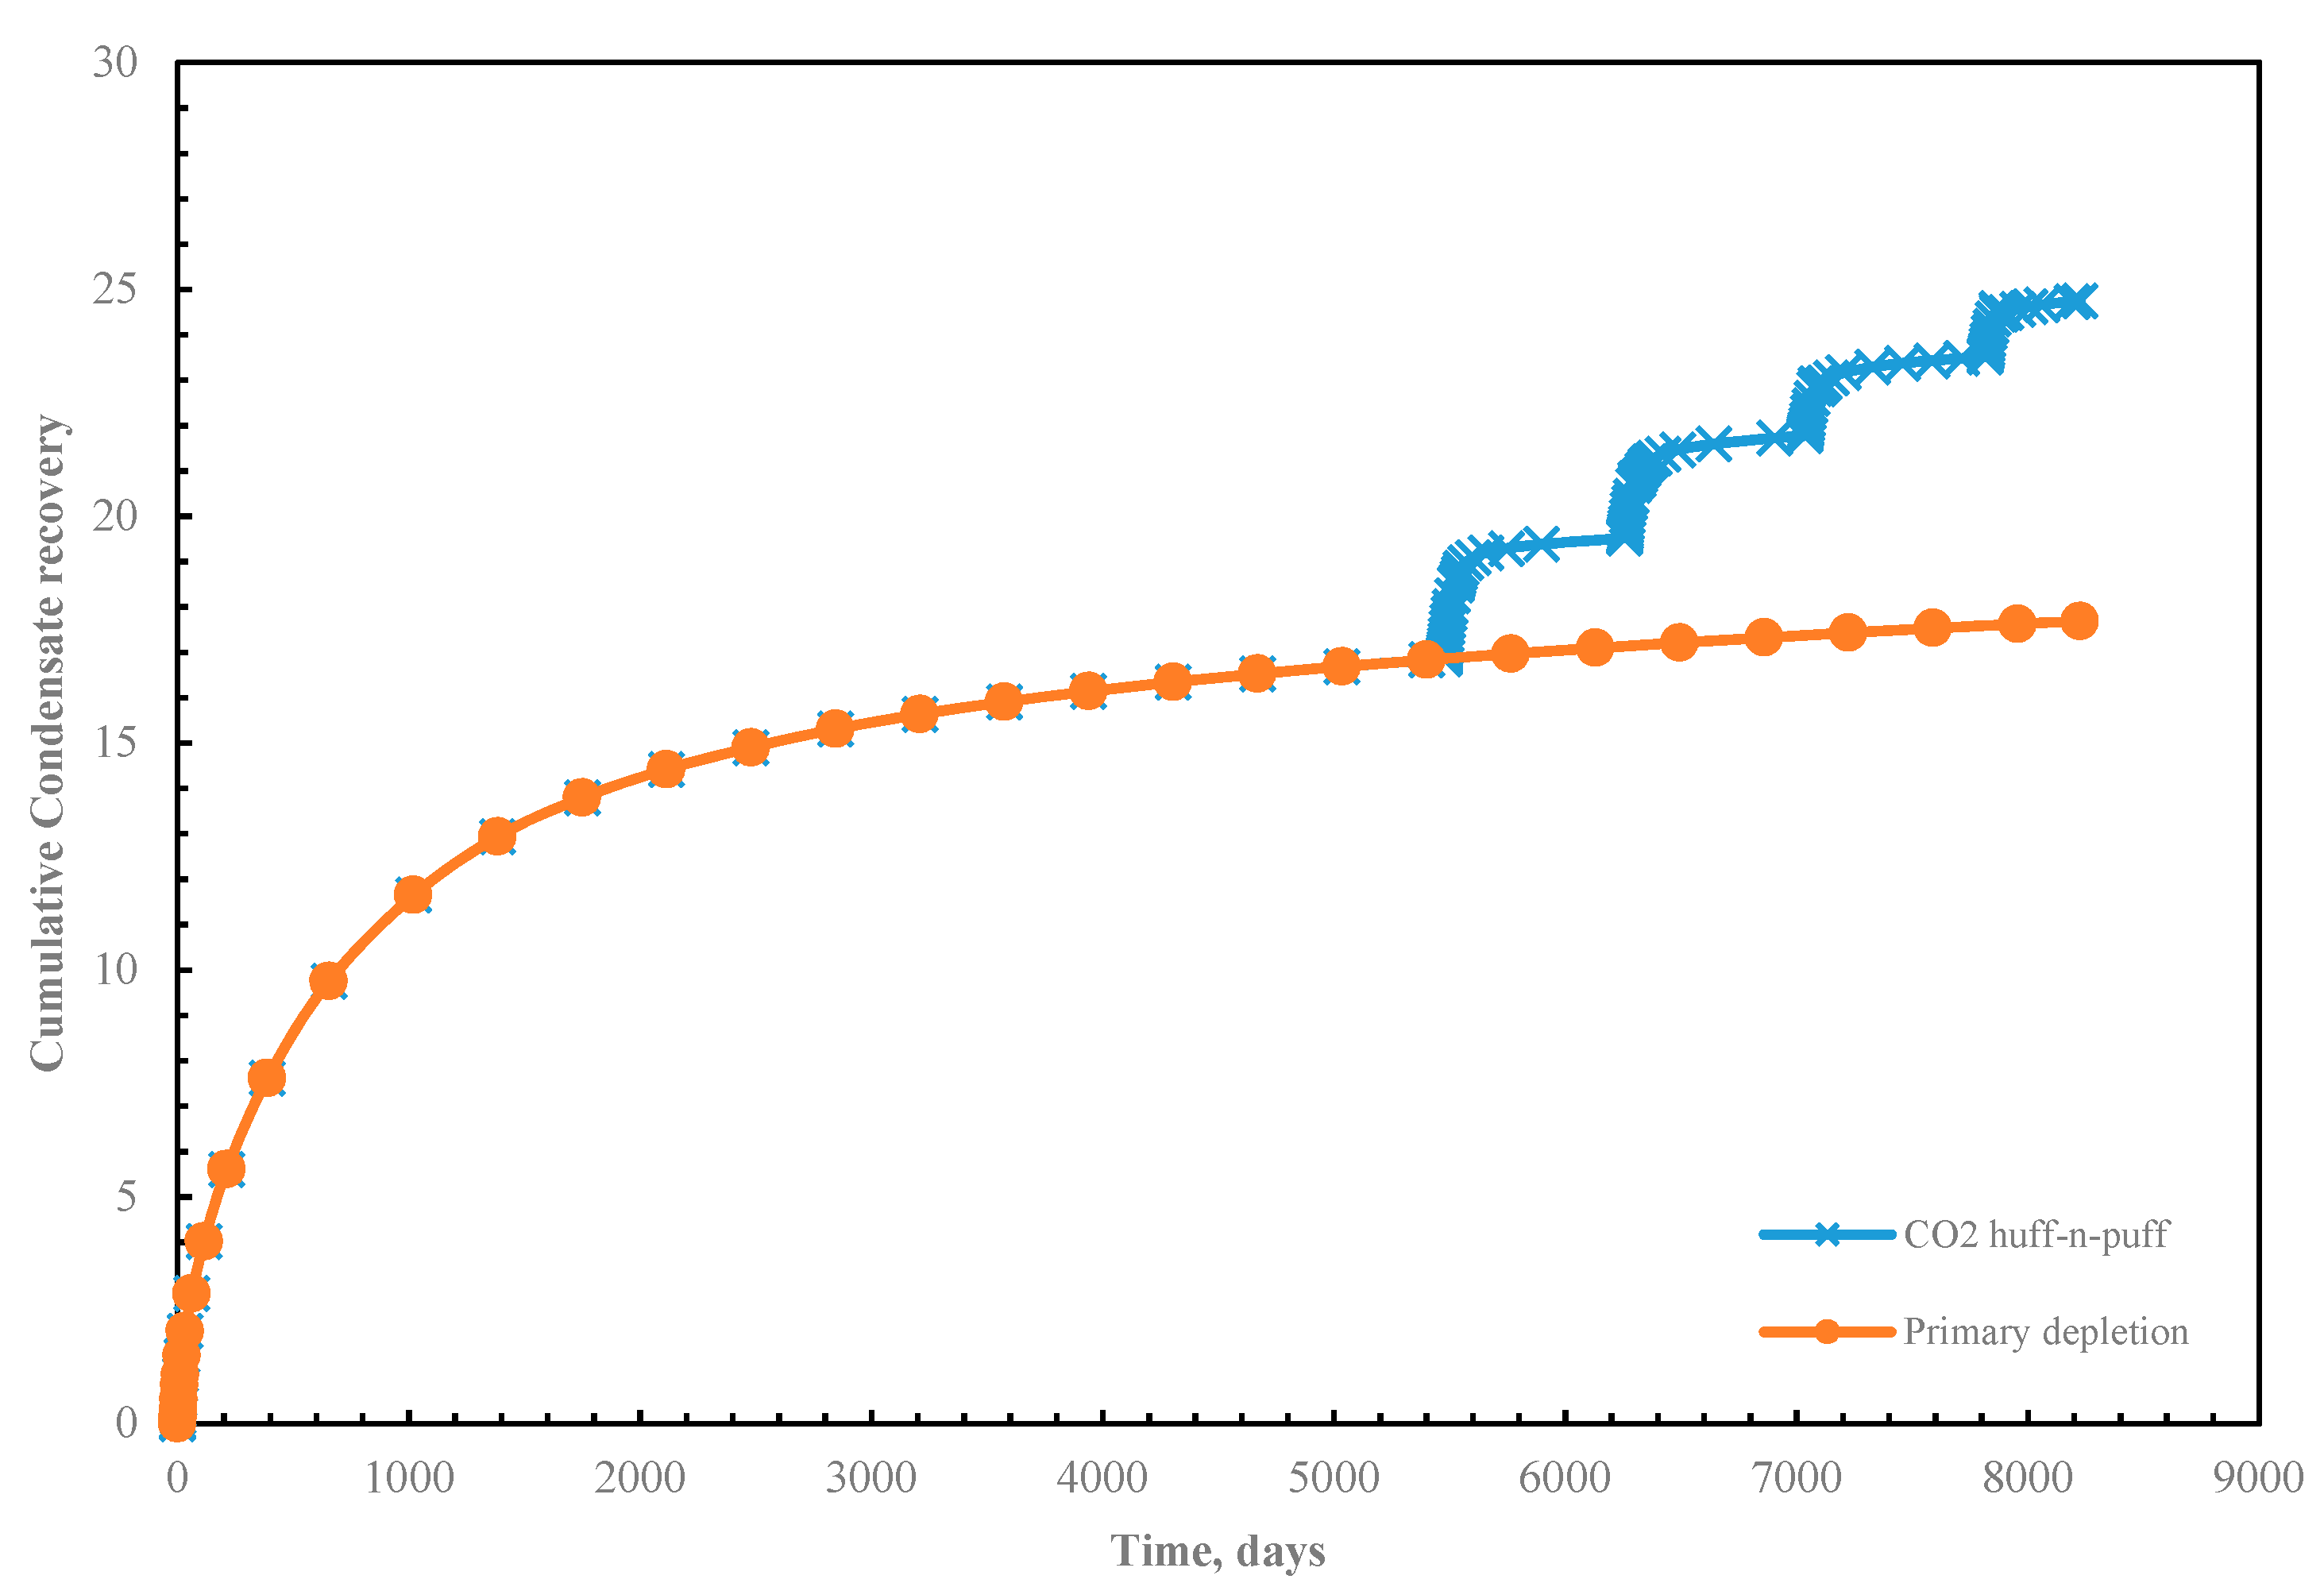
  • The results indicate that the condensate recovery can be effectively enhanced after the application of CO2 huff-n-puff. The condensate recovery was increased to 30.36% after 5 cycles of CO2 huff-n-puff in the experiment. In the simulation work, the condensate was enhanced to 24.7% after 4 cycles.
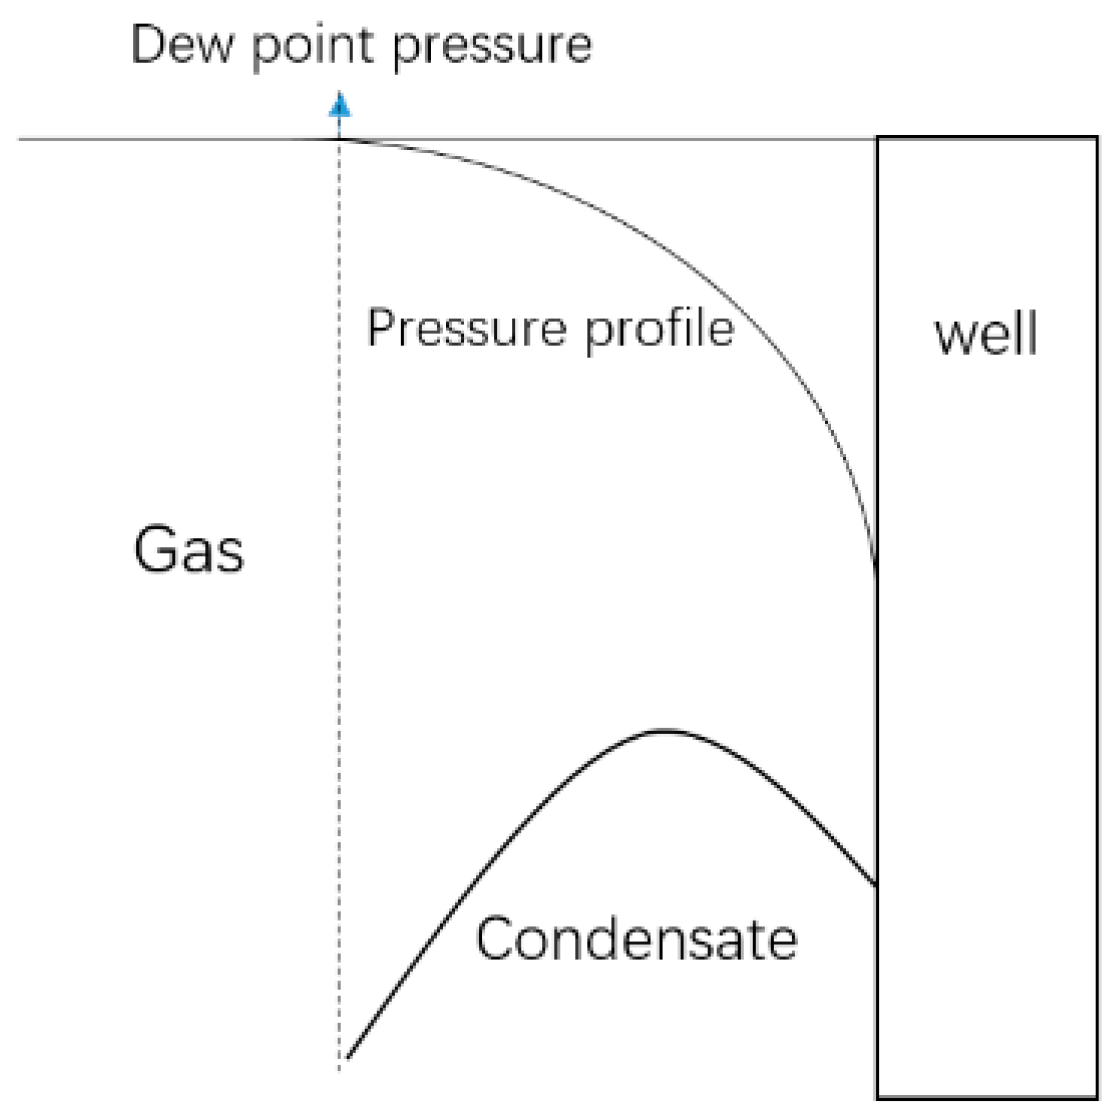
  • Injection period and injection pressure should be optimized to ensure that the pressure of the condensate region remains higher than the dew point pressure after the huff process.
  • Soaking periods should be based on the injection pressure. During the soaking periods, the pressure of the condensate region should remain higher than the dew point pressure. If this does not occur, condensate can be formed and the efficiency of huff-n-puff is decreased. When the injection pressure is much higher than the dew point pressure, soaking is recommended. Otherwise, the soaking should be neglected.
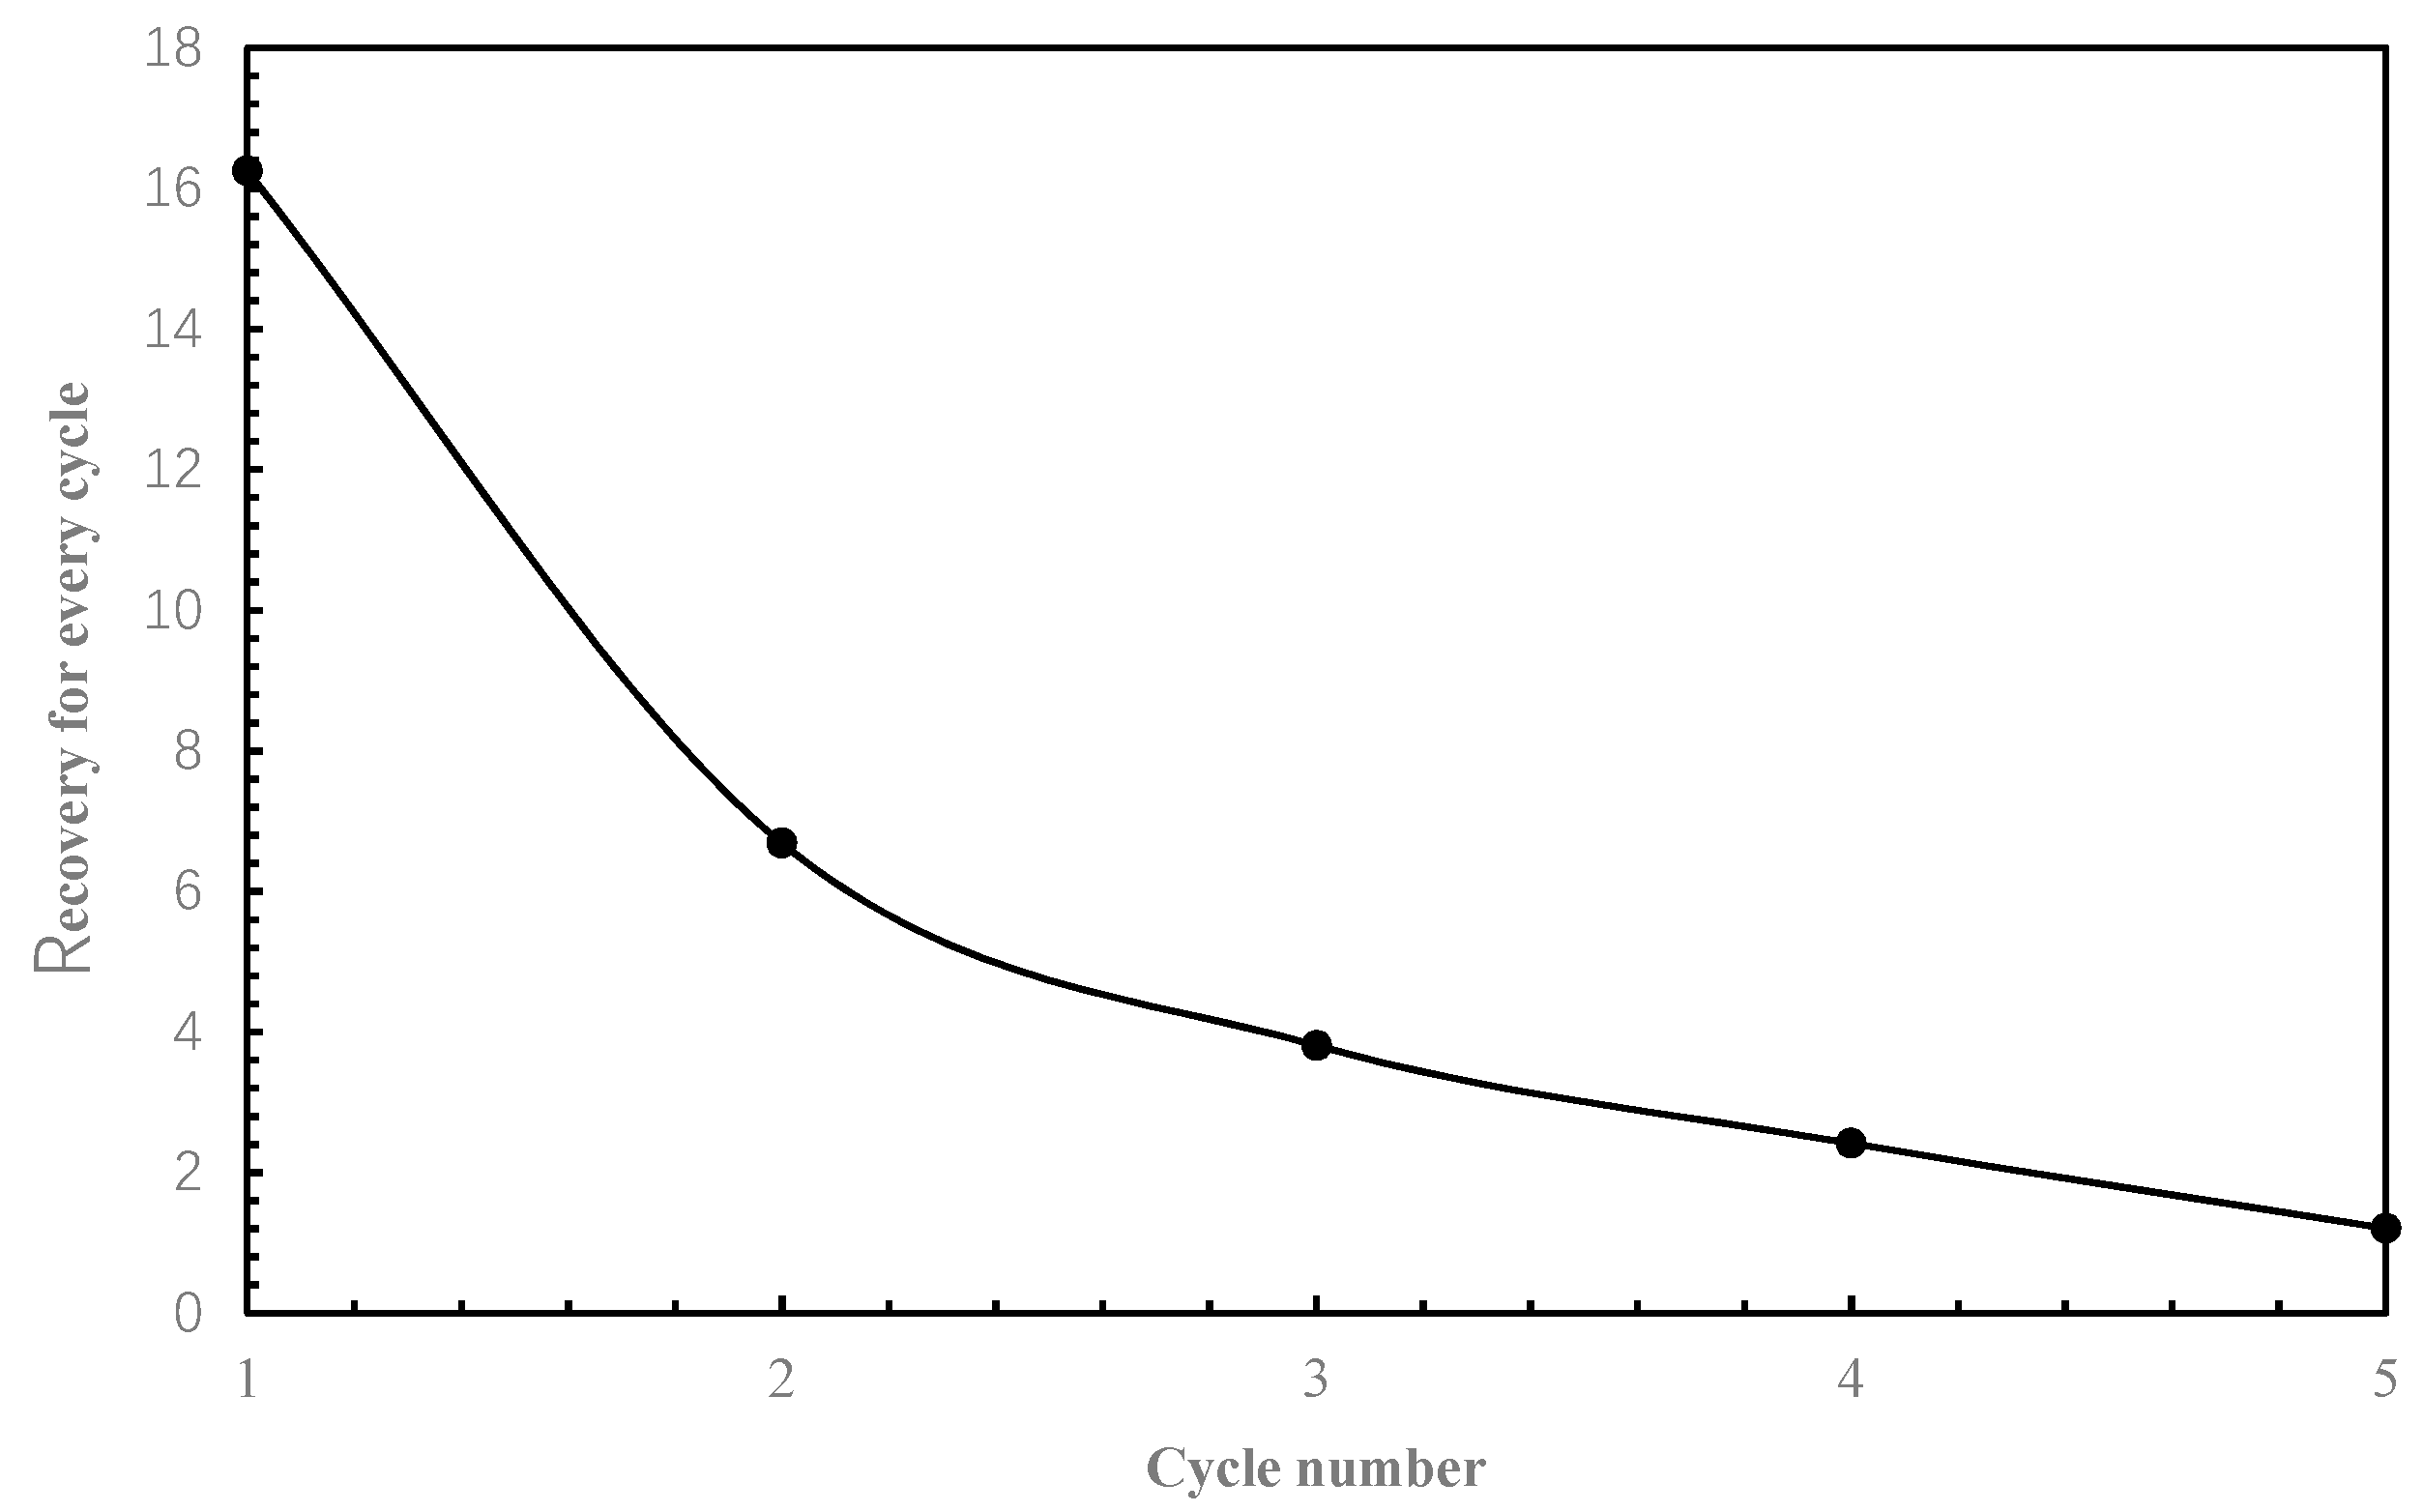
  • The determination of cycle number should depend on the condensate increment of every cycle. When the cycle number reaches a critical value, condensate recovery decreases as does the efficiency of CO2 huff-n-puff.

Author Contributions

Conceptualization, X.M.; Methodology, X.M. and Z.M.; Formal analysis, X.M. and Z.M.; Investigation, X.M., Z.M. and J.M.; Writing—original draft preparation, X.M.; Writing—review and editing, X.M., Z.M., and T.W.; Funding Acquisition, X.M.

Funding

This research was funded by China Postdoctoral Science Foundation Funded Project (Grant 2017M622317).

Acknowledgments

The Lab of Unconventional Oil and Gas Resources Development in China University of Petroleum (East China) is highly appreciated.

Conflicts of Interest

The authors declare no conflict of interest.

References

  1. Wheaton, R.J.; Zhang, H.R. Condensate banking dynamics in gas condensate Fields: Compositional changes and condensate accumulation around production wells. In Proceedings of the SPE Annual Technical Conference and Exhibition, Dallas, TX, USA, 1–4 October 2000. [Google Scholar] [CrossRef]
  2. Ayyalasomayajula, P.S.; Silpngarmlers, N.; Kamath, J. Well deliverability predictions for a low permeability gas condensate reservoir. In Proceedings of the SPE Annual Technical Conference and Exhibition, Dallas, TX, USA, 9–12 October 2005. [Google Scholar] [CrossRef]
  3. Hinchman, S.B.; Barree, R.D. Productivity loss in gas condensate reservoirs. In Proceedings of the SPE Annual Technical Conference and Exhibition, Las Vegas, NV, USA, 22–26 September 1985. [Google Scholar] [CrossRef]
  4. Muladi, A.; Pinczewski, W.V. Application of horizontal well in heterogeneity gas condensate reservoir. In Proceedings of the SPE Asia Pacific Oil and Gas Conference and Exhibition, Jakarta, Indonesia, 20–22 April 1999. [Google Scholar] [CrossRef]
  5. Miller, N.; Nasrabadi, H.; Zhu, D. On application of horizontal wells to reduce condensate blockage in gas condensate reservoirs. In Proceedings of the SPE International Oil and Gas Conference and Exhibition in China, Beijing, China, 8–10 June 2010. [Google Scholar] [CrossRef]
  6. Carlson, M.R.M.; Myer, J.W.G. The effects of retrograde liquid condensation on single well productivity determined via direct modelling of a hydraulic fracture in a low permeability reservoir. In Proceedings of the Low Permeability Reservoirs Symposium, Denver, Colorado, 19–22 March 1995. [Google Scholar] [CrossRef]
  7. Aly, A.M.; El-Banbi, A.H.; Holditch, S.A.; Wahdan, M.; Salah, N. Optimization of gas condensate reservoir development by coupling reservoir modeling and hydraulic fracturing design. In Proceedings of the SPE Middle East Oil Show, Manama, Bahrain, 17–20 March 2001. [Google Scholar] [CrossRef]
  8. Ignatyev, A.E.; Mukminov, I.; Vikulova, E.A.; Pepelyayev, R.V. Multistage hydraulic fracturing in horizontal wells as a method for the effective development of gas-condensate fields in the arctic region (Russian). In Proceedings of the SPE Arctic and Extreme Environments Conference and Exhibition, Moscow, Russia, 18–20 October 2011. [Google Scholar] [CrossRef]
  9. Zhang, L.; Kou, Z.; Wang, H.; Zhao, Y.; Dejam, M.; Guo, J.; Du, J. Performance analysis for a model of a multi-wing hydraulically fractured vertical well in a coalbed methane gas reservoir. J. Pet. Sci. Eng. 2018, 166, 104–120. [Google Scholar] [CrossRef]
  10. Dejam, M.; Hassanzadeh, H.; Chen, Z. Semi-analytical solution for pressure transient analysis of a hydraulically fractured vertical well in a bounded dual-porosity reservoir. J. Hydrol. 2018, 565, 289–301. [Google Scholar] [CrossRef]
  11. Bang, V.S.S.; Pope, G.A.; Sharma, M.M.; Baran, J.R. Development of a successful chemical treatment for gas wells with liquid blocking. In Proceedings of the SPE Annual Technology Conference and Exhibition, New Orleans, LA, USA, 4–7 October 2009. [Google Scholar] [CrossRef]
  12. Al-Anazi, H.A.; Walker, J.G.; Pope, G.A.; Sharma, M.M.; Hackney, D.F. A successful methanol treatment in a gas-condensate reservoir: Field application. In Proceedings of the SPE Production and Operation Symposium, Oklahoma City, OK, USA, 23–26 March 2003. [Google Scholar] [CrossRef]
  13. Al-Anazi, H.A.; Pope, G.A.; Sharma, M.M. Laboratory measurements of condensate blocking and treatment for both low and high permeability rocks. In Proceedings of the SPE Annual Technical Conference and Exhibition, San Antonio, TX, USA, 29 September–2 October 2002. [Google Scholar] [CrossRef]
  14. Li, K.; Firoozabadi, A. Experimental study of wettability alteration to preferential gas-wetting in porous media and its Effects. SPE Reserv. Eval. Eng. 2000, 3, 139–149. [Google Scholar] [CrossRef]
  15. Ahmadi, M.; Sharma, M.M.; Pope, G.; Torres, D.E.; McCulley, C.A.; Linnemeyer, H. Chemical treatment to mitigate condensate and water blocking in gas wells in carbonate reservoirs. SPE Prod. Oper. 2011, 26, 67–74. [Google Scholar] [CrossRef]
  16. Zheng, Y.; Rao, D.N. Surfactant-Induced spreading and wettability effects in condensate reservoirs. In Proceedings of the SPE Improved Oil Recovery Symposium, Tulsa, OK, USA, 24–28 April 2010. [Google Scholar] [CrossRef]
  17. Ganjdanesh, R.; Rezaveisi, M.; Pope, G.A.; Sepehrnoori, K. Treatment of condensate and water blocks in hydraulic fractured shale gas-condensate reservoirs. In Proceedings of the SPE Annual Technical Conference and Exhibition, Houston, TX, USA, 28–30 September 2015. [Google Scholar] [CrossRef]
  18. Abel, W.; Jackson, R.F.; Wattenbarger, R.A. Simulation of a partial pressure maintenance gas cycling project with a compositional model, Carson Creek Field, Alberta. J. Pet. Technol. 1970, 22, 38–46. [Google Scholar] [CrossRef]
  19. Luo, K.; Li, S.; Zheng, X.; Chen, G.; Dai, Z.; Liu, N. Experimental investigation into revaporization of retrograde condensate by lean gas injection. In Proceedings of the SPE Asia Pacific Oil and Gas Conference and Exhibition, Jakarta, Indonesia, 17–19 April 2001. [Google Scholar] [CrossRef]
  20. Aziz, R.M. A 1982 critique on gas cycling operations on gas-condensate reservoirs. In Proceedings of the Middle East Oil Technical Conference and Exhibition, Manama, Bahrain, 14–17 March 1983. [Google Scholar] [CrossRef]
  21. Al-Wadhahi, M.; Boukadi, F.H.; Al-Bemani, A.; Al-Maamari, R. Huff n puff to revaporize liquid dropout in an Omani gas field. J. Pet. Sci. Eng. 2007, 55, 67–73. [Google Scholar] [CrossRef]
  22. Siregar, S.; Hagoort, J.; Ronde, H. Nitrogen injection vs. gas cycling in rich retrograde condensate-gas reservoirs. In Proceedings of the SPE International Meeting on Petroleum Engineering, Beijing, China, 24–27 March 1992. [Google Scholar] [CrossRef]
  23. Stalkup, F.I. Carbon dioxide miscible flooding: Past, present, and outlook for the Future. J. Pet. Technol. 1978, 30, 1102–1112. [Google Scholar] [CrossRef]
  24. Gohary, M.E.; Bairaq, A.M.A.; Bradley, D.C.; Saeed, Y. Comparison of condensate recovery by hydrocarbon and nonhydrocarbon injection. In Proceedings of the SPE Abu Dhabi International Petroleum Exhibition and Conference, Abu Dhabi, UAE, 9–12 November 2015. [Google Scholar] [CrossRef]
  25. Odi, U. Analysis and potential of CO2 huff-n-puff for near wellbore condensate removal and enhanced gas recovery. In Proceedings of the SPE Annual Technical Conference and Exhibition, San Antonio, TX, USA, 8–10 October 2012. [Google Scholar] [CrossRef]
  26. Kurdi, M.; Xiao, J.; Liu, J. Impact of CO2 injection on condensate banking in gas condensate reservoirs. In Proceedings of the SPE Saudi Arabia section Young Professionals Technical Symposium, Dhahran, Saudi Arabia, 19–21 March 2012. [Google Scholar] [CrossRef]
  27. Gachuz-Muro, H.; Gonzalez Valtierra, B.E.; Luna, E.E.; Aguilar Lopez, B. Laboratory tests with CO2, N2 and lean natural gas in a naturally fractured gas-condensate reservoir under HP/HT Conditions. In Proceedings of the SPE Enhanced Oil Recovery Conference, Kuala Lumpur, Malaysia, 19–21 July 2011. [Google Scholar] [CrossRef]
  28. Moradi, B.; Tangsiri Fard, J.; Rasaei, M.R.; Momeni, A.; Bagheri, M.B. Effect of gas recycling on the enhancement of condensate recovery in an Iranian fractured gas/condensate reservoir. In Proceedings of the Trinidad and Tobago Energy Resources Conference, Poet of Spain, Trinidad, 27–30 June 2010. [Google Scholar] [CrossRef]
  29. Sheng, J.J. Increase liquid oil production by huff-n-puff of produced gas in shale gas condensate reservoirs. J. Unconv. Oil Gas Resour. 2015, 11, 19–26. [Google Scholar] [CrossRef] [Green Version]
  30. Zhao, H.; Firoozabadi, A. Sorption hysteresis of light hydrocarbons and carbon dioxide in shale and kerogen. Sci. Rep. 2017, 7, 16209. [Google Scholar] [CrossRef]
  31. Dejam, M.; Hassanzadeh, H.; Chen, Z. Pre-Darcy flow in porous media. Water Resour. Res. 2017, 53, 187–8210. [Google Scholar] [CrossRef]
  32. Jin, Z.; Firoozabadi, A. Flow of methane in shale nanopores at low and high pressure by molecular dynamics simulations. J. Chem. Phys. 2015, 143, 104315. [Google Scholar] [CrossRef] [PubMed]
  33. Dejam, M. Advective-diffusive-reactive solute transport due to non-Newtonian fluid flows in a fracture surrounded by a tight porous medium. Int. J. Heat Mass Transf. 2019, 128, 1307–1321. [Google Scholar] [CrossRef]
  34. Dejam, M.; Hassanzadeh, H.; Chen, Z. Shear dispersion in combined pressure-driven and electro-osmotic flows in a capillary tube with a porous wall. Am. Inst. Chem. Eng. J. 2015, 61, 3981–3995. [Google Scholar] [CrossRef]
  35. Dejam, M.; Hassanzadeh, H.; Chen, Z. Shear dispersion in combined pressure-driven and electro-osmotic flows in a channel with porous walls. Chem. Eng. Sci. 2015, 137, 205–215. [Google Scholar] [CrossRef]
  36. Sharma, S.; Sheng, J.J. A comparative study of huff-n-puff gas and solvent injection in a shale gas condensate core. J. Nat. Gas Sci. Eng. 2017, 38, 549–565. [Google Scholar] [CrossRef]
  37. Ren, B.; Ren, S.; Zhang, L.; Chen, G.; Zhang, H. Monitoring on CO2 migration in a tight oil reservoir during CCS-EOR in Jilin Oilfield China. Energy 2016, 98, 108–121. [Google Scholar] [CrossRef]
  38. Zuloaga, P.; Yu, W.; Miao, J. Performance evaluation of CO2 Huff-n-Puff and continuous CO2 injection in tight oil reservoirs. Energy 2017, 134, 181–192. [Google Scholar] [CrossRef]
  39. Song, C.; Yang, D. Experimental and numerical evaluation of CO2 huff-n-puff processes in Bakken formation. Fuel 2017, 190, 145–162. [Google Scholar] [CrossRef]
  40. Sheng, J.J.; Chen, K. Evaluation of the EOR potential of gas and water injection in shale oil reservoirs. J. Unconv. Oil Gas Resour. 2014, 5, 1–9. [Google Scholar] [CrossRef]
  41. Abedini, A.; Torabi, F. Oil recovery performance of immiscible and miscible CO2 huff-and-puff processes. Energy Fuels 2014, 28, 774–784. [Google Scholar] [CrossRef]
  42. Shi, C.; Horne, R.N. Improved recovery in gas-condensate reservoirs considering compositional variations. In Proceedings of the SPE Annual Technical Conference and Exhibition, Denver, CO, USA, 21–24 September 2008. [Google Scholar] [CrossRef]
  43. Wan, T.; Sheng, J.J.; Soliman, M.Y. Evaluation of EOR potential in fractured shale oil Reservoirs by cyclic gas injection. Pet. Sci. Technol. 2015, 33, 812–818. [Google Scholar] [CrossRef]
  44. Nezhad, M.M.; Fisher, Q.J.; Gironacci, E.; Rezania, M. Experimental study and numerical modeling of fracture propagation in shale rocks during Brazilian disk test. Rock Mech. Rock Eng. 2018, 51, 1755–1775. [Google Scholar] [CrossRef]
  45. Josh, M.; Esteban, L.; Delle Piane, C.; Sarout, J.; Dewhurst, D.N.; Clennell, M.B. Laboratory characterisation of shale properties. J. Pet. Sci. Eng. 2012, 88, 107–124. [Google Scholar] [CrossRef]
  46. Mello, M.R.; Telnaes, N.; Gaglianone, P.C.; Chicarelli, M.I.; Brassell, S.C.; Maxwell, J.R. Organic geochemical characterisation of depositional palaeoenvironments of source rocks and oils in Brazilian marginal basins. Org. Geochem. Pet. Explor. 1988, 13, 31–45. [Google Scholar] [CrossRef]
  47. Mousavi Nezhad, M.; Gironacci, E.; Rezania, M.; Khalili, N. Stochastic modelling of crack propagation in materials with random properties using isometric mapping for dimensionality reduction of nonlinear data sets. Int. J. Numer. Methods Eng. 2018, 113, 656–680. [Google Scholar] [CrossRef]
  48. Li, Y.; Pu, H. Modeling study on CO2 capture and storage in organic-rich shale. In Proceedings of the Carbon Management Technology Conference, Sugar Land, TX, USA, 17–19 November 2015. [Google Scholar] [CrossRef]
  49. Li, B.; Mezzatesta, A. Evaluation of pore size distribution effects on phase behavior of hydrocarbons produced in shale gas condensate reservoirs. In Proceedings of the SPE Middle East Oil & Gas Show and Conference, Manama, Kingdom of Bahrain, 6–9 March 2017. [Google Scholar] [CrossRef]
  50. Wang, X.; Sheng, J.J. Pore network modeling of the non-Darcy flows in shale and tight formations. J. Pet. Sci. Eng. 2018, 163, 511–518. [Google Scholar] [CrossRef]
  51. Wang, X.; Sheng, J.J. Understanding oil and gas flow mechanisms in shale reservoirs using SLD–PR transport model. Transp. Porous Media 2018, 119, 337–350. [Google Scholar] [CrossRef]
  52. Altman, R.M.; Fan, L.; Sinha, S.; Stukan, M.; Viswanathan, A. Understanding mechanisms for liquid dropout from horizontal shale gas condensate wells. In Proceedings of the SPE Annual Technical Conference and Exhibition, Amsterdam, The Netherlands, 27–29 October 2014. [Google Scholar] [CrossRef]
Figure 1. Condensate and pressure profile around the wellbore.
Energies 12 00042 g001
Figure 2. Huff-n-puff gas scenario in shale reservoirs.
Energies 12 00042 g002
Figure 3. Phase diagram of initial gas mixture.
Energies 12 00042 g003
Figure 4. Liquid dropout curve of methane and n-butane gas condensate mixture, 20 °C (68 °F).
Energies 12 00042 g004
Figure 5. Schematic of CO2 huff-n-puff.
Energies 12 00042 g005
Figure 6. Field scale simulation model in ij view.
Energies 12 00042 g006
Figure 7. The liquid dropout curve of reservoir fluid at 93.3 °C (200 °F).
Energies 12 00042 g007
Figure 8. Variation of condensate saturation.
Energies 12 00042 g008
Figure 9. Cumulative condensate recovery.
Energies 12 00042 g009
Figure 10. Increment of condensate recovery for every cycle.
Energies 12 00042 g010
Figure 11. Comparison of cumulative condensate recovery.
Energies 12 00042 g011
Figure 12. Cumulative condensate recovery with different injection pressure.
Energies 12 00042 g012
Figure 13. Main condensate region after primary depletion.
Energies 12 00042 g013
Figure 14. Pressure distribution for different injection pressure. (a) Injection pressure: 2500 psi; (b) Injection pressure: 3000 psi; (c) Injection pressure: 3500 psi; (d) Injection pressure: 4000 psi.
Energies 12 00042 g014
Figure 15. Cumulative condensate recovery for different injection period.
Energies 12 00042 g015
Figure 16. Pressure distribution. (a) Injection time: 50 days; (b) Injection time: 100 days.
Energies 12 00042 g016
Figure 17. Cumulative condensate recovery for different soaking at 3000 injection pressure.
Energies 12 00042 g017
Figure 18. Cumulative condensate recovery for different soaking at 5000 injection pressure.
Energies 12 00042 g018
Figure 19. Pressure distribution near the fracture, injection pressure: 3000 psi; (a) start of soaking time; (b) end of soaking time.
Energies 12 00042 g019
Figure 20. Pressure distribution near the fracture, injection pressure: 5000 psi; (a) start of soaking time; (b) end of soaking time.
Energies 12 00042 g020
Figure 21. Cumulative condensate recovery with and without CO2 diffusion.
Energies 12 00042 g021
Figure 22. Cumulative condensate recovery at different cycle number.
Energies 12 00042 g022
Table 1. Core properties.
Diameter (cm)Length (cm)Permeability (nD)Porosity (%)
3.810.21006.8
Table 2. Reservoir and fluid characteristics.
ParametersValueUnit
Initial Reservoir pressure5000psi
Initial Reservoir Temperature93.3°C
Matrix Permeability0.0001mD
Matrix Porosity0.06-
Fracture Permeability100mD
Table 3. Reservoir fluid composition.
NameComposition
CO20.18
N20.13
CH461.92
C2H614.08
C3H88.35
IC40.97
NC43.41
IC50.84
NC51.48
NC61.79
NC71.58
NC81.22
NC90.94
C10+3.11
Table 4. Different scenarios used in the study of soaking period effect.
ScenarioCase 1Case 2Case 3Case 4Case 5Case 6
Soaking time0 days50 days100 days0 days50 days100 days
Injection pressure3000 psi3000 psi3000 psi5000 psi5000 psi5000 psi

