Article

Investigation on Blending Effects of Gasoline Fuel with N-Butanol, DMF, and Ethanol on the Fuel Consumption and Harmful Emissions in a GDI Vehicle

1
State Key Laboratory of Engines, Tianjin University, Tianjin 300072, China
2
China Petrochemical Sales Limited Oil Technology Research Institute, Tianjin 300170, China
3
College of Mechanical Engineering, Guangxi University, Nanning 530004, China
*
Authors to whom correspondence should be addressed.
Energies 2019, 12(10), 1845; https://doi.org/10.3390/en12101845
Submission received: 21 March 2019 / Revised: 7 May 2019 / Accepted: 13 May 2019 / Published: 15 May 2019

Abstract

:
The effects of three kinds of oxygenated fuel blends—i.e., ethanol-gasoline, n-butanol-gasoline, and 2,5-dimethylfuran (DMF)-gasoline-on fuel consumption, emissions, and acceleration performance were investigated in a passenger car with a chassis dynamometer. The engine mounted in the vehicle was a four-cylinder, four-stroke, turbocharging gasoline direct injection (GDI) engine with a displacement of 1.395 L. The test fuels include ethanol-gasoline, n-butanol-gasoline, and DMF-gasoline with four blending ratios of 20%, 50%, 75%, and 100%, and pure gasoline was also tested for comparison. The original contribution of this article is to systemically study the steady-state, transient-state, cold-start, and acceleration performance of the tested fuels under a wide range of blending ratios, especially at high blending ratios. It provides new insight and knowledge of the emission alleviation technique in terms of tailoring the biofuels in GDI turbocharged engines. The results of our works showed that operation with ethanol–gasoline, n-butanol–gasoline, and DMF–gasoline at high blending ratios could be realized in the GDI vehicle without any modification to its engine and the control system at the steady state. At steady-state operation, as compared with pure gasoline, the results indicated that blending n-butanol could reduce CO2, CO, total hydrocarbon (THC), and NOX emissions, which were also decreased by employing a higher blending ratio of n-butanol. However, a high fraction of n-butanol increased the volumetric fuel consumption, and so did the DMF–gasoline and ethanol–gasoline blends. A large fraction of DMF reduced THC emissions, but increased CO2 and NOX emissions. Blending n-butanol can improve the equivalent fuel consumption. Moreover, the particle number (PN) emissions were significantly decreased when using the high blending ratios of the three kinds of oxygenated fuels. According to the results of the New European Drive Cycle (NEDC) cycle, blending 20% of n-butanol with gasoline decreased CO2 emissions by 5.7% compared with pure gasoline and simultaneously reduced CO, THC, NOX emissions, while blending ethanol only reduced NOX emissions. PN and particulate matter (PM) emissions decreased significantly in all stages of the NEDC cycle with the oxygenated fuel blends; the highest reduction ratio in PN was 72.87% upon blending 20% ethanol at the NEDC cycle. The high proportion of n-butanol and DMF improved the acceleration performance of the vehicle.

1. Introduction

In recent years, in order to alleviate environmental pollution, reduce dependence on petroleum resources, and meet increasingly stringent emission regulations, biofuels have been investigated widely [1] and considered as attractive alternative fuels for gasoline. Ethanol, as a representative biofuel, has the properties of a high octane number, large latent heat of vaporization, and less soot formation tendency in the engine combustion process [2]. Ethanol is the main alternative fuel for SI (spark ignition) engines [3]. Unlike a co-solvent being required when ethanol is blended with diesel [4], ethanol and gasoline are mutually soluble. As a result, there is no requirement for a co-solvent, which means that the production and storage of ethanol–gasoline blended fuel is very convenient and low cost. Compared with ethanol, n-butanol is one of four isomers of butanol, which has a straight-chain structure with the OH at the terminal carbon [5,6]. N-butanol has higher energy density, lower vapor pressure, better compatibility, and lower corrosion to the engine system than that of ethanol [7,8,9]. Similar to n-butanol, the heating value of DMF (2,5-dimethylfuran) is about 15% higher than that of ethanol. The characteristics of DMF include a high boiling point, insolubility in water, good storage stability, etc. [10,11,12]. Meanwhile, DMF has a high research octane number (RON) and consequently a low knock tendency in engines [13,14]. Therefore, both n-butanol and DMF also have been considered as new alternative fuels or fuel additions in SI engines. Furthermore, all the three biofuels-ethanol, n-butanol, and DMF—are relatively easy to obtain and can be processed from waste biomass; thus, the production process has less pollution to the environment.
Ethanol has been already widely used in spark ignition engines along with gasoline, which is due to its high octane number and high volatility. Some scholars have studied the effect of ethanol blending into gasoline on the performance of GDI (gasoline direct injection) engines. In recent years, GDI has been an important innovation of the automotive industry that has been rapidly developed and applied [15]. With respect to the PFI (port fuel injection) engine, the GDI engine has apparent advantages such as better fuel economy, transient response, cold-start emissions due to the precise control and fast response of fuel injection, better mixing with high injection pressure and direct injection in the cylinder, etc. [16,17]. Costa et al. [18] compared the engine performance and emissions of a production four-stroke engine fueled with hydrous ethanol and a gasoline-ethanol fuel blend. The results showed that the BMEP (brake mean effective pressure) was higher when the gasoline-ethanol was fueled at lower engine speeds. Palmer [19] indicated that adding ethanol to gasoline increased the octane number. The results showed that ethanol–gasoline fuel blends containing 10% ethanol improved the engine power by 5%. However, Hsieh et al. [20] pointed out that mixing 5%, 10%, 20%, and 30% ethanol by volume into gasoline increased the fuel consumption due to the low heat value of ethanol. Chen et al. [21] investigated ethanol-gasoline blends of E5, E10, E20, E30, and E40. As far as emissions were concerned, E5 and E10 showed an indistinguishable trend with gasoline (E0), while E20 to E40 obviously decreased HC, CO, and NOX emissions. Costagliola et al. [22] studied the influence of four bioethanol–gasoline blends prepared with 10%, 20%, 30%, and 85% ethanol by volume in gasoline, and CO2 was reduced by 7% when fueled with E85 compared to the gasoline fuel. Stępień et al. [23] investigated a flex-fuel direct-injection vehicle with ethanol-gasoline blend fuels containing 10% or 85% ethanol with special consideration of nanoparticle and non-legislated gaseous emissions. It indicated that nanoparticle emissions from ethanol–gasoline blends of E85 showed the lowest PN (particle number) concentrations. In addition, the emissions of nitrogen dioxide (NO2) and nitrous oxide (N2O) could be found in only negligible amounts. Ericsson et al. [24] also found that an ethanol-gasoline fuel blend with 85% ethanol content (E85) could simultaneously reduce the quantity and quality of particulate emissions in a direct injection engine, and the particulate quality emissions during the cold-start stage would also be significantly reduced.
Butanol has been widely regarded as an alternative fuel to gasoline in recent years. Many scholars have studied the effects of butanol on the performance and emissions of gasoline engines. Karavalakis et al. [25] conducted comparative tests of ethanol–gasoline and n-butanol-gasoline blends at different blending ratios in a direct-injection gasoline engine, and found that high-oxygen fuels could significantly reduce particulate quality emissions. The concentration of particulate quantity generally decreased when the proportion of ethanol and butanol increased. Other researchers observed that the addition of n-butanol could result in shorter ignition delay, faster combustion, better combustion stability, and better emissions, but advancing the spark timing will increase HC and NOX emissions in spite of decreasing CO emissions [26,27,28]. Compared with gasoline, the concentrations of nitrogen oxides either decreased or increased slightly when operated with gasoline–butanol blends and pure n-butanol [29,30]. He et al. [31,32] investigated the combustion and emission characteristics of a HCCI (Homogeneous Charge Compression Ignition) engine fueled with n-butanol-gasoline blends in a single cylinder port fuel injection engine, and found that the indicated mean effective pressure (IMEP) decreased as the n-butanol amount in the blends increased. The presence of n-butanol increased both formaldehyde and acetaldehyde emissions. Venugopal et al. [33] investigated the emission characteristics of gasoline and n-butanol under a dual fuel mode employing a dual-injection system. The results showed that with the proper selection of the fuel ratio, a significant reduction in HC emissions could be achieved compared to operation on neat gasoline. Singh et al. [34] analyzed the technical feasibility of a multi-point port fuel injection SI engine with butanol-gasoline blends of 5%, 10%, 20%, 50%, and 75% n-butanol by volume. The research found that butanol-gasoline blends have slightly higher BSFC (brake-specific fuel consumption) than gasoline. Bata et al. [35] investigated the effects of butanol on the performance of a four-cylinder spark-ignition engine, and found that the thermal efficiency of the fuel with 20% butanol in gasoline was reduced by 2.5%, and the effective fuel consumption rate was increased by 6.5%. Chen et al. [36] also investigated the combustion and performance under stoichiometric combustion conditions with n-butanol-gasoline blends of 15%, 30%, and 50% n-butanol by volume on a turbocharged GDI engine. It indicated that n-butanol-gasoline blends increased the combustion pressure and pressure rise rate, and decreased the ignition delay and combustion duration compared with pure gasoline. A higher n-butanol ratio in fuel blends increased the combustion temperature and brake thermal efficiency, decreased the temperature in the later stage of the expansion stroke, and showed a slightly higher knock possibility in high-load conditions. Furthermore, Chen et al. [37] investigated the thermodynamic process and engine emissions of n-butanol-gasoline blends with 30% and 50% n-butanol by volume. The results showed that the maximum BMEP of the engine was increased to 1.99 MPa with B50. A high ratio of n-butanol increased unburned hydrocarbon (UHC) and CO emissions, but decreased NOX and CO2 emissions. Besides, the group of Yao et al. [38,39,40,41] investigated the effects of the addition of n-butanol by experimental study on diesel engine and laser diagnostics. It can be seen that blending n-butanol can reduce soot emissions, because the oxygenated structure of n-butanol has a higher ability to reduce PAHs (polycyclic aromatic hydrocarbons) and soot.
As a new oxygenated fuel, DMF has also been widely studied worldwide. Christensen et al. [42] investigated the chemical and physical properties of fuel mixtures with the addition of DMF for a spark-ignited engine to determine their feasibility as gasoline alternative fuels. The results showed that blending DMF decreased the vapor pressure and density of the blends, but increased the viscosity. Daniel et al. [43] investigated PFI, GDI, and dual-injected modes in a single-cylinder, four-stroke SI research engine; the results indicated that 25% DMF in gasoline offered higher thermal efficiencies and lower fuel consumption, but also produced higher NO emissions. Rothamer et al. [14] investigated DMF/gasoline blends of 5%, 10%, and 15% DMF by volume. The results showed that slight knocking occurred when an engine was fueled with DMF5. There was no distinctive difference in knock suppression capabilities between DMF10 and DMF15. E10 (ethanol/gasoline blend with 10% ethanol by volume) had a better anti-knock property than DMF10 and DMF15. It was found that DMF exhibited less sensitivity to engine parameters such as combustion phasing, injection timing, and variable valve timing, which meant allowing a wider window for emissions optimization. Daniel et al. [44] investigated the effects of combustion phasing, injection timing, relative air-fuel ratio, and variable valve timing on the performance and emissions of a SI engine using 2,5-dimethylfuran. The results showed that emissions were inherently low, except for NO emissions.
Based on the above discussion, it can be found that blending three biofuels, i.e., ethanol, n-butanol, and DMF into gasoline can improve the performance and emissions of gasoline engines to some extent. However, the existing investigations mainly focused on small blending proportions of ethanol, n-butanol, and DMF into gasoline in spark ignition (SI) engines or vehicles. Therefore, this paper mainly highlighted the effect of high blending ratios of ethanol, n-butanol, and DMF on the fuel consumption, emissions at different vehicle speeds, and acceleration performance. Meanwhile, the steady-state, transient-state, cold-start, and acceleration performance of the tested fuels have been firstly systematically studied in this paper. Considering that the downsizing is the main development direction in SI engines, the tested vehicle is equipped with a direct-injection turbocharged engine. Through comparison and analysis, the research aims to produce knowledge regarding which biofuels can offer better characteristics on combustion and emissions in GDI turbocharged engines.

2. Experimental Apparatus and Methods

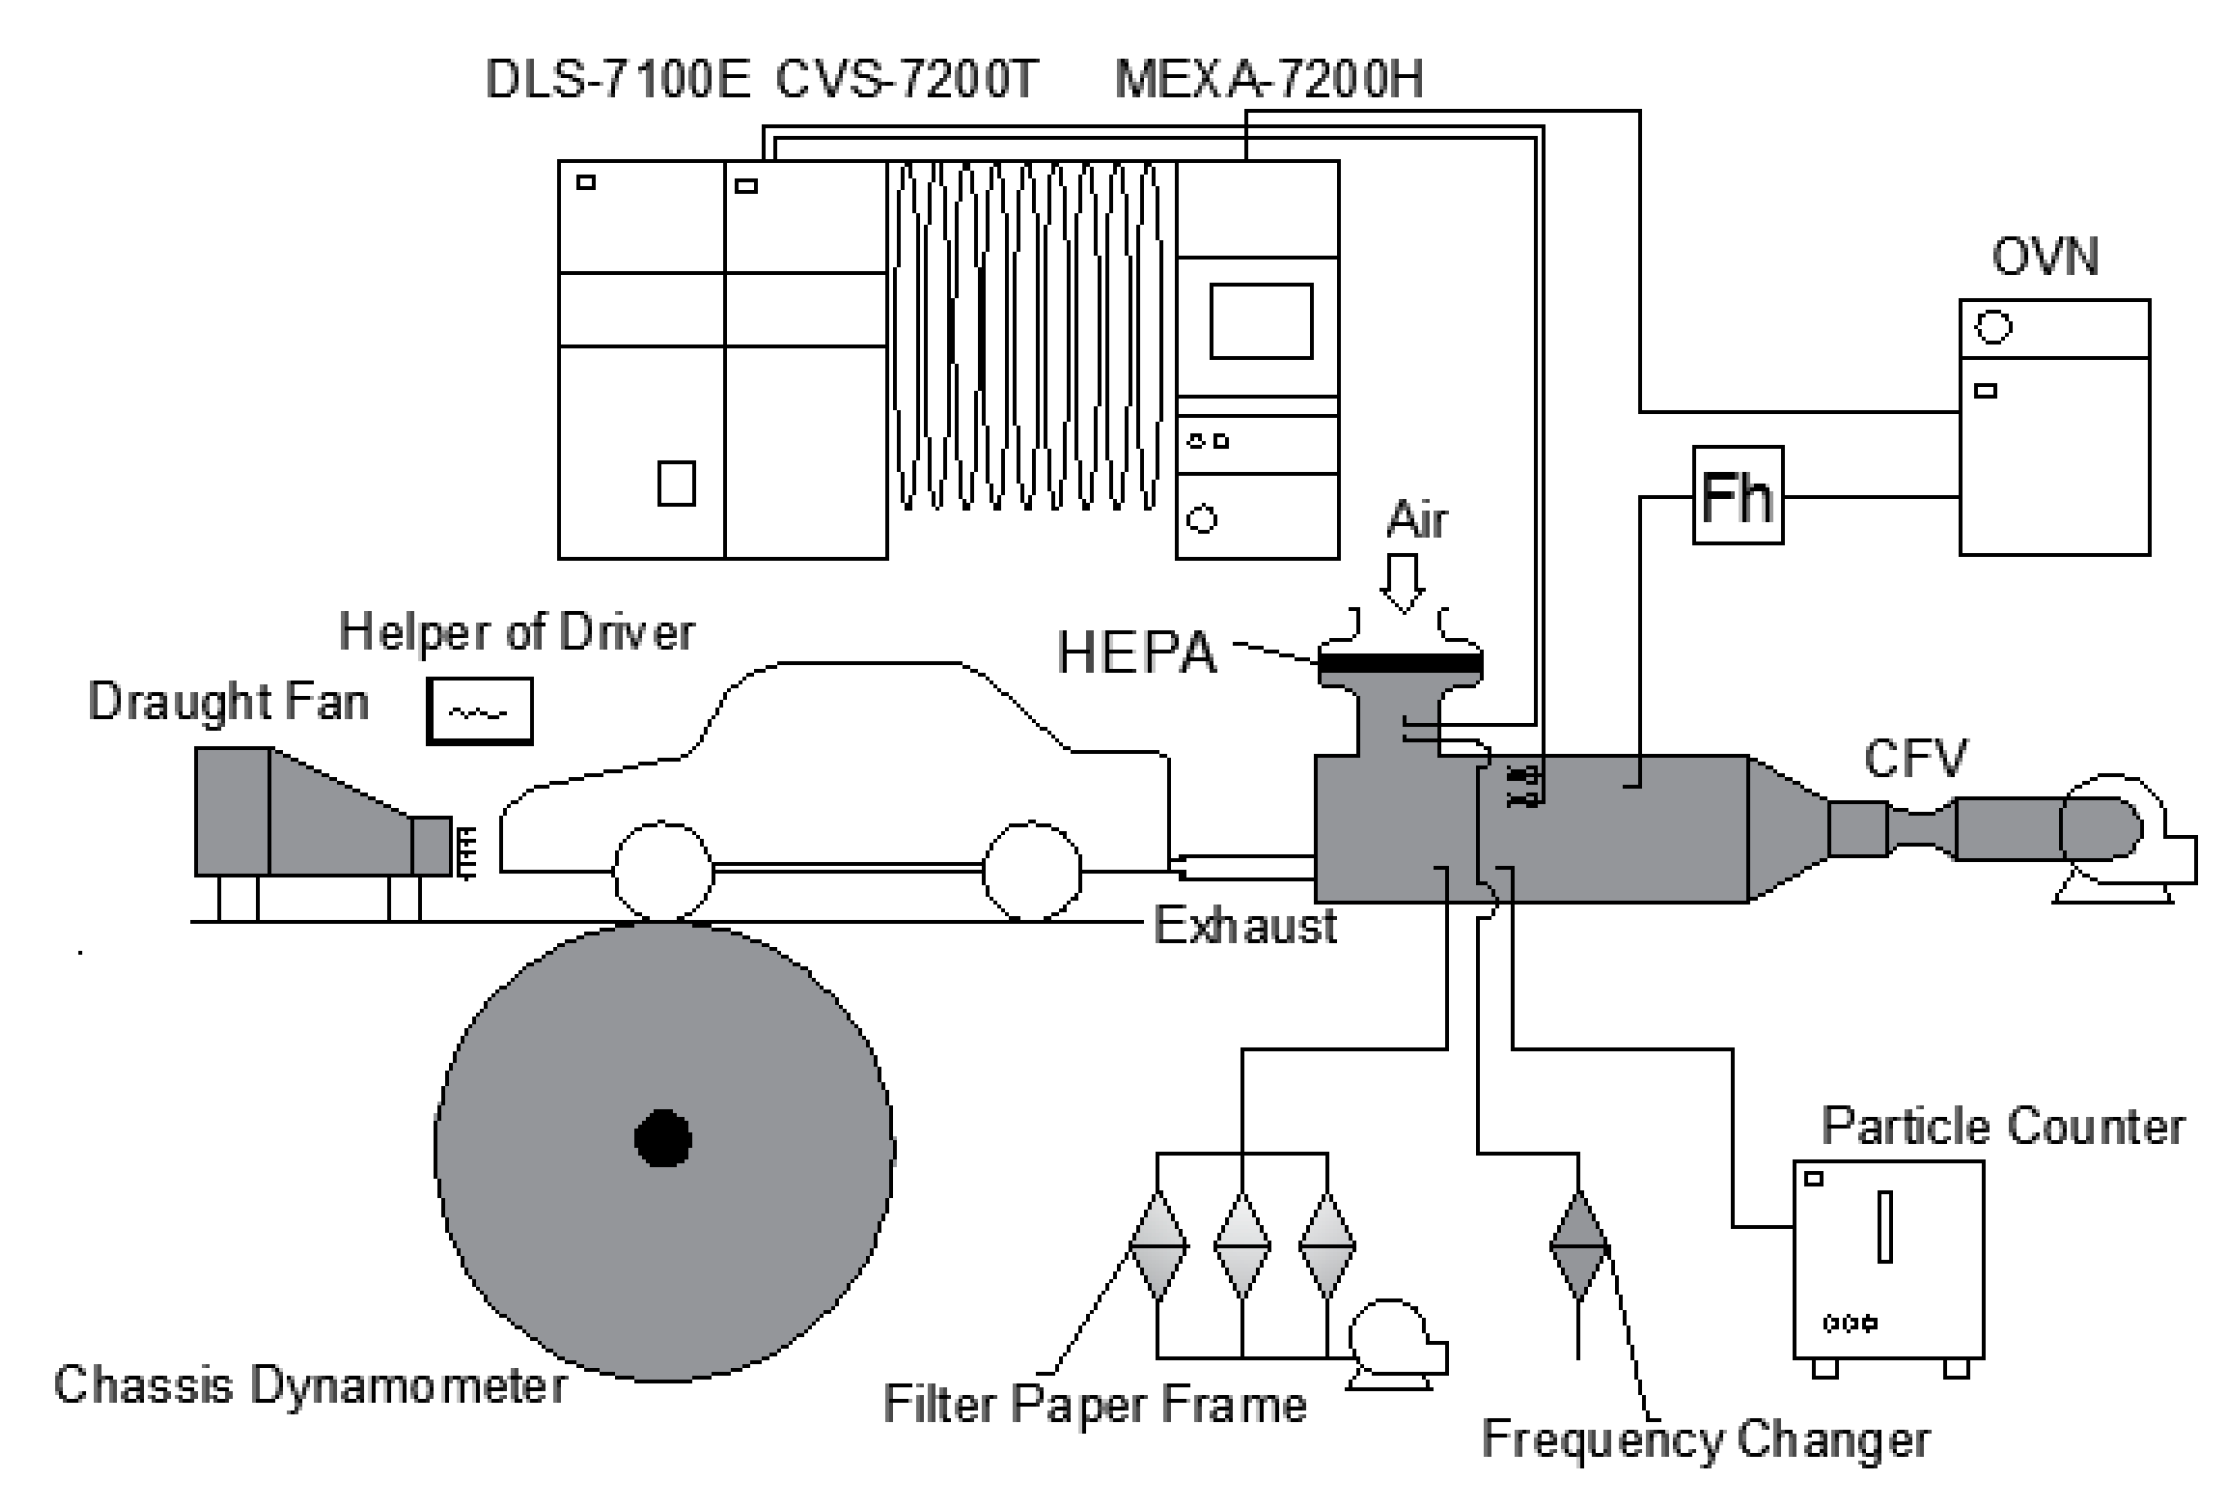
2.1. Experimental Equipment

The test was conducted on a commercial GDI vehicle (manual model of a FAW-Volkswagen BORA 2016, FAW-Volkswagen Automotive Company Ltd, Changchun, Jilin, China). The main technical parameters of the engine of the tested vehicle are shown in Table 1. The accumulated mileage of the GDI vehicle before the test was 500 km, and the vehicle was in good operation condition. The experiment was performed on a chassis dynamometer test bench, and the schematic diagram of the test bench is shown in Figure 1. The car simulated the actual road operating conditions on the chassis dynamometer. The exhaust gas passed through the dilution channel, which introduced air to dilute the exhaust gas so as to simulate the condition of the vehicle exhaust into the atmosphere. The concentration of the diluted exhaust gas was continuously measured with the emission analyzer during the test. Meanwhile, a part of the diluted exhaust gas with a fixed flow rate was collected in the gasbag, and was analyzed to quantify the concentration of the components in the exhaust gas after the end of the test cycle. The fuel consumption was also calculated with the exhaust components and their concentrations in the gasbag. The emission analyzer employed in current study was a Horiba MEXA-7200H (HORIBA Ltd, Kyoto, Japan); the full-flow dilution sampling system was a Horiba CVS-7200T (HORIBA Ltd, Kyoto, Japan), and the dilution channel was a Horiba DLS-7100E (HORIBA Ltd, Kyoto, Japan). CO2, total hydrocarbon (THC), CO, and NOX emissions were tested by an emission analyzer. PN emissions were measured by a MEXA-2000SPCS (HORIBA Ltd, Kyoto, Japan) particle counter. The measuring principle of the MEXA-2000SPCS is laser scattering condensation particle counting. The measured solid particles were between 23 nm and 2.5 um. The counting efficiency of 23-nm solid particles was 50% ± 12%, and the counting efficiency of 41-nm solid particles was 90% or above. The particulate matter (PM) were collected by filter paper and then weighed by precision electronic balance (MSE6.6S-000-DF, Sartorius Ltd, Gottingen, Germany). Table 2 shows the major equipment used in this study. Table 3 shows the measurement errors of the major instruments and equipment.

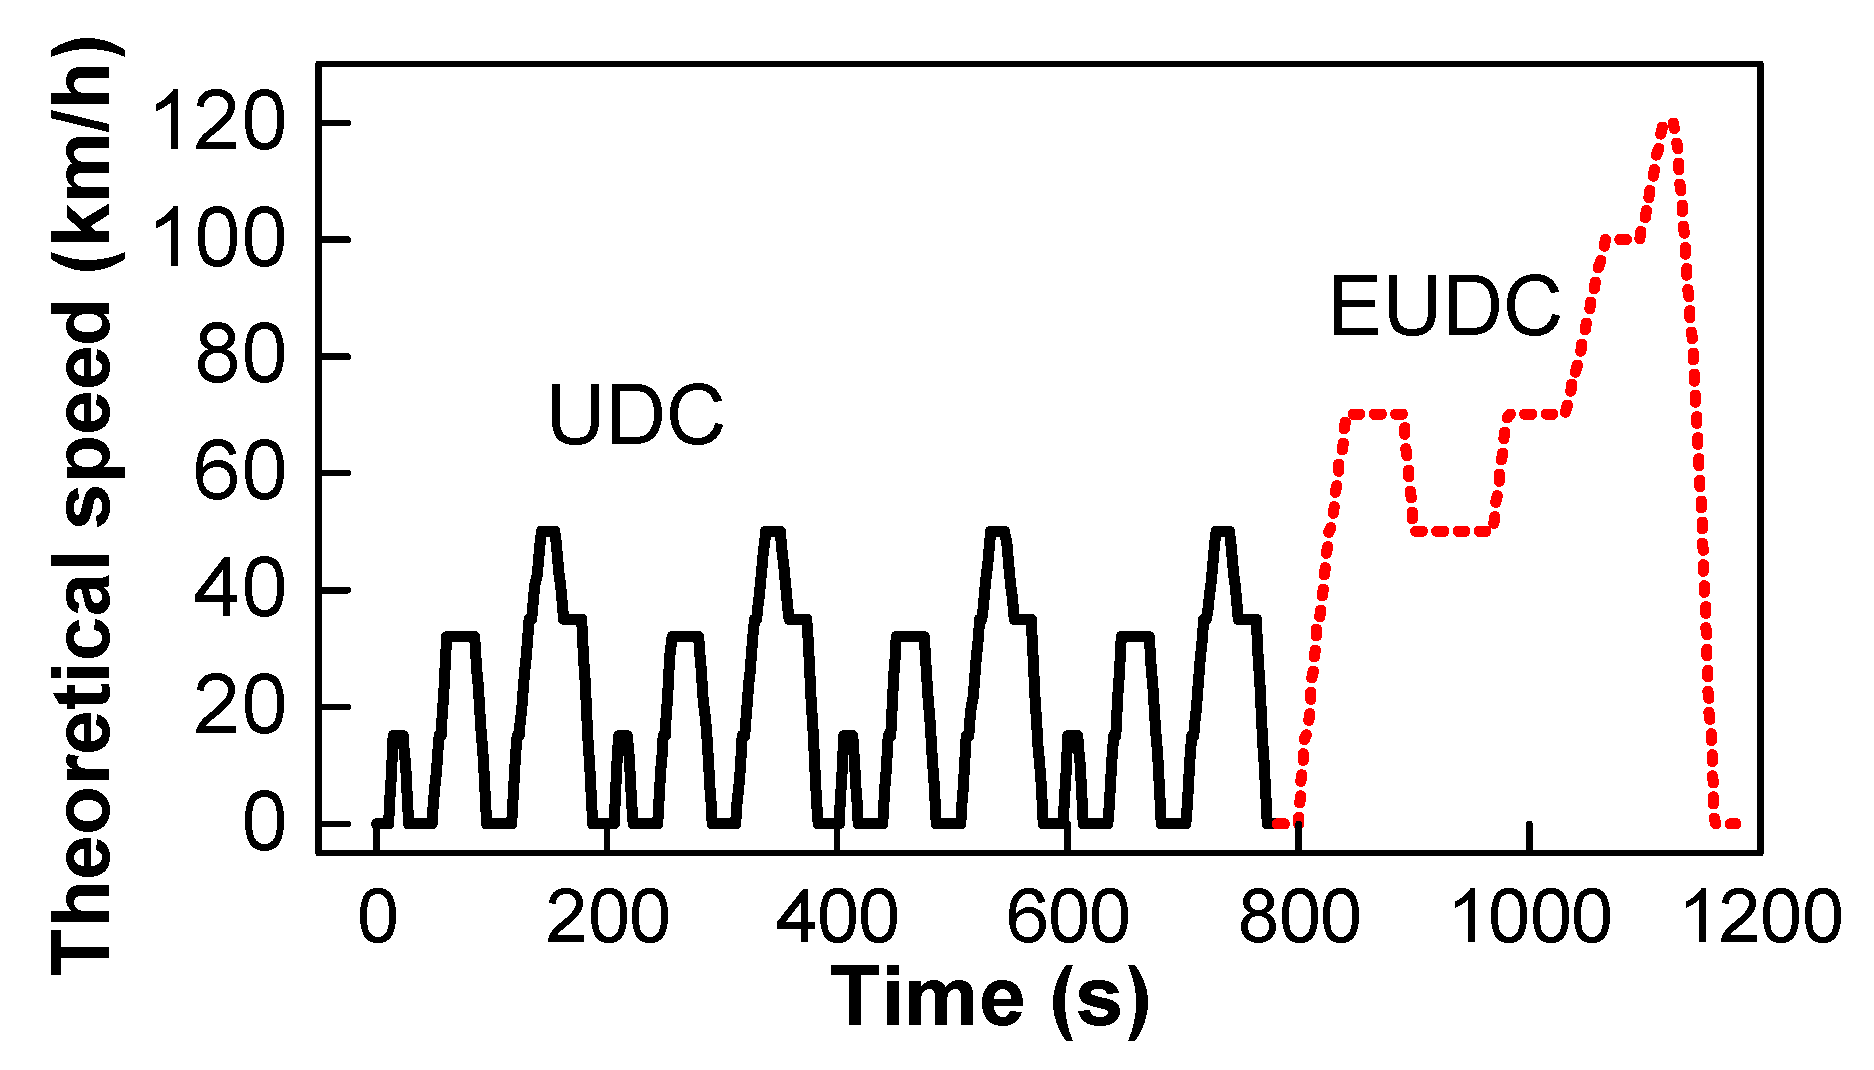
2.2. Experimental Methods

The New European Drive Cycle (NEDC) was chosen as the test cycle in this study. The entire NEDC cycle is divided into an Urban Drive Cycle (UDC) and Extra-Urban Drive Cycle (EUDC). The speed of the UDC operating condition is lower compared with that of the EUDC operating condition, and a similar trend is shown in the engine temperature. The vehicle speed of the NEDC cycle is shown in Figure 2. To evaluate the emissions and fuel economy of various fuels under different operating conditions, six steady-state vehicle speeds, including 0 km/h, 15 km/h, 40 km/h, 65 km/h, 90 km/h, and 120 km/h were tested. The emission analyzer sampled exhaust gas for 100 seconds at each vehicle speed. Before measurement, the vehicle speed was allowed to stabilize for 20 seconds to ensure stable operation. In order to avoid the influence of the after-treatment device and highlight the impact of different fuels on emissions, the three-way catalytic converter of a GDI car was disabled before the test without affecting the exhaust pressure of the vehicle. The air–fuel ratio was controlled by the lambda sensor, and the calibration data of this production vehicle did not change, which the vehicle ran naturally with different experimental fuels in order to evaluate the adaptability of various tested oxygenated fuels to the existing vehicle.
The car acceleration performance was used to evaluate the impact of different fuels on the power performance of the vehicle. Since the GDI vehicle used in this test adopts a manual transmission, in order to eliminate the error caused by the shift process, each gear was measured separately. The starting speed of each gear shift lever referred to the minimum speed at which the engine operated stably, while the maximum speed referred to the highest speed and the extreme point of the acceleration curve of the vehicle at that gear shift lever. Accordingly, the speed of the third gear was 30–65 km/h, that of the fourth gear was 40–80 km/h, and that of the fifth gear was 60–110 km/h. Each acceleration test was performed at least four times.
To ensure the reliability of the data, the tire pressure during the test was maintained at 2.25–2.3 bar, and the lubricant, air filter, and oil filter of the vehicle were replaced periodically. Once the tested fuel was changed, the fuel tank and pipe needed to be drained and cleaned thoroughly with the next set of fuel, and a new fuel filter was replaced. Then, the vehicle was operated at a speed of 70–90 km/h for more than 20 min with the new test fuel to eliminate the interference of the previous test fuel on the test results.

2.3. Test Fuels

The test fuels were fuel blends of gasoline and oxygenated fuels including ethanol, n-butanol, and 2,5-dimethylfuran, i.e., gasoline was blended with each oxygenated fuel in a certain volume ratio. The gasoline was bought from a Shell gas station with the research octane number (RON) of 93.1; there was no ethanol addition, and oxygen content was below 0.82%. Three oxygenated fuels-ethanol, n-butanol, and DMF—were bought from Tianjin Yuanli Chemical Engineering Limited Company, and their purities were all higher than 99%. The volume percentage of oxygenated fuels in the fuel blends was set to 20%, 50%, 75%, and 100%. Table 4 shows the physicochemical properties of the three oxygenated fuels as well as gasoline. Table 5 shows the key fuel blends’ properties. The octane number, density, and latent heat of vaporization of each oxygenated fuel were higher than those of gasoline. However, the lower heating value of each oxygenated fuel was lower than that of gasoline. In the following, simple signs will be used to designate various types of blended fuels. The form of sign was oxygenated fuel abbreviation and volumetric percentage, among which the abbreviation of ethanol, n-butanol, and 2,5-dimethylfuran were E, B, and D, respectively. Following such a rule, E20 represented the ethanol-gasoline blends with an ethanol volume percentage of 20%, and so on.

3. Results and Discussions

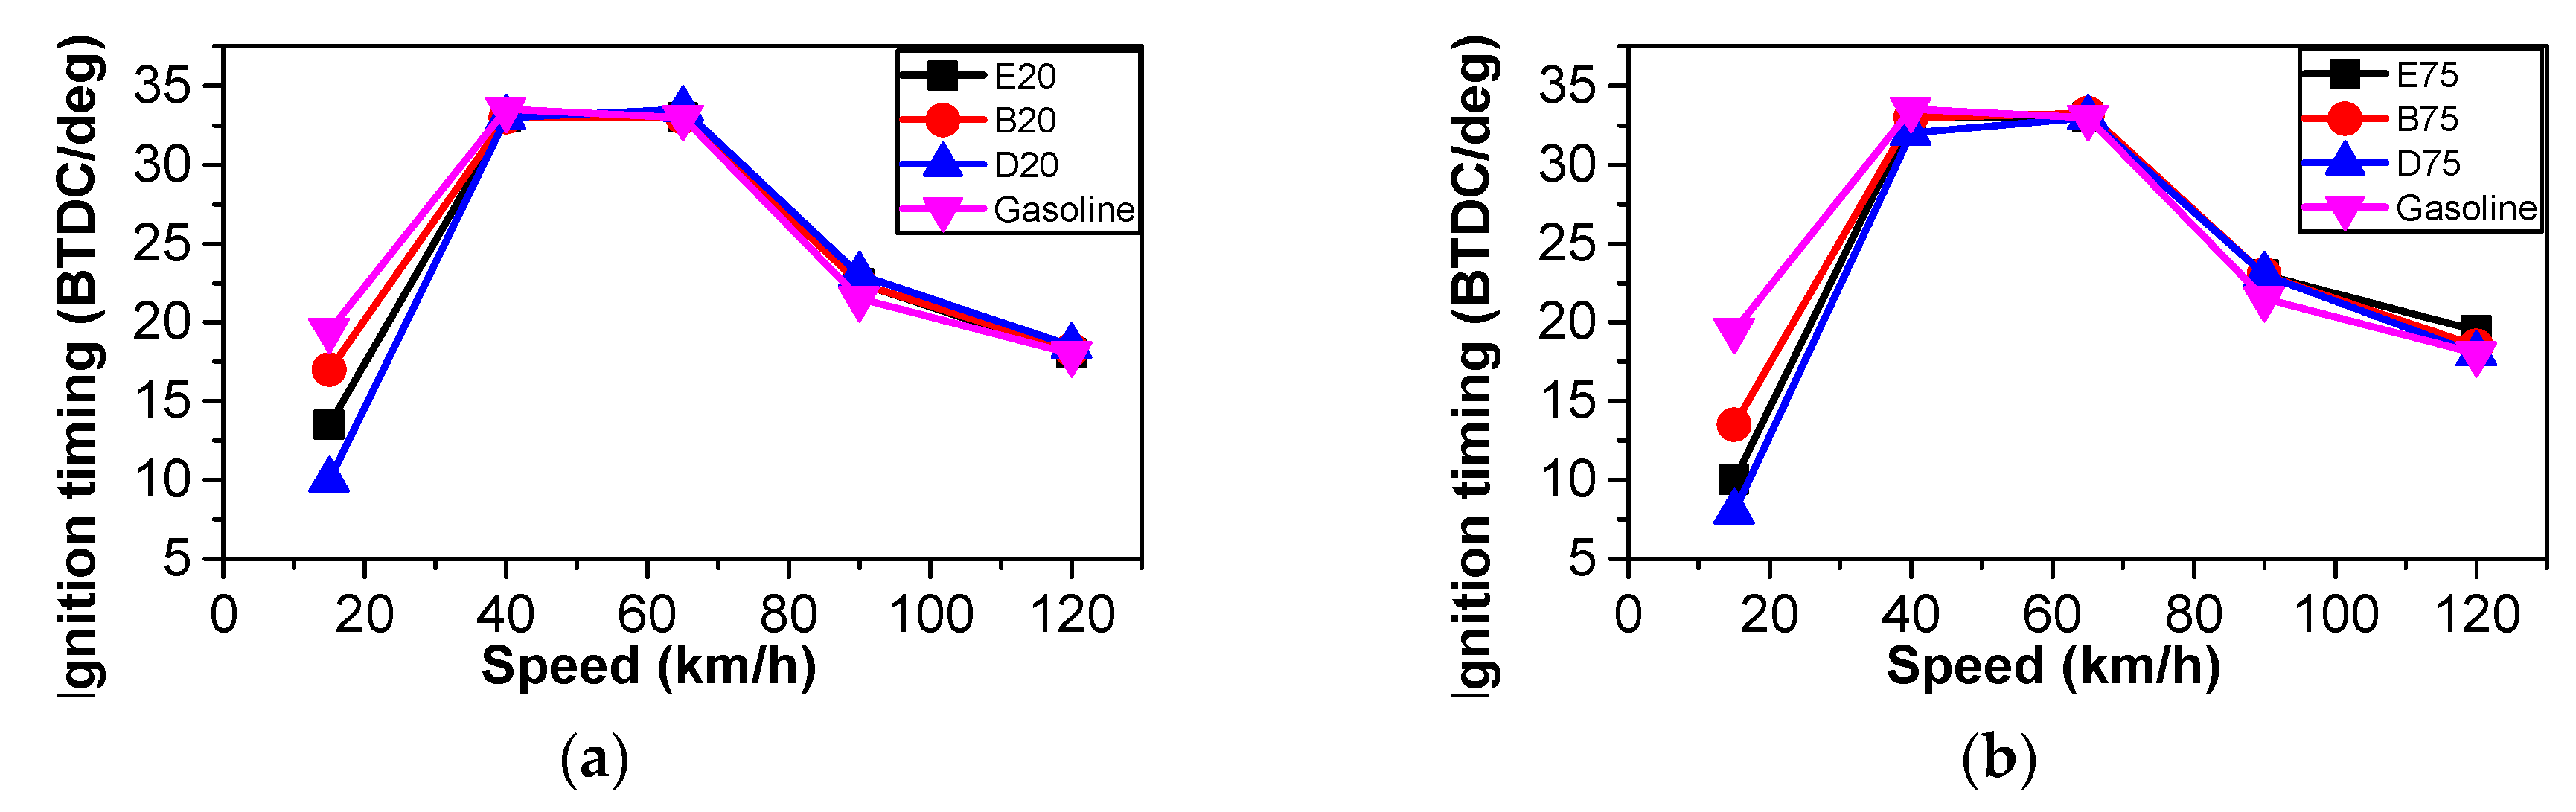
3.1. Ignition Timing Comparison

Figure 3 shows the ignition timing of three kinds of blended fuels-ethanol-gasoline, n-butanol-gasoline, and DMF-gasoline, at the blending ratios of 20% and 75%; the results of pure gasoline are presented for comparison as well. The ignition timing has a direct influence on combustion in the cylinder, which consequently shows a great influence on the performance of the engine. As the vehicle speed increases from 15 km/h to 120 km/h, the ignition timing first advances; then, it stays basically the same, and finally retards. The retardation of the ignition timing may be to ensure the high catalytic efficiency of the three-way catalytic converter and control the emissions at the low speed of 15 km/h; meanwhile, the low turbulent intensity restrains the reactivity of fuels and the laminar flame speed at a low speed of 15 km/h, which may make the ignition timing retard. The combustion speed is faster at a high speed of 120 km/h, and the accumulation of ignition delay will be much less than that at a lower engine speed, so the ignition timing should be retarded. The ignition timings of ethanol-gasoline, n-butanol-gasoline, and DMF-gasoline all retard compared to that of pure gasoline at the low speed of 15 km/h; in addition, as the blending ratios of ethanol, n-butanol, and DMF increase, the ignition timings of them retard more. Studies have shown that the combustion durations of DMF, ethanol, and n-butanol are shorter than those of gasoline under the same ignition timing; in addition, the higher in-cylinder temperature of DMF increases the burning speed rate [46], so the ignition timings of ethanol-gasoline, n-butanol-gasoline, and DMF—gasoline retard may be to ensure a similar combustion phase with gasoline. However, the ignition timings of ethanol-gasoline, n-butanol-gasoline, and DMF-gasoline slightly advance compared to that of gasoline at high speed. This may be due to the high octane number of DMF, ethanol, and n-butanol, and the high laminar flame burning speed of ethanol and n-butanol.

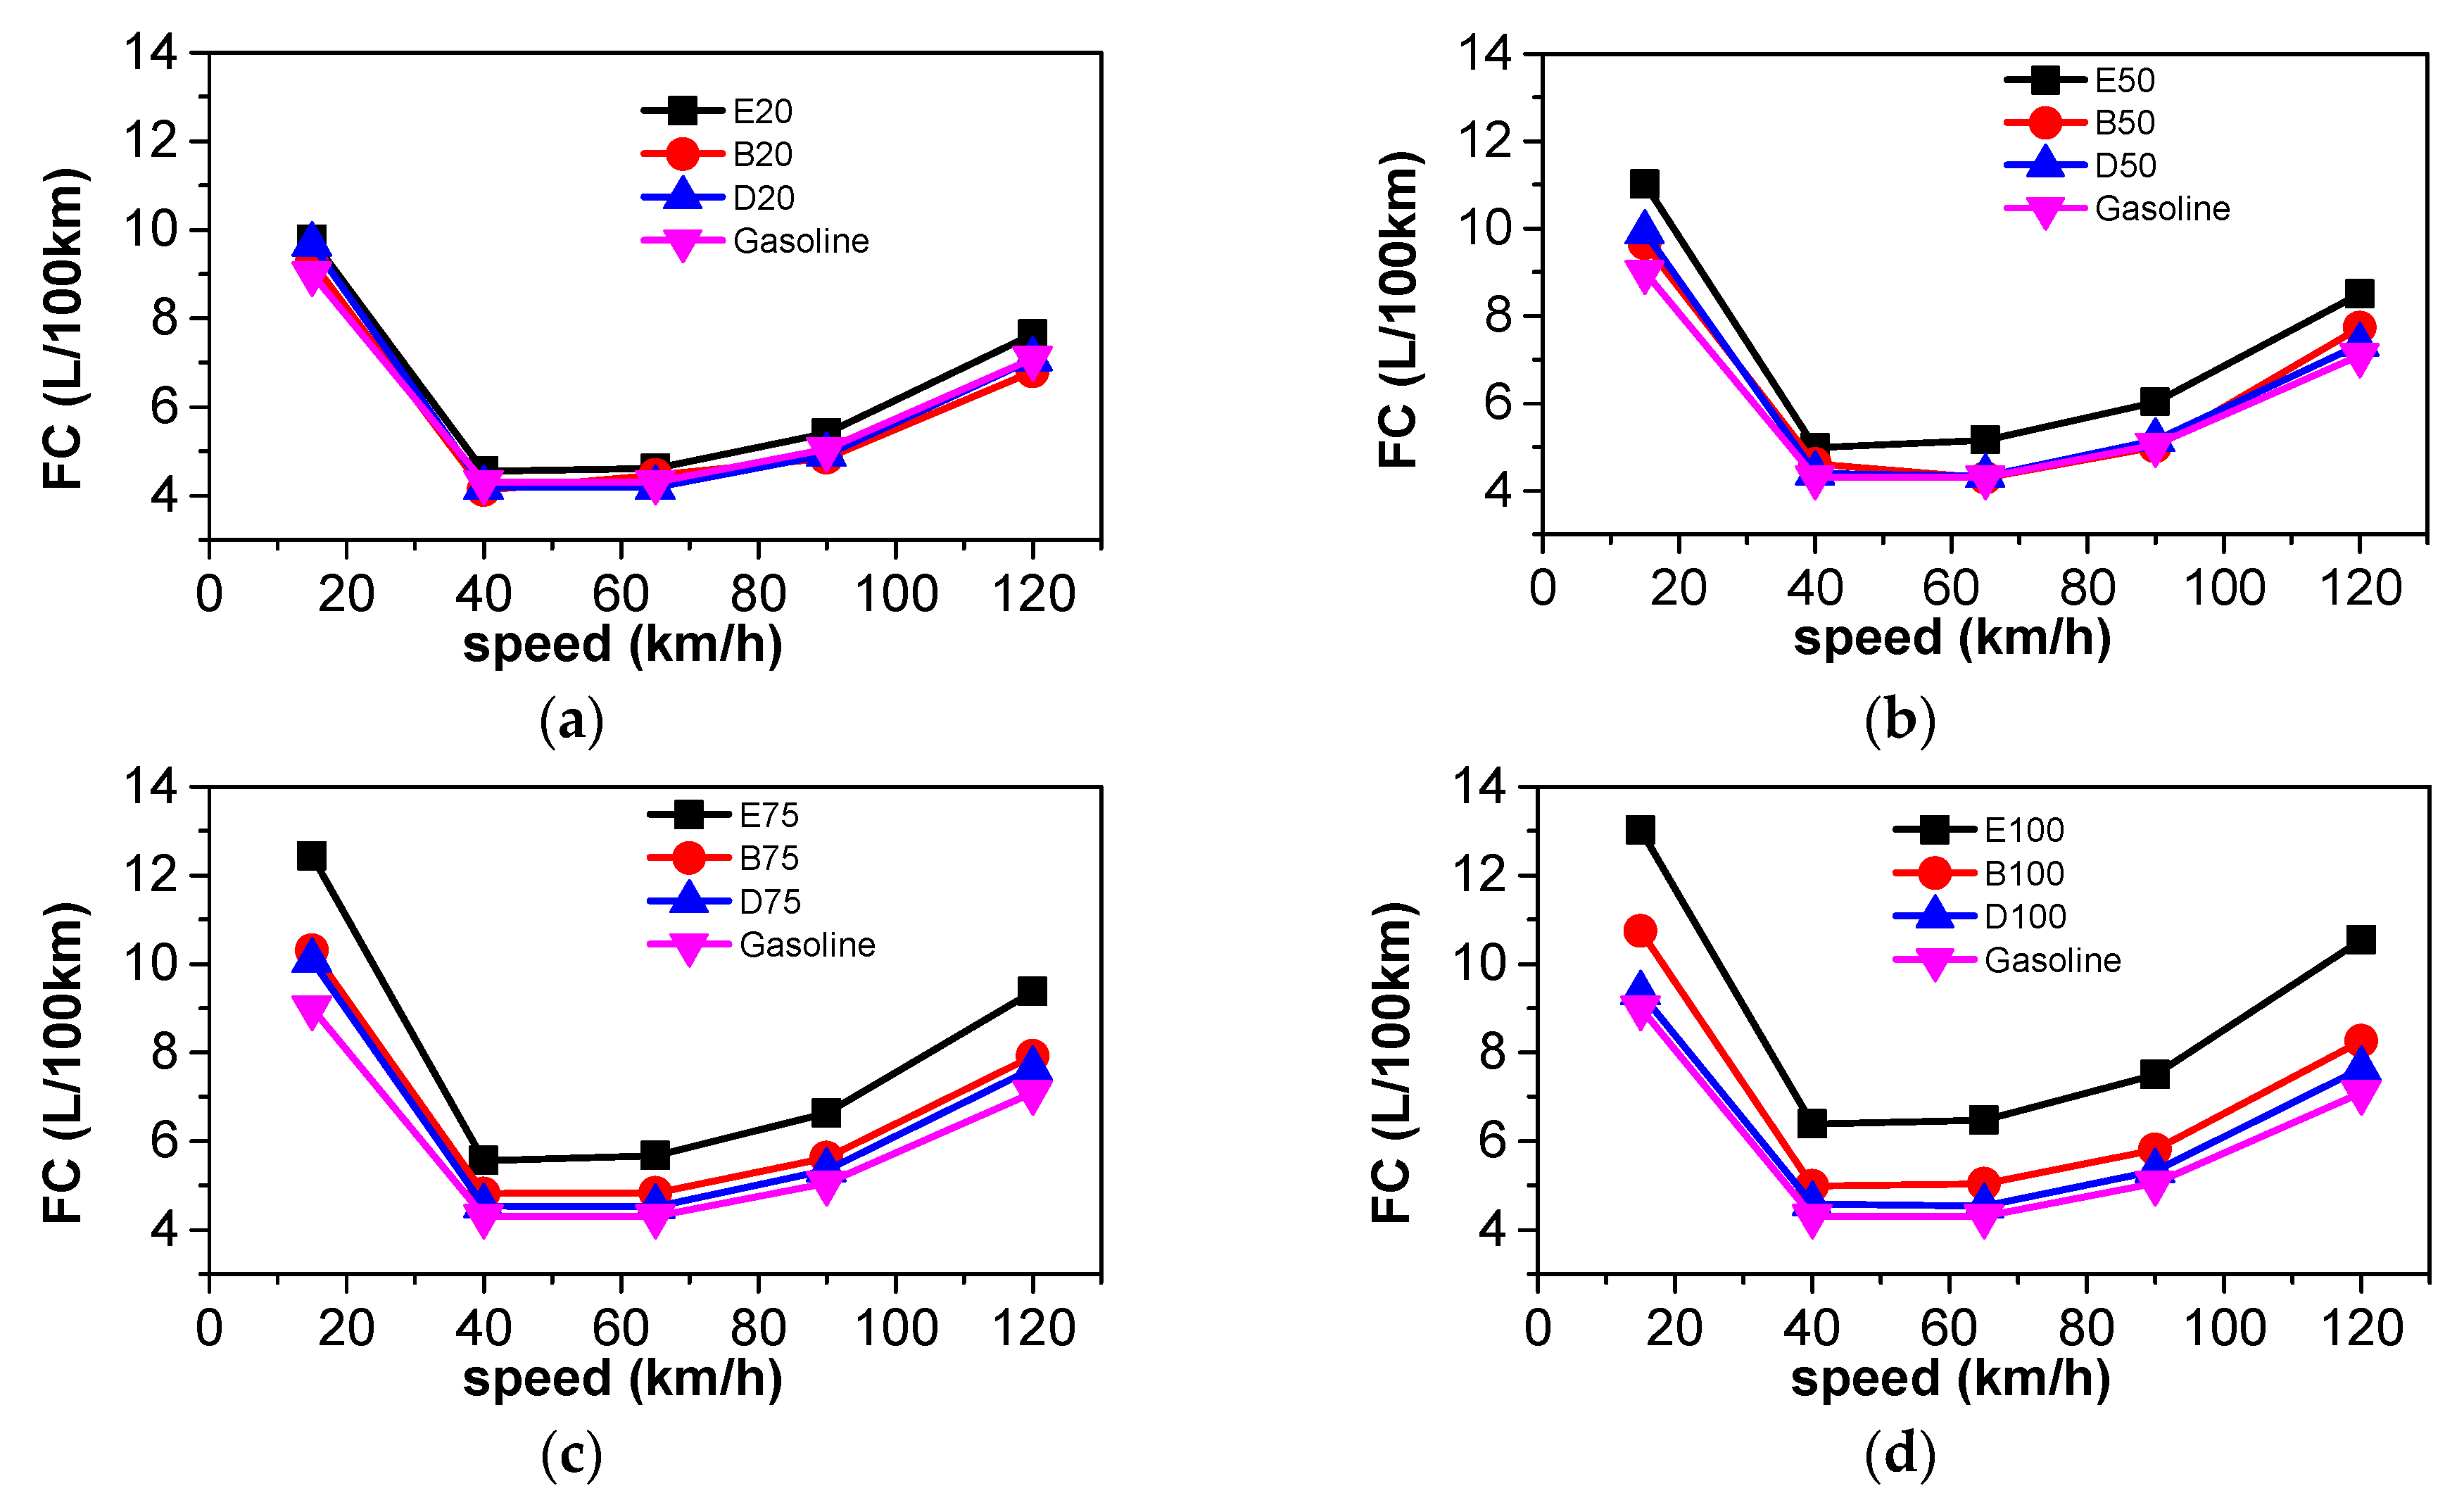
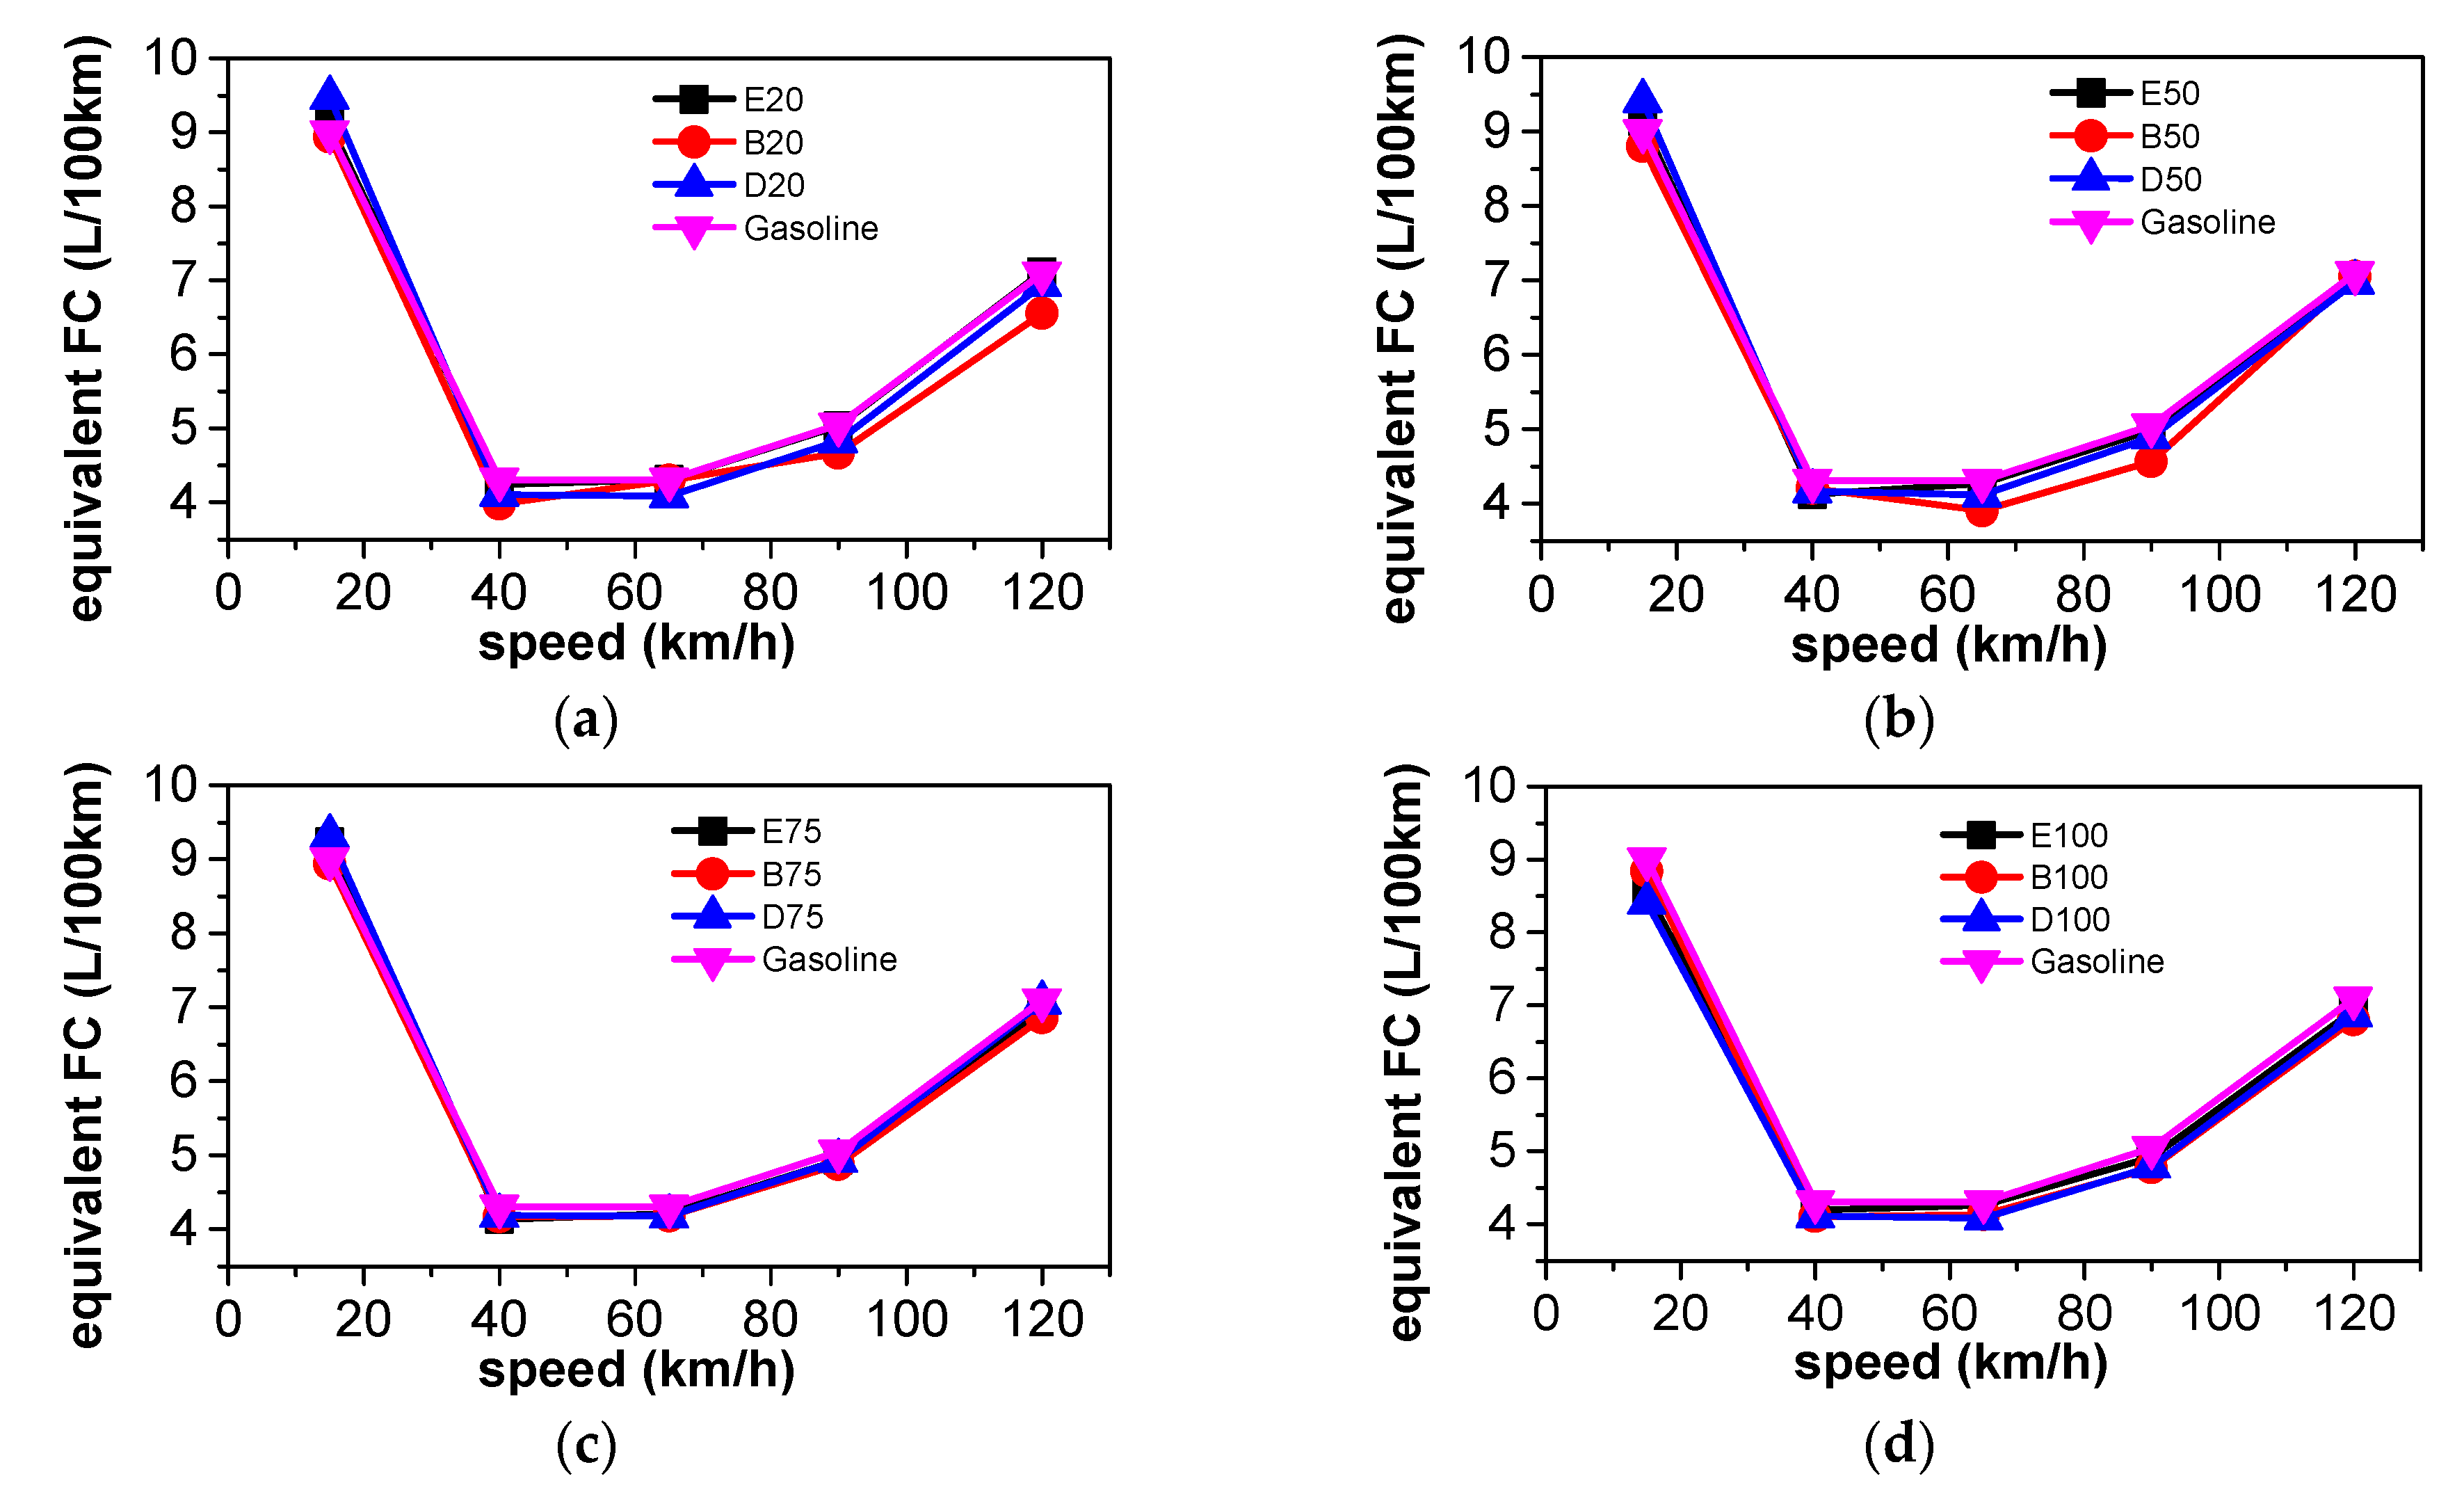
3.2. Energy Consumption Comparison

Figure 4 shows volumetric fuel consumption of ethanol-gasoline, n-butanol-gasoline, and DMF-gasoline at the blending ratios of 20%, 50%, 75%, and 100%. Similar to CO2 emissions, the commonality of the four curves is that the volumetric fuel consumption is higher at a low vehicle speed of 15 km/h. As the vehicle speed increases, the volumetric fuel consumption decreases firstly; then, it increases and remains at the lowest level when the vehicle speed increases from 40 to 65 km/h for each fuel. This takes place because the weak airflow at low speed results in a low flame propagation speed and high heat loss, which contributes to the low thermal efficiency and high volumetric fuel consumption. At high speed, the low degree of constant volume combustion due to the increasing crank angle of combustion and sometimes incomplete combustion cause low thermal efficiency and high volumetric fuel consumption. Meanwhile, the air resistance is greater at high speed, which creates high volumetric fuel consumption. The volumetric fuel consumptions of the ethanol-gasoline blended fuels are higher than that of pure gasoline at all the four blending ratios. As the proportion of ethanol increases, the volumetric fuel consumption also increases accordingly, which is mainly attributed to the lower heating value of ethanol. For n-butanol-gasoline, the volumetric fuel consumption is almost at the same level of gasoline with 20% and 50% blending ratios. However, when the blending ratio is increased further, the volumetric fuel consumption increases gradually compared with gasoline. The lower heating value of n-butanol is lower than that of gasoline. Therefore, more n-butanol is required to release the same amount of heat, which is the main reason for the increased volumetric fuel consumption of n-butanol–gasoline. While in the case of the smaller blending ratios of 20% and 50%, since the latent heat of vaporization of n-butanol is higher than that of gasoline, the temperature in the cylinder is lower, which reduces the heat loss. Meanwhile, the oxygen in n-butanol promotes combustion and improves the efficiency. These two factors are beneficial for the reduction in fuel consumption and compensate for the impact of the reduction in the lower heating value of n-butanol, so the fuel consumptions of n-butanol–gasoline at low blending ratios are similar to that of gasoline. Regarding DMF-gasoline, there is only a small effect on volumetric fuel consumption compared with gasoline at various blending ratios. The main reason is that the lower heating value of DMF is slightly lower than that of gasoline, while it is the highest among the three oxygenated additions. When taking all the test fuels into consideration, the volumetric fuel consumption of ethanol-gasoline is the highest among the test fuels. The volumetric fuel consumption of n-butanol-gasoline and DMF-gasoline are similar to that of pure gasoline at both 20% and 50% blending ratios, but higher than that of pure gasoline at 75% and 100% blending ratios. The addition of DMF has better volumetric fuel consumption than that of the addition of ethanol and n-butanol.
Figure 5 shows the equivalent fuel consumption of three kinds of blended fuels-ethanol-gasoline, n-butanol–gasoline, and DMF-gasoline at blending ratios of 20%, 50%, 75%, and 100%, respectively. The equivalent fuel consumption is defined as the equivalent gasoline consumption calculated with the lower heating value of each fuel. It is calculated by the following Formula (1):
EFCfuel = FCfuel × LHVfuel/LHVG
where EFCfuel, FCfuel, and LHVfuel are the equivalent fuel consumption, volumetric fuel consumption, and lower heating value of a blended fuel; LHVG is the lower heating value of gasoline.
The definition of equivalent fuel consumption can provide an insight into the efficiency of combustion by eliminating the effect of the variation in the heating values of different fuels on the fuel consumption. It can be seen clearly that the effect of blending various proportions of oxygenated fuels on the equivalent fuel consumption is fairly small. Similar to the above-mentioned trend (Figure 4), for all the test fuels, the equivalent fuel consumption is higher at low speed. As the vehicle speed increases, the equivalent fuel consumption decreases firstly, and then increases. The high equivalent fuel consumption at low speed is mainly due to the severe throttling loss. The equivalent fuel consumption of ethanol–gasoline is the same as that of pure gasoline, which may be due to the increase of flame propagation speed improving the combustion efficiency for ethanol; however, the higher latent heat of vaporization of ethanol reduces the combustion efficiency. Oxygen and the lower latent heat of vaporization of butanol improve the combustion process, resulting in the higher combustion efficiency of butanol compared to that of pure gasoline. When the blending ratios are up to 75% and 100%, DMF exhibited a slightly better equivalent fuel consumption. Although the laminar flame burning speed of DMF is slightly lower than that of gasoline, the high-octane value of DMF allows slightly advanced ignition and combustion at 65 km/h and 90 km/h, as shown in Figure 3, which can make combustion closer to the top dead center and increase the degree of constant volume combustion. Similar results can also be found in previous studies [14,47]. In summary, at the same speed, different fuel components show very small effects on the equivalent fuel consumption, meaning that the thermal efficiency of the different fuels are similar.
Figure 6 shows the CO2 emissions of three kinds of blended fuels-ethanol-gasoline, n-butanol-gasoline, and DMF-gasoline, at the blending ratios of 20%, 50%, 75%, and 100%; the results of pure gasoline are also presented for comparison. The commonality trend for all the test fuels is that the CO2 emissions are the highest at the low speed of 15 km/h. As the vehicle speed increases, CO2 emissions decrease firstly, and then increase. The CO2 emissions are the lowest when the vehicle speed is in the range of 40 to 65 km/h. The CO2 emissions at a vehicle speed of 120 km/h are smaller than those at a vehicle speed of 15 km/h. This can be explained by the fuel consumption, because the CO2 emissions are positively correlated with it. For n-butanol-gasoline blends, the CO2 emissions at various n-butanol blending ratios are lower than those of gasoline. One reason is that the ratio of carbon atoms to the energy of n-butanol is lower; releasing the same amount of heat produces less CO2. In addition, as shown in Figure 5, the equivalent fuel consumption of n-butanol is lower than that of gasoline, because the oxygen content in n-butanol can promote combustion, enhance the combustion efficiency, and improve the thermal efficiency, which results in lower equivalent fuel consumption and less CO2 formation. The CO2 emissions of DMF-gasoline with a 20% DMF fraction remain almost at the same level as that of gasoline. However, at larger blending proportions, the CO2 emissions of DMF-gasoline become higher than gasoline due to the larger ratio of carbon atoms to the energy of DMF. For ethanol-gasoline fuel blends, the CO2 emissions are slightly lower those of pure gasoline. The theoretical calculation of ethanol can reduce CO2 emissions due to its lower ratio of carbon atoms to the energy compared with that of gasoline. However, meanwhile, the larger latent heat of vaporization and the surface tension of ethanol may reduce the in-cylinder temperature, deteriorate the fuel atomization and evaporation, and have negative impacts on the combustion and fuel efficiency. Therefore, combining the influence of the two aspects mentioned, the differences in CO2 emissions between ethanol–gasoline blends and pure gasoline are very small. Taking all the test fuels into consideration, the DMF-gasoline fuel blends show the highest CO2 emissions, and the higher the blending ratio of DMF is, the greater the presented difference in CO2 emissions. The CO2 emissions of n-butanol-gasoline and ethanol-gasoline are slightly lower than those of pure gasoline.

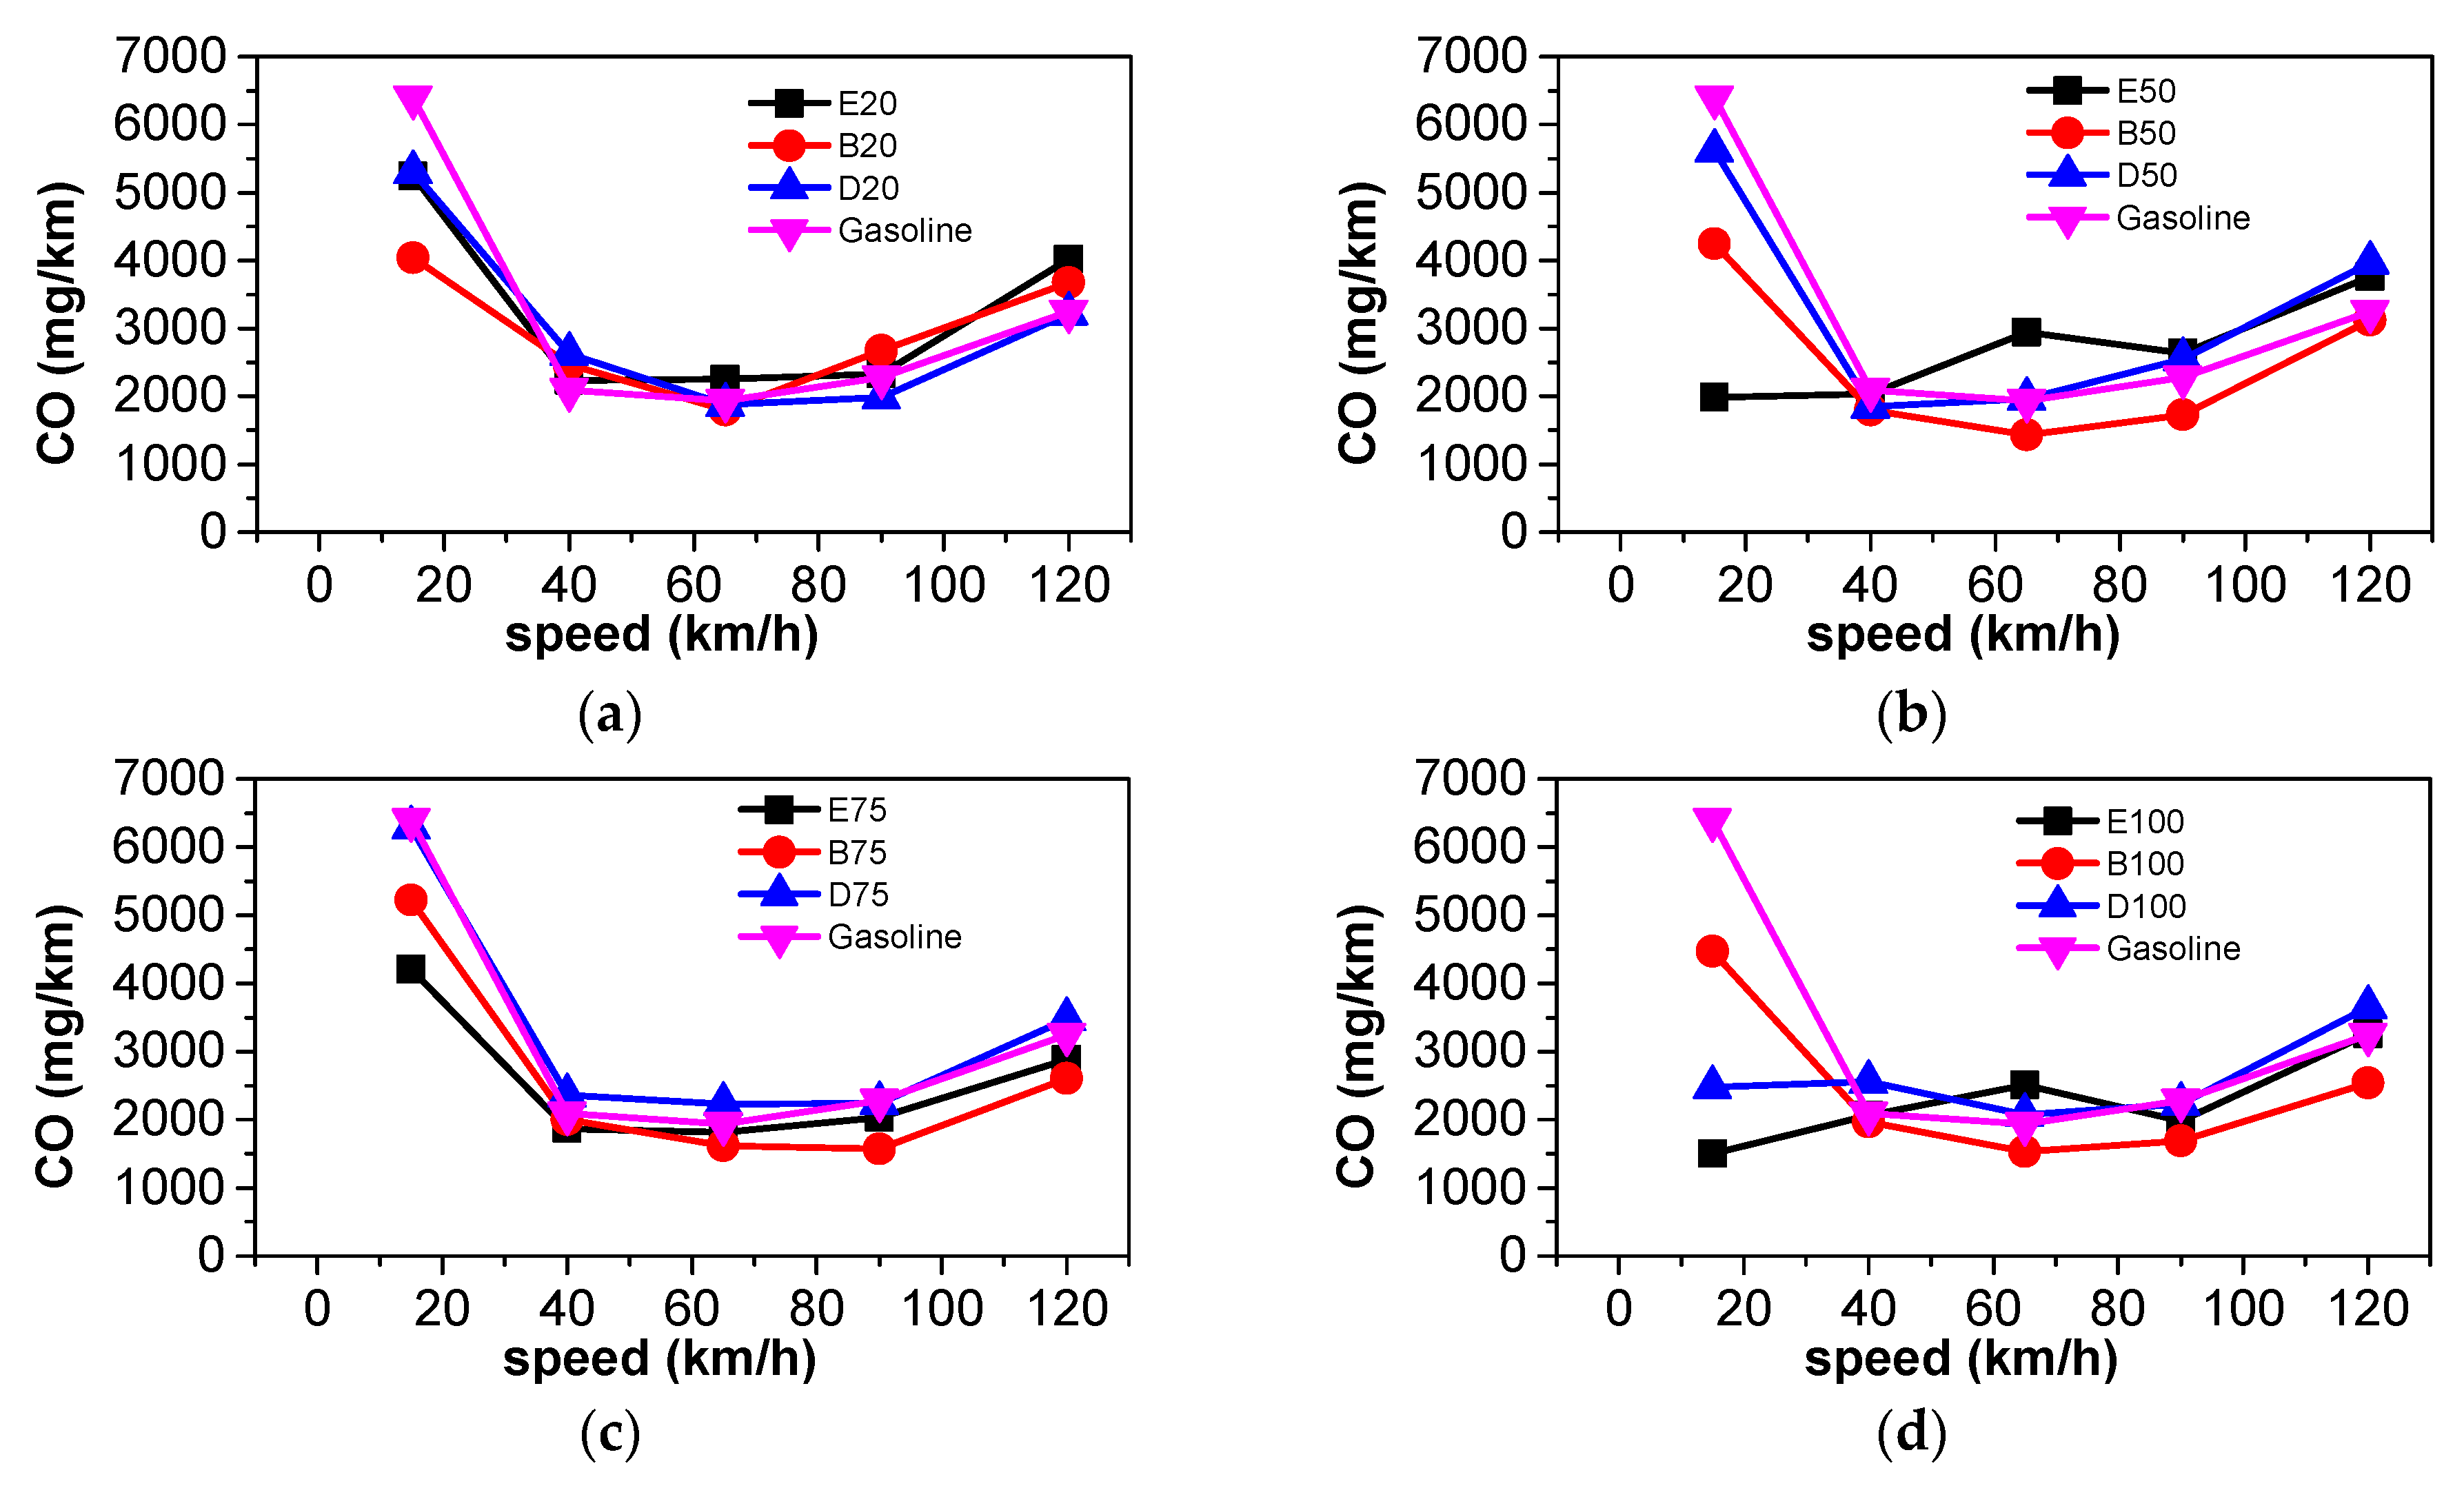
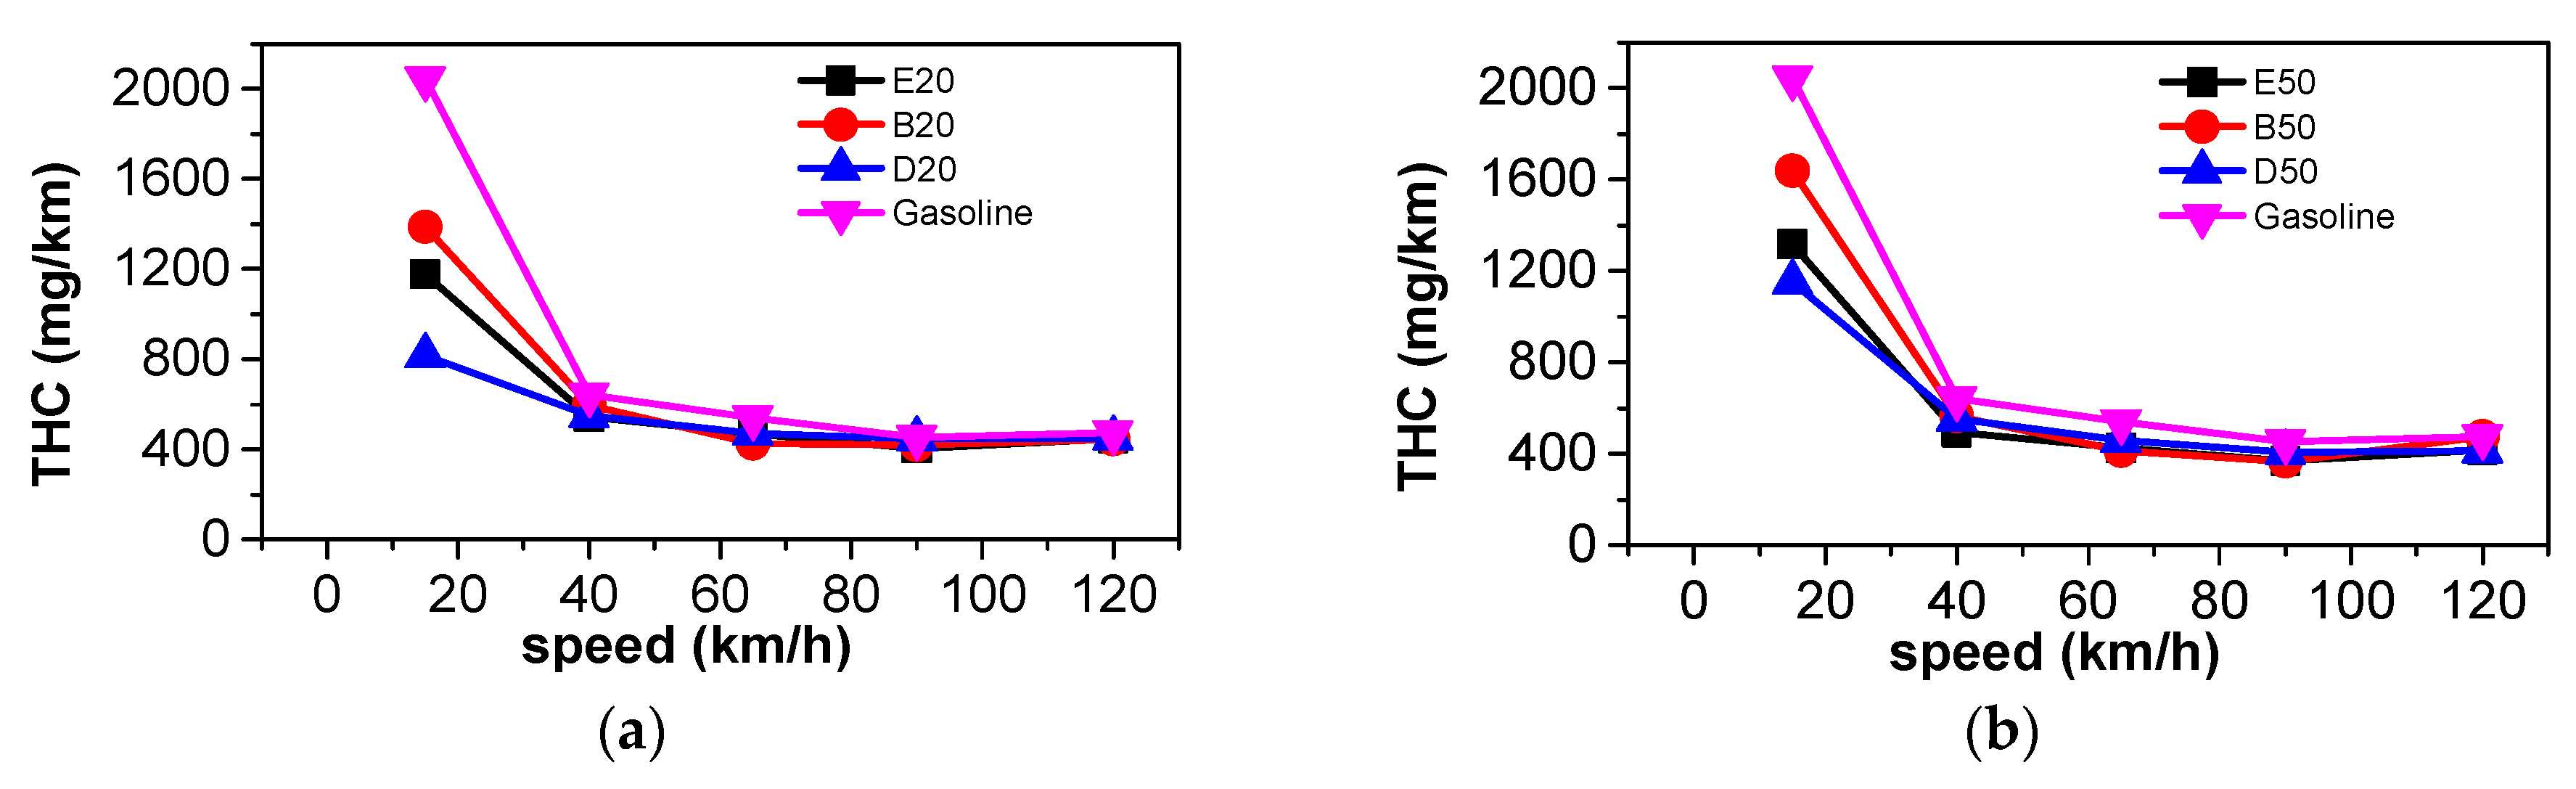
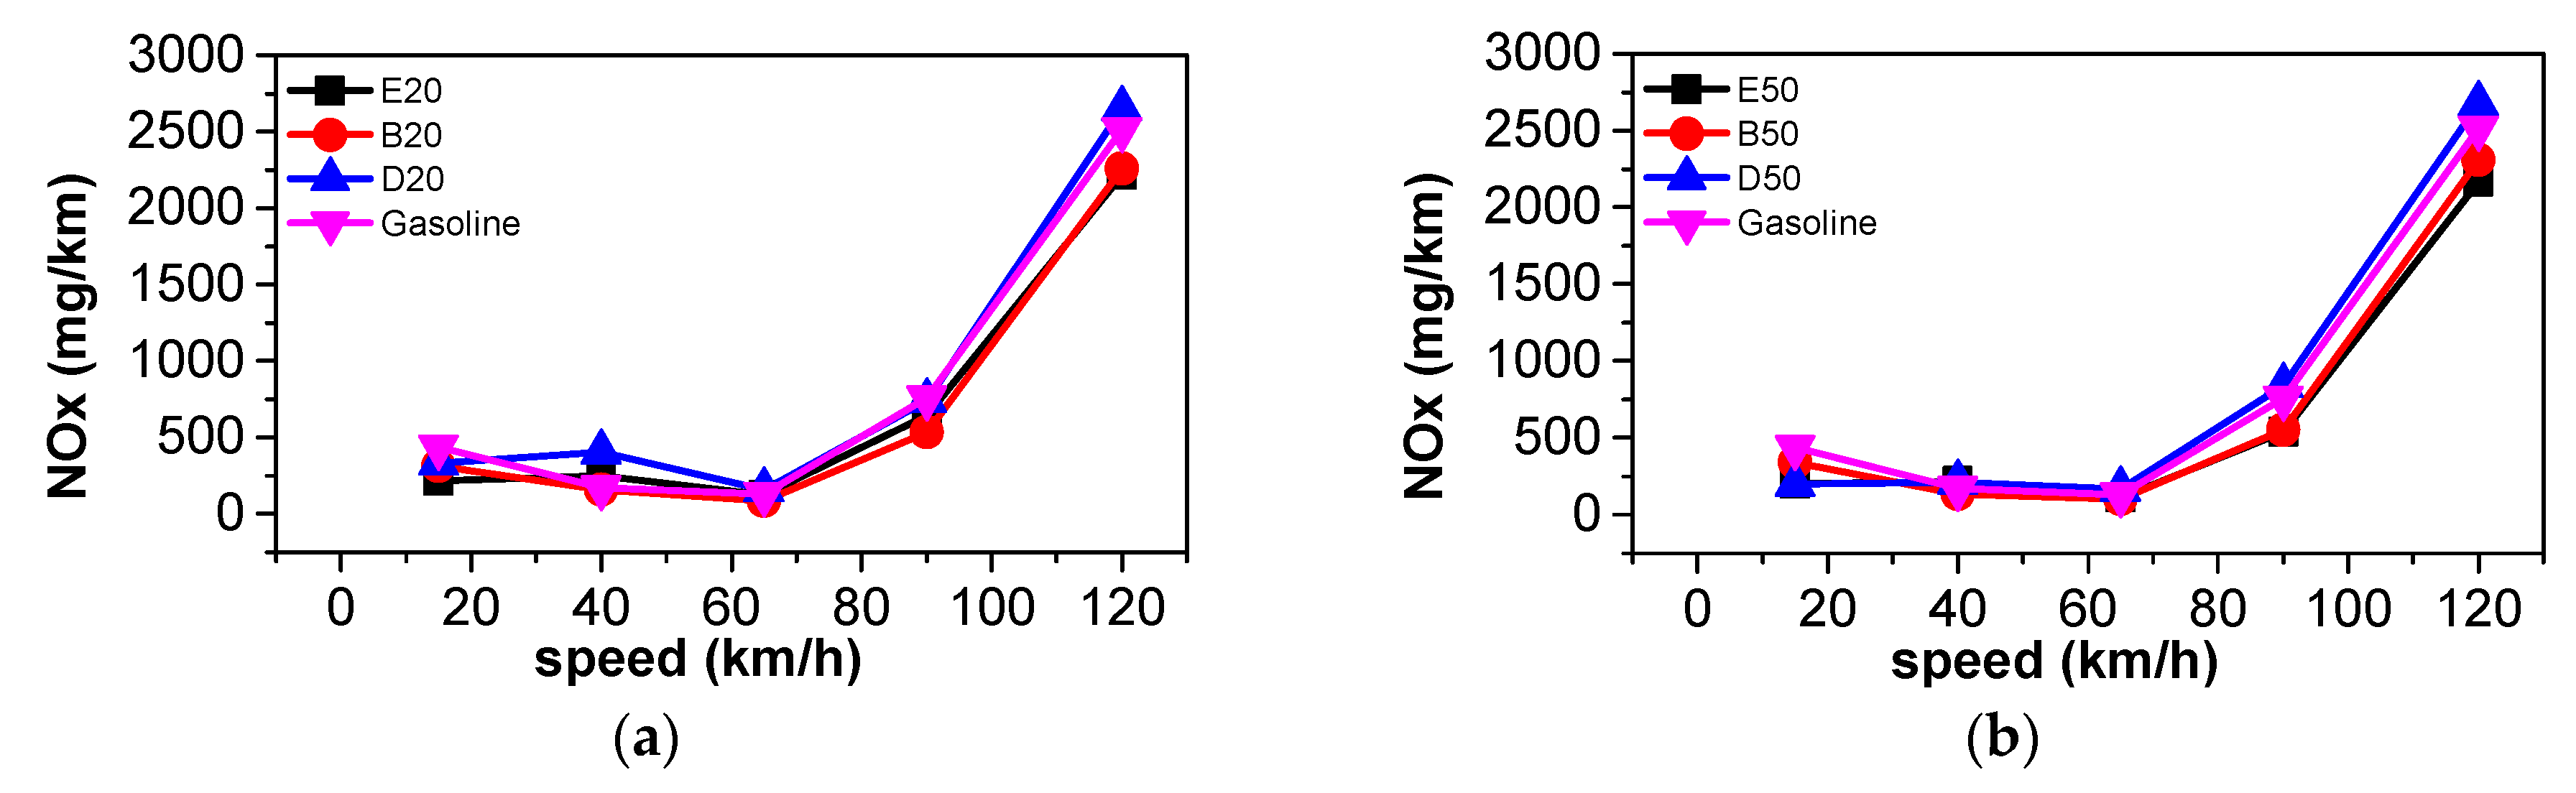
3.3. Comparison of Harmful Gaseous Emissions

Figure 7 shows the CO emissions of ethanol–gasoline, n-butanol–gasoline, and DMF–gasoline with blending ratios of 20%, 50%, 75%, and 100%, respectively. In general, CO emissions are higher at lower speeds, and as the vehicle speed increases, CO emissions decrease firstly, and then increase as the vehicle speed furtherly increases. At low speeds, the combustion temperature is low as well, which causes incomplete combustion and low combustion efficiency; as a result, the CO emissions are higher. The combustion temperature increases when the vehicle speed becomes higher, so the combustion efficiency is improved and CO emissions decrease. When the vehicle runs at high speed and at a high gear, the engine also working in high speed, and the combustion duration is shortened significantly. As a result, there is not enough time available for the complete oxidization of CO, which results in the increase in CO emissions. Blending oxygenated fuel can decrease CO emissions at low speed. On one hand, the oxygen in fuels is helpful to oxidize CO. On the other hand, the effect of volatility becomes significant when the mixing between air and fuel is uneven at low speed. The volatility of ethanol is better than those of gasoline, n-butanol, and DMF, so the CO emissions of E50, E75, and E100 are lowest at low speed. In the case of large blending proportions, the CO emissions of n-butanol-gasoline are the lowest at medium to high vehicle speeds. The possible reasons may be as follows. Firstly, the oxygen in n-butanol is beneficial for the oxidization of CO. Secondly, OH radical form more easily with the longer molecular chain of n-butanol, and OH is a strong oxidant to oxidize CO. Blending ethanol and DMF in gasoline has a less significant effect on the reduction of CO emissions at medium to high vehicle speeds. On one hand, due to the oxygenated nature and higher octane number of ethanol and DMF, the blended fuels attain better combustion than gasoline. On the other hand, due to the high latent heat of vaporization of these two fuels, there is a large number of CO formed in the low-temperature region, where oxidation is not easy. The simultaneous effects of these two aspects lead to a smaller effect of CO emissions on the blending ratio of ethanol and DMF.
Figure 8 shows THC emissions of ethanol-gasoline, n-butanol-gasoline, and DMF–gasoline with blending ratios of 20%, 50%, 75%, and 100%, respectively. The high THC emissions are mainly concentrated at the low speed of 15 km/h due to the low combustion temperature and consequent incomplete combustion. With the increase of speed, the THC emissions decrease quickly, and then remain at a low level with small changes with speed; at the same time, the difference in THC emissions among different kinds of blended fuels decreases. This is because as the speed increases, the increased gas flow in the cylinder enhances the homogeneity and the combustion rate increases; so, the THC emissions decrease. However, with the increase of blending proportion, the difference in THC emissions among different fuels increases. Under all the operating conditions, the THC emissions of oxygenated fuel blends are lower than those of pure gasoline, since the oxygen atoms in the oxygenated fuel promote combustion. As the blending ratio increases, the amount of THC emissions decreases. This is probably due to the fuel containing more oxygen, which makes the combustion more complete. Ethanol has lower THC emissions at various blending ratios than gasoline, which is attributed to the highest oxygen content of ethanol promoting full combustion, and thus reducing THC emissions. However, when n-butanol was blended in a large proportion, the THC emissions were higher than those of ethanol and DMF. This is probably because the addition of n-butanol is not conducive to atomization due to its higher viscosity and boiling point, making it is easy to cause impinging [48].
Figure 9 shows NOX emissions of ethanol-gasoline, n-butanol-gasoline, and DMF-gasoline with blending ratios of 20%, 50%, 75%, and 100%, respectively. It can be seen that NOX emissions are low and change little at low to medium speeds (15–65 km/h). However, when the vehicle speed is higher than 65 km/h, NOX emissions increase rapidly. This is because the combustion temperature is higher at the higher vehicle speed, so the increase in combustion temperature leads to more NOX formation. At medium and high speeds, blending ethanol and n-butanol result in lower NOX emissions than those of gasoline. This is mainly due to the high latent heat of vaporization of ethanol and n-butanol, which results in a lower in-cylinder temperature and combustion temperature as well [26]. This is the dominant factor influencing NOx formation. So, with an increase in the blending ratio of ethanol and n-butanol, NOx emissions decrease accordingly, and ethanol-gasoline shows the lowest NOx because of this blend having the highest latent heat of vaporization of ethanol. Such a trend is more obvious at high blending ratios, e.g., 75% and 100%. However, the large proportion of DMF blending resulted in higher NOX emissions than gasoline, and NOX emissions increased as the DMF blending ratio increased, which is opposite to the trends of blending ethanol and n-butanol. According to the theoretical air-fuel ratio and low heating value of DMF and gasoline, calculating the homogeneous mixture with an equivalent ratio of one under complete combustion conditions, it can be concluded that the combustion temperature of DMF is higher than that of gasoline. Studies have also shown that the adiabatic flame temperature of DMF is higher than that of gasoline [46], which can explain the increase in NOX emissions as the DMF blending ratio increases. In addition, the higher octane number of DMF results in a slightly advanced combustion phase and high constant volume of combustion, which increase the NOX emissions to some extent.

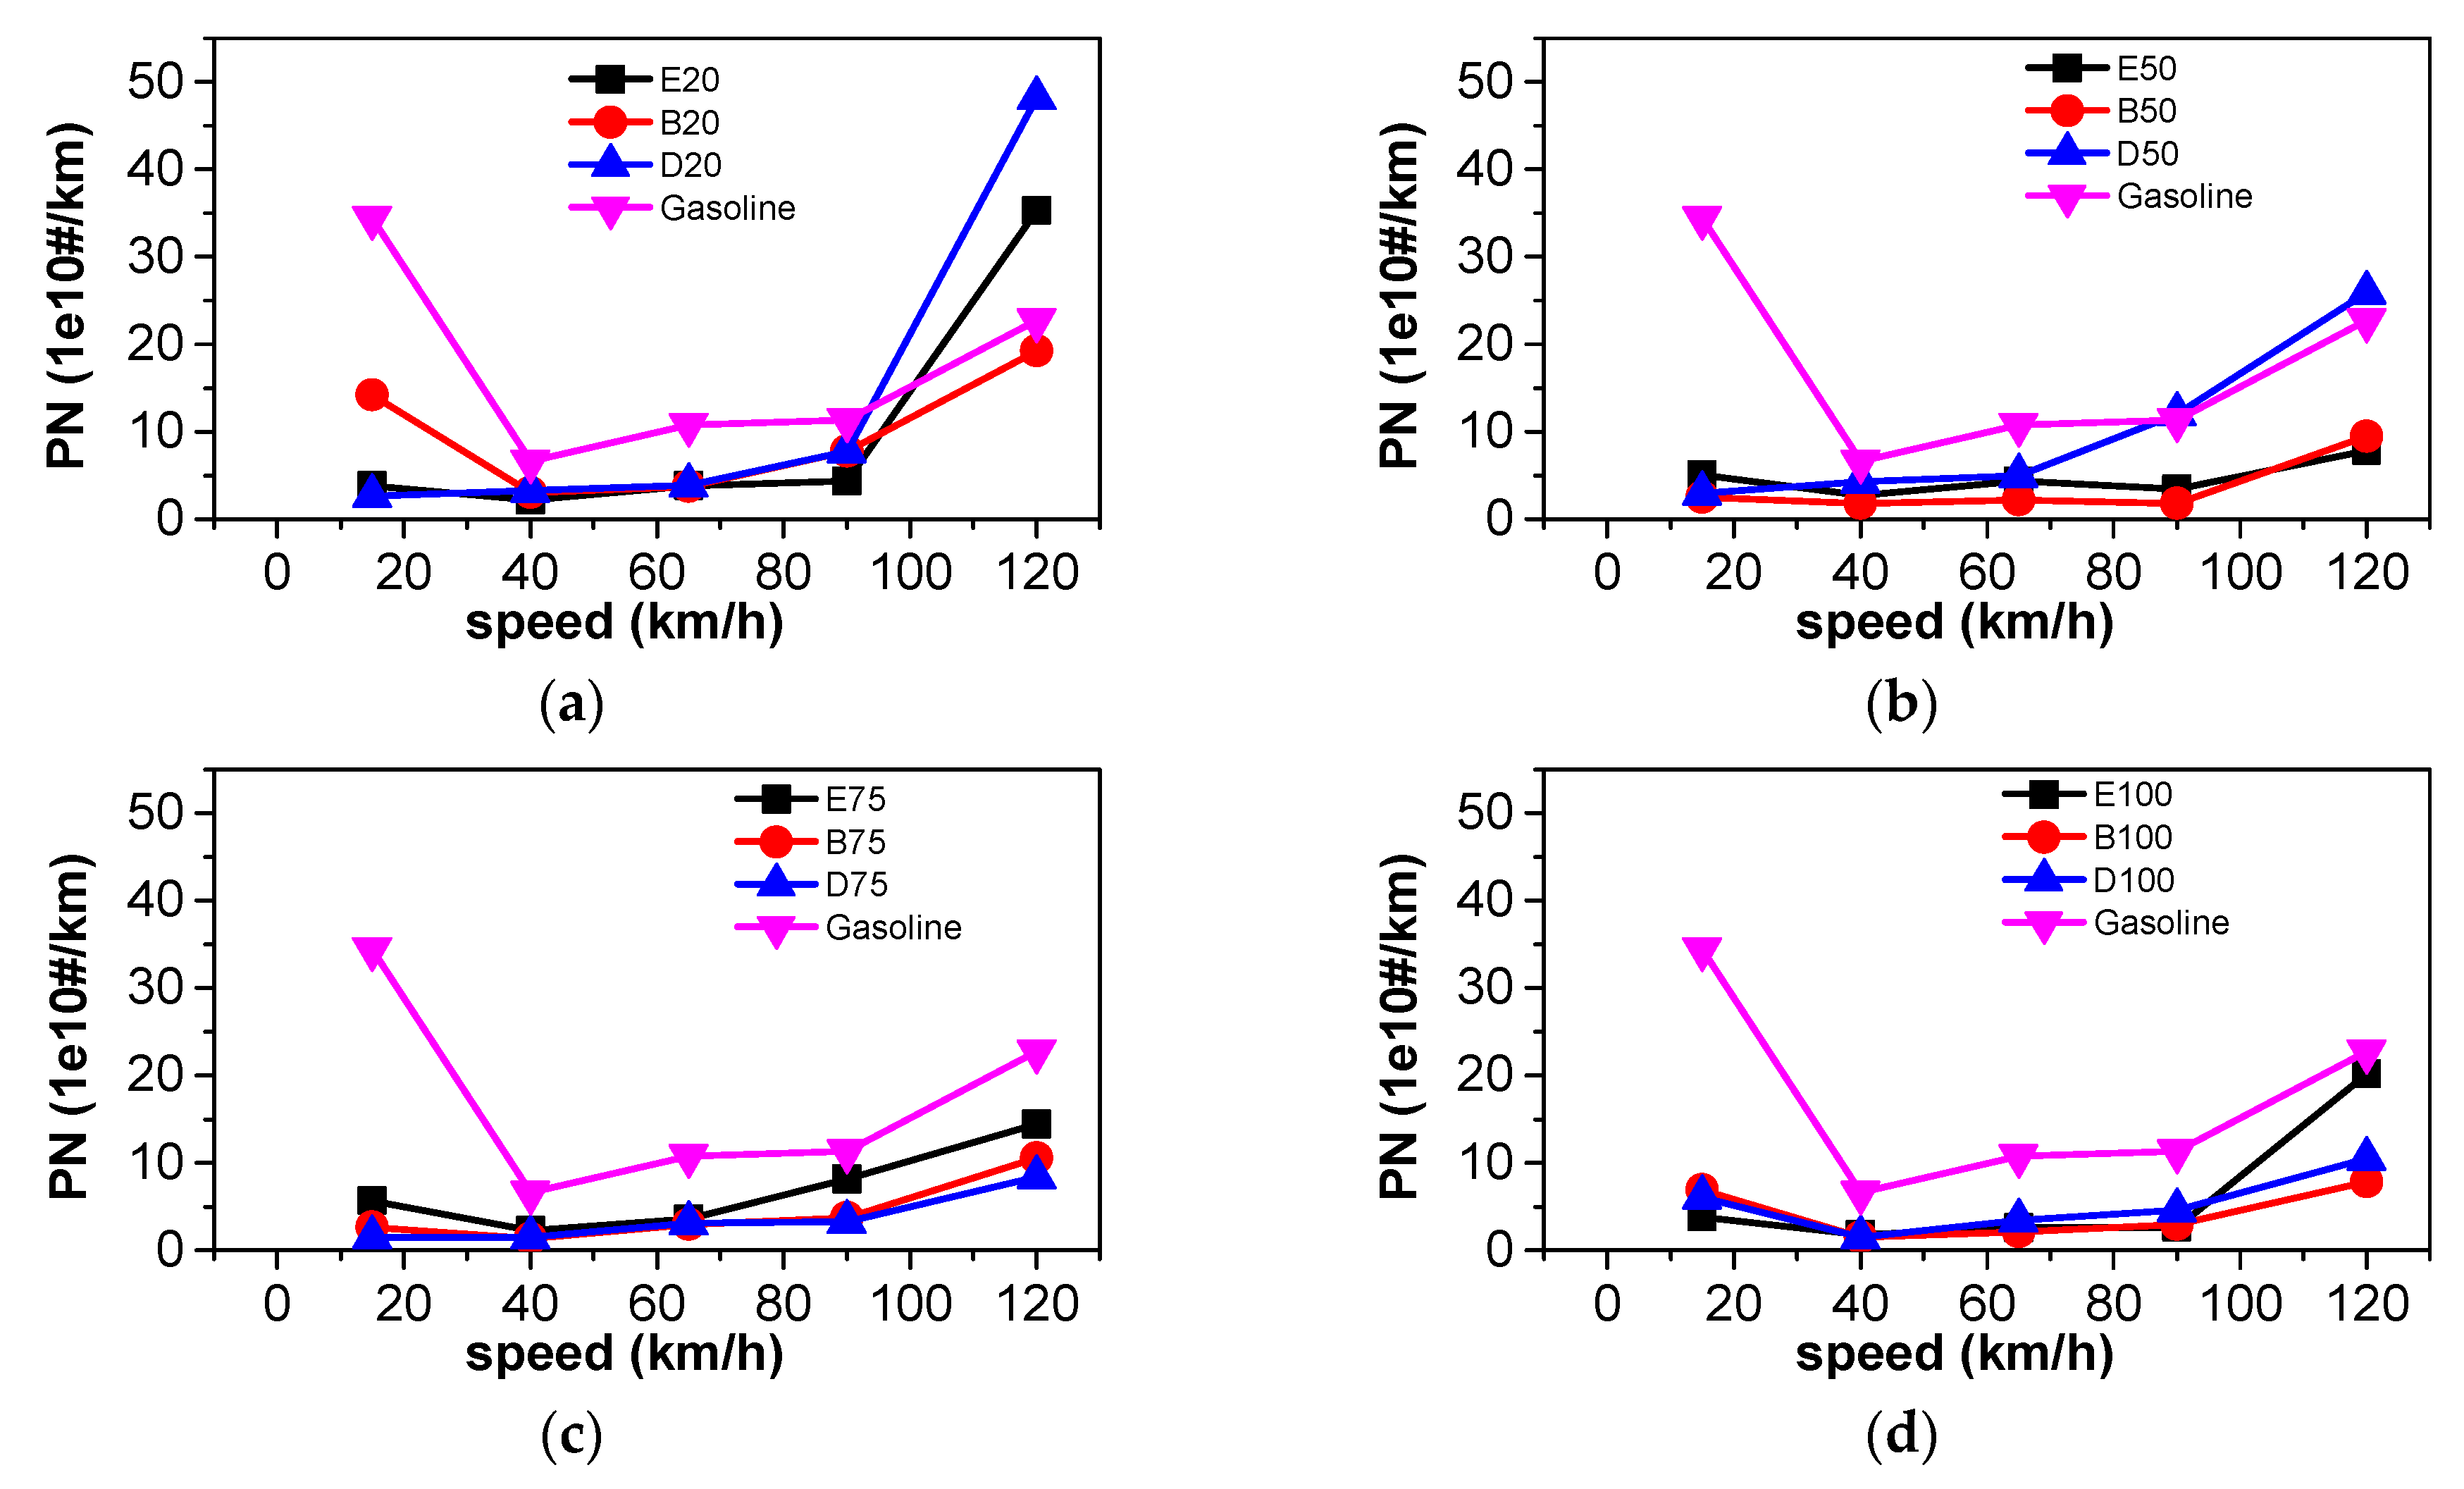
3.4. Particle Number Emissions

Figure 10 shows the PN (particle number) emissions of ethanol-gasoline, n-butanol-gasoline, and DMF-gasoline with blending ratios of 20%, 50%, 75%, and 100%, respectively. At low and medium vehicle speeds, the PN emissions of oxygenated blended fuels at various blending ratios are kept at a low level; however, PN emissions are higher at high speed (≥ 90 km/h). This is mainly because the fuel mass is increased at high speed, and more fuel will impinge into the wall; the mixing timing is also shortened, which results in poor fuel-air mixing, and the PN increases accordingly. At the four blending ratios, the PN emissions of the oxygenated blended fuels are generally lower than those of gasoline. This is because blending oxygenated fuels can provide a certain amount of oxygen for combustion, improving the mixing between fuel and air and reducing the content of aromatic in the blending fuel, which reduces the soot formation. When the blending ratios are 75% and 100%, the PN emissions of the blended fuels are decreased remarkably, and both n-butanol-gasoline and DMF-gasoline exhibit lower PN emissions than ethanol–gasoline. This may be mainly because the combustion temperatures of n-butanol-gasoline and DMF-gasoline are higher than that of ethanol-gasoline, which enhances the oxidation of soot.

3.5. Effect of Blending Small Fraction Oxygenated Fuel in Gasoline on Fuel Consumption and Emissions of NEDC Cycle

In the sections above, the fuel consumptions and emissions of three kinds of oxygenated blended fuels have been compared at different blending ratios under steady-state operating conditions. However, considering that transient and cold-start operations are important in real driving cycles, the effects of oxygenated fuels on fuel efficiency and emissions also need to be investigated. The NEDC cycle, which is a standard test cycle of European Union emission regulation, include transient and cold-start operations, and can be employed in the evaluation for different fuels concerning such operating conditions. However, for oxygenated blended fuels with blending ratios over 30%, there are certain technical obstacles related to running in the NEDC cycle because of the difficulties regarding cold starts without the changes in the vehicle engine. Therefore, only the small blending ratio of 20% is selected for the comparison of different fuels in the NEDC cycle.

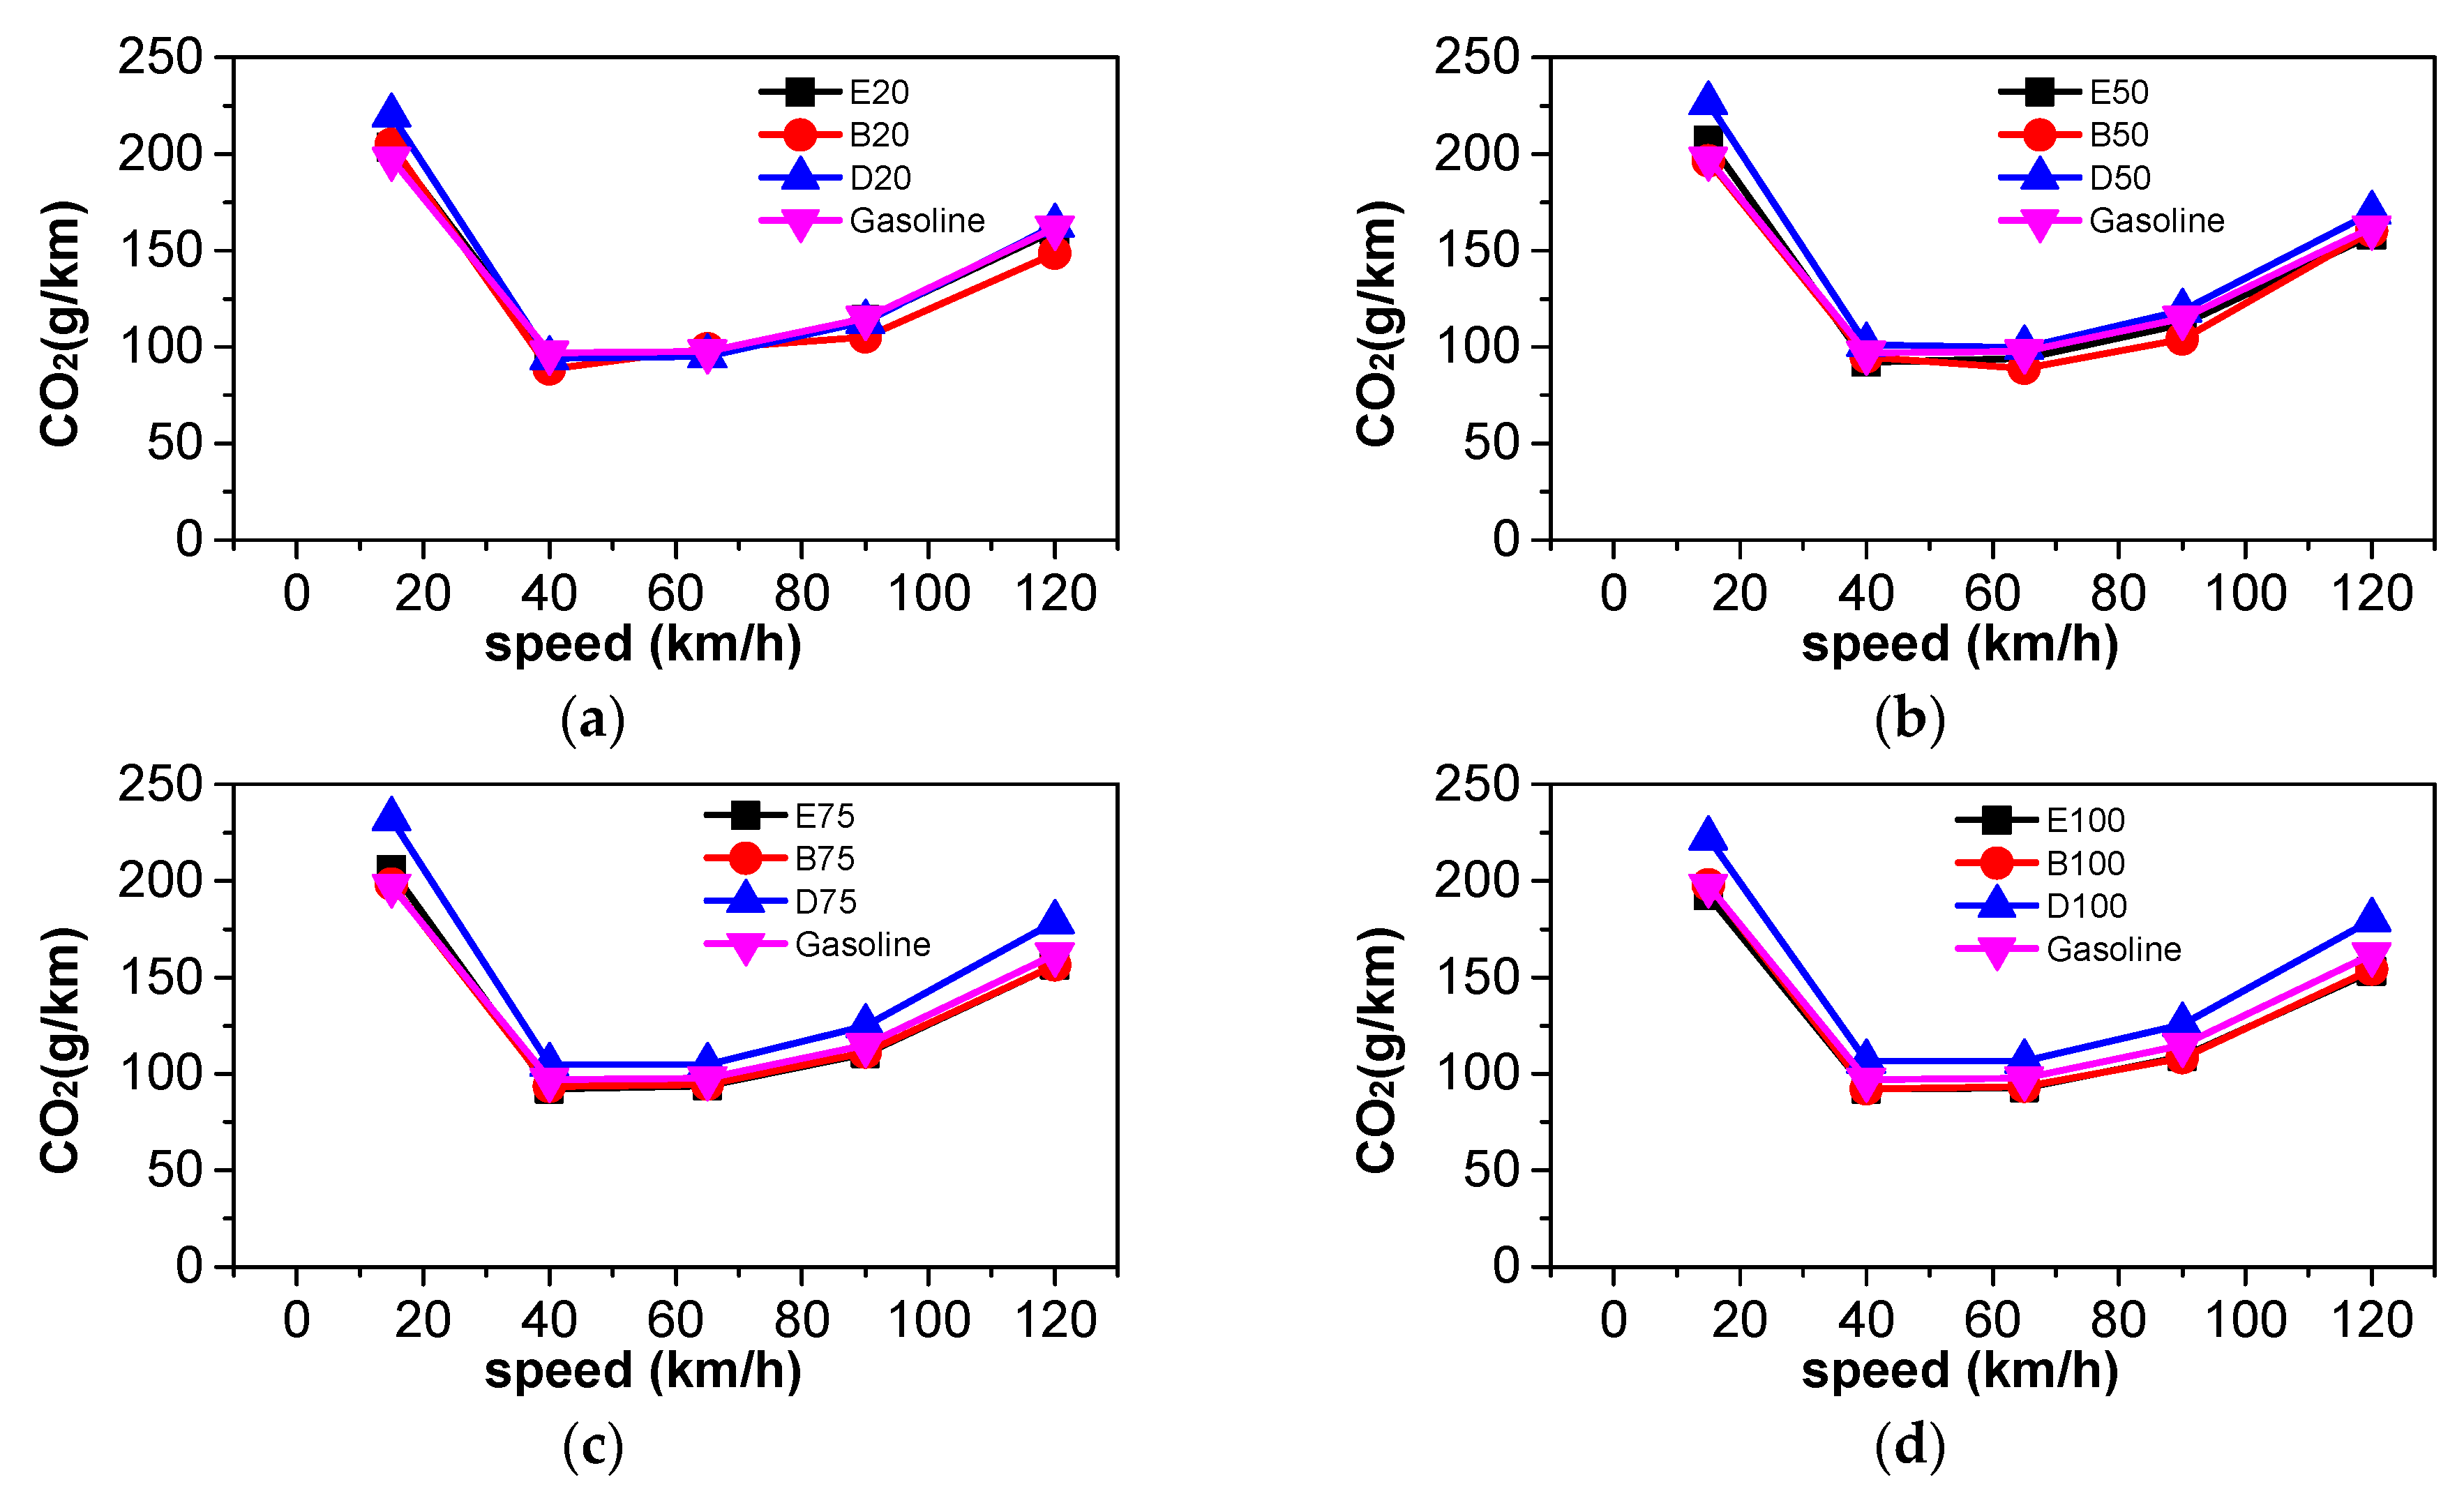
3.5.1. Comparison of Energy Consumption

Figure 11 shows the energy consumption of E20, B20, and D20 in the NEDC cycle. It can be seen that the CO2 emission of B20 is lower than that of gasoline in the NEDC cycle. Meanwhile, the CO2 emissions of B20 are reduced both in the UDC and EUDC stages, which may be due to the dehydrogenation of n-butanol in the early stage of combustion generating a large amount of active free radicals. In turn, the hydroxyl group promotes the low-temperature oxidation process of gasoline and improves the combustion chemical reaction rate [49,50]. The CO2 emissions of E20 and D20 both increase in the NEDC cycle compared to gasoline, and the increase mainly comes from the UDC stage, while the CO2 emissions in the EUDC stage is basically equivalent to gasoline. The latter is mainly due to the low combustion temperature and incomplete combustion in the UDC stage resulting in high equivalent fuel consumption. The dominant factor affecting volumetric fuel consumption is the lower heating value. Equivalent fuel consumption is the fuel consumption after removing the effect of the lower heating value. The equivalent fuel consumption and volume fuel consumption of B20 in the whole NEDC cycle are lower than that of gasoline, which may be because the oxygen in n-butanol promotes combustion and improves the fuel efficiency. In addition, the faster laminar flame speed of n-butanol results in a shorter combustion duration and high constant volume of combustion [51]. The energy consumption of E20 is higher than that of gasoline at all stages in the NEDC cycle, and D20 shows a slightly lower equivalent fuel consumption than gasoline in the whole cycle. The main reason is same as the steady state for energy consumption.

3.5.2. Comparison of Harmful Emissions

Figure 12 shows the harmful emissions emitted during the NEDC cycles of E20, B20, and D20. The CO and THC emissions in the UDC stage are higher than those of the EUDC stage, which is mainly because during the start-up of the SI engine, fuel-rich injection is required to ensure ignition in the first 30 s, and excessive fuel supply due to low temperature and poor mixing in the cylinder produces large amounts of THC and CO emissions during cold starts [21]. The CO, THC, and NOX emissions of B20 in the whole NEDC cycle are lower than those of gasoline. The oxygenated effect and fast combustion of n-butanol reasonably reduced CO and THC formation, especially in the UDC stage, which features low speed and frequent cold starts. The harmful emissions of DMF in all stages of the NEDC cycle are generally slightly higher than those of gasoline, which may be because the low H/C and O/C of DMF are not conducive to oxidizing THC and CO. The small increase in combustion temperature resulting from the oxygenated property of DMF causes slightly high NOX emissions. The CO and THC emissions of E20 are higher than those of gasoline, but NOX emissions are lower than those of gasoline. The latter is mainly attributed to the higher latent heat of vaporization of ethanol resulting in a lower combustion temperature in the cylinder, which decrease the combustion efficiency and NOx formation simultaneously. The high latent heat of vaporization of ethanol increases the combustion loss, resulting in higher CO emissions.

3.5.3. Comparison of Particle Emissions

Figure 13 shows particulate emissions of E20, B20, and D20 in the NEDC cycle. In all the stages of the NEDC cycle, the PM and PN of the oxygenated blended fuels decrease significantly compared with gasoline, and the largest reduction is obtained with D20. It is generally believed that the oxygenated fuel contains oxygen atoms in its molecule, which decrease the formation of the soot precursor and is favorable for the later oxidation of soot, and consequently reduces soot emissions compared with gasoline. For D20, the combustion temperature is somewhat higher than gasoline, which can further promote the oxidation of soot. Therefore, a significant reduction in particulate emissions can be achieved when D20 is fueled to the vehicle engine. The oxygen content of E20 is higher than that of B20, which is beneficial to suppress the formation of soot, resulting in lower emissions of particles compared with B20. Particle emissions of B20 are the highest among the three oxygenated blended fuels because of the high viscosity (poor mixing) and fairly higher latent heat of vaporization (low combustion temperature) compared to D20.

3.6. Comparison of Acceleration Performance

Figure 14 shows the acceleration time of each gear of ethanol-gasoline, n-butanol-gasoline, and DMF-gasoline with blend ratios of 20%, 50%, 75%, and 100%, respectively. Here, the acceleration time is employed to represent the dynamic performance of the vehicle. It can be seen that the blending of the oxygenated fuels reduces the acceleration time at each gear. The high octane number of the oxygenated fuel and the consequently strong anti-knock properties contribute to improving the engine thermal efficiency by advancing the ignition and combustion phasing, especially in the accelerated operating condition. At each gear, as the blending ratio of DMF increases, the acceleration time decreases. This indicates that the engine exhibits a higher power during the acceleration process. The reason is that although the lower heating value of DMF is relatively low, the theoretical air–fuel ratio of DMF is small. This results in the fuel energy of D20 that is injected into the cylinder being higher than that of gasoline at the stoichiometric ratio condition under the same intake air amount; therefore, the power output of D20 is increased. When the blending ratios of n-butanol are 75% and 100%, the acceleration time in each gear position is smaller than that of gasoline. It can be seen from the above analysis that n-butanol has a significant improvement in combustion. Overall, the acceleration performance of blended ethanol is better than the other two blended oxygenated fuels except E100 in three and four gears. The reason is the high latent heat of vaporization of ethanol, which promotes the charge cooling for an increased power density. Meanwhile, at the same amount of intake air, ethanol allows 11.5% more energy to be injected than gasoline due to the lowest stoichiometric air-fuel (A/F) ratio of ethanol, which leads to a shorter acceleration time.

4. Conclusions

In this paper, the effects of n-butanol-gasoline, DMF-gasoline, and ethanol-gasoline on the energy consumption, harmful emissions, and acceleration performance of a GDI vehicle with a chassis dynamometer were investigated. The experimental study was carried out at a steady-state cycle and an NEDC cycle with the oxygenated blending ratios of 20%, 50%, 75%, and 100% by volume. The results were compared with pure gasoline. The main conclusions are summarized as follows:
(1)
At steady state, CO2 emissions and equivalent fuel consumption were reduced when n-butanol was blended into gasoline. The emissions of CO, THC, NOX, and PN also decreased as a large proportion of n-butanol was used. Blending DMF into gasoline has little effect on CO2 emissions. A large proportion of DMF resulted in the decreased THC and PN emissions and increased NOX emissions. When a large proportion of ethanol was blended into gasoline, THC, NOX, and PN emissions simultaneously decreased. Among the three oxygenated blended fuels, n-butanol–gasoline is the best for improving harmful emissions and CO2 emissions.
(2)
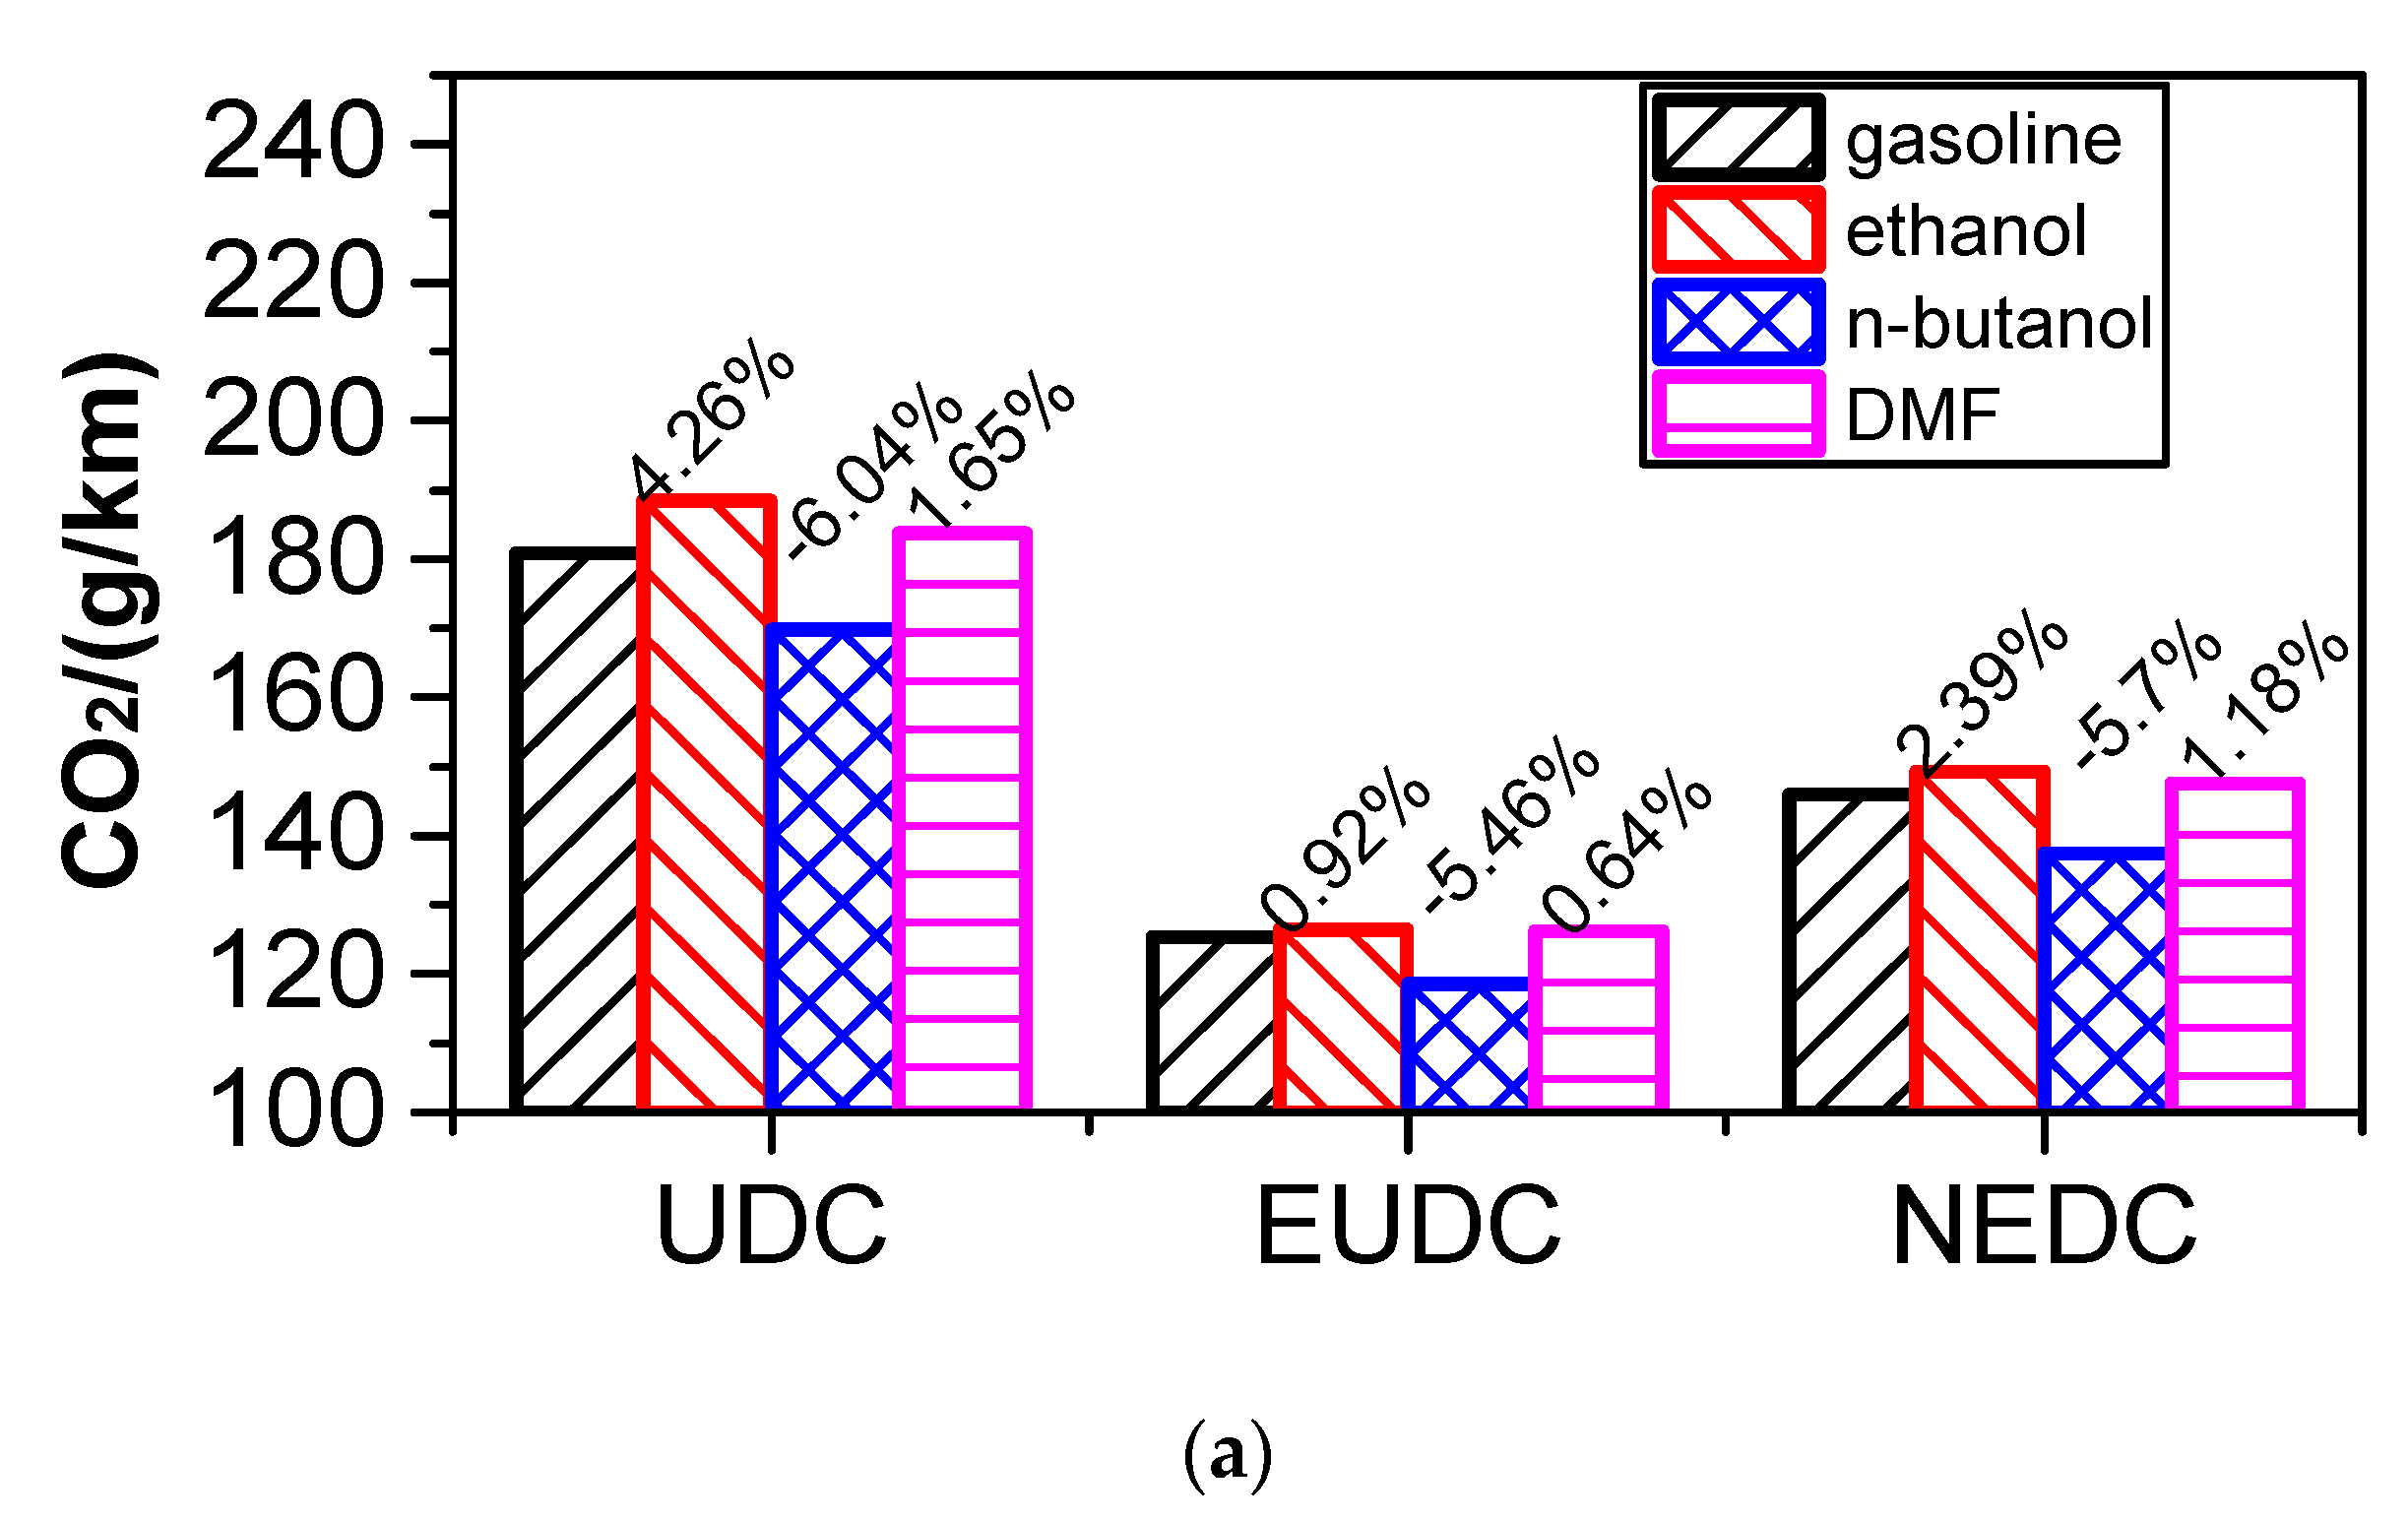
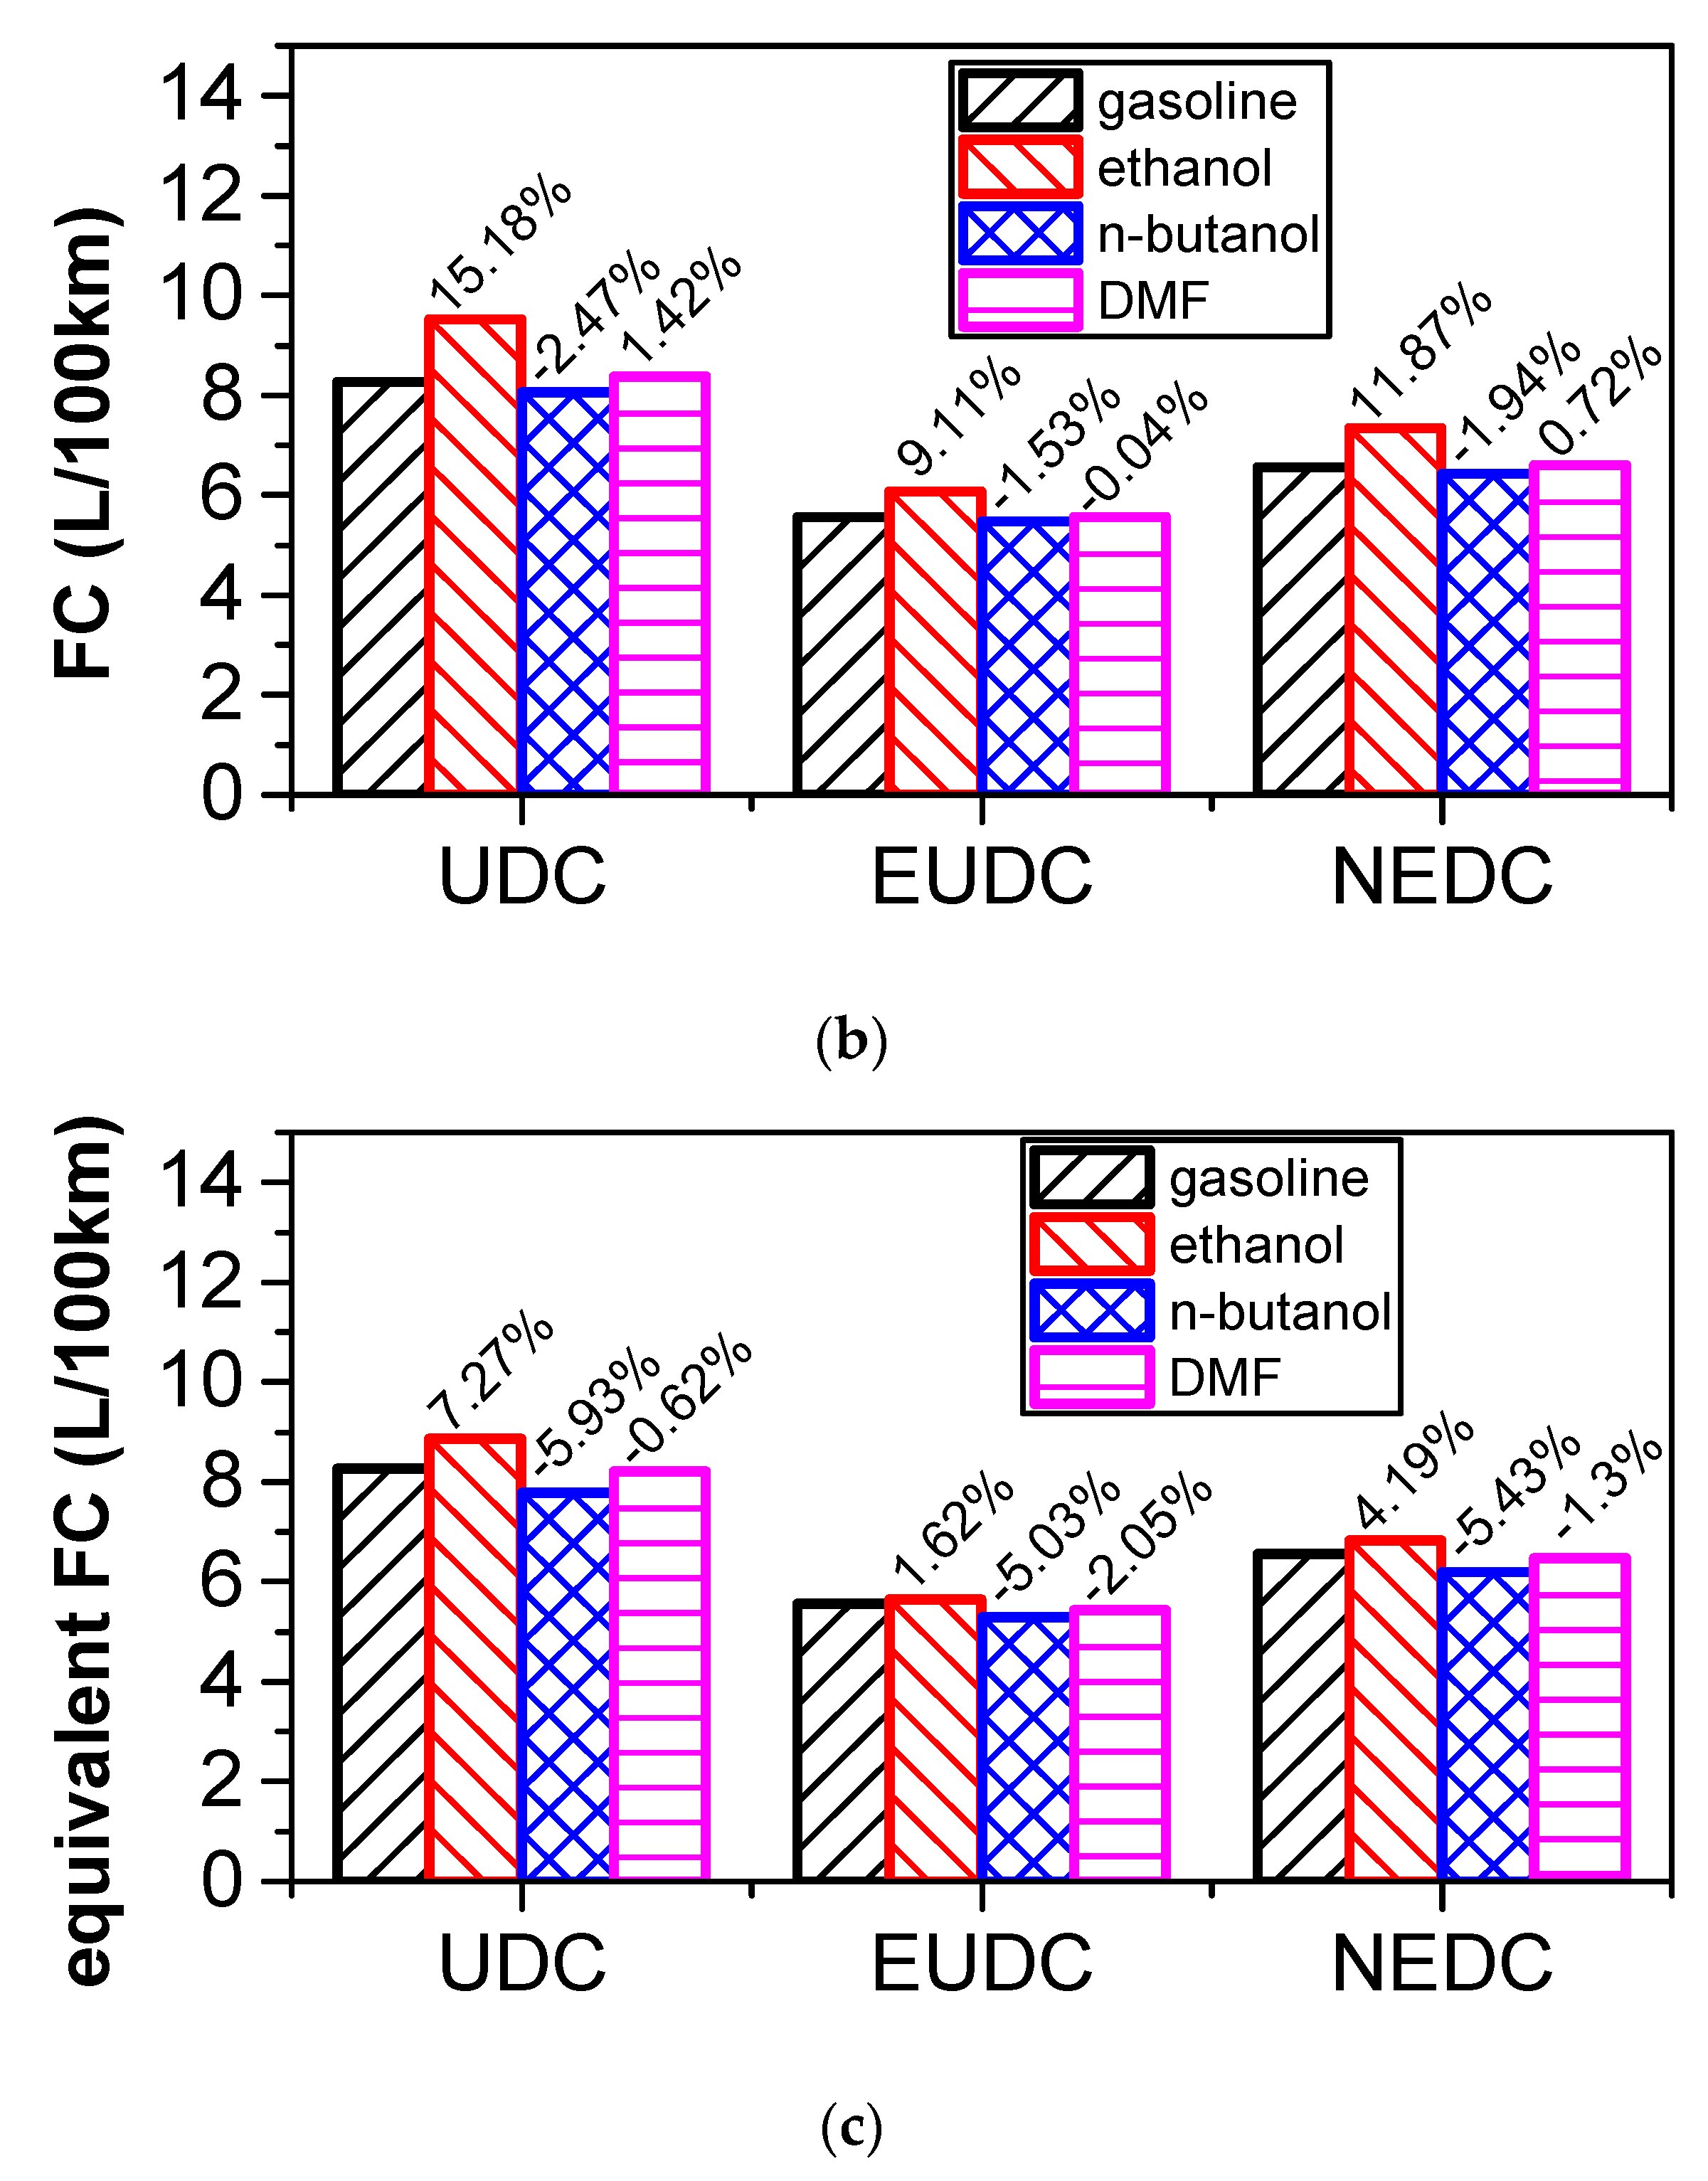
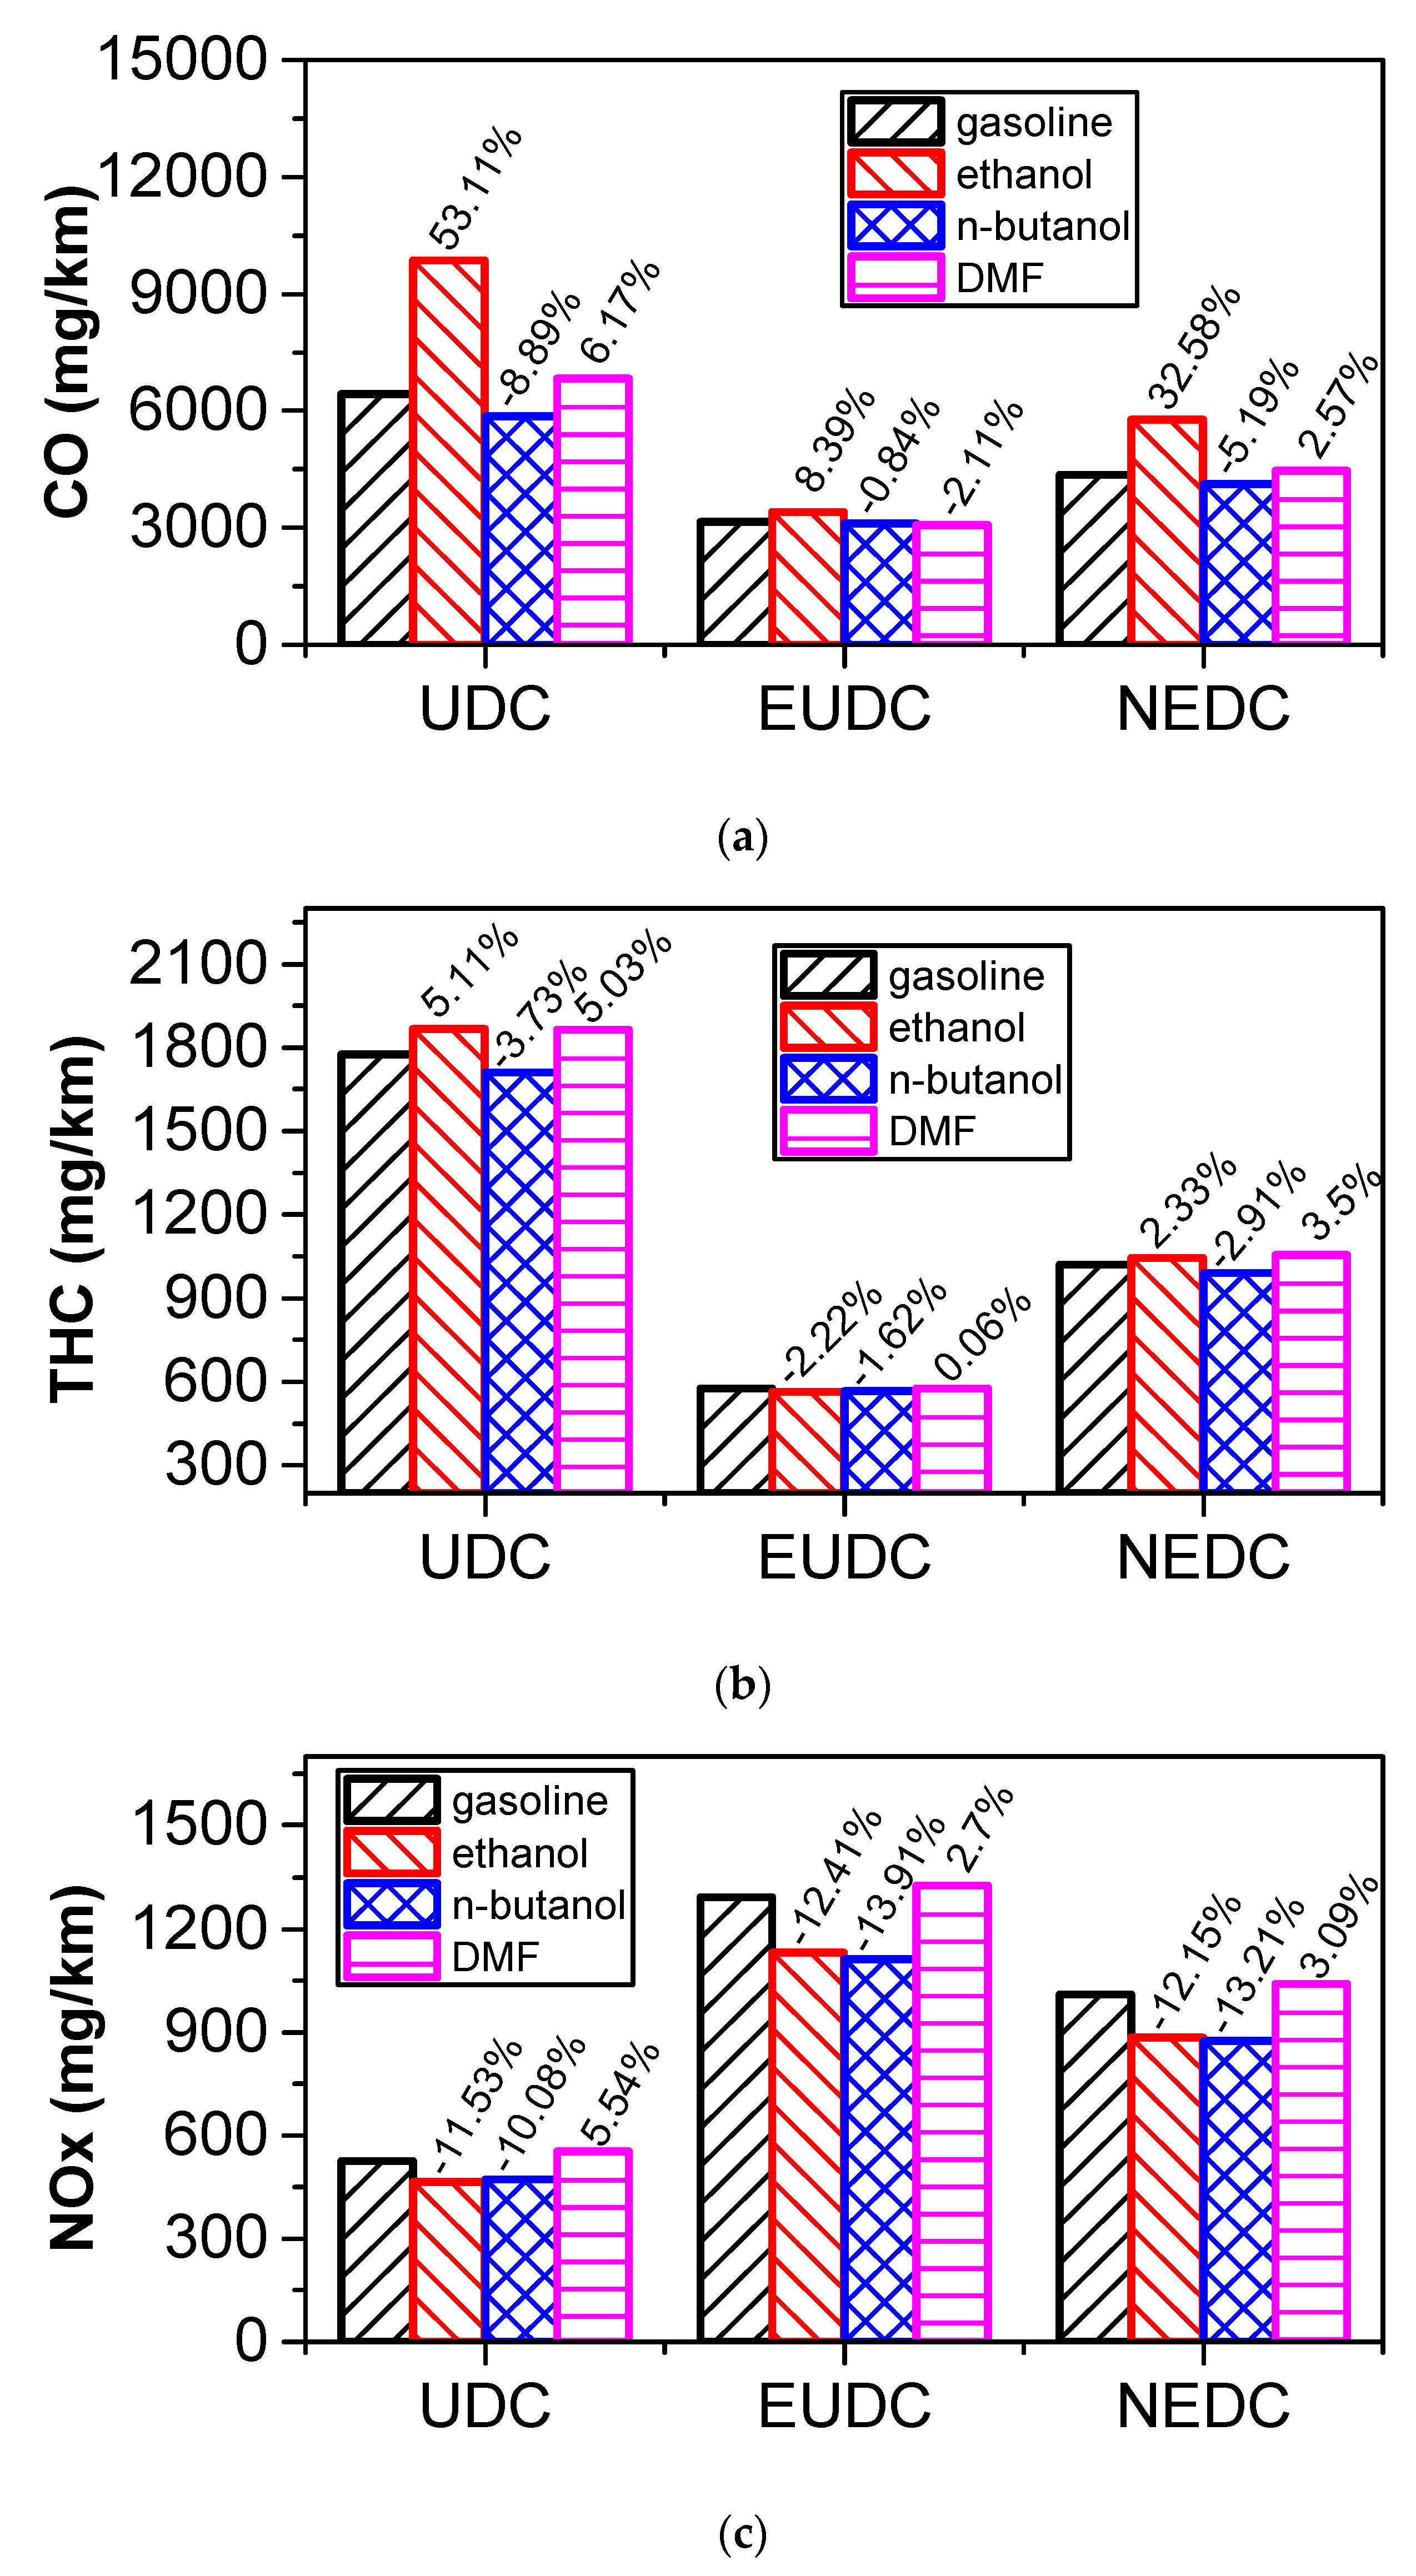
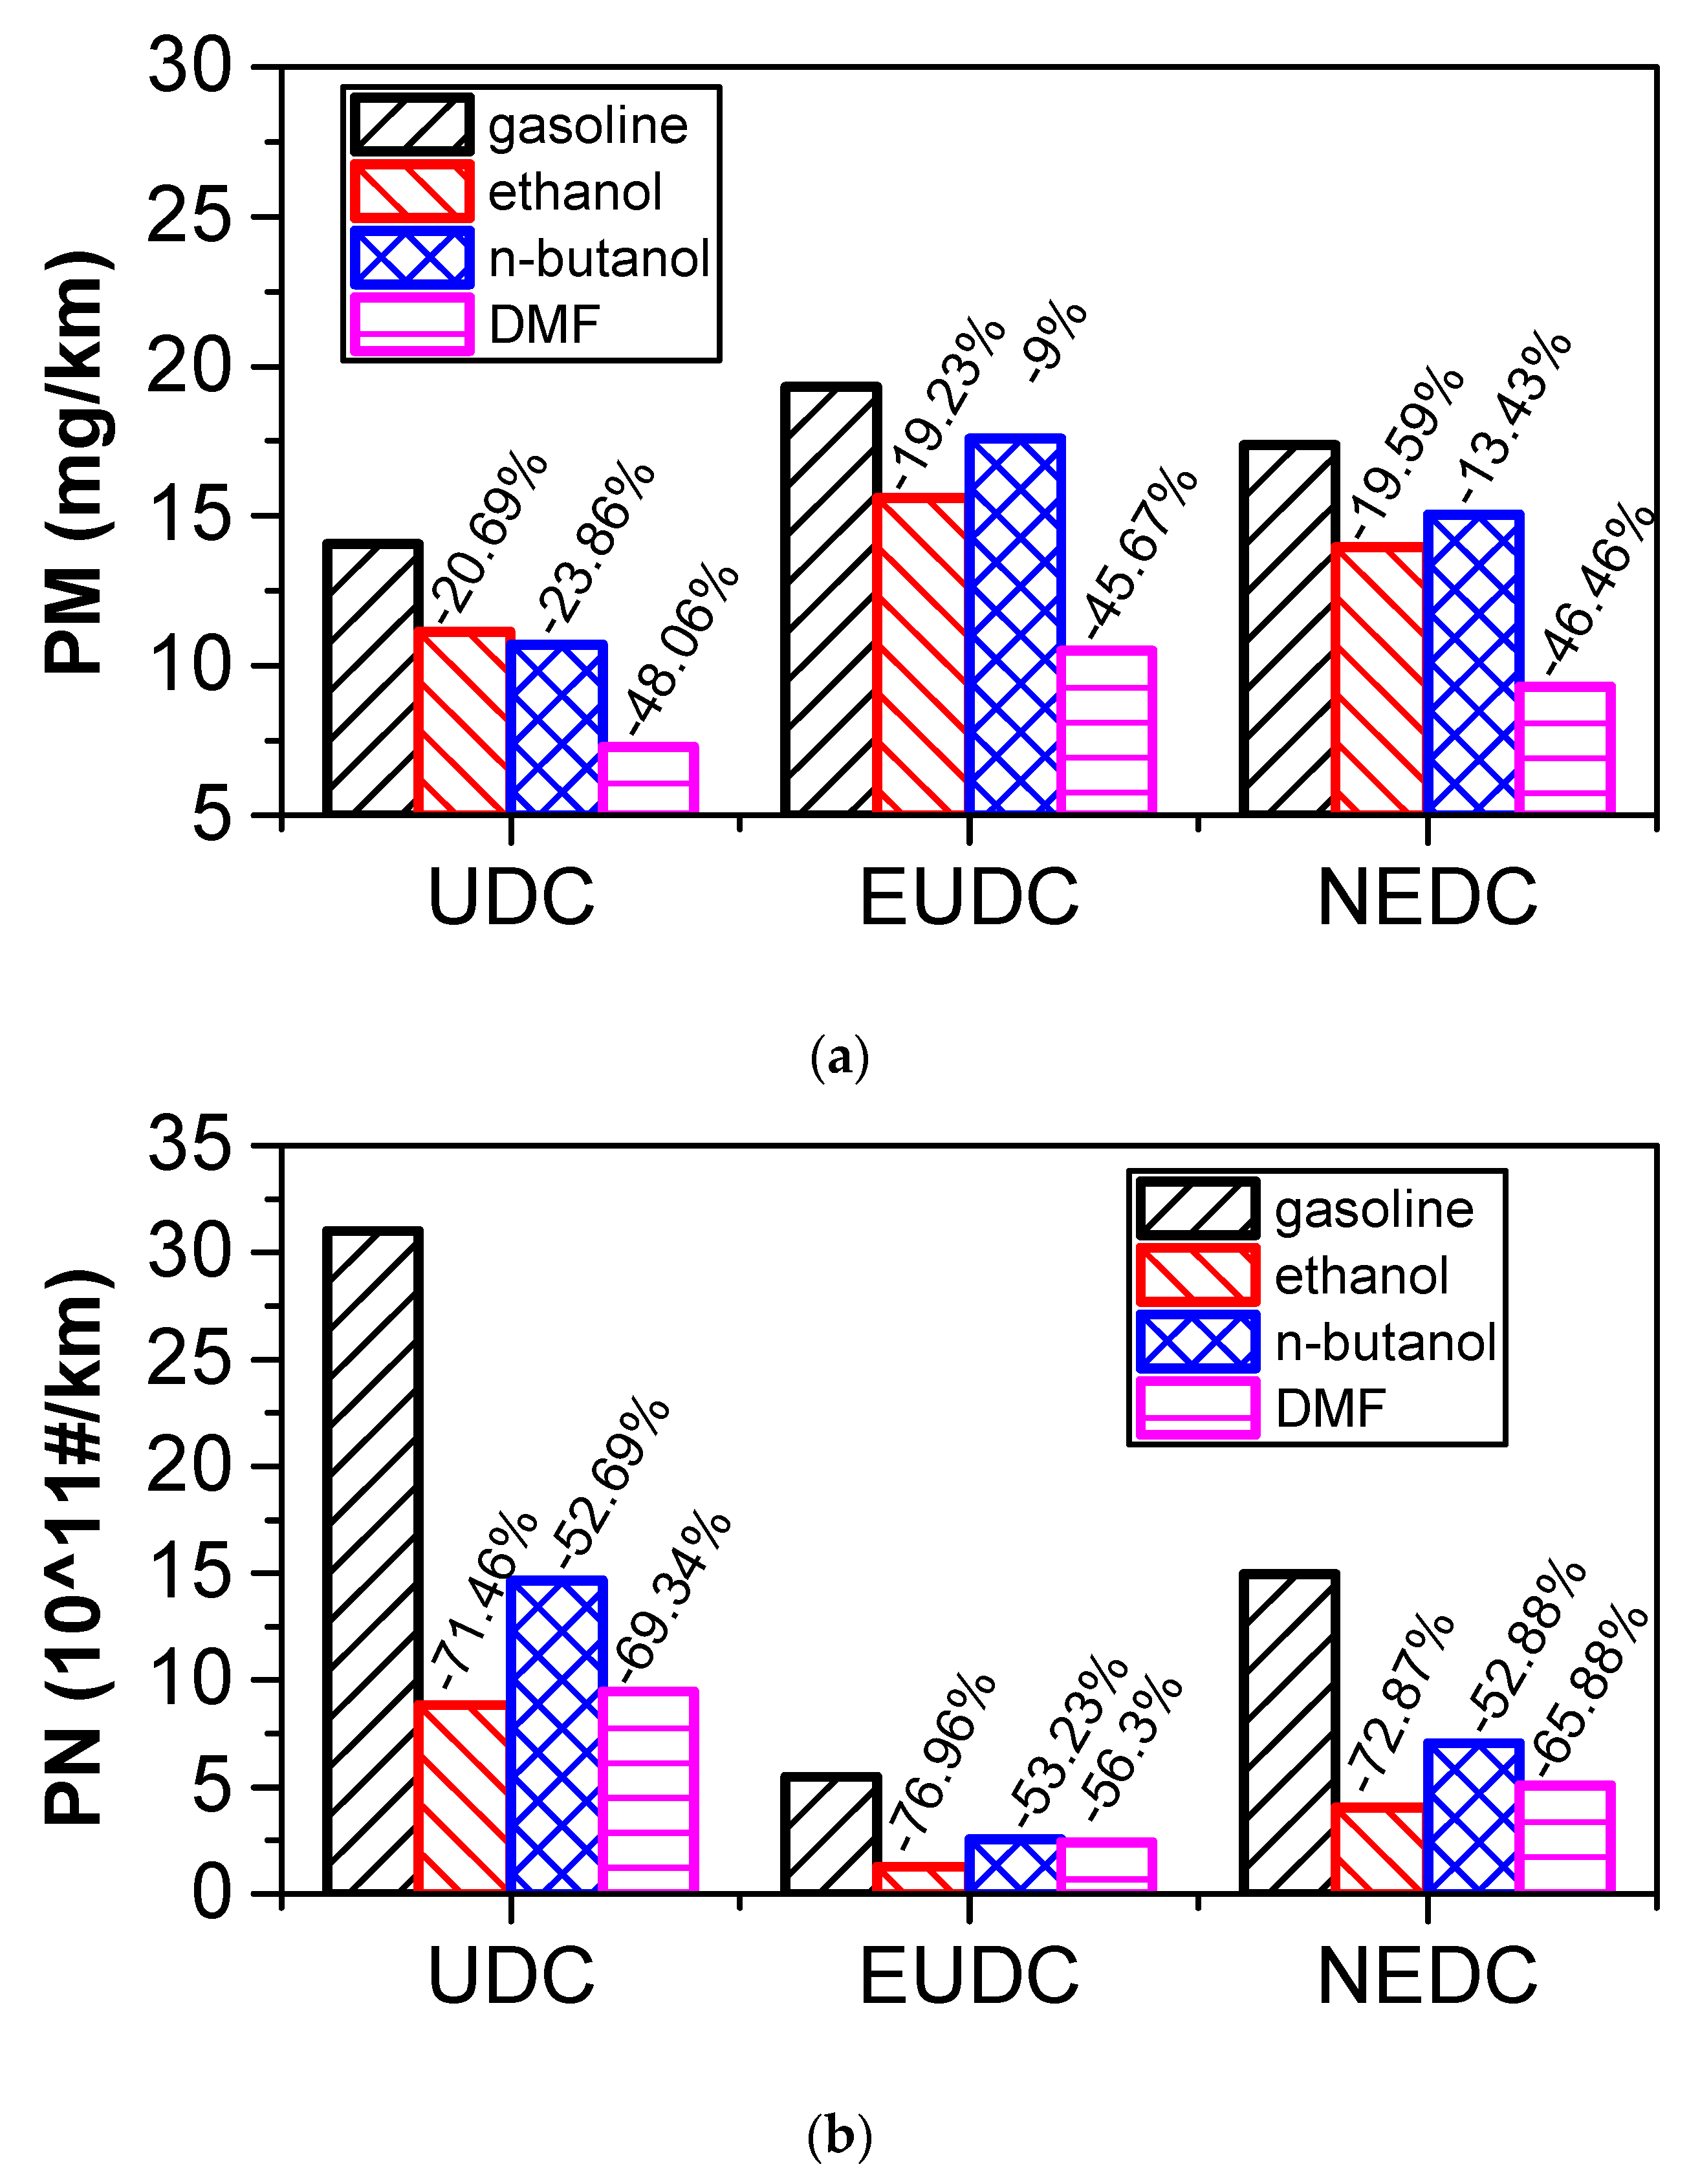
According to the results of the NEDC cycle, when blending 20% n-butanol into gasoline, the CO2 emissions, volumetric fuel consumption, and equivalent fuel consumption are reduced by 5.7%, 1.94%, and 5.434%, respectively, compared with gasoline. Meanwhile, CO, THC, and NOX emissions decreased. However, when blending 20% DMF into gasoline, the CO2 emissions and volumetric fuel consumption were higher than those of gasoline in the NEDC cycle, and CO, THC, and NOX emissions increased, while the equivalent fuel consumption was lower than that of gasoline. When blending 20% ethanol into gasoline, the CO2 emissions, volumetric fuel consumption, and equivalent fuel consumption were higher than that of gasoline. Ethanol–gasoline blends increased CO and THC emissions in all stages in the cycle, but NOX emissions decreased. Blending 20% of the three oxygenated fuels significantly reduced PN and PM emissions in the NEDC cycle.
(3)
The acceleration performance of three, four, and five gears is improved by blending oxygenated fuel into gasoline. As the DMF blending ratio increases, the acceleration time decreases gradually. Blending a large proportion of n-butanol also improved the acceleration performance. Overall, the acceleration performance of ethanol–gasoline was the best among the three kinds of blended fuels at five gears, although its acceleration time at three and four gears under 100% blending was slightly longer than that of the other two oxygenated fuels.
(4)
The impacts of the addition of ethanol, n-butanol, and DMF on the steady-state performance of the vehicle were positive. However, when the blending ratio was over 30%, the cold start performance of the vehicle will be challenging without changing the engine. So, the coupling of fuel and the engine needs to be further studied.

Author Contributions

All the authors have worked on this manuscript together, and all the authors have read and approved the final manuscript. Conceptualization, H.L., F.D., H.H. and Z.Z.; Data curation, X.L.; Formal analysis, X.W.; Investigation, D.Z. and Q.W.; Project administration, Y.Y. and Y.W.; Writing—original draft, X.W.; Writing—review & editing, Q.W., H.L. and Z.Z.

Funding

This research was funded by [the National Natural Science Foundation of China (NSFC)] grant number [51576138] and by [the National Natural Science Foundation of China (NSFC)] grant number [91541205].

Conflicts of Interest

The authors declare no conflict of interest.

References

  1. Giakoumis, E.G.; Rakopoulos, C.D.; Dimaratos, A.M.; Rakopoulos, D.C. Exhaust emissions with ethanol or n-butanol diesel fuel blends during transient operation: A review. Renew. Sustain. Energy Rev. 2012, 17, 170–190. [Google Scholar] [CrossRef]
  2. Rakopoulos, D.C.; Rakopoulos, C.D.; Giakoumis, E.G.; Komninos, N.P.; Kosmadakis, G.M.; Papagiannakis, R.G. Comparative Evaluation of Ethanol, n-Butanol, and Diethyl Ether Effects as Biofuel Supplements on Combustion Characteristics, Cyclic Variations, and Emissions Balance in Light-Duty Diesel Engine. J. Energy Eng. 2017, 143, 1–8. [Google Scholar] [CrossRef]
  3. Demirbas, A. Biodiesel: A Realistic Fuel Alternative for Diesel Engines; Springer: London, UK, 2008. [Google Scholar]
  4. Jin, C.; Pang, X.T.; Zhang, X.Y.; Wu, S.; Ma, M.X.; Xiang, Y.; Ma, J.S.; Ji, J.; Wang, G.; Liu, H.F. Effects of C3-C5 alcohols on solubility of alcohols/diesel blends. Fuel 2019, 236, 65–74. [Google Scholar] [CrossRef]
  5. Huang, H.; Zhu, J.; Zhu, Z.; Wei, H.; Lv, D.; Zhang, P.; Sun, H. Development and validation of a new reduced diesel-n-butanol blends mechanism for engine applications. Energy Convers. Manag. 2017, 149, 553–563. [Google Scholar] [CrossRef]
  6. Chen, Z.; Wu, Z.; Liu, J.; Lee, C. Combustion and emissions characteristics of high n-butanol/diesel ratio blend in a heavy-duty diesel engine and EGR impact. Energy Convers. Manag. 2014, 78, 787–795. [Google Scholar] [CrossRef]
  7. Jin, C.; Yao, M.; Liu, H.; Lee, C.F.; Ji, J. Progress in the production and application of n-butanol as a biofuel. Renew. Sustain. Energy Rev. 2011, 15, 4080–4106. [Google Scholar] [CrossRef]
  8. Huang, H.; Zhou, C.; Liu, Q.; Wang, Q.; Wang, X. An experimental study on the combustion and emission characteristics of a diesel engine under low temperature combustion of diesel/gasoline/n-butanol blends. Appl. Energy 2016, 170, 219–231. [Google Scholar] [CrossRef]
  9. Chen, Z.; Liu, J.; Wu, Z.; Lee, C. Effects of port fuel injection (PFI) of n-butanol and EGR on combustion and emissions of a direct injection diesel engine. Energy Convers. Manag. 2013, 76, 725–731. [Google Scholar] [CrossRef]
  10. Wettstein, S.G.; Alonso, D.M.; Gurbuz, E.I.; Dumesic, J.A. A roadmap for conversion of lignocellulosic biomass to chemicals and fuels. Curr. Opin. Chem. Eng. 2012, 1, 218–224. [Google Scholar] [CrossRef]
  11. Roman-Leshkov, Y.; Barrett, C.J.; Liu, Z.Y.; Dumesic, J.A. Production of dimethylfuran for liquid fuels from biomass-derived carbohydrates. Nature 2007, 447, 982–985. [Google Scholar] [CrossRef]
  12. Tong, X.; Ma, Y.; Li, Y. Biomass into chemicals: Conversion of sugars to furan derivatives by catalytic processes. Appl. Catal. A Gen. 2010, 385, 1–13. [Google Scholar] [CrossRef]
  13. Lovell, W.G. Knocking Characteristics of Pure Hydrocarbons. Ind. Eng. Chem. 1948, 40, 2388–2438. [Google Scholar] [CrossRef]
  14. Rothamer, D.A.; Jennings, J.H. Study of the knocking propensity of 2,5-dimethylfuran–gasoline and ethanol–gasoline blends. Fuel 2012, 98, 203–212. [Google Scholar] [CrossRef]
  15. Zhao, F.; Lai, M.C.; Harrington, D.L. Automotive spark-ignited direct-injection gasoline engines. Prog. Energy Combust. 1999, 25, 437–562. [Google Scholar] [CrossRef]
  16. Hasan, A.O.; Abu-Jrai, A.; Turner, D.; Tsolakis, A.; Xu, H.; Golunski, S.E.; Herreros, J.M. Control of harmful hydrocarbon species in the exhaust of modern advanced GDI engines. Atmos. Environ. 2016, 129, 210–217. [Google Scholar] [CrossRef] [Green Version]
  17. Marseglia, G.; Costa, M.; Catapano, F.; Sementa, P.; Vaglieco, B.M. Study about the link between injection strategy and knock onset in an optically accessible multi-cylinder GDI engine. Energy Convers. Manag. 2017, 134, 1–19. [Google Scholar] [CrossRef]
  18. Costa, R.C.; Sodré, J.R. Hydrous ethanol vs. gasoline-ethanol blend: Engine performance and emissions. Fuel 2010, 89, 287–293. [Google Scholar] [CrossRef]
  19. Palmer, F.H. Vehicle performance of gasoline containing oxygenates. Inst. Mech. Eng. 1986, 319, 33–46. [Google Scholar]
  20. Hsieh, W.D.; Chen, R.H.; Wu, T.L.; Lin, T.H. Engine performance and pollutant emission of an SI engine using ethanol–gasoline blended fuels. Atmos. Environ. 2002, 36, 403–410. [Google Scholar] [CrossRef]
  21. Chen, R.H.; Chiang, L.B.; Chen, C.N.; Lin, T.H. Cold-start emissions of an SI engine using ethanol–gasoline blended fuel. Appl. Eng. 2011, 31, 1463–1467. [Google Scholar] [CrossRef]
  22. Costagliola, M.A.; De, S.L.; Iannaccone, S.; Prati, M.V. Combustion efficiency and engine out emissions of a S.I. engine fueled with alcohol/gasoline blends. Appl. Energy 2013, 111, 1162–1171. [Google Scholar] [CrossRef]
  23. Stępień, Z.; Czerwinski, J.; Comte, P.; Oleksiak, S. Nanoparticle and Non-legislated Gaseous Emissions from a Gasoline Direct-Injection Car with Ethanol Blend Fuels and Detergent Additives. Energy Fuels 2016, 30, 7268–7276. [Google Scholar] [CrossRef]
  24. Ericsson, P.; Holmström, M.; Amberntsson-Carlsson, A.; Ohlson, C.; Skoglundh, M.; Andersson, B.; Carlsson, P. Characterization of Particulate Emissions and Methodology for Oxidation of Particulates from Non-Diesel Combustion Systems. SAE Pap. 2008. [Google Scholar] [CrossRef]
  25. Karavalakis, G.; Short, D.; Vu, D.; Villela, M.; Asa-Awuku, A.; Durbin, T.D. Evaluating the regulated emissions, air toxics, ultrafine particles, and black carbon from SI-PFI and SI-DI vehicles operating on different ethanol and iso-butanol blends. Fuel 2014, 128, 410–421. [Google Scholar] [CrossRef]
  26. Gu, X.; Huang, Z.; Cai, J.; Gong, J.; Wu, X.; Lee, C.F. Emission characteristics of a spark-ignition engine fuelled with gasoline-n-butanol blends in combination with EGR. Fuel 2012, 93, 611–617. [Google Scholar] [CrossRef]
  27. Dernotte, J.; Mounaim-Rousselle, C.; Halter, F.; Seers, P. Evaluation of butanol-gasoline blends in a port fuel-injection, spark-ignition engine. Oil Gas Sci. Technol. 2010, 65, 345–351. [Google Scholar] [CrossRef]
  28. Papagiannakis, R.G.; Rakopoulos, D.C.; Rakopoulos, C.D. Theoretical Study of the Effects of Spark Timing on the Performance and Emissions of a Light-Duty Spark Ignited Engine Running under Either Gasoline or Ethanol or Butanol Fuel Operating Modes. Energies 2017, 10, 1198. [Google Scholar] [CrossRef]
  29. Wigg, B.; Coverdill, R.; Lee, C.F.; Kyritsis, D. Emissions Characteristics of Neat Butanol Fuel Using a Port Fuel-Injected, Spark-Ignition Engine. SAE Tech. Pap. 2011. [Google Scholar] [CrossRef]
  30. Wallner, T.; Frazee, R. Study of Regulated and Non-Regulated Emissions from Combustion of Gasoline, Alcohol Fuels and their Blends in a DI-SI Engine. SAE Tech. Pap. 2010. [Google Scholar] [CrossRef]
  31. He, B.Q.; Liu, M.B.; Yuan, J.; Zhao, H. Combustion and emission characteristics of a HCCI engine fuelled with n-butanol–gasoline blends. Fuel 2013, 108, 668–674. [Google Scholar] [CrossRef]
  32. He, B.Q.; Yuan, J.; Liu, M.B.; Zhao, H. Combustion and emission characteristics of a n-butanol HCCI engine. Fuel 2014, 115, 758–764. [Google Scholar] [CrossRef]
  33. Venugopal, T.; Ramesh, A. Effective utilisation of butanol along with gasoline in a spark ignition engine through a dual injection system. Appl. Eng. 2013, 59, 550–558. [Google Scholar] [CrossRef]
  34. Singh, S.B.; Dhar, A.; Agarwal, A.K. Technical feasibility study of butanol-gasoline blends for powering medium-duty transportation spark ignition engine. Renew. Energy 2015, 76, 706–716. [Google Scholar] [CrossRef]
  35. Bata, R.M.; Elrod, A.C.; Lewandowskia, T.P. Butanol as a blending agent with gasoline for IC engines. SAE Tech. Pap. 1989. [Google Scholar] [CrossRef]
  36. Chen, Z.; Yang, F.; Xue, S.; Wu, Z.; Liu, J. Impact of higher n-butanol addition on combustion and performance of GDI engine in stoichiometric combustion. Energy Convers. Manag. 2015, 106, 385–392. [Google Scholar] [CrossRef]
  37. Chen, Z.; Zhang, Y.; Wei, X.; Zhang, Q.; Wu, Z.; Liu, J. Thermodynamic process and performance of high n-butanol/gasoline blends fired in a GDI production engine running wide-open throttle (WOT). Energy Convers. Manag. 2017, 152, 57–64. [Google Scholar] [CrossRef]
  38. Liu, H.F.; Zhang, P.; Liu, X.L.; Chen, B.L.; Geng, C.; Li, B.; Wang, H.; Li, Z.S.; Yao, M.F. Laser diagnostics and chemical kinetic analysis of PAHs and soot in co-flow partially premixed flames using diesel surrogate and oxygenated additives of n-butanol and DMF. Combust. Flame 2018, 188, 129–141. [Google Scholar] [CrossRef]
  39. Chen, B.L.; Liu, X.L.; Liu, H.F.; Wang, H.; Kyritsis, D.C.; Yao, M.F. Soot reduction effects of the addition of four butanol isomers on partially premixed flames of diesel surrogates. Combust. Flame 2017, 177, 123–136. [Google Scholar] [CrossRef]
  40. Zheng, Z.Q.; Wang, X.F.; Zhong, X.F.; Hu, B.; Liu, H.F.; Yao, M.F. Experimental study on the combustion and emissions fueling biodiesel/n-butanol, biodiesel/ethanol and biodiesel/2,5-dimethylfuran on a diesel engine. Energy 2016, 115, 539–549. [Google Scholar] [CrossRef]
  41. Zheng, Z.Q.; Li, C.L.; Liu, H.F.; Zhang, Y.; Zhong, X.F.; Yao, M.F. Experimental study on diesel conventional and low temperature combustion by fueling four isomers of butanol. Fuel 2015, 141, 109–119. [Google Scholar] [CrossRef]
  42. Christensen, E.; Yanowitz, J.; Ratcliff, M.; McCormick, R.L. Renewable oxygenate blending effects on gasoline properties. Energy Fuel 2011, 25, 4723–4733. [Google Scholar] [CrossRef]
  43. Daniel, R.; Xu, H.; Wang, C.; Richardson, D.; Shuai, S. Combustion performance of 2,5-dimethylfuran blends using dual-injection compared to direct-injection in a SI engine. Appl. Energy 2012, 98, 59–68. [Google Scholar] [CrossRef]
  44. Daniel, R.; Wang, C.; Xu, H.; Tian, G. Effects of combustion phasing, injection timing, relative air-fuel ratio and variable valve timing on SI engine performance and emissions using 2,5-Dimethylfuran. SAE Int. 2012, 5, 855–866. [Google Scholar] [CrossRef]
  45. Shukla, M.K.; Singh, E.; Singh, N.; Singal, S.K. Prospects of 2,5-dimethylfuran as a fuel: Physico-chemical and engine performance characteristics evaluation. J. Mater. Cycles Waste Manag. 2015, 17, 459–464. [Google Scholar] [CrossRef]
  46. Daniel, R.; Tian, G.; Xu, H.; Wyszynski, M.L.; Wu, X.; Huang, Z. Effect of spark timing and load on a DISI engine fueled with 2,5-dimethylfuran. Fuel 2011, 90, 449–458. [Google Scholar] [CrossRef]
  47. Tian, G.; Daniel, R.; Li, H.; Xu, H.; Shuai, S.; Richards, P. Laminar burning velocities of 2,5-dimethylfuran compared with ethanol and gasoline. Energy Fuels 2010, 24, 3898–3905. [Google Scholar] [CrossRef]
  48. Tornatore, C.; Marchitto, L.; Valentino, G.; Corcione, F.E.; Merola, S.S. Optical diagnostics of the combustion process in a PFI SI boosted engine fueled with butanol-gasoline blend. Energy 2012, 45, 277–287. [Google Scholar] [CrossRef]
  49. Sarathy, S.M.; Thomson, M.J.; Togbé, C.; Dagaut, P.; Halter, F.; Mounaim-Rousselle, C. An experimental and kinetic modeling study of n-butanol combustion. Combust. Flame 2009, 156, 852–864. [Google Scholar] [CrossRef]
  50. Yang, B.; Osswald, P.; Li, Y.; Wang, J.; Wei, L.; Tian, Z.; Qi, F.; Kohse-Höinghaus, K. Identification of combustion intermediates in isomeric fuel-rich premixed butanol-oxygen flames at low pressure. Combust. Flame 2007, 148, 198–209. [Google Scholar] [CrossRef]
  51. Szwaja, S.; Naber, J.D. Combustion of n-butanol in a spark-ignition IC engine. Fuel 2010, 89, 1573–1582. [Google Scholar] [CrossRef]
Figure 1. Schematic of the experimental setup. HEPA: High Efficiency Particulate Air filter; OVN: Oven Type Heated Analyzer; CFV: Critical Flow Venturi.
Energies 12 01845 g001
Figure 2. Vehicle speed of the New European Drive Cycle (NEDC) cycle. UDC: Urban Drive Cycle.
Energies 12 01845 g002
Figure 3. Comparison of ignition timing of different fuels at different blending ratios: (a) 20% blending ratio; (b) 75% blending ratio.
Energies 12 01845 g003
Figure 4. Comparison of volumetric fuel consumption (FC) of different fuels at different blending ratios: (a) 20% blending ratio; (b) 50% blending ratio; (c) 75% blending ratio; and (d) 100% blending ratio.
Energies 12 01845 g004
Figure 5. Comparison of equivalent fuel consumption of different fuels at different blending ratios: (a) 20% blending ratio; (b) 50% blending ratio; (c) 75% blending ratio; and (d) 100% blending ratio.
Energies 12 01845 g005
Figure 6. Comparison of CO2 emissions of different fuels at different blending ratios: (a) 20% blending ratio; (b) 50% blending ratio; (c) 75% blending ratio; and (d) 100% blending ratio.
Energies 12 01845 g006
Figure 7. Comparison of CO emissions of different fuels at different blending ratios: (a) 20% blending ratio; (b) 50% blending ratio; (c) 75% blending ratio; and (d) 100% blending ratio.
Energies 12 01845 g007
Figure 8. Comparison of THC emissions of different fuels at different blending ratios: (a) 20% blending ratio; (b) 50% blending ratio; (c) 75% blending ratio; and (d) 100% blending ratio.
Energies 12 01845 g008aEnergies 12 01845 g008b
Figure 9. Comparison of NOX emissions of different fuels at different blending ratios: (a) 20% blending ratio; (b) 50% blending ratio; (c) 75% blending ratio; and (d) 100% blending ratio.
Energies 12 01845 g009aEnergies 12 01845 g009b
Figure 10. Comparison of particle number (PN) emissions of different fuels at different blending ratios: (a) 20% blending ratio; (b) 50% blending ratio; (c) 75% blending ratio; and (d) 100% blending ratio.
Energies 12 01845 g010
Figure 11. Comparison of CO2, volumetric fuel consumption (FC), and equivalent fuel consumption of E20, B20, D20, and gasoline: (a) CO2 emissions; (b) Volumetric FC; and (c) Equivalent FC.
Energies 12 01845 g011aEnergies 12 01845 g011b
Figure 12. Comparison of CO, THC, and NOX emissions of E20, B20, D20, and gasoline: (a) CO emissions; (b) THC emissions; and (c) NOX emissions.
Energies 12 01845 g012
Figure 13. Comparison of particulate matter (PM) and particle number (PN) emissions of E20, B20, D20, and gasoline: (a) PM emissions; (b) PN emissions.
Energies 12 01845 g013
Figure 14. Acceleration time of three, four, and five gears: (a) Acceleration time of three gears; (b) Acceleration time of four gears; (c) Acceleration time of five gears.
Energies 12 01845 g014
Table 1. Detailed engine parameters. GDI: gasoline direct injection.
ParameterGDI Car
Engine typeFour cylinders, four valves per cylinder
Displacement1395 mL
Maximum power96 kW
Air intake systemTurbocharged
Compression ratio10.5
Fuel supply methodDirect injection in cylinder
Exhaust treatmentNo
Knock sensorExists
Emission standardsChina V
Gasoline recommended95#
Maximum design total mass 1765 kg
Table 2. Major equipment.
NameTypeManufacturer
Chassis dynamometerRoadsim48"compactAVL
Emission analyzerMEXA-7200HHoriba
Dilution sampling systemCVS-7200THoriba
Dilution channelDLS-7100EHoriba
Particle counterMEXA-2000SPCSHoriba
High precision electronic balanceMSE6.6S-000-DFSartorius
Table 3. Measurement errors of major instruments and equipment. PN: particle number, PM: particulate matter.
EquipmentTest ItemsMeasurement Error
Emission analyzerCO2≤1% Full scale or 2% measurements, take the minimum
CO
THC
NOX
Particle counterPN<10%
Chassis dynamometerSpeed constant adjustment difference<0.05% Full scale
Time measurement tolerance0.00005%
Traction constant tolerance<0.2% Full scale
Precision electronic balanceFilter paper quality (PM)±1 µg (5% load)
Table 4. Physical and chemical properties of three oxygenated fuels and gasoline [36,45,46].
FuelGasolineEthanoln-Butanol2,5-Dimethylfuran
Molecular formulaC2–C14C2H5OHC4H9OHC6H8O
Molecular weight (g/mol)110.846.0774.1296.1
Research octane number93.110796119
Density at 20 °C (g/mL)0.7450.7890.810.89
Lower heating value (MJ/L)32.921.326.929.3
Laminar flame burning speed at 1 bar, 390K (cm/s)52635750
Viscosity at 20 °C (cSt)0.4–0.81.523.350.57
Surface Tension at 20 °C (mN/m)20–2522.3924. 625.9
Vapor Pressure (kPa)55–103184.081.253
Boiling point (°C)35–2107811792
Latent heat of vaporization (kJ/kg)180–373840546332
H/C ratio1.832.51.3
O/C ratio00.50.250.167
Stoichiometric A/F ratio14.568.9511.1310.72
Stoichiometric CO2 (kg/L, fuel)2.381.511.932.45
Table 5. Key fuel blend properties. Fuel: ethanol–gasoline blends (E), n-butanol–gasoline blends (B), and 2,5-dimethylfuran–gasoline blends (D) with an E/B/D volume percentage of 20%, and so on.
FuelDensity at 20 °C (g/mL)Lower Heating Value (MJ/L)H/C RatioO/C RatioStoichiometric A/F Ratio
E200.75430.62.00.0713.27
E500.76727.12.30.1911.61
E750.77824.22.60.3310.26
B200.75831.71.90.0413.72
B500.77829.92.10.1112.71
B750.79428.42.30.1811.91
D200.77432.21.70.0313.57
D500.81831.11.60.0812.41
D750.85430.21.50.1311.53

