General Correlations of Iso-octane Turbulent Burning Velocities Relevant to Spark Ignition Engines


Department of Mechanical Engineering, National Central University, Tao-yuan City 32001, Taiwan
*
Author to whom correspondence should be addressed.
Energies 2019, 12(10), 1848; https://doi.org/10.3390/en12101848
Submission received: 10 April 2019
/
Revised: 8 May 2019
/
Accepted: 12 May 2019
/
Published: 15 May 2019
(This article belongs to the Special Issue Cleaner Combustion)
Abstract
:A better understanding of turbulent premixed flame propagation is the key for improving the efficiency of fuel consumption and reducing the emissions of spark ignition gasoline engines. In this study, we measure turbulent burning velocities (ST) of pre-vaporized iso-octane/air mixtures over wide ranges of the equivalence ratio (φ = 0.9–1.25, Le ≈ 2.94–0.93), the root-mean-square (r.m.s.) turbulent fluctuating velocity (u′ = 0–4.2 m/s), pressure p = 1–5 atm at T = 358 K and p = 0.5–3 atm at T = 373 K, where Le is the effective Lewis number. Results show that at any fixed p, T and u′, Le < 1 flames propagate faster than Le > 1 flames, of which the normalized iso-octane ST/SL data versus u′/SL are very scattering, where SL is the laminar burning velocity. But when the effect of Le is properly considered in some scaling parameters used in previous correlations, these large scattering iso-octane ST/SL data can be collapsed onto single curves by several modified general correlations, regardless of different φ, Le, T, p, and u′, showing self-similar propagation of turbulent spherical flames. The uncertainty analysis of these modified general correlations is also discussed.
1. Introduction
Designing a better spark ignition (SI) gasoline engine with higher thermal efficiency and lower engine emissions necessitates a thorough understanding of flame kernel initiation and its subsequent flame propagation that take place under high pressure (p), high temperature (T), high r.m.s. turbulent fluctuating velocity (u′) and other complex conditions. For example, the mixture characteristics in the vicinity of an engine top dead center are frequently changed from lean to stoichiometry or even rich when the loads vary from low to high [1]. Besides, the mixture characteristics and values of u′ change from cylinder to cylinder, resulting in the difference of flame initiation and subsequent flame propagation speed. Therefore, the turbulent burning velocity (ST) has been introduced for further understanding of turbulent premixed flame propagation [2]. However, ST data for liquid fuels (e.g., iso-octane, the major component of gasoline surrogate) under SI engine relevant conditions are rare, since most studies applied gaseous fuels (e.g., methane, propane, hydrogen at atmospheric condition [2,3,4,5,6,7] or at elevated pressure and room temperature conditions [8,9,10,11,12,13,14,15,16]). Whether these gaseous ST data could be applicable to SI gasoline engines is still an open issue. To the best knowledge of the authors, the only available iso-octane ST data which satisfied high-T, -p and -u′ conditions were that reported by Lawes et al. [17] and Nguyen et al. [18] using turbulent spherical expanding flame at T = 360 K [17] and 423 K [18]. Clearly, more lean and rich iso-octane ST data under high-T, -p, and -u′ conditions are needed in order to make a detailed comparison with previous gaseous ST data and thus address the question of similarity and difference between liquid iso-octane and gaseous data, as the first objective of this study.
Lean and rich iso-octane/air mixtures have very different Lewis number (Le). For instance, the lean iso-octane/air mixture at the equivalence ratio φ = 0.9 has Le ≈ 2.94 >> 1, while the rich iso-octane/air mixture at φ = 1.25 has Le ≈ 0.93 < 1. Note that Le is the effective Lewis number which is estimated by the ratio between thermal diffusivity and mass diffusivity with the mass diffusivity being that of the deficient reactants and the abundant inert, i.e., Le ≈ Lefuel for lean mixture and Le ≈ Leoxygen for the rich mixture [17]. Hence, the second objective of this paper is to seek possible general correlations of ST with the consideration of the Le effect to represent the liquid iso-octane/air mixture at lean and rich conditions in attempt to enhance our understanding of high-pressure/temperature turbulent flame propagation that may be relevant to SI gasoline engines.
Seeking a general correlation of iso-octane ST data is of high interest for SI engines using liquid fuels, and it is still an unresolved problem. Due to the complexity of turbulence-chemistry interactions, the different configuration of experimental facilities, and the uncertainty of measurement techniques, a general correlation to predict ST is not always clear despite many ST correlations available in literatures (e.g., [2,3,4,8,9,10,12,13,14,15,16,17,18,19,20,21,22,23,24], among others). Thus, in this work we make our efforts to analyze the scaling parameters in some selected correlations by taking the effect of Le into consideration based on the present measured ST data using a single liquid fuel (iso-octane). Therefore, proper scaling parameters including the effect of Le and better modified general correlations using the same liquid iso-octane ST data may be obtained. In this study, five general correlations, all including the effect of Le, are considered and tested by using the current measured iso-octane ST data. Further, a mean absolute percentage error (MAPE) [23] is used to assess the accuracy of these five correlations. The first correlation is the Bradley’s correlation [3]:
is the mean progress variable, i.e., = 0 and = 1 represent reactant and product, respectively. The stretch factor K ≈ 0.25(u′/SL)2(ReT)−0.5 [25], where the turbulent flow Reynolds number ReT = u′LI/ν, LI is the integral length scale, and ν is the kinematic viscosity of reactant. Second, by grouping the scaling parameters in correlations proposed by Kobayashi et al. [19], Chaudhuri et al. [12], and Shy et al. [16] with Le−1, three modified correlations have been reported in Reference [18], respectively as shown below:
〈R〉 is the mean turbulent spherical flame radius, δL is the laminar flame thickness, and α = δLSL is the thermal diffusivity. In Equation (3), the commonly-used integral length scale of turbulence is replaced by the average flame radius 〈R〉 and the kinematic viscosity (ν) is replaced by the thermal diffusivity (α ≈ δLSL), as proposed by Chaudhuri et al. [12,13]. Finally, the fifth correlation is that reported by Ritzinger [20]:
Equation (5) has been tested against methane/air ST data at high-pressure gas engine conditions [26], while Equations (1)–(4) have not yet done so. To see how well these five correlations, Equations (1)–(5), could be applicable to SI engines for ST prediction, an uncertainty comparison is performed by accessing the accuracy of these correlations based on the MAPE value which is calculated using the following equation [23].
xexp,i is the experimental value, xcorr,i is the value predicted by the correlation, and n is the number of the data group under examination.
In short, this work measures ST data of lean, stoichiometric, and rich iso-octane/air mixtures with Le > 1 and Le < 1 using a large dual-chamber, constant pressure/temperature, fan-stirred cruciform explosion facility, capable of generating near-isotropic turbulence. It will be shown in due course that all the scattering ST data of iso-octane/air mixtures can be collapsed onto single curves using Equations (1)–(5). Further, the current iso-octane data are also compared with previous data proposed by Lawes et al. [17]. Finally, the uncertainty of these correlations based on the MAPE is discussed.
2. Experimental Method
Experiments are conducted in a large dual-chamber, constant-temperature, constant-pressure, fan-stirred cruciform explosion facility for SL and ST measurements of expanding spherical iso-octane/air flames. The reader is directed to [18,21] and references therein for detail treatment on the facility and its associated turbulence properties. For completeness, a simplified sketch of the 3D cruciform burner resided in a large pressure vessel with optical accesses is added, as shown in Figure 1, alongside the Schlieren imaging arrangement. Below are the descriptions of the experimental procedures.
Before a run, we first vacuum the heated 3D cruciform burner (Figure 1) and then inject the appropriate mole fractions of pre-vaporized iso-octane and air into the burner to the desired initial pressure and temperature conditions. Two counter-rotating fans at a frequency of 30 Hz are turned on to well mix the iso-octane/air mixture for 4 minutes and reach a uniform temperature distribution with less than 1 °C variation in the domain of experimentation. The temperature uniformity is achieved by using effective turbulent heat convection through a pair of heated perforated plates (please see [18,21] for details). The domain of experimentation is set at 0.17 ≤ 〈R〉/Rmin ≤ 0.30 to avoid the ignition influence at the early stage of kernel development and the wall effects at the later stage of flame propagation, where the minimum wall confinement radius of the 3D cruciform bomb Rmin is about 150 mm. For laminar flame speed measurements, we ignite the mixtures shortly (about 10 s) after the fan turn-off to allow for the decay of turbulence to quiescence, while keeping a uniform temperature distribution in the experimental domain [21]. Centrally-ignited flame initiation and its subsequent flame propagation are recorded by the high-speed Schlieren imaging to obtain the time evolution of the average flame radii 〈R〉(t) = [A(t)/π]0.5, where A(t) is the area enclosed by the laminar/turbulent flame front. The flame speed d〈R〉/dt is obtained by the central differentiation of 〈R〉 vs. t data.
A typical refined gasoline consists of hundreds of different components that may vary batch by batch depending on the source of crude oil and the refinery processes, making the benchmark of ST for gasoline difficult to measure accurately. For simplicity, iso-octane, a major surrogate component for gasoline, is used to gain insight and understanding of the underlying physical mechanism of turbulent premixed flame propagation. As such, this work measures values of ST for iso-octane/air mixtures as a function of φ, u′, p, T, and Le. Table 1 lists laminar properties of the iso-octane/air mixture at various conditions including T, φ, Le, p and corresponding laminar burning velocities (SL). It should be noted that the selected mixtures, i.e., φ = 0.9 & 1.25 at T = 358K at p = 1 atm and φ = 1.0 & 1.2 at T = 373 K at p = 1 atm, have closely matched values of SL (see Table 1) but with different Le (Le > 1 and Le < 1). As such, the effect of Le on ST of iso-octane/air mixtures can be studied.
3. High-Speed Schlieren Imaging of Turbulent Spherical Flame and Their ST Determination
Figure 2 shows the effects of Le and p on the emergence of small scale structures and the increase of average flame propagation rate at fixed u′ with increasing p for both (a) laminar and (b) turbulent cases, where all images have the same 〈R〉 ≈ 35 mm. At any fixed p, the elapsed instants after ignition show that Le < 1 flames (2nd and 4th columns) propagate much faster than Le > 1 flames (1st and 3rd columns). SL decreases with increasing p even though the flame at 5 atm appears more wrinkling due to the emergence of cellular structures allover the flame surface especially for the case at 5 atm and Le ≈ 0.93 < 1 (see the 4th column of the first row images in Figure 2a). For the turbulent case at constant u′ = 1.4 m/s (Figure 2b), the turbulent flame propagates faster with increasing p under both Le > 1 and Le < 1 conditions, where the turbulent wrinkled flame at 5 atm are full of very small scale structures. These fine structures are mainly due to the reduction of the thickness of the laminar flamelet at high pressure that promotes the hydrodynamic instability and thus increases the wrinkled flame front surface, but they contribute only a small part for the increase of ST. This is because when the flow turbulent Reynolds number (ReT,flow = u′LI/ν) is kept constant for gaseous fuels (e.g., methane and syngas), ST actually decreases with increasing pressure, similar to SL, showing a global response of burning velocities to the increase of pressure (please see Reference [11] for detail information). As such, the increase of ST with increasing p at fixed u′ is probably mainly due to the increase of ReT,flow at elevated pressure because ν ~ ρ−1 ~ p−1.
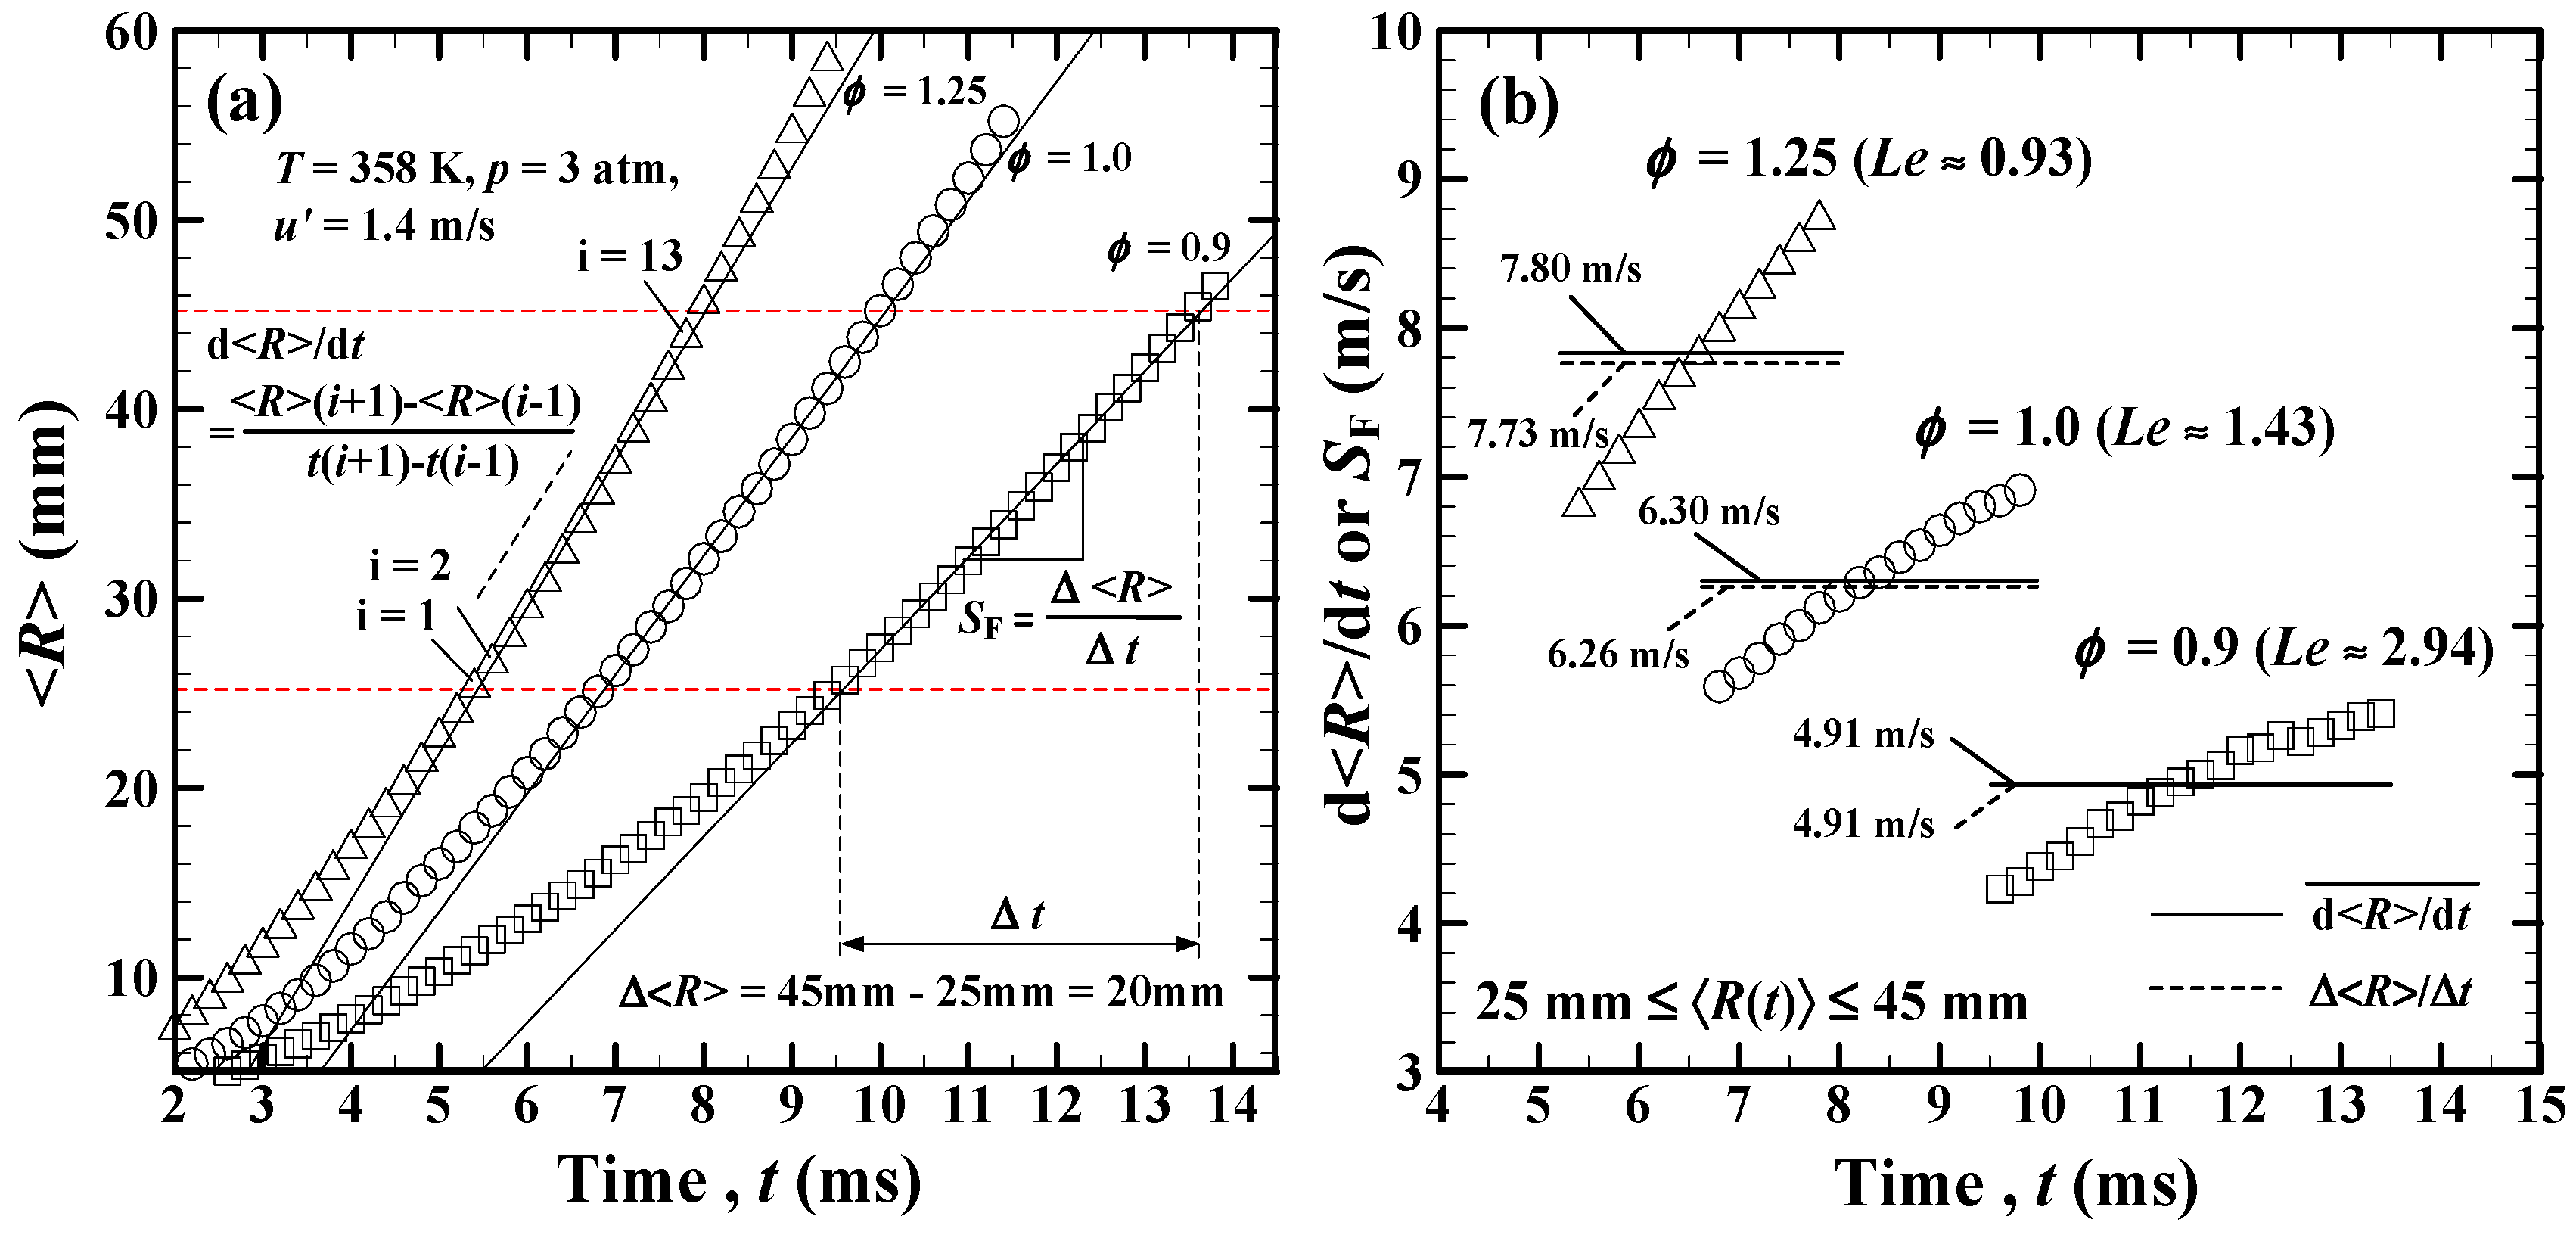
Figure 3a shows the averaged flame radii of iso-octane/air turbulent premixed flames versus time for Le > 1 (φ = 0.9 and 1.0) and Le < 1 (φ = 1.25) at the same p = 3 atm, u′ = 1.4 m/s, and T = 358 K conditions. Flame speeds, d〈R〉(t)/dt and SF or ST, can be estimated from the raw data of 〈R〉(t) within the range of 25 mm ≤ 〈R〉 ≤ 45 mm. d〈R〉/dt is directly taking the time differentiation on 〈R〉(t), while SF is determined as the slope of the best linear-fit of 〈R〉(t) within 25 mm ≤ 〈R〉 ≤ 45 mm. Within this experimentation domain, SF is just the average value of the linear increase d〈R〉/dt data (), as substantiated in Figure 3b. Note that these iso-octane data of 〈R〉 vs. t and d〈R〉/dt vs. t or 〈R〉 in Figure 3 are very similar to previous data obtained from the Leeds fan-stirred explosion bomb [17,28]. It has been shown in Reference [11] that the modified SF using the density correction and Bradley’s mean progress variable converting factor for Schlieren spherical flames at [25], i.e., ST,=0.5 ≈ (ρb/ρu)SF(〈R〉=0.1/〈R〉=0.5)2 = (ρb/ρu)(〈R〉=0.1/〈R〉=0.5)2, show good agreements between Bunsen-type and spherical flames, suggesting that ST determined at the flame surface contour of may be a better representative of itself regardless of different flame geometries. The subscripts b and u indicate burned and unburned gases. For Schlieren expanding spherical turbulent premixed flames, 〈R〉=0.1/〈R〉=0.5 ≈ 1.4 [22,28]. In this work, all measured SF data are converted to turbulent burning velocities at ().
4. Results and Discussion
Figure 4a presents laminar and turbulent burning velocities of iso-octane/air mixtures as a function of p for three different values of φ with different Le varying from 0.93 to 2.94. As increase p, values of SL decrease in a minus power law manner of the form SL ~ , where the exponent nL increases with increasing Le from nL = 0.14 at Le ≈ 0.93 and nL = 0.31 at Le ≈ 1.43 to nL = 0.33 at Le ≈ 2.94. This suggests that Le < 1 flames are less sensitive to pressure elevation than Le > 1 flames. On the other hand, values of increase with increasing p in a positive power law form, i.e., ST ~ , where nT decreases with increasing Le from nT = 0.14 at Le ≈ 0.93 and nT = 0.1 at Le ≈ 1.43 to nT = 0.03 at Le ≈ 2.94. The latter case for the lean iso-octane/air mixture at φ = 0.9 shows that ST ~ p0.03 when u′ = 1.4 m/s. In other words, at large Le ≈ 2.94 >> 1 and u′ = 1.4 m/s, the fine structures allover the flame front surface (Figure 2b) induced by the hydrodynamic instability at high pressure as well as the increase of ReT,flow due to the decrease of kinematic viscosity at elevated pressure only have a rather small influence on ST. The reason for this tiny impact on ST due to the increase of p when u′ = 1.4 m/s is not yet clear, which deserves further studies. Figure 4b presents laminar and turbulent burning velocities as a function of temperature at four different values of u′ for the stoichiometric iso-octane/air mixture at 1 atm. In general, values of SL and increase with increasing T. ~ , where T0 = 298 K. The exponent constant mT = 0.07 is small at small u′ = 1.4 m/s, while the value of mT increases to 1.07 when u′ = 4.2 m/s. This suggests that is not-so-sensitive to the increase of temperature at u′ = 1.4 m/s in line with previous studies by Lipatnikov et al. [29] and Fogla et al. [30] who studied the effect of density ratio on the turbulent flame speed. Note that changing the temperature is equivalent to changing the density ratio between the burned and unburned gases that has insignificant effect on ST at low-to-moderate turbulent intensities [29,30]. However, such temperature enhancement sensitivity increases with increasing u′.
The current ST data obtained at 373 K and 5 atm may not be sufficiently high, since much higher temperatures and pressures are typically observed in SI engines. However, the available ST data of pre-vaporized iso-octane fuel (the major component of gasoline surrogate) even at 373 K and 5 atm are still very rare, which may be important as the first order approximation towards the practical SI engine conditions. Moreover, these experimental results are useful because they can be used to improve current models for the predication of turbulent flame speeds of pre-vaporized iso-octane fuel at high p and high T.
All present ST,=0.5/SL of iso-octane/air mixtures at φ = 0.9–1.25 at T = 358 K and/or 373 K together with previous data at φ = 1.0 and at T = 423 K [18] are grouped onto two data sets having Le < 1 and Le > 1 and plotted against turbulent intensities (u′/SL), as shown in Figure 5. Results show that Le < 1 flames with ST,=0.5/SL = 2.54(u′/SL)0.53 having a poor goodness R2 = 0.58 propagates faster than Le > 1 flames with ST,=0.5/SL = 1.76(u′/SL)0.64 and R2 = 0.65, revealing large data scattering. Note that the increase of ST,=0.5/SL with u′/SL is not linear. There is a bending effect of ST,=0.5/SL at higher u′/SL for both Le < 1 and Le > 1 flames. Such bending effect has been discussed by many studies (e.g., [2,4,11,19,22,25] among others), which is mainly attributed to the turbulent flame stretch effect. At higher u′/SL, the two fitting curves are getting closer to each other, suggesting that the effect of Le is getting weaker in intense turbulence. Nevertheless, it is obvious that the Le effect should be considered in any scaling correlations.
First, we discuss the correlation of Equation (1) proposed by Bradley et al. [3] which is used to fit all data from Figure 5. The result is presented in Figure 6, suggesting that the Bradley’s correlation can be used to fit all scattering ST data for Le > 1 and Le < 1 flames with a better goodness of R2 = 0.77 than that in Figure 5. In [3], Bradley et al. noted that Equation (1) was limited within the range of KLe between 0.01 and 0.63 and, if outside that range, the logarithmic plots of ut/u′k (or ST/u′) against KLe has large data scattering (please see Reference [3]). Also plotted in Figure 6 for comparison is the original version of Equation (1): ST,=0.5/u′ = 0.88 (KLe)−0.3 based on various gaseous mixtures [3]. The present pre-factor 0.55 is 62.5% of the previous pre-factor of 0.88 as in [3], probably due to different liquid and gaseous fuels applied.
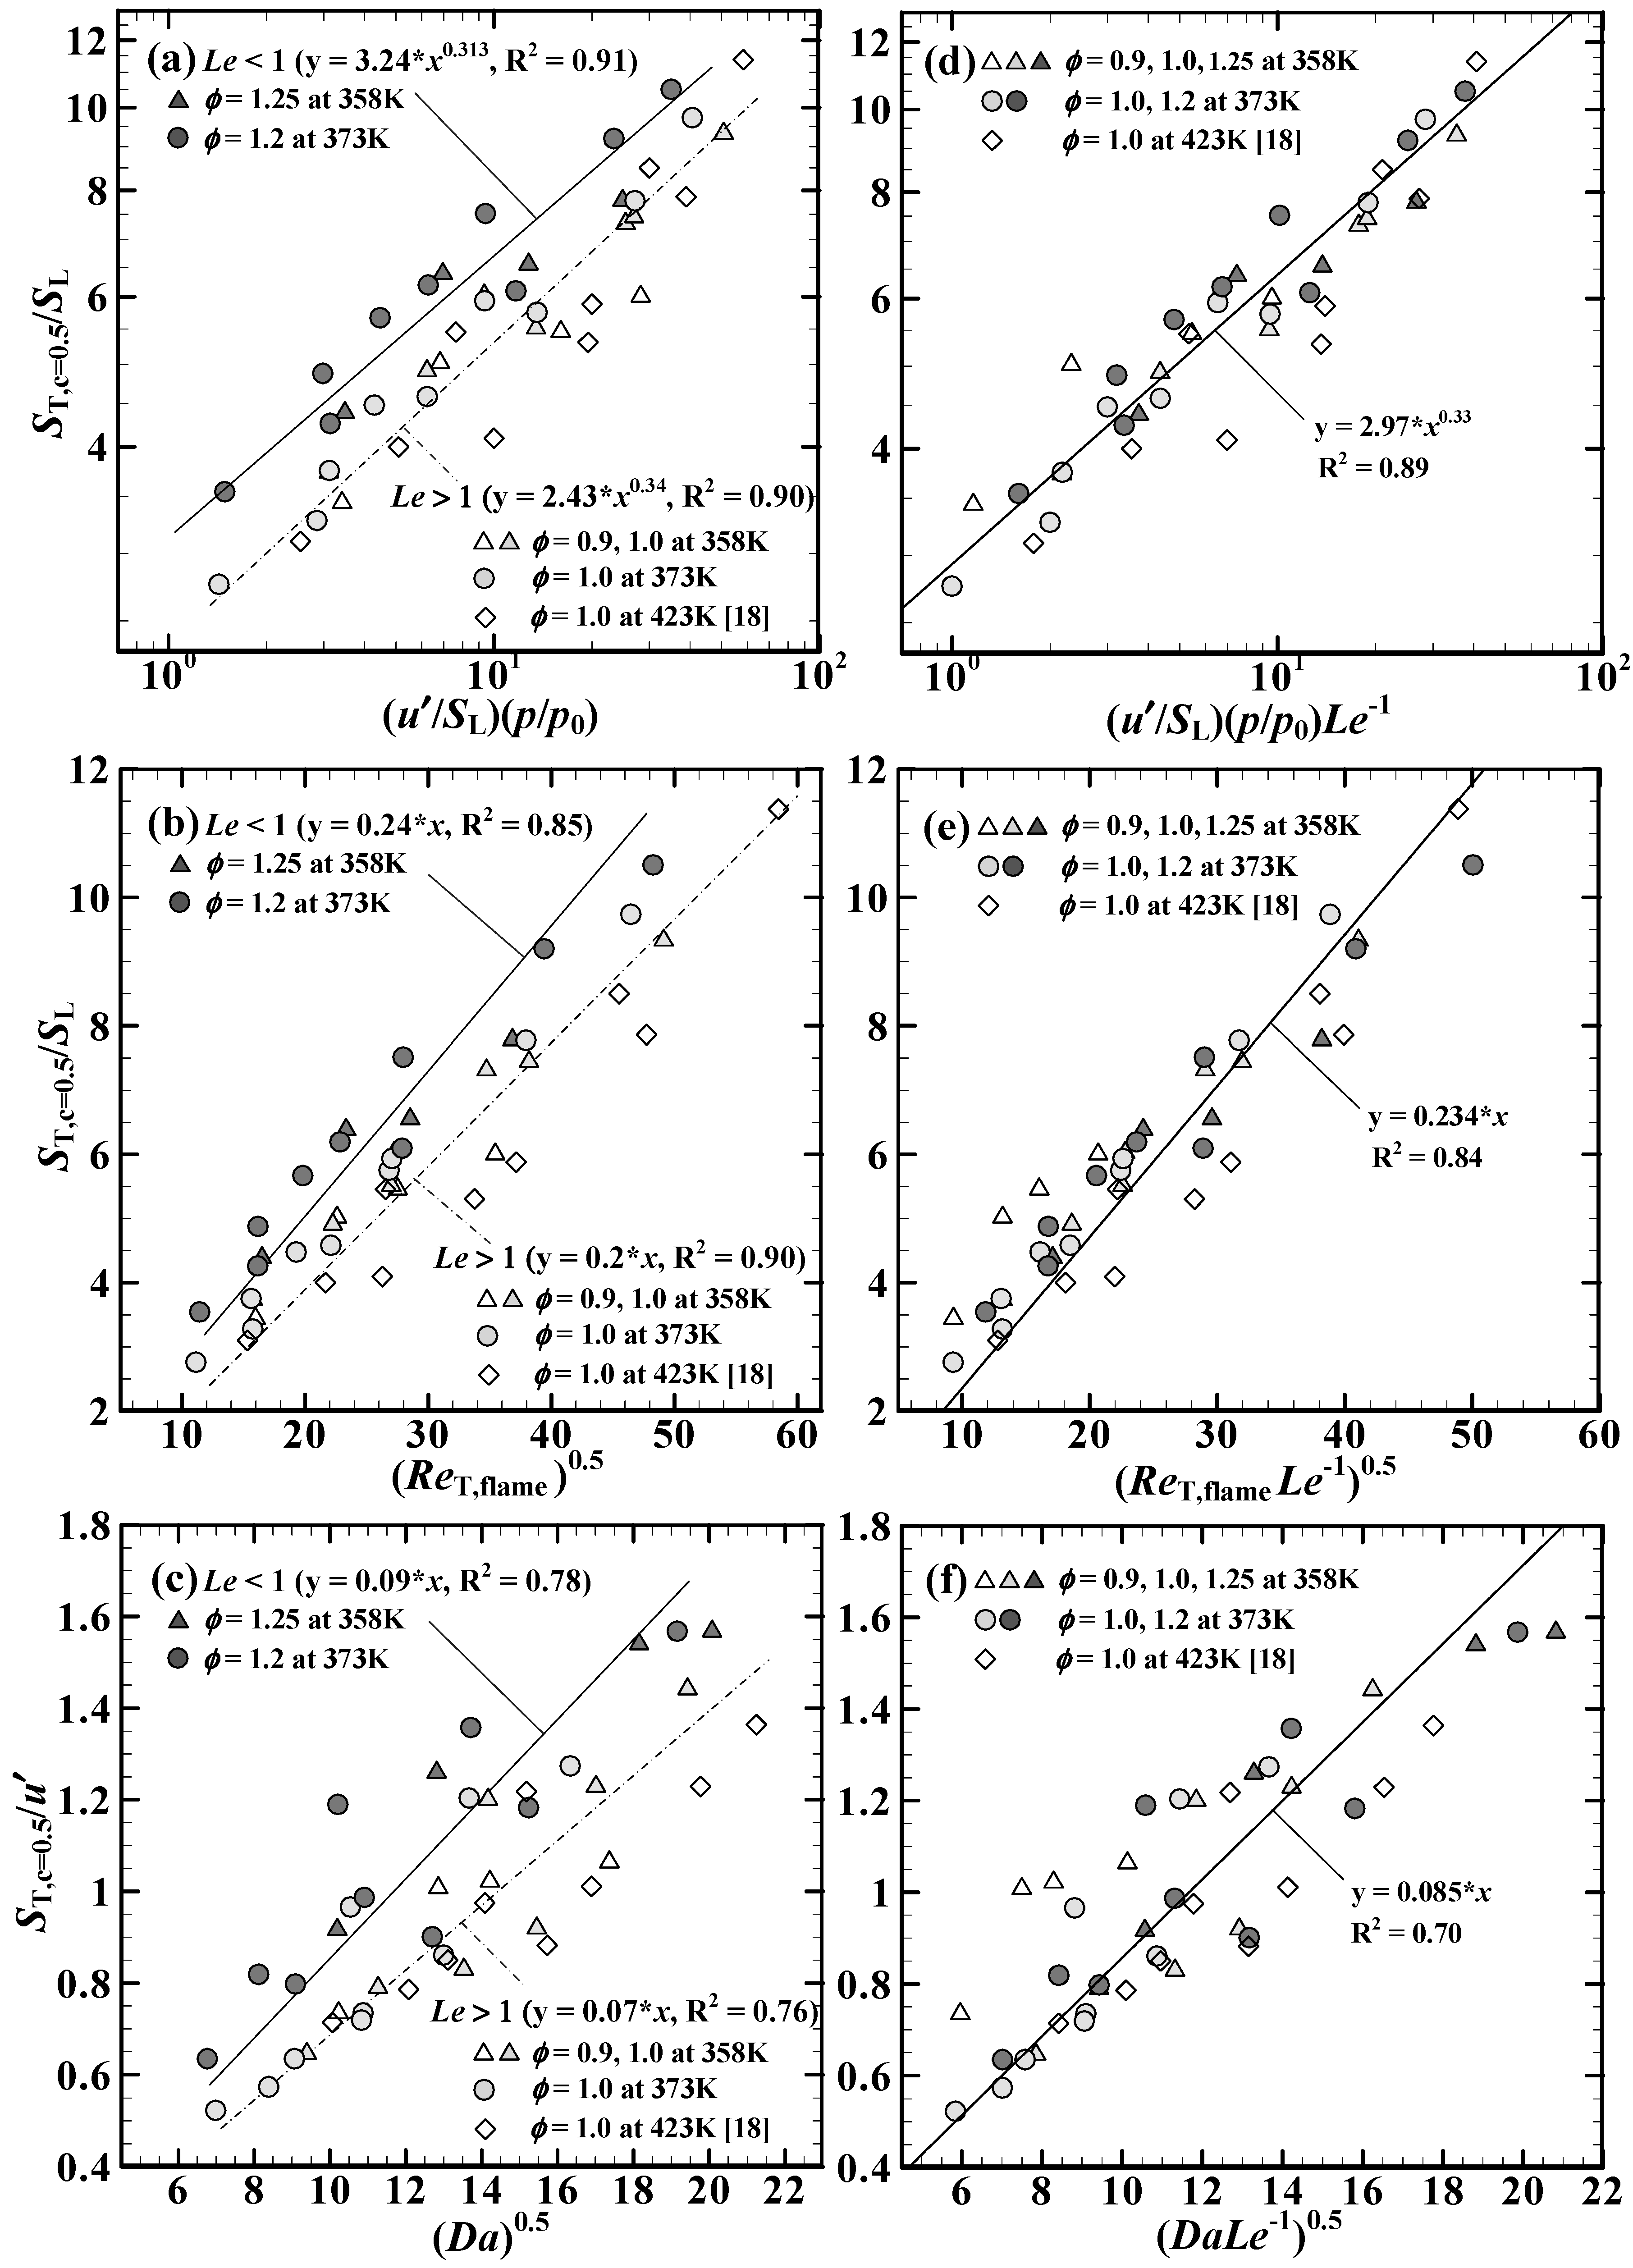
Figure 7a–c show the normalized ST,=0.5 data by their corresponding values of SL and/or u′ for iso-octane/air mixtures with Le > 1 and Le < 1 using the earlier versions of Equations (2)–(4) without the consideration of Le. These three earlier versions of scaling parameters are respectively: (a) (u′/SL)(p/p0) proposed by Kobayashi et al. [8,19], (b) (ReT,flame)0.5 by Chaudhuri et al. [12], and (c) (Da)0.5 by Shy et al. [10,11,16]. The results clearly show two distinct data sets with Le < 1 flames (dark grey symbols) propagating faster than Le > 1 flames (white and light grey symbols) for all three correlations as shown in Figure 7a–c. Clearly, the effect of Le must be taken into the consideration to obtain possible general correlations. When the aforesaid three scaling parameters are grouped with Le−1, all present iso-octane ST,=0.5 data can be collapsed onto single curves, as shown in Figure 7d–f, suggesting that the propagation of iso-octane turbulent premixed spherical flames is self-similar, regardless of different Le, φ, p, and u’ applied. The goodness between these three modified correlations varies from R2 ≈ 0.89 using Equation (2) and R2 ≈ 0.84 using Equation (3) to R2 ≈ 0.7 using Equation (3), all based on the same iso-octane/air ST,=0.5 data.
The final ST,=0.5/SL correlation to be discussed is Equation (5) proposed by Ritzinger [20] based on a complicated empirical relation in the form of . Results are presented in Figure 8, where all the present iso-octane ST,=0.5 data can be well collapsed onto a single curve with R2 = 0.89. In general, Equations (1)–(5) can be used as general correlations for both present liquid iso-octane/air and preveous gaseous turbulent burning velocities with reasonably good R2, regardless of different fuel, φ, Le, u’, T and p applied.
Here we apply Equation (6) to estimate MAPE and the results are shown in Figure 9. MAPE is a better statistical variable than the goodness R2, because the latter depends strongly on the available data volume to estimate the uncertainty of these five general correlations (Equations (1)–(5)). Note that the lower the MAPE is, the more accuracy of the correlation is. All MAPE percentages for the aforesaid five general correlations are less than 13%, showing that these general correlations are reasonably good. Among them, the best is Equation (5) proposed by Ritzinger [20] with a lowest MAPE of 8.5% and the second best is Equation (2) proposed by Kobayashi et al. [8,19] with a MAPE of 9.6%. The other three general correlations (Equations (1), (3), (4)) have roughly the same MAPE (11.9%–12.9%). It should be noted that Equation (2) is probably the most convenient one to use, because it does not require any length scales of turbulence and flame.
We now discuss the iso-octane comparison between the present data and previous data obtained by Lawes et al. [17] using Equation (4). The comparison results are presented in Figure 10. The main reason that we use Equation (4) for comparison is because the Damköhler number (Da) to the one half power has been extensively used by Peters [31]. Besides, Da = (LI/u′)(SL/δL) includes the important integral length scale of turbulence (LI), but Equation (2) and Equation (3) do not include LI. A good agreement between present and previous data is found. Both present and previous iso-octane ST,=0.5 data can be represented by a scaling relation of ST,=0.5/u′ = 0.082 (DaLe−1)0.5 with a reasonable goodness of R2 = 0.78.
5. Conclusions
Turbulent burning velocities of lean, stoichiometric and rich iso-octane/air mixtures having Le < 1 and Le > 1 are measured under elevated pressures and temperatures relevant to SI gasoline engine or micro gas turbine conditions. These measurements reveal the following points:
(1) Turbulent burning velocities increase with increasing pressure and temperature at any given r.m.s turbulent fluctuating velocities. However, the increase of turbulent burning velocities is quite small at modest u′ = 1.4 m/s, which is much less sensitive with the increase of pressure and temperature as compared to that at higher values of u′.
(2) The bending effect of ST,=0.5/SL vs. u′/SL curves is observed at higher u′/SL.
(3) Le < 1 flames (the rich iso-octane/air mixture) propagate faster than Le > 1 flames (lean and/or stoichiometric iso-octane/air mixtures) at any given conditions.
(4) All present iso-octane ST,c = 0.5 data with Le < 1 and Le > 1 can be collapsed onto single curves regardless of different T, p, u′, φ, and Le used, which can be represented by five general correlations (Equations (1)–(5)), suggesting that turbulent premixed spherical flames have a self-similar propagation nature. These five general correlations have reasonable good accuracy due to their low values of MAPE (MAPE < 13%).
The fundamental understanding of flame initiation and propagation of lean iso-octane/air mixtures through the interactions of centrally-ignited outwardly-propagating premixed flame and intense turbulence at high pressure and high temperature is of importance for the future development of high-thermal-efficiency SI gasoline engines operated at fuel lean conditions. This is because premixed lean-burn technology can increase the mixture specific heat ratio and decrease the net heat loss to the engine cylinder through low temperature combustion, resulting in higher thermal efficiency and lower NOx emissions [32]. As pointed out by Nakata et al. [32], super lean-burn combustion with a very strong tumble flow (very high u′) in a long stroke cylinder is crucial to further enhance the maximum engine thermal efficiency up to 50% [33]. Hence, for the future research direction, the ST information of iso-octane (the major component of gasoline surrogate) at extreme conditions, e.g., leaner mixtures (φ = 0.6–0.8), higher u′ > 4.2 m/s and higher p > 5 atm, are needed.
Author Contributions
Conceptualization, S.S.S.; methodology, S.S.S.; validation, M.T.N., D.Y., and C.C.; formal analysis, M.T.N., D.Y., C.C., and S.S.S.; investigation, M.T.N., D.Y., C.C., and S.S.S.; resources, S.S.S.; data curation, M.T.N., D.Y., C.C., S.S.S.; Writing—Original Draft preparation, M.T.N., S.S.S.; Writing—Review and Editing, S.S.S.; visualization, M.T.N., D.Y., and C.C.; supervision, S.S.S.; project administration, S.S.S.
Funding
This research was funded by the MINISTRY OF SCIENCE AND TECHNOLOGY, TAIWAN, grant number MOST 106-2221-E-008-054-MY3; 106-2923-E-008-004-MY3, for which we are greatly appreciated.
Conflicts of Interest
The authors declare no conflict of interest.
References
- Tropina, A.A.; Shneider, M.N.; Miles, R.B. Ignition by short duration, nonequilibrium plasma: Basic concepts and applications in internal combustion engines. Combust. Sci. Technol. 2016, 188, 831–852. [Google Scholar] [CrossRef]
- Abdel-Gayed, R.G.; Bradley, D.; Lawes, M. Turbulent burning velocities: A general correlation in terms of training rates. Proc. R. Soc. A 1987, 414, 389–413. [Google Scholar] [CrossRef]
- Bradley, D.; Lau, A.K.C.; Lawes, M. Flame stretch rate as a determinant of turbulent burning velocity. Philos. Trans. R. Soc. Lond. A 1992, 338, 359–387. [Google Scholar]
- Ronney, P.D. Modeling in Combustion Science; Springer: Berlin, Germany, 1994; pp. 3–20. [Google Scholar]
- Lipatnikov, A.N.; Chomiak, J. Turbulent flame speed and thickness: Phenomenology, evaluation, and application in multi-dimensional simulations. Prog. Energy Combust. Sci. 2002, 28, 1–74. [Google Scholar] [CrossRef]
- Lipatnikov, A.; Chomiak, J. Molecular transport effects on turbulent flame propagation and structure. Prog. Energy Combust. Sci. 2005, 31, 1–73. [Google Scholar] [CrossRef]
- Driscoll, J.F. Turbulent premixed combustion: Flamelet structure and its effect on turbulent burning velocities. Prog. Energy Combust. Sci. 2008, 34, 91–134. [Google Scholar] [CrossRef]
- Kobayashi, H.; Kawazoe, H. Flame instability effects on the smallest wrinkling scale and burning velocity of high-pressure turbulent premixed flames. Proc. Combust. Inst. 2000, 28, 375–382. [Google Scholar] [CrossRef]
- Cheng, R.K.; Littlejohn, D.; Strakey, P.A.; Sidwell, T. Laboratory investigations of a low-swirl injector with H2 and CH4 at gas turbine conditions. Proc. Combust. Inst. 2009, 32, 3001–3009. [Google Scholar] [CrossRef]
- Liu, C.C.; Shy, S.S.; Chen, H.C.; Peng, M.W. On interaction of centrally ignited, outwardly propagating premixed flames with fully developed isotropic turbulence at elevated pressure. Proc. Combust. Inst. 2011, 33, 1293–1299. [Google Scholar] [CrossRef]
- Liu, C.; Shy, S.S.; Peng, M.; Chiu, C.; Dong, Y. High-pressure burning velocities measurements for centrally ignited premixed methane/air flames interacting with intense near-isotropic turbulence at constant Reynolds numbers. Combust. Flame 2012, 159, 2608–2619. [Google Scholar] [CrossRef]
- Chaudhuri, S.; Wu, F.; Zhu, D.; Law, C.K. Flame speed and self-similar propagation of expanding turbulent premixed flames. Phys. Rev. Lett. 2012, 108, 044503. [Google Scholar] [CrossRef] [PubMed]
- Chaudhuri, S.; Wu, F.; Law, C.K. Scaling of turbulent flame speed for expanding flames with Markstein diffusion considerations. Phys. Rev. E 2013, 88, 033005. [Google Scholar] [CrossRef]
- Wu, F.; Saha, A.; Chaudhuri, S.; Law, C.K. Propagation speeds of expanding turbulent flames of C4 to C8 n-alkanes at elevated pressures: Experimental determination, fuel similarity, and stretch-affected local extinction. Proc. Combust. Inst. 2015, 35, 1501–1508. [Google Scholar] [CrossRef]
- Venkateswaran, P.; Marshall, A.; Seitzman, J.; Lieuwen, T. Scaling turbulent flame speeds of negative Markstein length fuel blends using leading points concepts. Combust. Flame 2015, 162, 375–387. [Google Scholar] [CrossRef]
- Shy, S.S.; Liu, C.C.; Lin, J.Y.; Chen, L.L.; Lipatnikov, A.N.; Yang, S.I. Correlations of high-pressure lean methane and syngas turbulent burning velocities: Effects of turbulent Reynolds, Damköhler, and Karlovitz numbers. Proc. Combust. Inst. 2015, 35, 1509–1516. [Google Scholar] [CrossRef]
- Lawes, M.; Ormsby, M.P.; Sheppard, C.G.W.; Woolley, R. The turbulent burning velocity of iso-octane/air mixtures. Combust. Flame 2012, 159, 1949–1959. [Google Scholar] [CrossRef] [Green Version]
- Nguyen, M.T.; Yu, D.W.; Shy, S.S. General correlations of high pressure turbulent burning velocities with the consideration of Lewis number effect. Proc. Combust. Inst. 2019, 37, 2391–2398. [Google Scholar] [CrossRef]
- Kobayashi, H.; Seyama, K.; Hagiwara, H.; Ogami, Y. Burning velocity correlation of methane/air turbulent premixed flames at high pressure and high temperature. Proc. Combust. Inst. 2005, 30, 827–834. [Google Scholar] [CrossRef]
- Ritzinger, J. Einfluss der Kraftstoffe RON95, Methan und Ethanol auf Flammenausbreitung und Klopfverhalten in Ottomotoren mit Abgasrückführung. Ph.D. Thesis, ETH Zürich, Zürich, Switzerland, 2013. [Google Scholar]
- Jiang, L.J.; Shy, S.S.; Li, W.Y.; Huang, H.M.; Nguyen, M.T. High-temperature, high-pressure burning velocities of expanding turbulent premixed flames and their comparison with Bunsen-type flames. Combust. Flame 2016, 172, 173–182. [Google Scholar] [CrossRef]
- Bradley, D.; Lawes, M.; Liu, K.; Mansour, M.S. Measurements and correlations of turbulent burning velocities over wide ranges of fuels and elevated pressures. Proc. Combust. Inst. 2013, 34, 1519–1526. [Google Scholar] [CrossRef] [Green Version]
- Burke, E.M.; Güthe, F.; Monaghan, R.F.D. A comparison of turbulent flame speed correlations for hydrocarbon fuels at elevated pressures. In Proceedings of the ASME Turbo Expo 2016: Turbomachinery Technical Conference and Exposition, Seoul, Korea, 13–17 June 2016. [Google Scholar]
- Muppala, S.P.R.; Aluri, N.K.; Dinkelacker, F.; Leipertz, A. Development of an algebraic reaction rate closure for the numerical calculation of turbulent premixed methane, ethylene, and propane/air flames for pressures up to 1.0 MPa. Combust. Flame 2005, 140, 257–266. [Google Scholar] [CrossRef]
- Bradley, D.; Lawes, M.; Mansour, M.S. Correlation of turbulent burning velocities of ethanol–air, measured in a fan-stirred bomb up to 1.2 MPa. Combust. Flame 2011, 158, 123–138. [Google Scholar] [CrossRef]
- Ratzke, A.; Schöffler, T.; Kuppa, K.; Dinkelacker, F. Validation of turbulent flame speed models for methane–air-mixtures at high pressure gas engine conditions. Combust. Flame 2015, 162, 2778–2787. [Google Scholar] [CrossRef]
- Peng, M.W.; Shy, S.S.; Shiu, Y.W.; Liu, C.C. High pressure ignition kernel development and minimum ignition energy measurements in different regimes of premixed turbulent combustion. Combust. Flame 2013, 160, 1755–1766. [Google Scholar] [CrossRef]
- Bradley, D.; Haq, M.Z.; Hicks, R.A.; Kitagawa, T.; Lawes, M.; Sheppard, C.G.W.; Woolley, R. Turbulent burning velocity, burned gas distribution, and associated flame surface definition. Combust. Flame 2003, 133, 415–430. [Google Scholar] [CrossRef]
- Lipatnikov, A.N.; Li, W.Y.; Jiang, L.J.; Shy, S.S. Does density ratio significantly affect turbulent flame speed? Flow Turbul. Combust. 2017, 98, 1153–1172. [Google Scholar] [CrossRef] [PubMed]
- Fogla, N.; Creta, F.; Matalon, M. The turbulent flame speed for low-to-moderate turbulence intensities: Hydrodynamic theory vs. experiments. Combust. Flame 2017, 175, 155–169. [Google Scholar] [CrossRef]
- Peters, N. The turbulent burning velocity for large-scale and small-scale turbulence. J. Fluid Mech. 1999, 384, 107–132. [Google Scholar] [CrossRef]
- Nakata, K.; Nogawa, S.; Takahashi, D.; Yoshihara, Y.; Kumagai, A.; Suzuki, T. Engine technologies for achieving 45% thermal efficiency of S.I. engine. SAE Int. J. Eng. 2015, 9, 179–192. [Google Scholar] [CrossRef]
- Maruta, K.; Nakamura, H. Super lean-burn in SI engine and fundamental combustion studies. J. Combust. SOC. Jpn. 2016, 58, 9–19. [Google Scholar]
Figure 1.
The high-pressure/temperature, double-chamber explosion facility for premixed turbulent combustion studies [27].
Figure 1.
The high-pressure/temperature, double-chamber explosion facility for premixed turbulent combustion studies [27].

Figure 2.
High-speed Schlieren images of lean and rich iso-octane/air expanding spherical premixed flames, i.e., φ = 0.9 with Le ≈ 2.94 > 1 and φ = 1.25 with Le ≈ 0.93 < 1 at 358 K, showing effects of Lewis number and pressure on the emergence of small scale structures and the increase in average flame propagation rate at fixed u′ = 1.4 m/s where the flow turbulent Reynolds number (ReT,flow = u′LI/ν) increases with pressure because ν ~ ρ−1 ~ p−1. All images in both (a) laminar and (b) turbulent cases have the same 〈R〉 ≈ 35mm in the same view field of 110 mm × 110 mm for comparison.

Figure 3.
(a) Typical averaged flame radii of turbulent iso-octane/air premixed flames as a function of time at three different values of φ with Le > 1 (φ = 0.9 and 1.0) and Le < 1 (φ = 1.25) under the same p = 3 atm, u′ = 1.4 m/s and T = 358 K conditions. (b) Two turbulent flame speeds versus time, d⟨R⟩/dt and SF (the slope of ⟨R⟩(t)) as indicated in (a), which are almost equal to each other within 25 mm ≤ 〈R(t)〉 ≤ 45 mm.

Figure 4.
(a) Laminar burning velocities and turbulent burning velocities at = 0.5 of the iso-octane/air mixtures at three different φ with Le < 1 and Le > 1 as a function of pressure, where T = 358 K and u′ = 1.4 m/s. (b) Effect of temperature on SL and ST at = 0.5 having four different u′ varying from 0 to 4.2 m/s.

Figure 5.
Normalized turbulent burning velocities at = 0.5 plotted against turbulent intensities (u′/SL) at different pressure p = 0.5–3 atm at 373 K and p = 1–5 atm at 358 K and/or 423 K.
Figure 5.
Normalized turbulent burning velocities at = 0.5 plotted against turbulent intensities (u′/SL) at different pressure p = 0.5–3 atm at 373 K and p = 1–5 atm at 358 K and/or 423 K.

Figure 6.
Normalized turbulent burning velocities of iso-octane/air mixtures using the Bradley’s correlation [3]: ST,=0.5/u′ = 0.55(KLe)−0.3. The dashed line was the original version of previous data obtained by Bradley et al. [3], where ST,=0.5/u′ = 0.88(KLe)−0.3.

Figure 7.
Left column: Normalized turbulent burning velocities for iso-octane/air mixtures plotted against three different scaling parameters: (a) (u′/SL)(p/p0) [8,19]; (b) (ReT,flame)0.5 [12]; (c) (Da)0.5 [10,11,16], all showing that Le < 1 flames propagate faster than Le > 1 flames having considerable data scattering. Right column: Same data from (a)–(c), but plotted against three modified scaling parameters grouped with Le−1: (d) (u′/SL)(p/p0)Le−1 (Equation (2)); (e) (ReT,flameLe−1)0.5 (Equation (3)); (f) (DaLe−1)0.5 (Equation (4)), in which both Le < 1 and Le > 1 data sets are collapsed onto single curves.

Figure 8.
Normalized turbulent burning velocities of iso-octane/air mixtures using Equation (5).

Figure 9.
The accuracy of five general correlations determined through the use of mean absolute.

Figure 10.
Comparison of present data with previous data obtained by Lawes et al. [17] using Equation (4) for the same iso-octane/air mixtures.
Figure 10.
Comparison of present data with previous data obtained by Lawes et al. [17] using Equation (4) for the same iso-octane/air mixtures.


Table 1.
Conditions and properties of iso-octane/air mixtures.
| T (K) | φ | Le | p (atm) | SL (cm/s) |
|---|---|---|---|---|
| 358 | 0.9/1.0/1.25 | 2.94/1.43/0.93 | 1, 3, 5 | 41.0, 26.2, 24.8/45.0, 31.2, 27.6/40.2, 32.9, 28.2 |
| 373 | 1.0/1.2 | 1.43/ 0.93 | 0.5, 1, 3 | 49.0, 44.9, 31.0/47.0, 44.6, 36.0 |
| 423 1 | 1.0 | 1.43 | 1, 3, 5 | 55.0, 42.0, 36.0 |
1 Previous data at 423 K [18].
© 2019 by the authors. Licensee MDPI, Basel, Switzerland. This article is an open access article distributed under the terms and conditions of the Creative Commons Attribution (CC BY) license (http://creativecommons.org/licenses/by/4.0/).
Share and Cite
MDPI and ACS Style
Nguyen, M.T.; Yu, D.; Chen, C.; Shy, S. General Correlations of Iso-octane Turbulent Burning Velocities Relevant to Spark Ignition Engines. Energies 2019, 12, 1848. https://doi.org/10.3390/en12101848
AMA Style
Nguyen MT, Yu D, Chen C, Shy S. General Correlations of Iso-octane Turbulent Burning Velocities Relevant to Spark Ignition Engines. Energies. 2019; 12(10):1848. https://doi.org/10.3390/en12101848
Chicago/Turabian StyleNguyen, Minh Tien, Dewei Yu, Chunyen Chen, and Shenqyang (Steven) Shy. 2019. "General Correlations of Iso-octane Turbulent Burning Velocities Relevant to Spark Ignition Engines" Energies 12, no. 10: 1848. https://doi.org/10.3390/en12101848
Note that from the first issue of 2016, this journal uses article numbers instead of page numbers. See further details here.