Energy and Luminous Performance Investigation of an OPV/ETFE Glazing Element for Building Integration
by
 , , ,
, , ,
Álex Moreno
1 ,
,
Daniel Chemisana
1,*,
Rodolphe Vaillon
2,
Alberto Riverola
1 and
Alejandro Solans
1 1
Applied Physics Section of the Environmental Science Department, University of Lleida, 25001 Lleida, Spain
2
IES, Université de Montpellier, CNRS, 34000 Montpellier, France
*
Author to whom correspondence should be addressed.
Energies 2019, 12(10), 1870; https://doi.org/10.3390/en12101870
Submission received: 15 April 2019
/
Revised: 5 May 2019
/
Accepted: 10 May 2019
/
Published: 16 May 2019
(This article belongs to the Special Issue Innovative Technologies for Buildings Energy Efficiency and NZEB Targets)
Abstract
:The combination of architectural membranes such as ethylene tetrafluoroethylene (ETFE) foils and organic photovoltaic (OPV) cells offers a wide range of possibilities for building integration applications. This is due to their flexibility, free-shape, variable color and semitransparency, light weight, cost-effectivity, and low environmental impact. In addition, electrical generation is provided. Four configurations of ETFE foils designed to be integrated onto a south façade glazing element were studied for two representative European locations with different climatic conditions: Barcelona and Paris. These configurations comprise a reference one based on a double ETFE foil with a 10 mm air gap in between, and the other three incorporate on the inner ETFE foil either OPV cells covering 50% or 100% of its surface or a shading pattern printed on it covering 50% of its surface. Results show that, in terms of energy, the configuration with higher OPV coverage area is the one achieving the lowest net energy consumption in both locations. However, when looking at the illumination comfort this option results in insufficient illumination levels. Therefore, a tradeoff strategy balancing energy performance and illumination comfort conditions is necessary. Based on that, the best solution found for both cities is the configuration integrating OPV cells covering 50% of the glazing area and for a window to wall ratio of 0.45.
1. Introduction
It is widely known that the building sector is the largest energy consumer in the world. In the European Union (EU), buildings are responsible for approximately 40% of energy consumption and 36% of carbon dioxide emissions. These figures are explained by the simple fact that 75% of the buildings in Europe are energy inefficient [1]. In addition, energy demand in buildings keeps on rising because of an improved access to energy in developing countries, a more intense use of energy-consuming devices, and a rapid growth in floor area in buildings (around 3% per year) [2].
With the aim of alleviating and then reversing this trend, the European Union defined a series of policies. The last Directive of the European Parliament is the 2018/844, which amends Directive 2010/31/EU on the energy performance of buildings and Directive 2012/27/EU on energy efficiency. This new Directive extends the so-called ″20-20-20″ goals (20% increase in energy efficiency, 20% reduction of CO2 emissions from 1990 levels, and 20% of energy production from renewables) to be reached by 2020, to more demanding ones to be fulfilled by 2030. The new targets set that energy efficiency should be improved by 32.5%, greenhouse gas emissions should be decreased by 40%, and 32% of energy production should be from renewables [3].
In order to meet these requirements for buildings, a smart solution is to integrate photovoltaic systems into buildings. Using a combination of insulating and glazing elements for shading control, building integrated photovoltaics (BIPV) not only provides electrical power, but also fulfills an architectural function. With the functions that add to electrical power generation, BIPV is a promising and strategic technology which is able to address simultaneously the requirements of higher renewable energy share and better energy efficiency. In recent years, different approaches have been used for developing BIPV. The most common approach is to use glass-based structures [4]. Nonetheless, a growing percentage of architectural designs makes use of lighter transparent structures which offer larger flexibility for shapes and functionalities in comparison to the glass-based structures [5]. Polymeric foils and membranes have emerged as a potential candidate to properly cover those characteristics of flexibility and lightness. Among the available polymer materials, ethylene tetrafluoroethylene (ETFE) is one of the most accepted since it possesses the highly adequate characteristics for being integrated into buildings: Light, flexible, transparent, self-cleaning, mechanically adequate, stable, thermally insulating, and environmentally friendly [6]. In particular, several articles point out that the environmental impact of ETFE is less than that of glass [6,7].
Concerning the photovoltaic technologies that are best suited for integration into buildings, organic photovoltaic (OPV) cells are attractive thanks to several characteristics: Light, semitransparent, free-form, flexible, cost-effective, performant under low-light and diffuse light illuminations, and one of the most eco-friendly photovoltaic (PV) technologies [8,9]. A drawback of OPV, yet to be fully solved, is the degradation of performance over time. However, the commercial OPV cells manufactured by Heliatek are sold with a 5-year product warranty and a 20-year performance warranty, with an efficiency of 6% for 30% transparency cells [10].
Based on the positive features described above for both ETFE and OPV, combining for BIPV seems to be a logical step forward. In recent years, a few articles report on ETFE foils combined with thin film PV modules, mostly made with amorphous silicon [11,12]. Similar to OPV, PV cells made of amorphous silicon have low efficiency and stability issues. However, amorphous silicon PV technology suffers from significantly higher greenhouse gas emissions and energy payback times than OPV [9,13,14]. Nevertheless, since the technologies involved are relatively recent, very limited research investigating configurations combining ETFE with OPV for integration into buildings is reported in the literature. In 2018, a pioneering work analyzed the feasibility of printing OPV on ETFE [15]. Another article analyzed the mechanical robustness linked to the electrical performance of an OPV structure printed on polyethylene terephthalate (PET, the most conventional substrate) and ETFE [16]. The study focused on analyzing the mechanical-electrical effects on the printed electrode layers made of Ag and Ag/poly (3,4-ethylenedioxythiophene) -PEDOT-, depending on whether they are printed on PET or ETFE. The mechanical analysis is crucial since most of the ETFE configurations are built as multilayer inflated cushions. The results revealed that ETFE-printed electrodes are less brittle and sensitive to tensile strain and that the use of Ag/PEDOT layering can double the tensile strain threshold. Finally, it was stated that further research is needed to investigate the properties of direct-printed full OPV on ETFE. In spite of the fact that more research is needed, in a previous publication the authors indicate that although OPV can be integrated in ETFE membranes either by lamination or mechanical fixing, research on OPV directly printed onto architectural membranes such as ETFE is imperative since this configuration is the one achieving the most promising market prospect due to: High throughput and low cost production processes, and high applicability in modern architectural context [17]. In the same direction, Hu et al. [18] assessed the electrical-thermal-mechanical properties of OPV/ETFE foils. They observed that under normal operating conditions electrical properties are relatively not affected by thermal and mechanical changes. However, a direct relation between mechanical and thermal properties (stress curves at different temperatures) is observed. It should be noted that specimens analyzed are mechanically fixed onto ETFE and not printed. Menéndez et al. [4] designed, fabricated, and tested a novel planar multifunctional ETFE module comprising LEDs, OPVs, and flexible electronics. OPV cells, manufactured by OPVIUS GmbH, are integrated into the ETFE foils by lamination. Performance was monitored for different pressure and temperature conditions. Based on the results, an optimized lamination process was stated to ensure proper performance. Almost one-year outdoor monitoring was conducted with positive feedback, that led to a step forward for developing the final demonstrator (1.5 m by 6 m façade screen).
It can be noticed that there are a limited number of studies describing performances of OPV combined with ETFE. Among them, only one study conducts experiments outdoors but in a free-rack module. Therefore, bearing in mind that OPV/ETFE is mainly developed for building integration applications, more research is needed for analyzing the behavior of the OPV/ETFE glazing in a building integrated environment. In order to fill in this gap, the present research deals with the full modelling of a planar OPV/ETFE system integrated in a south façade (northern hemisphere), determining the effect on the illumination of the interior space, the thermal demands and electrical power generation. These performances are analyzed for different configurations defined as a function of the percentage of OPV cells in the glazing and the coverage area of the glazing in the façade. As a result, the paper aims at demonstrating the suitability of such a configuration for building integration.
The contents of the paper are organized as follows. In Section 2 the methods utilized for the different characterizations are described. Spectral transmittance and reflectance values were measured in the laboratory whilst OPVs electrical performance was monitored outdoors. Section 3 explains the model and the main parameters and assumptions involved. The model, fed with the experimental results, is utilized to simulate the performance of the OPV/ETFE system integrated in an office building and to conduct a sensitivity analysis. Once the model is introduced, the main results are discussed in Section 4 and the main conclusions of the study are provided.
2. Characterization of ETFE Foils and OPV Cells
Three different ETFE foils were analyzed in this study: Two ETFE clear foils with different thicknesses (150 and 250 μm) and the same 250 μm-thick ETFE clear foil but with silver prints resulting in a 28% opacity. Printing allows for reduced light transmission and provides an effective shading element.
Commercially available OPV cells were selected for this study. They are considered to be representative of the wide variety of organic technologies.
2.1. Optical Properties
The spectral transmittance and reflectance of the ETFE foils and the OPV cells were determined from 0.35 to 50 μm with a Fourier-transform spectrometer Bruker Optics—IFS 66 v/S equipped with an integrating sphere. This spectral range covers both the solar range and almost the full range of thermal emission (>96% for 25 °C) in the mid-infrared for common operational temperatures. Using Kirchhoff’s law, the absorptance can be derived from the experimental measurements as follows:
τ + ρ + α = 1
The ETFE clear foils behave similarly regardless of their thickness with high transmittances over the solar range (~90%) whereas the printed ETFE reflects 30% of the incoming solar light and transmits only ~40% of it. In the IR, ETFE foils start to absorb more with some transmission peaks that can reach values higher than 50% (Figure 1).
2.2. Luminous and Solar Characteristics
The methods to determine luminous and solar characteristics of glazing in buildings from spectral reflectance and transmittance measurements are detailed in EN 410:2011 [19]. These properties are taken as inputs to evaluate performances in terms of lighting conditions, and heating and cooling demands. In addition, a comparison between different foils can be performed based on their performances.
The main parameters derived from the spectral measurements are the solar transmittance (τe), the solar reflectance (ρe), the visible transmittance (τv), the visible reflectance (ρv), the transmission factor of solar energy (g), and the shading coefficient (SC). Other parameters that can be obtained from experimental measurements are the correlated color temperature (CCT) that is defined as the absolute temperature of a blackbody whose chromaticity most nearly resembles that of the light source. This parameter is key for interior spaces since it is related to human perception. It was calculated using McCamy’s equation [20]:
where n is calculated using the x, y coordinates from CIE 1931 [21] as:
CCT = 449 n3 + 3525 n2 + 6823.3 n + 5520.33
Another useful parameter is the color rendering index (CRI), also known as general index of color reproduction (Ra) (UNE-EN 410). A summary of the values obtained for all the studied foils is provided in Table 1.
2.3. Thermal Characteristics
In order to assess the performances of the ETFE window integrated into a building, its thermal properties have to be determined. The level of insulation is given by the thermal transmittance (U-value) which is obtained by computing the heat flow through the element for a known temperature difference between its two faces.
In the EU and associated countries, the procedure to calculate the U-value is reported in the UNE-EN 673 [22]. The algorithm was substantially simplified compared to the ISO 15099 [23] algorithm, which is used in North America to predict the thermal and optical performances of windows. The thermal properties of glazing systems are calculated based on a comprehensive heat transfer model, analyzing conductive, convective, and radiative heat transfer.
The thermal conductivity, the specific heat and the density of ETFE were obtained from the manufacturer data sheet (Table 2) and allowed to compute conductive and convective calculations [24]:
The normal emissivity (εn) is crucial to calculate the radiative heat flux and therefore the U-value. Antretter et al. evaluated the heat flux through an EFTE cushion and concluded that 30% of it was due to convection and 70% due to radiation, thus stressing the importance of an appropriate radiative modeling [25]. The normal emissivity can be calculated following the procedure reported in the UNE-EN 12898 [26]. This standard uses as an input the optical measurements previously provided. In the next table (Table 3), the resulting values are provided:
2.4. OPV Cells Characterization
The OPV power density output was characterized over a period of five months (July–November) under real conditions. The OPVs were placed vertically on a south-oriented testing unit at 1.5 m height to avoid albedo effects. The irradiance was measured using a pyranometer (CMP6) located at the same position as the OPVs. Temperatures were monitored using T-type thermocouples attached at the rear part of the OPV cells, which were connected to a maximum power point tracker (MPPT). Figure 2 shows the power density as a function of irradiance for the entire time period. The average, minimum, and maximum module back temperatures together with the standard deviation can be seen in Table 4.
The power density dependence with temperature is very week. Therefore, a linear regression relating power and irradiance obtained from the experimental campaign was applied while neglecting the temperature dependence.
3. Model Description
3.1. Studied Configurations
ETFE foils may be configured in different ways depending on the application in which they are expected to be used and its associated requirements (illumination control, high thermal insulation, etc.). Four different configurations were analyzed in this study, all of them composed of two flat films and an intermediate layer of air (10 mm). Figure 3 shows the selected configurations: (a) a panel composed of two clear 250 μm-thick ETFE layers; (b) a panel comprised of a clear 250 μm-thick EFTE layer and OPV cells attached onto a clear 150 μm-thick ETFE layer and covering 100% of its area; (c) a panel composed of a clear 250 μm-thick EFTE layer and OPV cells attached onto a clear 150 μm-thick ETFE layer and covering 50% of its area; (d) a panel comprising a clear 250 μm-thick EFTE layer and another clear 250 μm-thick EFTE layer with 50% of its area silver printed. The studied configurations are plotted in Figure 3 and are identified using the nomenclature introduced in Table 5.
The luminous, solar, and thermal characteristics of every configuration are provided in Table 6. It can be appreciated that the reference configuration is the one achieving the highest transmittance and solar factor, but as a consequence the higher shading coefficient and thermal transmittance values. The U-value was calculated following the simplified UNE procedure and the ISO one, noticing that those calculated by UNE exceed the ISO ones. The configuration 1, C1, results in the lower transmittance and solar factor values by far with respect to the other configurations. However, regarding the U-values, a small variation can be observed. Differences in the two standard calculations for the U-value are noticeable for this case since for the U-value referred to ISO, C1 gets a value slightly higher than C3, but referring to UNE C1 has the lowest U-value. In the case of configurations C3 and C4, similar values are reported for the tabulated parameters.
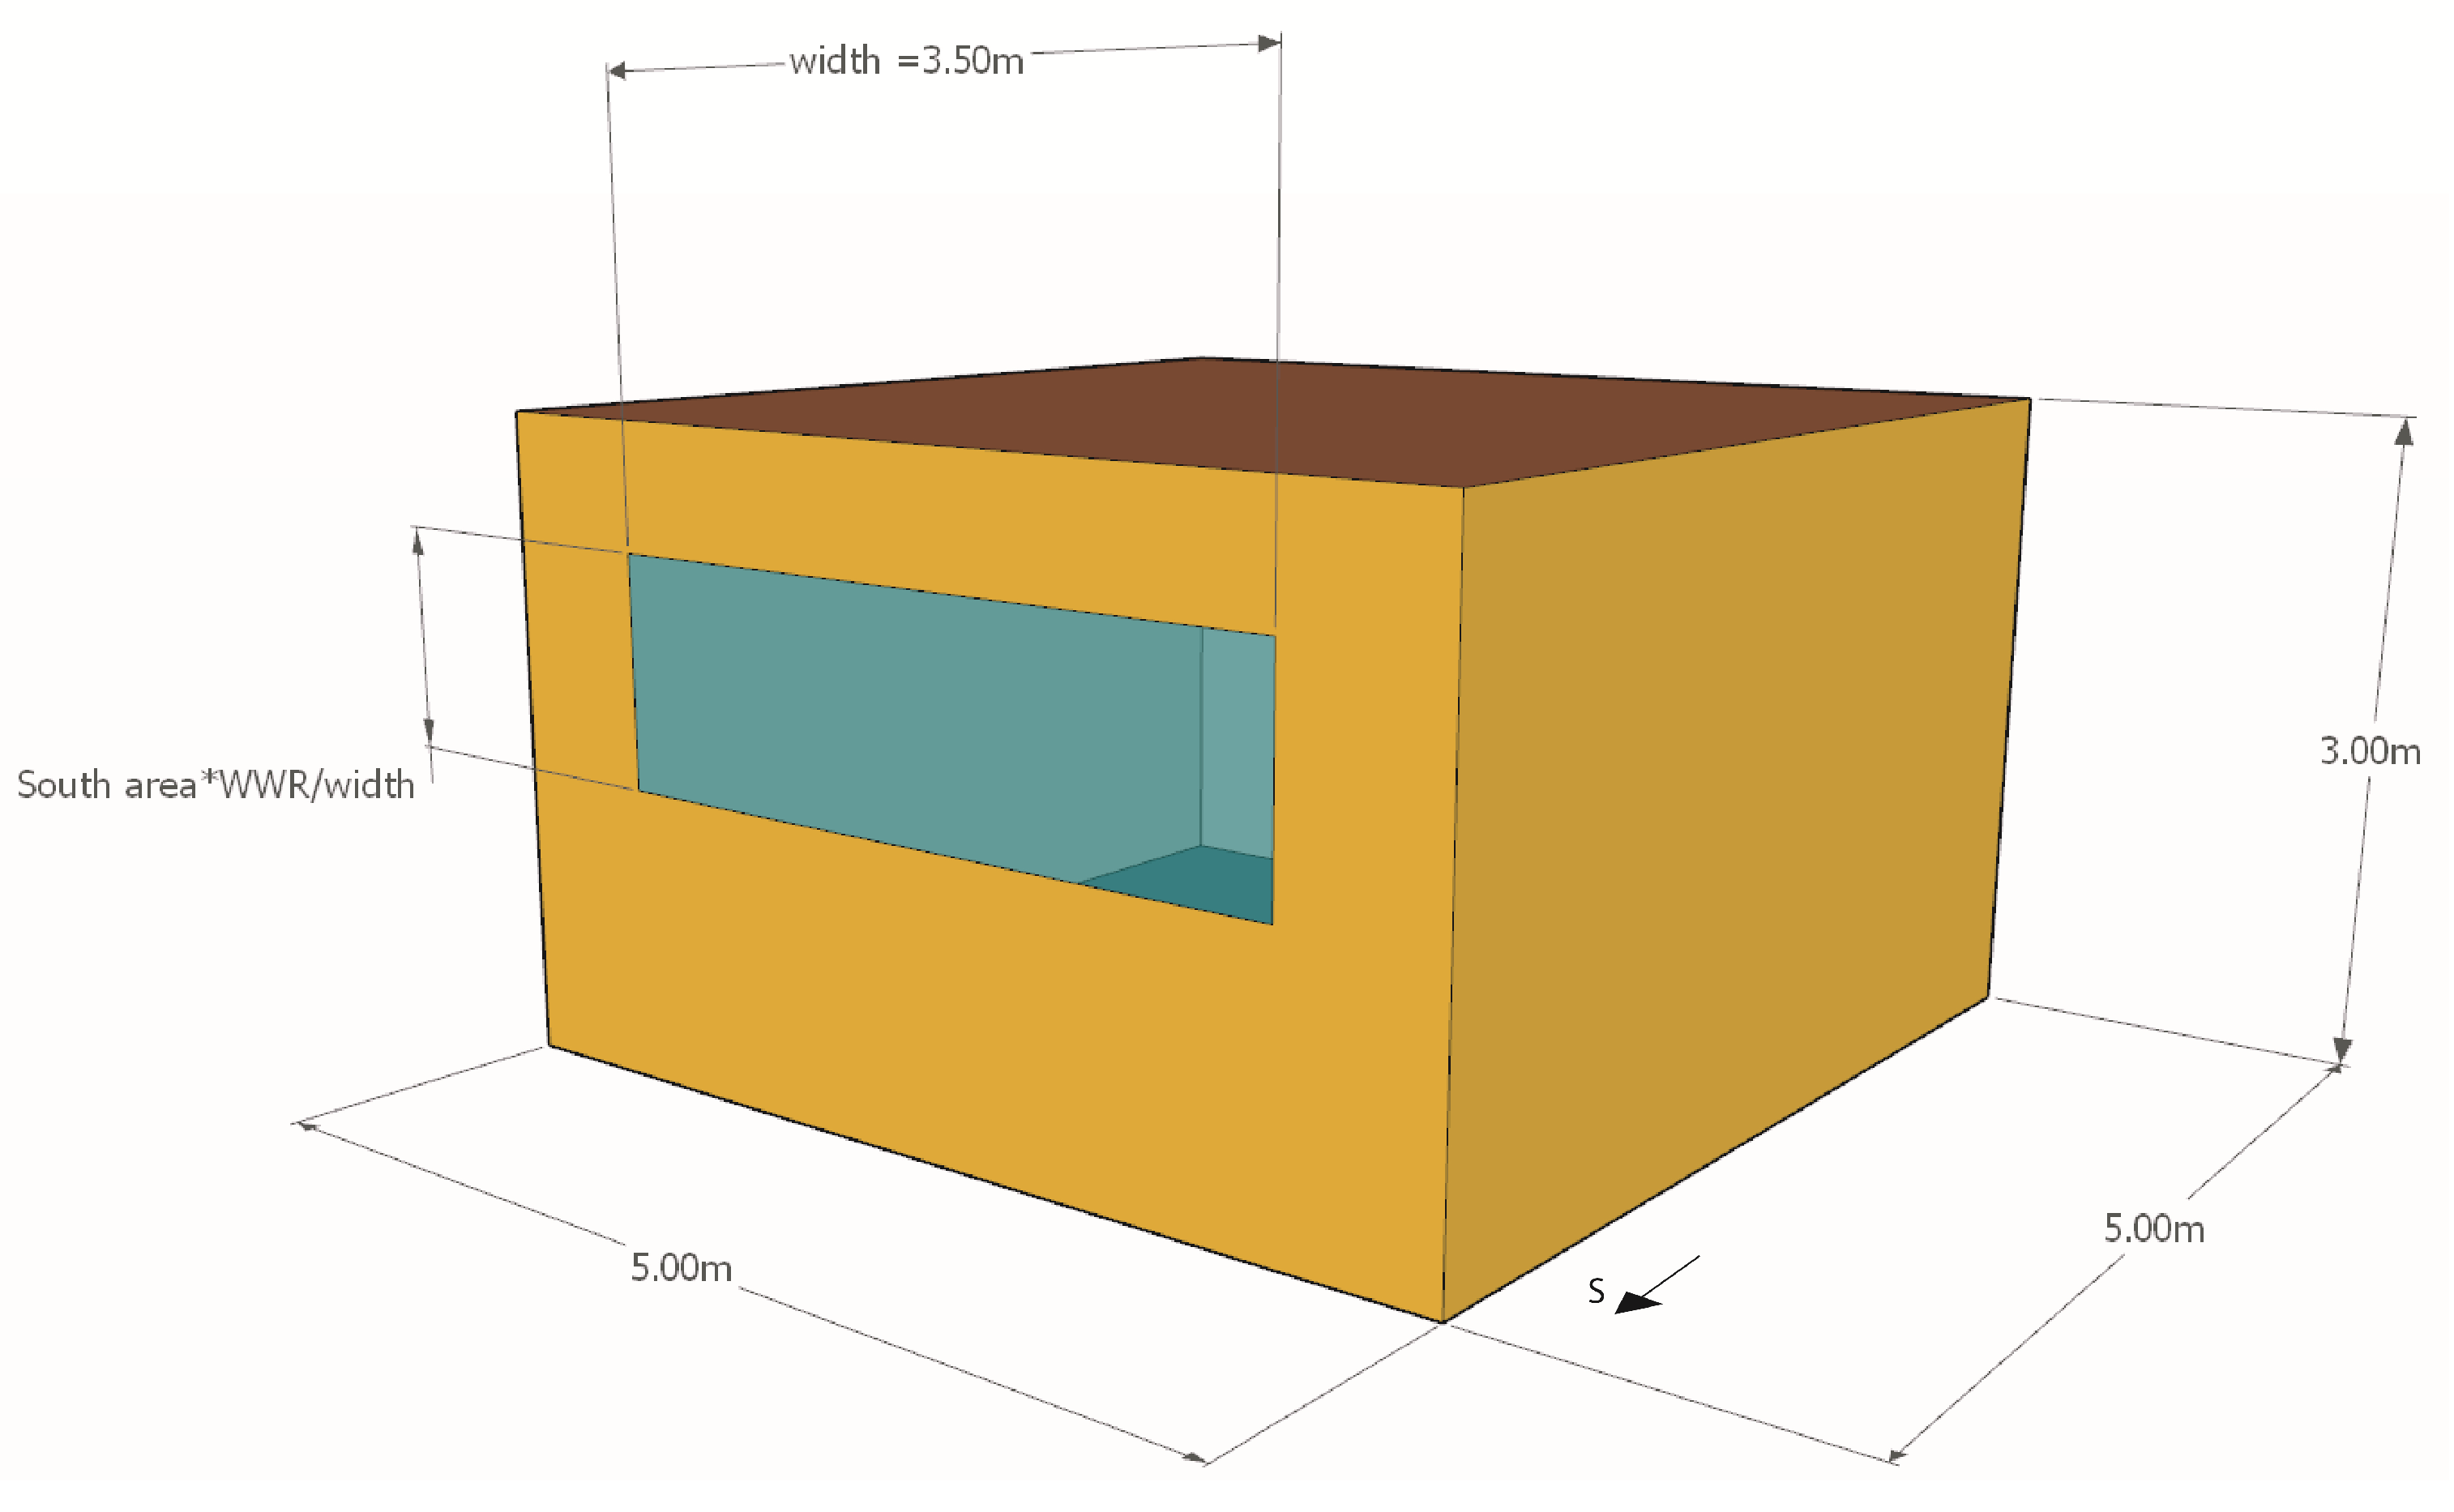
3.2. Building Model Parameters and Assumptions
A 3D model of an office building was created in SketchUp and imported from Trnsys [27] (Figure 4). The building has a floor area of 25 m2 (5 m by 5 m) with a height of 3 m, resulting in a total volume of 75 m3. The different ETFE window configurations proposed in this study were integrated in the south façade (selected locations are in the northern hemisphere) with different window wall ratios (WWR) ranging from 25% to 95% in 10% steps. Window wall ratio is defined as the percentage of glazed area with respect to the total wall area where the glazing is placed. The simulations allowed evaluating the lighting conditions, and the thermal and electrical behaviors.
The thermal characteristics under standard conditions (20 °C and 1 atm) of the selected building are selected based on the minimum required values of each country regulations [28,29] given in Table 7.
Nonetheless, the thermal transmittance depends on the different temperatures across the system and also some of the parameters involved are angle dependent. Therefore, the U-value is calculated at each time step considering the specific conditions by means of the LBL Window Program [30], which generates a DOE-2 file format that is subsequently read by Trnsys.
Glazing temperatures are calculated considering the transmittance, reflectance, and absorptance of each specific system to incoming direct and diffuse solar radiations and also to diffuse short-wavelength radiation reflected through the multilayered system. Also, convective, conductive, and long-wave radiative heat transfer calculations are performed between individual layers and inner and outer environments.
The internal heat gains generated by occupancy, lighting, and appliances have been considered and calculated according to standard EN16798-1 [31]. This norm also indicates the values for ventilation rates including infiltration, which for the present case takes a value of 0.8 l s−1 m−2 (office building with normal level of expectation). The space heating and cooling demands are calculated to maintain an interior temperature of 20 °C in winter and 26 °C in summer (latent control not applied). The heating season is considered to start on 16 October and to finish on 15 May, and the cooling season from 16 May to 15 October.
The heating demand is covered by a reversible heat pump with a coefficient of performance (COP) of 3.38 for heating and an energy efficiency ratio (EER) of 3.35 for cooling. These values were set according to the requirements established by the European Commission in the rule n° 206/2012 and by the standard UNE-EN 14511-1 [32]. The heat pump operation time was set to 11 hours per day (7:00 h–18:00 h) from Monday to Friday.
The main parameters and assumptions for these calculations are summed up in Table 8.
3.3. Climate Conditions
The ETFE windows performance was assessed in Barcelona (Spain, Latitude: 41.4°, Longitude: 2.15°) and Paris (France, Latitude: 48.4°, Longitude: 2.3°). In this study, typical meteorological year weather data from the Meteonorm Trnsys database was used. This data is hourly based and represents long-term statistical trends and patterns.
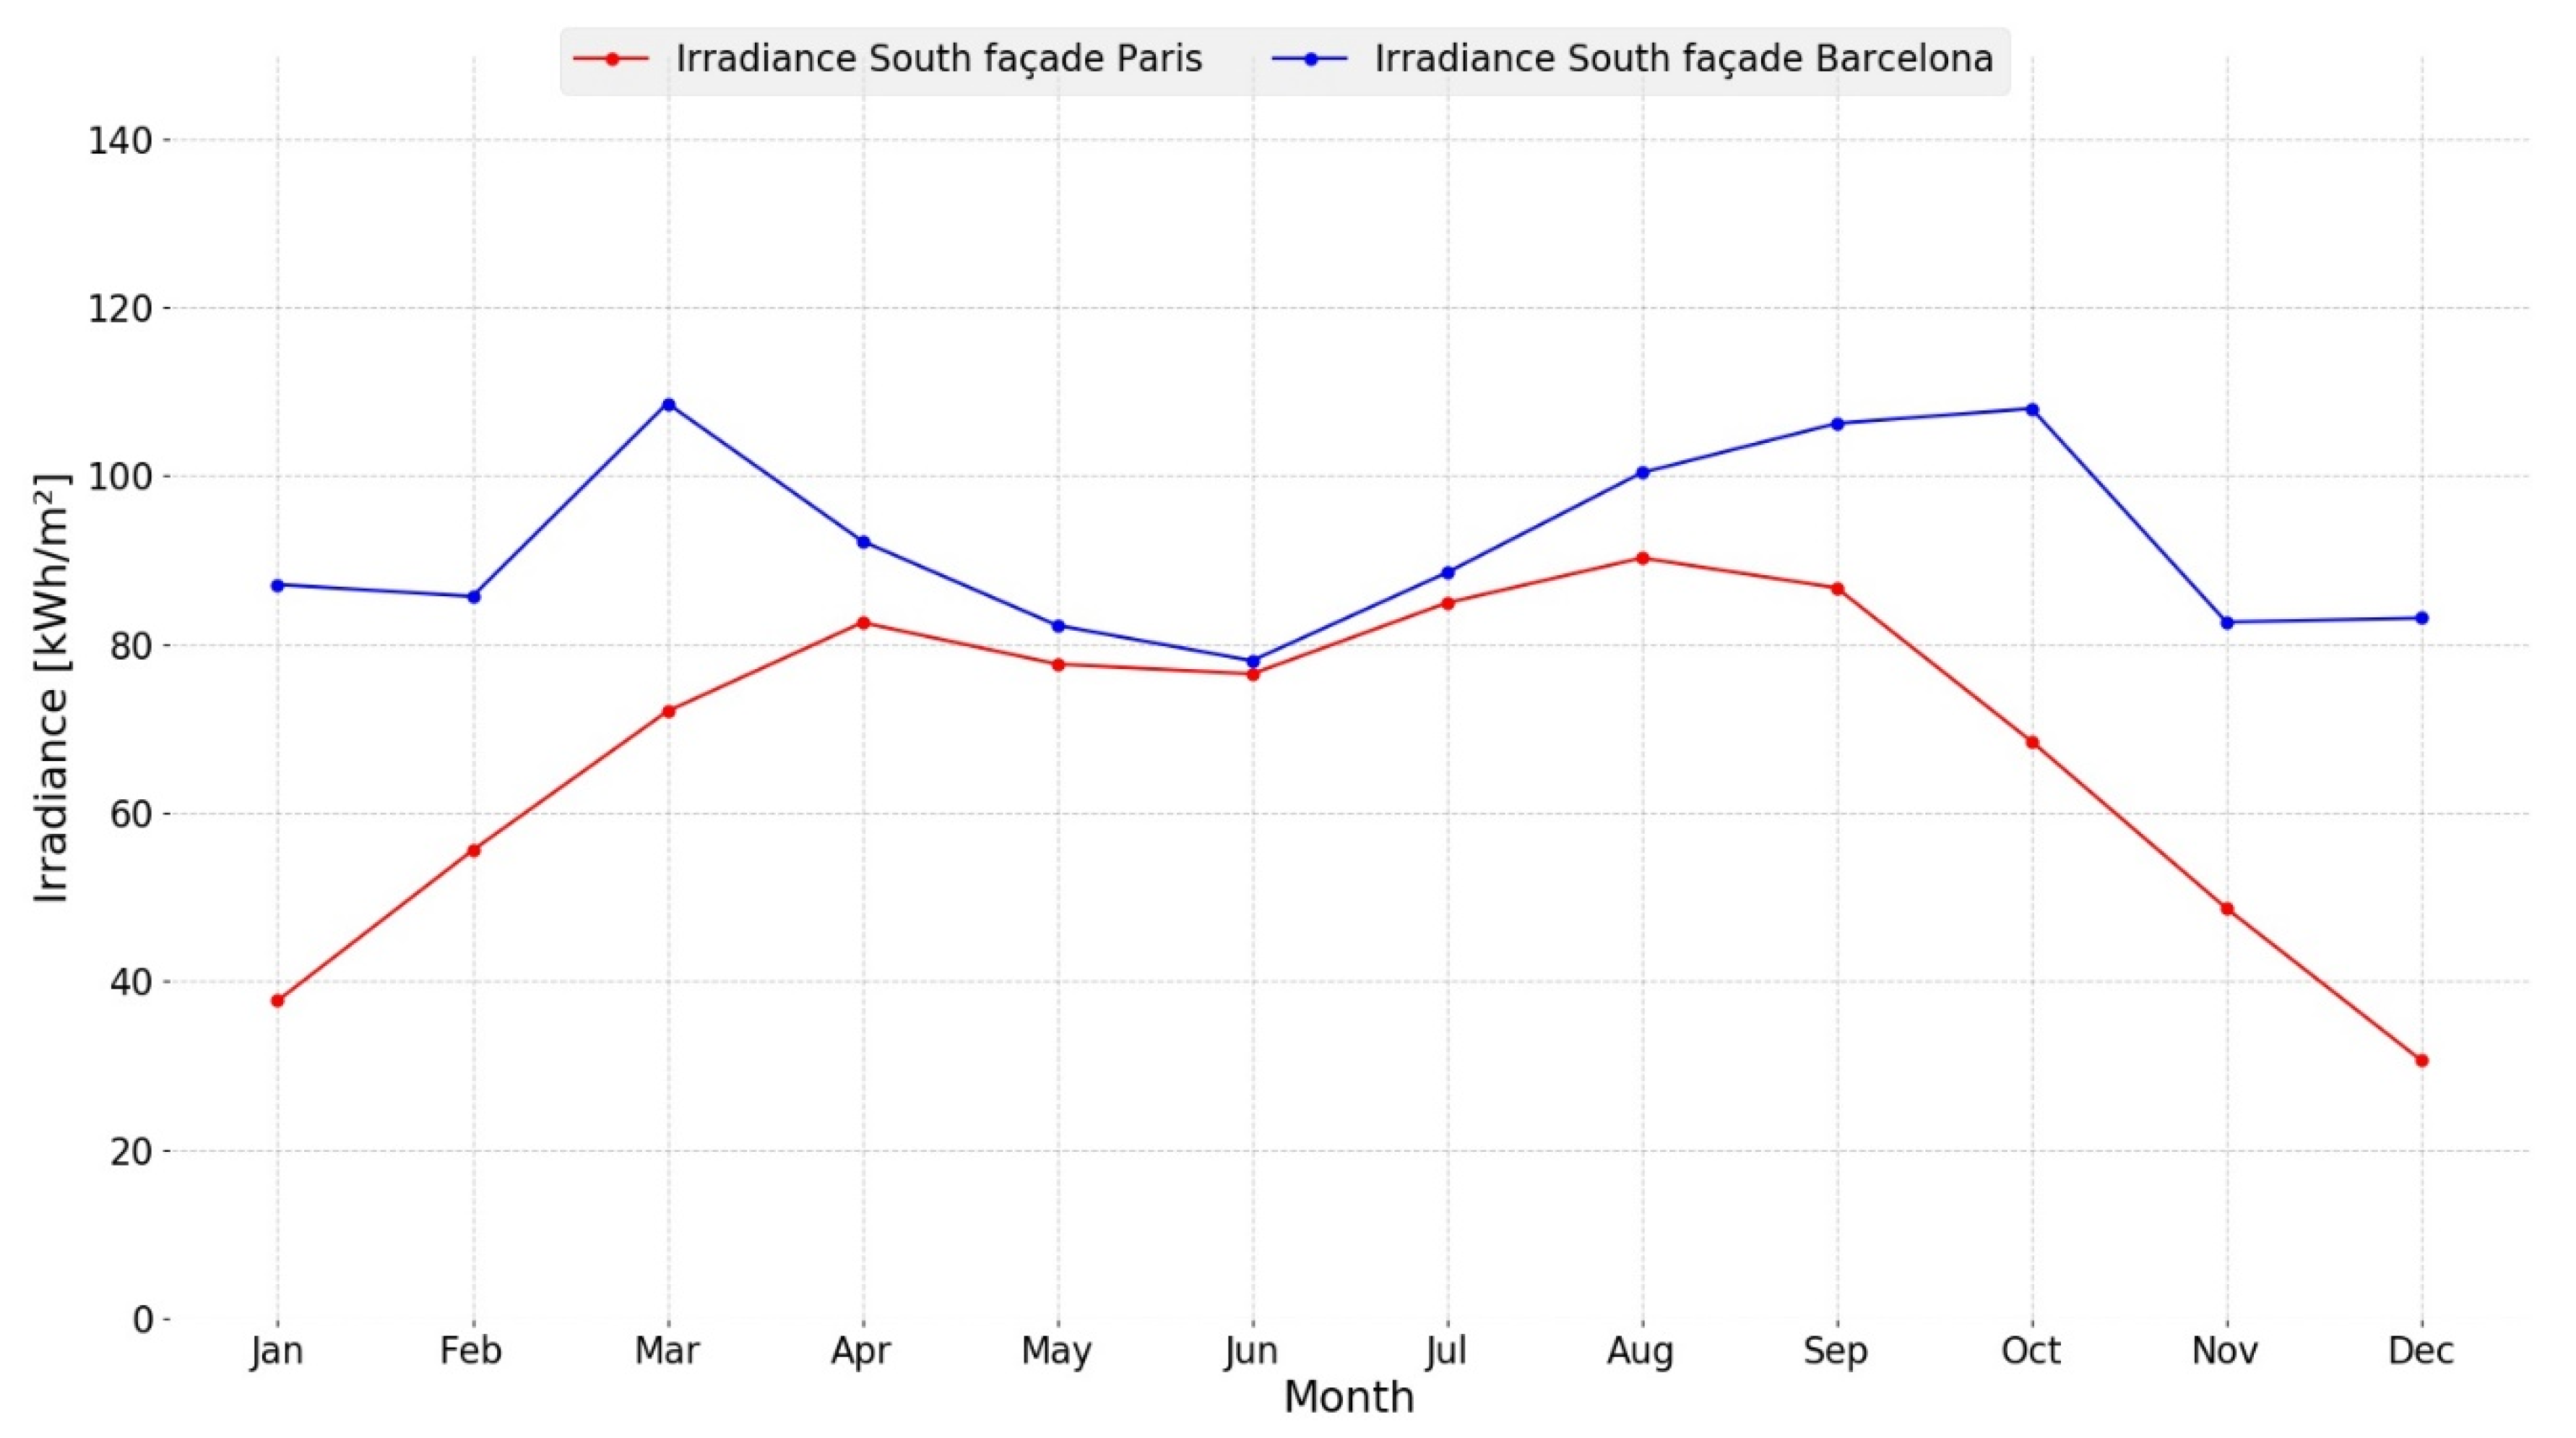
Figure 5 shows the monthly cumulated global horizontal irradiance (GHI) and the average ambient temperatures. The annual cumulated GHI in Barcelona is 1536 kWh/m2 and the annual average temperature is 15.3 °C whereas in Paris the GHI is 1044 kWh/m2 and the annual average temperature is 9.83 °C. Regarding the global vertical irradiance over the south façade (Figure 6), Barcelona receives 1102 kWh/m2 and Paris 811 kWh/m2.
3.4. Simulation Criteria
The purpose of this document is to analyze the thermal, electrical, and lighting behaviors when incorporating the different systems as a substitute for conventional windows. Concerning lighting, daylight availability describes the light transmitted through a window system to an indoor space. It can be defined by dynamic/climate-based metrics such as daylight autonomy (DA), useful daylight illuminance (UDI), or annual light/sunlight exposure [33].
DA is a climate-based metric defined as the percentage of occupied hours in a year when a minimum illuminance threshold (x lux) can be met by daylight alone. Illuminances of 300 lux (DA300 lux) and 500 lux (DA500 lux) are the most common target thresholds for offices, classrooms, and libraries. For any given point in a building, daylight is considered sufficient if the daylight autonomy exceeds 50% of the occupied hours of the year (i.e., DA300 lux or 500 lux > 50%) [33].
UDI is a modification of daylight autonomy conceived by [34]. In contrast to measures of daylight autonomy, the UDI paradigm gives significance to those daylight illuminances below a design threshold or between two values. The UDI range is further subdivided into three ranges. The range UDI < 100 Lux indicates a low level of illumination in which artificial lighting will be necessary, the range UDI 100–2000 indicates levels of comfort lighting in which the majority of activities can be carried out, and the range UDI > 2000 indicates that the lighting levels create a discomfort situation due to the high level of illumination. Normally this last case happens in south orientations where the solar radiation directly impacts the interior of the building.
In addition to the luminous performance, an analysis of the energetic demands for the different configurations is conducted. The annual global consumption of energy (Qoverall) is determined by subtracting the annual energy produced by the OPV cells (−EPV) (if installed) to the annual energy consumed by the air conditioning equipment (Qheating + Qcooling).
Qoverall = Qcooling + Qheating − EPV
Thus, small values of Qoverall indicate less energy demand in the building and more energy savings.
4. Results
The annual energetic performance of the four system configurations integrated onto the south façade with several WWR was evaluated for Barcelona and Paris. The space heating and cooling demands, as well as the electrical production for the cases where OPV cells are used, were calculated.
The impact of the WWR is clearly illustrated in Figure 7. Increasing WWR brings higher cooling demands and less heating demands due to the enhanced solar gain. Although the heat flux increases with bigger windows (higher losses especially during the night), the demands are not impacted to a great extent mainly due to the diurnal occupation for an office case-study. The criterion followed to establish the WWR range is that the maximum WWR considered in the interval is the one where the overall energy demand in both configurations including OPVs (50% and 100%) is the minimum. Figure 7 includes also the subsequent WWR to illustrate that overall energy demands change in slope and start to increase.
In Barcelona, the impact of increasing the size of the windows can be directly related to a higher cooling demand due to its hot and sunny summers and mild winter Mediterranean climate (Csa) [35]. WWRs vary from 25% to 65% since under the last WWR the net/overall energy demands for the configurations including OPVs grow with respect to the previous WWR (55%). WWR of 55% is set as the upper limit of the WWR interval. It is observed that configurations ETFE + OPV(100%)/ETFE (C1), ETFE + OPV(50%)/ETFE (C2), and ETFE + ETFE-SILVER(50%) (C3) bring energetic savings with respect to the reference case ETFE + ETFE (REF) since they act as shading elements. On the other hand, Paris has an oceanic semi-continental climate (Cfb) [35]. As a consequence, increasing the WWR reduces the overall energy demand and equalizes the space heating and cooling demands. Configurations with higher shading increase the heating demands due to the colder climate in Paris. Due to this fact, the maximum WWR value considered is 85%. Under 95% WWR the overall energy demand values increase.
In general, configurations C1 and C2 produce electrical energy and, as a consequence, reduce the overall energy demand. An exception is configuration C1 in Paris when WWR is 0.25, where the net energy does not improve since the small fraction of glazing in the south wall reduces solar gains. Thus in the end the heating demand has become larger than the savings achieved due to the smaller cooling demand in summer.
In Barcelona, configuration C1 brings a heating demand reduction spanning from 8.69% (WWR = 0.25) to 24.04% (WWR = 0.55) compared to the reference case. In addition, a fraction ranging from 46.00% to 71.05% of the consumption is covered by PV production. In Paris, also for C1, the heating demand is increased (4.22%) for a WWR of 0.25. However, with higher WWR (0.35, 0.45, 0.55, 0.65, 0.75, and 0.85) the heating demand drops (3.30%, 10.84%, 17.25%, 22.64%, 25.98%, and 26.85% respectively). Interestingly, for WWR 0.35–0.85 the PV production is able to cover from 31.93% to 77.79% of the total consumption.
Configuration C2 in Barcelona reduces the heating demand from 5.22% (WWR = 0.25) to 14.45% (WWR = 0.55) and the PV production covers from 22.16% (WWR = 0.25) to 31.54% (WWR = 0.55) of the energy consumption. Differently in Paris, the same system increases the heating demand for WWR = 0.25 (2.31%). However, a larger WWR comes with a drop-in heating demand, from 2.77% (WWR = 0.35) to 16.83% (WWR = 0.85) and the PV production covers from 16.27% (WWR = 0.25) to 34.21% (WWR = 0.85) of the total energy consumption. All the values reported above are compared to the reference case.
Configuration C3 only acts as a shading element (there is no PV production) and its thermal performance is similar to configuration C2. Nonetheless, configuration C2 reduces the heating demand globally more than 2% compared to configuration C3.
In the end, in Barcelona, configuration C1 is the less energy consuming option, with the same level independently of the WWR (up to 0.55). It is worth noticing that when WWR is the largest, PV production is fortunately larger to compensate for the cooling needs. In Paris, large window areas with the maximum coverage of OPV cells (configuration C1) is optimum for net energy consumption. Thus luminous performance will be required for finding the optimum WWR in Barcelona and for checking if configuration C1 remains attractive in both locations.
Regarding the luminous performance, DA and UDI were evaluated (Figure 8). The WWR doesn’t impact on the DA at 300 lux (DA300). Therefore, a WWR of 0.25 would be sufficient for all configurations except C1 (ETFE + OPV(100%)/ETFE). This configuration has a limited transmissivity of solar light and therefore artificial illumination would be necessary during the vast majority of the day. Higher WWRs than 0.55 are not included for the case of Paris since DA at 300 lux is not influenced.
The UDI of interest is from 100 to 2000 lux since it comprises the range 100–300 lux where only additional illumination would be required and the 300–2000 lux range where luminous comfort is achieved without having recourse to artificial light. For increasing values of WWR and considering the reference case, UDI 100–2000 lux gets reduced by increasing UDI > 2000 lux. But this high level of illumination causes discomfort. Figure 9 shows that the results are similar in both Barcelona and Paris. Based on this indicator, for the case of Barcelona the best configuration is found to be a WWR of 0.45 and the configuration C2, achieving an illumination level from 100 lux to 2000 lux during 82.2% of the annual hours. For the rest of the WWR analyzed, configuration C2 always performs the best, except for a WWR of 0.25 where the glazing including the silver printed pattern (configuration C3) slightly outperforms configuration C2. In the case of Paris, the best performances are when WWR is equal to 0.35 for configuration C2. Based on this result, larger WWRs than 55% are not included in Figure 9. Similarly to the results obtained for Barcelona, with a WWR of 0.25 the combination including a silver printed ETFE foil (C3) provides a better illumination than configuration C2.
On the other hand, configurations with shading elements (either an OPV/ETFE or a silver printed ETFE layer) achieve DA values around 80% in Barcelona and 70% in Paris (4% lower than the reference case for both cities). The UDI indicator in the range 100–2000 lux is increased with higher WWR except for large values (>0.5) where it starts to decay.
When combining the analyses on energy consumption and illumination performances, conclusions can be drawn about optimum strategies for integrating OPV/ETFE windows in buildings as a function of the local climate
5. Conclusions
OPV/ETFE building integrated windows are a promising alternative to conventional glass windows. They have advantageous characteristics such as low environmental impact, flexibility, light weight, color variability, free-shape, and more generally customization options. Transmittance and reflectance spectral measurements of three different EFTE foils and a commercial OPV have been performed. The main optical, thermal, and luminous properties have been calculated from this experimental characterization to perform a dynamic simulation in Trnsys for a model office building. The luminous and energetic performances have been evaluated for 4 different window configurations, different WWRs and two locations (Barcelona and Paris). The four configurations comprise a reference case (REF) which does not have any shading element, a case where a tinted layer is added (C3), and two cases where OPV cells are added with area coverages of 50% (C2) and 100% (C1). Energy produced by the OPV cells partly covers electrical demands of the reversible heat pump.
The main conclusions that can be drawn from this study are the following. Firstly, ETFE foils with OPVs are able to provide reasonable shares of the total heating and cooling demands. Values higher than 22% for Barcelona and 16% for Paris can be attained (WWR of 25%). The configuration that best performs in terms of energy fraction covered, in both locations, is found to be C1 since it has the higher PV area to generate electricity. On the other hand, configuration C1 in combination with the various WWRs is different for the two locations. In the case of Barcelona, the net energy is almost the same for WWR from 0.25 to 0.45. For a WWR of 0.55 the cooling demand increases in a bigger proportion than the rise in electricity produced thanks to a larger area coverage, resulting in a net energy consumption slightly smaller than for lower WWRs. In Paris the most effective WWR is 0.85 because the heating demand is predominant and the higher the glazing area the higher the energy flux entering the interior space.
Secondly, a solar control system should be added to the reference system since high percentages over the yearly daytime hours with levels of illumination higher than 2000 lux are registered, with the associated discomfort.
Thirdly, configurations C1, C2, and C3, which have shading elements, are key to create luminous comfort for climates and latitudes such as Barcelona. The cooling needs are reduced, and when increasing WWR, the luminous comfort characterized by the UDI 100–2000 lux is enhanced. On the other hand, adding shading elements in places like Paris increases the heating demands whilst improving the luminous comfort. In both locations, configuration C2 under a WWR of 0.45 is the combination providing the best UDI percentages of about 80% (80% of the daytime yearly hours are under illumination comfort).
Finally, OPV cells in windows transform a passive system into an active one able to provide a fraction of the total energy demands. In addition, OPV cells act as shading elements and therefore change the thermal and luminous performances. The area of the window covered by the OPV cells is key to achieve a satisfactory tradeoff between all the targets. High OPV coverage area in windows could be a possibility for places like Barcelona characterized by hot temperatures during long periods over the year. However, for places with colder climates such as Paris OPV cells can have more detrimental impacts. Higher OPV coverage of the total area reduces the luminous comfort (UDI) and the useful daylight (DA300) in both cities. Even though high OPV areas provide high coverage of building demands, the luminous discomfort associated may lead to discarding this option.
Author Contributions
The research team works in a collaborative manner and all the authors have contributed in all the sections of the present manuscript.
Funding
This research was supported by the “Generalitat de Catalunya” (grants 2018FI_B1_00136, 2017 SGR 1276 and ICREA Academia) and “Ministerio de Economía y Competitividad” of Spain (grant reference ENE2016-81040-R).
Acknowledgments
The authors would like to acknowledge the collaboration with the company IASO SA.
Conflicts of Interest
The authors declare no conflicts of interest.
References
- The Energy Performance of Buildings Directive Factsheet. Available online: ec.europa.eu/energy/sites/ener/files/documents/buildings_performance_factsheet.pdf (accessed on 10 April 2019).
- International Energy Agency. Available online: https://www.iea.org/topics/energyefficiency/buildings/ (accessed on 10 April 2019).
- EU Directive (EU). 2018/844 of the European Parliament and of the Council of 30 May 2018 Amending Directive 2010/31/EU on the Energy Performance of Buildings and Directive 2012/27/EU on Energy Efficiency; EU: Brussels, Belgium, 2018. [Google Scholar]
- Menéndez, A.; Martínez, A.; Santos, A.; Ruiz, B.; Moritz, K.; Klein, I.; Díaz, J.; Lagunas, A.R.; Sauermann, T.; Gómez, D. A multifunctional ETFE module for sustainable façade lighting: Design, manufacturing and monitoring. Energy Build. 2018, 161, 10–21. [Google Scholar] [CrossRef]
- Robinson-Gayle, S.; Kolokotroni, M.; Cripps, A.; Tanno, S. ETFE foil cushions in roofs and atria. Constr. Build. Mater. 2001, 15, 323–327. [Google Scholar] [CrossRef]
- Lamnatou, C.; Moreno, A.; Chemisana, D.; Reitsma, F.; Clariá, F. Ethylene tetrafluoroethylene (ETFE) material: Critical issues and applications with emphasis on buildings. Renew. Sustain. Energy Rev. 2018, 82, 2186–2201. [Google Scholar] [CrossRef]
- Maywald, C.; Riesser, F. Sustainability-The Art of Modern Architecture. Procedia Eng. 2016, 155, 238–248. [Google Scholar] [CrossRef]
- Yu, J.; Zheng, Y.; Huang, J. Towards high performance organic photovoltaic cells: A review of recent development in organic photovoltaics. Polymers 2014, 6, 2473–2509. [Google Scholar] [CrossRef]
- Hengevoss, D.; Baumgartner, C.; Nisato, G.; Hugi, C. Life Cycle Assessment and eco-efficiency of prospective, flexible, tandem organic photovoltaic module. Sol. Energy 2016, 137, 317–327. [Google Scholar] [CrossRef]
- Heliatek—The Future Is Light. Available online: https://www.heliatek.com/en/ (accessed on 10 April 2019).
- Hu, J.; Chen, W.; Qiu, Z.; Zhao, B.; Zhou, J.; Qu, Y. Thermal performances of ETFE cushion roof integrated amorphous silicon photovoltaic. Energy Convers. Manag. 2015, 106, 1201–1211. [Google Scholar] [CrossRef]
- Hu, J.; Chen, W.; Liu, Y.; Zhao, B.; Yang, D.; Ge, B. Two-layer ETFE cushions integrated flexible photovoltaics: Prototype development and thermal performance assessment. Energy Build. 2017, 141, 238–246. [Google Scholar] [CrossRef]
- Jean, J.; Brown, P.R.; Jaffe, R.L.; Buonassisi, T.; Bulović, V. Pathways for solar photovoltaics. Energy Environ. Sci. 2015, 8, 1200–1219. [Google Scholar] [CrossRef]
- Lizin, S.; Van Passel, S.; De Schepper, E.; Maes, W.; Lutsen, L.; Manca, J.; Vanderzande, D. Life cycle analyses of organic photovoltaics: A review. Energy Environ. Sci. 2013, 6, 3136–3149. [Google Scholar] [CrossRef]
- Zanelli, A.; Beccarelli, P.; Monticelli, C.; Ibrahim, H.M. Technical and Manufacturing Aspects in order to create a smart façade system with OPV integrated into ETFE foils. In Proceedings of the International Symposia IASS-APCS, Seoul, Korea, 21–24 May 2012. [Google Scholar]
- Fan, Z.; De Bastiani, M.; Garbugli, M.; Monticelli, C.; Zanelli, A.; Caironi, M. Experimental investigation of the mechanical robustness of a commercial module and membrane-printed functional layers for flexible organic solar cells. Compos. Part B Eng. 2018, 147, 69–75. [Google Scholar] [CrossRef]
- Fan, Z.; Bastiani, M.D.; Monticelli, C.; Caironi, M.; Zanelli, A. Performance investigation of organic photovoltaic layers on architectural membrane. In Proceedings of the 9th Energy Forum Advanced Building Skins Conference, Bressanone, Italy, 6 November 2014. [Google Scholar]
- Hu, J.; Chen, W.; Yin, Y.; Li, Y.; Yang, D.; Wang, H.; Zhang, X. Electrical-thermal-mechanical properties of multifunctional OPV-ETFE foils for large-span transparent membrane buildings. Polym. Test. 2018, 66, 394–402. [Google Scholar] [CrossRef]
- Aenor, E.L. Ensayos no Destr. Por Ultrason. Especificaciones Para El Bloque Calibración No. 2; UNE-EN ISO 79632006; ISO: Geneva, Switzerland, 2011; pp. 1–16. [Google Scholar]
- McCamy, C.S. Correlated color temperature as an explicit function of chromaticity coordinates. Color Res. Appl. 1992, 17, 142–144. [Google Scholar] [CrossRef]
- Smith, T.; Guild, J.; The, C.I.E. Colorimetric standards and their use. Trans. Opt. Soc. 1931, 33, 73–134. [Google Scholar] [CrossRef]
- EN 673. Glass in Building-Determination of Thermal Transmittance (U Value)-Calculation Method; DIN: Berlin, Germany, 2011. [Google Scholar]
- ISO 15099. Thermal Performance of Windows, Doors and Shading Devices–Detailed Calculations; ISO: Geneva, Switzerland, 2003. [Google Scholar]
- The Chemours Company. TefzelTM ETFE Fluoropolymer Film; The Chemours Company: Wilmington, DC, USA, 2017. [Google Scholar]
- Antretter, F.; Haupt, W.; Holm, A. Thermal Transfer through Membrane Cushions Analyzed by Computational Fluid Dynamics. In Proceedings of the 8th Nordic Symposium on Building Physics in the Nordic Countries, Copenhagen, Denmark, 16–18 June 2008. [Google Scholar]
- En, B.S. Glass in Building—Determination of the Emissivity; EPB: Chattanooga, TN, USA, 2001. [Google Scholar]
- Klein, S.; Beckman, W. TRNSYS 18: A Transient System Simulation Program: Mathematical Reference; Wisconsin-Madison: Madison, WI, USA, 2017. [Google Scholar]
- Código Técnico de la Edificación (CTE) Documento Básico de Ahorro de Energía (DB-HE). 2017. Available online: https://www.codigotecnico.org/images/stories/pdf/ahorroEnergia/DBHE.pdf (accessed on 16 May 2019).
- Legifrance Arrêté du 28 Décembre 2012 Relatif Aux Caractéristiques Thermiques et aux Exigences de Performance Énergétique des Bâtiments Nouveaux et des Parties Nouvelles de Bâtiments Autres que ceux Concernés par l’article 2 du décret du 26 Octobre 2010 Relatif Aux. 2013. Available online: https://www.legifrance.gouv.fr/affichTexte.do?cidTexte=JORFTEXT000026871753&categorieLien=id (accessed on 16 May 2019).
- Berkeley, L. Window 7 User Manual; Microsoft: Redmond, WA, USA, 2019. [Google Scholar]
- CEN prEN 16798-1. Energy Performance of Buildings-Part 1: Indoor Environmental Input Parameters for Design and Assessment of Energy Performance of Buildings Addressing Indoor Air Quality, Thermal Environment, Lighting and Acoustics-Module M1-6; EPB: Chattanooga, TN, USA, 2015; p. 44. [Google Scholar]
- En, N.E. Norma Española Bombas De Calor Para La Calefacción Y La Refrigeración De Locales Y Enfriadoras De Proceso Con Compresores Accionados Eléctricamente Parte 1: Términos y Definiciones; DIN: Berlin, Germany, 2019. [Google Scholar]
- Sun, Y.; Wu, Y.; Wilson, R. A review of thermal and optical characterisation of complex window systems and their building performance prediction. Appl. Energy 2018, 222, 729–747. [Google Scholar] [CrossRef]
- Nabil, A.; Mardaljevic, J. Useful daylight illuminance: A new paradigm for assessing daylight in buildings. Light. Res. Technol. 2005, 37, 41–59. [Google Scholar] [CrossRef]
- Kottek, M.; Grieser, J.; Beck, C.; Rudolf, B.; Rubel, F. World Map of the Köppen-Geiger climate classification updated. Meteorol. Z. 2006, 15, 259–263. [Google Scholar] [CrossRef]
Figure 1.
Experimental transmittance and reflectance of the three ethylene tetrafluoroethylene (ETFE) foils and the organic photovoltaic (OPV) cells.
Figure 1.
Experimental transmittance and reflectance of the three ethylene tetrafluoroethylene (ETFE) foils and the organic photovoltaic (OPV) cells.

Figure 2.
Experimental OPV power density as a function of irradiance.

Figure 3.
Studied configurations: (a) ETFE + ETFE; (b) ETFE + OPV/ETFE; (c) ETFE + OPV(50%)/ETFE; (d) ETFE + ETFE-SILVER(50%).
Figure 3.
Studied configurations: (a) ETFE + ETFE; (b) ETFE + OPV/ETFE; (c) ETFE + OPV(50%)/ETFE; (d) ETFE + ETFE-SILVER(50%).

Figure 4.
Building model description.

Figure 5.
Monthly irradiances and mean temperatures for Barcelona and Paris.

Figure 6.
Monthly irradiances at the south façade for Barcelona and Paris.

Figure 7.
Annual consumption of different configurations: (a) Barcelona; (b) Paris.


Figure 8.
Daylight autonomy (DA) (300 lux) for the different configurations in Barcelona and Paris.

Figure 9.
Useful daylight illuminance: (a) Barcelona; (b) Paris.


Table 1.
Summary of luminous and solar characteristics.
| Foil | τe | ρe | τv | ρv | g | SC | CRI (%) | CCT (K) |
|---|---|---|---|---|---|---|---|---|
| ETFE 250 μm | 0.910 | 0.074 | 0.907 | 0.77 | 0.917 | 1.051 | 99.09 | 6377.4 |
| ETFE 150 μm | 0.926 | 0.064 | 0.923 | 0.067 | 0.932 | 1.068 | 99.09 | 6377.4 |
| ETFE-Silver 250 μm | 0.283 | 0.396 | 0.284 | 0.401 | 0.350 | 0.437 | 99.09 | 6377.4 |
| OPV | 0.165 | 0.232 | 0.100 | 0.114 | 0.296 | 0.405 | 76.36 | 9083.9 |
Table 2.
Summary of thermal characteristics.
| Thermal Characteristic | Value | Units |
|---|---|---|
| λETFE 20 °C | 0.24 | W/mK |
| CpETFE 20 °C | 1172 | J/Kg·K |
| ρETFE 20 °C | 1700 | Kg/m3 |
Table 3.
Summary of normal emissivity.
| Foil | εn |
|---|---|
| ETFE 250 μm | 0.894 |
| ETFE 150 μm | 0.897 |
| ETFE-Silver 250 μm | 0.774 |
| OPV | 0.712 |
Table 4.
Summary of thermal characteristics.
| Tmean (°C) | Standard Deviation (°C) | Tmin (°C) | Tmax (°C) |
|---|---|---|---|
| 31.36 | 8.79 | 4.8 | 48.9 |
Table 5.
ID of configurations.
| ID | Configuration |
|---|---|
| REF | ETFE 250 μm/air gap/ETFE 250 μm |
| C1 | ETFE 250 μm/air gap/OPV(100%)/ETFE 150 μm |
| C2 | ETFE 250 μm/air gap/OPV(50%)/ETFE 150 μm |
| C3 | ETFE 250 μm/air gap/ETFE-SILVER(50%) 250 μm |
Table 6.
Summary of luminous, solar, and thermal characteristics of the configurations.
| ID | τe | ρe | τv | ρv | g | SC | UISO (W/m2K) | UUNE-EN (W/m2K) |
|---|---|---|---|---|---|---|---|---|
| REF | 0.834 | 0.135 | 0.827 | 0.151 | 0.84 | 0.97 | 2.81 | 2.91 |
| C1 | 0.147 | 0.306 | 0.065 | 0.21 | 0.27 | 0.593 | 2.68 | 2.78 |
| C2 | 0.474 | 0.238 | 0.435 | 0.197 | 0.57 | 0.756 | 2.75 | 2.85 |
| C3 | 0.554 | 0.272 | 0.550 | 0.277 | 0.60 | 0.746 | 2.64 | 2.81 |
Table 7.
Envelope thermal characteristics.
| Elements | U-Value (W/m2K) | |
|---|---|---|
| Barcelona | Paris | |
| Walls | 0.75 | 0.36 |
| Roof | 0.5 | 0.20 |
| Ground Floor | 0.75 | 0.20 |
Table 8.
Assumptions.
| Description | Value | Units |
|---|---|---|
| Set point in heating period | 20 | °C |
| Set point in cooling period | 26 | °C |
| Occupation rate [31] | 10 | m2/per. |
| Heat gains per person (sensible) [31] | 5 | W/m2 |
| Heat gains per person (latent) [31] | 3.3 | W/m2 |
| Ventilation including infiltration [31] | 0.8 | s−1·m−2 |
| Light heat gains | Daylighting in Trnsys model | W |
| Appliances heat gain [31] | 12 | W/m2 |
| Lighting, illuminance in working areas [31] | 500 | lux |
© 2019 by the authors. Licensee MDPI, Basel, Switzerland. This article is an open access article distributed under the terms and conditions of the Creative Commons Attribution (CC BY) license (http://creativecommons.org/licenses/by/4.0/).
Share and Cite
MDPI and ACS Style
Moreno, Á.; Chemisana, D.; Vaillon, R.; Riverola, A.; Solans, A. Energy and Luminous Performance Investigation of an OPV/ETFE Glazing Element for Building Integration. Energies 2019, 12, 1870. https://doi.org/10.3390/en12101870
AMA Style
Moreno Á, Chemisana D, Vaillon R, Riverola A, Solans A. Energy and Luminous Performance Investigation of an OPV/ETFE Glazing Element for Building Integration. Energies. 2019; 12(10):1870. https://doi.org/10.3390/en12101870
Chicago/Turabian StyleMoreno, Álex, Daniel Chemisana, Rodolphe Vaillon, Alberto Riverola, and Alejandro Solans. 2019. "Energy and Luminous Performance Investigation of an OPV/ETFE Glazing Element for Building Integration" Energies 12, no. 10: 1870. https://doi.org/10.3390/en12101870
Note that from the first issue of 2016, this journal uses article numbers instead of page numbers. See further details here.