Use of Waste Glass as A Replacement for Raw Materials in Mortars with a Lower Environmental Impact
by
 , ,
, ,
Viviana Letelier
1 ,
,
Bastián I. Henríquez-Jara
1,
Miguel Manosalva
1,
Camila Parodi
1 and
José Marcos Ortega
2,* 1
Department of Civil Engineering, Universidad de la Frontera, Av. Fco. Temuco, Salazar 01145, Chile
2
Departamento de Ingeniería Civil, Universidad de Alicante, Ap. Correos 99, 03080 Alacant/Alicante, Spain
*
Author to whom correspondence should be addressed.
Energies 2019, 12(10), 1974; https://doi.org/10.3390/en12101974
Submission received: 14 April 2019
/
Revised: 14 May 2019
/
Accepted: 17 May 2019
/
Published: 23 May 2019
(This article belongs to the Special Issue Sustainability Assessment of Energy Technologies and Energy Systems and Their Contribution to the UN Sustainable Development Goals)
Abstract
:Glass waste used in mortars or concretes behaves similar to cement, with resulting environmental benefits. In this light, the behavior of glass powder of various particle sizes has been analyzed as a cement replacement in mortars, in an attempt to minimize the loss of strength and durability, and maximize the amount of materials replaced. The dry density, water accessible porosity, water absorption by immersion, capillary absorption coefficient, ultrasonic pulse velocity and both compressive and flexural strengths were studied in the mortars. Furthermore, a statistical analysis of the obtained results and a greenhouse gases assessment were also performed. In view of the results obtained, glass powder of 38 microns allows up to 30% of the cement to be replaced, due to the filler effect combined with its pozzolanic activity. Moreover, it has been observed that glass powder size is one of the factors with the greatest influence among the properties of porosity, absorption and capillarity. On the other hand, in the mechanical properties, this factor does not contribute significantly more than the amount of glass powder. Finally, the greenhouse gasses analysis shows that the incorporation of glass powder reduces the CO2 emissions associated with mortar up to 29.47%.
1. Introduction
The first manufactured glass was found in ancient Mesopotamia [1] and its production has boosted since then to reach massive capacities, which inevitably entails major waste rates. In spite of the lack of information; in 2012 it was estimated that a high-income country produces 602 million tons of solid waste per year, 7% of which is glass [2]. The main concern of waste glass production is the use of landfill, which is at odds with its properties that make it optimal for recycling [3].
Recycling rates vary according to country. The US recycles just 26% of the 11.48 millions of tons of waste glass produced, while 61.3% ends up in landfills [4]. By contrast, the EU28 reached 74%, the highest recycling rate in 2016, with peaks over 95% in Sweden, Belgium, the Netherlands, and Denmark [5]. There is an imminent need to find a way to reduce the amount of glass waste in those countries where it is still not managed, and it has been proven that high levels of glass recycling can be achieved.
On the other hand, the cement industry is one of the major industrial CO2 emitters [1], directly due to limestone thermal treatments and indirectly due to kiln heating, which releases CO2 through fossil burning. One kilogram of concrete generates 0.9 kg of CO2 [6]. It is concerning because, in light of cement consumption, it is considered the second most consumed substance on Earth, surpassed only by water [7]. That is why one of the biggest opportunities to mitigate the environmental impact of concrete is through the use of supplementary cementitious materials (SCM), which are materials with pozzolanic properties used to replace cement in concrete [8,9,10].
Glass powder (GP) appears to be a solution because it contains silica (SiO2) in amounts greater than 70%, has high specific surface area and is amorphous in nature, which allows it to react with portlandite [11]. Pozzolanic properties can be noted only with a particle size below 300 μm [12]. The affinity between cement and glass powder can be taken advantage of to reduce the percentage of cement in concrete and manage waste glass generation.
It has been demonstrated that glass powder of specific sizes and in certain proportions does not affect the mechanical properties of concrete [11]. Moreover, Elaqra and Rustom [13] stated that it is already known that the compressive and flexural strengths of concrete with GP as SCM are controlled by the chemical composition, amount and size of GP. It was proved that the smaller the particle size, the higher the pozzolanic activity [1,14,15,16,17], and the optimal size is in the 45–75 μm range [18]. The influence of the amount of GP was widely studied [11,19,20], but it was determined that optimal results are achieved between 10–30% [1,11], and even amounts up to 15% enhance the compressive strength [21]. The hydration of cement is also improved because of the particle size and the pozzolanic behavior of GP [22]. According to the physical and chemical criteria of ASTM C 618 and European standards (UNE-EN 450-1), glass can be considered a pozzolanic cementitious material [23].
The durability properties were studied too. Water absorption [21,23,24], porosity [24,25] and workability [26,27] are also influenced by GP particle size and amount. Homogeneity of mortar was also studied with ultrasound by Wang et al. [27], who used prediction models, relating compressive strength, curing days and cement replacement.
The aims of this study were: to quantify the influence of the particle size and the percentage of cement replacement on the mechanical and durability properties of mortar with 10, 20, and 30% replacement with GP of 38 μm, 45 μm, and 75 μm, using an analysis of variance (ANOVA); to analyze the CO2 emissions due to the GP production process and variation in the mortar total CO2 emissions; and to conclude an optimal size-amount combination, taking the environmental impact and mortar properties into account.
2. Materials and Methods
2.1. Materials
2.1.1. Portland Cement
Table 1 presents a chemical analysis of the pozzolanic cement used in this study. This cement is type P according to standard ASTM C 595.
2.1.2. Waste Glass
The typical soda water lime glass used in this study is obtained from clear glass bottles. Its chemical composition can be observed in Table 1. The GP is obtained with a process of crushing and dry grinding, followed by a process where the particles are separated according to the size required, in this case glass particle sizes of 75 μm, 45 μm and 38 μm.
2.2. Mix Proportion
The proportions of the mortar mixture for 0.003 m3 are provided in Table 2. In order to analyze the influence of different types of waste and maximum particle sizes, 13 mortar mixtures were prepared. They were prepared with a water to cement ratio of 0.6 and cement to sand ratio of 1:3.
The cement replacements for GP of 10%, 20%, and 30% in weight and three maximum sizes of GP equal to 75 μm, 45 μm, and 38 μm were analyzed.
Regarding the curing of the specimens, all of them were stored in a humidity chamber, where the temperature was 20 °C and the relative humidity (RH) was 95%, during the first 24 h after setting. Once that period finished, the specimens were de-moulded and kept immersed in water in optimum laboratory conditions (20 °C and 100% RH), up to the corresponding testing age.
2.3. Testing Methods
2.3.1. Microstructure Characterization of the Glass Powder
In order to characterize the glass powder studied in this research, scanning electron microscopy (SEM) images were obtained and energy dispersive spectroscopy (EDS) analysis were performed, both using a FESEM microscopy model ZEISS SUPRA 40. In addition to this, the glass powder was also characterized with a X-ray diffractometer (XRD) model Rigaku RINT 1400, using monochromatic Cu Kα radiation at 50 kV and 80 mA, with an angular speed 2°/min and step 0.02° for the 2θ range 4°–60°.
2.3.2. Consistency
The fluidity of the mortar was set according to Spanish Association for Standardization and Certification standard UNE-EN1015-3 [28]. The flow was measured with a mini slump cone, whose internal diameter was 100 mm, on a 250 mm flow table disc. The procedure was as follows: the mould was first filled with fresh mortar, and then it was raised vertically to extend the mortar on the disc, shaking the flow table 15 times at a constant rate. Two perpendicular diameters of the mortar were then measured and recorded.
2.3.3. Dry Density
The dry density (ρd) was obtained following the standard UNE-EN 1015-10 [29], for which 3 cylindrical samples 100 mm in diameter and 50 mm high were used. This was carried out at 28 and 90 days of curing. First, the samples were dried for a minimum of 24 h in a furnace at 105 °C and the dry weight was measured (A). Then, they were placed in water for 24 h and the saturated weight was measured (B). Finally, the weight of the sample suspended in water was measured and the submerged weight was obtained (C). The dry density was calculated using the formula given by Equation (1).
where γ is the density of the water equal to 1 g/cm3.
2.3.4. Water-Accessible Porosity
Water-accessible porosity (Pa) was calculated according to standard UNE-EN 1015-18 [30] (based on information of the dry density using the ratio established in Equation (2).
2.3.5. Water Absorption by Immersion
The water absorption by immersion, Abs (%), was calculated according to standard UNE-EN 1015-18 [30] from the dry density data, applying the formula given in Equation (3).
2.3.6. Capillary Absorption Test
In terms of water absorption rate, it was calculated in accordance with ASTM C1585 [31]. To perform the test, three cylindrical samples 100 mm in diameter and 50 mm high were used, and the increase in the mass due to water absorption, as a function of time was monitored.
The initial water absorption rate (cm/s1/2) was obtained from the slope between the periods between 1 min and 6 h, i.e., from the absorption-square root of the time chart. On the other hand, the capillary absorption coefficient (K) was obtained from Equation (4).
where K is the capillarity coefficient (cm/s1/2); Q is the amount of water absorbed (cm3); A the surface area exposed to the water (cm2) and t the time (s).
2.3.7. Compressive and Flexural Strength
Complying with UNE-EN 196-1 standard [32], three different prism specimens measuring 4 cm × 4 cm × 16 cm were tested for each series at 7, 14, 28 and 90 curing days, from which the compressive and flexural strengths were obtained.
2.3.8. Ultrasonic Pulse Velocity (UPV) Test
The aim of the ultrasonic pulse velocity (UPV) method is to verify the homogeneity of the material, the presence of cracks or hollows, possible changes in the properties with curing age and to get information about the physical and dynamic properties of the mortars. The UPV test determines the propagation velocity of a sound wave in a certain material; detecting the time it takes a wave to cross a certain thickness. For this method, the tests were conducted on 3 cylindrical test tubes 100 mm in diameter and 50 mm high according to ASTM C597-02 [33] using an UPV testing instrument model Controls 58-E4800. The time for an ultrasonic pulse to move across the specimen was measured with a precision of 0.1 μs, with 54 kHz transducers located at the center of the opposite side of each specimen.
2.3.9. Statistical Analysis
To determine the statistical significance of the variables with respect to the changes in the mechanical properties and durability of the samples, an analysis of variance (Factorial ANOVA) was performed, using the statistical environment R for each property analyzed. The level of significance used was 5%, i.e., a 95% probability that the effect is significant.
The factors of each model (independent variables) were: percentage of glass (%GP, 3 levels) and the particle size of the glass (GP Size, 3 levels) plus the corresponding interactions. The dependent or design variable was the property studied in each case.
The percentage share of each factor in the value of each property was estimated with the sum of squared differences (Sum Sq) of each factor with respect to the total of Sum Sq variations [34]. The correlation was obtained from this, as this is the ratio between the sum of all the variations of the factors of the model and total variation of the model [34].
2.3.10. Greenhouse Gases (GHG) Analysis
To analyze the CO2 values associated with the production of GP of different particle sizes, the equations used are those proposed by Shuhua Liu et al. [35], who developed models to determine the glass particle size corresponding to the 25th, 50th, 75th and 90th percentiles of the particle size, respectively, depending on the grinding time. From these, Equation (5) (which presents R2 = 0.988) is used inversely to calculate the approximate grinding time taken to obtain particles of the size used in this study.
where D90 is the size (μm) of the opening of the sieve, through which 90% of the sample mass passes, and t is the grinding time in minutes. Inversion is proposed to obtain the ratio showed in Equation (6).
According to the life cycle analysis of the glass cast by British Glass, the electricity consumption in the process of grinding and segregating the glass is from 3 to 15 kWh per ton [36]. In order to determine the influence of CO2 emissions on electricity production, a comparison was made between the amount of CO2 per ton of GP cast by three different countries depending on their emissions per kWh (kgCO2/kWh) registered by the OECD tool “Compare your Country” [36]. For cement, the CO2 emission recorded in the ICE Database is considered [37].
For the cement, it was considered a factor of 0.83 kgCO2/kg and an embodied energy of 4.6 MJ/Kg (1277 kWh/ton) [38]. On the other hand, for the sand, a factor 0.014 kgCO2/kg was considered [38], while its embodied energy was not taken into account, because the sand has not been compared to other materials. With regard to the GP, an estimate was made of the energy consumption of the grinding machine model Gilson Testing Screen TS-1F and the average CO2 emissions provided by the OECD [37] per kWh associated with the generation of electricity (0.432 kg CO2/KWh). In terms of the GHG and energy consumption, the contribution of GP is negligible compared to the cement.
To gain better insight into how much more sustainable the proposed raw materials are compared to the conventional ones, the SUB-RAW Index [39] was analyzed, defined in Equation (7)
where: EEraw represents the embodied energy of the original material (MJ/kg); EEsub represents the embodied energy of the proposed material (MJ/kg); CFraw represents the CO2 emissions of the original material (kg/kg); CFsub represents the CO2 emissions of the proposed material (kg/kg).
For the abovementioned index, which can take values between −9 and 9, the more positive indicates greater sustainability (in relative terms) than the compared material.
3. Results and Discussion
3.1. Characterization of the Glass Powder
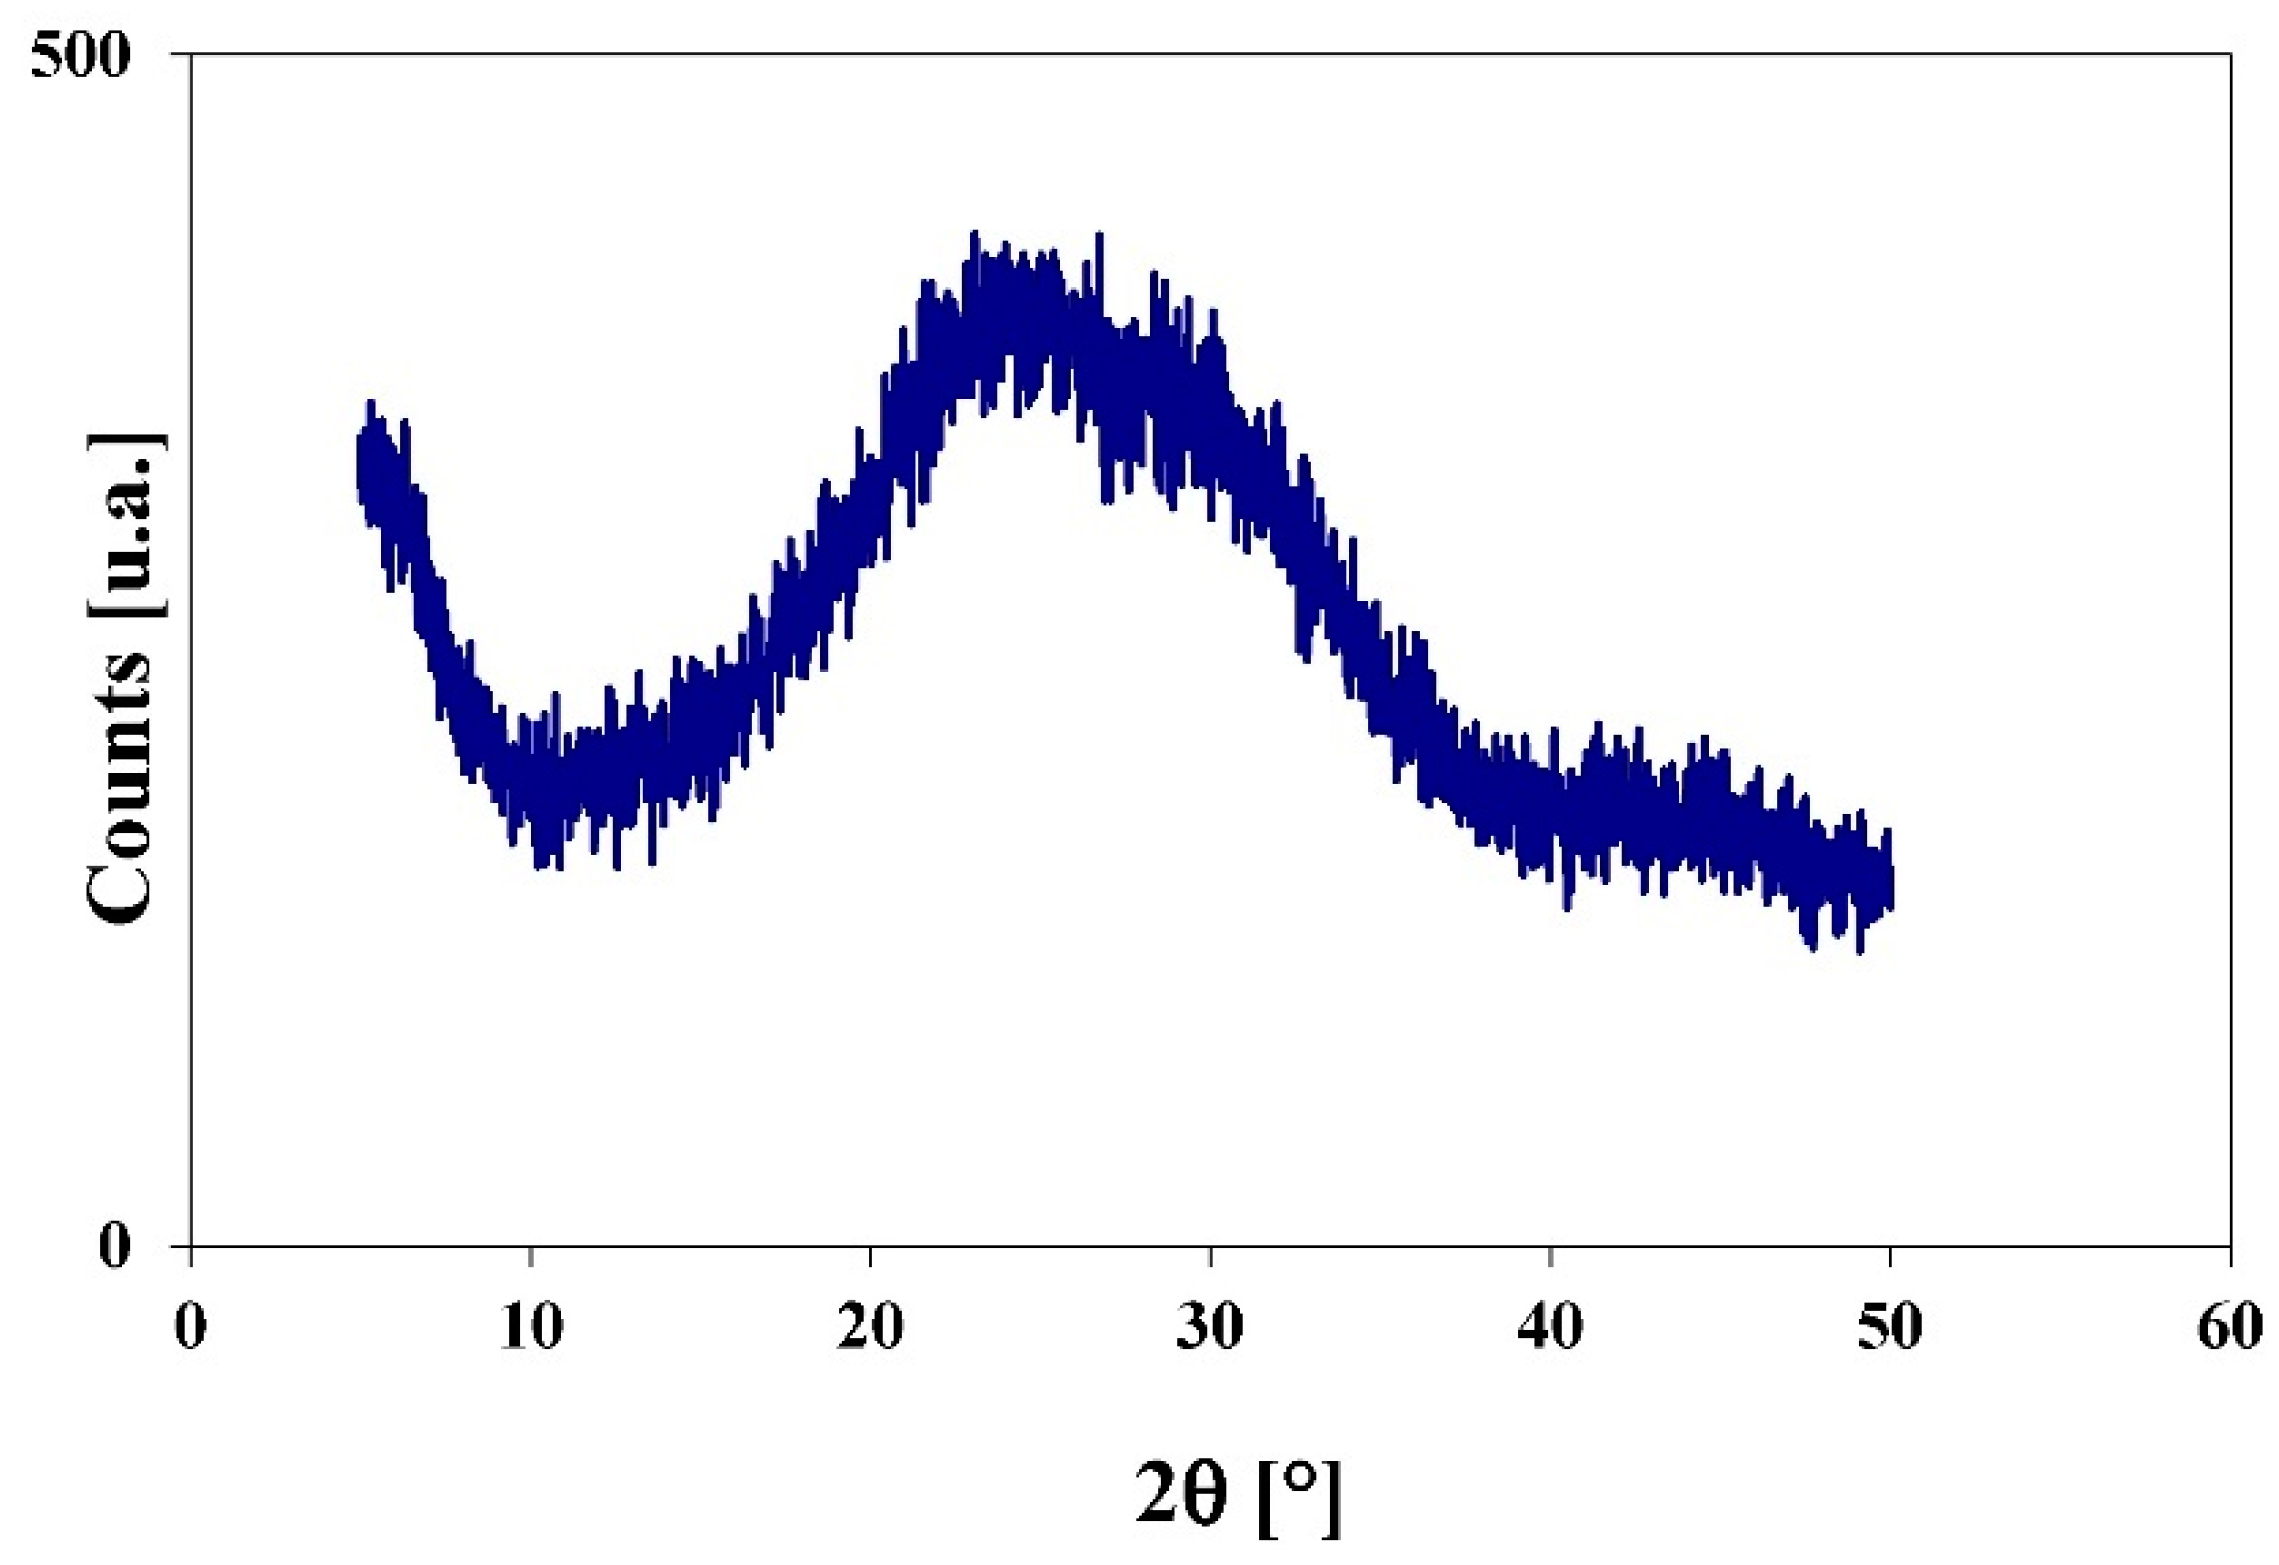
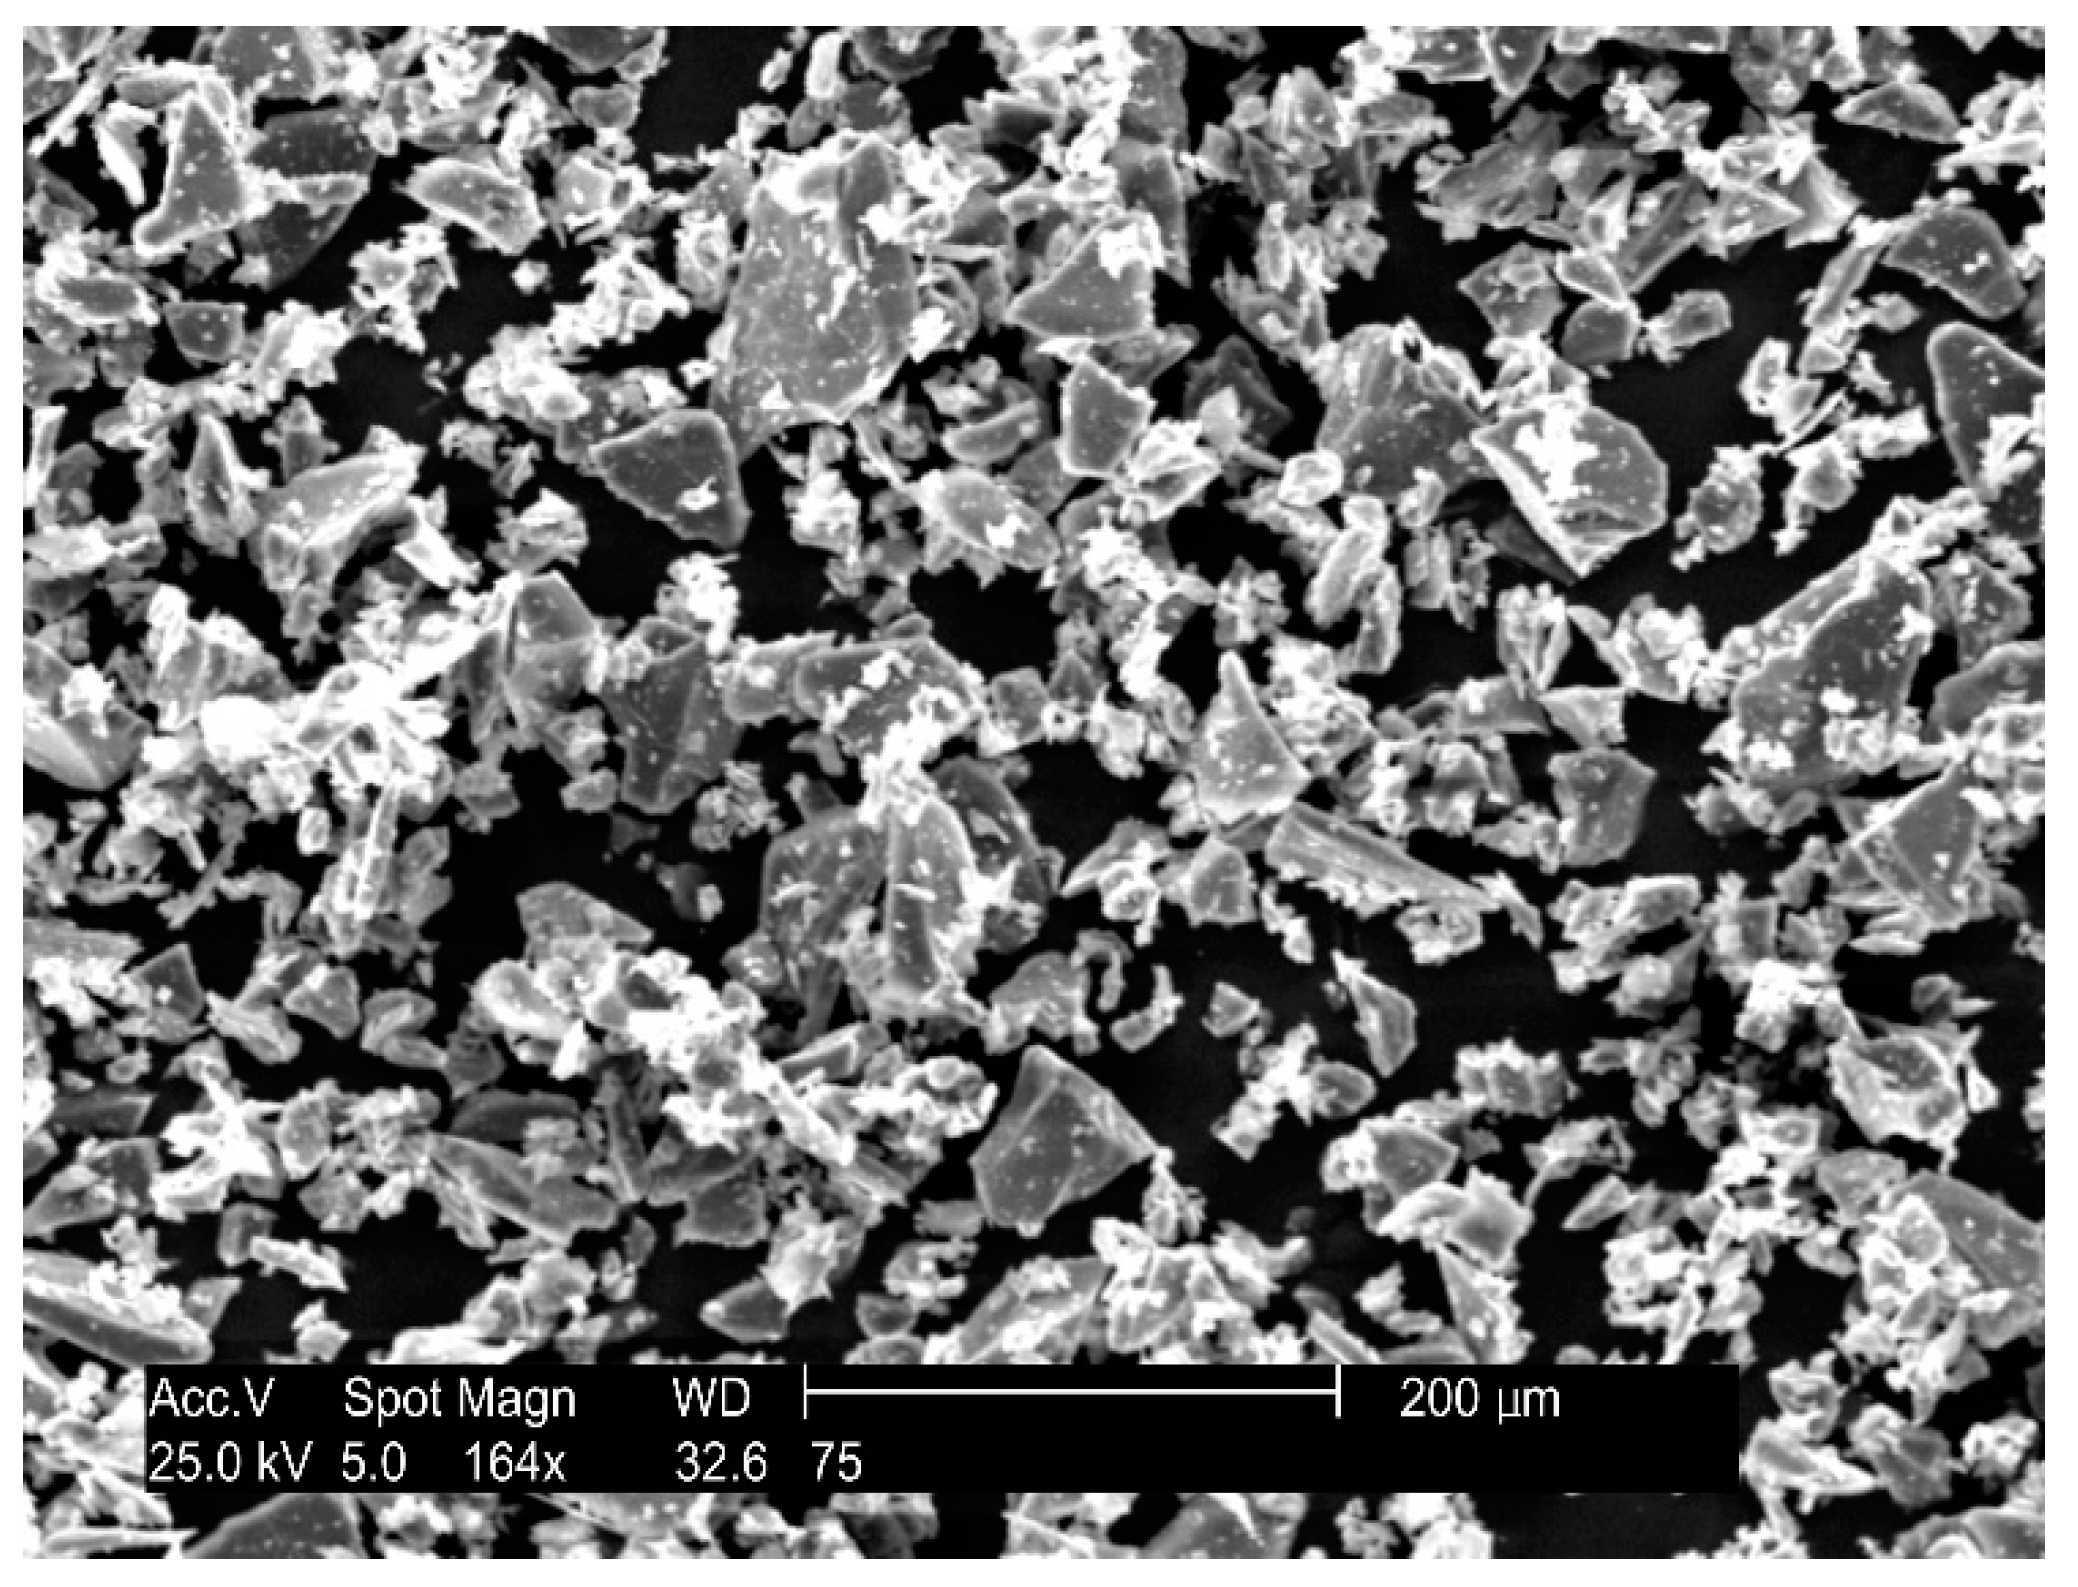
The waste glass was obtained from municipal recycling containers. The mineralogical study of the dry GP was carried out using X-ray diffraction (XRD), as has been explained in Section 2.3.1. From the images obtained from the diffraction patterns of the XRD analysis of the GP (Figure 1), no peaks attributable to any crystallized compound were observed, except for a wide diffraction halo between 20 and 30, corresponding to the vitreous phase, which is consistent with previously conducted studies [40]. The results of the scanning electron microscopy (SEM) and the energy dispersive spectroscopy (EDS) are depicted in Figure 2 and Figure 3, respectively. The SEM micrographs showed that most of the GP particles are angular and shredded.
3.2. Consistency
The consistency values are presented in Table 2. As observed, the mortar consistency was affected first by the GP particle size and then by the percentage of cement replacement. According to Lu et al. [26], in order to analyze the consistency of mortars with GP as a cement replacement, two characteristics of GP must be considered. The first one is the non-hydrophilic and smooth character of the GP surface. The other characteristic is the irregular and angular shape of waste GP. The former could cause in the effective water to cement (w/c) ratio to increase, which would improve the fluidity of the fresh mortar. By contrast, as a result of the sharp edge and the high aspect ratio, the incorporation of waste GP might impede the movement of the mortar.
When 75 µm particles are used, a more noticeable reduction in consistency is observed, which increases with the rise in the percentage of GP. This is produced principally to the greater particle size and the irregular shape of the GP. According to Lu et al. [26], the sharper edge and the more angular shape of the GP particles reduce the fluidity of the cement mortars and concretes.
On the other hand, when the particle size is reduced, the consistency of the mortar increases to values even greater than those of the control mortar, likely because the finest particles are able to reduce the friction due to the irregular shape [26] and because the non-absorbent surface of the GP could compensate for the loss of viability due to the abovementioned irregular shape [26].
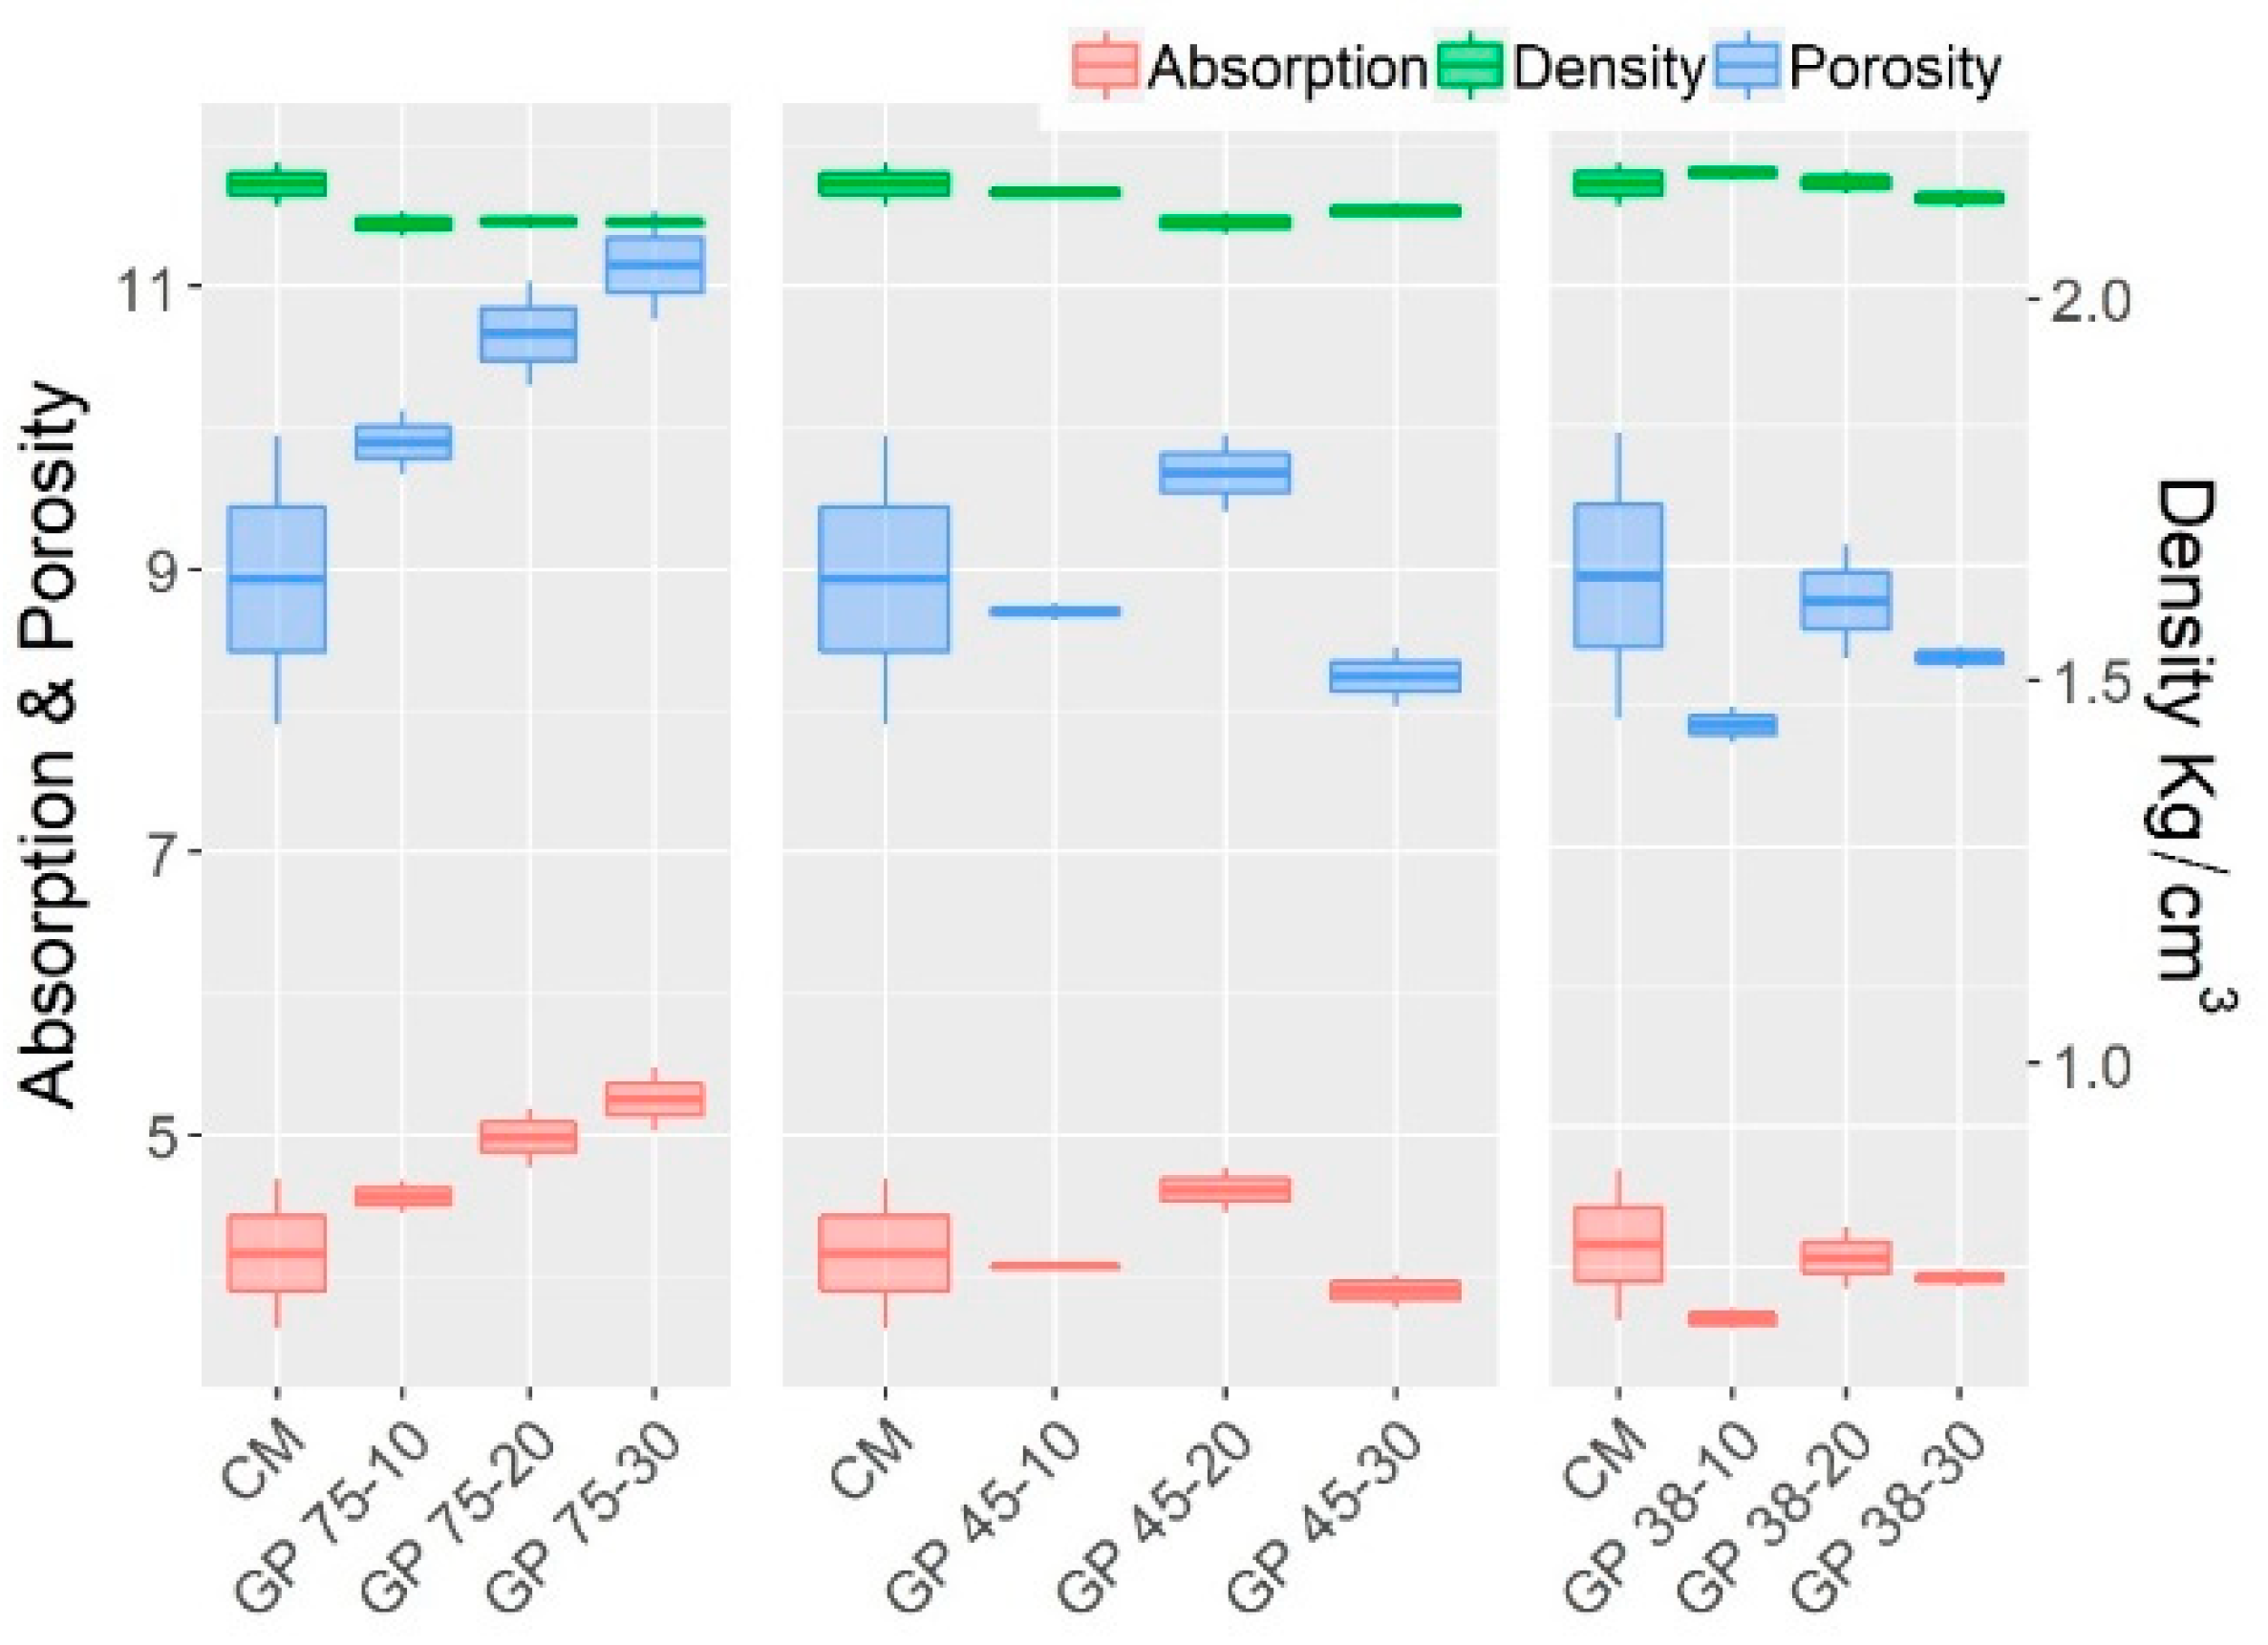
3.3. Dry Density, Water Absorption and Open Porosity
Figure 4 shows the values of the density, absorption and open porosity observed at 28 days. The error bars of the abovementioned figure represent the standard deviation for each mortar result.
At 28 days, the densities of the mortars with GP are lower than the control mortar, due mainly to the lower density of the GP compared to the Portland cement to which it is replacing. Therefore, as the GP replacement percentage increases, the density of the mortar falls. However, the density increases slightly with the decrease in the maximum size of the GP, due mainly to the filler effect of the finer particles that make it possible to fill the empty spaces within the mortar matrix. The small GP particles produce a high packing density of the cement paste structure, which causes a reduction in porosity and absorption [40].
In addition to this, the absorption and porosity results show a decreasing tendency, as the particle size and the replacing percentage are reduced—which could be justified in relation to the size of GP particles used. In the case of 75 µm, these GP particles probably replaced cement percentages with a smaller average particle sizes, producing a less compact matrix with higher porosity and therefore leading to a pore network which allows higher absorption. On the other hand, when GP particles of 45 microns or less are used, mortars can be obtained with absorptions and porosities similar to or lower than the control mortar.
3.4. Water Absorption by Capillarity
Figure 5 presents the values of the coefficients of capillarity at 28 days of curing. In that figure, the error bars represent the standard deviation for each mortar result. From the charts, it is noted that the capillarity of all the series is generally greater than the control sample. This would show a lower difficulty to water ingress in the series with glass powder compared to the control ones. In view of the results obtained, it has been noted that a rising tendency of the water absorption as the particle size and the replacing percentage increase. This could be related to the granulometric distribution of the GP used, because in the cases of 75 µm and 45 µm GP particles, they probably replaced cement percentages with a smaller average particle size. The increase of the water absorption by capillarity—as the replacing percentages of cement by GP rise, tends to be stabilized for the series with a particle size smaller than 38 µm, showing capillarity values closest to the control mortar. This is due mainly to the finest particles physically filling the capillary pores, producing a more refined pore network, which would reduce the capillary absorption [23].
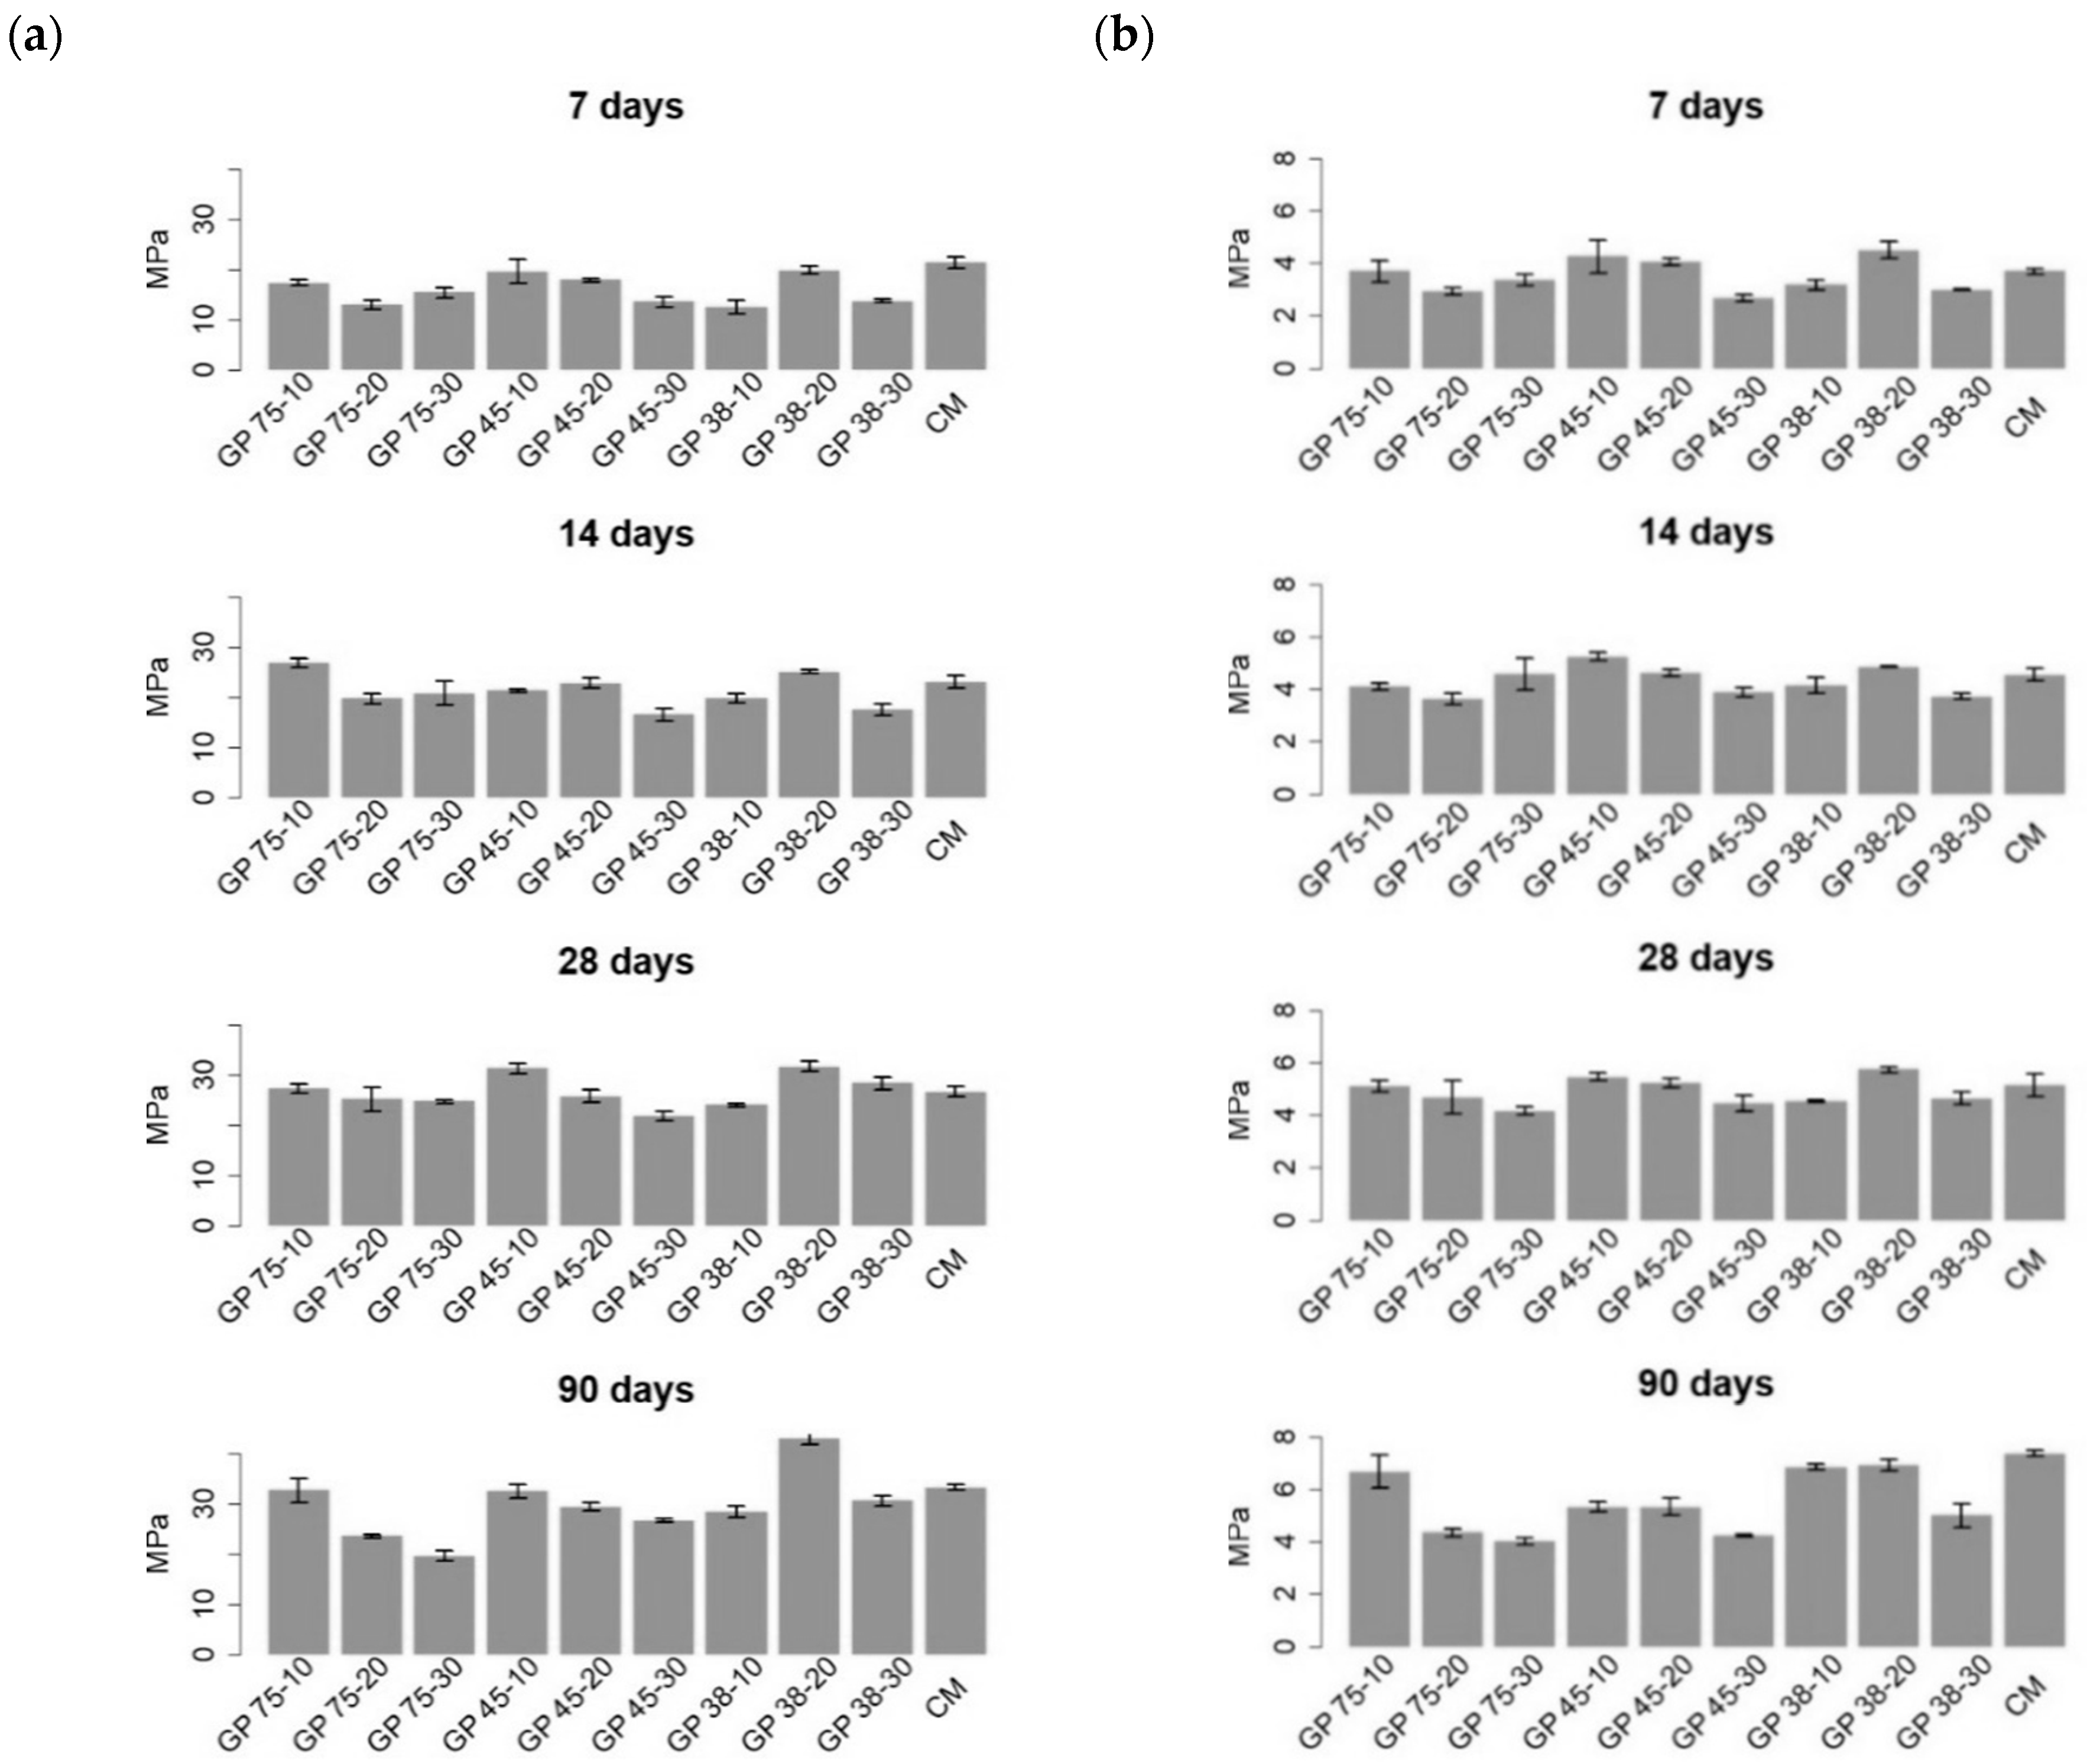
3.5. Compressive and Flexural Strength
The results of the compressive strengths appear in Figure 6a, in which the error bars represent the standard deviation for each mortar result. As may be noted, the strengths of the series are affected by the GP particle size, with greater strength being observed in the mortars with finer GP particles. This is mainly due to the combined effect of the physical and pozzolanic properties of GP particles smaller than 45 µm. First, the finest GP particles can fill the gap left by other components, lessening the pore volume in the hardened matrix. On the other hand, the reaction between the amorphous compounds, like alumina and silica, with portlandite produces silicate/aluminate hydrates similar to those produced as a result of cement hydration, which is known as the pozzolanic effect [41].
These results agree with those reported by Idir et al. [42], where greater strengths were observed for the lowest size particles, with values that sometimes exceed the reference ones without glass, independently of the percentage of replacement used. Lu et al. [26] conclude that GP particle size is an important factor responsible for the increase in pozzolanic reactivity. For their part, Kim et al. [40] comment that smaller particles, given their greater contact surface, can increase the pozzolanic reactions because this is proportional to the amount of surface available for the reaction.
It is observed that, at seven days of curing, all the series present lower compressive strengths than that of the control mortar. As the curing days increase, these differences decrease, which reveals the delayed pozzolanic reactivity of GP [13]. Lu et al. [43] suggest that the reactivity of GP can compete with traditional pozzolana after extended curing.
The flexural strength (Figure 6b) shows a behavior influenced by the maximum size of GP particles. Mortars with GP particle sizes of 45 and 38 microns exhibit behaviors similar to the control mortar for percentages up to 20%. However, the mortars with particle sizes of 75 microns only behave similarly to the control mortar for percentages up to 10%.
3.6. Ultrasonic Pulse Velocity
The UPV values for the mortar samples at 28 days of curing are shown in Figure 7.
Generally, the UPV values obtained for all the samples are very close, slightly lower than those of the control mortar, with values similar to those found by Wang et al. [27]. Most of the samples are catalogued with medium quality according to the ASTM C597-02 criteria, with the exception of series GP 75-30 and GP45-10. Nevertheless, these series are very close to the lower limit of this category of 3000 m/s.
3.7. Statistical Analysis
Flexural strength and durability properties were tested on three samples from each mortar, while compressive strength was tested on six samples from each mortar. The coefficient of variation of the mortar results are shown in Table 3 for mechanical properties, while Table 4 shows the variation coefficients (c.v.) of durability properties and the respective mean values (μ). The mean c.v. of durability properties is 0.061, with maximal values of 0.24 and minimal value of 0.01, values low enough to consider the mean value as a representative measure of central tendency for durability properties. The same occurs with the variation of mechanical properties, where the c.v. has a mean of 0.05 with maximal values of 0.14 and minimal of 0.01.
The statistical analyses are summarized in Table 5 and Table 6 for 28 days and 90 days, respectively.
In the case of compressive and flexural strengths, generally an increase in the R2 value can be seen for the ANOVA models at 90 days of setting (Table 6) compared to 28 days (Table 5), which is reflected in a stabilization of the models due to variation reduction associated with the residual value. This is accompanied by a general increase in the number of factors, whose influence is statistically significant compared to at 28 days. It is possible to observe that the contribution of the factor GP Size is high for the compressive strength values at 90 days (32%), with both values being of high statistical significance (P near zero). However, for this same property, the factor % GP proved to have more participation than that found for mortar samples in previous studies [44].
The flexural strength was mainly affected by the interaction between the percentage of GP for both setting periods (45% and 44% participation, respectively), with P values near zero.
For porosity and absorption, the factor that participated most at 28 days was the percentage of GP. The results of the analysis for density and ultrasound were not statistically significant at 28 days of curing.
Further, some correlation between the studied properties can be noted. Table 7 shows the correlation between mechanical properties at 28 and 90 days and durability properties.
From Table 7, inverse correlations between porosity (at 28 and 90 days) and mechanical properties can be noted, where the strongest inverse correlation corresponds to porosity at early ages and flexural and compressive strength at 90 days. The same phenomenon can be seen in the correlation between absorption (both ages) and mechanical properties. In other words, a lower absorption capacity and porosity is related with higher flexural and compressive strength.
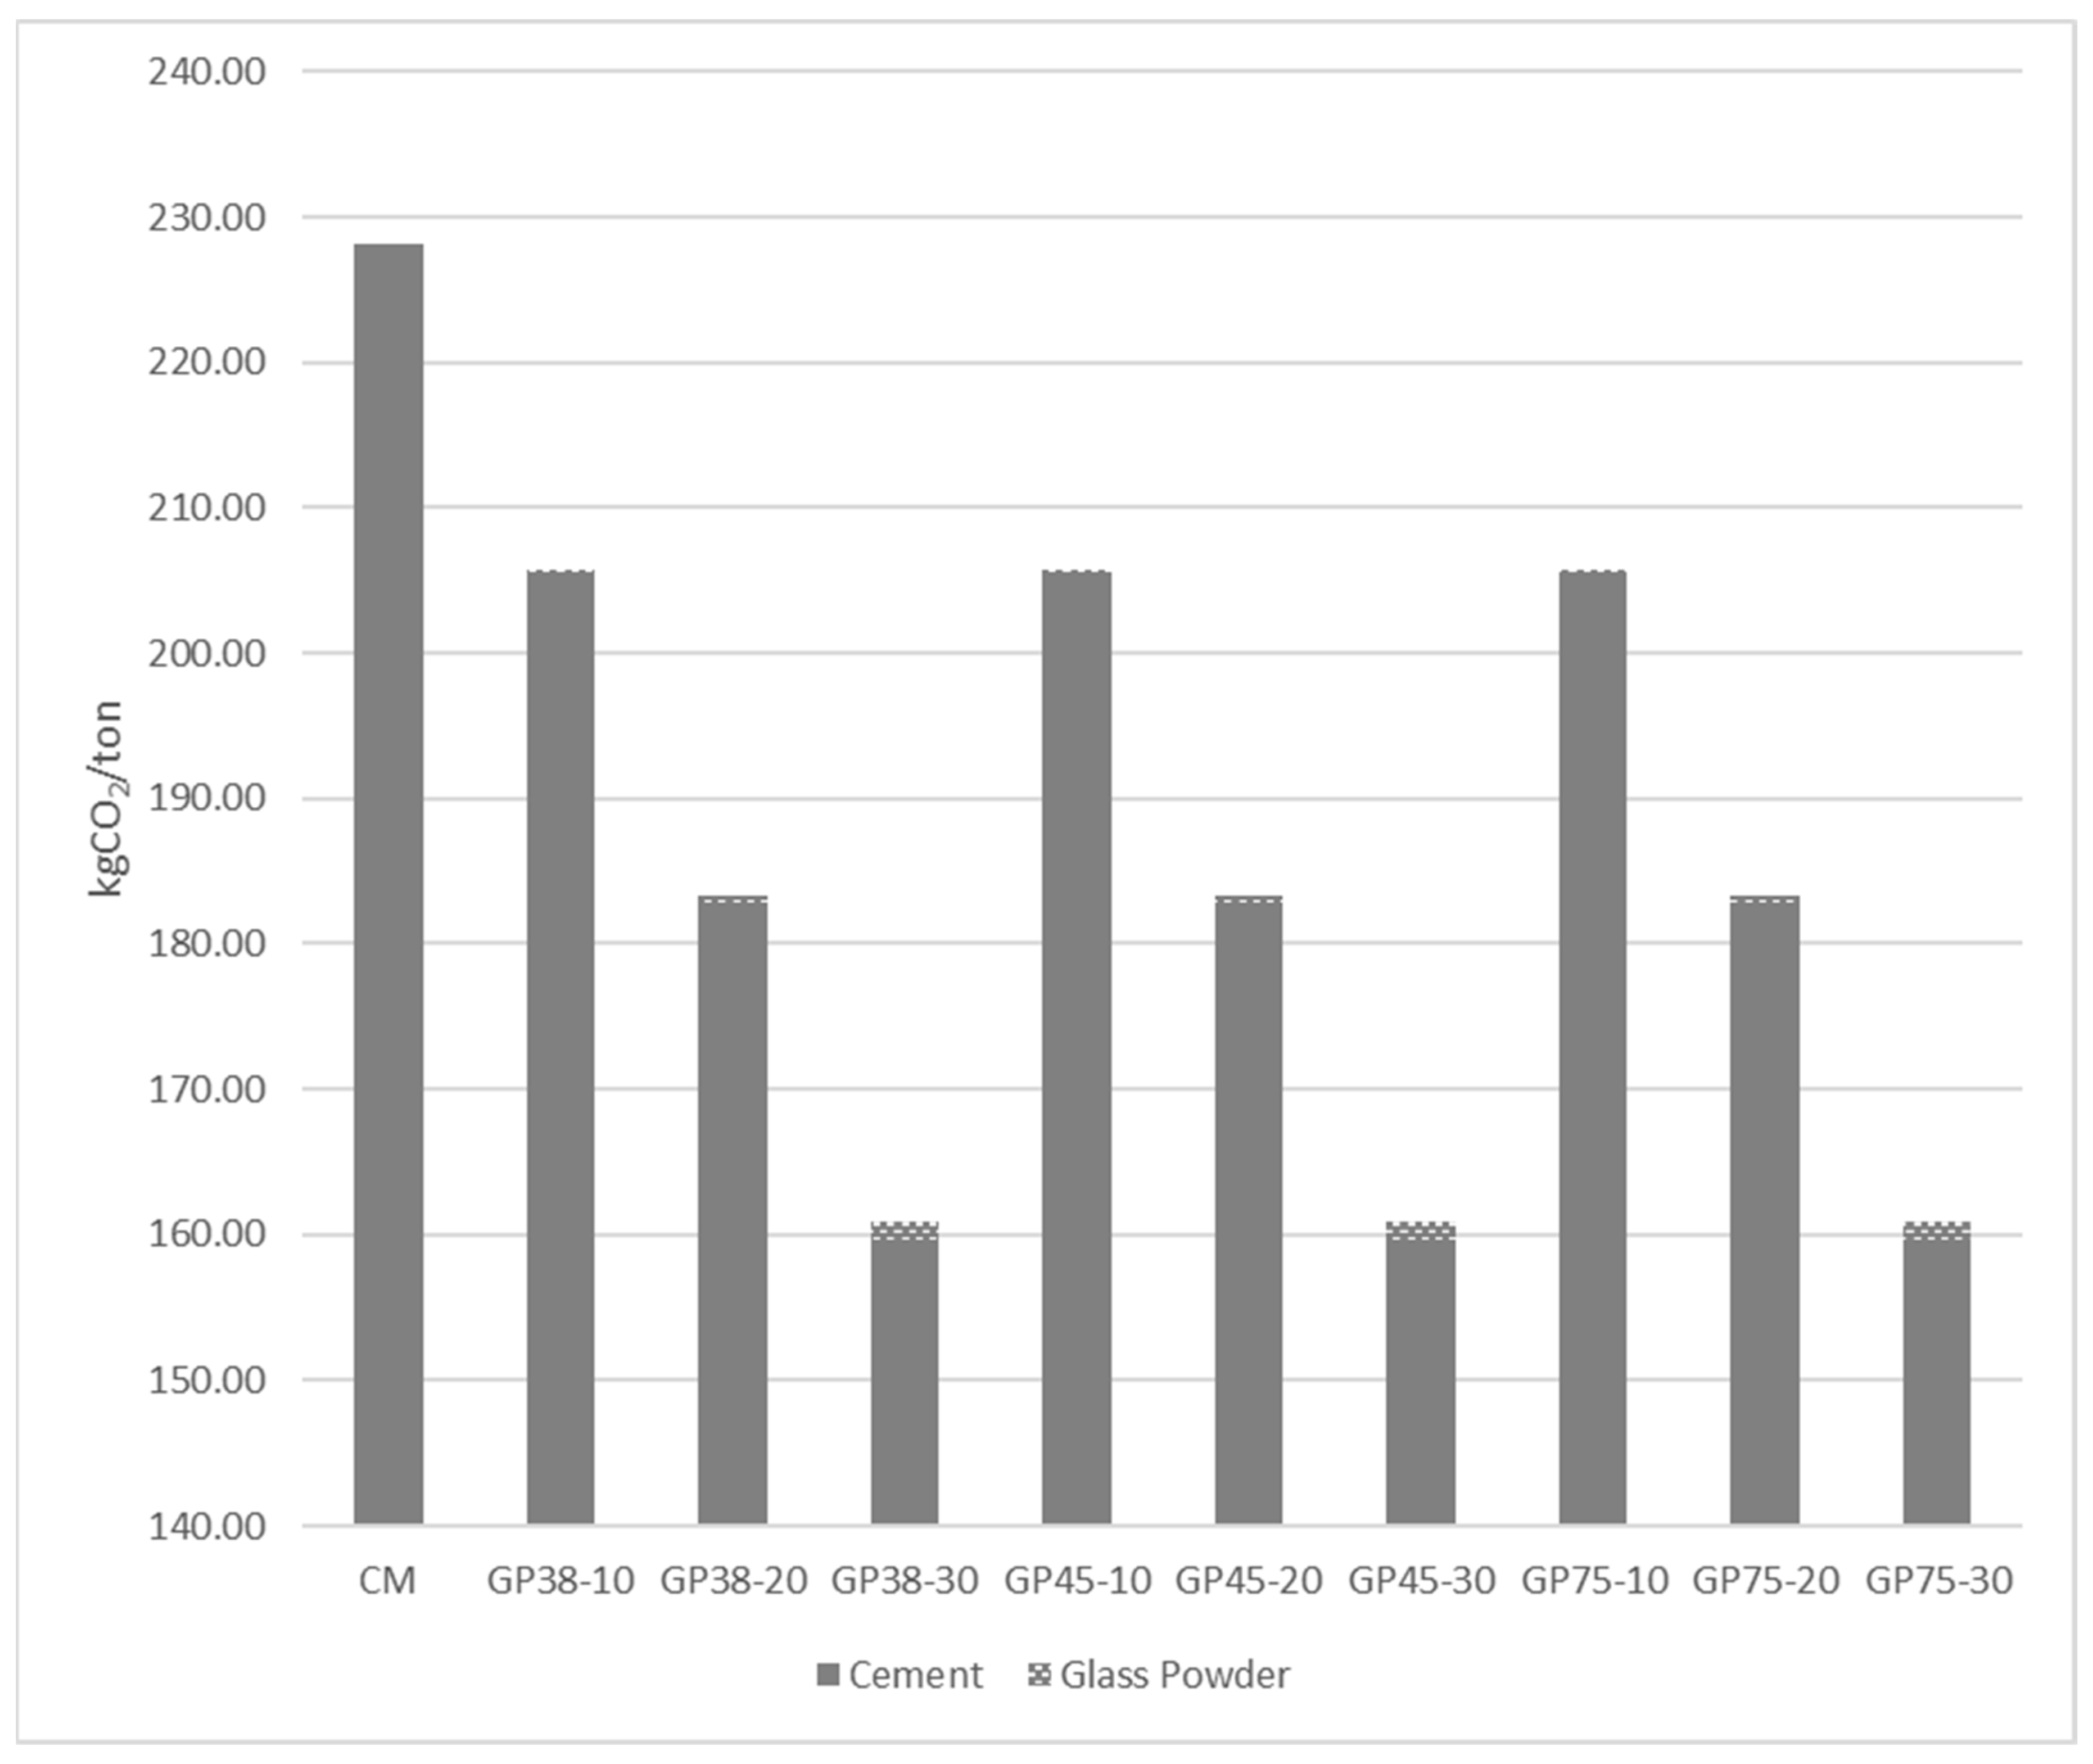
3.8. Greenhouse Gas (GHG) Assessment
Norway, South Africa, and Chile were chosen for comparison with the OECD average (0.432 kg CO2/kWh); the first for having the lowest CO2 emission per kWh (0.008 CO2/kWh), the second for having the highest CO2 emissions per kWh (0.926 CO2/kWh), and Chile as the object of study in the context of this investigation (0.482 CO2/kWh). A consumption of 15 kWh per ton of GP is considered [36].
Despite the variation in GP-related CO2 emissions depending on which factor of CO2 emissions per kWh is used, this does not really affect the results. Using the OECD average of CO2 emissions by electrical consumption, the results in Figure 8 are obtained. The CO2 associated with GP grinding is very small compared to the CO2 associated with the cement that is replaced (see Table 8). The GP part is only between 0.2% (for GP 75–10) and 0.9% (for GP 38–30) of the 228.13 kg CO2/ton associated with the control sample. The greatest reduction occurs for the GP75–30 sample (29.47%).
It is deduced in view of the SUB-RAW index (Table 9) that the GP is much more sustainable compared to cement, and following the Botempi’s interpretation regarding this index, it may be stated that EE and CF of GP are less than that of the cement up to 2.84 orders of magnitude, depending on the country where it is produced.
4. Conclusions
The main conclusions to be drawn from the analyzed results can be summarized as follows:
- The use of GP particles with a maximum size of 38 microns make it possible to increase the cement replacements up to 30%,
- GP size is one of the factors with the greatest influence among the properties of porosity, absorption and capillarity. However, in the mechanical properties, this factor does not contribute significantly more than the amount of GP.
- The CO2 associated with GP grinding is negligible in comparison to that associated with cement, even when using the highest CO2 rate per KWh within the OECD.
- The statistical analysis supports the validity of the results obtained in the majority of the tests performed. The increase of R2 values in the mechanical properties for greater curing days is accompanied by a general increase in the number of factors whose influence is statistically significant at 90 days in respect to 28 days.
Author Contributions
V.L. wrote the paper. V.L., B.I.H.-J., M.M. and C.P. performed the experiments. J.M.O. supervised the research work and revised the paper. All the authors contributed to conceive and design the experiments, and to analyse and discuss the results.
Funding
Part of this research was funded by the Universidad de La Frontera (Chile) through the DIUFRO Project DI17-0013 (“Analisis del efecto de la trituración en el comportamiento del polvo de vidrio como reemplazo de cemento”).
Conflicts of Interest
The authors declare no conflict of interest.
References
- Jani, Y.; Hogland, W. Waste glass in the production of cement and concrete—A review. J. Environ. Chem. Eng. 2014, 2, 1767–1775. [Google Scholar] [CrossRef]
- Hoornweg, D.; Bhada-Tata, P. What a Waste. Available online: https://openknowledge.worldbank.org/handle/10986/17388 (accessed on 5 January 2019).
- Heriyanto; Pahlevani, F.; Sahajwalla, V. From waste glass to building materials—An innovative sustainable solution for waste glass. J. Clean. Prod. 2018, 191, 192–206. [Google Scholar] [CrossRef]
- United States Environmental Protection Agency (USEPA) Advancing Sustainable Materials Management: 2014 Fact Sheet. Available online: https://www.epa.gov/sites/production/files/2016-11/documents/2014_smmfactsheet_508.pdf (accessed on 5 January 2019).
- FEVE Glass Packaging Closed Loop Recycling Up to 74% in the EU. Available online: https://feve.org/glass-packaging-closed-loop-recycling-74-eu/ (accessed on 10 January 2019).
- National Ready Mixed Concrete Association Concrete CO2 Fact Sheet. Available online: https://www.nrmca.org/sustainability/CONCRETE CO2 FACT SHEET FEB 2012.pdf (accessed on 10 January 2019).
- Rubenstein, M. Emissions from the Cement Industry. Available online: http://blogs.ei.columbia.edu/2012/05/09/emissions-from-the-cement-industry/ (accessed on 10 January 2019).
- Liu, Y.; Sidhu, K.S.; Chen, Z.; Yang, E.-H. Alkali-treated incineration bottom ash as supplementary cementitious materials. Constr. Build. Mater. 2018, 179, 371–378. [Google Scholar] [CrossRef]
- Ortega, J.M.; Ferrandiz, V.; Antón, C.; Climent, M.A.; Sánchez, I. Influence of curing conditions on the mechanical properties and durability of cement mortars. In Materials Characterisation IV: Computational Methods and Experiments; Mammoli, A.A., Brebbia, C.A., Eds.; WIT Press: Southampton, UK, 2009; pp. 381–392. [Google Scholar]
- Ortega, J.M.; Sánchez, I.; Climent, M.A. Influence of environmental conditions on durability of slag cement mortars. In Proceedings of the 2nd International Conference on Sustainable Construction Materials and Technologies, Ancona, Italy, 28–30 June 2010; pp. 277–287. [Google Scholar]
- Omran, A.; Tagnit-Hamou, A. Performance of glass-powder concrete in field applications. Constr. Build. Mater. 2016, 109, 84–95. [Google Scholar] [CrossRef]
- Federico, L.M.; Chidiac, S.E. Waste glass as a supplementary cementitious material in concrete—Critical review of treatment methods. Cem. Concr. Compos. 2009, 31, 606–610. [Google Scholar] [CrossRef]
- Elaqra, H.; Rustom, R. Effect of using glass powder as cement replacement on rheological and mechanical properties of cement paste. Constr. Build. Mater. 2018, 179, 326–335. [Google Scholar] [CrossRef]
- Khmiri, A.; Samet, B.; Chaabouni, M. A cross mixture design to optimise the formulation of a ground waste glass blended cement. Constr. Build. Mater. 2012, 28, 680–686. [Google Scholar] [CrossRef]
- Shao, Y.; Lefort, T.; Moras, S.; Rodriguez, D. Studies on concrete containing ground waste glass. Cem. Concr. Res. 2000, 30, 91–100. [Google Scholar] [CrossRef]
- Shayan, A.; Xu, A. Value-added utilisation of waste glass in concrete. Cem. Concr. Res. 2004, 34, 81–89. [Google Scholar] [CrossRef]
- Shi, C.; Wu, Y.; Riefler, C.; Wang, H. Characteristics and pozzolanic reactivity of glass powders. Cem. Concr. Res. 2005, 35, 987–993. [Google Scholar] [CrossRef]
- Pereira-De-Oliveira, L.A.; Castro-Gomes, J.P.; Santos, P.M.S. The potential pozzolanic activity of glass and red-clay ceramic waste as cement mortars components. Constr. Build. Mater. 2012, 31, 197–203. [Google Scholar] [CrossRef]
- Kamali, M.; Ghahremaninezhad, A. Effect of glass powders on the mechanical and durability properties of cementitious materials. Constr. Build. Mater. 2015, 98, 407–416. [Google Scholar] [CrossRef]
- Sobolev, K.; Türker, P.; Soboleva, S.; Iscioglu, G. Utilization of waste glass in ECO-cement: Strength properties and microstructural observations. Waste Manag. 2007, 27, 971–976. [Google Scholar] [CrossRef] [PubMed]
- Aliabdo, A.A.; Abd Elmoaty, A.E.M.; Aboshama, A.Y. Utilization of waste glass powder in the production of cement and concrete. Constr. Build. Mater. 2016, 124, 866–877. [Google Scholar] [CrossRef]
- Kamali, M.; Ghahremaninezhad, A. An investigation into the hydration and microstructure of cement pastes modified with glass powders. Constr. Build. Mater. 2016, 112, 915–924. [Google Scholar] [CrossRef]
- Matos, A.M.; Sousa-Coutinho, J. Durability of mortar using waste glass powder as cement replacement. Constr. Build. Mater. 2012, 36, 205–215. [Google Scholar] [CrossRef]
- Harbi, R.; Derabla, R.; Nafa, Z. Improvement of the properties of a mortar with 5% of kaolin fillers in sand combined with metakaolin, brick waste and glass powder in cement. Constr. Build. Mater. 2017, 152, 632–641. [Google Scholar] [CrossRef]
- Lu, J.-X.; Zhan, B.-J.; Duan, Z.-H.; Poon, C.S. Using glass powder to improve the durability of architectural mortar prepared with glass aggregates. Mater. Des. 2017, 135, 102–111. [Google Scholar] [CrossRef]
- Lu, J.-X.; Duan, Z.-H.; Poon, C.S. Combined use of waste glass powder and cullet in architectural mortar. Cem. Concr. Compos. 2017, 82, 34–44. [Google Scholar] [CrossRef]
- Wang, C.-C.; Wang, H.-Y.; Chen, B.-T.; Peng, Y.-C. Study on the engineering properties and prediction models of an alkali-activated mortar material containing recycled waste glass. Constr. Build. Mater. 2017, 132, 130–141. [Google Scholar] [CrossRef]
- Asociación Española de Normalización y Certificación (AENOR). UNE-EN 1015-3. Métodos de ensayo de los morteros para albañilería. Parte 3, Determinación de la consistencia del mortero fresco (por la mesa de sacudidas); AENOR: Madrid, Spain, 2000. (in Spanish) [Google Scholar]
- Asociación Española de Normalización y Certificación (AENOR). UNE-EN 1015-10. Métodos de ensayo de los morteros para albañilería. Parte 10, Determinación de la densidad aparente en seco del mortero endurecido; AENOR: Madrid, Spain, 2000. (in Spanish) [Google Scholar]
- Asociación Española de Normalización y Certificación (AENOR). UNE-EN 1015-18: Métodos de ensayo de los morteros para albañilería. Determinación del coeficiente de absorción de agua por capilaridad del mortero endurecido; AENOR: Madrid, Spain, 2003. (in Spanish) [Google Scholar]
- ASTM International. ASTM C1585-13, Standard Test Method for Measurement of Rate of Absorption of Water by Hydraulic-Cement Concretes; ASTM International: West Conshohocken, PA, USA, 2013. [Google Scholar]
- Asociación Española de Normalización y Certificación (AENOR). UNE-EN 196-1:2005. Métodos de Ensayo de Cementos. Parte 1: Determinación de Resistencias Mecánicas; AENOR: Madrid, Spain, 2005. (in Spanish) [Google Scholar]
- ASTM International. ASTM C 597-02 Standard Test Method for Pulse Velocity Through Concrete; ASTM International: West Conshohocken, PA, USA, 2002. [Google Scholar]
- Grömping, U. Relative importance for linear regression in R: The package relaimpo. J. Stat. Softw. 2006, 17, 1–27. [Google Scholar] [CrossRef]
- Liu, S.; Li, Q.; Xie, G.; Li, L.; Xiao, H. Effect of grinding time on the particle characteristics of glass powder. Powder Technol. 2016, 295, 133–141. [Google Scholar] [CrossRef]
- British Glass Glass Recycling. Available online: http://www.gpi.org/recycling/glass-recycling-facts (accessed on 25 January 2019).
- OECD Climate Change Mitigation Policies. Available online: http://www.compareyourcountry.org/climate-policies?cr=oecd{\&}lg=en{\&}page=2{\&}visited=1 (accessed on 28 July 2018).
- Hammond, G.P.; Jones, C.I. Embodied energy and carbon in construction materials. Proc. Inst. Civ. Eng. Energy 2008, 161, 87–98. [Google Scholar] [CrossRef] [Green Version]
- Bontempi, E. A new approach for evaluating the sustainability of raw materials substitution based on embodied energy and the CO2 footprint. J. Clean. Prod. 2017, 162, 162–169. [Google Scholar] [CrossRef]
- Kim, J.; Yi, C.; Zi, G. Waste glass sludge as a partial cement replacement in mortar. Constr. Build. Mater. 2015, 75, 242–246. [Google Scholar] [CrossRef]
- Schackow, A.; Stringari, D.; Senff, L.; Correia, S.L.; Segadães, A.M. Influence of fired clay brick waste additions on the durability of mortars. Cem. Concr. Compos. 2015, 62, 82–89. [Google Scholar] [CrossRef]
- Idir, R.; Cyr, M.; Tagnit-Hamou, A. Use of fine glass as ASR inhibitor in glass aggregate mortars. Constr. Build. Mater. 2010, 24, 1309–1312. [Google Scholar] [CrossRef]
- Lu, J.-X.; Zhan, B.-J.; Duan, Z.-H.; Poon, C.S. Improving the performance of architectural mortar containing 100% recycled glass aggregates by using SCMs. Constr. Build. Mater. 2017, 153, 975–985. [Google Scholar] [CrossRef]
- Letelier, V.; Tarela, E.; Osses, R.; Cárdenas, J.P.; Moriconi, G. Mechanical properties of concrete with recycled aggregates and waste glass. Struct. Concr. 2017, 18, 40–53. [Google Scholar] [CrossRef]
Figure 1.
XRD analysis of the Glass powder (GP) used in this study.

Figure 2.
Scanning electron microscopy (SEM) analysis of the glass powder.

Figure 3.
Energy dispersive spectroscopy (EDS) analysis of the glass powder.
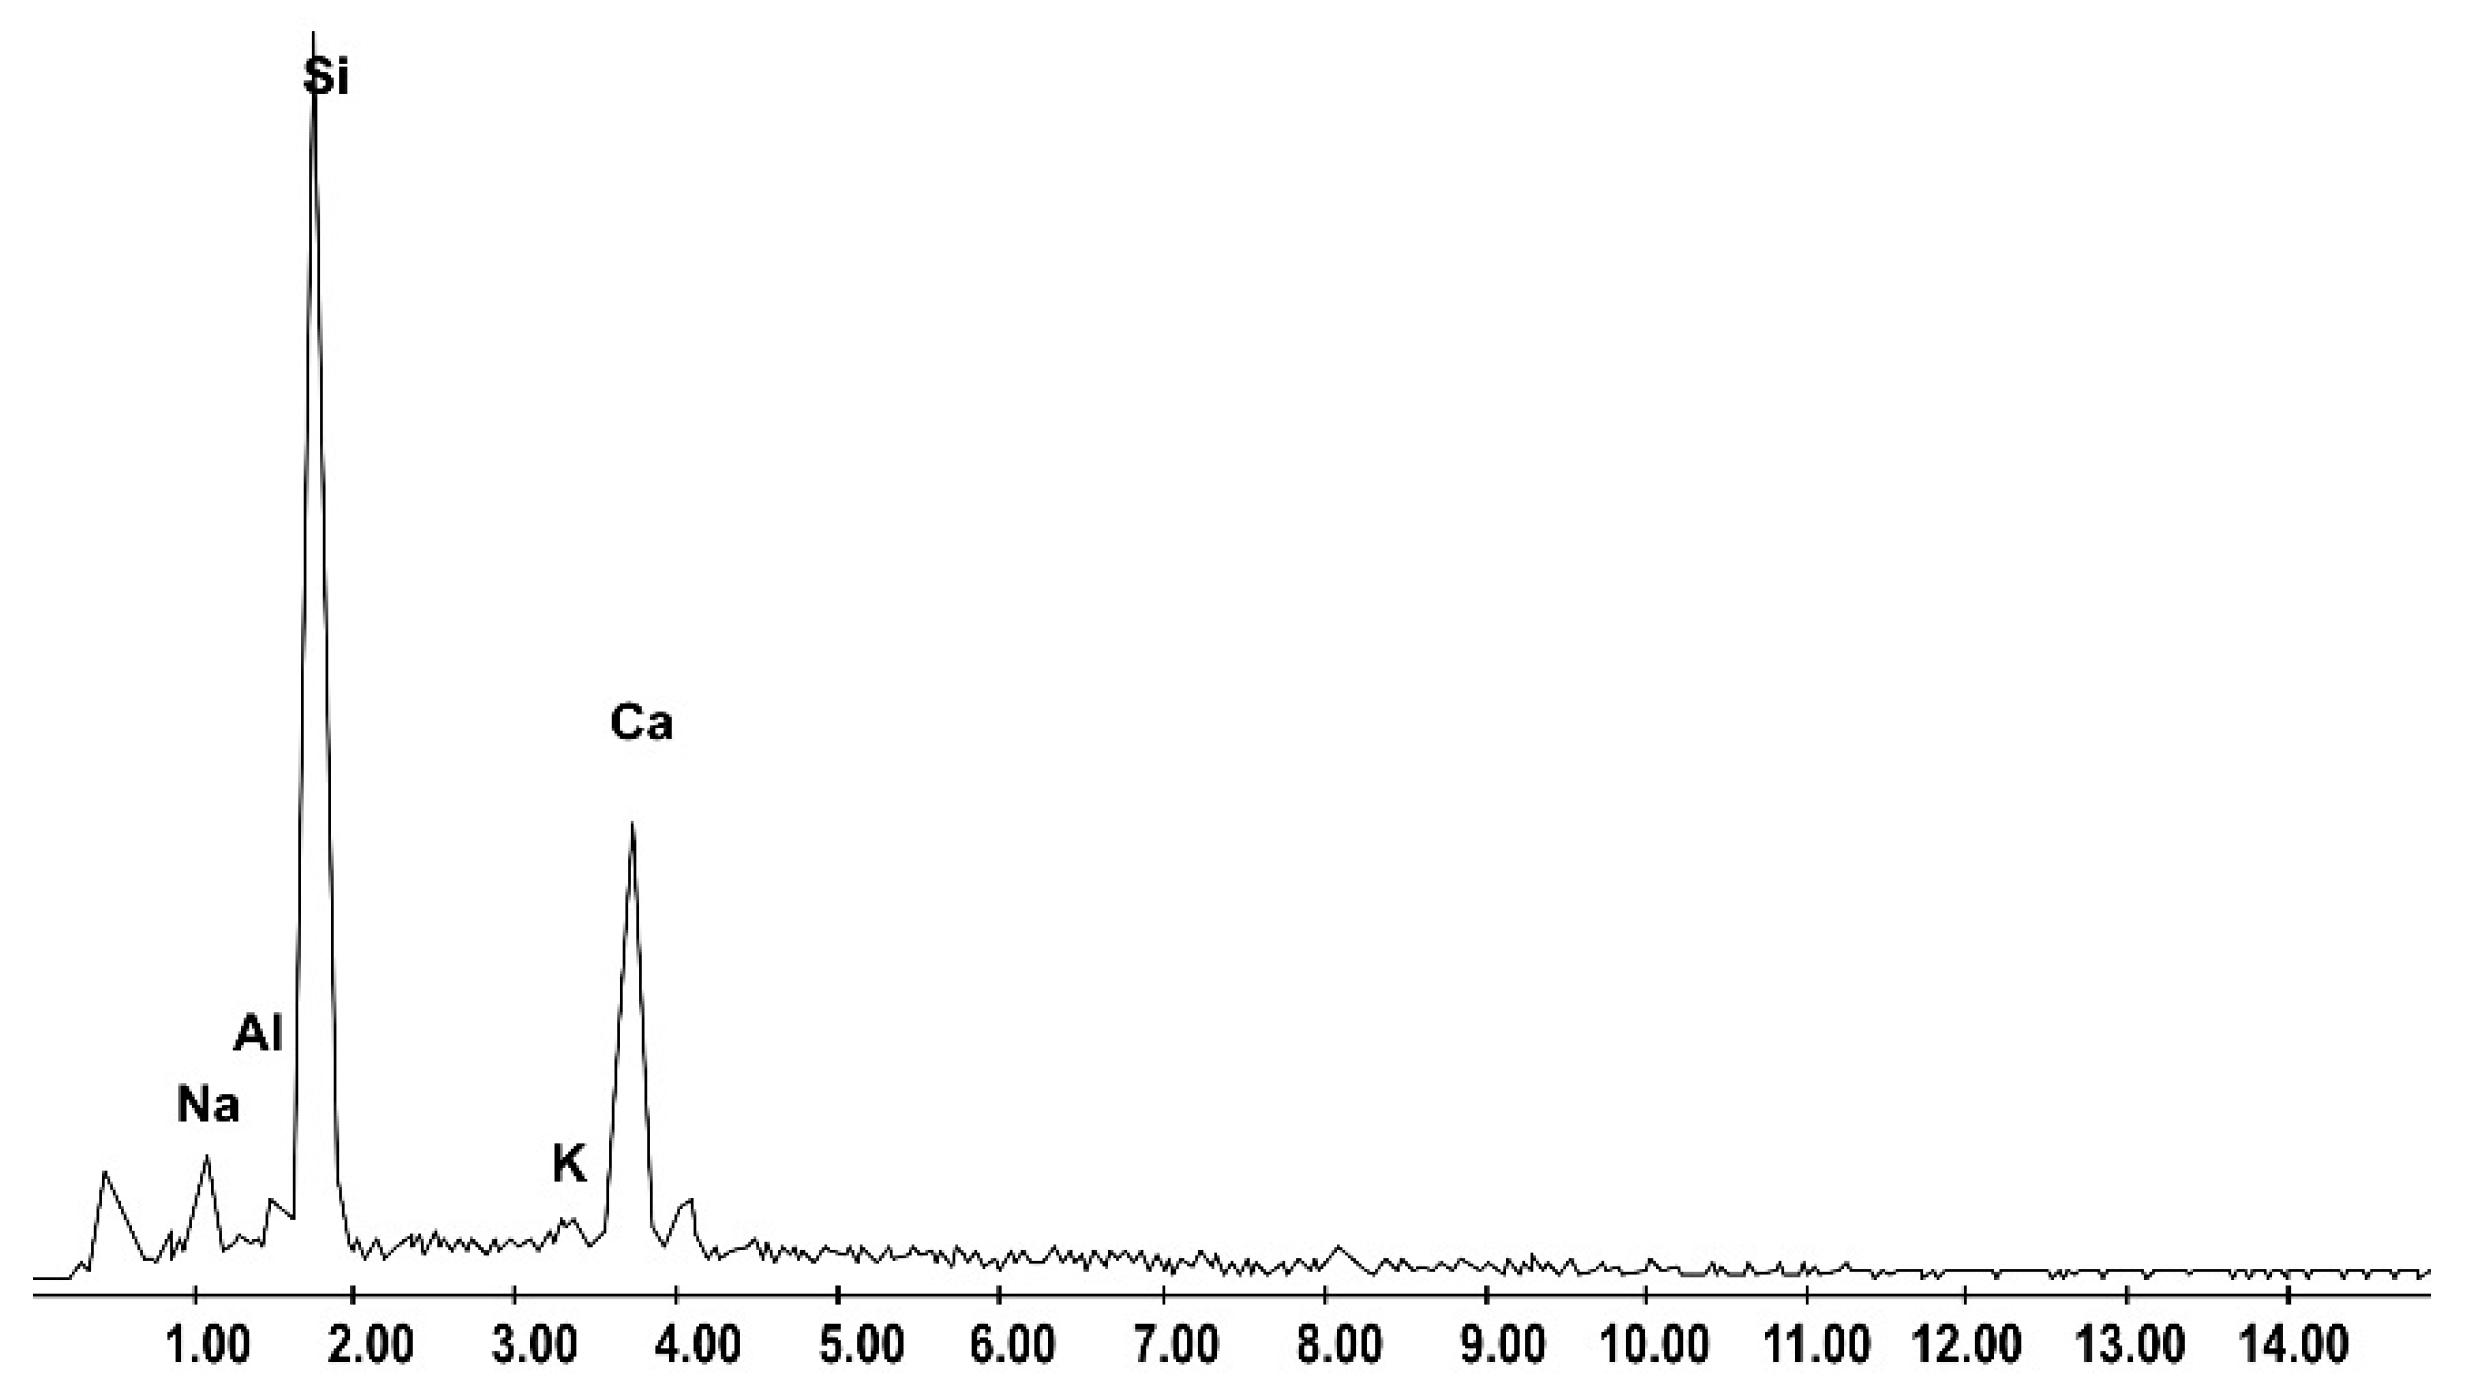
Figure 4.
Absorption, porosity, and density results.

Figure 5.
Capillarity results for mortar samples.

Figure 6.
(a) Results of compressive strength. (b) Results of flexural strength.

Figure 7.
Ultrasonic pulse test results.
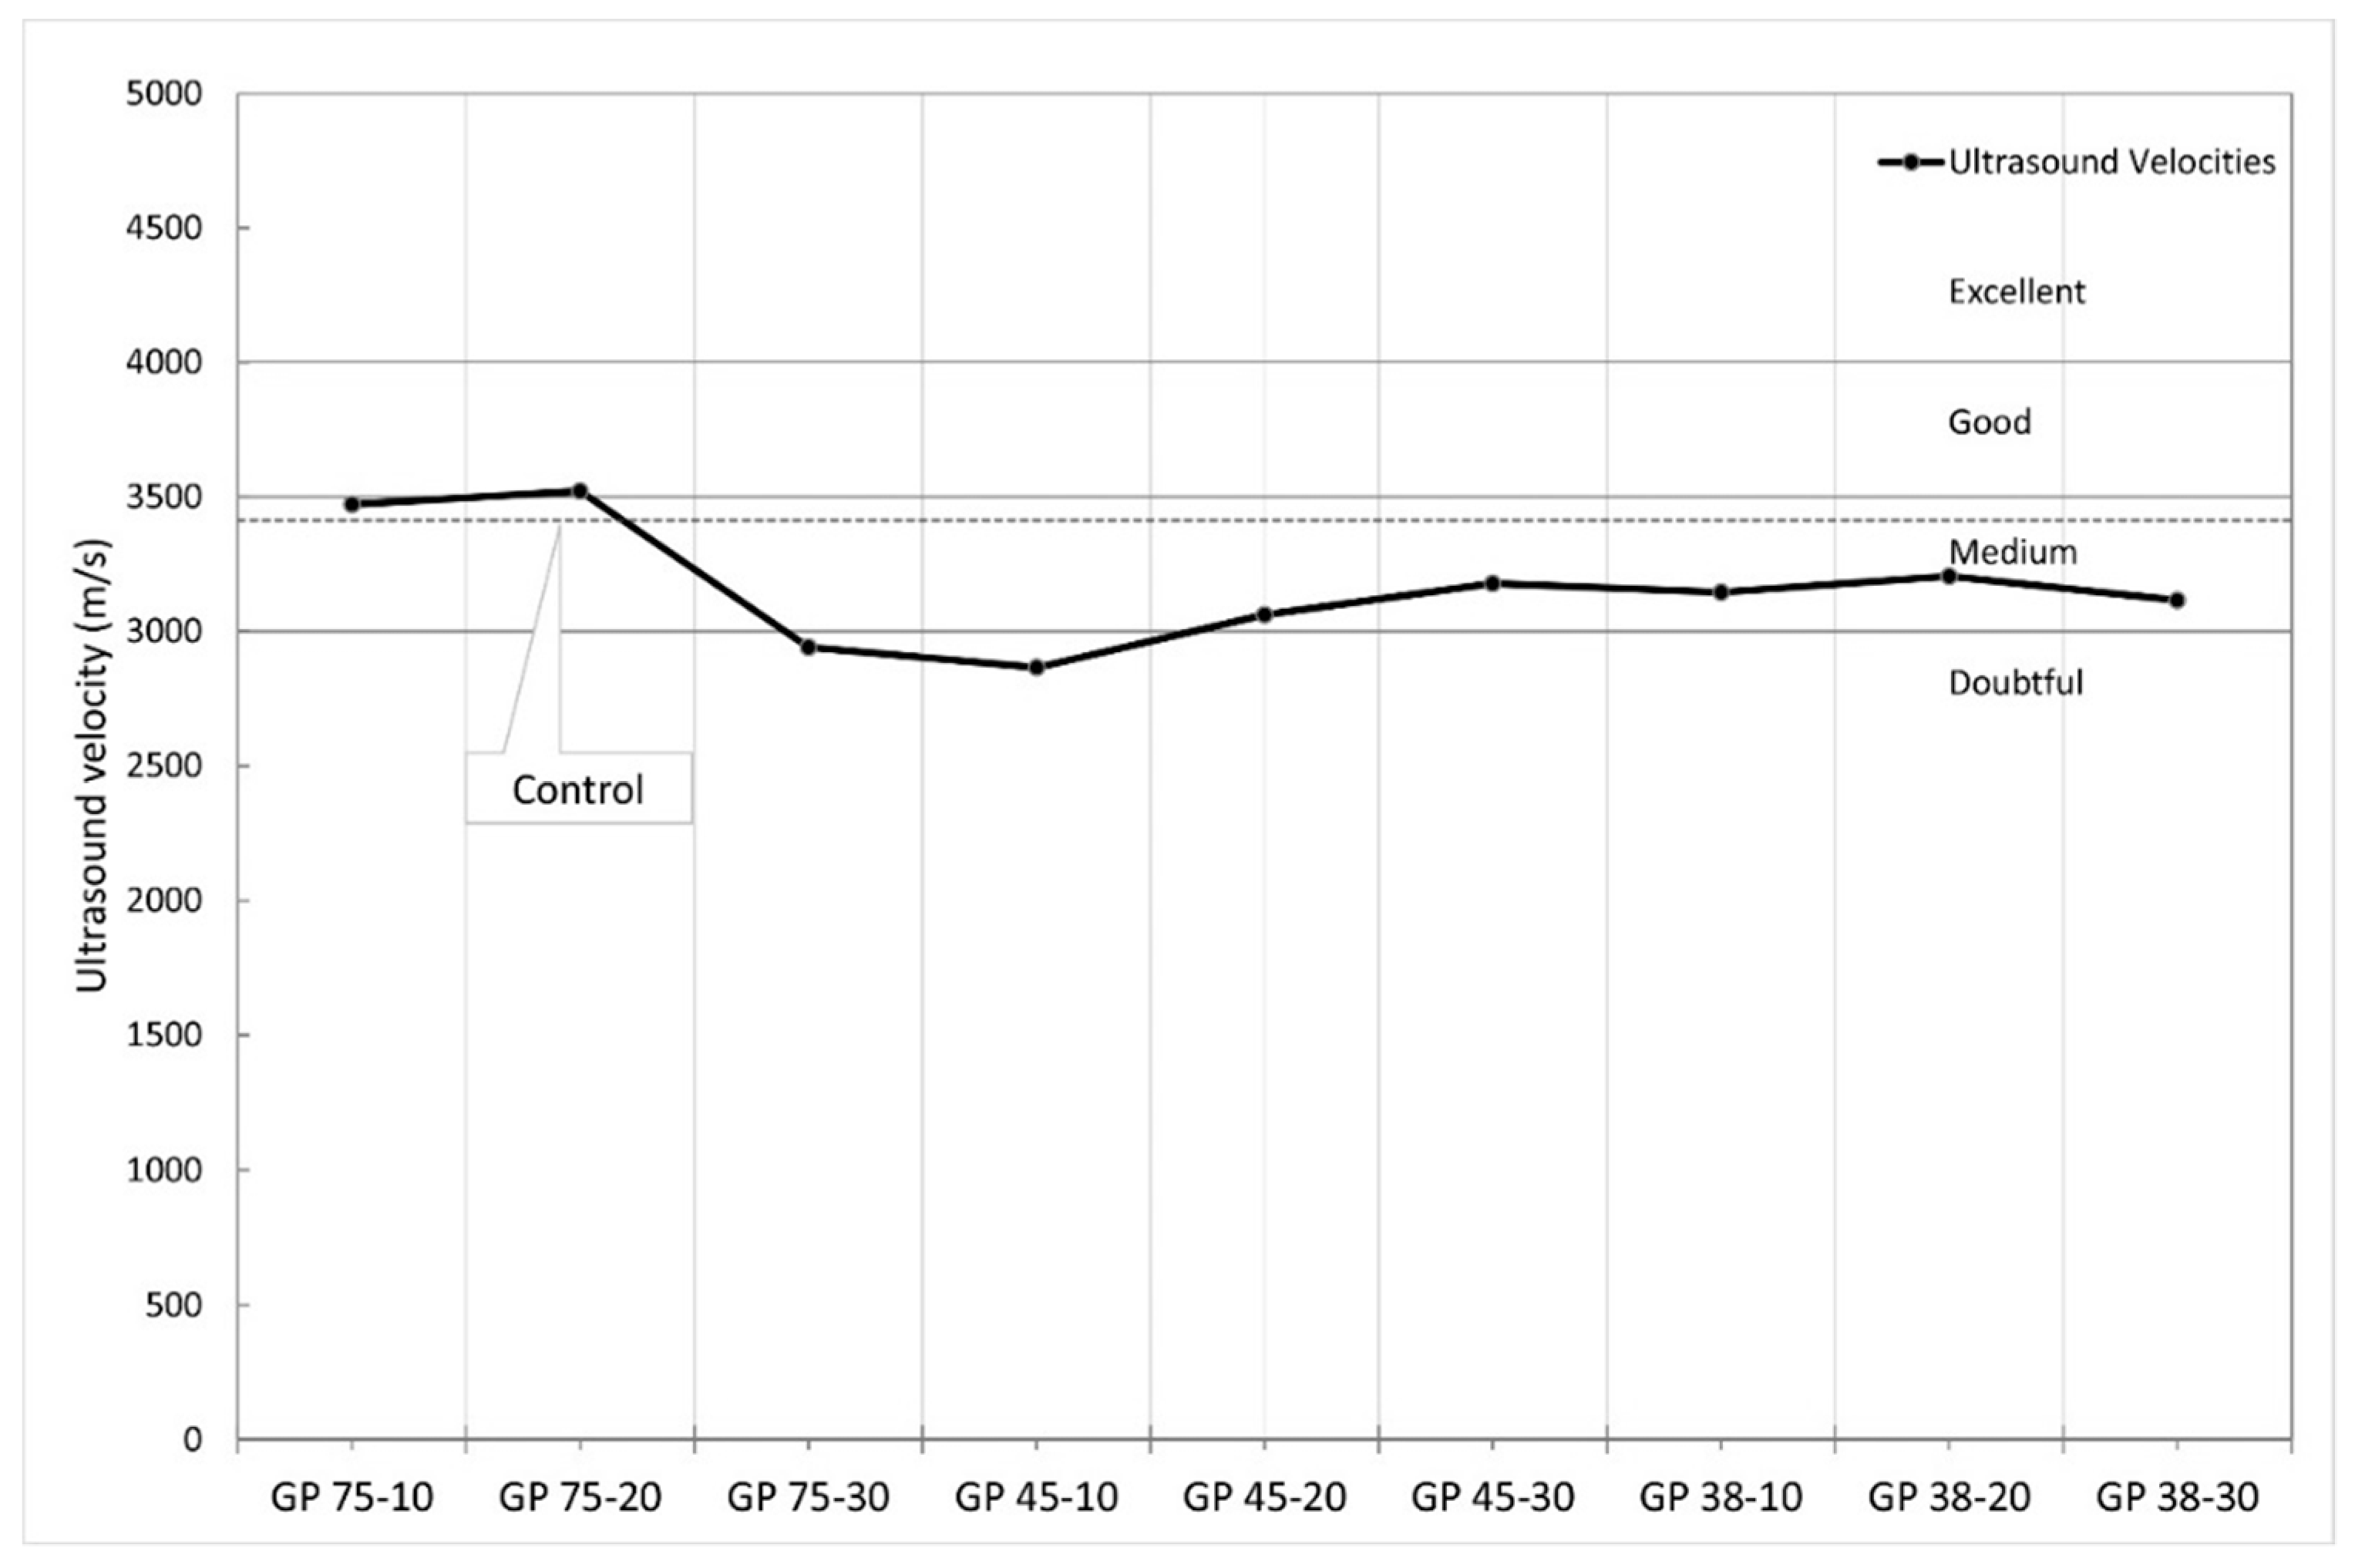
Figure 8.
Embodied CO2 analysis.


Table 1.
Chemical properties of cement and Glass powder (GP).
| Composition | Cement (%) | GP (%) |
|---|---|---|
| SiO2 | 38.06 | 64.32 |
| Al2O3 | 8.88 | 2.90 |
| CaO | 40.92 | 18.18 |
| Fe2O3 | 2.83 | - |
| SO3 | 2.33 | - |
| MgO | 1.59 | - |
| Na2O | 1.75 | 13.03 |
| K2O | 1.62 | 1.53 |
Table 2.
Mortar mixture proportions.
| Water (g) | Cement (g) | GP 75 μm (g) | GP 45 μm (g) | GP 38 μm (g) | Sand (g) | Consistency (mm) | |
|---|---|---|---|---|---|---|---|
| CM | 270 | 450 | - | - | - | 1350 | 163.3 |
| GP 75-10 | 270 | 405 | 45 | - | - | 1350 | 165.2 |
| GP 75-20 | 270 | 360 | 90 | - | - | 1350 | 156.5 |
| GP 75-30 | 270 | 315 | 135 | - | - | 1350 | 148.6 |
| GP 45-10 | 270 | 405 | - | 45 | - | 1350 | 170.3 |
| GP 45-20 | 270 | 360 | - | 90 | - | 1350 | 166.2 |
| GP 45-30 | 270 | 315 | - | 135 | - | 1350 | 161.9 |
| GP 38-10 | 270 | 405 | - | - | 45 | 1350 | 175.3 |
| GP 38-20 | 270 | 360 | - | - | 90 | 1350 | 168.9 |
| GP 38-30 | 270 | 315 | - | - | 135 | 1350 | 161.9 |
Table 3.
Variation coefficients of mechanical properties at different ages.
| Flexural Strength | Compressive Strength | |||||||
|---|---|---|---|---|---|---|---|---|
| 7 Days | 14 Days | 28 Days | 90 Days | 7 Days | 14 Days | 28 Days | 90 Days | |
| GP 75-10 | 0.11 | 0.03 | 0.04 | 0.09 | 0.03 | 0.03 | 0.04 | 0.07 |
| GP 75-20 | 0.05 | 0.04 | 0.04 | 0.07 | 0.02 | 0.05 | 0.05 | 0.04 |
| GP 75-30 | 0.01 | 0.06 | 0.05 | 0.11 | 0.02 | 0.05 | 0.05 | 0.05 |
| GP 45-10 | 0.03 | 0.09 | 0.03 | 0.08 | 0.03 | 0.12 | 0.05 | 0.08 |
| GP 45-20 | 0.07 | 0.10 | 0.04 | 0.08 | 0.05 | 0.04 | 0.04 | 0.07 |
| GP 45-30 | 0.01 | 0.05 | 0.11 | 0.06 | 0.03 | 0.04 | 0.02 | 0.03 |
| GP 38-10 | 0.09 | 0.05 | 0.05 | 0.05 | 0.03 | 0.05 | 0.06 | 0.09 |
| GP 38-20 | 0.14 | 0.01 | 0.10 | 0.00 | 0.04 | 0.02 | 0.06 | 0.01 |
| GP 38-30 | 0.07 | 0.07 | 0.12 | 0.07 | 0.03 | 0.05 | 0.04 | 0.05 |
| CM | 0.03 | 0.09 | 0.07 | 0.02 | 0.04 | 0.03 | 0.05 | 0.03 |
Table 4.
Variation coefficients and mean values of durability properties at 28 days.
| Capillarity | Density | Absorption | Porosity | |||||
|---|---|---|---|---|---|---|---|---|
| μ (10−4cm/s0.5) | c.v. | μ (kg/cm3) | c.v. | μ (%) | c.v. | μ (%) | c.v. | |
| GP 75-10 | 8.84 | 0.08 | 2.11 | 0.02 | 4.70 | 0.06 | 9.89 | 0.03 |
| GP 75-20 | 7.81 | 0.16 | 2.08 | 0.01 | 4.98 | 0.06 | 10.67 | 0.05 |
| GP 75-30 | 11.81 | 0.18 | 2.08 | 0.01 | 4.96 | 0.11 | 11.16 | 0.05 |
| GP 45-10 | 7.37 | 0.04 | 2.13 | 0.01 | 4.19 | 0.05 | 8.91 | 0.04 |
| GP 45-20 | 8.10 | 0.04 | 2.12 | 0.02 | 4.61 | 0.05 | 9.68 | 0.04 |
| GP 45-30 | 9.05 | 0.11 | 2.10 | 0.01 | 3.90 | 0.04 | 8.24 | 0.04 |
| GP 38-10 | 6.86 | 0.24 | 2.14 | 0.02 | 3.63 | 0.03 | 7.87 | 0.02 |
| GP 38-20 | 7.58 | 0.02 | 2.13 | 0.02 | 4.06 | 0.08 | 8.75 | 0.07 |
| GP 38-30 | 7.24 | 0.08 | 2.12 | 0.01 | 3.92 | 0.02 | 8.97 | 0.12 |
| CM | 6.52 | 0.06 | 2.15 | 0.02 | 4.16 | 0.18 | 8.93 | 0.16 |
Table 5.
Analysis of Variance results for 28 days of curing.
| R2 | Factor | Df | Sum Sq | Mean Sq | F Value | Pr(>F) | Sig.Codes | Share | |
|---|---|---|---|---|---|---|---|---|---|
| Compressive strength | 0.96 | GP% | 2 | 100.17 | 50.08 | 45.87 | 4.06 × 10⁻⁷ | *** | 26% |
| GPSIZE | 2 | 61.34 | 30.67 | 28.09 | 8.48 × 10⁻⁶ | *** | 16% | ||
| GP%:GPSIZE | 4 | 205.34 | 51.33 | 47.01 | 2.59 × 10⁻⁸ | *** | 54% | ||
| Residuals | 15 | 16.38 | 1.09 | ||||||
| Flexural strength | 0.81 | GP% | 2 | 4.108 | 2.0539 | 21.639 | 1.63 × 10⁻⁵ | 45% | |
| GPSIZE | 2 | 0.921 | 0.4606 | 4.853 | 0.02062 | . | 10% | ||
| GP%:GPSIZE | 4 | 2.357 | 0.5892 | 6.208 | 0.00254 | ** | 26% | ||
| Residuals | 18 | 1.708 | 0.0949 | ||||||
| Ultrasound | 0.30 | GP% | 2 | 63925 | 31963 | 0.425 | 0.66 | . | 3% |
| GPSIZE | 2 | 156570 | 78285 | 1.041 | 0.373 | 8% | |||
| GP%:GPSIZE | 4 | 354530 | 88632 | 1.179 | 0.353 | 18% | |||
| Residuals | 18 | 1353022 | 75168 | ||||||
| Capillarity | 0.77 | GP% | 2 | 1.04 × 10⁻¹¹ | 5.18 × 10⁻¹² | 4.365 | 0.0473 | *** | 22% |
| GPSIZE | 2 | 1.54 × 10⁻¹¹ | 7.69 × 10⁻¹² | 6.48 | 0.0181 | *** | 33% | ||
| GP%:GPSIZE | 4 | 1.02 × 10⁻¹¹ | 2.54 × 10⁻¹² | 2.141 | 0.1576 | *** | 22% | ||
| Residuals | 9 | 1.07 × 10⁻¹¹ | 1.19 × 10⁻¹² | ||||||
| Density | 0.35 | GP% | 2 | 0.00389 | 0.00194 | 1.899 | 0.1785 | 14% | |
| GPSIZE | 2 | 0.00573 | 0.00286 | 2.799 | 0.0874 | . | 20% | ||
| GP%:GPSIZE | 4 | 0.00045 | 0.00011 | 0.11 | 0.9775 | 2% | |||
| Residuals | 18 | 0.01842 | 0.00102 | ||||||
| Porosity | 0.83 | GP% | 2 | 2.18 | 1.09 | 3.107 | 0.085182 | . | 9% |
| GPSIZE | 2 | 13.958 | 6.979 | 19.893 | 0.000222 | *** | 60% | ||
| GP%:GPSIZE | 4 | 3.225 | 0.806 | 2.298 | 0.124027 | 14% | |||
| Residuals | 11 | 3.859 | 0.351 | ||||||
| Absorption | 0.80 | GP% | 2 | 0.332 | 0.1658 | 1.773 | 0.211593 | 6% | |
| GPSIZE | 2 | 3.771 | 1.8853 | 20.151 | 0.000146 | *** | 68% | ||
| GP%:GPSIZE | 4 | 0.357 | 0.0891 | 0.953 | 0.467557 | 6% | |||
| Residuals | 12 | 1.123 | 0.0936 |
Signif. codes: 0 ***, 0.001 **, 0.05 . ; GP% means percentage of GP replacement, GPSIZE is the size of the GP particles and the interaction between the variables is represented by GP%: GPSIZE.
Table 6.
Analysis of Variance results for 90 days of curing.
| R2 | Factor | Df | Sum Sq | Mean Sq | F Value | Pr(>F) | Sig.Codes | Share | |
|---|---|---|---|---|---|---|---|---|---|
| Compressive strength | 0.98 | GP% | 2 | 374.6 | 187.28 | 148.34 | 6.55 × 10⁻¹² | *** | 30% |
| GPSIZE | 2 | 398.7 | 199.34 | 157.9 | 3.86 × 10⁻¹² | *** | 32% | ||
| GP%: GPSIZE | 4 | 434.9 | 108.73 | 86.12 | 1.75 × 10⁻¹¹ | *** | 35% | ||
| Residuals | 18 | 22.7 | 1.26 | ||||||
| Flexural strength | 0.92 | GP% | 2 | 13.727 | 6.864 | 48.18 | 5.93 × 10⁻⁸ | 44% | |
| GPSIZE | 2 | 8.75 | 4.375 | 30.71 | 1.58 × 10⁻⁶ | . | 28% | ||
| GP%: GPSIZE | 4 | 6.335 | 1.584 | 11.12 | 0.000101 | ** | 20% | ||
| Residuals | 18 | 2.564 | 0.142 |
Signif. codes: 0 ***, 0.001 **, 0.05 . ; GP% means percentage of GP replacement, GPSIZE is the size of the GP particles and the interaction between the variables is represented by GP%: GPSIZE.
Table 7.
Correlation between studied properties.
| F28 | F90 | C28 | C90 | Por28 | Por90 | Abs28 | Abs90 | US28 | |
|---|---|---|---|---|---|---|---|---|---|
| F28 | 1.00 | ||||||||
| F90 | 0.59 | 1.00 | |||||||
| C28 | 0.80 | 0.39 | 1.00 | ||||||
| C90 | 0.87 | 0.74 | 0.74 | 1.00 | |||||
| Por28 | −0.24 | −0.47 | −0.07 | −0.52 | 1.00 | ||||
| Por90 | −0.05 | −0.30 | −0.17 | −0.23 | 0.26 | 1.00 | |||
| Abs28 | −0.10 | −0.40 | −0.08 | −0.45 | 0.96 | 0.37 | 1.00 | ||
| Abs90 | −0.14 | −0.35 | −0.24 | −0.30 | 0.24 | 0.99 | 0.34 | 1.00 | |
| US28 | −0.17 | 0.03 | −0.32 | −0.17 | 0.30 | −0.08 | 0.35 | −0.09 | 1.00 |
F28 and F90 = Flexural strength at 28 days and 90 days. C28 and C90 = Compressive strength at 28 and 90 days. Por28 and Por90 = Porosity at 28 and 90 days. Abs 28 and Abs90 = Absorption at 28 and 90 days. US28 = Ultrasound velocity at 28 days.
Table 8.
CO2 associated with GP grinding time.
| GP Size (μm) | Time (hrs) | Consumption (kWh/ton) | Norway (kgCO2/ton) | Chile (kgCO2/ton) | South Africa (kgCO2/ton) | OECD (kgCO2/ton) |
|---|---|---|---|---|---|---|
| 38.1 | 2.54 | 38.09 | 0.30 | 18.36 | 35.27 | 16.46 |
| 44.5 | 2.16 | 32.47 | 0.26 | 15.65 | 30.06 | 14.03 |
| 73.7 | 1.11 | 16.66 | 0.13 | 8.03 | 15.43 | 7.20 |
| Cement (kgCO2/ton) | 830 |
Table 9.
SUB-RAW index.
| GP Size (μm) | Norway | Chile | South Africa | OECD |
|---|---|---|---|---|
| 38.1 | 2.48 | 1.59 | 1.45 | 1.61 |
| 44.5 | 2.55 | 1.66 | 1.52 | 1.68 |
| 73.7 | 2.84 | 1.95 | 1.81 | 1.97 |
© 2019 by the authors. Licensee MDPI, Basel, Switzerland. This article is an open access article distributed under the terms and conditions of the Creative Commons Attribution (CC BY) license (http://creativecommons.org/licenses/by/4.0/).
Share and Cite
MDPI and ACS Style
Letelier, V.; Henríquez-Jara, B.I.; Manosalva, M.; Parodi, C.; Ortega, J.M. Use of Waste Glass as A Replacement for Raw Materials in Mortars with a Lower Environmental Impact. Energies 2019, 12, 1974. https://doi.org/10.3390/en12101974
AMA Style
Letelier V, Henríquez-Jara BI, Manosalva M, Parodi C, Ortega JM. Use of Waste Glass as A Replacement for Raw Materials in Mortars with a Lower Environmental Impact. Energies. 2019; 12(10):1974. https://doi.org/10.3390/en12101974
Chicago/Turabian StyleLetelier, Viviana, Bastián I. Henríquez-Jara, Miguel Manosalva, Camila Parodi, and José Marcos Ortega. 2019. "Use of Waste Glass as A Replacement for Raw Materials in Mortars with a Lower Environmental Impact" Energies 12, no. 10: 1974. https://doi.org/10.3390/en12101974
Note that from the first issue of 2016, this journal uses article numbers instead of page numbers. See further details here.