Article

A Case Study on the Electricity Generation Using a Micro Gas Turbine Fuelled by Biogas from a Sewage Treatment Plant

1
Graduate Institute of Environmental Engineering, National Taiwan University, Taipei 106, Taiwan
2
Institute of Environmental Technology, Vietnam Academy of Science and Technology, Hanoi 1000000, Vietnam
3
Department of Chemical Engineering, National Taiwan University, Taipei 106, Taiwan
4
Department of Chemical Engineering and Biotechnology, National Taipei University of Technology, Taipei 106, Taiwan
5
Department of Occupational Safety and Health, China Medical University, Taichung 404, Taiwan
6
Department of Environmental Engineering, National I-Lan University, Yi-Lan 260, Taiwan
7
Huimin Environmental Tech Corporation, Taipei 105, Taiwan
8
Sewerage Systems Office, Public Works Department, Taipei City Government, Taipei 10376, Taiwan
*
Author to whom correspondence should be addressed.
Energies 2019, 12(12), 2424; https://doi.org/10.3390/en12122424
Submission received: 21 May 2019 / Revised: 15 June 2019 / Accepted: 21 June 2019 / Published: 24 June 2019
(This article belongs to the Section F: Electrical Engineering)

Abstract

:
Combined heat and power production from biogas is now playing an important role in energy and resource utilization as well as pollution control in waste water treatment. This research used biogas from the Bali Sewage Treatment Plant in New Taipei City, Taiwan, as a major source of fuel for the electricity generation. A micro gas turbine electricity generator, Capstone CR-30, which possesses a maximum rated power load (PWL) of 30 kW, was equipped to convert biogas into electricity. The biogas is mainly composed of CH4 (56.1 ± 8.0 vol.%), CO2 (25.5 ± 9.8 vol.%), H2 (0.5 vol.%), and H2S (0.99 ± 0.07 ppmv). During the test operation period of the generator, it was found that the thermal efficiency increases from 19.8% to 23.4% kWhe/kWhth, while the electricity generation efficiency (ηEB) also rises from 0.93 to 1.09 kWhe/m3 biogas as the PWL increases from 10 kW to 30 kW. The results indicated that the generator has a better performance with higher PWL. At PWL = 30 kW, the average adjusted concentrations of CO and NOx (adjusted to 15 vol.% O2) emitted from the generator are 86 ppmv and 17 ppmv, respectively. Both are much lower than the emission standards of stationary sources in Taiwan of 2000 ppmv and 150 ppmv, respectively. Thus, PWL of 30 kW was selected in cooperation with biogas inflow = 0.412 m3/min and air/fuel ratio (i.e., air/biogas ratio) = 76.0 vol./vol. for the long-term regular operation. At the above setting conditions for long-term operation, the generator continuously consumed the biogas and provided stable electricity generation at a rate of 19.64 kWhe/h for a 2-year running period. Moreover, the greenhouse gas can be cut off with a rate of 10.78 kg CO2e/h when using biogas as fuel for electricity generation. Overall, this research proves that the application of a micro gas turbine electricity generator not only has promising performance for using biogas but also gives a significant reduction of greenhouse gas emission, which fits the concepts of the circular economy and environmental protection.

1. Introduction

Biogas is a kind of biofuel, mainly produced from sewage treatment plants, landfills, and livestock farms through the anaerobic digestion (AD) [1,2,3,4]. As a result of the AD process by a consortium of microorganisms in the absence of oxygen, biogas produced is primarily composed of CH4 and CO2. Other components are H2, hydrogen sulfide (H2S), ammonia (NH3), CO, and volatile organic compounds (VOCs), dust, and occasionally siloxanes [5,6,7,8,9]. For example: Chen et al. [5], Gao et al. [6], and Huertas et al. [7] reported that volume fractions of CH4 and CO2 in biogas from different conditions are approximately in the range of 35–80 vol.% and 15–55 vol.%, respectively. The volume fraction of H2S is about 0.1–0.8 vol.% [7].
Although CH4 is good combustible gas, it is also a kind of greenhouse gas (GHG). According to the global warming potential value, the greenhouse effect of CH4 per 100 years is 34 times that of CO2 [10]. If the biogas can be utilized properly, not only the intensification of the greenhouse effect can be slowed down, but the biogas can also be substituted for fossil fuels. Combustion of the biogas can releases heat energy or converted to electricity using internal combustion engines, resulting in a high calorific value of 17–25 MJ/m3 [1,2,3].
Combined heat and power (CHP) production, using biogas from small-scale anaerobic digestion, has emerged as a profitable match, especially in wastewater plants [11]. The biogas is generally infused into two typical types of electricity generators, e.g., internal combustion engines and gas turbines, to generate electricity. While biogas has narrower flammability limits than natural gas or methane, internal combustion engines show decreased thermal efficiency by a delayed combustion in the presence of a high CO2 concentration [3]. Micro gas turbines are small, high-speed, gas combustion turbines with power output ranging from 30 kW to over 200 kW [12]. The electrical efficiency of micro gas turbines was more stable, while the electrical efficiency decreased only 0.4% for a 60% methane concentration compared to typical natural gas [13]. A study on thermodynamic assessment of integrated biogas-based micro-power generation system showed that gas turbine cycle is more efficient in terms of utilization of recovered exergy than organic Rankine cycle [14]. The air pollutant emission and maintenance requirements of micro gas turbines would be lower than these from internal combustion engines [15]. The small CHP system using a 5-MW gas turbines with and without combined cycle system may have economic benefits while it also shows a strong dependence on heat sales [16].
Although previous studies have shown the promising results for using micro gas turbines fueled with biogas, a long-term optimization operation in a sewage treatment plant has been rarely reported in the literature. Thus, this study focussed on the application of the micro gas turbine and practically operated it in a sewage treatment plant for 2 years running. Effects of key parameters on the system performance were elucidated. These include rated power load (PWL), actual power generated (PWA), volumetric flow rate of input biogas containing CH4, CO2, air, and other gases (QBG), and air-fuel ratio in volume/volume (i.e., ratio of input air to input feed fuel of biogas (AFRV). Thermal efficiency of thermal energy to electricity (ηT), electricity generation efficiency from biogas (ηEB), air pollution emissions in exhausted gas, and GHG reduction were examined. The long-term operation of a micro gas turbine system fueled with biogas and its energy saving and environmental benefits were also discussed.

2. Experimental Methods

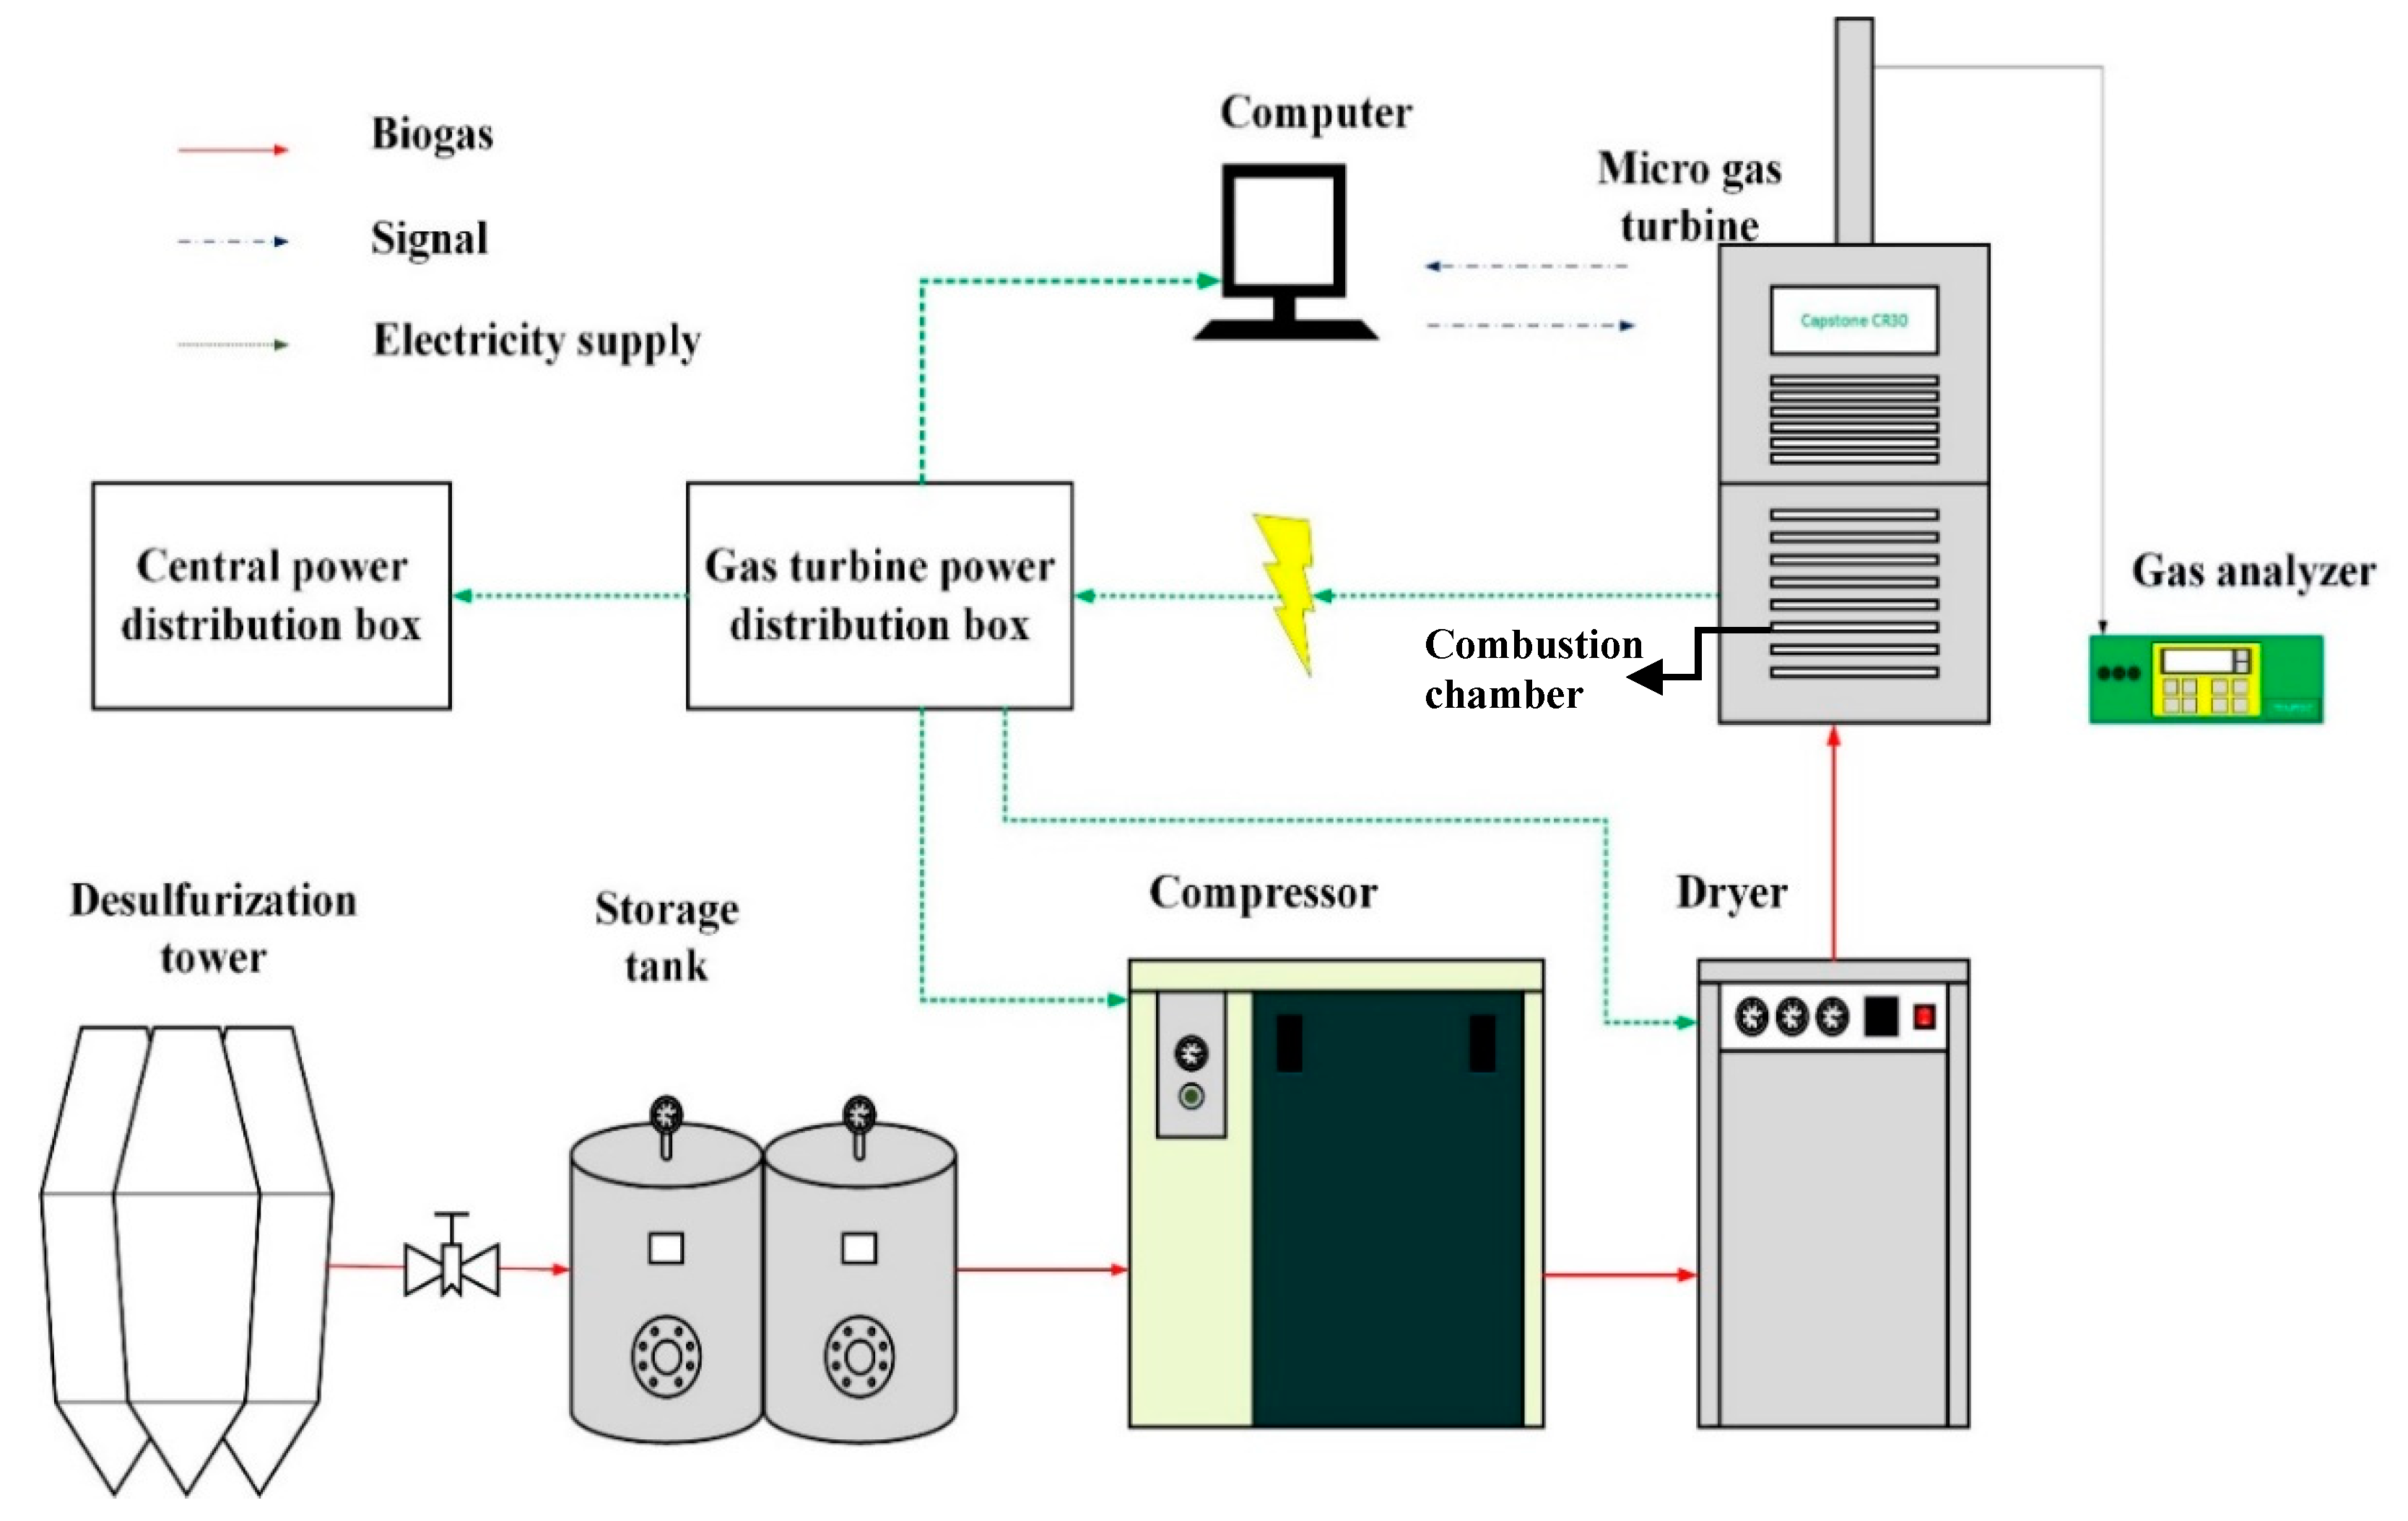
2.1. Brief Description of the Main Subsystems and Processes of Target Sewage Treatment Plant

Bali Sewage Treatment Plant (called Bali Plant) was chosen as the target wastewater treatment plant studied. The plant was located in New Taipei City, Taiwan, established in 1994, while it was commissioned in 1997 [17]. The average daily wastewater treatment capacity is 1,320,000 m3/d [18]. The source of wastewater is mainly from the metropolitan area in the north of Taiwan, where Tamshui river flows by.
The plant treats wastewater with the primary treatment. Large particles and impurities in wastewater, which cannot be decomposed, are firstly removed through the trash rack. The flow then pasts through an aerated grit chamber which eliminates the sand particles. Finally, the sludge is separated from the treated wastewater by gravity in a primary sedimentation tank [18].
The sludge from the primary sedimentation tank is subsequently sent to the sludge concentrating tank to reduce its water content and transferred to egg-shaped CSTR for further treatment. In this stage, anaerobic digestion AD takes place to decompose the organic matters in the sludge and generate biogas. The produced biogas is then desulfurized and purified. In the current situation, about 25.82 vol.% purified biogas is used as fuel for boilers and dual-fuel electricity generators. The heat energy of high-temperature combusted gas exhausted from the boiler is recovered for the use in the egg-shaped digesters and the desulfurization tower. On the other hand, the electricity generated from the dual-fuel electricity generator is used as basic power consumption in the plant. The remaining un-used biogas of about 74.18 vol.% is sent to the flare tower and burned for safety [18].
After AD, the digested sludge is discharged from the egg-shape digesters for dewatering and then compressed into sludge cakes which can be easily transported for landfill. As for the wastewater after AD, part of it is recovered for use in the plant, while the rest is discharged into the ocean after adding sodium hypochlorite to destroy the microorganisms.

2.2. Materials and Methods

The feed biogas of the micro gas turbine electricity generator is essentially composed of CH4, H2S, H2, and CO2. Figure 1 shows the complete path of how biogas is transformed into electricity. It includes desulfurization, drying, compression, combustion, and electricity generation.
The micro gas turbine electricity generator used in this study is Model CR-30 from Capstone Turbine Co. (CTC, Los Angeles, CA, USA). The maximal rated power load PWL is 30 kW. The micro gas turbine (width of 0.76 m, depth of 1.5 m, and height of 1.8 m) mainly consists of a compressor, a combustion chamber, and a turbine. As air enters the turbine, it is compressed into a high-pressure gas (379–414 kPa gauge) through a compressor and then mixed with the fuel and combusted in the combustion chamber. The high-temperature (~275 °C) with a flow rate of 0.31 kg/s formed subsequently pushes and rotates the turbine for doing the shaft work. The mechanical energy is then utilized for maintaining the operation of the compressor and also for generating the electricity. More details of CR-30 can be found in CTC [19].
The micro gas turbine electricity generator was tested in different setups of PWL, required volumetric flow rate of input biogas QBG, and air-fuel ratio in volume/volume AFRV. The corresponding thermal efficiencies ηT and electricity generation efficiency ηEB were then obtained and assessed for the experimental testing operation. Further, the emissions of exhausted gas were immediately detected by a gas analyzer and collected in gas bags for further analysis. After short-term optimization experiments of micro gas turbine electricity generator, the long-term regular operation was conducted for a 2-year running.

2.3. Analyses of Emissions

The analytical methods and instruments are described as follows. The on-site exhaust emission analysis was conducted by a continuous gas detector (flue gas analyzer, Tempest 100, Telegan Gas Monitoring Ltd., Abingdon, Oxfordshire, UK). The detected species were CO, NO, NO2, SO2, CO2, and O2.
CH4 and H2 were measured by two gas chromatograph-flame ion detectors (Agilent 6890 Chemstation, Hewlett Packard, Wilmington, DE, USA; 5890 Series II, Hewlett Packard, Wilmington, DE, USA) and two Taiwanese meteorological chromatographs (China Chromatography Personal 1000, China Chromatography Co., Taipei, Taiwan). The volumes were measured at 25 °C and 1 atm unless otherwise specified.

2.4. Thermal Efficiency, Electricity Generation Efficiency and Thermal NOx

Energy efficiency indicators for power plant have been proposed in previous studies [20,21]. In this study, energy efficiency measure is defined as actual energy output divided by energy output that consumers are actually requiring in terms of an end use service [20]. Therefore, thermal efficiency ηT was calculated by the actual output electricity (Ee,o) divided by input thermal energy (Eth,i) as presented in Equation (1). The Ee,o already subtracts the energy loss of CR-30 micro gas turbine electricity generator during electricity generation. The Eth,i of biogas is computed by Equation (2), where CCH4, QBG, and HL,CH4 stand for the volume concentration of CH4 (vol.%), the volume flow rate of biogas (m3/d), and the low heating value of biogas in terms of CH4 (39.83 MJ/m3), respectively.
ηT (Thermal efficiency) = Ee,o/Eth,i,
Eth,i = CCH4 × QBG × HL,CH4,
The electricity generation efficiency from biogas (ηEB, kWhe/m3 bigas) is defined as Ee,o divided by the volume of input biogas in this study shown in Equation (3).
ηEB (Electricity generation efficiency from biogas) = Ee,o/VBG,
Ratio of air to fuel (AFR) is a significant parameter for the micro gas turbine electricity generator. The theoretical AFR to carry out complete combustion of fuel [22] can be derived by the reaction of biogas combustion shown in reaction (R1), where x and y stand for the moles of CO2 and air in biogas when 1 mole CH4 is assumed. The first three items in reaction (R1) are the components of biogas (input biogas = CH4 + xCO2 + y(O2 + (79/21) N2), so the stoichiometric input air (2 − y) × (O2 + (79/21) N2) is making up the oxygen for complete oxidation of methane. The difference between 2 mole air for complete oxidation of 1 mole methane and y mole air in biogas is regarded as insufficient air ((2 − y) × (O2 + (79/21) N2)) which needs to be externally supplied. Note that xCO2 does not participate the combustion reaction of CH4, it is included in both sides of reaction (R1) to indicate its presence before and after the reaction, affecting the concentrations of reactants and products. In fact, CO2 is one of the main components of biogas which exhibits an average concentration of 25.5 vol.% in the long-term analysis. After the combustion of biogas in the gas turbine electricity generator, because of oxidation of methane, more CO2 is then generated and appears in the product gas. The net oxidation reaction of CH4 is CH4 + yO2 + (2 − y)O2 → CO2 +2H2O.
CH4 + xCO2 + y(O2 + (79/21)N2) + (2 − y)(O2 + (79/21)N2) → (1 + x)CO2 + 2H2O + 2(79/21)N2,
The AFR may be considered in terms of mass/mass ratio (AFRM) and vol./vol. ratio (AFRV), respectively. These are: AFRM = ratio of input air to feed fuel of biogas containing air and other gases in mass /mass, AFRV = ratio of input air to feed fuel of biogas containing air and other gases in vol./vol. Via reaction (R1), the make-up stoichiometric AFRM (AFRMS) and stoichiometric AFRV (AFRVS) for 1 mole CH4 are obtained as Equations (4) and (5), respectively. Notice that for 1 mole CH4, insufficient oxygen is made up by (2 − y) mole air.
AFRMS = (2 − y) × 28.8/(16 + 44x + 28.8y),
AFRVS = (2 − y)/(1 + x + y),
The actual AFR (AFRMA and AFRVA) are yet presented as Equations (6) and (7) with z as the moles of the actual additive air substituting for (2 − y) in reaction (R1).
AFRMA = z × 28.8/(16 + 44x + 28.8y),
AFRVA = z/(1 + x + y),
Assuming CH4 is completely oxidized in the generator, the excessive amount of oxygen for biogas combustion is then calculated by oxygen from the actual additive air subtracting that from make-up stoichiometrically required air. Consequently, z moles actual air supply deducting (2 − y) moles make-up stoichiometric air required gives the excessive oxygen presented as 0.21(z − (2 − y)) moles. This excessive oxygen subsequently participates into nitrogen oxidation reaction (R2). Thus, the maximal formation of thermal NOx (NO2) is obtained with 0.21(z − (2 − y)) moles.
0.5 × 0.21(z − (2 − y))N2 + 0.21(z − (2 − y)) O2 → 0.21(z − (2 − y)) NO2,
Because the stoichiometric coefficient ratio is proportional to the volume ratio regarding each gas species as an ideal gas, the volume ratio of CH4 to excessive air (VCH4/EA), volume flow rate of excessive air (QEA), and maximal volume flow rate of thermal NO2 (QNO2) are obtained by the following equations, respectively.
VCH4/EA = 1:(z − (2 − y)),
QEA = (z − (2 − y)) × QCH4 = (z − (2 − y)) × CCH4 × QBG,
QNO2 = 0.21QEA,
In Equation (9), QCH4 is the volume flow rate of CH4 in input biogas.
The volume ratios of CH4:CO2:air in input biogas encountered in test operation were 42.3%:28.9%:28.9% as shown in Table 1. This then gives 1:x:y = 1:0.6832:0.6836. By substituting x and y into Equation (7) with AFRVA = 76 which was measured during the operation, z = 179.88 is then obtained. Further, values of VCH4/EA, QEA, and QNO2 with the available x, y, and z can be subsequently estimated.

3. Results and Discussion

3.1. Characteristics of Biogas of Bali Sewage Treatment Plant

Table 1 shows the composition of biogas in the Bali Plant. The biogas produced by the egg-shaped digesters of the Bali Plant was de-sulfurized by a desulfurization tower. The data from 2 June 2015 to 31 May 2016 without micro gas turbine electricity generator were gathered by Huimin Environment Tech Co. (HETC), the agency in charge of plant operation, illustrating that the de-sulfurized biogas contains CH4 of 28.9~67.5 vol.% (56.1 ± 8.0 vol.%), CO2 of 2.5~42.0 vol.% (25.5 ± 9.8 vol.%), hydrogen of 0.5 vol.%, and hydrogen sulfide of 0.5~1 ppmv (0.99 ± 0.07 ppmv) [23]. The biogas after desulfurization tower exhibited a variation. During the test operation from 31 May 2016 to 30 June 2016 incorporation with micro gas turbine electricity generator, the contents of biogas measured indicated methane of 42.3 vol.%, CO2 of 28.9 vol.%, and air of 28.9 vol.%. The air content was the balance value.
The daily production of biogas from the Bali Plant is about 4424 m3/d. Currently, however, roughly 3281 m3/d biogas is directly combusted in flare without any energy utilization indicating that about 74.2 vol.% of the biogas has been wasted. The remaining 25.8 vol.% biogas is used as a fuel supply for boilers and dual-fuel electricity generators [18].

3.2. Performance Evaluation of Micro Gas Turbine Electricity Generator Using Biogas during Test Operation

3.2.1. Output Power Generated and Thermal Efficiency

Table 2 shows the variations of actual power generated PWA, thermal efficiency ηT, and electricity generation efficiency from biogas ηEB with QBG and AFRV under the different settings of the rated power load PWL, for the test operation. The actual methane concentration of the biogas after desulfurization was 42.3 vol.%. The relationship between ηT and PWL is further shown in Figure 2. It reveals that the higher the PWL is, the higher the ηT and ηEB can reach. The required QBG also increases along with rising PWL as more biogas (methane) is in demand for higher energy output. Overall, the best conditions of test operation are then decided at the maximal setup of PWL = 30 kW, QBG = 0.412 m3/min, and AFRV = 76.0 vol./vol. because of the highest ηT (23.4% kWhe/kWhth) and ηEB (1.09 kWhe/m3). Notice that the actual power generated PWA is slightly lower than that of rated power load PWL set. Also note that the PWL of 30 kW is the limitation of the CR-30 micro gas turbine electricity generator employed in this study. When the generator with higher PWL is used, it will offer a higher efficiency.
Under the above said best conditions, the electricity generator had continuously combusted about 593.28 m3/d of the biogas and converted it to electricity. This electricity was subsequently applied in the plant for basic power consumption. Although the maximal PWL of the micro gas turbine electricity generator was set up at 30 kW, the actual power generated PWA of this setting was roughly 27 kW. Assuming that the PWA all stemmed from the combustion of methane in biogas, Eth,i at the best conditions of Table 2 is calculated by Equation (2) with CCH4= 42.3 vol.%, QBG = 0.412 m3/min, and HL,CH4 = 39.83 MJ/m3. Hence, Eth,i is 6.93 MJ/min (=115.59 kWhth/h).
Via Equations (1) and (2), the thermal efficiency ηT and the electricity generation efficiency from biogas ηEB at the best conditions of Table 2 are then obtained with the values of 23.4% kWhe/kWhth and 1.09 kWhe/m3 biogas. However, the values of ηT and ηEB are subject to the temperature of the surroundings as the temperature affects the combustion efficiency of the generator. The effect of ambient temperature on PWA and ηT have been noted by CTC [19]. The results indicated that ηT gradually decreases along with increasing temperature. PWA (at PWL = 30 kW) maintains at 30 kW until ambient temperature reaches 19 °C, but starts to decrease above 19 °C. The testing of the generator was carried out in the spring and summer periods in Taiwan. The average ambient temperature was around 25 °C, and the maximum thermal efficiency ηT of 23.4% kWhe/kWhth with PWA of 27 kW in Table 2 of this study are close to the corresponding values of 24.5 kWhe/kWhth and 27.5 kW based on the performance of nominal PWA and ηT from CTC [19].

3.2.2. AFR Ratios

The composition of biogas shown in Table 1 determines the volume ratio of CH4, CO2, and air of the biogas (=1:x:y = 0.4226:0.2885:0.2889 (precise values) = 1:0.6832:0.6836), deducing that AFRMS and AFRVS are 0.58 kg/kg and 0.56 vol.%/vol.%, respectively, based on Equations (4) and (5). The actual air-fuel volume ratio AFRVA applied in the generator at PWL = 30 kW was over 76.0 vol.%/vol.% (as shown in Table 2) indicating that a considerable excess of the required air was provided for the combustion. Excessive air can enhance the combustion efficiency (reduce the concentration of CO). In fact, for the consideration of design, the abundant air is mainly used to cool down the generator’s engine.

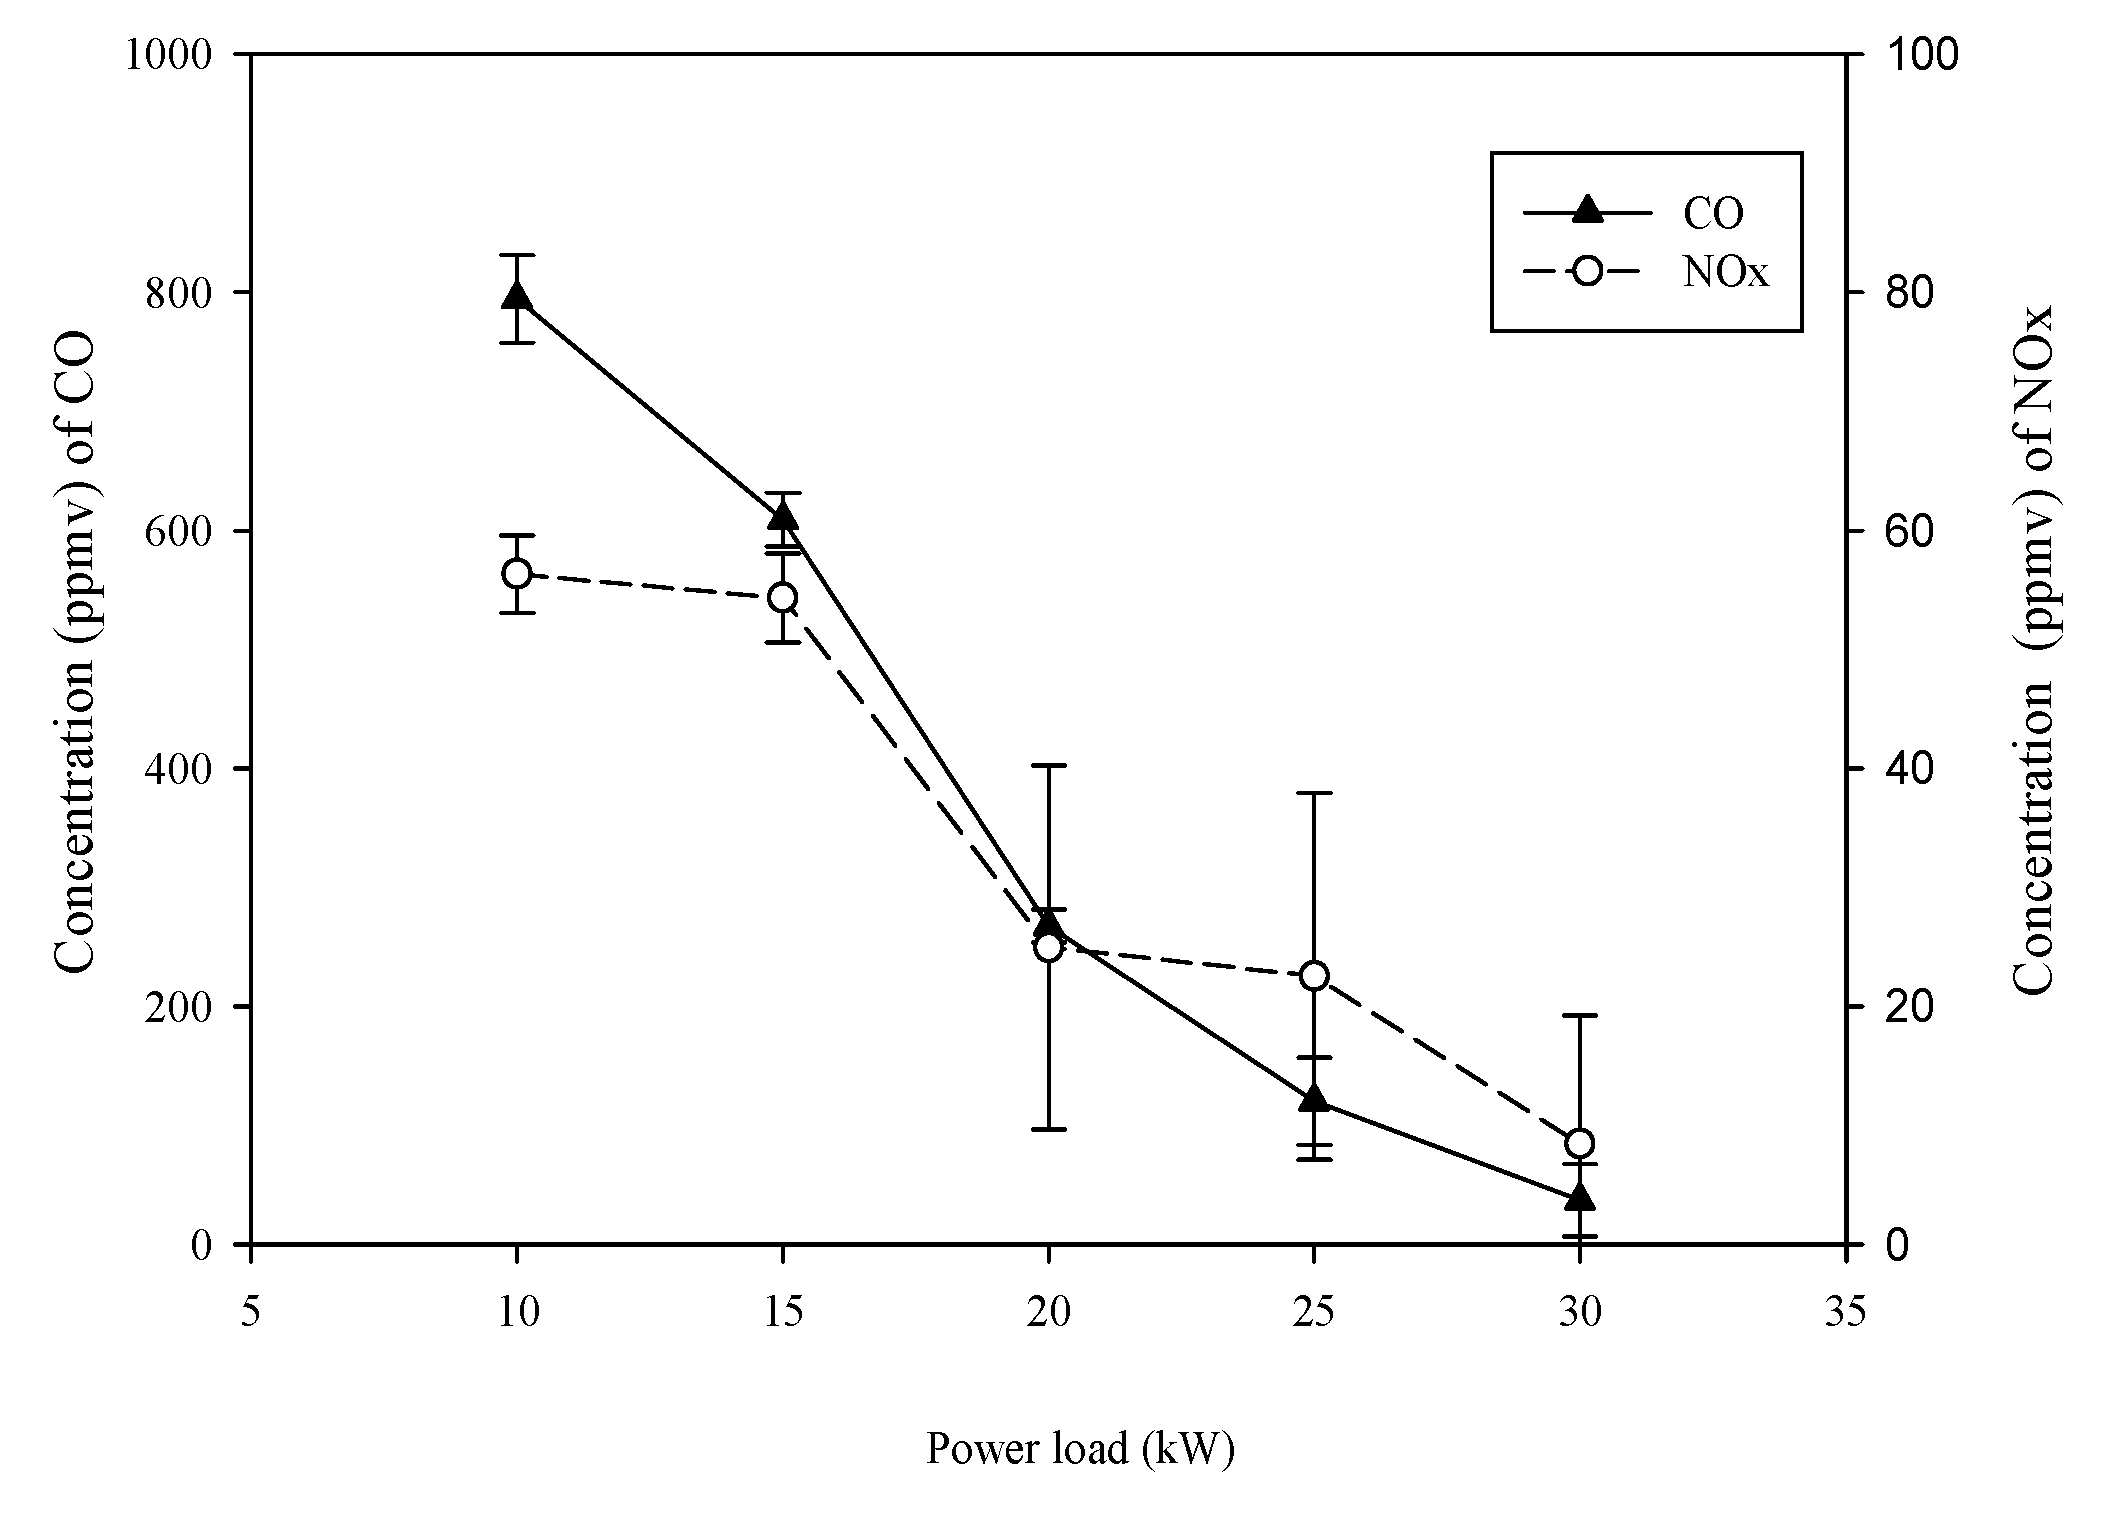
3.2.3. Air Pollutant Emissions

The main air pollutants emitted by biogas combustion after desulfurization are CO, CO2, and NOx. Figure 3 illustrates the variations of un-adjusted emission concentrations of CO and NOx with PWL. It indicated the concentrations decrease along with increasing PWL. At PWL = 30 kW, the average un-adjusted emission concentrations of CO and NOx are as low as 37.1 ppmv and 7.6 ppmv, respectively. The corresponding un-adjusted CO2 and O2 emission concentrations are shown in Figure 4 with respectively average values of about 1.38 vol.% and 18.49 vol.% at 30 kW. The variations of CO2 and O2 with PWL are very small because a high AFRVA of 76.0 vol.%/vol.% was applied in the micro gas turbine electricity generator.
To estimate the maximal thermal NOx, the combustion temperature is firstly assumed to exceed the generation temperature of NOx, and its emission is based on the mechanism (R2). The excessive oxygen combined with nitrogen can generate harmful gas NOx (thermal NOx). Assuming that CH4 is completely reacted with enough oxygen in the air, the maximal NOx emission potential (expressed as NO2) is 736.7 kg/h (NO2 at 25 °C and 1 atm, 1 mole = 24.5 L = 46.01 g) computed as follows. z of 179.88 is calculated by Equation (7) with AFRVA = 76 and (1 + x + y) = (1 + 0.6832 + 0.6836). QCH4 is known as 10.45 m3/h (=QBG × CCH4 = 0.412 m3/min × 60 min/h × 42.3 vol.%), so the excessive air flow rate QEA is then calculated by Equation (9) (=(z − (2 − y)) × 10.45 m3/h = (179.88 − (2 − 0.6836)) × 10.45 m3/h = 1865.95 m3/h). Finally, via Equation (10), a maximal NO2 formation rate QNO2 of 391.85 m3/h (=0.21 × QEA = 391.85 m3/h) is obtained. By multiplying the density at 25 °C and 1 atm of ideal gas NO2 ((46.01 g/mole)/24.5 L/mole = 1.88 kg/m3) with QNO2, the maximal mass flow rate of emitted thermal NO2 (FM,NO2) is then deduced as 736.7 kg/h.
Referring to the adjusted concentrations of the exhaust gas (with oxygen content adjustment) in Table 3, the actual NOx emission rate is about 0.040 kg/h, which is much lower than the maximal thermal NOx emission rate obtained from the above estimation. This suggests that the operating temperature is lower than the thermal NOx generating temperature. Thus, the inhalation of excess air has little influence on the formation of NOx. In addition, the concentrations of CO and other inorganic gases during discharge of exhaust gas are low by the use of excess air, which is a great advantage of the feature of micro gas turbine electricity generator.
Table 3 also indicates that high PWL can give a reduction of CO and NOx concentrations in the exhaust. For PWL above 15 kW, the adjusted CO and NOx concentrations are all below the emission standards of stationary sources of 2000 ppmv and 150 ppmv, respectively [22]. The adjusted NOx concentration further meets the air pollutant emission standard of 40 ppmv for gas turbine units and combined cycle units of existing electricity generation facility of pollution sources as PWL is set as high as 30 kW [24]. At a full load of 30 kW, the average adjusted CO, NOx, and CO2 emission concentrations are 85.68 ppmv, 17.45 ppmv, and 3.22 vol.%, respectively. At the best condition of PWL = 30 kW, the generator not only emits the lowest CO and NOx but also has the highest thermal efficiency. Because of the low exhaust of pollutants, the micro gas turbine electricity generator is suitable for the application of biogas for power generation.

3.2.4. Combustion Efficiency

The combustion efficiency (CE) of micro gas turbine electricity generator is close to 0.99 at its full load of 30 kW, as shown in Figure 5, indicating nearly complete combustion. The CE increases with increasing PWL. Notice that the raw biogas contains about 28.9 vol.% CO2. A large portion of the CO2 emission is from the CO2 originally contained in the input raw biogas itself, and the rest is from the combustion emission of methane.

3.3. Long-term Regular Operation of Micro Gas Turbine Electricity Generator Using Biogas and Its Energy Saving and Environmental Benefits

After the installation and short-term optimization experiments of micro gas turbine electricity generator, the long-term regular operation began on 1 June 2016. Referring the results of previous testing run, the operating conditions were set as follows: rated power load PWL = 30 kW, flow rate of input biogas QBG = 0.412 m3/min, and actual air-fuel ratio AFRVA (vol./vol.) = 76.03. Table 4 presents the performance results of the micro gas turbine electricity generator from 1 June 2016 to 31 December 2018. Currently, the generator is still being operated in good condition. As shown in Table 4, the generator consumed 322,061 m3 biogas in 17,853 h. After deducting the external electricity used at start-up, a total output of electricity of 350,548 kWhe was generated. The hourly electricity generation rate was about 19.64 kWhe/h, while the electricity generation efficiency from biogas çEB was 1.09 kWhe/m3 biogas.
Based on these findings, the emission of CO2 of a CR-30 gas turbine electricity generator fuelled by biogas containing 42.3 vol.% CH4 and 28.9 vol.% CO2 was about 1.17 kg CO2e/kWhe for the combustion of total biogas. The biogas consumption and net electricity generation were 24.72 m3/h and 27 kWhe/h, respectively. Note that emission factors of GHG (FEE) of power generation in Taiwan were about 0.530–0.554 kg CO2e/kWhe of 2016–2017 for a mixed fuel usage of coal, oil, gas, nuclear, and renewables [25], while global FEE of coal-fired, oil-fired, and gas-turbine open cycle electricity generations were about 0.785–0.985, 0.540–0.785, and 0.415–0.560 kg CO2e/kWhe, respectively [26]. The average FEE of Taiwan is lower than those of coal-fired and oil-fired power plants, while slightly higher than that of gas-turbine open cycle electricity generation. Biogas has a higher carbon emission rate (amount of carbon emitted per unit of energy) than fossil fuels. However, bioenergy is counted as zero-carbon inside the Emissions Trading System and national greenhouse gas emission data worldwide. Taking into account the zero-carbon property, the yearly net electricity generation of a CR-30 gas turbine electricity generator was approximately 172,003 kWhe/y, while the annual greenhouse gas reduction was 94,451 kg CO2e/y in Taiwan (shown in Table 4). On the other hand, converting CH4 into CO2 significantly lessens the impact of global warming because the global warming potential of CH4 is over 34 times higher than CO2 according to IPCC AR5 [10]. Hence, the benefits of energy gain and greenhouse gas reduction are significant taking advantage of using biogas via the micro gas turbine electricity generator.

3.4. Comparison of Performances for Cases with Varied to Those with Constant Biogas Flow Rates and Methane Concentrations

Notice that the biogas intake and the concentration of methane were actually not controlled at fixed values for the long-term regular operation (1 June 2016~31 December 2018, denoted as Case A) regarding the data in Table 4. Its performance is thus compared to those with constant biogas flow rate at the conditions set in test operation in 31 May 2016~30 June 2016 at PWL = 30 kW (noted as Case B) (Table 2), as well as with constant methane concentration taking the average value in 2 June 2015 to 31 May 2016 reported by HETC [23] (called Case C) (Table 1).
As noted in Section 3.1, about 4423 m3/d of de-sulfurized biogas was produced in the Bali Plant, of which 1142 m3/d (25.82%) was utilized in the plant. The residual biogas of 3281 m3/d can be used for electricity generation. For Case B operating a CR-30 at PWL = 30 kW, QBG = 0.412 m3/min (=24.72 m3/h = 593 m3/d), AFRVA = 76.0 vol./vol., and ηEB =1.09 kWhe/m3 (Table 2), it can generate electricity at a rate of 647 kWhe/d (=593 m3/d ×1.09 kWhe/m3). In order to treat the excess biogas of 3281 m3/d, six CR-30s are required (=3281/593 = 5.53 ≈ 6). However, the average biogas intake per hour recorded by the plant in the long-term regular operation period (Case A) was 18.04 m3/h (= 433 m3/d) (Table 4), which is lower than the constant biogas intake of 24.72 m3/h (593 m3/d) employed in the test operation (Case B). This elucidates that eight CR-30s (=3281/433 = 7.58 ≈ 8) are in demand for the treatment of biogas in practical situations (Case A). The low average biogas flow rate of the long-term regular operation (Case A) leads to lower average daily net electricity generation, with the value of 471 kWhe/d (Table 4), than that of test operation (Case B), with an estimated value of 647 kWhe/d.
The electricity generation ability of biogas is dependent on its contents of energy matters, mainly methane. Data of 2 June 2015 to 31 May 2016 in Table 1 reported by HETC [23] (Case C) illustrate that the biogas of Bali Plant majorly contains 56.1 vol.% CH4, 25.5 vol.% CO2, and 18.4 vol.% O2, with negligible H2 of 0.5 vol.% and H2S of 1.0 ppmv. In accordance with constant CCH4 (56.14 vol.%, using the average value), QBG (taking 433 m3/d as that for Case A in Table 4), and HL,CH4 (39.83 MJ/m3), Equation (2) deduces that the methane in biogas can produce 9682 MJ/d (=433 m3/d × 0.5614 × 39.83 MJ/m3) after complete combustion. Using the thermal efficiency of CR-30 at PWL = 30 kW (23.4% kWhe/kWhth) calculated from test operation, the output electricity is thus obtained with a high value of 629 kWhe/d (=9682 MJ/d × 1 kWhth/3.6 MJ × 0.234 kWhe/kWhth). As the methane concentration of biogas intake was not stable during the operation of the plant, the average daily net electricity generation (471 kWhe/d for Case A in Table 4) recorded from the long-term regular operation was lower than that from the calculation (629 kWhe/d for Case C) based on constant methane concentration (56.1 vol.%, using mean value).
The comparison suggests that the parameters of biogas intake flow rate and methane concentration play an essential role in biogas electricity generation during the operation of the micro gas turbine generator. More methane entering the generator results in a lower AFR, then more energy can be produced, resulting in higher values of ηT and ηEB.

4. Conclusions

In this study, the micro gas turbine electricity generator fuelled by biogas from digesters in Bali Sewage Treatment Plant (denoted as Bali Plant) (New Taipei City, Taiwan) has been examined for the optimization and long-term 2-year running performance assessment. The results indicate that the thermal efficiency ηT and electricity generation efficiency from biogas ηEB increase with increasing rated power load PWL and flow rate of input biogas QBG. As PWL increases, the concentrations of the exhaust of CO and NOx decrease, while those of CO2 and O2 show only slight variations. The appropriate operation conditions of the 30 kW micro gas turbine employed were identified. Estimation of thermal NOx was low. The performance of the micro gas turbine is limited by its designed maximal PWL, indicating a micro gas turbine of proper large scale, say with 200 kW, would further enhance the performance, especially allowing for large QBG.
Some specific results are remarked as follows. The optimized operation conditions of the generator are: PWL = 30 kW, QBG = 0.412 m3/min, and actual air-fuel volume ratio AFRVA = 76.0 vol./vol. At these conditions, ηT and ηEB can be as high as 23.4% kWhe/kWhth and 1.09 kWhe/m3 biogas, respectively, while the actual power generated PWA is 27 kW. Biogas from digesters in Bali STP has a composition with CH4 of 56.1 ± 8.0 vol.%, CO2 of 25.5 ± 9.8 vol.%, H2 of 0.5 vol.%, and H2S of 0.99 ± 0.07 ppmv. About 4423 m3/d of de-sulfurized biogas was produced in the Bali Plant, of which 1142 m3/d (25.82%) was utilized in the plant. The residual biogas of 3281 m3/d can be used for electricity generation. The average daily biogas intake of one CR-30 MGT electricity generator is 433 m3/d, and thus 8 CR-30s are required for using the available biogas produced from Bali Plant. The average annual net electricity generation of one CR-30 MGT electricity generator is approximately 172,003 kWhe/y, while the annual average greenhouse gas reduction is 94,451 kg CO2e/y.
Results of long-term regular operations showed that biogas intake flow rate and methane concentration play an essential role in biogas electricity generation by a micro gas turbine generator. The power system performance can be further improved by introducing an additional heat recovery system as an integrated combined heat and power (CHP) system. The mass and energy balances of CHP system require extensive and long-term regular tests for utilizing biogas as fuel.

Author Contributions

C.-C.C., C.-Y.C., Y.-H.C. (Yi-Hung Chen) and M.V.D. conceived and designed the experiments; C.-C.C., W.-L.H., B.-L.L., Y.-H.C. (Yen-Hau Chen) and M.-H.Y. performed the experiments; C.-C.C., W.-L.H., B.-L.L., and C.-Y.C. analyzed the data; C.-Y.C., Y.-H.C. (Yi-Hung Chen), C.-F.L., C.-P.Y., J.-L.S., W.-Y.W. and T.V.T. contributed reagents/materials/analysis tools; Y.-H.C. (Yi-Hung Chen), D.V.M., M.-H.Y., C.-F.L., C.-P.Y., J.-L.S., and C.-H.L. discussed the results and provided suggestion; C.-C.C., B.-L.L., Y.-H.C. (Yen-Hau Chen), and C.-Y.C. wrote the paper. C.-C.C., Y.-H.C. (Yen-Hau Chen), M.-H.Y. and C.-Y.C. revised the paper.

Funding

This research was funded by Ministry of Science and Technology of Taiwan (grant numbers: MOST 105-2923-E-002-008, MOST 106-2923-E-002-001 and MOST 107-2923-E-002-001) and Vietnam Ministry of Science and Technology (NDT.17.TW/16).

Acknowledgments

The authors would like to thank the supports from the Ministry of Science and Technology of Taiwan, Vietnam Academy of Science and Technology, Sewerage System Office of Public Works Department of Taipei City Government, Bali Sewerage Treatment Plant, and Huimin Environmental Tech Corporation for this study.

Conflicts of Interest

The authors declare no conflict of interest.

Nomenclature

AFRAir-fuel ratio, =ratio of input air to input feed fuel of biogas containing CH4, CO2, air, and other gases
AFRMAir-fuel ratio in mass/mass, =ratio of input air to input feed fuel of biogas containing CH4, CO2, air, and other gases in mass/mass, kg/kg
AFRMAActual AFRM, =28.8z/(16 + 44x + 28.8y) (Equation (6)), kg/kg
AFRMSMake-up stoichiometric or theoretic AFRM in mass/mass, =(2 – y) × 28.8/(16 + 44x + 28.8y) (Equation (4)), kg/kg
AFRVAir-fuel ratio in volume/volume, =ratio of input air to input feed fuel of biogas containing CH4, CO2, air, and other gases in volume/volume, vol./vol.
AFRVAActual AFRV, =z/(1 + x + y) (Equation (7)), vol./vol.
AFRVSMake-up stoichiometric or theoretic AFRV in volume/volume, =(2 − y)/(1 + x + y) (Equation (5)), vol./vol.
CCH4Concentration of methane (CH4) in biogas, vol.%
CnCs adjusted with oxygen content in emission gas using Cn = ((21 − On)/(21 − Os))Cs according to regulation on gas turbine electricity generation facility, ppmv
CsGaseous pollutant concentration of emission gas measured according to the official method, ppmv
CECombustion efficiency, %
Ee,oActual output electric energy, kWhe
Eth,iInput thermal energy, kWhth
FEEEmission factor of greenhouse gas from electricity generation, kg CO2e/kWhe
FM,NO2Mass flow rate of emitted thermal NO2, kg/h
HL,CH4Low heating value of biogas in terms of CH4, 39.83 MJ/m3
OnReference baseline value of oxygen content of emission gas for pollutant concentration adjustment using Cn = ((21 − On)/(21 − Os))Cs according to regulation on gas turbine electricity generation facility, 15 vol.%
OsMeasured oxygen content in emission gas, vol.%
PWAActual power generated, kW
PWLRated power load, kW
QBGFlow rate of input biogas containing CH4, CO2, air, and other gases, m3/h or mole/h
QCH4Flow rate of CH4 in input biogas, m3/h or mole/h
QEAVolume flow rate of excessive air, =(z − (2 − y)) × QCH4 =(z − (2 − y)) × CCH4 × QBG (Equation (9)), m3/h
QNO2Maximal volume flow rate of thermal NO2, =0.21QEA (Equation (10)), m3/h
VBGVolume of input biogas, m3
VCH4/EAVolume ratio of CH4 to excessive air, =1:(z − (2 − y)) (Equation (8)), vol./vol.
x, yStoichiometric coefficients of reaction (R1) in combustion of biogas (containing relatively 1 mole CH4, x mole CO2, and y mole air) with externally introduced air ((2 − y) mole), CH4 + xCO2 + y(O2 + (79/21)N2) + (2 − y)(O2 + (79/21)N2) → (1 + x)CO2 + 2H2O + 2(79/21)N2 (reaction (R1))
zMoles of the actual additive air substituting for (2 − y) in reaction (R1), while being associated with thermal NOx formation according to mechanism 0.5 × 0.21(z − (2 − y))N2 + 0.21(z − (2 − y)) O2 → 0.21(z − (2 − y)) NO2 (reaction (R2))
ηTThermal efficiency, =Ee,o/Eth,i = output electricity/input thermal energy, % kWhe/kWhth
ηEBElectricity generation efficiency from biogas, =Ee,o/VBG = output electricity/volume of biogas, kWhe/m3 biogas

Abbreviation

ADAnaerobic digestion
BGBiogas
CTCCapstone Turbine Co.
CHPCombined heat and power system
HETCHuimin Environmental Tech Co., Taipei, Taiwan
IPCCIntergovernmental Panel on Climate Change
GHGGreenhouse gas
GWPGlobal warming potential
STPSewage treatment plant
TEPATaiwan Environmental Protection Administration
VOCsVolatile organic compounds
WWTPWaste water treatment plant
YTCYu-Tang Co., Taipei, Taiwan

References

  1. Boulamanti, A.K.; Maglio, S.D.; Giuntoli, J.; Agostini, A. Influence of different practices on bio-gas sustainability. Biomass Bioenergy 2013, 53, 149–161. [Google Scholar] [CrossRef]
  2. Huopana, T.; Song, H.; Kolehmainen, M.; Niska, H. A regional model for sustainable bio-gas electricity production: A case study from a Finnish province. Appl. Energy 2013, 102, 676–686. [Google Scholar] [CrossRef]
  3. Jiang, Y.H.; Xiong, S.S.; Shi, W.; He, W.H.; Zhang, T.; Lin, X.K.; Gu, Y.; Lv, Y.D.; Qian, X.J.; Ye, Z.Y.; et al. Research of bio-gas as fuel for internal combustion engine. In Proceedings of the Asia-Pacific Power and Energy Engineering Conference, Wuhan, China, 27–31 March 2009. [Google Scholar] [CrossRef]
  4. Hosseini, S.E.; Wahid, M.A. Feasibility study of biogas production and utilization as a source of renewable energy in Malaysia. Renew. Sustain. Energy Rev. 2013, 19, 454–462. [Google Scholar] [CrossRef]
  5. Chen, X.Y.; Vinh-Thang, H.; Remirez, A.A.; Rodrigue, D.; Kaliaguine, S. Membrane gas separation technologies for bio-gas upgrading. RSC Adv. 2015, 5, 24399–24448. [Google Scholar] [CrossRef]
  6. Gao, Y.; Jiang, J.; Meng, Y.; Yan, F.; Aihemaiti, A. A review of recent developments in hydrogen production via bio-gas dry reforming. Energy Convers. Manag. 2018, 171, 133–155. [Google Scholar] [CrossRef]
  7. Huertas, J.I.; Giraldo, N.; Izquierdo, S. Mass Transfer in Chemical Engineering Processes; Markŏs, J., Ed.; Intech: London, UK, 2011; pp. 133–135. [Google Scholar]
  8. Joppert, C.L.; Perecin, D.; Santos, M.M.; Coelho, S.T.; Camacho, J.L.P. A short-cut model for predicting biomethane availability after bio-gas upgrading. J. Clean. Prod. 2018, 200, 148–160. [Google Scholar] [CrossRef]
  9. Udaeta, M.E.M.; de SMedeiros, G.A.; da Silva, V.O.; Galvão, L.C.R. Basic and procedural requirements for energy potential from bio-gas of sewage treatment plants. J. Environ. Manag. 2019, 236, 380–387. [Google Scholar] [CrossRef] [PubMed]
  10. IPCC. AR5, IPCC Fifth Assessment Report: Climate Change; Intergovernmental Panel on Climate Change: Cambridge, UK, 2013. [Google Scholar]
  11. Hosseini, S.E.; Wahid, M.A. Development of biogas combustion in combined heat and power generation. Renew. Sustain. Energy Rev. 2014, 40, 868–875. [Google Scholar] [CrossRef]
  12. Pilavachi, P.A. Mini-and micro-gas turbines for combined heat and power. Appl. Therm. Eng. 2002, 22, 2003–2014. [Google Scholar] [CrossRef]
  13. Hosseini, S.E.; Barzegaravval, H.; Wahid, M.A.; Ganjehkaviri, A.; Sies, M.M. Thermodynamic assessment of integrated biogas-based micro-power generation system. Energy Convers. Manag. 2016, 128, 104–119. [Google Scholar] [CrossRef]
  14. Kim, S.; Sung, T.; Kim, K.C. Thermodynamic performance analysis of a biogas-fuelled micro-gas turbine with a bottoming organic Rankine cycle for sewage sludge and food waste treatment plants. Energies 2017, 10, 275. [Google Scholar] [CrossRef]
  15. Somehsaraei, H.N.; Majoumerd, M.M.; Breuhaus, P.; Assadi, M. Performance analysis of a biogas-fueled micro gas turbine using a validated thermodynamic model. Appl. Therm. Eng. 2014, 66, 181–190. [Google Scholar] [CrossRef]
  16. Kang, J.Y.; Kang, D.W.; Kim, T.S.; Hur, K.B. Comparative economic analysis of gas turbine-based power generation and combined heat and power systems using biogas fuel. Energy 2014, 67, 309–318. [Google Scholar] [CrossRef]
  17. Bali STP (Bali Sewage Treatment Plant). Bulletin of Bali Sewage Treatment Plant; Bali STP: New Taipei City, Taiwan, 2019. [Google Scholar]
  18. YTC (Yu-Tang Co.). Operation Report of Bali Sewage Treatment Plant; YTC: New Taipei City, Taiwan, 2015. [Google Scholar]
  19. CTC (Capstone Turbine Co.). Capstone Model CR-30 Performance; CTC: Los Angeles, CA, USA, 2006. [Google Scholar]
  20. Patterson, M.G. What is energy efficiency? Concepts, indicators and methodological issues. Energy Policy 1996, 24, 377–390. [Google Scholar] [CrossRef]
  21. Kanoglu, M.; Dincer, I.; Rosen, M.A. Understanding energy and exergy efficiencies for improved energy management in power plants. Energy Policy 2007, 35, 3967–3978. [Google Scholar] [CrossRef]
  22. TEPA (Taiwan Environmental Protection Administration). Emission Standards of Stationary Sources (ESSS). 2013. Available online: http://ivy5.epa.gov.tw/docfile/040070.pdf (accessed on 24 June 2016).
  23. HETC (Huimin Environmental Tech Co.). Annual Report of Emission Concentrations of De-Sulfurised Bio-Gas of Bali Sewage Treatment Plant; HETC: Taipei, Taiwan, 2016. [Google Scholar]
  24. TEPA. Air Pollutant Emission Standards for Power Facilities. Amended on 1 December 2014. Available online: https://oaout.epa.gov.tw/law/LawContent.aspx?id=FL015370 (accessed on 3 March 2019).
  25. TMOEA (Taiwan Ministry of Economic Affairs). CO2 Emission Inventory for Fuel Fired Power Generation Systems in Taiwan. 2018. Available online: https://www.moeaboe.gov.tw/ECW/populace/content/wHandMenuFile.ashx?file_id=5356 (accessed on 13 June 2019).
  26. Steen, M. Greenhouse Gas Emissions from Fossil Fuel Fired Power Generation Systems; European Commission Joint Research Centre: Brussels, Belgium, 2017. [Google Scholar]
Figure 1. The process of biogas application in combination with a CR-30 micro gas turbine electricity generator.
Energies 12 02424 g001
Figure 2. Thermal efficiency (ηT) vs. rated power load (PWL) for micro gas turbine electricity generator using biogas for test operation.
Energies 12 02424 g002
Figure 3. Un-adjusted concentrations of the exhaust of CO and NOx from micro gas turbine electricity generator using biogas for test operation. Exhaust gas Tavg = 275 °C.
Energies 12 02424 g003
Figure 4. Un-adjusted concentrations of the exhaust of CO2 and O2 from micro gas turbine electricity generator using biogas for test operation. Exhaust gas Tavg = 275 °C.
Energies 12 02424 g004
Figure 5. Combustion efficiency (CE) of the micro gas turbine generator using biogas for test operation. (CE = CO2/(CO2 + CO); data from Table 3).
Energies 12 02424 g005
Table 1. Concentration of de-sulfurized biogas from Bali Sewage Treatment Plant (test operation).
CH4
(vol.%)
CO2
(vol.%)
H2
(vol.%)
H2S
(ppmv)
Air
(vol.%)
Concentration
reported a
56.1 ± 8.025.5 ± 9.80.50.99 ± 0.0718.4
Concentration
measured in test operation b
42.3 ± 1.228.9 ± 2.4--28.9
a: Huimin Environment Tech Co. (HETC) (data from 2 June 2015 to 31 May 2016 without micro gas turbine electricity generator) [23]. b: Actual measurements during test operation from 31 May 2016 to 30 June 2016 (with micro gas turbine electricity generator).
Table 2. Characteristics of micro gas turbine electricity generator at different rated power loads (test operation).
PWL (kW)PWA (kW)QBG (m3/min)AFRV (vol./vol.)CCH4 (vol.%)ηT (% kWhe/kWhth)ηEB (kWhe/m3)
109.90.17886.142.319.80.93
1514.90.23884.722.31.04
2019.90.31180.122.81.07
2524.10.37178.023.11.08
3027.00.41276.023.41.09
PWL: Rated power load. PWA: Actual power generated. QBG: Volumetric flow rate of input biogas containing CH4, CO2, air, and other gases. AFRV: Air-fuel ratio in volume/volume, = ratio of input air to input feed fuel of biogas containing CH4, CO2, air, and other gases in volume/volume. CCH4: Concentration of methane (CH4) in biogas. ηT: Thermal efficiency of thermal energy to electricity. ηEB: Electricity generation efficiency from biogas.
Table 3. Concentrations and mass flow rates of pollutants of exhausted gas from micro gas turbine electricity generator with oxygen content adjustment.
LoadExhaustCO aNOx aCO2 aCONOxCO2
(kW)(kg/s)(ppmv)(ppmv)(vol.%)(kg/h)(kg/h)(kg/h)
100.31 b2014.90 ± 215.47121.43 ± 52.683.41 ± 0.242.18 ± 0.230.28 ± 0.1257.90 ± 4.08
151378.62 ± 231.91107.97 ± 54.183.22 ± 0.041.49 ± 0.250.25 ± 0.1254.55 ± 0.69
20516.76 ± 193.5757.13 ± 34.583.28 ± 0.100.56 ± 0.210.13 ± 0.0855.55 ± 1.75
25211.12 ± 167.7750.49 ± 34.153.37 ± 0.130.23 ± 0.180.12 ± 0.0857.22 ± 2.24
3085.68 ± 67.7317.45 ± 15.543.22 ± 0.040.09 ± 0.070.04 ± 0.0454.52 ± 0.76
Emission standard c2000150 d----
Emission standard e-10 f or 40 g----
a: Adjusted to 15 vol.% O2 by air pollution emission standards’ equation of power facility using Cn = ((21 − On)/(21 − Os))Cs [24]. Cs: Gaseous pollutant concentration of emission gas measured according to the official method. Os: Measured oxygen content in emission gas. On: Reference baseline value of oxygen content of emission gas for pollutant concentration adjustment according to regulation on gas turbine electricity generation facility, 15 vol.%. Cn: Cs adjusted with oxygen content in emission gas according to regulation on gas turbine electricity generation facility. b: Average value of waste gas emission [19]; 0.31 kg/s = 1,116 kg/h. c: Emission standards of stationary sources in Taiwan [22]. d: For gas fuels. e: Air Pollutant Emission Standards for Power Facilities [24]. f: For the new facility. g: For existed facility. ±: Standard deviation.
Table 4. Benefits of electricity generation and greenhouse gas reduction based on the emission factors of greenhouse gas from electricity generation in Taiwan for one 30 kW MGT electricity generator under regular operation from 1 June 2016 to 31 December 2018.
Operation Data aLong-Term Regular Operation 1 June 2016~31 December 2018 (Case A)Short-Time Test Operation 31 May 2016~30 June 2016 (Case B)HETC [23] 2 June 2015~31 May 2016 (Case C)
Operation time (h)17,853--
Methane concentration-42.356.14
Biogas consumption (m3)322,061 b--
Biogas consumption per hour or per day (m3/h or m3/d)18.04 or 43324.72 or 593- or 433 f
Net electricity generation (kWhe)350,548--
Net electricity generation per hour or per day (kWhe/h or kWhe/d)19.64 or 47127 or 64726.2 g or 629 g
Electricity generation efficiency from biogas, ηEB (kWhe/m3)1.09 c1.09 e-
Environmental benefits
Greenhouse gas reduction (kg CO2e) d192,495--
Greenhouse gas reduction per hour (kg CO2e/h)10.78--
Greenhouse gas reduction per day (kg CO2e/d)258.77--
Greenhouse gas reduction per year (kg CO2e/y)94,451--
a: December 2017 and January 2018 were annual maintenance time. Micro gas turbine electricity generator was not operated. There was no data. b: In April to November 2017, biogas flow meter was malfunctioned. There was no data for biogas flow rate. The data were estimated as follows: (1) Using the monthly variation trend of electricity generation efficiency from biogas ηEB in March to November 2018 to estimate that in April to November 2017; (2) Using ηEB and net electricity generation in April to November 2017 to compute the biogas consumption. c: Electricity generation efficiency from biogas ηEB = net electricity generation 350,548 kWhe/biogas consumption 322,061 m3 = 1.09 kWhe/m3 biogas. d: Emission factors of greenhouse gas from electricity generation in Taiwan are 0.530 and 0.554 kg CO2e/kWhe in 2016 and 2017, respectively [25]. Emission factor for 2018 is assumed the same as that of 2017. e: From Table 2. f: As that for Case A. g: Calculated using ηT = 23.4% kWhe/kWhth.

