Review

Electric Vehicle into the Grid: Charging Methodologies Aimed at Providing Ancillary Services Considering Battery Degradation

by
Gaizka Saldaña
1,
Jose Ignacio San Martin
1,
Inmaculada Zamora
2,
Francisco Javier Asensio
1,* and
Oier Oñederra
2
1
Department of Electrical Engineering, Engineering School of Gipuzkoa, Section of Eibar, University of the Basque Country (UPV/EHU), Avda. Otaola 29, 20600 Eibar, Spain
2
Department of Electrical Engineering, Engineering School of Bilbao, University of the Basque Country (UPV/EHU), Plaza Ingeniero Torres Quevedo 1, 48013 Bilbao, Spain
*
Author to whom correspondence should be addressed.
Energies 2019, 12(12), 2443; https://doi.org/10.3390/en12122443
Submission received: 31 May 2019 / Revised: 20 June 2019 / Accepted: 21 June 2019 / Published: 25 June 2019
(This article belongs to the Section E: Electric Vehicles)

Abstract

:
The necessity of transport electrification is already undeniable due to, among other facts, global Greenhouse Gas (GHG) emissions and fossil-fuel dependency. In this context, electric vehicles (EVs) play a fundamental role. Such vehicles are usually seen by the network as simple loads whose needs have to be supplied. However, they can contribute to the correct operation of the network or a microgrid and the provision of ancillary services and delay the need to reinforce the power lines. These concepts are referred to as Vehicle-to-Grid (V2G), Vehicle-to-Building (V2B) and Vehicle-to-Home (V2H). In paper, a deep classification and analysis of published charging strategies is provided. In addition, optimal charging strategies must minimise the degradation of the batteries to increase their lifetime, since it is considered that the life of a battery ends when its capacity is reduced by 20% with respect to its nominal capacity. Therefore, an optimal integration of EVs must consider both grid and batteries impact. Finally, some guidelines are proposed for further research considering the current limitations of electric vehicle technology. Thus, these proposed guidelines are focused on V2G optimal management, enabling new business models while keeping economic viability for all parts involved.

1. Introduction

In 2017, Greenhouse Gas (GHG) emissions from fossil fuels reached 36.79 gigatons of carbon dioxide equivalent (GtCO2e), increasing between 0.8% and 3% over the previous year. Moreover, it is estimated that GHG emissions will double by 2050 if actions are not taken [1,2]. The transport sector was responsible for 35% of the total energy consumed in 2014, of which 21% corresponded to passenger transport, with an average consumption of 1.9 MJ/pKm [3]. Passenger transport by road accounted for 49.7% of total energy consumption from oil in 2015 with 1908.48 MToe and 5553.34 MtCO2 [3]. Considering all mentioned data, there is still a long way to reach the scenario of zero net emissions by 2060 from IEA [2]. In this context, the energy and transport sectors play a fundamental role in achieving the zero emissions goal, through the development and implementation of new technologies such as Electric Vehicles (EV) and the improvement of energy generation processes.
True variation in GHG emission depends on the mix of technologies used for the electric energy production that EVs require [4]. Differences in emissions between Battery Electric Vehicles (BEVs) and Internal Combustion Engine Vehicles (ICEVs) range approximately 20–80 g CO2-e/km taking UK as a case study, but increase to 70–150 g CO2-e/km in the case of California [5]. Table 1 shows a comparison of emissions and cost, per distance unit and energy unit, for an EV among different countries.
In view of the increasing demand of the electric vehicle, an aspect that is gaining interest by the research community is the effect the charging system will have in the current power grid. Table 2 collects the analysed literature regarding the current state of the EV depending on the topics studied. These topics include EV Technology (historical evolution, power train, and battery and charger technology explanation); analysis of the economic, environmental or technical impact to the grid (in terms of load capacity, load profile, losses, voltage profile, phases unbalance, harmonics, equipment such as transformers, and stability); battery technical specifications (types, models and effects that recharging may have on the health of the battery); charging technical specifications (standards, topologies and methodologies); and other specifications (V2G, RES integration, DG, smart grid, communications and projects developed).
Several publications focus on the impact that vehicles can have on the network. However, there is no study considering both the power grid and battery impacts. Proper operation of the grid enables the integration of a greater number of vehicles. Nevertheless, the battery performance must be taken into account, mainly for being the limiting factor in the profitability of an electric vehicle. In this context, this paper focuses on the joint analysis of the impacts derived from the battery charging methods, taking into consideration a global view. In this sense, some research gaps have been identified within electric vehicle charging management, for which some research lines have been proposed.
This paper is organised as follows. general aspects of EVs are introduced in Section 2. Section 3 describes the impact on the grid of the charging strategies analysed, including several classifications of them. Afterwards, Section 4 describes the effects on batteries and key aspects to be considered. Section 5 shows some research opportunities. Finally, the main conclusions are presented in Section 6.

2. General Aspects of Electric Vehicle

Transport electrification is introduced as part of the solution to GHG emissions increase, which is mainly governed by road passenger transport. In this context, the European Union is promoting this Roadmap 2050, where, in 2050, emissions have to be reduced by 80% compared to 1990 [43]. Some countries in the European Union have started to impose restrictions on traditional vehicles. These constraints include the prohibition of new vehicles to be sold from 2040 onwards and the prohibition of their driving from 2050 onwards.
When compared to ICEVs, EVs show a better performance due mostly to the higher efficiency of the Electric Motor (EM) and the associated powertrain [44]. Among the advantages of this technology are:
  • Improvement of local air quality due to less emitting tailpipe exhaust gases, zero in BEVs
  • Improvement of energy efficiency in transport sector: the EM is more than twice as efficient as the Internal Combustion Engine (ICE) [45]
  • Less maintenance related to engine or mechanics and associated costs, especially in BEVs
  • Less noise pollution since EM is much quieter than ICE
  • Reduction of the external energy dependence of some countries by reducing the oil needed for fuels
  • Greater flexibility for the joint development of other technologies such as the integration of Renewable Energies Sources (RES) [11]
  • Improvement of electrical network quality under correct coordination [12]
In turn, disadvantages for users with the current state of development are listed below:
  • Low autonomy in electric mode compared to ICEVs
  • Few charging stations and long duration of the charge
  • High cost and limited lifetime of batteries
  • The almost zero noise produced during the operation of the EM may not prevent accidents, for example, by not warning the presence of vehicles to pedestrians
Vehicles can be classified into two general groups depending on their motor: ICE and EM. Traditional vehicles are based on heat engines: Spark-Ignition Engine (SIE) and Compression-Ignition Engine (CIE). On the other hand, EVs can be declassified into Plug-in-Electric Vehicles (PEVs), Hybrid Electric Vehicles (HEV) and other alternatives such as Fuel Cell Electric Vehicle (FCEV). This classification is shown in Figure 1.
PEVs get their electric energy from the power grid, thus the analysis regarding charging schedules of electric vehicles only considers this type of vehicle. Currently, there are different alternatives in the market within the category of PEV depending on the topology that is adopted: BEV, Range Extended Electric Vehicle (REEV) or Series Plug-In Hybrid Electric Vehicle (PHEV) and Parallel PHEV.
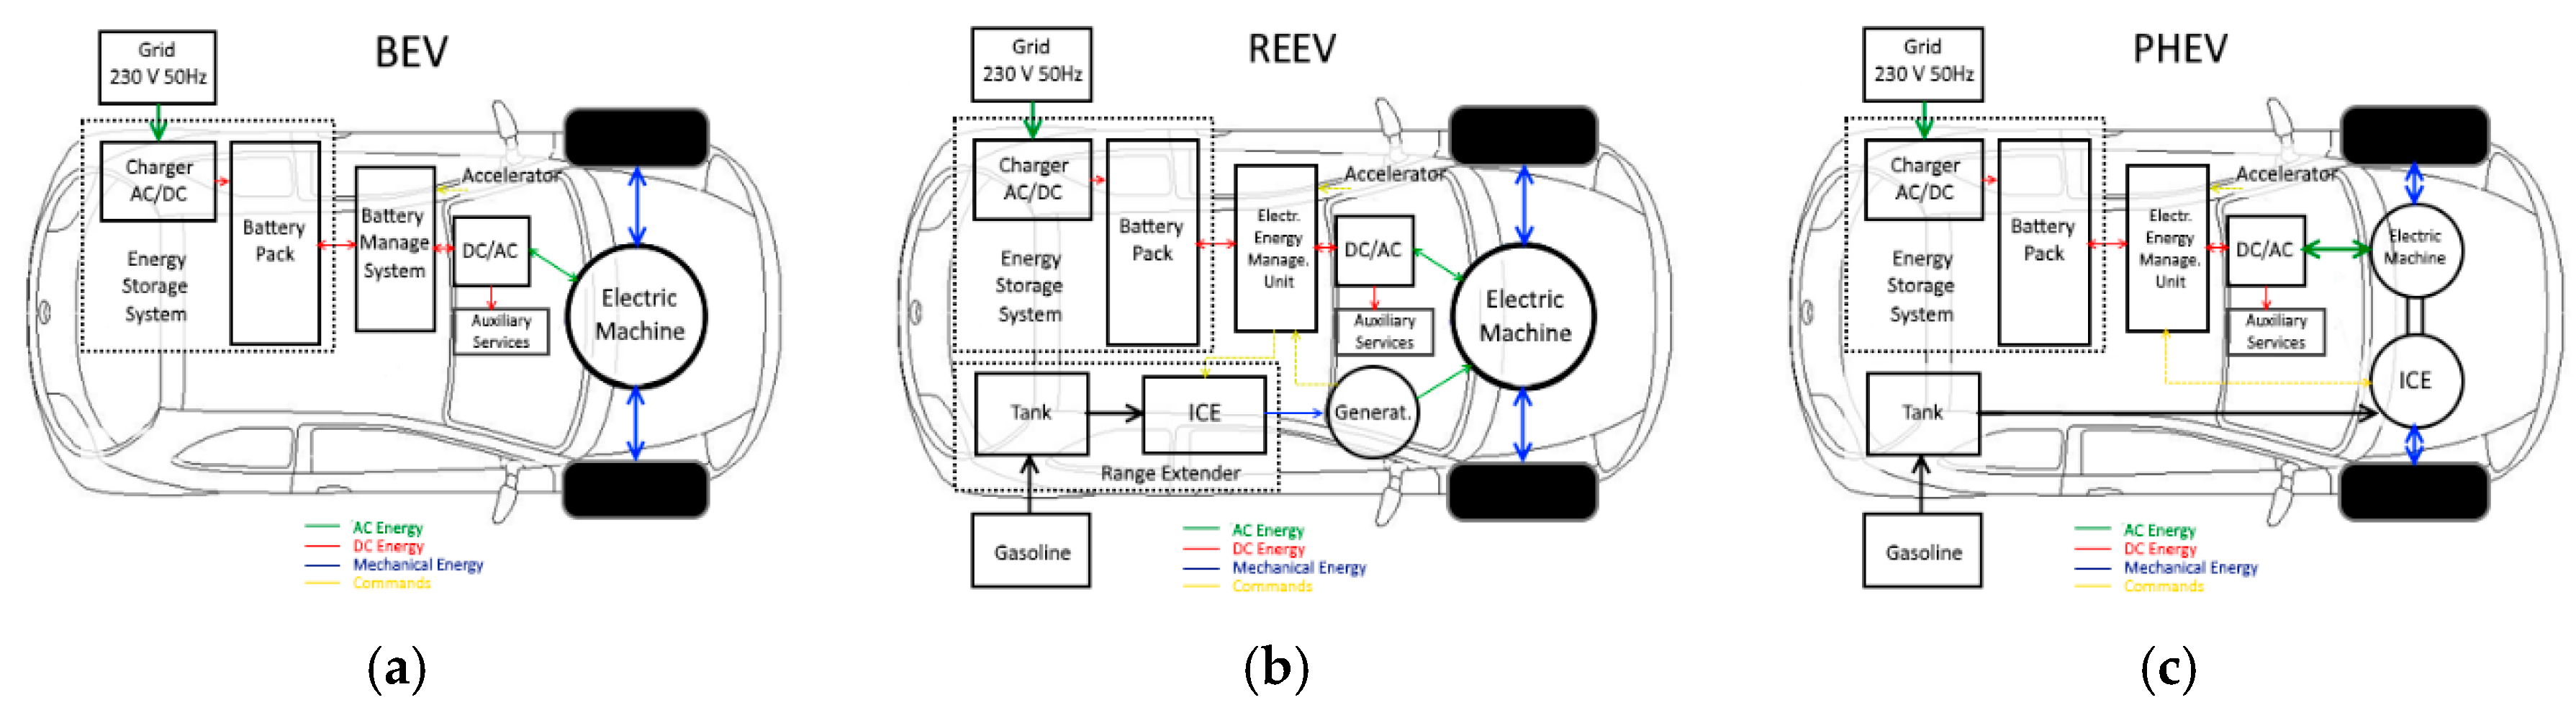
  • BEV (Figure 2a): The BEV is the simplest in terms of technology, since it is a purely electric vehicle. It consists of batteries that are charged from the network through an on-board or off-board charger, and a DC/AC converter that feeds a reversible electric machine with the energy coming from the batteries. The bidirectionality of the energy flow allows the reversible machine to operate in generator mode, thus enabling the regenerative braking. The batteries operate in a single mode, “Charge Depleting Mode” [45], discharging during vehicle operation and recharging from grid or through regenerative braking. Constructively, two types of BEVs can be found, according to whether a single electric machine is connected to the wheels through a differential, or an electrical machine is installed in each wheel, known as an in-wheel machine.
  • REEV/Series PHEV (Figure 2b): The REEV/Series PHEV comprises mechanical and electrical energy sources, while traction is always electrical. In addition, it includes an ICE that feeds the battery in moments of depth of discharge. Thus, the batteries work in two modes: Charge Depleting Mode, when the small ICE is disconnected; and Charge Sustaining Mode, when the ICE is working, keeping the battery charge at a specified minimum level [45]. The main difference between REEV and series PHEV is the size of the ICE, which is considerably higher in the PHEV. This allows an optimal operation of the REEV motor at the point of maximum efficiency, with less fuel consumption.
  • Parallel PHEV (Figure 2c): A parallel PHEV vehicle also has two types of energy sources, but traction can be performed electrically or mechanically as required.
In 2016, approximately 753,000 PEVs (60% BEVs) were registered in new sales worldwide, reaching 2 million units in circulation (0.2%), which rose to 3.1 million in 2017 [46]. Among the recommendations of the IEA are to prioritise the economic incentives for the purchase of PEVs and the availability of charging infrastructures, local incentives such as access granted to restricted urban areas, special pricing in car parks and public fleet programs [2].
Regarding the BEV/PHEV ratio, there are differences depending on the territory. Two-thirds of EVs in circulation globally are BEV type. In Norway and Denmark, BEVs accounted for 53% and 56% of new sales of EVs, respectively, while in the other Nordic countries the PHEVs lead. Generally, small vehicles are BEVs, while in medium-large size vehicles the effort and costs of the associated powertrain become PHEV profitable [47].
For a correct sizing of the battery to be used, it is useful to know the transport needs of the inhabitants of different countries. These needs can be generally classified into three ranges [48]:
  • About 40 km: UK is the leading country in this category.
  • From 50 to 60 km: Most countries are in this category: Germany France, Italy, etc.
  • More than 70–80 km: This range includes countries such as Poland and Spain.
Given these needs and the average energy consumption, a 16-kW h battery is considered to be sufficient to meet 80% of transport needs [49]. According to the analysis carried out in [50], 87% of US circulating vehicles on a given day could be replaced by BEVs performing a single charge.

3. Impact on the Grid and Associated Charging Methodologies

The charging of EVs is one of the main issues for the total integration of this technology into the power grid, due to the wide range of phenomena that their impact can cause. An efficient electrical system benefits all interested parties, such as Transmission System Operator (TSO), Distribution System Operator (DSO), Independent System Operator (ISO) if it exists, users, etc., in terms of ease of operation, quality and price.
Charging methodologies can be classified into two general groups depending on the power direction: unidirectional and bidirectional.

3.1. Unidirectional

The unidirectional charging concept refers to a single flow of energy from the grid to the vehicle used to charge its batteries. Table 3 collects the best-known charging standards among all that have been published.
Figure 3 shows a classification of the unidirectional charging strategies analysed according to their location, which are detailed throughout this section.

3.1.1. Uncontrolled

In uncontrolled charging, also known as dumb charging, the charging occurs from the time the vehicle is connected, up to reaching 100% State of Charge (SOC) or the departure time, in the case it is sooner. It has the disadvantage of not ensuring the full charging of the vehicle, as well as not guaranteeing safety in the power transport lines and associated equipment. The price of electricity is not considered, and therefore the cost of charging is unpredictable. As an advantage, it is the cheapest charging method in terms of development and implementation, as there is no need to invest in equipment. However, the operation of the system becomes complex and expensive.
Performing the charging of many EVs in an uncontrolled manner is commonly associated with a series of damages for the distribution companies. One of these damages implies the congestion of the power lines, which is dependent on the charging schedule given by society routines. Thus, most of the charging events would occur at the same time, and within the most crucial hours as far as the power grid is concerned, i.e., in the interval of greatest demand. The proportion of power grid capacity in use defines the so-called capacity factor, which would exceed its maximum value in the case of uncontrolled charging of EVs. The load variation, defined as zero for a flat demand, would also be affected by modifying the demand from the minimum value to its maximum in a short period of time. Load variation is one of the key factors that determine the power losses and cause premature aging of power equipment such as transformers.
This charging type, despite not having complexity, does not benefit any part, since the increase on system losses and the premature aging of equipment would negatively affect the electricity price to be paid by the end user.
In [51], the authors performed an assessment of the effects that uncontrolled charging would have in the power grid, in terms of losses and voltage deviation depending on the penetration rate (0–30%). The results show for all cases a significant increase in losses as well as voltage variations, which are maximum in winter season because of the higher power demand. The simulation network used (IEEE34 node) corresponds to the real network of Arizona.
In [52], on the other hand, the impacts in the Zurich area (Switzerland) are analysed in terms of demand profile, equipment load factor and operating costs. As a consequence of an uncontrolled strategy, the demand profile is greatly accentuated in peak periods both in the transport network and in the distribution network; the maximum safe load factor of equipment such as transformers is overpassed in certain periods; and operating costs grow considerably. The authors of [53] came to the same conclusion through their analysis on the “IEEE 31-node 23 kV” test network.
However, in [54], the HV network from the city of Morelia, Mexico, is analysed, where a penetration ratio of 10.5% would not saturate the power lines nor the transformers, nor losses would increase noticeably. In [55], another network, a model from CIGRE, is analysed with up to 50% penetration index, resulting in an increase of both losses and load factor of equipment, but within the established limits. However, voltage at certain nodes would not be acceptable.
In conclusion, the analysed literature shows that, for small penetration ratios, the uncontrolled method can be viable depending on the capacity and topology of the network. However, in large ratios, it increases the peak-to-valley difference, increasing network losses and causing overload and undervoltage effects [56].

3.1.2. Controlled (Smart Charging)

Due to the major negative impact that uncontrolled charging of EVs can have on the power grid, it is necessary to develop a methodology considering different indicators of the correct overall performing of the network. This methodology pursuing a goal, or a series of specific objectives, is known as Controlled Charging or Smart Charging. The main characteristics of main topologies are summarised in Table 4 and this comparison is graphed in Figure 4. The different algorithms can be classified according to different categories, such as the objective they pursue or the calculation method used. In this case, they have been first categorised according to their location, and secondarily to other considerations (objective, software, solver, etc.) in Table 5, Table 6, Table 7 and Table 8.
Scalability measures the capacity of integrating more vehicles into the overall available infrastructure. In the decentralised architecture, the intelligence is located in each vehicle, therefore it presents a better scalability against the centralised architectures, of which the DSO-based is the least scalable. End user controllability shows the liberty for end user to take part in making decisions, and follows a similar trend for the same reasons. In this sense, the greater is the centralisation, the lower is the capacity of the end user to decide on the way in which the exchange of energy with the grid is carried out. Ease of implementation is also led by decentralised architecture, while multi-agent-based intelligence is the worst, since it requires the largest communication infrastructure.
V2G factor considers the ability and performance that each architecture could get in providing ancillary services to the power system. In this regard, multi-agent-based architecture shows a better coordination and ensures that the needs of all parts are met. On the contrary, decentralised architecture has the greatest difficulties, due to the lack of a communications layer and the fact that it only uses local measures mean it has less capacity to manage a possible contribution to the network in a global manner.
The ability to create new business models is the last aspect considered. While decentralised architecture has low capability and DSO-based one can only offer this opportunity to the current DSO companies, aggregator-based and multi-agent-based ones enable the creation of new business models. These business models could consist, for example, in participating in the electricity market for the purchase of energy, the management of technical restrictions, and providing ancillary services.

Decentralised

Providing each vehicle with a charging management system with connection ability to other elements or entities is the so-called decentralised charging control. In this way, each vehicle performs its operation based on a series of internal and/or external signals. Most of the literature analysed regarding this unidirectional strategy shares a common goal: the valley filling of the load profile. Table 5 shows a classification of the literature analysed based on decentralised charging.
There is a large literature which seeks to optimise the electricity cost [57,58,59,60,61,62,63,64,65]. The authors of [57,58,59] showed how to operate this type of control with the main objective of optimising the cost and contributing to the valley filling. They used the Nash Certainty Equivalence (NCE) method, where each vehicle establishes its charging conditions in search of the lowest cost considering the strategies of other vehicles in a series of communications. In turn, individual strategies are penalised the further they get from the overall strategy.
Communications about the status of the grid is essential for decentralised charging as demonstrated in [66], where a valley filling strategy is proposed taking into account violations of system voltage bounds. Especially, this necessity is higher when the behaviour of the driver is not known, thus the system planning cannot be foreseen and most decisions must be made in real time.
The design of the controller to be installed is treated in [67]. The authors managed the charging in a variable way related to the SOC of the batteries, as well as the voltage of the node where they are connected. The results show that the correct design of this controller is a determining factor to avoid undervoltages.
Other decentralised strategies are based on signals received from other entities such as the DSO resulting in the so-called “signal-based charging”. In [61], a signal-based charging decentralised strategy with real-time operation capacity and focused on the valley filling service is presented.
In recent years, Demand Side Management (DSM) is gaining prominence because of the organisation of energy markets in time intervals with variable prices. This tariff system of the electricity market can be considered when establishing a charging strategy, known as “price-based charging”. This is the case in [68], where a day-ahead time-power-varying pricing scheme indirectly coordinates an overall effect of valley filling, maintaining the independent self-determination of each EV.
Connecting multiple EVs demanding active power on the same bus can generate large voltage drops due to the large R/X ratio of the distribution system (close to 1 [72]) as given in Equation (1).
Δ V = P · R + Q · X V 2 ,
where Δ V is the voltage drop; P and Q are the active and reactive power injected (negative for consumed), respectively; R and X are the impedance in the point of common coupling; and V is the voltage in the point of common coupling.
As a solution, the so-called voltage droop charging control is widely known, and is used in [65,69]. This method adjusts the charging power based on the voltage of the node (Figure 5a).
The improvement obtained with this method depends on the number of vehicles working together. The authors showed that this method in combination with a local or global optimisation strategy can reduce the impact of EVs on the voltage profile. A variation of this method for frequency regulation is graphed in Figure 5b, and is explained in more detail below.

Centralised

Creating an entity with the intelligence to control the charging of EVs is the so-called centralised control. It can be split into several concepts based on the location of the control intelligence. The most common locations are aggregator, DSO and multi-agent.
(1) Aggregator-Based
The centralised control in the most local form is given by a device or entity able to decide on one or a series of vehicles. This entity is commonly known as “Aggregator” and aims to bring together several vehicles from users with common interests and mediate with system operators (DSO, TSO, ISO, etc.). Generally, the centralised control via aggregator seeks the objective of reducing charging costs or the price for end users. Table 6 shows a classification of the literature analysed based on Aggregator based charging.
Figure 6 shows a general scheme of the operation of an algorithm located in the aggregator, although in markets where the vertical integration of several companies is possible (retailer, DSO, etc.), they correspond to only one [83].
The aggregator can combine different functions depending on the number of vehicles they work with. If this number is high, the aggregator can act as retailer, participating in energy auctions to offer the lowest price to its customers. In [85], this case is analysed for Level 1 and Level 2 chargers corresponding to a residential area or a commercial fleet where there is no interest in the participation in ancillary services. Two algorithms are presented, the first one concerning the purchase of energy based on an estimation, and the second one concerning to its provision to end users. For the case in which customers decide to participate in the maintenance of power supply quality, the authors of [86] presented an algorithm with three variants where the charging power varies considering different grid parameters, resulting in benefits for all parties concerned. These benefits are low charging price for users, the economic profit for the aggregator, the minimum degradation of the battery when subjected to fewer processes, and the participation in ancillary services.
In low power domestic charging, the aggregator usually is called home energy control box or Home Energy Management System (HEMS) [62,88,98]. This device aims to collect the demand profiles both inherent to a home and the EVs charging. With this information, it is possible to design a charging plan suited to each user, not only meeting its specifications or requirements, but also achieving a flattening of the demand curve of the home as a whole. This concept can be extrapolated to a series of homes being controlled by the same device under a global energy control strategy, with better results and less installation costs. The authors of [98] proposed a charging strategy based solely on the instantaneous price of electricity under a congestion pricing regulation, because of the limited existing communication infrastructures. In the case that the user needs to charge his vehicle as soon as possible, it will become a critical load and will not participate in the incentive program [88].
In [81], the economic differences between four typical strategies are analysed: cheapest (recharging in period when mean electricity price is the lowest), cheapest starting (start the recharging when electricity price is the lowest), low cost (recharging when off-peak period begins) and last period (charging as late as possible). For domestic charging in Mode 1, the “cheapest starting” method is discarded because it fails to ensure the final SOC requirement, being “last period” the one offering the best results for nocturnal charging. The authors of [78] exposed a charging control based on events. These events can be requests for new charging, user preference updates or DSO signals (concerning the status of the network). The advantage of this strategy is that the system is able to foresee an estimated price, based on the desired charging characteristics. They considered the aging of the battery, only relating it to the number of charging activations. The results show a proper operation by modifying the parameters in each time window.
Time of Use Tariff is one of the most used market systems in which the electric vehicle can be integrated. This system decomposes the day into a series of intervals, usually three (peak, shoulder and off-peak), assigning a different price to each one. In [93], a procedure is proposed where vehicles are classified according to the charging priority, assuming higher prices at higher priority. This control allows a lower variation of the voltages in the nodes and transmission losses across the network. Optimisation in two stages under the same market system is proposed in [80], the first in economic and the second in quality of supply terms, resulting in a valley filling up to 28.2%.
Collective car parks are locations of great interest because of the many vehicles parked in them. Their management in a centralised manner allows acting more effectively towards a common objective. In [90], an optimisation strategy based on the Particle Swarm Optimisation (PSO) method is proposed, since it presents the best results in just 4 s for 100 EVs. However, the proposal in [97] is based on rectangle placement, or temporary division slots method, defining the charging schedule flexibility of each vehicle depending on its arrival and departure time. The charger can vary its voltage among Levels 1, 2 and 3 to flatten the demand curve, i.e., to reduce the load variation. In [82], a dynamic programming optimisation in two stages is performed: first, the calculation of the cost in the current period and then a short-term electricity price estimation for the next interval.
In addition to domestic charging and parking lots, service stations are another important core. These stations are strategically located according to the power grid configuration and the geographical location. They allow high power charging for users requiring large autonomy in a short time. These stations can be supported by RES supplying part of the energy needed [89,91]. In [91], a system based on Flexibility Envelope is presented for a charging station that combines photovoltaic (PV) generation, battery storage and grid connection. The parameters are adjusted according to the SOC of the battery, resulting in greater profits for the station and less impact on the network.
There are other charging methods in addition to the wired ones. One of them is the exchange of the depleted battery by a full-charged one, called Battery Swapping. This method has the advantage of needing much less time for its operation, allowing the user to have his vehicle back fully functional in minutes. Thus, creating service stations for this purpose also means a business line. A specific strategy for charging batteries in such stations is proposed in [84]. The authors used a hybridisation of a Genetic Algorithm (GA) and PSO to optimise energy losses and operation costs. As restrictions, voltage deviations and the maximum power under a dynamic market price regulation are set. It concludes with a promising vision, especially when combining with RES and a communications system that allows participating in regulatory markets. Such a combination of stations with RES appears in [89], which consists of a two-stage planning: a day ahead forecast of the renewable generation and the supply of the energy. The algorithm manages the system in real time considering the price difference by the Sample Average Approximation (SAA) method.
(2) DSO-Based
Charging strategies can also be controlled directly or indirectly by each distribution company, generally with the goal of improving the power quality. This centralisation aided by fast chargers has demonstrated the ability to flatten the load profile in the UK [99]. However, the authors did not consider the technical impact in the network or the effects on the voltage profile.
Table 7 shows a classification of the literature analysed based on DSO-based charging. Many of them seeks to optimise the cost of electricity [100,101,102], but there are also some strategies aiming at optimising the quality of supply [99,100,101,102,103,104,105] and reducing losses on the network [104].
The simplest control is given by price signals (Figure 7). In this type of control, vehicles would perform their charging when the price of electricity is low, usually at dawn. However, many vehicles would cause power quality problems due to the new peak demand [101]. Besides, the strategy, formulated as a function of the market price and the transformer load to which they are connected, shows good operability. A similar analysis is carried out in [106], concluding with a continuous price modification proposal based on the capacity available.
Based on the premise that reducing losses entails improving voltage profile, in [104], a strategy is studied which minimises the load variation and increases the load factor at the same time, based on Monte Carlo method. It is shown that, if the distribution system corresponds to a single feeder with all the loads connected to its final end, the relationship between losses, load factor and load variation is exact. Although it is not the case for most applications, it is a good approximation for a great number of them.
In [100], an iterative optimisation to reduce the charging cost is performed. Thus, in each iteration, the next time interval is planned considering the voltage limits and the electricity price at each hour. Note that, since the distribution system is an unbalanced system, it is important to consider an affine load flow.
The authors of [102] introduced an alternative to the valley filling to reduce operating costs and to improve the reliability of the network. Thus, through flexible planning and simulations on a New York network, the authors achieved up to 16% energy cost reduction, 9% higher than with valley filling, for a specific proportion of Level 1 and Level 2 chargers.
(3) Multi-Agent-Based
Depending on the network topology, a multi-agent decision system is also possible. In multi-agent systems, charging decisions do not depend on a single entity, but are conditioned to the agreement of several entities through a communications system. Therefore, these strategies are more appropriate to be implemented in Smart Grids (SG). The entities are commonly associated with two operators at different levels, where the lower level seeks to carry out the charging as efficiently as possible and the higher level seeks the efficiency improvement of the whole system. Despite being a complex operation, it is very promising when the network allows its application. Table 8 shows a classification of the literature analysed based on multi-agent charging.
In [63], a strategy with experimental validation based on multi-agent concept is presented. In normal operation, a collaboration between the DSO, coordinator, aggregator and every EV allows charging with the following procedure: each electric vehicle sends status information (current SOC, desired SOC, desired charging period, etc.) to the aggregator, which collects all the information and compares it with the market prices aiming at lowering the cost. In the case of emergency defined by contingencies occurrence (overload, undervoltage, etc.), the DSO, which is constantly monitoring the network, sends a Shedding signal to the coordinator, which is redirected to the affected aggregator. Figure 8 shows a general scheme of the operation of this multi-agent algorithm.
The proposal in [109] consists in the creation of a series of agents representing each typology of elements and negotiations among them, based on the interests of each one. In the case of EVs, each affected transformer, informing of the available capacity and arriving at a common agreement, would authorise charging operations. Thus, although the agents are independent from each other, their objectives are not independent under coordination. The results show a more conservative tendency compared to GAs, but with the advantage of needing fewer data.

3.2. Bidirectional

The bidirectional charging concept refers to a power flow that can be given from the grid to the vehicle, used to charge its batteries, or given from the vehicle to another entity (grid, building, home, etc.). Figure 9 shows a classification of bidirectional charging strategies analysed according to their location and possibilities.
In this section, the three main approaches are explained: Vehicle-to-Grid (V2G), Vehicle-to-Building (V2B) and Vehicle-to-Home (V2H). Table 9 summarises their advantages and drawbacks.

3.2.1. Vehicle-To-Grid (V2G)

The Vehicle-to-Grid (V2G) concept allows temporary discharge of the batteries installed in EVs, thus providing stored energy for power grid regulation purposes. There are many ways to perform this contribution, as shown in Figure 7 [56,71,73,74,75,76,77,110,111,112,113,114,115,116,117,118,119,120,121,122,123,124,125,126,127,128,129,130,131,132,133,134,135,136,137,138]. Some studies support the remuneration of this concept as an alternative to economic incentives to promote the purchasing of EVs [115]. In this concept, the aggregator has a predominant role, since joining the interests of many vehicles allows exploring new forms of business, such as providing ancillary services [73].
Proper management of the energy flows to and from the batteries of the EVs could make this technology competitive. In this context, the Net Present Value (NPV) of EVs could be slightly higher than those of gasoline ($23,779 vs. $22,842) with a 4-kW domestic bidirectional charger [115].
In this sense, the available capacity in a battery is a key factor for the provision of ancillary services, but the power is even more important, which is mainly limited by the charger. The income of the aggregator is proportional to the power, since the supply market is based on power, instead of energy [116].
Several regulation services can be found on the market, being the frequency and voltage regulation the most relevant for EVs.
(1) Frequency Regulation
Frequency regulation is one of the most critical and extended ancillary services with regard to collaboration between EVs and markets. In search of stability, deviations in the grid frequency can be corrected by varying the power generation or consumption. Traditionally, generators coupled to the network (spinning reserve) have been responsible for this regulation, assuming greater contamination and degradation of equipment [117]. Unlike the sale of electric power that is billed by the amount of energy, the provision of frequency regulation is remunerated based on available installed power [118].
The classical frequency regulation system called droop method is widely explained in [77], as represented in Figure 5b. The “adaptive droop method” is a proposed decentralised methodology in which the offset is modified to create a state called Battery State Holder (BSH), transferring the dead nand to the abscissa axis. Thus, depending on the value of the offset, the charging droop will be greater than or equal to that of the discharging. Two other variations are presented in [75], which are tested by means of a droop mode controller and a PI controller coupled to a high pass filter to avoid undesirable responses against stationary frequency fluctuations. This second variation can substitute 80% of the frequency regulation by the traditional generators for the case of study.
In [119], an operation strategy with frequency regulation is provided, in which a symmetric charging/discharging is established during the regulation mode, so that the SOC of the batteries is not affected. Due to the lack of regulation about V2G, the authors used a series of random prices based on Markov models. The results reflect an increase in global benefits. A similar study is conducted in [118].
The authors of [120] used a priority policy commonly called Early Deadline First (EDF) where the vehicle with the least available time for charging has highest priority. In turn, during the parked time, there are four modes of operation: immediate charging, charging when there is available power, charging with price limit and charging with provision of frequency regulation. Although the simulation example considers the joint operation of several homes, the methodology is proposed to be used with HEMS and aims to be upgraded to a decentralised or multi-agent strategy.
In [121], the authors established a compromise between the final SOC and the economic income due to the frequency regulation service. Even though the final SOC is unpredictable, it is ensured to be sufficient to complete the next trip. This relationship is established by using weighting functions and built-in linear programming. The regulation is also discriminated between ramp up and ramp down.
A strategy based on the coordination of several agents is presented in [73]. Since each aggregator will cover a large area, the creation of different entities depending on the number of vehicles to be controlled is proposed. These entities are based on a controller called Micro Grid Aggregation Unit (MGAU) for every 400 vehicles located in the MV/LV transformation centres and a Central Aggregation Unit (CAU) located in the HV/MV transformation centres for every 20,000 vehicles. For large consumption points such as shopping centres, they recommend feeding the EVs directly from the MV network. As in unidirectional mode, the DSO can interrupt charging in the case of abnormal system operation, while the frequency regulation is based on droop method.
Recent publications (e.g., [117]) try to look beyond the droop method by proposing different objectives that can be covered within the frequency regulation, namely: minimisation of network frequency deviations, maximising the V2G contribution respecting the preferences of the user, an optimal vehicle charging and discharging program, minimising battery degradation and maximising user retribution. The authors designed these goals in a Mixed Integer Linear Programming (MILP) environment assuming a communication system between aggregators. The results show an improvement in the regulation signals compared to droop method, as well as a lower degradation of batteries as long as the charging and discharging limits are respected.
Regarding the integration of RES, in [74], a decentralised droop mode controller similar to the aforementioned is used to complement their intermittency in weak networks. Consequently, the power quality is significantly improved and the connection of more RES without violating the established bounds is allowed [74]. Additionally, these RES can operate at the Maximum Power Point (MPP) [122].
The frequency stabilising effect that EVs can have enables the creation of Virtual Power Plants (VPPs), as shown in [76]. VPPs encompass a series of generators and/or storage systems, of a single or a combination of several technologies, under the same electric entity without the need of being located in the same geographical location. Thus, a wind farm can provide an energy amount of higher quality despite the weather fluctuations, for example. Although the regulations of each country are different, a minimum power requirement for participation in ancillary markets is commonly established (e.g., 2 MW in UK) [123]. Obviously, a single vehicle or a small group of them is not enough to overcome this requirement, but it could be feasible for a VPP formed by many aggregators.
(2) Active/Reactive Power for Voltage Regulation
Power injection by EVs has a stabilising effect, which may also help raise the voltage of the overloaded nodes, as follows from Equation (1). In addition, voltage can also be reduced by implementing fuzzy logic controllers [124].
As previously explained, large car parks are more likely to cause problems in the voltage. In [71], an example of optimisation for this application is described, where a prediction unit and a two-stage optimisation unit are responsible for avoiding the violation of the technical limits of the network. The particularity of this research work is the use of the Vehicle-to-Vehicle (V2V) concept, i.e., the battery discharging is only carried out if there is another vehicle with higher priority to which the energy is directed, and the absorption of energy from the network would violate technical limits. This way, the accelerated degradation of batteries is reduced, since there are no incentives.
The charging of EVs can take place in any of the four P—Q quadrants. This characteristic is used in [125] to compensate the voltage drops produced by the simultaneous consumption of active power and the injection of reactive power. This operation could benefit the user by lowering the cost of charging under a dynamic pricing system.
(3) Load Profile
The effect that proper management of charging can have on the load profile is very promising. Most of the strategies analysed consider the concept of valley filling either implicitly or explicitly. However, in conjunction with Demand Side Management (DSM), V2G is also able to flatten the demand curve to an average value, by responding as generators in peak demands [126,127].
(4) Spinning Reserve
While uncontrolled charging should be avoided, smart charging (with or without V2G or ancillary services) reduces the cost of system operation and allows integration of more RES. Shifting responsibility regulations from traditional units to EVs allows the exploitation of generation sources at the point of maximum efficiency, leading to economic and environmental benefits [128].
In [129], the authors presented a strategy framed in stochastic programming for parking lots with RES, which can provide ancillary services and considers the spinning reserve. The optimisation is carried out in two simultaneous parts: the day ahead and the collaboration with the DSO. The authors concluded that greater benefits are obtained in the participation of ancillary services when considering wind generation, although photovoltaics provide greater benefits in the energy markets.

3.2.2. Vehicle-To-Building (V2B)

The Vehicle-to-Building concept combines local (usually renewable) generation technologies and storage systems (including EVs). It was introduced in 2008 as a variant of V2G to flatten the demand curve of a building by applying DSM, and thus optimising energy consumption. This is possible by applying the optimal management of buildings and considering a fleet of vehicles such as offices or car-rental companies.
The authors of [130] applied this concept to their university campus considering all economic factors in billing. Vehicles are charged for free, but they can be used for the campus electrical system regulation, and sometimes for consumption. Three types of vehicles and real consumption data are considered. As results, maximum power, variation of cumulative power, variation in billing and user benefits are given, showing divergences for each type of vehicle. As general conclusion, an economic benefit when raising power supply and managing energy flows is found.
In [131], two application cases of this concept are proposed: centralised and decentralised. The authors established the optimisation as the minimum Euclidean distance between the instantaneous energy demand of the system and the average demand. The centralised approach requires the disclosure of specific vehicle data and its users, which may constitute a failure of privacy, so that the decentralised approach based on game theory is promoted.
In the example in [132], an average office building is considered with photovoltaic energy contribution, electrical and thermal storage, and a series of electrical and thermal loads. The resolution method seeks the Pareto Frontier between the cost of vehicles charging and building energy cost. A similar example is given in [133], where the degradation of the storage system of the building is considered. The building corresponds to an office building in Los Angeles and the vehicles are charged “as soon as possible”. The results show a reduction in total costs up to 7.2%.
In [134], the authors proposed a four-stage strategy for a commercial complex, which comprises a service station, a storage system and photovoltaic generation. The electrical demand of the building is covered with photovoltaic generation, and Demand Response (DR) is applied. The different stages of optimisation range from the forecast of generation and demand on day-ahead to the operation in real time through data updates at certain moments.

3.2.3. Vehicle-To-Home (V2H)

Vehicle-to-Home technology is very similar to V2B since it also combines local (usually renewable) generation technologies and storage (including EVs) to flatten the demand curve. Thus, the EVs act as generators at certain times, delivering power to the home temporarily, or in emergency situations. As driving energetic demand is much greater than the domestic one, it does not suppose a sizing problem.
An example is developed in [135] where the objective is to reduce the total energy cost, considering the difference of the energy bought and the sale of the generated energy from PV, the prices, and the capacity of DR, using as storage the battery of the vehicle. The authors of [136], however, focused the optimisation on not consuming energy from the grid at peak periods and on complementing the domestic battery with that integrated in the vehicle.
In [137], an innovative concept called Vehicle-to-Neighbour (V2N) is shown. In this sense, a residential neighbourhood management system is formulated where the concepts V2H at the local level, V2N at the level of urbanisation and V2G at a global level are carried out. Thus, apart from the known concepts, the possibility of sharing energy between neighbours at a lower cost at certain moments also exists.
Extreme weather caused by climate change and with the local difficulties of some population areas are causing the electricity network to suffer a greater number of blackouts. During these blackouts, EVs can feed domestic loads for a specified period, by acting as emergency generators. In these cases, they are responsible not only for contributing, but also for maintaining an active electrical network with full responsibility for regulating frequency and voltage. In [138], the authors proposed a regulation scheme for these cases based on V2H, considering PHEVs that use an ICE as electrical generators. Initially, it is proposed to provide service to a single household and it is aimed at maximising the energy supplying time. After that, they extrapolated it to a neighbourhood together with PV generation, although no real-time control is specified.

4. Impact on Batteries and Associated Recharging Methodologies

Batteries are the core of an electric vehicle, besides the electrical machine. Thus, their behaviour over time has vital relevance for both technical and economic performance results. Therefore, modelling the behaviour and correct representation of relevant phenomena involved are essential.
In [139], the authors developed an advisory model that compares the level of battery development (specific energy and specific power) and charging level. Thus, it is analysed if major advances in technology allowing greater capacity, and therefore autonomy, would have substantial advantages. The results for the cases chosen by the authors show a greater profitability in the use of fast charging in current batteries.
While users prefer complete charging as frequently as possible accelerating the process of degradation, charging as late as possible tends to minimise the degradation process [140].

4.1. In-Battery Phenomena Modelling

The State of Health (SOH) of a battery quantifies the reduction of the properties of the battery with respect to its original state, this reduction being referred to as degradation. The irreversible degradation of batteries is made up of two fundamental factors: aging due to the consumed lifetime (calendar aging) and due to cycles of use (cycling aging) [140,141]. Table 10 shows the main causes of degradation in a battery. A battery pack has to be replaced when it loses 20–30% of its original storage capacity and drivers needs cannot be met. Once the batteries have reached their End of Life (EoL) to be used in EVs, they can be used in large-scale storage systems or as a backup system in DC chargers since they still have 70–80% of their original capacity [142]. It is known that these two factors: (i) increase the internal resistance and thus reducie the available power (power fading); and (ii) reduce the storage capacity (capacity fading) [140,143]. Lithium-ion batteries used in BEV traction should have 5–10 years of lifetime and support 1000–2000 cycles [143].
The main factors of battery degradation are the temperature, the time, the DoD and the discharge ratio, being the temperature the most relevant. The temperature is influenced by solar radiation, the charge/discharge ratio, the cooling management system (if any), etc., while the DoD is only affected by the use that the driver requires from the battery (travel distance, frequency, driving habits, etc.).
It is important to consider the calendar aging in the batteries of an electric vehicle since the vehicles remain parked 96% of the time [144]. The degradation due to consumed lifetime (calendar aging) is greater at the beginning and decreases as time passes according to Equation (2).
D c a l e n d a r = f · e E a / R T · t β ,
where D c a l e n d a r is the degradation in percentage [%]; f is the pre-exponential factor, which is 14,876 day1/2; E a is the activation energy, which is 24.5 [kJ·mol−1]; R is the gas constant, which is 8.314 [J·mol−1·K−1]; T is the absolute temperature in [K]; t is the time in days; and β corresponds to 1/2 when SEI (Solid Electrolyte Interphase) growth is the dominant ageing mechanism [141,145].
Calendar aging is due to the inevitable decomposition of the compounds present in each cell, specifically to the deposition of lithium ions [33], and depends on the SOC but mostly on the temperature [140,141]. The SOC is related to the voltage of each cell through the open circuit voltage curve, while the relationship between temperature and degradation follows the Arrhenius law [140].
The degradation due to cycling aging only occurs with the use of the batteries and depends mostly on the DoD and the SOC range in which it operates, as well as the charge/discharge current ratio [140]. Equation (3) is usually used to represent this phenomenon.
D c y c l i n g = B 1 · e B 2 · I r a t e · A h , B 1 = a · T 2 + b · T + c , B 2 = d · T + e ,
where D c y c l i n g is the degradation in percentage [%]; a   = 8.89·10−6 [Ah−1 K−2]; b = −0.0053 [Ah−1 K−1]; c = 0.7871 [Ah−1]; d = −0.0067 [Ah−1 K−1]; e = 2.35 [Ah−1]; I r a t e is the charge/discharge rate expressed as a C-rate; and A h is the Ah-throughput (which is expressed as Ah = (cycle number) × (DOD) × (full cell capacity)) [145].
It has been demonstrated that small cycles, approximately 20%, around an average SOC (50% approximately) are much more beneficial than deep cycles. Large variations of the SOC cause the Solid Electrolyte Interphase (SEI) layer to grow and can damage the cathodic material, leading to a power loss [143]. Specifically, for the case of V2G, DoDs lower than 60% are recommended, with a SOC range of 30–90% [23].
The effect of cycle aging is studied in [146]. The study is based on fifty registered cycles of different drivers, which are classified into three categories according to their behaviour: aggressive, mild and gentle. The simulations encompass different cases, considering L1 and L2 chargers as well as frequency regulation, peak shaving and integration of RES acting as storage systems. As a result, it is found that the batteries of the aggressive conductors degrade on average between 23.5% and 38.9% more than the other two categories, and the uncontrolled charging increase the degradation by 15.8%. Additionally, an active thermal management system is recommended, which, depending on the local climate, has more or less influence [143,146].
Temperature is one of the three main parameters of the variation of performance between cells. This variation must be as small as possible because the overall performance of the battery is conditioned by cells with increased degradation. Specifically, it is recommended to maintain the temperature difference among cells of a battery pack below 8 °C. The other two parameters of greatest influence are the Coulombic efficiency and the self-discharge rate, which are defined by the construction process [147].

4.2. V2X Services Provision Consequences in Battery Degradation

The study conducted in [141] shows that uncontrolled charging (G2V) would cause a 31% loss of capacity after ten years, regardless of the type of charger (a L2 charger would have minimal effects compared to an L1 charger). However, when incorporating V2G services, higher degradation is observed. Specifically, after ten years, the degradation increases to 45% with L2 chargers that should provide daily peak shaving services. Nevertheless, it has to be highlighted that this service is usually needed up to 20 times a year. The frequency regulation service would suppose a degradation of 35.03% and 42.56% for L1 and L2 chargers, respectively. The average degradation by frequency regulation services is 0.0010–0.0023% per event depending on the level of the charger, which would cost $0.2–0.46 per event. Helping to mitigate the fluctuations produced by the integration of RES involve capacity losses of 0.0059–0.013% per service. Considering 20 events per year (over ten years), this represents an extra loss of 1.18–2.60% and a cost of $1.18–2.60 per day. These results are collected in Table 11.
The results above show the profitability of V2G services, with the exception of net load shaping, since it requires constant charge/discharge. Assuming 30% as the EOL of the battery, the provision of V2G services supposes a reduction of the time of life of 0.25 years due to peak load shaving, 0.19 years due to frequency regulation and 0.51 years due to net load shaving [141].
The previous results are similar to the aforementioned analysis in [146], where there are no great differences between L1 and L2 charges, and the degradation produced by the peak load saving service is more pronounced than the frequency regulation due to the greater DOD. However, frequency regulation produces higher capacity fade slope. Regarding the integration of RES, the use of EV batteries as storage for photovoltaic generation leads to a degradation of 37%.
In [148], the authors concluded that the cost derived from the degradation of the batteries should be reduced by an order of 10 to be profitable for load shifting. The cost of ageing would have to be about five times less if battery costs were halved.
Regarding battery degradation, some differences between PHEVs and BEVs have been observed. In this sense, degradation in PHEVs is highly dependent on battery capacity, while BEVs show a higher dependency to DoD when providing ancillary services, apart from the energy throughput [149].
Currently, several chemistries are available within Li-Ion technology, of which Lithium-Cobal-Oxide (LCO), Lithium-Iron-Phosphate (LFP), Lithium-Nickel-Manganese-Cobalt (NMC) and Lithium-Nickel-Cobalt-Aluminium-Oxide (NCA) are the best known. LFP represents high power batteries, which seem to be more suitable for V2G, whereas NMC and NCA are the best choice for driving-only EV applications due to their high energy density characteristic. In Reference [150], after testing NCA and LFP cells under several conditions, the following conclusions are obtained:
  • LFP and NCA cell degradation rates are similar for frequency regulation.
  • NCA shows better performance in frequency regulation.
  • LFP shows better performance in peak shaving, less calendar aging and higher round-trip Efficiency (discharge energy/charge energy ratio).
  • Cell resistance evolution is lineal in NCA, but parabolic in LFP.
The effects of combining a realistic driving schedule with mimicking afternoon V2G service in LFP cells are studied in [151]. This study supports the difference standing among chemistries, and its results show that DoD is not of high relevance in the cells tested up to 3C. The main conclusion is that driving can be more harmful than slow constant V2G. Since V2G is not usually given in a constant way, further research is encouraged.

4.3. Battery Degradation Considering Strategies

There are various research works in this field (e.g., [152]). In this study, an algorithm aimed at minimising batteries aging derived from V2G services is developed. The aging model is based on two years of experimental data, and is validated with realistic cycles. The results show that, with a proper control, V2G services can even extend the life of batteries in collaboration with the SG and Battery Management System (BMS), reducing by 9.1% and 12.1% the capacity fade and the power fade, respectively.
In addition, based on experimental data, in [153], the authors characterised a series of batteries differentiating the degradation mechanism depending on different factors (number of charging times, room temperature, if V2G exists, etc.). In their experience, most frequently charging slightly reduces the calendar aging, possibly with a lower cycling ratio. However, V2G services has a greater influence on reducing battery life, up to five years in the case it runs on the two daily peaks of demand, with a 75% of degradation and a resistance increase of 10%. Therefore, the authors concluded by highlighting the relevance of incentives for the promotion of this service and that, in hot climates, it is best to charge as late as possible and not to leave the battery fully charged.
A short but exhaustive review of the two previous papers is presented in [154], which highlights the differences in results despite the apparent similarity of the hypotheses used, as well as the factors not taken into account. On the other hand, the lack of existing regulation related to the subject is claimed, showing the uncertainty of V2G despite the commitments acquired regarding the integration of RES and its compatibility. In turn, and due to the close relationship between the viability of the V2G and the degradation of batteries, further research is encouraged in this area.
Based on the objective of an optimal control of the battery temperature, the authors of [155] designed a charging strategy and compared it with the widely used CC-CV method. This procedure is applied to different charging times and considers the climatic and environmental conditions. The results are very similar for fast charging, but, as charging rate decreases, the improvement is more noticeable.
In [156], a charging strategy is presented with the aim of reducing the total operational cost through nonlinear programming. It considers the effect of calendar aging but not cycling aging. By using the last period strategy in each price step to reduce the temperature of the battery or the average SOC, a cost reduction of up to 73% is achieved. The same authors presented a similar study in [157]. Moreover, charging as late as possible also enables the reduction of CO2 emissions. This reduction is increased when the participation of renewables in the mix is increased [158].
Another study aimed at reducing operational costs while reducing the degradation produced by different chargers in a Battery Swapping Station is presented in [156]. The authors performed a comparative analysis of three different techniques: Particle Swarm Operation (PSO), Varying Population Genetic Algorithm (VPGA) and Varying Population Differential Evolution (VPDE).

5. Research Gap and Further Research Proposal

After analysing the existing literature, certain deficiencies to be met have been detected, which are exposed in this section.
Most of the recharging methodologies presented analyse the impact of vehicles on the electrical system in one or several terms, either in energy or technical aspects. Prior to the definition of the objectives to be achieved, an analysis of the network in terms of strength, sensitivity of parameters and disturbances should be performed. Thus, it would be possible to determine the services that would provide greater benefit to the network. In this sense, it is not possible to assure that a regulation service is the best for all networks.
Many other papers are aimed at reducing the degradation produced in the batteries according to the provision of a specific service. The degradation analysis must be deep enough to contemplate all the consequences of the relevant phenomena. Although the chemical models are more accurate, they add excessive complexity. Thus, it is concluded that a sufficiently detailed thermo-electrical model is needed, including variables such as temperature and instantaneous current to provide results with sufficient accuracy and veracity while computational costs are reduced. This way, the development of optimisation methodologies that would allow an active thermal management, responsible for a large potential in system efficiency improvement, could be carried out.
Finally, although there is much research work done in both fields, no methodology analysed establishes an objective function considering both factors, grid and batteries, in search of an overall optimisation of the system. This issue is important since, in attempting to improve the power quality of the network, the degradation induced to the batteries can make the operation economically or technically unprofitable. In this sense, none of the research works analysed considers a recharging methodology that optimises the operation of a large-scale power system considering techno-economical aspects in a coupled manner, such as battery degradation, losses given in the grid, frequency and voltage stabilisation, peak shaving, etc. This proposed optimisation methodology could consider a dynamically weighed objective function, in which the different weights could be established according to predicted operation patters and restrictions, and updated in real-time according to the needs of the end user, the technical restrictions given at each moment, and all the economic aspects involved.
In short, a methodology that would allow designing a specific charging protocol considering the needs of each network and the batteries health, and that would allow maximising the incomings of all parts involved (end user, DSO, ISO, etc.), is required. Great applicability of this concept can be found, such as domestic collective car parks. The choice of the control strategy is of great relevance. While decentralised methods offer greater scalability and data privacy, they are more limited. On the other hand, centralised methods require communication for optimised management. This relationship is an impediment, as the current power system does not have a communications layer of such magnitude. However, an opportunity for its development is detected.
It is known that power electronics, such as converters installed in electric vehicle chargers, have a negative impact on the network in terms of harmonic generation. In the case of a massive integration, the presence of converters will become critical, and their influence must be studied in depth.
At last, the relocation of the batteries that are no longer suitable for electrical traction is nowadays unknown. Although some research works propose their use for stationary energy storage, further research is required to determine the viability of this application. In this context, in the case the residual economic value of a battery at each point of its SoH were known, then it would be possible to optimise the economic balance, which in turn would enable the choice of the optimum time to perform the battery replacement of an electric vehicle.

6. Conclusions

In this paper, an overview of the current state of the electric vehicle is presented in terms of the effects that charging methodologies have on the network and on the batteries. The existing literature regarding charging strategies has been categorised according to its location, characteristics and considerations. Regarding the battery degradation, the most relevant phenomena have been described, providing an analysis that facilitates the understanding of the complexity of the topic.
The integration of EVs in different power systems is influenced by the market and enables the creation of new business models associated with the management of new services. These services include the management and marketing of energy through aggregators and alternative system operators, as well as the operation of microgrids under V2H, V2B, V2N and V2G concepts.
Location, local power system characteristics or customers profile have to be considered to establish an optimal unidirectional or bidirectional recharging strategy. The future of the applicability of different bidirectional services is directly related to the research efforts and improvements in battery degradation. Thus, the degradation by frequency regulation has been classified as insignificant, making it the most profitable of the services. In turn, once the influence of different charging rates is analysed, it is considered that currently L2 chargers are only indicated for unidirectional load, since in bidirectional flow the degradation in the battery is unfeasible.
The V2B and V2H concepts are presented with special interest for those cases in which RES are available and higher efficiencies and a lower energy costs during charging are demanded, improving the power supply quality. However, there are no standards in this field that regulate or assess its correct implementation.
As far as the life cycle is concerned, it is necessary to give a later end to degraded batteries. Although they are no longer suitable for traction, their materials can be recycled and used for the construction of new units, or they can be used in storage systems where the capacity, power, or total energy are not limiting factors per volume unit.
Most of the strategies proposed, especially aggregator-and multi-agen-based ones, are based on the hypothetical situation of the existence of global communications, which nowadays is not true. The installation of a secure communications channel, with absolute availability and global reach, is a first necessary step for the development of the electric vehicle, and even more for V2G.
Finally, the development of electric mobility responds mainly to the need to reduce emissions. This approach must consider the characteristics of each power system and the origin of its electricity. There may be cases where the transition to electric mobility, far from reducing emissions, increases them, as can happen in coal-based generation systems. Moreover, the focus of emissions shifts from vehicles to energy plants, requiring also an environmental impact analysis. This is why the development of electric mobility is linked to a greater penetration of RES, in order to respond to the new energy demand in an effective, efficient and as clean as possible way.

Author Contributions

Conceptualisation, G.S. and F.J.A.; formal analysis, G.S.; writing—original draft preparation, G.S.; writing—review and editing, F.J.A. and O.O.; visualisation, O.O.; supervision, J.I.S.M. and I.Z; project administration, J.I.S.M and I.Z.; and funding acquisition, J.I.S.M. and I.Z.

Funding

The authors acknowledge the support from the Provincial Council of Gipuzkoa (project Etorkizuna Eraikiz 2019 DGE19/03), the Basque Government (GISEL Research Group IT1083-16), and the University of the Basque Country UPV/EHU (PES16/31 and PES17/08).

Conflicts of Interest

The authors declare no conflict of interest.

Abbreviations

The following abbreviations are used in this manuscript
BEVBattery Electric Vehicle
CC-CVConstant Current and Constant Voltage
CO2eCarbon Dioxide equivalent
DERDistributed Energy Resources
DoDDepth of Discharge
DRDemand Response
DSMDemand Side Management
DSODistribution System Operator
EMElectric Motor
EoLEnd of Life
EVElectric Vehicle
G2VGrid-to-Vehicle
GAGenetic Algorithm
GHGGreenhouse Gases
HEMSHome Energy Management System
HEVHybrid Electric Vehicle
ICEInternal Combustion Engine
ICEVInternal Combustion Engine Vehicle
ISOIndependent System Operator
MGAUMicro Grid Aggregation Unit
MPPMaximum Power Point
PHEVPlug in Hybrid Electric Vehicle
pKmPassenger and kilometre
PSOParticle Swarm Optimisation
REEVRange Extended Electric Vehicle
RESRenewable Energies Sources
SOCState of Charge
SOHState of Health
TSOTransport System Operator
V2BVehicle-to-Building
V2GVehicle-to-Grid
V2HVehicle-to-Home
V2VVehicle-to-Vehicle
VPPVirtual Power Plant

References

  1. Global Carbon Project 2018. Analysis: Global CO2 Emissions Set to Rise 2% in 2017 after Three-Year ‘Plateau’. Available online: https://www.carbonbrief.org/analysis-global-co2-emissions-set-to-rise-2-percent-in-2017-following-three-year-plateau (accessed on 18 August 2018).
  2. IEA. Energy Technology Perspectives 2017: Catalysing Energy Technology Transformations; IEA: Paris, France, 2017. [Google Scholar]
  3. OECD Publishing. World Energy Statistics 2017; IEA: Paris, France, 2017. [Google Scholar]
  4. Environmental Assessment of Plug-In Hybrid Electric Vehicles: Nationwide Greenhouse Gas Emissions (1015325); Final Report; EPRI: Palo Alto, CA, USA, 2007.
  5. Ma, H.; Balthasar, F.; Tait, N.; Riera-Palou, X.; Harrison, A. A new comparison between the life cycle greenhouse gas emissions of battery electric vehicles and internal combustion vehicles. Energy Policy 2012, 44, 160–173. [Google Scholar] [CrossRef]
  6. Compare Your Country. OECD. Available online: http://www.compareyourcountry.org/climate-policies?cr=oecd&lg=en&page=2# (accessed on 25 August 2018).
  7. EU, Electricity Prices by Type of Users. Medium Size Households, European Union. Available online: https://ec.europa.eu/eurostat/tgm/table.do?tab=table&plugin=1&language=en&pcode=ten00117 (accessed on 15 September 2018).
  8. Canadian Electricity Association, Canada’s Electricity Industry, Ottawa, ON, Canada. 2016. Available online: https://me.queensu.ca/Courses/MECH4301/Electricity101%20Report%20of%20Candian%20Electrical%20Association.pdf (accessed on 25 June 2019).
  9. IRENA. Remap 2030 Renewable Energy Prospects for the Russian Federation, Working Paper; IRENA: Abu Dhabi, UAE, 2017. [Google Scholar]
  10. Fridley, D.; Lu, H.; Liu, X. Key China Energy Statistics 2016. LBNL China Energy Group, 2017. Available online: https://china.lbl.gov/publications/key-china-energy-statistics-2016 (accessed on 25 June 2019).
  11. Yong, J.Y.; Ramachandaramurthy, V.K.; Tan, K.M.; Mithulananthan, N. A review on the state-of-the-art technologies of electric vehicle, its impacts and prospects. Renew. Sustain. Energy Rev. 2015, 49, 365–385. [Google Scholar] [CrossRef]
  12. Liu, L.; Liu, X.; Kong, F.; Peng, Y.; Wang, Q. A review on electric vehicles interacting with renewable energy in smart grid. Renew. Sustain. Energy Rev. 2015, 51, 648–661. [Google Scholar] [CrossRef]
  13. García-Villalobos, J.; Zamora, I.; San Martín, J.I.; Asensio, F.J.; Aperribay, V. Plug-in electric vehicles in electric distribution networks: A review of smart charging approaches. Renew. Sustain. Energy Rev. 2014, 38, 717–731. [Google Scholar] [CrossRef]
  14. Martínez-Lao, J.; Montoya, F.G.; Montoya, M.G.; Manzano-Agugliaro, F. Electric vehicles in Spain: An overview of charging systems. Renew. Sustain. Energy Rev. 2017, 77, 970–983. [Google Scholar] [CrossRef]
  15. Yang, Z.; Li, K.; Foley, A. Computational scheduling methods for integrating plug-in electric vehicles with power systems: A review. Renew. Sustain. Energy Rev. 2015, 51, 396–416. [Google Scholar] [CrossRef]
  16. Shaukat, N.; Khan, J.; Khan, B.; Ali, S.M.; Mehmood, C.A.; Farid, U.; Majid, M.; Anwar, S.M.; Jawad, M.; Ullah, Z. A survey on electric vehicle transportation within smart grid system. Renew. Sustain. Energy Rev. 2018, 81, 1329–1349. [Google Scholar] [CrossRef]
  17. Mwasilu, F.; Justo, J.J.; Kim, E.; Do, T.D.; Jung, J. Electric vehicles and smart grid interaction: A review on vehicle to grid and renewable energy sources integration. Renew. Sustain. Energy Rev. 2014, 34, 501–516. [Google Scholar] [CrossRef]
  18. Richardson, D.B. Electric vehicles and the electric grid: A review of modeling approaches, Impacts, and renewable energy integration. Renew. Sustain. Energy Rev. 2013, 19, 247–254. [Google Scholar] [CrossRef]
  19. Mahmud, K.; Town, G.E.; Morsalin, S.; Hossain, M.J. Integration of electric vehicles and management in the internet of energy. Renew. Sustain. Energy Rev. 2018, 82, 4179–4203. [Google Scholar] [CrossRef]
  20. Shareef, H.; Islam, M.M.; Mohamed, A. A review of the stage-of-the-art charging technologies, placement methodologies, and impacts of electric vehicles. Renew. Sustain. Energy Rev. 2016, 64, 403–420. [Google Scholar] [CrossRef]
  21. Habib, S.; Kamran, M.; Rashid, U. Impact analysis of vehicle-to-grid technology and charging strategies of electric vehicles on distribution networks—A review. J. Power Sources 2015, 277, 205–214. [Google Scholar] [CrossRef]
  22. Hu, J.; Morais, H.; Sousa, T.; Lind, M. Electric vehicle fleet management in smart grids: A review of services, optimization and control aspects. Renew. Sustain. Energy Rev. 2016, 56, 1207–1226. [Google Scholar] [CrossRef] [Green Version]
  23. Tan, K.M.; Ramachandaramurthy, V.K.; Yong, J.Y. Integration of electric vehicles in smart grid: A review on vehicle to grid technologies and optimization techniques. Renew. Sustain. Energy Rev. 2016, 53, 720–732. [Google Scholar] [CrossRef]
  24. Green, R.C.; Wang, L.; Alam, M. The impact of plug-in hybrid electric vehicles on distribution networks: A review and outlook. Renew. Sustain. Energy Rev. 2011, 15, 544–553. [Google Scholar] [CrossRef]
  25. Rahman, I.; Vasant, P.M.; Singh, B.S.; Abdullah-Al-Wadud, M.; Adnan, N. Review of recent trends in optimization techniques for plug-in hybrid, and electric vehicle charging infrastructures. Renew. Sustain. Energy Rev. 2016, 58, 1039–1047. [Google Scholar] [CrossRef]
  26. Aghaei, J.; Nezhad, A.E.; Rabiee, A.; Rahimi, E. Contribution of Plug-in Hybrid Electric Vehicles in power system uncertainty management. Renew. Sustain. Energy Rev. 2016, 59, 450–458. [Google Scholar] [CrossRef]
  27. Hannan, M.A.; Azidin, F.A.; Mohamed, A. Hybrid electric vehicles and their challenges: A review. Renew. Sustain. Energy Rev. 2014, 29, 135–150. [Google Scholar] [CrossRef]
  28. Sabri, M.F.M.; Danapalasingam, K.A.; Rahmat, M.F. A review on hybrid electric vehicles architecture and energy management strategies. Renew. Sustain. Energy Rev. 2016, 53, 1433–1442. [Google Scholar] [CrossRef]
  29. Peng, C.; Zou, J.; Lian, L. Dispatching strategies of electric vehicles participating in frequency regulation on power grid: A review. Renew. Sustain. Energy Rev. 2017, 68, 147–152. [Google Scholar] [CrossRef]
  30. Shafie-khah, M.; Neyestani, N.; Damavandi, M.Y.; Gil, F.A.S.; Catalão, J.P.S. Economic and technical aspects of plug-in electric vehicles in electricity markets. Renew. Sustain. Energy Rev. 2016, 53, 1168–1177. [Google Scholar] [CrossRef]
  31. Yilmaz, M.; Krein, P.T. Review of the Impact of Vehicle-to-Grid Technologies on Distribution Systems and Utility Interfaces. TPEL 2013, 28, 5673–5689. [Google Scholar] [CrossRef]
  32. Su, W.; Eichi, H.; Zeng, W.; Chou, M.Y. A Survey on the Electrification of Transportation in a Smart Grid Environment. TII 2012, 8, 1–10. [Google Scholar] [CrossRef]
  33. Ahmadian, A.; Sedghi, M.; Elkamel, A.; Fowler, M.; Aliakbar Golkar, M. Plug-in electric vehicle batteries degradation modeling for smart grid studies: Review, assessment and conceptual framework. Renew. Sustain. Energy Rev. 2018, 81, 2609–2624. [Google Scholar] [CrossRef]
  34. Ashique, R.H.; Salam, Z.; Bin Abdul Aziz, M.J.; Bhatti, A.R. Integrated photovoltaic-grid dc fast charging system for electric vehicle: A review of the architecture and control. Renew. Sustain. Energy Rev. 2017, 69, 1243–1257. [Google Scholar] [CrossRef]
  35. Cecati, C.; Mokryani, G.; Piccolo, A.; Siano, P. An overview on the smart grid concept. In Proceedings of the 36th Annual Conference of the IEEE Industrial Electronics Society (IECON 2010), Glendale, AZ, USA, 7–10 November 2010; pp. 3322–3327. [Google Scholar]
  36. Sun, Q.; Ge, X.; Liu, L.; Xu, X.; Zhang, Y.; Niu, R.; Zeng, Y. Review of Smart Grid Comprehensive Assessment Systems. Energy Proced. 2011, 12, 219–229. [Google Scholar] [CrossRef] [Green Version]
  37. Wen, M.H.F.; Leung, K.C.; Li, V.O.K.; He, X.; Kuo, C.C.J. A survey on smart grid communication system. APSIPA Trans. Signal Inf. Process. 2015, 4, e5. [Google Scholar] [CrossRef]
  38. Ramesh, V. A Smart Survey on Demand Response Potential in Global Energy Market. Indian J. Sci. Technol. 2015, 8, 474–483. [Google Scholar]
  39. Mahmoudzadeh Andwari, A.; Pesiridis, A.; Rajoo, S.; Martinez-Botas, R.; Esfahanian, V. A review of Battery Electric Vehicle technology and readiness levels. Renew. Sustain. Energy Rev. 2017, 78, 414–430. [Google Scholar] [CrossRef]
  40. Hoarau, Q.; Perez, Y. Interactions between electric mobility and photovoltaic generation: A review. Renew. Sustain. Energy Rev. 2018, 94, 510–522. [Google Scholar] [CrossRef] [Green Version]
  41. Zhang, X.; Wang, Q.; Xu, G.; Wu, Z. A review of plug-in electric vehicles as distributed energy storages in smart grid. In Proceedings of the 5th IEEE PES Innovative Smart Grid Technologies (ISGT) European 2014 Conference, Istanbul, Turkey, 12–15 October 2014. [Google Scholar]
  42. Sujitha, N.; Krithiga, S. RES based EV battery charging system: A review. Renew. Sustain. Energy Rev. 2017, 75, 978–988. [Google Scholar] [CrossRef]
  43. European Commission. Communication from the Commission to the European Parliament, the Council, the European Economic and Social Committee and the Committee of the Regions. Energy Roadmap 2050; European Commission: Brussels, Belguim, 2011. [Google Scholar]
  44. Darabi, Z.; Ferdowsi, M. Aggregated Impact of Plug-in Hybrid Electric Vehicles on Electricity Demand Profile. TSTE 2011, 2, 501–508. [Google Scholar] [CrossRef]
  45. Poullikkas, A. Sustainable options for electric vehicle technologies. Renew. Sustain. Energy Rev. 2015, 41, 1277–1287. [Google Scholar] [CrossRef]
  46. IEA. Global EV Outlook 2018; IEA: Paris, France, 2018. [Google Scholar]
  47. IEA. Nordic EV Outlook 2018; IEA: Paris, France, 2018. [Google Scholar]
  48. Pasaoglu Kilanc, G.; Fiorello, D.; Martino, A.; Scarcella, G.; Alemanno, A.; Zubaryeva, A.; Thiel, C. Driving and Parking Patterns of European Car Drivers—A Mobility Survey; LD-NA-25627-EN-N, EUR—Scientific and Technical Research Reports; European Commission, Publications Office of the European Union: Brussels, Belguim, 2012. [Google Scholar]
  49. Eberle, D.U.; von Helmolt, D.R. Sustainable transportation based on electric vehicle concepts: A brief overview. Energy Environ. Sci. 2010, 3, 689–699. [Google Scholar] [CrossRef]
  50. Needell, Z.A.; McNerney, J.; Chang, M.T.; Trancik, J.E. Potential for widespread electrification of personal vehicle travel in the United States. Nat. Energy 2016, 1, 16112. [Google Scholar] [CrossRef]
  51. Clement-Nyns, K.; Haesen, E.; Driesen, J. The Impact of Charging Plug-In Hybrid Electric Vehicles on a Residential Distribution Grid. TPWRS 2010, 25, 371–380. [Google Scholar] [CrossRef]
  52. Gonzalez Vaya, M.; Galus, M.D.; Waraich, R.A.; Andersson, G. On the interdependence of intelligent charging approaches for plug-in electric vehicles in transmission and distribution networks. In Proceedings of the 2012 IEEE PES Innovative Smart Grid Technologies (ISGT Europe 2012), Berlin, Germany, 14–17 October 2012; pp. 1–8. [Google Scholar]
  53. Deilami, S.; Masoum, A.S.; Moses, P.S.; Masoum, M.A.S. Real-Time Coordination of Plug-In Electric Vehicle Charging in Smart Grids to Minimize Power Losses and Improve Voltage Profile. In Proceedings of the 2011 IEEE PES Innovative Smart Grid Technologies (ISGT Europe 2011), Manchester, UK, 5–7 December 2011; Volume 2, pp. 456–467. [Google Scholar]
  54. Vega Ayala, H.E.; Garcia Barriga, N. Study of the impact of electric vehicles fleets in HV electric power grids based on an uncontrolled charging strategy. In Proceedings of the 2017 IEEE Autumn Meeting on Power, Electronics and Computing (ROPEC), Ixtapa, Mexico, 8–10 November 2017; pp. 1–6. [Google Scholar]
  55. Nour, M.; Ramadan, H.; Ali, A.; Farkas, C. Impacts of plug-in electric vehicles charging on low voltage distribution network. In Proceedings of the 2018 International Conference on Innovative Trends in Computer Engineering (ITCE’2018), Aswan, Egypt, 19–21 February 2018; pp. 357–362. [Google Scholar]
  56. Yang, J.; He, L.; Fu, S. An improved PSO-based charging strategy of electric vehicles in electrical distribution grid. Appl. Energy 2014, 128, 82–92. [Google Scholar] [CrossRef]
  57. Ma, Z.; Callaway, D.; Hiskens, I. Decentralized charging control for large populations of plug-in electric vehicles: Application of the Nash certainty equivalence principle. In Proceedings of the 2010 IEEE International Conference on Control Applications (CCA), Yokohama, Japan, 8–10 September 2010; pp. 191–195. [Google Scholar]
  58. Ma, Z. Decentralized valley-fill charging control of large-population plug-in electric vehicles. In Proceedings of the 2012 24th Chinese Control and Decision Conference (CCDC), Taiyuan, China, 23–25 May 2012; pp. 821–826. [Google Scholar]
  59. Xie, K.; Dong, L.; Liao, X.; Gao, Z.; Gao, Y. Game-based Decentralised Charging Control for Large Populations of Electric Vehicles. PE 2012, 7, 252. [Google Scholar]
  60. Richardson, P.; Flynn, D.; Keane, A. Local Versus Centralized Charging Strategies for Electric Vehicles in Low Voltage Distribution Systems. In Proceedings of the 2012 IEEE PES Innovative Smart Grid Technologies (ISGT Europe 2012), Berlin, Germany, 14–17 October 2012; Volume 3, pp. 1020–1028. [Google Scholar]
  61. Gan, L.W.; Topcu, U.; Low, S.H. Optimal Decentralized Protocol for Electric Vehicle Charging. TPWRS 2013, 28, 940–951. [Google Scholar] [CrossRef]
  62. Sheikhi, A.; Bahrami, S.; Ranjbar, A.M.; Oraee, H. Strategic charging method for plugged in hybrid electric vehicles in smart grids; a game theoretic approach. Int. J. Electr. Power 2013, 53, 499–506. [Google Scholar] [CrossRef]
  63. Grau Unda, I.; Papadopoulos, P.; Skarvelis-Kazakos, S.; Cipcigan, L.M.; Jenkins, N.; Zabala, E. Management of electric vehicle battery charging in distribution networks with multi-agent systems. Electr. Power Syst. Res. 2014, 110, 172–179. [Google Scholar] [CrossRef]
  64. Dallinger, D.; Wietschel, M. Grid integration of intermittent renewable energy sources using price-responsive plug-in electric vehicles. Renew. Sustain. Energy Rev. 2012, 16, 3370–3382. [Google Scholar] [CrossRef] [Green Version]
  65. Beaude, O.; He, Y.; Hennebel, M. Introducing decentralized EV charging coordination for the voltage regulation. In Proceedings of the 4th IEEE PES ISGT Europe, Copenhagen, Denmark, 6–9 October 2013. [Google Scholar]
  66. Liu, M.; Phanivong, P.K.; Callaway, D.S. Electric vehicle charging control in residential distribution network: A decentralized event-driven realization. In Proceedings of the 2017 IEEE 56th Annual Conference on Decision and Control (CDC), Melbourne, Australia, 12–15 December 2017; pp. 214–219. [Google Scholar]
  67. Faddel, S.; Mohamed, A.A.S.; Mohammed, O. Linear autonomous control of electric vehicles charging in distribution systems. In Proceedings of the 2017 IEEE Power & Energy Society General Meeting (PESGM), Chicago, IL, USA, 16–20 July 2017. [Google Scholar]
  68. Zhang, K.; Xu, L.; Ouyang, M.; Wang, H.; Lu, L.; Li, Z.; Li, J. Optimal decentralized valley-filling charging strategy for electric vehicles. Energy Convers. Manag. 2014, 78, 537–550. [Google Scholar] [CrossRef]
  69. Geth, F.; Leemput, N.; Van Roy, J.; Buscher, J.; Ponnette, R.; Driesen, J. Voltage droop charging of electric vehicles in a residential distribution feeder. In Proceedings of the 2012 IEEE PES Innovative Smart Grid Technologies (ISGT Europe 2012), Berlin, Germany, 14–17 October 2012. [Google Scholar]
  70. Ahn, C.; Li, C.; Peng, H. Optimal decentralized charging control algorithm for electrified vehicles connected to smart grid. J. Power Sources 2011, 196, 10369–10379. [Google Scholar] [CrossRef]
  71. Shaaban, M.F.; Ismail, M.; El-Saadany, E.F.; Zhuang, W. Real-Time PEV Charging/Discharging Coordination in Smart Distribution Systems. TSG 2014, 5, 1797–1807. [Google Scholar] [CrossRef]
  72. Oliveira, D.Q.; Zambroni de Souza, A.C.; Delboni, L.F.N. Optimal plug-in hybrid electric vehicles recharge in distribution power systems. Electr. Power Syst. Res. 2013, 98, 77–85. [Google Scholar] [CrossRef]
  73. Lopes, J.A.P.; Soares, F.J.; Almeida, P.M.R. Integration of Electric Vehicles in the Electric Power System. JPROC 2011, 99, 168–183. [Google Scholar] [CrossRef]
  74. Pecas Lopes, J.A.; Rocha Almeida, P.M.; Soares, F.J. Using vehicle-to-grid to maximize the integration of intermittent renewable energy resources in islanded electric grids. In Proceedings of the International Conference on Clean Electrical Power (ICCEP 2009), Capri, Italy, 9–11 June 2009; pp. 290–295. [Google Scholar]
  75. Pillai, J.R.; Bak-Jensen, B. Vehicle-to-Grid for islanded power system operation in Bornholm. In Proceedings of the IEEE PES General Meeting, Providence, RI, USA, 25–29 July 2010. [Google Scholar]
  76. Luo, X.; Xia, S.; Chan, K.W. A decentralized charging control strategy for plug-in electric vehicles to mitigate wind farm intermittency and enhance frequency regulation. J. Power Sources 2014, 248, 604–614. [Google Scholar] [CrossRef]
  77. Liu, H.; Hu, Z.; Song, Y.; Lin, J. Decentralized Vehicle-to-Grid Control for Primary Frequency Regulation Considering Charging Demands. TPWRS 2013, 28, 3480–3489. [Google Scholar] [CrossRef]
  78. Di Giorgio, A.; Liberati, F.; Canale, S. Electric vehicles charging control in a smart grid: A model predictive control approach. Control. Eng. Pract. 2014, 22, 147–162. [Google Scholar] [CrossRef]
  79. Subramanian, A.; Garcia, M.; Dominguez-Garcia, A.; Callaway, D.; Poolla, K.; Varaiya, P. Real-time scheduling of deferrable electric loads. In Proceedings of the 2012 American Control Conference (ACC), Montreal, QC, Canada, 27–29 June 2012; pp. 3643–3650. [Google Scholar]
  80. Jiang, R.; Zhang, Z.; Li, J.; Zhang, Y.; Huang, Q. A coordinated charging strategy for electric vehicles based on multi-objective optimization. In Proceedings of the 2017 2nd International Conference on Power and Renewable Energy (ICPRE), Chengdu, China, 20–23 September 2017; pp. 823–827. [Google Scholar]
  81. Torres-Sanz, V.; Sanguesa, J.A.; Martinez, F.J.; Garrido, P.; Marquez-Barja, J.M. Enhancing the Charging Process of Electric Vehicles at Residential Homes. Access 2018, 6, 22875–22888. [Google Scholar] [CrossRef]
  82. Zhang, L.; Li, Y. Optimal Management for Parking-Lot Electric Vehicle Charging by Two-Stage Approximate Dynamic Programming. TSG 2017, 8, 1722–1730. [Google Scholar] [CrossRef]
  83. Sundstrom, O.; Binding, C. Flexible Charging Optimization for Electric Vehicles Considering Distribution Grid Constraints. TSG 2012, 3, 26–37. [Google Scholar] [CrossRef]
  84. Amiri, S.S.; Jadid, S. Optimal charging schedule of electric vehicles at battery swapping stations in a smart distribution network. In Proceedings of the 2017 Smart Grid Conference (SGC), Tehran, Iran, 20–21 December 2017. [Google Scholar]
  85. Wu, D.; Aliprantis, D.C.; Ying, L. Load Scheduling and Dispatch for Aggregators of Plug-In Electric Vehicles. TSG 2012, 3, 368–376. [Google Scholar] [CrossRef]
  86. Sortomme, E.; El-Sharkawi, M.A. Optimal Charging Strategies for Unidirectional Vehicle-to-Grid. TSG 2011, 2, 131–138. [Google Scholar] [CrossRef]
  87. Goyal, P.; Sharma, A.; Vyas, S.; Kumar, R. Customer and aggregator balanced dynamic Electric Vehicle charge scheduling in a smart grid framework. In Proceedings of the 2016 International Conference on Electrical Power and Energy Systems (ICEPES 2016), Bhopal, India, 14–16 December 2016; pp. 276–283. [Google Scholar]
  88. Zhou, K.; Cai, L. Randomized PHEV Charging Under Distribution Grid Constraints. TSG 2014, 5, 879–887. [Google Scholar] [CrossRef]
  89. Li, W.J.; Tan, X.; Sun, B.; Tsang, D.H.K. Optimal power dispatch of a centralised electric vehicle battery charging station with renewables. IET Commun. 2018, 12, 579–585. [Google Scholar]
  90. Wu, H.; Pang, G.K.H.; Choy, K.L.; Lam, H.Y. A scheduling and control system for electric vehicle charging at parking lot. In Proceedings of the 2017 11th Asian Control Conference (ASCC), Gold Coast, QLD, Australia, 17–20 December 2017; pp. 13–18. [Google Scholar]
  91. Huo, Y.; Bouffard, F.; Joos, G. An energy management approach for electric vehicle fast charging station. In Proceedings of the 2017 IEEE Electrical Power and Energy Conference (EPEC), Saskatoon, SK, Canada, 22–25 October 2017. [Google Scholar]
  92. O’Connell, A.; Flynn, D.; Richardson, P.; Keane, A. Controlled charging of electric vehicles in residential distribution networks. In Proceedings of the 2012 IEEE PES Innovative Smart Grid Technologies (ISGT Europe 2012), Berlin, Germany, 14–17 October 2012. [Google Scholar]
  93. Chunlin, G.; Dequan, H.; Qinbo, Y.; Zhou, M. Dynamic sorting intelligent charging control strategy of electric vehicles based on time-of-use price. In Proceedings of the 2017 China International Electrical and Energy Conference (CIEEC), Beijing, China, 25–27 October 2017; pp. 199–204. [Google Scholar]
  94. Liao, C.; Yang, B. Phases-Controlled Coordinated Charging Method for Electric Vehicles. CES TEMS 2018, 2, 3–12. [Google Scholar]
  95. Mets, K.; Verschueren, T.; Haerick, W.; Develder, C.; De Turck, F. Optimizing smart energy control strategies for plug-in hybrid electric vehicle charging. In Proceedings of the 2010 Network Operations and Management Symposium Workshops (NOMSW), Osaka, Japan, 19–23 April 2010; pp. 293–299. [Google Scholar]
  96. Zhang, W.; Dreise, C.; Shao, R.; Chang, L. An improved minimum-cost charging schedule for large-scale penetration of electric vehicles. In Proceedings of the APEC Mar 2018, San Antonio, TX, USA, 4–8 March 2018; pp. 3411–3417. [Google Scholar]
  97. Shukla, R.M.; Sengupta, S.; Patra, A.N. Smart plug-in electric vehicle charging to reduce electric load variation at a parking place. In Proceedings of the 2018 IEEE Applied Power Electronics Conference and Exposition (APEC), San Antonio, TX, USA, 4–8 January 2018; pp. 632–638. [Google Scholar]
  98. Fan, Z. A Distributed Demand Response Algorithm and Its Application to PHEV Charging in Smart Grids. TSG 2012, 3, 1280–1290. [Google Scholar] [CrossRef]
  99. Zhang, P.; Qian, K.; Zhou, C.; Stewart, B.G.; Hepburn, D.M. A Methodology for Optimization of Power Systems Demand Due to Electric Vehicle Charging Load. TPWRS 2012, 27, 1628–1636. [Google Scholar] [CrossRef]
  100. O’Connell, A.; Flynn, D.; Keane, A. Rolling Multi-Period Optimization to Control Electric Vehicle Charging in Distribution Networks. TPWRS 2014, 29, 340–348. [Google Scholar]
  101. Mahat, P.; Handl, M.; Kanstrup, K.R.; Lozano, A.P.; Sleimovits, A. Price based electric vehicle charging. In Proceedings of the 2012 IEEE Power and Energy Society General Meeting (PESGM), San Diego, CA, USA, 22–26 July 2012. [Google Scholar]
  102. Valentine, K.; Temple, W.G.; Zhang, K.M. Intelligent electric vehicle charging: Rethinking the valley-fill. J. Power Sources 2011, 196, 10717–10726. [Google Scholar] [CrossRef]
  103. Mao, T.; Lau, W.H.; Shum, C.; Chung, H.; Tsang, K.F.; Tse, N.C.F. A new schedule-controlled strategy for charging large number of EVs with load shifting and voltage regulation. In Proceedings of the 2015 IEEE PES Asia-Pacific Power and Energy Engineering Conference (APPEEC), Brisbane, Australia, 15–18 November 2015. [Google Scholar]
  104. Sortomme, E.; Hindi, M.M.; MacPherson, S.D.J.; Venkata, S.S. Coordinated Charging of Plug-In Hybrid Electric Vehicles to Minimize Distribution System Losses. TSG 2011, 2, 198–205. [Google Scholar] [CrossRef]
  105. Zhang, A.; Sun, B.; Liu, T.; Tan, X.; Wang, S.; Tsang, D.H.K. Joint voltage and frequency regulation by EV charging scheduling in the distribution network. In Proceedings of the 2018 IEEE Power & Energy Society Innovative Smart Grid Technologies Conference (ISGT), Washington, DC, USA, 19–22 February 2018. [Google Scholar]
  106. Momber, I.; Gomez, T.; Soder, L. PEV fleet scheduling with electricity market and grid signals Charging schedules with capacity pricing based on DSO’s long run marginal cost. In Proceedings of the 2013 10th International Conference on the European Energy Market (EEM), Stockholm, Sweden, 27–31 May 2013. [Google Scholar]
  107. Wang, J.; Bharati, G.R.; Paudyal, S.; Ceylan, O.; Bhattarai, B.P.; Myers, K.S. Coordinated Electric Vehicle Charging with Reactive Power Support to Distribution Grids. TII 2018, 15, 54–63. [Google Scholar] [CrossRef]
  108. Soares, F.J.; Almeida, P.M.R.; Lopes, J.A.P. Quasi-real-time management of Electric Vehicles charging. Electr. Power Syst. Res. 2014, 108, 293–303. [Google Scholar] [CrossRef] [Green Version]
  109. Logenthiran, T.; Srinivasan, D. Multi-agent system for managing a power distribution system with Plug-in Hybrid Electrical vehicles in smart grid. In Proceedings of the ISET-India, Kollam, India, 1–3 December 2011; pp. 346–351. [Google Scholar]
  110. Iversen, E.B.; Morales, J.M.; Madsen, H. Optimal charging of an electric vehicle using a Markov decision process. Appl. Energy 2014, 123, 1–12. [Google Scholar] [CrossRef] [Green Version]
  111. Zakariazadeh, A.; Jadid, S.; Siano, P. Multi-objective scheduling of electric vehicles in smart distribution system. Energy Convers. Manag. 2014, 79, 43–53. [Google Scholar] [CrossRef]
  112. Wang, Z.; Wang, S. Grid Power Peak Shaving and Valley Filling Using Vehicle-to-Grid Systems. TPWRD 2013, 28, 1822–1829. [Google Scholar]
  113. He, Y.; Venkatesh, B.; Guan, L. Optimal Scheduling for Charging and Discharging of Electric Vehicles. TSG 2012, 3, 1095–1105. [Google Scholar] [CrossRef]
  114. Rivera, J.; Wolfrum, P.; Hirche, S.; Goebel, C.; Jacobsen, H. Alternating Direction Method of Multipliers for decentralized electric vehicle charging control. In Proceedings of the 52nd IEEE Conference on Decision and Control (CDC), Florence, Italy, 10–13 December 2013; pp. 6960–6965. [Google Scholar]
  115. Rotering, N.; Ilic, M. Optimal Charge Control of Plug-In Hybrid Electric Vehicles in Deregulated Electricity Markets. TPWRS 2011, 26, 1021–1029. [Google Scholar] [CrossRef]
  116. Harris, C.B.; Webber, M.E. The sensitivity of vehicle-to-grid revenues to plug-in electric vehicle battery size and EVSE power rating. In Proceedings of the 2014 IEEE PES General Meeting (PESGM), National Harbor, MD, USA, 27–31 July 2014. [Google Scholar]
  117. Kaur, K.; Kumar, N.; Singh, M. Coordinated Power Control of Electric Vehicles for Grid Frequency Support: MILP-based Hierarchical Control Design. TSG 2018, 10, 3364–3373. [Google Scholar] [CrossRef]
  118. ur Rehman, U.; Riaz, M. Real time controlling algorithm for vehicle to grid system under price uncertainties. In Proceedings of the ICPESG, Mirpur Azad Kashmir, Pakistan, 9–10 April 2018; pp. 1–7. [Google Scholar]
  119. Shi, W.; Wong, V.W.S. Real-time vehicle-to-grid control algorithm under price uncertainty. In Proceedings of the SmartGridComm, Brussels, Belgium, 17–20 October 2011; pp. 261–266. [Google Scholar]
  120. Kang, J.; Duncan, S.J.; Mavris, D.N. Real-time Scheduling Techniques for Electric Vehicle Charging in Support of Frequency Regulation. Procedia Comput. Sci. 2013, 16, 767–775. [Google Scholar] [CrossRef] [Green Version]
  121. Han, S.; Han, S.; Sezaki, K. Development of an Optimal Vehicle-to-Grid Aggregator for Frequency Regulation. TSG 2010, 1, 65–72. [Google Scholar]
  122. Tokudome, M.; Tanaka, K.; Senjyu, T.; Yona, A.; Funabashi, T.; Chul-Hwan, K. Frequency and voltage control of small power systems by decentralized controllable loads. In Proceedings of the 2009 International Conference on Power Electronics and Drive Systems (PEDS), Taipei, Taiwan, 2–5 November 2009; pp. 666–671. [Google Scholar]
  123. UK Parliament. Electricity Market Reform: Capacity Market—Detailed Design Proposals; Command Paper; UK Parliament: London, UK, 2013. [Google Scholar]
  124. Singh, M.; Kumar, P.; Kar, I. Implementation of Vehicle to Grid Infrastructure Using Fuzzy Logic Controller. TSG 2012, 3, 565–577. [Google Scholar] [CrossRef]
  125. Paudyal, S.; Ceylan, O.; Bhattarai, B.P.; Myers, K.S. Optimal coordinated EV charging with reactive power support in constrained distribution grids. In Proceedings of the 2017 IEEE Power & Energy Society General Meeting (PESGM), Chicago, IL, USA, 16–20 July 2017. [Google Scholar]
  126. Shinde, P.; Swarup, K.S. Optimal Electric Vehicle charging schedule for demand side management. In Proceedings of the 2016 First International Conference on Sustainable Green Buildings and Communities (SGBC), Chennai, India, 18–20 December 2016. [Google Scholar]
  127. Jian, L.; Zhu, X.; Shao, Z.; Niu, S.; Chan, C.C. A scenario of vehicle-to-grid implementation and its double-layer optimal charging strategy for minimizing load variance within regional smart grids. Energy Convers. Manag. 2014, 78, 508–517. [Google Scholar] [CrossRef]
  128. Pavić, I.; Capuder, T.; Kuzle, I. Value of flexible electric vehicles in providing spinning reserve services. Appl. Energy 2015, 157, 60–74. [Google Scholar] [CrossRef]
  129. Shafie-Khah, M.; Siano, P.; Fitiwi, D.Z.; Mahmoudi, N.; Catalao, J.P.S. An Innovative Two-Level Model for Electric Vehicle Parking Lots in Distribution Systems with Renewable Energy. TSG 2018, 9, 1506–1520. [Google Scholar]
  130. Tanguy, K.; Dubois, M.R.; Lopez, K.L.; Gagné, C. Optimization model and economic assessment of collaborative charging using Vehicle-to-Building. Sustain. Cities Soc. 2016, 26, 496–506. [Google Scholar] [CrossRef]
  131. Nguyen, H.K.; Song, J.B. Optimal charging and discharging for multiple PHEVs with demand side management in vehicle-to-building. JCN 2012, 14, 662–671. [Google Scholar] [CrossRef]
  132. Kuang, Y.; Hu, M.; Dai, R.; Yang, D. A Collaborative Decision Model for Electric Vehicle to Building Integration. Energy Proced. 2017, 105, 2077–2082. [Google Scholar] [CrossRef]
  133. Wu, D.; Zeng, H.; Lu, C.; Boulet, B. Two-Stage Energy Management for Office Buildings With Workplace EV Charging and Renewable Energy. TTE 2017, 3, 225–237. [Google Scholar]
  134. Yan, Q.; Zhang, B.; Kezunovic, M. Optimized Operational Cost Reduction for an EV Charging Station Integrated with Battery Energy Storage and PV generation. TSG 2017, 10, 2096–2106. [Google Scholar] [CrossRef]
  135. Erdinc, O.; Paterakis, N.G.; Mendes, T.D.P.; Bakirtzis, A.G.; Catalao, J.P.S. Smart Household Operation Considering Bi-Directional EV and ESS Utilization by Real-Time Pricing-Based DR. TSG 2015, 6, 1281–1291. [Google Scholar] [CrossRef]
  136. Wu, X.; Hu, X.; Teng, Y.; Qian, S.; Cheng, R. Optimal integration of a hybrid solar-battery power source into smart home nanogrid with plug-in electric vehicle. J. Power Sources 2017, 363, 277–283. [Google Scholar] [CrossRef] [Green Version]
  137. Pal, S.; Kumar, R. Electric Vehicle Scheduling Strategy in Residential Demand Response Programs with Neighbor Connection. TII 2018, 14, 980–988. [Google Scholar] [CrossRef]
  138. Shin, H.; Baldick, R. Plug-In Electric Vehicle to Home (V2H) Operation Under a Grid Outage. TSG 2017, 8, 2032–2041. [Google Scholar] [CrossRef]
  139. Verbrugge, M.W.; Wampler, C.W. On the optimal sizing of batteries for electric vehicles and the influence of fast charge. J. Power Sources 2018, 384, 312–317. [Google Scholar] [CrossRef]
  140. Schoch, J.; Gaerttner, J.; Schuller, A.; Setzer, T. Enhancing electric vehicle sustainability through battery life optimal charging. Transp. Res. B-Meth. 2018, 112, 1–18. [Google Scholar] [CrossRef]
  141. Wang, D.; Coignard, J.; Zeng, T.; Zhang, C.; Saxena, S. Quantifying electric vehicle battery degradation from driving vs. vehicle-to-grid services. J. Power Sources 2016, 332, 193–203. [Google Scholar] [CrossRef] [Green Version]
  142. Thompson, A.W. Economic implications of lithium ion battery degradation for Vehicle-to-Grid (V2X) services. J. Power Sources 2018, 396, 691–709. [Google Scholar] [CrossRef]
  143. Pelletier, S.; Jabali, O.; Laporte, G.; Veneroni, M. Battery degradation and behaviour for electric vehicles: Review and numerical analyses of several models. Transp. Res. B-Methodol. 2017, 103, 158–187. [Google Scholar] [CrossRef]
  144. Kempton, W.; Tomić, J. Vehicle-to-grid power implementation: From stabilizing the grid to supporting large-scale renewable energy. J. Power Sources 2005, 144, 280–294. [Google Scholar] [CrossRef]
  145. Wang, J.; Purewal, J.; Liu, P.; Hicks-Garner, J.; Soukazian, S.; Sherman, E.; Sorenson, A.; Vu, L.; Tataria, H.; Verbrugge, M.W. Degradation of lithium ion batteries employing graphite negatives and nickel–cobalt–manganese oxide+spinel manganese oxide positives: Part 1, aging mechanisms and life estimation. J. Power Sources 2014, 269, 937–948. [Google Scholar] [CrossRef]
  146. Jafari, M.; Gauchia, A.; Zhao, S.; Zhang, K.; Gauchia, L. Electric Vehicle Battery Cycle Aging Evaluation in Real-World Daily Driving and Vehicle-to-Grid Services. TTE 2018, 4, 122–134. [Google Scholar] [CrossRef]
  147. Zhou, L.; Zheng, Y.; Ouyang, M.; Lu, L. A study on parameter variation effects on battery packs for electric vehicles. J. Power Sources 2017, 364, 242–252. [Google Scholar] [CrossRef]
  148. Calvillo, C.F.; Czechowski, K.; Söder, L.; Sanchez-Miralles, A.; Villar, J. Vehicle-to-grid profitability considering EV battery degradation. In Proceedings of the 2016 IEEE PES Asia-Pacific Power and Energy Engineering Conference (APPEEC), Xi’an, China, 25–28 October 2016; pp. 310–314. [Google Scholar]
  149. Bishop, J.D.K.; Axon, C.J.; Bonilla, D.; Tran, M.; Banister, D.; McCulloch, M.D. Evaluating the impact of V2G services on the degradation of batteries in PHEV and EV. Appl. Energy 2013, 111, 206–218. [Google Scholar] [CrossRef]
  150. Crawford, A.J.; Huang, Q.; Kintner-Meyer, M.C.W.; Zhang, J.; Reed, D.M.; Sprenkle, V.L.; Viswanathan, V.V.; Choi, D. Lifecycle comparison of selected Li-ion battery chemistries under grid and electric vehicle duty cycle combinations. J. Power Sources 2018, 380, 185–193. [Google Scholar] [CrossRef]
  151. Uddin, K.; Jackson, T.; Widanage, W.D.; Chouchelamane, G.; Jennings, P.A.; Marco, J. On the possibility of extending the lifetime of lithium-ion batteries through optimal V2G facilitated by an integrated vehicle and smart-grid system. Energy 2017, 133, 710–722. [Google Scholar] [CrossRef]
  152. Dubarry, M.; Devie, A.; McKenzie, K. Durability and reliability of electric vehicle batteries under electric utility grid operations: Bidirectional charging impact analysis. J. Power Sources 2017, 358, 39–49. [Google Scholar] [CrossRef]
  153. Uddin, K.; Dubarry, M.; Glick, M.B. The viability of vehicle-to-grid operations from a battery technology and policy perspective. Energy Policy 2018, 113, 342–347. [Google Scholar] [CrossRef]
  154. Tang, L.; Rizzoni, G.; Cordoba-Arenas, A. Battery Life Extending Charging Strategy for Plug-in Hybrid Electric Vehicles and Battery Electric Vehicles. IFAC PapersOnLine 2016, 49, 70–76. [Google Scholar] [CrossRef]
  155. Rücker, F.; Bremer, I.; Linden, S.; Badeda, J.; Sauer, D.U. Development and Evaluation of a Battery Lifetime Extending Charging Algorithm for an Electric Vehicle Fleet. Energy Proced. 2016, 99, 285–291. [Google Scholar] [CrossRef] [Green Version]
  156. Ruecker, F.; Bremer, I.; Sauer, D.U. Development and analysis of a charging algorithm for electric vehicle fleets extending battery lifetime. In Proceedings of the ITEC-AP, Busan, South Korea, 1–4 June 2016; p. 29. [Google Scholar]
  157. Hu, X.; Zou, Y.; Yang, Y. Greener plug-in hybrid electric vehicles incorporating renewable energy and rapid system optimization. Energy 2016, 111, 971–980. [Google Scholar] [CrossRef]
  158. Wu, H.; Pang, G.K.; Choy, K.L.; Lam, H.Y. A charging-scheme decision model for electric vehicle battery swapping station using varied population evolutionary algorithms. Appl. Soft Comput. 2017, 61, 905–920. [Google Scholar] [CrossRef]
Figure 1. Vehicles classification.
Energies 12 02443 g001
Figure 2. (a) BEV topology scheme; (b) REEV topology scheme; and (c) parallel PHEV topology scheme.
Energies 12 02443 g002
Figure 3. The literature organised according to the location of the unidirectional algorithm.
Energies 12 02443 g003
Figure 4. Comparison of charging characteristics by architecture.
Energies 12 02443 g004
Figure 5. (a) Voltage droop control; and (b) classical frequency droop control method [73,74,75,76]. The graphed case is the equivalent to maximum V2G droop in [77].
Energies 12 02443 g005
Figure 6. Example of aggregator-based charging strategy.
Energies 12 02443 g006
Figure 7. Example of DSO centralised charging strategy.
Energies 12 02443 g007
Figure 8. Example of Multi-Agent charging strategy based on [63].
Energies 12 02443 g008
Figure 9. The analysed literature according to the location of the bidirectional algorithm.
Energies 12 02443 g009
Table 1. Comparison of emissions and costs derived from electric vehicle charging.
CountryEmissions Per Energy Unit (g CO2/kW h)Emissions Per km (g/km)Price Per Energy Unit (€/kW h)Price Per km (€/km)
Belgium19923.880.21730.0299
Canada15818.960.080.0110
China71185.320.0810.0111
Czech Republic51661.920.16810.0231
Denmark300360.30.0412
Estonia1016121.920.13510.0185
Finland175210.15780.0217
France647.680.15240.0209
Germany48658.320.30.0412
Greece64977.880.15630.0215
Hungary29335.160.13970.0192
Ireland43552.20.22950.0315
Italy34341.160.22920.0315
Japan57268.640.210.0288
Korea53664.320.0870.0119
Lithuania20424.480.1370.0188
Luxembourg30636.720.16650.0229
Netherlands45254.240.18980.0261
Norway80.960.19090.0262
Poland76992.280.1480.0203
Portugal28133.720.20810.0286
Russia43952.680.0270.0037
Slovak Republic17621.120.16980.0233
Slovenia31938.280.1610.0221
Spain24729.640.22280.0306
Sweden131.560.21010.0288
Turkey44253.040.14950.0205
UK45955.080.17410.0239
USA48958.680.10.0137
Assuming a mean energetic cost of 13.73 kW h/100 km given in NEDC cycle. Emissions correspond to the power systems of each country from 2013 [6]. Prices from 2013 [7,8,9,10].
Table 2. Classification of analysed reviews.
ReferenceTechnologyImpactBatteriesChargingOthers
EcoEnvGrid
HPTBCLCLPLossVPUHEqStaTypModEffStdTopMetV2GRESDGS GComProj
[11]- Energies 12 02443 i001 Energies 12 02443 i001 Energies 12 02443 i001 Energies 12 02443 i001 Energies 12 02443 i001- Energies 12 02443 i001 Energies 12 02443 i001 Energies 12 02443 i001 Energies 12 02443 i001 Energies 12 02443 i001- Energies 12 02443 i001------ Energies 12 02443 i001 Energies 12 02443 i001----
[12]- Energies 12 02443 i001- Energies 12 02443 i001----------------- Energies 12 02443 i001----
[13]- Energies 12 02443 i001----- Energies 12 02443 i001 Energies 12 02443 i001 Energies 12 02443 i001--- Energies 12 02443 i001--- Energies 12 02443 i001 Energies 12 02443 i001 Energies 12 02443 i001 Energies 12 02443 i001- Energies 12 02443 i001-- Energies 12 02443 i001
[14]- Energies 12 02443 i001--------------- Energies 12 02443 i001 Energies 12 02443 i001 Energies 12 02443 i001------
[15]------------------- Energies 12 02443 i001 Energies 12 02443 i001 Energies 12 02443 i001----
[16]- Energies 12 02443 i001- Energies 12 02443 i001 Energies 12 02443 i001 Energies 12 02443 i001 Energies 12 02443 i001------------- Energies 12 02443 i001-- Energies 12 02443 i001 Energies 12 02443 i001-
[17]----------------- Energies 12 02443 i001-- Energies 12 02443 i001 Energies 12 02443 i001- Energies 12 02443 i001 Energies 12 02443 i001-
[18]- Energies 12 02443 i001-- Energies 12 02443 i001 Energies 12 02443 i001 Energies 12 02443 i001- Energies 12 02443 i001 Energies 12 02443 i001----------- Energies 12 02443 i001- Energies 12 02443 i001 Energies 12 02443 i001-
[19] Energies 12 02443 i001 Energies 12 02443 i001 Energies 12 02443 i001 Energies 12 02443 i001---------- Energies 12 02443 i001-- Energies 12 02443 i001 Energies 12 02443 i001 Energies 12 02443 i001--- Energies 12 02443 i001 Energies 12 02443 i001-
[20]--- Energies 12 02443 i001 Energies 12 02443 i001 Energies 12 02443 i001--- Energies 12 02443 i001-- Energies 12 02443 i001 Energies 12 02443 i001--- Energies 12 02443 i001 Energies 12 02443 i001- Energies 12 02443 i001-----
[21]--- Energies 12 02443 i001--- Energies 12 02443 i001- Energies 12 02443 i001------ Energies 12 02443 i001 Energies 12 02443 i001- Energies 12 02443 i001 Energies 12 02443 i001 Energies 12 02443 i001----
[22]------ Energies 12 02443 i001- Energies 12 02443 i001 Energies 12 02443 i001---- Energies 12 02443 i001-- Energies 12 02443 i001- Energies 12 02443 i001 Energies 12 02443 i001 Energies 12 02443 i001- Energies 12 02443 i001--
[23]------- Energies 12 02443 i001 Energies 12 02443 i001 Energies 12 02443 i001--- Energies 12 02443 i001-- Energies 12 02443 i001--- Energies 12 02443 i001 Energies 12 02443 i001----
[24]--- Energies 12 02443 i001---- Energies 12 02443 i001 Energies 12 02443 i001-- Energies 12 02443 i001---- Energies 12 02443 i001- Energies 12 02443 i001 Energies 12 02443 i001-----
[25]----------------- Energies 12 02443 i001- Energies 12 02443 i001 Energies 12 02443 i001 Energies 12 02443 i001----
[26]- Energies 12 02443 i001------ Energies 12 02443 i001 Energies 12 02443 i001--------- Energies 12 02443 i001- Energies 12 02443 i001----
[27]- Energies 12 02443 i001------------- Energies 12 02443 i001----------
[28]- Energies 12 02443 i001------------------------
[29]---- Energies 12 02443 i001-- Energies 12 02443 i001----- Energies 12 02443 i001------- Energies 12 02443 i001----
[30]- Energies 12 02443 i001-- Energies 12 02443 i001--- Energies 12 02443 i001---- Energies 12 02443 i001-- Energies 12 02443 i001--- Energies 12 02443 i001 Energies 12 02443 i001----
[31]- Energies 12 02443 i001------ Energies 12 02443 i001--- Energies 12 02443 i001--- Energies 12 02443 i001 Energies 12 02443 i001- Energies 12 02443 i001 Energies 12 02443 i001 Energies 12 02443 i001----
[32]-- Energies 12 02443 i001----------- Energies 12 02443 i001-- Energies 12 02443 i001-- Energies 12 02443 i001 Energies 12 02443 i001-- Energies 12 02443 i001-
[33]-- Energies 12 02443 i001----------- Energies 12 02443 i001 Energies 12 02443 i001 Energies 12 02443 i001--- Energies 12 02443 i001-----
[34]--- Energies 12 02443 i001--- Energies 12 02443 i001 Energies 12 02443 i001-- Energies 12 02443 i001 Energies 12 02443 i001--- Energies 12 02443 i001 Energies 12 02443 i001-- Energies 12 02443 i001 Energies 12 02443 i001----
[35]----------------------- Energies 12 02443 i001--
[36]----------------------- Energies 12 02443 i001--
[37]-------------------- Energies 12 02443 i001-- Energies 12 02443 i001 Energies 12 02443 i001-
[38]----------------------- Energies 12 02443 i001--
[39]- Energies 12 02443 i001 Energies 12 02443 i001-------------- Energies 12 02443 i001 Energies 12 02443 i001------ Energies 12 02443 i001
[40]------------------- Energies 12 02443 i001 Energies 12 02443 i001 Energies 12 02443 i001 Energies 12 02443 i001---
[41]------- Energies 12 02443 i001------ Energies 12 02443 i001---- Energies 12 02443 i001 Energies 12 02443 i001 Energies 12 02443 i001- Energies 12 02443 i001 Energies 12 02443 i001-
[42]--- Energies 12 02443 i001--------------- Energies 12 02443 i001- Energies 12 02443 i001----
OS- Energies 12 02443 i001 Energies 12 02443 i001--- Energies 12 02443 i001 Energies 12 02443 i001 Energies 12 02443 i001 Energies 12 02443 i001-- Energies 12 02443 i001 Energies 12 02443 i001-- Energies 12 02443 i001 Energies 12 02443 i001- Energies 12 02443 i001 Energies 12 02443 i001 Energies 12 02443 i001----
H, History; PT, Power Train; B, Battery; C, Charger; Eco, Economic; Env, Environmental; LC, Load Capacity; LP, Load Profile; Loss, Losses; V, Voltage; PU, Phase Unbalance; H, Harmonics; Eq, Equipment; Sta, Stability; Typ, Types; Mod, Models; Eff, Effect; Std, Standards; Top, Topologies; Met, Methodologies; V2G, Vehicle-to-Grid; RES, Renewable Energies Sources Integration; DG, Distributed Generation; SG, Smart Grid; Com, Communications; Proj, Projects.
Table 3. Classification of charging Standards.
Voltage [V]Max Current [A]Power [kW]Time of ChargingInstallation Cost [$]Recommended Location
ACSAE Standard
Level 1120/230 (US/UE)12/16
(US)
1.4/1.9
1 ph
PHEV: 7 h (SOC 0–100%)
BEV: 17 h (SOC 20–100%)
500–800Domestic
Level 2240Up to 80Up to 19.2, 1 phEV: 3 h (SOC 0–100%) (On-board charger, 3.3 kW)
EV: 1.5 h (SOC 0–100%) (On-board charger, 7 kW)
EV: 20 min (SOC 0–100%) (In case of 20 kW on-board charger)
2000–8000Parking or public streets, Public places
Level 3 From 20 (1 ph/3 ph) 30,000–160,000
IEC Standard
Mode 1230/450163.7/11 (1 ph/3 ph) Domestic
Mode 2230/690323.7/22 (1 ph/3 ph) Car rental Company, Fleet of Company cars, Service Stations
DCSAE standard
Level 1200–45080Up to 20PHEV: 22 min (SOC 0–80%)
BEV: 1.2 h (SOC 20–100%) (In case of 20 kW off-board charger)
8500–50,000Parking or public streets, Public places
Level 2200–450200Up to 90PHEV: 10 min (SOC 0–80%)
BEV: 10 min (SOC 0–80%) (Off-board charger, 45 kW)
BEV: 22 min (SOC 20–80%) (Off-board charger, 45 kW)
Car rental Company, Fleet of Company cars, Service Stations
Level 3200–600400Up to 240BEV (only): <10 min (SOC 0–80%) (45 kW off-board charger) Service Stations
IEC Standard
Mode 3 6343.5 Service Stations
Mode 4 400From 50
BEV, 25 kW h; PHEV, 5–15 kW h; EV, 10 kW h.
Table 4. Comparison of centralised and decentralised charging characteristics.
AdvantagesDrawbacks
DecentralisedScalable
Greater fault tolerance
Less communications needed, generally based on local measurements
Greater data privacy
Greater controllability by the user.
Greater acceptance by the users
Unexpected results
Limited provision of ancillary services
User behaviour prediction necessity
Possibility of avalanche reactions
CentralisedKnown architecture
Better use of network capacity
Better provision of ancillary services
Hierarchical structure
Possibility of business models
Communication layer needed
Central controller (aggregator) needed
Limitation on the number of vehicles per controller
High processing capacity required
Possible data privacy violations
Table 5. Classification of the literature on decentralised strategies.
InterestObjectiveConsiderations
Aggregator[57,58,59]OptPrice[52,57,58,59,60,61,62,63,64,65]GridCurrent and Voltage limits[60,65,66,67]
DSO[60,61,66,68,69,70]Load FlatteningValley filling[57,58,59,61,66,68,70]Transformer limits[52,66]
Several stakeholders[64,65] Peak Saving[64]BatterySOC[52,57,59,60,61,65,67,68,71]
Load Shifting[60,70]Reaching desired SOC[52,57,61,66]
OptQualFrequency regulation[70]MarketDay ahead Prices[57,58,59,68,70]
Voltage regulation[52,65,69]Real Time prices[67]
Load Factor[61]PopulationHomogeneous[57,59,61,65,67,68,69,70]
Active power[52]Heterogeneous[52,58,60,64,66]
MethodSoftwareSolverValidation
Convex program[52,61,68]MATLAB[60,68,69,70]GAMS[52]Simulation[52,57,58,59,61,66,70]
Linear programming[52,60,70]PowerACE[64]CPLEX[52]Trusted/Applied Simulation[60,64,65,66,68,69]
Nash Certainly Equivalence (NCE)[57,58,59]Power Factory[60]CONOPT[52]
shrunken-primal dual subgradient (SPDS)[66]
Game Theory[65]
Table 6. Classification of the literature on aggregator-based strategies.
InterestObjectiveConsiderations
Aggregator[78,79,80,81,82]OptPrice[52,53,78,80,82,83,84,85,86,87,88,89,90,91,92]GridCurrent and Voltage limits[53,83,86,88,90,92,93]
DSO[84,92,93,94,95,96]OptLosses[53,84,93]Transformer limits[52,87,90,93]
Several stakeholders[53,62,83,87,88,97]Load FlatteningValley filling[83,84,95]BatterySOC[52,80,81,82,84,88,91,94,96,97]
Load Shifting[78,88,89,93,96]Reaching desired SOC[78,79,86,91,92,95,97]
Peak Saving[62]Battery constraints[83]
Battery degradation[78]
OptQual MarketDay ahead Prices[85,86,89,92]
Voltage regulation[52]Real Time prices[81,89]
Load Factor[96] Capacity prices[80,88,93,96,98]
Active power[52,94]PopulationHomogeneous[81,90,91,95,96]
Heterogeneous[52,53,83,84,86,87,88,92,93,97]
MethodSoftwareSolver/ToolsValidation
Convex program[52,86]MATLAB[53,78,80,86,88,89,92,93]GAMS[52]Simulation[52,62,78,79,80,81,82,85,87,89,90,91,93,95,96,97,98]
Nash Certainly Equivalence (NCE)[62] CPLEX[52,78,80,83]Trusted/Applied Simulation[53,84,88,92,94]
Linear programming[52,85] CVX[86,89]
Iterative Quadratic programming[83,92,95] NSGA-II[94]
Backward-forward method[84] CONOPT[52]
Flexibility Envelope[91]
Maximum Sensitivities Optimisation[53]
Genetic Algorithm (GA)[84,87,94]
Particle Swarm Optimisation (PSO)[84,87,90]
Differential Evolution (DE)[87]
Ageist Spider Monkey Optimisation (ASMO)[87]
Dynamic Programming[82]
Game theory[62]
Table 7. Classification of the literature on DSO-based strategies.
InterestObjectiveConsiderations
OptPrice[100,101,102]GridCurrent and Voltage limits[72,100,103]
DSO[51,72,99,102,103,104,105]OptLosses[72,104]Transformer limits[100,101]
Several stakeholders[100,101,106]Load FlatteningValley filling[99,102]BatterySOC[99,100,101,103,106]
Load Shifting[99,103,104]Reaching desired SOC[99,100,104,106]
OptQualFrequency Regulation[105]MarketDay ahead Prices[102]
Voltage regulation[103,105]Real Time prices[101,102]
Load Factor[99,104] Capacity prices[101,106]
Active power[105]PopulationHomogeneous[100,103]
Reactive Power[105]Heterogeneous[101,104,106]
MethodSoftwareSolver/ToolsValidation
Convex program[104,105]MATLAB[99,100,102,104,106]GAMS[106]Simulation[99,102,104]
Linear programming[100]Power Factory[101]CPLEX[106]Trusted/Applied Simulation[100,101,103,104,105]
Iterative Quadratic programming[99,104] CVX[103,104]
Dynamic Programming[51] fmincon[100]
Artificial Immune System[72] MATPOWER[102]
Table 8. Classification of the literature on multi-agent strategies.
InterestObjectiveConsiderations
OptPrice[63,107,108]GridCurrent and Voltage limits[63,107]
DSO[109]OptLosses[63]Transformer limits[63]
Several stakeholders[63,107,108]Load FlatteningValley fillingBatterySOC[107]
Load Shifting[63]MarketDay ahead Prices[63,108]
OptQualActive power[107]Real Time prices[107]
Reactive Power[107]PopulationHomogeneous[63,107,108,109]
MethodSoftwareSolver/ToolsValidation
MATLAB[107]GAMS[107]Simulation[63,108,109]
Linear programming[108,109]PSS/E[108]CPLEX[63]Trusted/Applied Simulation[107]
JAVA[58,66]KNITRO[107]
Python[108]
LINGO[108]
Table 9. Advantages and drawbacks of different bidirectional approaches.
ApproachAdvantagesDrawbacks
V2GOperation at large scale
Ancillary services supply
Electricity market participation
Large scale RES Integration
New business model opportunity
Complex operation
Complex prediction of EV demand
Large communication infrastructure required
User preferences to be considered
Lack of regulatory framework
Battery degradation
Standards needed to be developed
V2BDER improvement
DS improvement
Electricity bill lowering capability
Backup power
Easy EV demand prediction
Low investment
Medium difficulty operation
Poor market integration
User preferences to be considered
Battery degradation
V2HDS improvement
Backup power
Electricity bill lowering capability
Easy implementation
Very low investment
Low communication infrastructure required
Local RES integration
Isolated houses energy provision
Only compatible with single family home
Large scale opportunity loss
Battery degradation
Table 10. Degradation mechanisms in a Li-Ion battery.
Simulation ConceptDegradation DriverDegradation MechanismResult
CathodeAnodePower FadeCapacity Fade
Calendar aging (~t2)Surface Phase ChangeTemperature X
Precipitation of PhasesTemperature, SOCX
Loss of Active MaterialTemperature, SOC X
Dissolution of SpeciesTemperature, SOCX
Binder DecompositionSOCTemperature, SOCX (Cathode)X (Anode)
SEI Growth Temperature, SOCXX
SEI Dissolution TemperatureX
Crystal DisorderSOC X
Current Collector Corrosion SOCX
Cycling aging (Ah)Lithium Plating Temperature,C-RateXX
Intercalation Gradients Temperature,C-Rate X
Mechanical failureDODC-Rate, SOC, DODXX
High relevance mechanisms are written in red, lower relevance mechanisms are written in blue.
Table 11. Degradation of the battery after ten years depending on service and charger level [141].
ApproachL1L2
G2VUncontrolled charging31.41%
V2GPeak shaving36%45%
Frequency Regulation35.03%42.56%
Net load shaping32.59%34.01%

