Transient Simulation for a Pumped Storage Power Plant Considering Pressure Pulsation Based on Field Test


1
College of Water Conservancy and Hydropower Engineering, Hohai University, Nanjing 210098, China
2
College of Hydraulic and Civil Engineering, Xinjiang Agricultural University, Urumqi 830052, China
*
Author to whom correspondence should be addressed.
Energies 2019, 12(13), 2498; https://doi.org/10.3390/en12132498
Submission received: 15 May 2019
/
Revised: 18 June 2019
/
Accepted: 25 June 2019
/
Published: 28 June 2019
Abstract
:In this study, fast Fourier transform and inverse transform are adopted for noise reduction filtering the data of load rejection pressure of a single unit in a one-tube, four-unit pumped storage power station. Five-spot triple smoothing method is used to extract the time-average and pulsation value of the water hammer pressure of the spiral case and draft tube inlet. The reasonable correction formula is put forward, and the pulsating pressure rise rate of the spiral case (4.44%) and the draft tube inlet (−1.22%) are obtained. A mathematical model is also established for the transition process of the water conveyance and power generation system of the pumped storage power station, and the field single-unit load rejection condition is simulated. The simulation results are consistent with the measurements, and the accuracy of the calculation model in predicting the time-average pressure of water hammer is verified. Thus, the extreme successive load rejection conditions can be simulated based on the proposed model. Combining with the pulsating pressure rise rate of unit, the actual extreme value of extreme working condition is reasonably calculated. The conclusion shows that the pressure of spiral case and draft tube inlet after considering pressure pulsation can meet the control requirements, avoid the damage caused by extreme working condition test to unit, and ensure the operation safety of unit.
1. Introduction
With the progress of technology, pumped storage power stations have been developing towards the direction of high head, large capacity, and high speed. The hydraulic transient in the water conveyance and power generation system is often the main factor threatening the operation safety of pumped storage power stations. Through hydraulic calculation, the primary problem in the layout design of the pumped storage power station is the prediction and control of the important control values related to the safety of the power station and the unit, such as the maximum pressure of the spiral case and the minimum pressure at the draft tube inlet. Hydraulic transition processes in a pumped storage power station are numerous and complex, with more than 10 kinds of working conditions, including power generation, pumping, and mutual conversion between them. For a water transmission system with an upstream or tail water surge chamber, the most unfavorable water level and flow combination conditions must also be considered. At the same time, the pressure change of the pressure diversion system is often accompanied by serious pressure pulsation phenomenon, which further deteriorates the maximum pressure control value of the system. In comparison with conventional hydropower station units, the flow characteristics of water pump turbine units are unstable due to the presence of inverted “S” zone in the characteristic curve when braking condition and reverse pump condition. This phenomenon is prominent in the case of successive load rejection. These factors lead to the extreme pressure of water conveyance system, especially the minimum pressure of draft tube inlet, which is often not in simultaneous load rejection but in the succession of load rejection.
Pumped storage power station is the largest, most economical, and most mature energy storage technology at present. Therefore, this technology is being rapidly developed and applied. At the same time, there are a series of technical and economic problems to be solved. Mitani et al. proposed a new annual analysis method for thermal power generating units and pumped storage units, and evaluated the large-scale introduction of renewable energy [1]. Sankaramurthy et al. proposed a flower pollination algorithm for mitigating power system congestion, and economic analysis of the cost of alleviate congestion before and after the pumped storage device was added to the power system [2]. Trivedi et al. measured the transient pressure of a prototype Francis turbine during the transition from emergency shutdown to total load rejection. The variables, such as head, flow rate, and pressure at different positions, were analyzed in detail. Under the unstable condition, the maximum amplitude of unsteady pressure fluctuation in the turbine was observed. Such high amplitude and unsteady pressure fluctuation will affect the working life of the turbine [3,4]. He et al. analyzed the transient characteristics of the pump turbine in the start-up process by using the three-dimensional full flow channel numerical simulation method and discussed the relationship among pressure pulsation, mechanical vibration, and the dynamic stress of the runner. Hydraulic excitation has a significant effect on the dynamic stress and pressure pulsation of the runner [5]. Zhao et al. established a full flow channel model for a certain type of pump turbine, simulated the flow characteristics in the flow channel of the turbine using CFD technology, analyzed the pressure pulsation in the flow channel of the turbine, and discussed the source and mechanism of the pressure pulsation [6]. Yu et al. proposed a new closing law, which combines guide vane closure with main intake valve closure. The closing law can reduce the maximum pressure in spiral case and the maximum speed of runner and increase the minimum pressure in draft tube during transition [7]. Rezghi et al. carried out a numerical simulation on the interaction effect of two parallel units in the instability zone under the condition of conventional load rejection in a unit pumped storage power station with one-tube, two-unit [8]. Yu et al. established a mathematical model of hydropower station with multiple turbines sharing a hydraulic system, and studied the output change and dynamic characteristics of the turbine under the action of hydraulic disturbance [9]. Aiming at the problem of non-linear seepage in high-head pumped storage power station, Hu et al. established a non-linear seepage numerical model and applied it to the seepage analysis of the surrounding rock of the hydraulic tunnel of Yangjiang pumped storage power station [10].
One-dimensional numerical simulation is usually used to calculate for the ultimate pressure (maximum pressure of spiral case and minimum pressure of draft tube inlet) generated by the transient operation of pumped storage power station to provide a basis for the safe operation of a power plant. However, large pulsating pressure is generated during load rejection of the pump turbine, which worsens the water hammer pressure. The one-dimensional transient flow is calculated as the mean pressure, and the pulsating pressure cannot be simulated, making the simulation results biased towards danger. In addition, load rejection test is required before the pumped-storage power station is operated. However, considering that the dangerous working conditions, such as simultaneous load rejection or successive load rejection of multiple units in the same water transmission system, may damage the unit and the waterway system, the test can only be conducted under normal working conditions, such as single-unit load rejection. The extreme pressure of dangerous working conditions cannot be measured under the influence of pressure pulsation and cannot be checked for compliance on the design requirements. In view of the above problems, this paper analysed the on-site pressure data of single-unit load rejection of a certain high-head four-unit pumped storage power station, extracted the mean and pulsation value of the spiral case pressure and the draft tube inlet pressure and defined the pressure correction formula considering the pressure pulsation. The mathematical model for the transition process of the pumped storage power station’s water conveyance and power generation system was established, which was verified by the measured data. Different from the previous calculation of load rejection condition, which mainly considered conventional working conditions, based on this mathematical model, the possible dangerous conditions of the power station, i.e., successive load rejection conditions, were mainly simulated. Combined with the pressure correction formula, the influence of pressure pulsation was taken into account to check the safety of dangerous working conditions.
The structure of the rest of this paper is as follows: In the second part, on the basis of the continuity and motion equation of the pressurized diversion system, the mathematical model of the pump turbine and the water transmission system was established. In the third part, the main parameters of a pumped storage power station in China, which is a case study in this paper, were described, and the fast Fourier transform (FFT) method was used to analyze the pumped storage power. The data of field load rejection pressure of the single unit at the station were processed, and the time-averaged and pulsation values of the water hammer pressure of the spiral case and draft tube inlet were extracted. In the fourth part, combined with the project example, the numerical simulation of the same working condition of the load rejection experiment was carried out, and the calculation results were compared with the measured data to verify. In the fifth part, the numerical simulation of the control working condition was carried out, and the measured pulsation value was used to correct the results. The sixth and seventh parts contain the discussion and conclusion, respectively.
2. Mathematical Model
The characteristic method is a reliable and effective method for calculating the hydraulic transients. In this part, according to the continuity and motion equation of the pressure conduits and the pumped storage power station with surge chamber, the mathematical models of pump turbine and surge chamber were established in detail.
The characteristic method was based on two partial differential equations. The partial differential equation was transformed into an ordinary differential equation along the characteristic line. Then, the ordinary differential equation was integrated to obtain the differential equation. In the calculation of transient flow in the pressure diversion system of the hydropower station, the characteristic line method was the most commonly used numerical method for analyzing the hydraulic transient of the system because of its high stability and high accuracy.
For arbitrary flow in the pipeline, the continuity and motion equation can be described as follows:
In the formula, is the piezometer head, is the velocity in the pipe, is the acceleration of gravity, is the time variable, is the friction coefficient, is the diameter of the pipe, is the angle between the axis of the pipe and the horizontal plane, and is the water hammer wave velocity. Formulas (1) and (2) can be simplified into hyperbolic partial differential equations with friction term, so that they can be transformed into characteristic compatibility equations for water hammer calculation in pipelines by using the characteristic method. As shown in Figure 1a, the characteristic line equation is expressed as follows [11,12]:
In the formula, , , and are the known quantities of time t − △t.
By dividing the long L pipeline into N segments, each of which is △x = L/N and taking the time step △t = △x/a, the rectangular grid on the x–t plane is shown in Figure 1b. The calculation begins with the steady flow state at t = 0. Then, and of each grid point along t = △t were calculated, followed by t = 2△t, and so on, until the required time was obtained. At any intersection of internal grids, such as section i, simultaneous solutions (3) and (4) can solve the unknown quantities and.
2.1. Pump–Turbine
Four 300 MW pump turbines/generators were installed in this pumped storage power station project. The main equipment of the power station was supplied by the German Voith/Siemens consortium. The characteristic curve of the pump turbine is shown in Figure 2.
In Figure 2, the abscissa is the unit speed. The ordinate are unit discharge and unit moment , respectively, and is the guide vane opening.
Among them, is the runner diameter, is the runner speed, is the water head, is the flow rate and is the moment.
Considering that the pump turbine has two operating conditions: turbine and pump, to solve for the two operating conditions in a unified way and avoid the multi-value problems that may arise in the interpolation calculation, the improved Suter method [13,14] should be used to process the full characteristic curve of the pump turbine before calculation, and the full characteristic curve of pump turbine in four quadrants should be transformed into two periodic curves by using the following formula:
In the above formula:
, , and are dimensionless values of the water head, moment, speed, and flow rate, respectively, is the guide vane opening, is the unit moment of rated working condition, and and are the coefficients.
Pump turbine is one of the most important components of the pumped storage power station. The boundary conditions of the unit are shown in Figure 3.
If the upper and lower boundary nodes of the runner are numbered as 1 and 2, then according to formula (5) and (6), the water head balance equation of the runner boundary can be obtained as follows:
In the formula, and are the working head and flow rate of the runner under rated working conditions.
The rotational moment equation of the unit is as follows:
In the formula, is the inertial time constant of the unit, is the moment of inertia of the unit, and are the speed and force moment of the unit under rated operating conditions, respectively, is the dimensionless value of the unit’s rotational resistance moment, and , and are the values of the previous calculation steps of , and . The transient parameters , , and of the pump turbine node under various working conditions can be obtained by combining the above equations with the given guide vane closure law.
2.2. Computational Flow Chart
In the previous sections, the governing equation of hydraulic transition process of hydropower station was derived, and the boundary conditions of pump turbine, impedance surge chamber and bifurcation pipe were defined. For a better understanding of the numerical simulation, the calculation process is shown in Figure 4.
3. Data-Processing and Result of the Field Load Rejection Test
The research object of this paper is a pumped storage power station located in southern China. Four reversible pump–turbine units with a single-unit capacity of 300 MW are installed in the power station. The simplified layout of the hydropower plant is shown in Figure 5. The upstream and downstream reservoirs have a constant water level, and the upstream and downstream impedance surge chambers are connected to the diversion tunnel through connecting pipes. The rated parameters of pump turbines and the attributes of pressure diversion channels are listed in Table 1 and Table 2.
The on-site load rejection test was conducted using a single unit (no. 2 unit) with 100% load rejection test. Other units were in the state of shutdown. Initial test parameters are shown in Table 3.
The test was carried out by means of electrical signal measurement. Under the set test conditions, the signals of spiral case pressure and draft tube inlet pressure were collected in real time by using the mechanical condition monitoring system CSI2600 of Emerson Process Control Co., Ltd.
Types and parameters of pressure sensors for spiral case and draft tube inlet are shown in Table 4.
For the spiral case pressure, the measuring points are arranged on the inlet pressure measuring pipeline of the spiral case of Unit 2 near the outlet of the spiral case pressure taking hole, and for the pressure of the draft tube inlet, the measuring points are arranged on the pressure measuring pipeline above the inlet door of the draft tube of Unit 2. As shown in Figure 6.
The pressure signals of each part are taken from the pressure transmitter which has been corrected on the spot. The output current signals are processed by optical isolation and I/V conversion, and then connected to the data acquisition system for real-time data acquisition and processing. Considering that the noise signal may appear in the field load rejection test, the collected data need to be de-noised and filtered. In this paper, FFT is used to analyze the data in the time and frequency domain. The sampling frequency is 400 Hz. The transformed signal was filtered and rejected by setting the threshold, and the signal was inversely transformed; the purpose of reconstructing the signal and eliminating the noise was achieved [15,16].
Test process: unit 2 operates at full load, unit output power is 300 MW, and water purification head is 522.12 m before load rejection. The guide vanes of the unit will be closed according to the straight line law, and the closing time will be 30 s. After denoise filtering, the pressure curve is further smoothing filtering by five-spot triple smoothing method, and the time-averaged and pressure fluctuation values of water hammer pressure are extracted.
3.1. FFT and Inverse Transform (IFFT) Processing
FFT and inverse transform are fast algorithms of discrete Fourier transform. The discrete Fourier transform (DFT) of finite length discrete signals is as follows [17,18]:
In the above formula, , the inverse of that is,
However, it is not widely used due to the computational complexity of directly computing the discrete Fourier transform (DFT). In 1956, J.W. Cooley and J.W. Turkey proposed FFT algorithm based on the conjugate symmetry, periodicity, and reducibility of . Most of them used radix 2 FFT algorithm selected by time and radix 2 FFT algorithm selected by frequency. In this paper, the radix 2 FFT algorithm of frequency selection was adopted, and the program was implemented using MATLAB. The built-in FFT function was used to perform spectrum analysis, and the threshold value of points for fast Fourier inverse transformation (application IFFT function) was removed to reconstruct the original image. The spiral case pressure and draft tube inlet pressure collected from field test are shown in Figure 7. The spiral case pressure and draft tube inlet pressure with filtered pressure pulsation value are shown in Figure 8.
From Figure 8, it can be seen that the maximum pressure of the spiral case containing pressure fluctuation is 722.28 m and the minimum pressure of the draft tube inlet is 29.9 m.
3.2. Five-Spot Triple Smoothing Method
Figure 8 shows the image of spiral case pressure and draft tube inlet pressure after filtering. Considering that the pressure curve after denoise filtering contains fluctuating pressure, the time-averaged and pressure fluctuation value of water hammer pressure should be extracted by smoothing filtering. In this paper, the five-spot triple smoothing method was used to deal with the spiral case pressure and the draft tube inlet pressure contained pulsating pressure values [19].
Five-spot triple smoothing method can be used for signal smoothing in the frequency domain. For the data in the frequency domain, it can smoothen the spectral curve to enhance the fitting effect in the modal parameter identification. The principle of the five-point cubic smoothing method is as follows:
Assuming that the observed data at n isometric points are known, two adjacent points can be selected before and after each data point; the approximation by cubic polynomial is as follows:
According to the principle of least squares, the five-spot triple smoothing formula can be obtained as follows:
In general, more than five data sequences were used. The first two points were smoothed by applying the first and second items in formula (12). The last two points were smoothed by applying the fourth and fifth items in formula (12). The rest of the points were smoothed using the third item in formula (12).
Matlab programming is used to realize the process. The pressure process line in Figure 8 was smoothed by five-spot triple smoothing method, and the results are shown in Figure 9. The time average of the spiral case and draft tube inlet after smoothing were compared with the numerical simulation results. The specific comparison results are presented in Section 4.
From Figure 9, it can be seen that the time averaged of maximum pressure of spiral case without considering the influence of pressure fluctuation after load rejection test is 699.1 m, and the minimum pressure of draft tube inlet is 36.29 m.
4. Comparisons between the Measured Data and Numerical Simulation Results
4.1. Comparisons between the Measured Data and Numerical Simulation Results
The numerical simulation is programmed in FORTRAN language. The boundary conditions of the upstream and downstream reservoir water level, characteristic curve, channel layout, and closure rule were completely consistent with the actual situation of load rejection test on site. Numerical simulation was conducted on the 100% load rejection by using a single unit (No. 2 unit), and the calculation step was 0.00156 s. The measured data after smoothing and the results of numerical simulation are shown in Figure 9, and the comparison of extreme values is shown in Table 5.
As seen from Figure 9, after filtering and smoothing, the numerical simulation results were in good agreement with the experimental results. The spiral case pressure was concerned with the positive pressure extremum, while the draft tube inlet pressure was concerned with the negative pressure extremum. Although the numerical simulation results of draft tube inlet pressure in Figure 9b deviated from the measured data, which may be related to the turbulence of the flow pattern in the draft tube during the load rejection [20], the minimum value of the calculated results did not show a large deviation. Table 3 shows that the positive pressure extremum of spiral case and the negative pressure extremum of draft tube inlet are in good agreement with numerical simulation results. Hence, the accuracy of numerical simulation results is reliable.
4.2. Modified Formula and Rate of Pressure Rise
In the actual design process, the result of numerical calculation combined with the pressure change value caused by the phenomenon of pressure pulsation was the final result used to check the pressure standard of the water diversion channel. By processing the measured data and considering that the magnitude of pulsating pressure was related to the height of the water head of the power station, the revised formula for the pressure value of this power station was defined as follows:
In the formula, PPRR is the pulsating pressure rising rate of the spiral case and draft tube, MD is the measured data of water hammer pressure in field test, TA is the time average of water hammer pressure, and NHBLR is the net head before the load rejection of the unit.
When the numerical simulation pressure value under a certain operating condition is known, the final corrected pressure value under this working condition considering the influence of pressure pulsation is as follows:
In the formula, CPV is the corrected pressure value, NSR is the numerical simulation result, PPRR is the pulsating pressure rising rate and NHBLR is the net head before the load rejection of the unit.
Based on this example, according to the data in Table 3 and Table 5, the pulsating pressure rise rate of the spiral case and draft tube inlet is 4.44% and −1.22% (Pressure drop), respectively. The above correction values can be used to correct the numerical simulation calculation values of this power station under various operating conditions.
5. Numerical Simulation and Modification of Control Conditions
Based on the calculation, the control condition of the maximum spiral case pressure of this pumped storage power station appeared in the condition of simultaneous load rejection of four units, and the control condition of the minimum draft tube inlet pressure appeared in the condition of successive load rejection, that is, three units first load reject, and the last unit load reject at the most disadvantageous moment. As the successive load rejection condition increases the velocity gradient of the last load rejection unit [21], the minimum draft tube inlet pressure deteriorates further than the simultaneous load rejection. Hence, the successive load rejection test is not be directly carried out from the perspective of safe operation in the hydropower station. The extreme values of the spiral case and draft tube inlet under corresponding working conditions were obtained by numerical simulation. In combination with the pulsating pressure rising rate obtained in the previous section, the calculation results were corrected reasonably, thus providing practical reference for the safe operation of the project.
Table 6 illustrates the numerical simulation calculation conditions of control conditions.
According to the numerical simulation calculation, the pressure control condition of the spiral case is that four units load rejection at the same time, the maximum pressure occurred in unit 1. The pressure control condition of the draft tube inlet is as follows: firstly, units 1, 2. and 3 load rejections are at the same time; secondly, unit 4 load rejection is after 6.2 s. The minimum pressure occurred in unit 4. The pressure extreme process line of the spiral case in the pressure control condition is shown in Figure 10. The pressure extreme process line at the draft tube inlet in the condition of successive rejection (6.2 s) is shown in Figure 11. The pressure extreme value was corrected using formula (14), and the results are shown in Table 7.
Table 7 shows that the maximum pressure of the spiral case is 794.84 m, and the minimum pressure of the draft tube inlet is 1.38 m. According to the calculation above, the pulsating pressure rising rate of the spiral case is 4.44%, and the pressure fluctuation rise rate of the draft tube inlet is −1.22%. According to formula (14), the maximum pressure of the spiral case is 818.41 m, and the minimum pressure of draft tube inlet is −5.12 m. It can be seen that the numerical simulation results are actually dangerous compared with the actual operation of the power plant. However, considering that the power plant cannot carry out on-site load rejection test, and the pulsating pressure rise rate cannot be measured at the design stage, a considerable pressure allowance should be reserved in the design. Moreover, appropriate measures should be observed, such as increasing the diameter of diversion and tailrace branch tunnel, to ensure that the spiral case pressure and draft tube inlet pressure do not exceed the control value and avoid dangerous situations, such as liquid column separation.
6. Discussion
For high-head pumped storage power station, the extreme pressure of dangerous working conditions under pressure pulsation cannot be predicted in a better way and checked whether it meets the design requirements. Generally, a one-dimensional numerical simulation method is used in engineering to calculate and add appropriate allowance on the basis of the calculation value. However, the selection of this allowance is often based on experience, which often results in expensive engineering design results. In this paper, the field single-unit load rejection test data were processed scientifically, and the load rejection process under the corresponding test conditions was simulated numerically. By comparing the results of the test data with numerical simulation, a more reasonable correction formula of water hammer pressure was introduced. The pulsating pressure rise rate obtained from this method has a certain reference significance for the selection of parameters in the design stage of pumped storage power stations with similar head and unit capacity. At the same time, for the calculation of the transition process of the pumped storage power station, the importance of the calculation of successive load rejection conditions has recently been gradually recognized by the engineers. The numerical simulation process is more complex than the conventional conditions. The numerical simulation results are closely related to the number of units, the length of the diversion channel and tailrace, the size of surge chamber, and the closing law of guide vanes. Unlike the numerical simulation of conventional load rejection process, the most disadvantageous time interval between the earlier load rejection units and the subsequent load rejection units first need to be obtained through a large number of trial calculations. Then, the extreme pressure under this condition can be obtained by numerical simulation. The mathematical model presented in this paper solved this problem well and provided an effective supplement for the comprehensive numerical simulation of the hydraulic transition process of pumped storage power stations in the future.
7. Conclusions
In this work, the hydraulic transient process of a high-head pumped storage power station was studied. In this paper, FFT and inverse transform were adopted to perform noise reduction filtering of the data of load rejection pressure of a single unit in a one-tube, four-unit pumped storage power station, and a five-spot triple smoothing method was adopted to extract the time-averaged and pulsation value of water hammer pressure of spiral case and draft tube inlet. At the same time, the mathematical model of the transition process of the water conveyance and power generation system of the pumped storage power station was established. The field single-unit load rejection condition was also simulated. By comparing the measured data with the numerical simulation results, a reasonable correction formula of water hammer pressure value was proposed. At the same time, based on the mathematical model, the extreme load rejection conditions were simulated, and the actual extreme values of the extreme conditions were reasonably calculated according to the pulsating pressure rising rate of the spiral case (4.44%) and the draft tube inlet pressure fluctuation rising rate (−1.22%) calculated from the revised formula. The conclusion shows that the pressure of the spiral case and draft tube inlet can meet the control requirements after considering the pressure pulsation. It avoids the damage caused by the extreme condition test to the unit and ensures the operation safety of the unit. Nonetheless, this study has some deficiencies. For example, the pressure correction formula proposed in this paper was mainly based on the single-unit load rejection condition, and the pressure pulsation phenomenon may be more serious under the multi-unit load rejection condition. However, considering the field experiment under this condition cannot be carried out at present, only a certain amount of allowance can be left on the prediction results. Further research will continue in the later stage.
Author Contributions
Conceptualization and methodology, J.Z. and L.Z. and X.Y.; numerical simulation and data analysis, L.Z. and X.Z.; paper writing, L.Z.; Review and revision of papers, J.Z. and X.Y.; English Editor, J.L.
Funding
This paper was supported by the National Natural Science Foundation of China (Grant No. 51839008 and 51879087).
Conflicts of Interest
The authors declare no conflict of interest.
References
- Mitani, T.; Aziz, M.; Oda, T.; Uetsuji, A.; Watanabe, Y.; Kashiwagi, T. Annual Assessment of Large-Scale Introduction of Renewable Energy: Modeling of Unit Commitment Schedule for Thermal Power Generators and Pumped Storages. Energies 2017, 10, 738. [Google Scholar] [CrossRef]
- Sankaramurthy, P.; Chokkalingam, B.; Padmanaban, S.; Leonowicz, Z.; Adedayo, Y. Rescheduling of Generators with Pumped Hydro Storage Units to Relieve Congestion Incorporating Flower Pollination Optimization. Energies 2019, 12, 1477. [Google Scholar] [CrossRef]
- Trivedi, C.; Cervantes, M.J.; Gandhi, B.K.; Dahlhaug, O.G. Transient Pressure Measurements on a High Head Model Francis Turbine During Emergency Shutdown, Total Load Rejection, and Runaway. J. Fluid Eng.-T Asme 2014, 136, 121107. [Google Scholar] [CrossRef]
- Trivedi, C.; Agnalt, E.; Dahlhaug, O.G. Experimental Investigation of a Francis Turbine during Exigent Ramping and Transition into Total Load Rejection. J. Hydraul. Eng. 2018, 144, 04018027. [Google Scholar] [CrossRef]
- He, L.; Wang, Z.; Kurosawa, S.; Nakahara, Y. Resonance investigation of pump-turbine during startup process. In Proceedings of the 27th IAHR Symposium on Hydraulic Machinery and Systems, Montreal, QC, Canada, 22–26 September 2014. [Google Scholar]
- Zhao, X.; Xiao, Y.; Xu, J.; Xu, W.; Sun, J.; Wang, Z.; Yao, Y. Unsteady Flow Analysis of Pump Mode Small Discharge Condition for a Francis Pump-turbine. In Proceedings of the 28th IAHR Symposium on Hydraulic Machinery and Systems, Grenoble, France, 4–8 July 2016; IOP Publishing Ltd.: Bristol, UK, 2016; Volume 49. [Google Scholar]
- Yu, X.; Zhang, J.; Miao, D. Innovative Closure Law for Pump-Turbines and Field Test Verification. J. Hydraul. Eng. 2015, 141, 05014010. [Google Scholar] [CrossRef]
- Rezghi, A.; Riasi, A. The interaction effect of hydraulic transient conditions of two parallel pump-turbine units in a pumped-storage power plant with considering “S-shaped” instability region: Numerical simulation. Renew. Energy 2018, 118, 896–908. [Google Scholar] [CrossRef]
- Yu, X.; Zhou, Q.; Zhang, L.; Zhang, J. Hydraulic Disturbance in Multiturbine Hydraulically Coupled Systems of Hydropower Plants Caused by Load Variation. J. Hydraul. Eng. 2019, 145, 04018078. [Google Scholar] [CrossRef]
- Hu, S.; Zhou, X.; Luo, Y.; Zhang, G. Numerical Simulation Three-Dimensional Nonlinear Seepage in a Pumped-Storage Power Station: Case Study. Energies 2019, 12, 180. [Google Scholar] [CrossRef]
- Chaudhry, M.H. Characteristics and Finite-Difference Methods. In Applied Hydraulic Transients; Chaudhry, M.H., Ed.; Springer: New York, NY, USA, 2014; pp. 65–114. [Google Scholar]
- Wylie, E.B.; Streetr, V.L.; Suo, L.S. (Eds.) Solution by Characteristics Method. In Fluid Transient in Systems; Prentice Hall: Upper Saddle River, NJ, USA, 1993; pp. 36–68. [Google Scholar]
- Suter, P. Representation of pump characteristics for calculation of water hammer. Sulzer Tech. Rev. 1966, 11, 45–48. [Google Scholar]
- Martin, C.S. Transformation of pump-turbine characteristics for hydraulic transient analysis. In Proceedings of the 11th IAHR Symposium on Section Hydraulic Machinery Equipment and Cavitation, Amsterdam, The Netherlands, 9–11 September 1982. [Google Scholar]
- Bouajila, S.; De Colombel, T.; Lowys, P.Y.; Maitre, T. Hydraulic Phenomena Frequency Signature of Francis Turbines Operating in Part Load Conditions. In Proceedings of the 28th IAHR Symposium on Hydraulic Machinery and Systems, Grenoble, France, 4–8 July 2016; IOP Publishing Ltd.: Bristol, UK, 2016; Volume 49. [Google Scholar]
- Shi, G.; Liu, X.; Wei, W.; Liu, Y. Pressure pulsation characteristics in pump as hydraulic turbine with guide vanes. J. Drain. Irrig. Mach. Eng. 2017, 35, 6–12. (In Chinese) [Google Scholar]
- Yaroslavsky, L. Digital Holography and Digital Image Processing; Springer: Boston, MA, USA, 2004; pp. 239–274. [Google Scholar]
- Castleman, K.R. Digital Image Processing; Prentice Hall: Upper Saddle River, NJ, USA, 1996; pp. 146–175. [Google Scholar]
- Wu, H.; Sun, J.; Zheng, L. The analysis of the different filtering algorithm effects on the fluorescence spectrum data processing. In Proceedings of the 3rd International Conference on Mechatronics and Industrial Informatics, Zhuhai, China, 30–31 October 2015; Choi, S.B., Ed.; Atlantis Press: Paris, France, 2015; Volume 31, pp. 46–51. [Google Scholar]
- Amiri, K.; Mulu, B.; Raisee, M.; Cervantes, M.J. Unsteady pressure measurements on the runner of a Kaplan turbine during load acceptance and load rejection. J. Hydraul. Res. 2016, 54, 56–73. [Google Scholar] [CrossRef]
- Fang, Y.J.; Koutnik, J. The numerical simulation of the delayed load rejection of a pump-turbine powerplant. In Proceedings of the 26th IAHR Symposium on Hydraulic Machinery and Systems, Beijing, China, 19–23 August 2012; IOP Publishing Ltd.: Bristol, UK, 2013; Volume 15. [Google Scholar]
Figure 1.
Characteristic line schematic diagram and grid: (a) Characteristic lines on x-t plane; (b) X-t feature line grid.
Figure 1.
Characteristic line schematic diagram and grid: (a) Characteristic lines on x-t plane; (b) X-t feature line grid.

Figure 2.
The characteristic curve of the pump turbine: (a) Unit discharge and unit speed four-quadrant characteristic curve; (b) Unit moment and unit speed four-quadrant characteristic curve.
Figure 2.
The characteristic curve of the pump turbine: (a) Unit discharge and unit speed four-quadrant characteristic curve; (b) Unit moment and unit speed four-quadrant characteristic curve.


Figure 3.
Unit node.

Figure 4.
Computational flow chart.

Figure 5.
Arrangement of the diversion system of a pumped storage power station.

Figure 6.
Schematic chart of pressure signal acquisition for single unit load rejection test.

Figure 7.
Pre-filtering pressure process line: (a) Spiral case pressure; (b) Draft tube inlet pressure.
Figure 7.
Pre-filtering pressure process line: (a) Spiral case pressure; (b) Draft tube inlet pressure.


Figure 8.
Filtered pressure process line: (a) Spiral case pressure; (b) Draft tube inlet pressure.

Figure 9.
Comparison between the measured data and numerical simulation results of field load rejection test: (a) No. 2 spiral case pressure process line; (b) No. 2 draft tube inlet pressure process line.
Figure 9.
Comparison between the measured data and numerical simulation results of field load rejection test: (a) No. 2 spiral case pressure process line; (b) No. 2 draft tube inlet pressure process line.
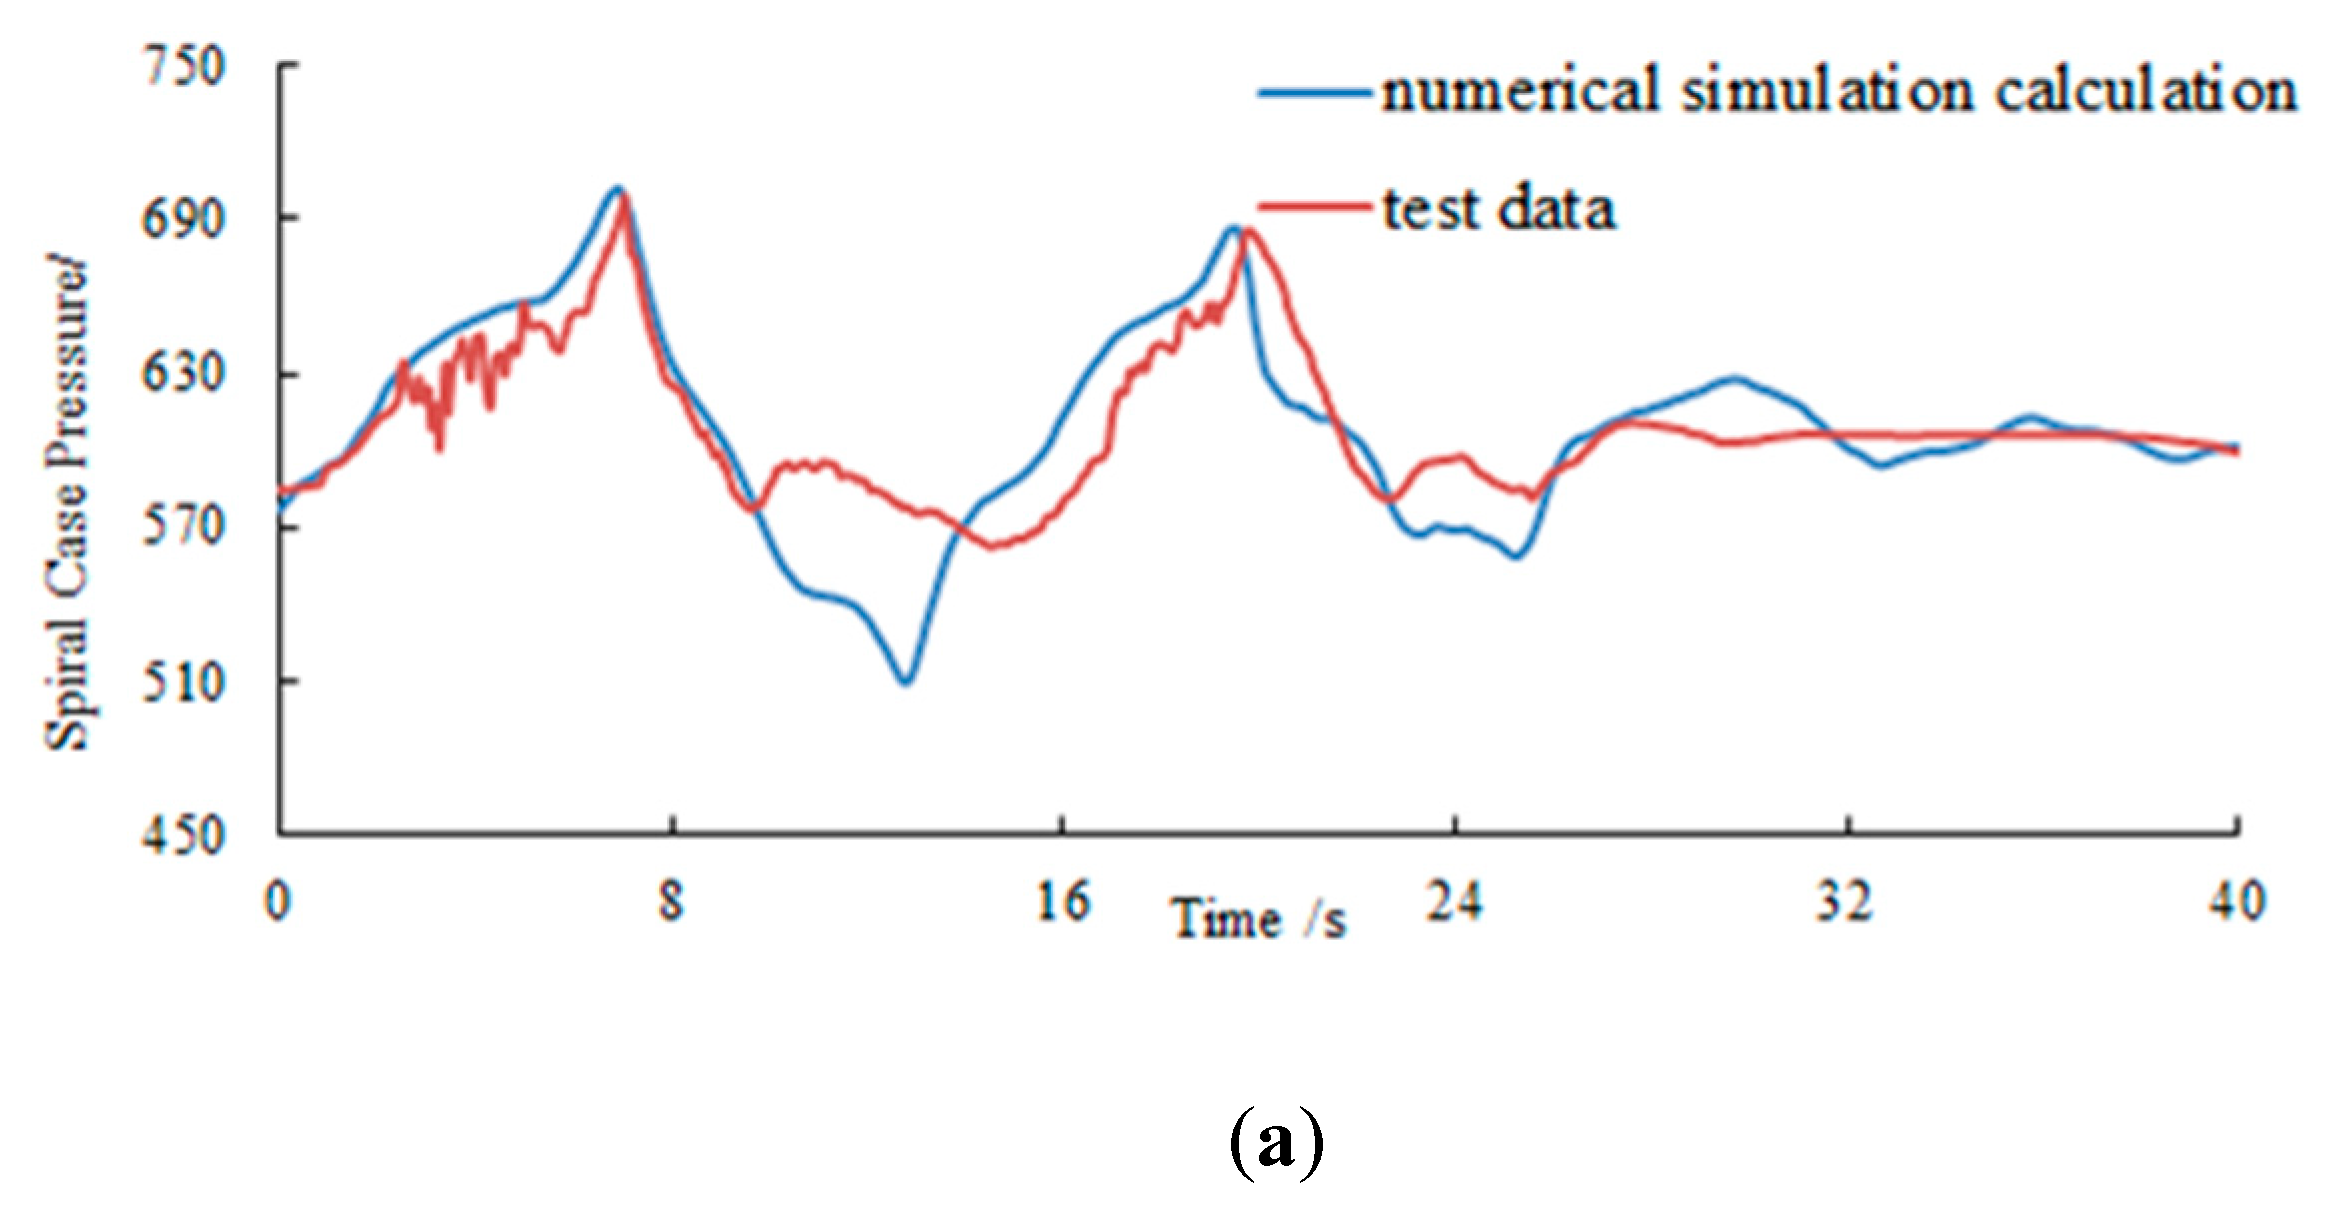

Figure 10.
Pressure extreme process line of spiral case under simultaneous load rejection.

Figure 11.
Pressure extreme process line of draft tube inlet under successive load rejection.


Table 1.
Rated parameters of water pump turbine.
| D1 (m) | Nr (MW) | Qr (m3/s) | nr (rpm) | Hr (m) | GD2 (t·m2) |
|---|---|---|---|---|---|
| 3.886 | 300 | 68.73 | 500 | 522 | 3600 |
Table 2.
Pressure diversion channel parameters of power station.
| Diversion Channel Number | L1 | L2 | l11 | l12 | l21 | l22 | l31 | l32 | l41 | l42 | L3 |
|---|---|---|---|---|---|---|---|---|---|---|---|
| Length (m) | 943.2 | 1095.3 | 180.5 | 120.6 | 200.3 | 116.8 | 220.2 | 107.7 | 238.6 | 115.7 | 1991.54 |
| Diameter (m) | 9.0 | 8.5 | 3.5 | 4.0 | 3.5 | 4.0 | 3.5 | 4.0 | 3.5 | 4.0 | 9.0 |
Table 3.
Description of field test conditions.
| Experimental Unit Number | Upper Reservoir Water Level (m) | Lower Reservoir Water Level (m) | Head Loss (m) | Net Head Before Load Rejection (m) | Output Power (MW) | Instructions |
|---|---|---|---|---|---|---|
| 2 | 805 | 278 | 4.88 | 522.12 | 300 | The guide vane closure rule is 30 s, a straight-line closure. |
Table 4.
Pressure sensor parameters for test.
| Measurement Items | Instrument Name | Model | Range | Accuracy | Number |
|---|---|---|---|---|---|
| Spiral case pressure of unit 2 | Pressure transmitter | MPM4730 | 10 MPa | 0.2 class | 1 |
| Draft tube Inlet Pressure of Unit 2 | Pressure transmitter | MPM4730 | 3 MPa | 0.2 class | 1 |
Table 5.
Comparisons between the measured data and numerical simulation extremum.
| Project | Maximum Pressure of Spiral Case (m) | Minimum Pressure at Draft Tube Inlet (m) |
|---|---|---|
| Measured data | 722.28 | 29.9 |
| Time averaged | 699.1 | 36.29 |
| Numerical simulation results | 702.13 | 32.68 |
Table 6.
Numerical simulation calculation conditions of control conditions.
| Calculate Target M | Upper Reservoir Water Level (m) | Lower Reservoir Water Level (m) | Head Loss (m) | Net Head Before Load Rejection (m) | Output Power Before Load Rejection (MW) | Instructions |
|---|---|---|---|---|---|---|
| Spiral case maximum pressure | 818.30 | 275.00 | 12.35 | 530.95 | 4 × 300 | Simultaneous load rejection of four units |
| Draft tube inlet Minimum pressure | 818.30 | 275.00 | 12.35 | 530.95 | 4 × 300 | 1#, 2# and 3# unit load rejection at the same time, at the most unfavorable moment point 4# unit load rejection |
Table 7.
Extremum of control conditions.
| Project | Numerical Simulation Calculation | Corrected Results |
|---|---|---|
| Spiral case maximum pressure (m) | 794.84 | 818.41 |
| draft tube inlet minimum pressure (m) | 1.38 | −5.12 |
© 2019 by the authors. Licensee MDPI, Basel, Switzerland. This article is an open access article distributed under the terms and conditions of the Creative Commons Attribution (CC BY) license (http://creativecommons.org/licenses/by/4.0/).
Share and Cite
MDPI and ACS Style
Zhang, L.; Zhang, J.; Yu, X.; Lv, J.; Zhang, X. Transient Simulation for a Pumped Storage Power Plant Considering Pressure Pulsation Based on Field Test. Energies 2019, 12, 2498. https://doi.org/10.3390/en12132498
AMA Style
Zhang L, Zhang J, Yu X, Lv J, Zhang X. Transient Simulation for a Pumped Storage Power Plant Considering Pressure Pulsation Based on Field Test. Energies. 2019; 12(13):2498. https://doi.org/10.3390/en12132498
Chicago/Turabian StyleZhang, Lei, Jian Zhang, Xiaodong Yu, Jiawen Lv, and Xiaoying Zhang. 2019. "Transient Simulation for a Pumped Storage Power Plant Considering Pressure Pulsation Based on Field Test" Energies 12, no. 13: 2498. https://doi.org/10.3390/en12132498
Note that from the first issue of 2016, this journal uses article numbers instead of page numbers. See further details here.