Experimental and Numerical Examination of Naturally-Aged Foam-VIP Composites †


1
Oak Ridge National Laboratory, One Bethel Valley Road, Oak Ridge, TN 37831, USA
2
Department of MEEP, Southern Illinois University, Carbondale, IL 62901, USA
*
Author to whom correspondence should be addressed.
†
This manuscript has been authored by UT-Battelle, LLC, under Contract No. DE-AC05-00OR22725 with the U.S. Department of Energy. The United States Government retains and the publisher, by accepting the article for publication, acknowledges that the United States Government retains a non-exclusive, paid-up, irrevocable, world-wide license to publish or reproduce the published form of this manuscript, or allow others to do so, for United States Government purposes. DOE will provide public access to these results of federally sponsored research in accordance with the DOE Public Access Plan (http://energy.gov/downloads/doe-public-access-plan ).
Energies 2019, 12(13), 2539; https://doi.org/10.3390/en12132539
Submission received: 12 June 2019
/
Revised: 25 June 2019
/
Accepted: 27 June 2019
/
Published: 2 July 2019
(This article belongs to the Special Issue Energy Efficiency in Plants and Buildings 2019)
Abstract
:This article describes an aging study of a foam-vacuum insulation panel (VIP) composite insulation board installed on a test wall in a natural exposure test facility through a 30-month period. Silica-based VIPs with a polymeric barrier film were used in this study. The study results showed the effectiveness of a VIP-based insulation to reduce the heat gains and losses through a wall compared to regular rigid foam insulation of the same thickness. However, the long-term performance monitoring indicated a gradual decline in the thermal performance of the foam-VIP composite. In addition, one-dimensional numerical models were created to simulate the in situ behavior of the foam-VIP composite. One model utilized constant thermal conductivities of the test wall components and another utilized temperature-dependent thermal conductivities; the latter used measurements of conductivity over temperatures ranging from −15 to 55 °C. The results of the simulations emphasized the need to use both temperature and time-dependent material properties for accurately predicting the long-term performance of VIP-based insulation systems.
1. Introduction
A study by the United States (U.S.) Energy Information Administration, estimated an increase in global energy consumption by about 45% from 2017 to 2040 [1,2]. The building sector contributes to about 40% of the energy consumption, highest among all sectors, and 30% of the CO2 emissions [3,4]. Thus, reducing building energy consumption would play a crucial role on a path towards future sustainability. Reducing the overall thermal transmittance of building envelopes is a key aspect for better thermal comfort and reduced energy consumption of buildings. The need for insulation materials with better thermal properties led researchers to investigate vacuum insulation panels (VIPs) [5] for building applications such as exterior walls of apartment buildings [6], multi-layered wall components with VIPs [7], etc. VIPs can achieve center-of-panel (COP) conductivities of 0.003–0.005 W/m·K, which are much lower than traditional building insulation materials [8]. Despite their superior performance, implementation of VIPs in buildings faces challenges regarding their service life and performance under realistic climate conditions [9,10]. There are only a handful of studies on aging of VIPs in real building applications [11,12,13]. In addition to the change in thermal performance over time, insulation materials, including VIPs, exhibit temperature-dependent properties [14,15,16], which need to be considered for dynamic heat transfer analyses of building components [15].
Berardi [17] performed hygrothermal simulations of wall and roof systems with typical fiber and foam insulations under climate conditions of Toronto, Canada, which has a humid continental climate with hot summers and very cold winters. The author found that using constant thermal conductivity can result in underestimation of energy demands for thermal comfort. Berardi et al. [15] extended the hygrothermal analysis to three different climate types in Italy, including humid temperate (cold winters and hot summers), warm temperate (warm winters and hot summers) and semi-arid (moderately cold winters and hot and dry summers). The hygrothermal simulations showed that, for most cases, the assumption of constant conductivity provided a reasonable approximation of the insulation performance. However, under certain conditions, like a flat roof under cold winter conditions, the assumption of constant conductivity significantly under- or over-estimated the heating loads [15]. Fantucci et al. [18] studied the impacts of aging and temperature on the thermal conductivity of VIPs via measurements and applied those results to transient heat transfer simulations of a pitched roof system containing a VIP. Compared to measured temperatures over a 15-day period, the simulated temperatures using a constant conductivity and temperature-dependent conductivity of VIPs showed root mean square errors of 1.33 °C and 1.18 °C, respectively. Annual simulations revealed small underestimations (≤3.2%) in integrated monthly heat losses with a constant VIP thermal conductivity vs. temperature-dependent conductivity; however, the integrated monthly heat gains were underestimated by up to 15.4% and maximum heat gains were underestimated by up to 21.2% with a constant thermal conductivity assumption [18].
Recently, Biswas and co-workers [14,19] described the development and characterization of composite foam boards containing fully-encapsulated VIPs. Based on laboratory evaluations, the composite boards could achieve a thermal resistance of 4.46 m2·K/W at 5.1 cm thickness. Biswas et al. [14] also described the installation of a composite board as exterior wall insulation in a natural exposure test facility in Charleston, South Carolina, USA for long term testing and presented measured temperatures and heat fluxes from the test wall over a 12-month period. The performance of the test wall with the foam-VIP composite board was compared to the performance of a baseline test wall which contained 5.1 cm of regular polyisocyanurate (PIR) foam board as exterior insulation. This study extends the long-term evaluation of the Charleston test walls to a 30-month period and summarizes the change in performance of the composite board with respect to the regular PIR board.
In addition, this study presents one-dimensional (1D) models of the Charleston test wall with constant and temperature-dependent thermal conductivities of the test wall components, including VIPs. The thermal conductivities were measured using a heat flow meter (HFM) according to ASTM C518 [20]. The simulations are intended to evaluate the impact of the thermal conductivities used as inputs to the 1D models on their ability to match the experimental results that are based on real material properties that are, in turn, influenced by both temperature variations and aging-related effects [10,21,22].
2. Experimental Methods
2.1. Natural Aging
Two test walls were installed in a natural exposure test (NET) facility in Charleston for long-term natural aging and thermal performance evaluation [14]. Charleston lies in ASHRAE climate zone 3A, which is defined as warm-humid [23]. The NET facility is a single-story building with mechanical heating and cooling. The facility is designed to accommodate side-by-side roof/attic and wall assemblies for long term testing under real building conditions. Figure 1 shows the south-east facing wall of the NET facility that can accommodate multiple test walls. Test walls are typically 2.64 m × 1.22 m in dimensions and are usually instrumented with temperature (T), humidity and heat flow sensors. The data are collected and monitored over the desired time period, several months and even years, for long-term thermal performance evaluation.
Two side-by-side test walls were installed for long-term evaluation and comparison: one with the composite foam-VIP board as the exterior continuous insulation (CI) layer and another with 5.1 cm regular PIR board as the CI. Except the exterior CI layer, both test walls were built identically: interior sheathing (1.3 cm gypsum board), wood framing (studs), cavity insulation (fiberglass batts of nominal thermal resistance 2.3 m2·K/W) and exterior sheathing (1.3 cm oriented strand board or OSB). The studs were “2 × 4”, i.e., 8.9 cm deep and 3.8 cm thick. Figure 2 shows a schematic representing the plan view (cross-section) of the test wall with the foam-VIP composite, along with the locations of various sensors, and a photograph of a vertical section of the foam-VIP test wall with the sensors installed on the interior OSB surface. In the second test wall, the foam-VIP composite was replaced with regular PIR board of the same thickness (5.1 cm). The sensors were scanned at 60 s intervals and time-averaged data were recorded on an hourly basis.
2.2. Thermal Conductivity Measurements
Conductivities of materials were measured according to ASTM C518 [20] using an HFM. The HFM consists of two independently temperature-controlled plates with embedded heat flow sensors that sandwich the test specimens. By measuring the temperature difference across the sample, the heat flow and the sample thickness, the conductivity of the sample can be determined following Fourier’s law, assuming one-dimensional heat flow. The samples used for measurements were nominally 0.61 m x 0.61 m and of the same thickness as the materials used in the test walls. The measurement area, i.e., the size of the embedded heat flow sensors, within the HFM plates was 25.4 cm × 25.4 cm. The stated uncertainty of the conductivity measurements using the HFM is ±1%.
The foam-VIP composite consisted of the VIPs sandwiched by 1.3 cm of high-density PIR and 1.3 cm regular-density PIR [14]; in further discussions, the high-density PIR is referred to as HD-PIR and PIR refers to regular-density PIR. The VIPs used for the conductivity measurements were created by the same manufacturer using the same raw materials (fumed silica core and polymeric barrier film) but were from a different batch from the VIPs used to create the foam-VIP composites. HD-PIR and PIR samples of 1.3 cm thickness were obtained from the same foam manufacturer that created the foam-VIP composite boards.
3. Simulation Methodology
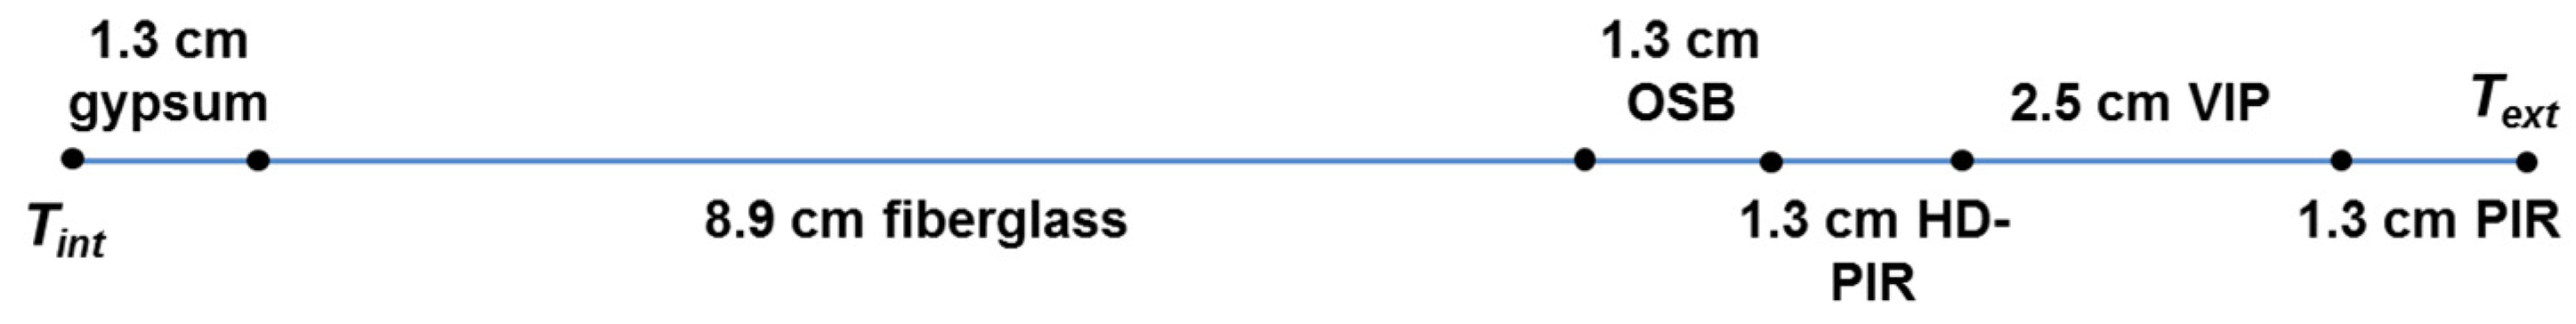
The simulations were performed using the Heat Transfer Module of COMSOL Multiphysics (https://www.comsol.com/heat-transfer-module). For this study, a one-dimensional model was utilized, as shown in Figure 3. The 1D model represents the centerline of the horizontal cross-section of the test wall shown in Figure 2. The different wall components and their linear dimensions are illustrated in Figure 3. The measured transient interior (Tint) and exterior (Text) surface temperatures were used as the boundary conditions.
The simulations were performed using both constant and temperature-dependent thermal conductivities of all wall materials. The constant thermal conductivities were based on measurements at a mean temperature of 23.9 °C, which is the temperature at which thermal resistance of insulation materials are typically rated in North America. The temperature-dependent thermal conductivities were measured at mean temperatures ranging from −10 to 50 °C. Table 1 lists the material properties used in the constant conductivity (‘kc’) simulations. Values of specific heat (‘cp’) and density (‘ρ’) were based on measurements and commonly available literature for building material properties.
4. Results and Discussion
4.1. Natural Aging Results
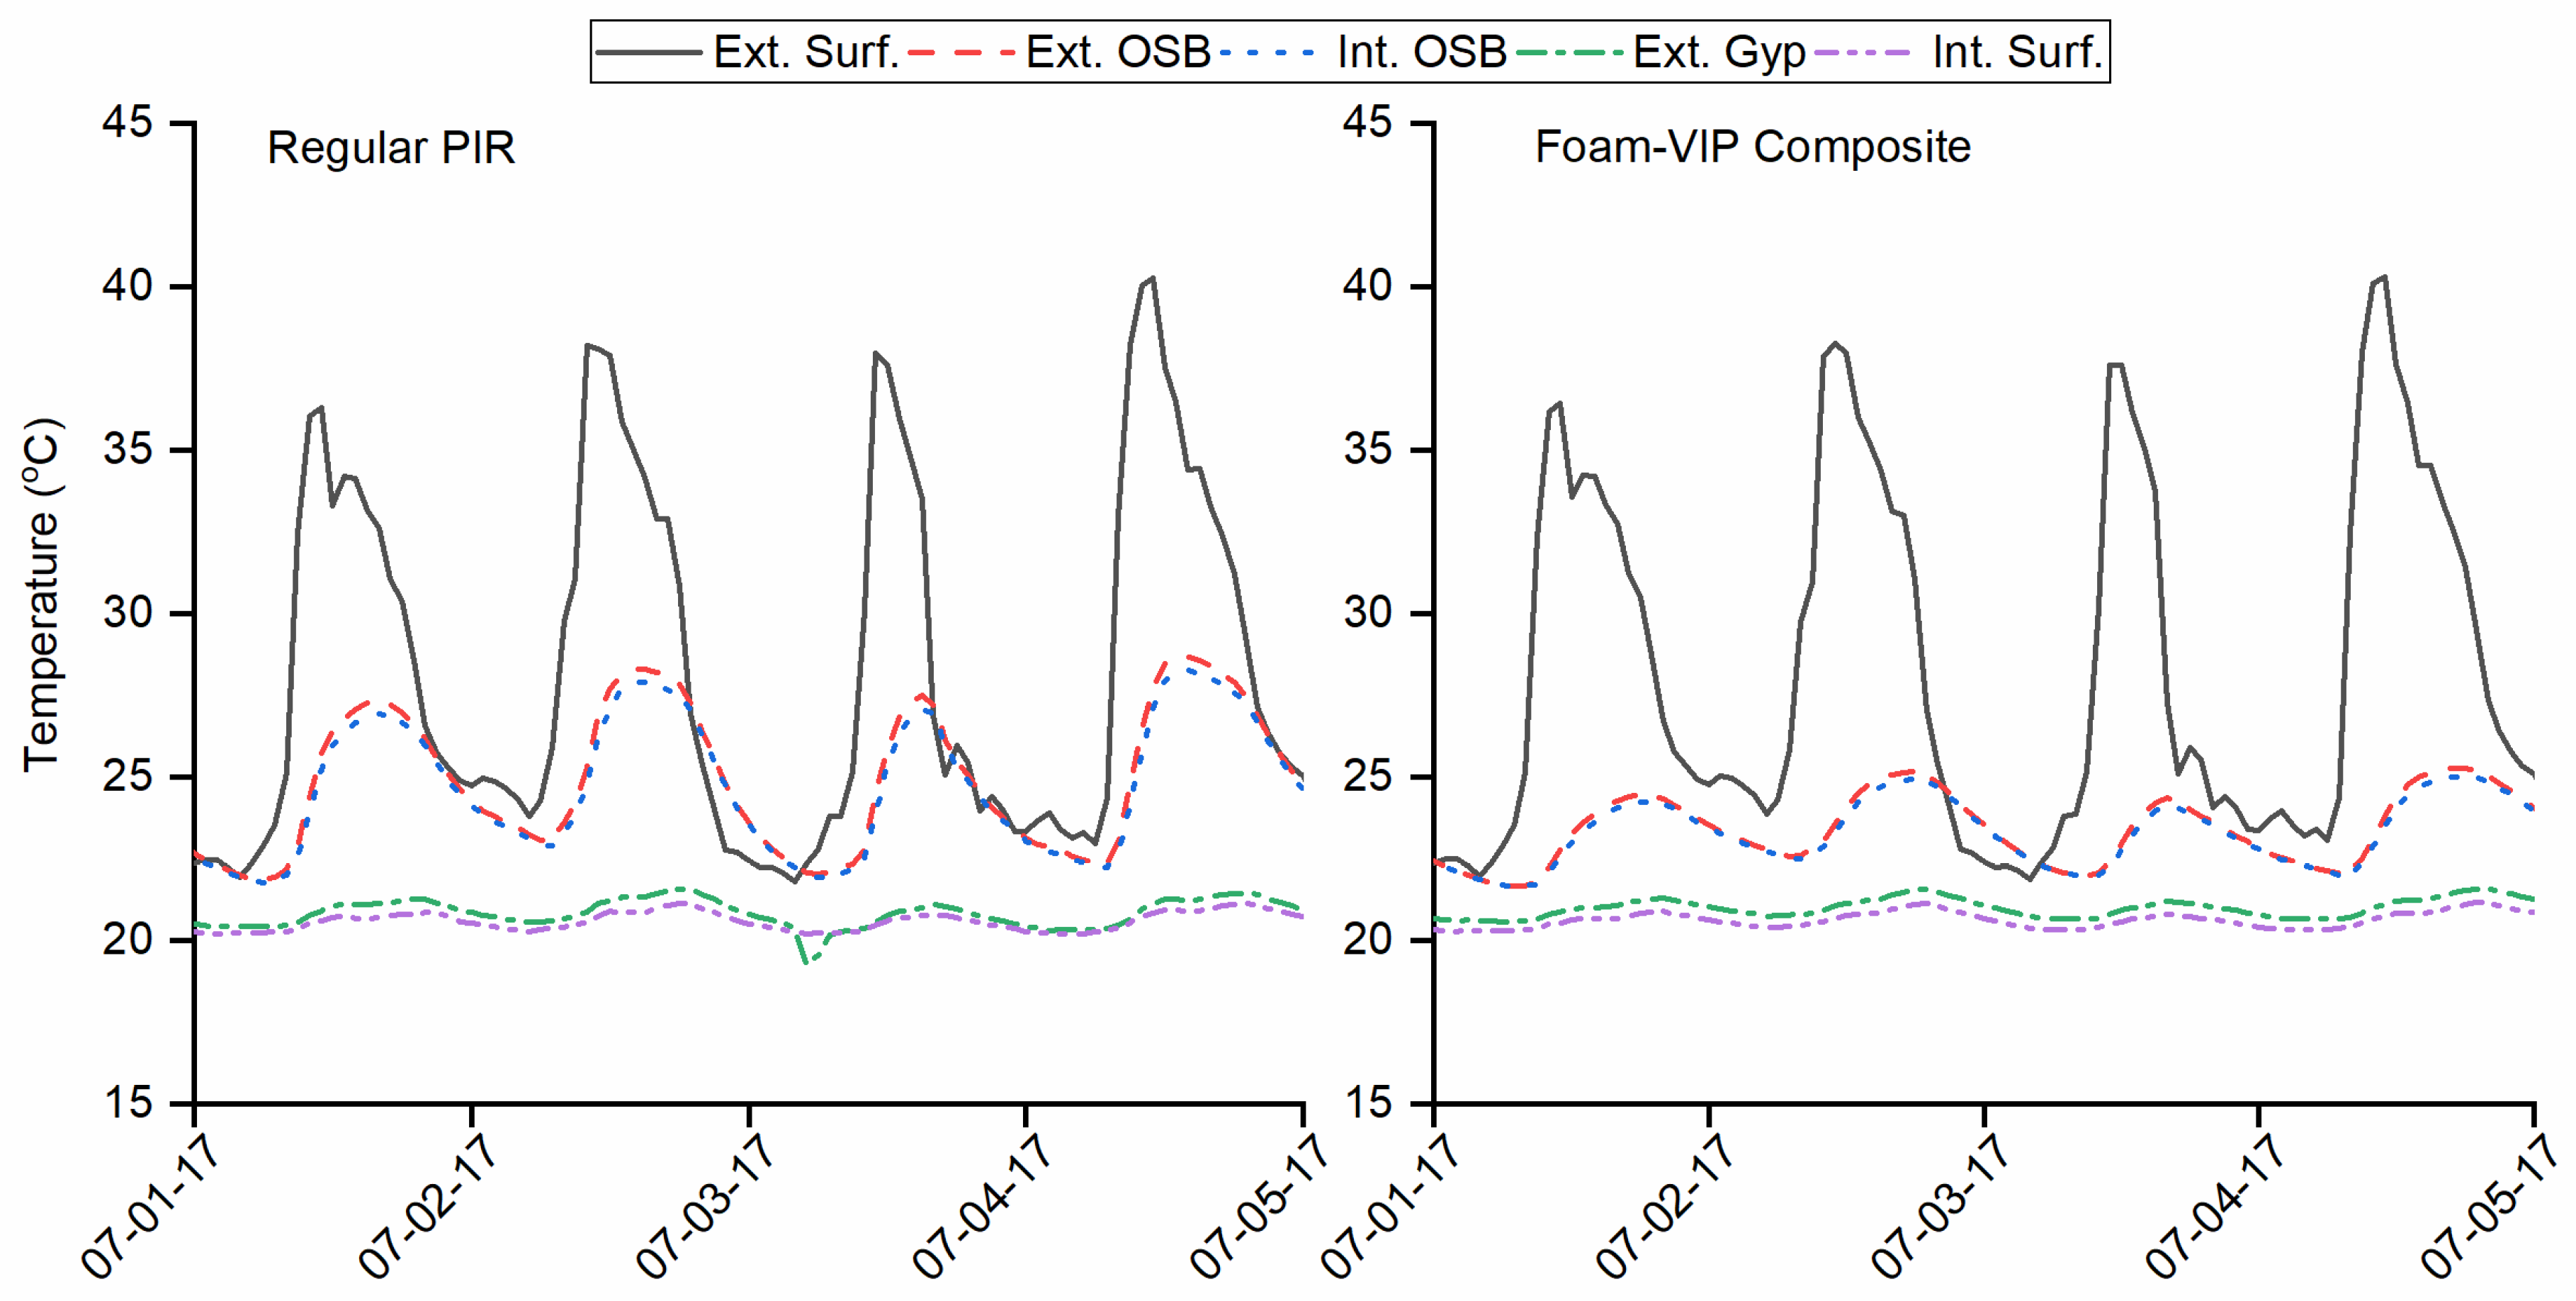
Here, comparative temperatures and heat fluxes from the test walls with the foam-VIP composite and regular PIR board are presented and discussed. Figure 4 compares the temperature distributions across the two test walls over several days during summer of 2017. ‘Ext.’ and ‘Int.’ refer to the surfaces of the OSB and gypsum (‘Gyp.’) layers facing towards the building exterior and interior conditioned space, respectively. The exterior and interior surface temperatures were similar for the two test walls, as these temperatures are driven by the outdoor and interior conditions, respectively. However, there are discernible differences in the measured OSB surface temperatures of the two walls. As expected, the foam-VIP composite is much more effective than PIR in dampening the temperature fluctuations due to the outside surface temperatures.
Figure 5 shows the measured hourly heat flows (q, W/m2) through the two test walls at the OSB–cavity interface. It is noted that the HFTs used for these evaluations measure the heat flows through a small area that is coincident with the center of the VIPs and therefore do not represent the overall performance of the foam-VIP composite board vs. the regular PIR. However, these measurements are useful in understanding the long-term behavior of the foam-encapsulated VIPs. Figure 6 compares the monthly integrated heat gains and losses from the test walls, measured at the OSB–cavity interface; the heat loss magnitudes are shown without the negative sign. Monthly heat gains were calculated by integrating the positive hourly heat flows into the building; monthly heat losses were calculated by integrating the negative heat flows that were going from the building to the outside. As expected, the peak heat gains and losses were substantially lower with the foam-VIP composite board.
Next, the percent reduction in monthly heat gains and losses due to the foam-VIP composite board compared to the regular PIR board were calculated during summer and winter months of subsequent years, and are shown in Figure 7. The percent reductions were observed to be progressively lower during subsequent years. For example, during December 2016, the percent reduction in the monthly heat loss with the composite board compared to the PIR board was 52.5%, but the percent reductions dropped to 47% and 43.4% during December 2017 and December 2018, respectively. Considering the winter months of December, January, February and March, the average percent reductions during the three years were 54%, 48% and 45.2%. Thus, the average drop in percent reduction from year 2 (2017–18) to year 3 (2018–19) was 2.8, which is about half that of the average drop of 6 from year 1 (2016–17) to year 2 (2017–18).
Considering the summer months, the average reductions during 2017 and 2018 were 47.4% and 44.5%. It is further noted that the percent reductions in heat flows with the foam-VIP composites vs. regular PIR were lower during the summer months compared to the winter months during corresponding years of aging. A possible reason is that the combination of high temperature and high humidity during summer months has an adverse impact on the thermal performance of VIPs; such impacts have been shown in past aging studies such as [10]. Figure 8 shows the outdoor temperature and relative humidity (RH) during the aging test period. The maximum daily RH was close to 100% at all times, but combined with the high temperature during summer periods, the overall thermal performance of the foam-VIP composite is expected to be lower during summer months.
The tests are ongoing to collect more data and evaluate how the percent reductions change over additional years. However, the data so far suggest a small but discernible degradation in thermal performance of the foam-VIP composite boards compared to regular PIR. The VIPs used in the composite contained a polymeric barrier film. Replacing the polymeric film with a metallized film is expected to yield better long-term performance.
4.2. Measured Thermal Conductivities
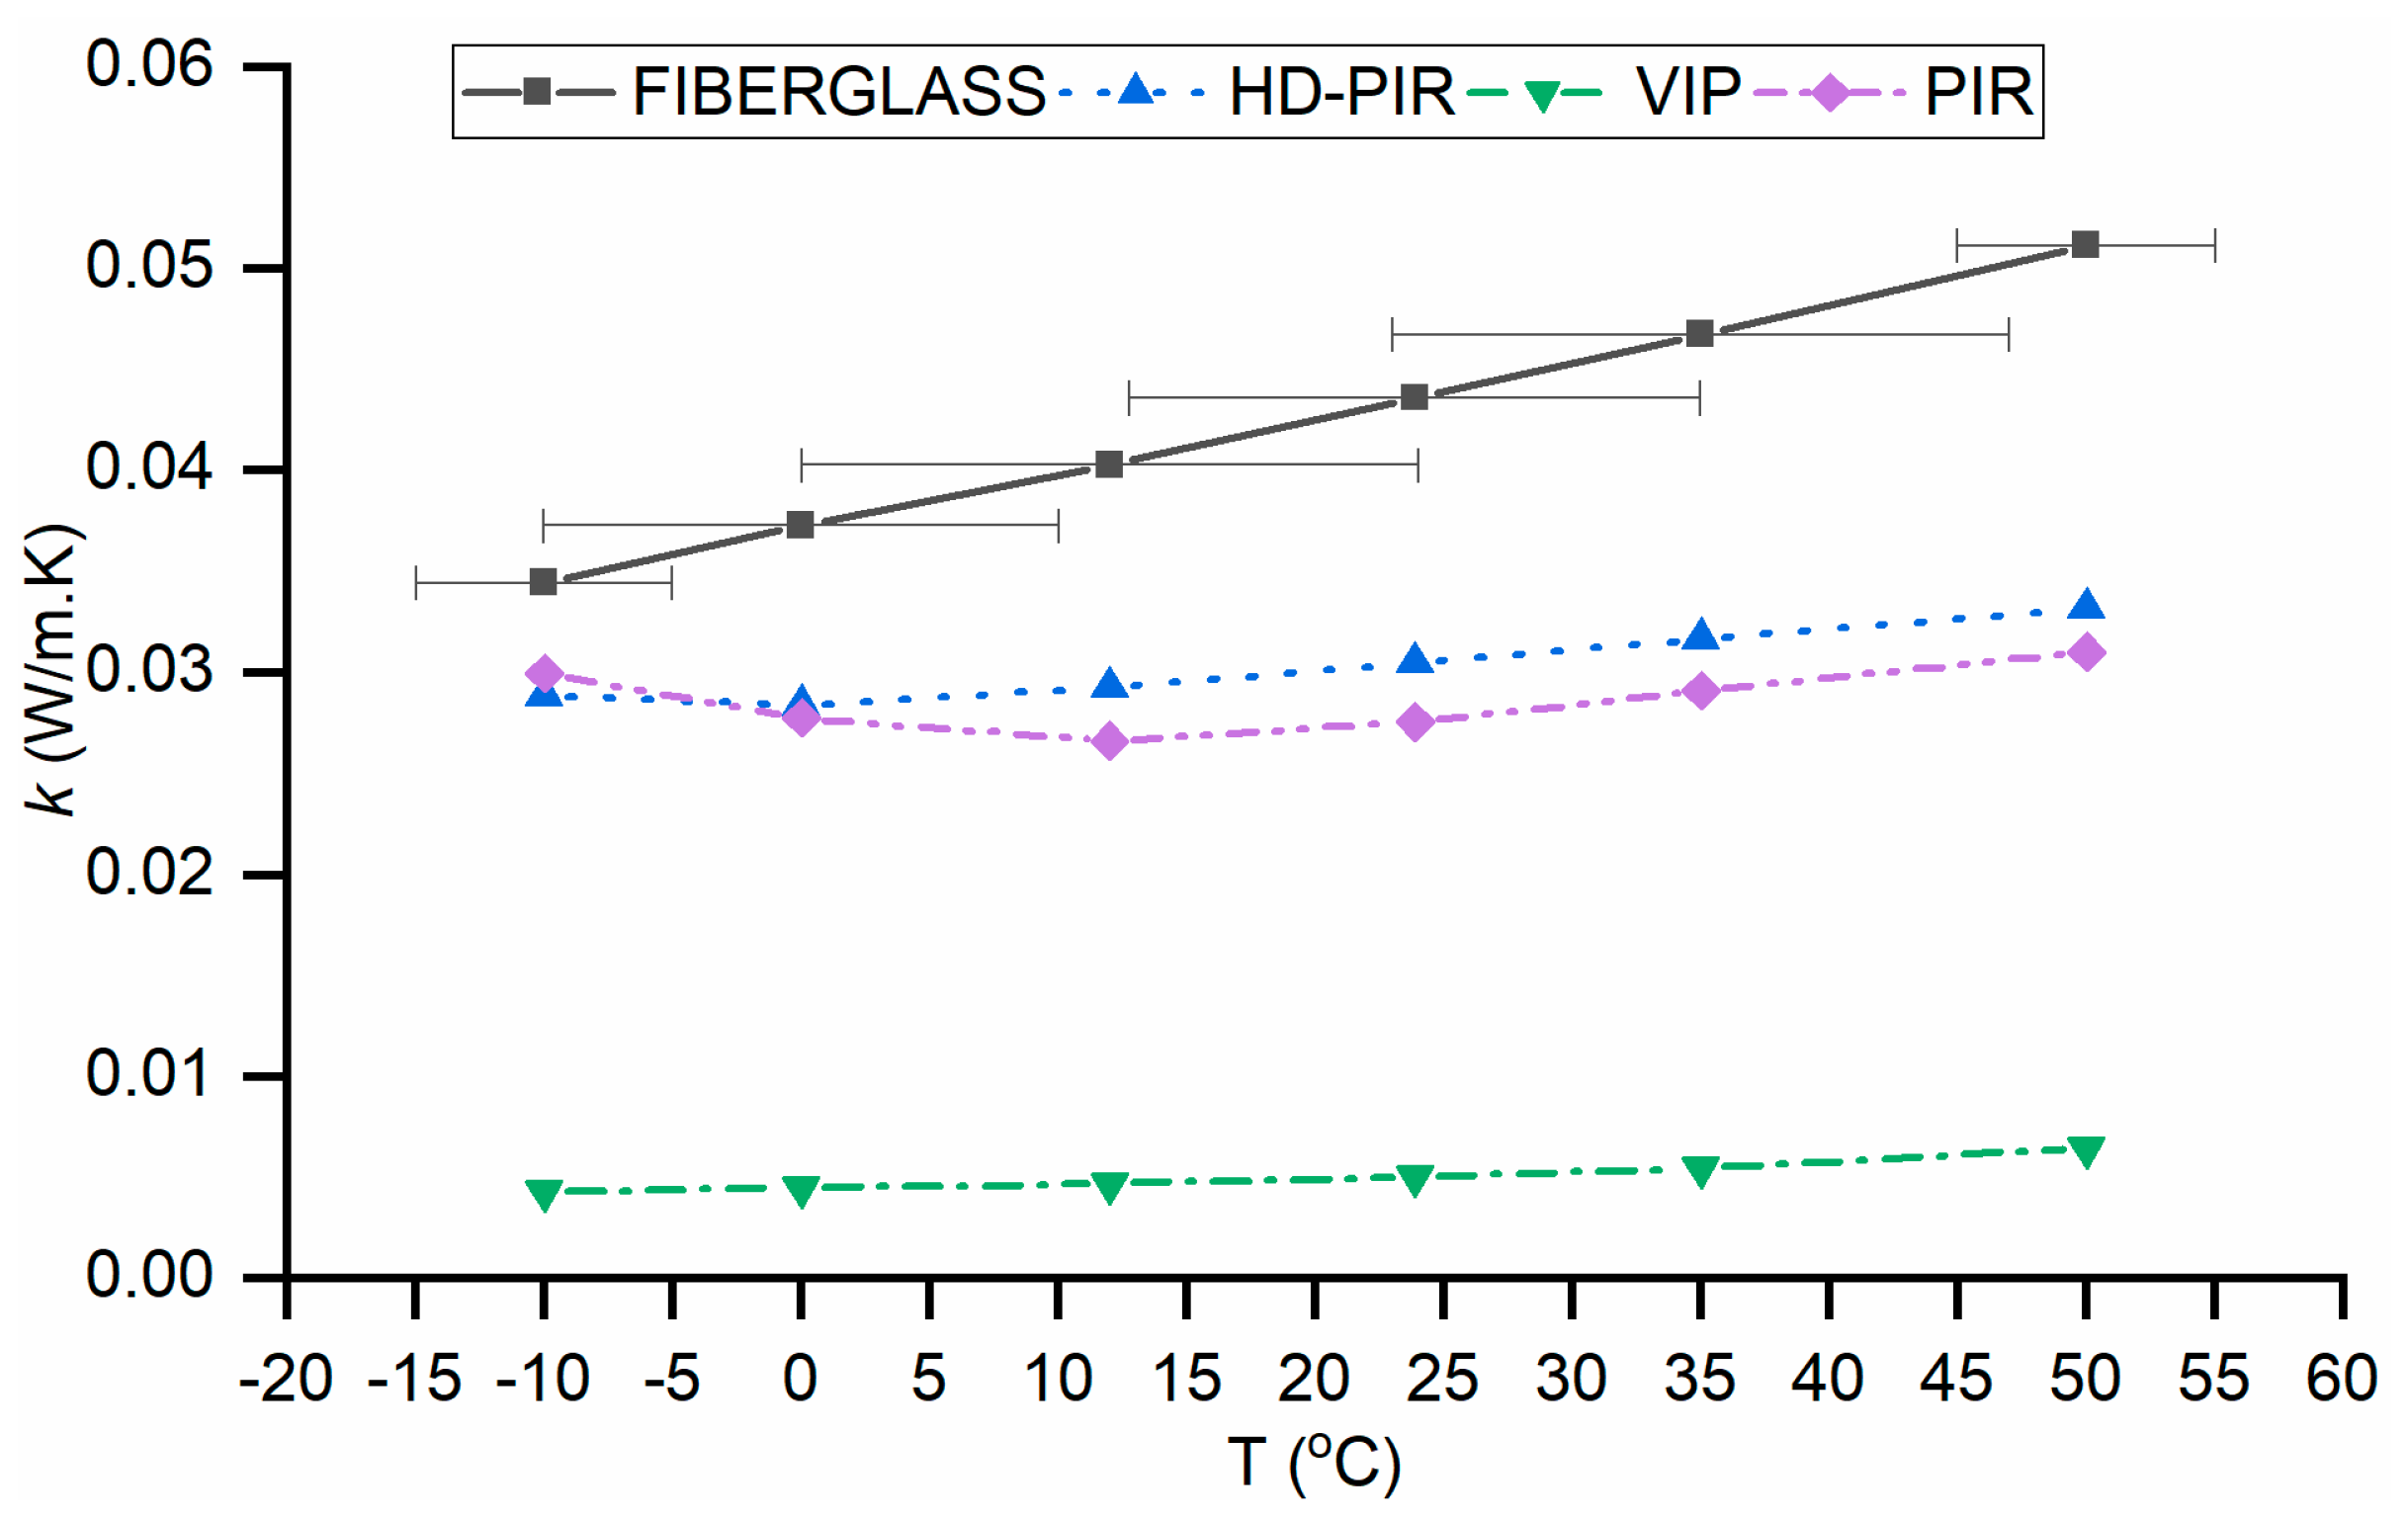
Temperature-dependent thermal conductivities were measured of all materials used in the model. The materials used for these measurements were of the same thickness as the ones installed in the Charleston test wall and originated from the same sources. The VIP, PIR and HD-PIR samples were obtained from the same respective manufacturers. The other materials were of the same brand and were acquired locally. Figure 9 shows the measured thermal conductivities of the insulation materials as functions of temperature. The measurements were made according to ASTM C518 [20]. The conductivities are shown as functions of the mean measurement temperatures in Figure 9. The plate temperatures, i.e., the temperature difference imposed on the specimens, are represented by the horizontal bars associated with the fiberglass conductivity plot. The same temperatures were used for measurements of all samples. The conductivities of fiberglass and VIP samples rose monotonously with temperature, but the conductivities of PIR and HD-PIR samples showed a non-linear behavior. Higher conductivities of PIR foam are typically observed at low temperatures due to condensation of the blowing agents within the PIR microstructure [15].
Though they are not shown in Figure 9, thermal conductivities of gypsum board and OSB samples were also measured. The conductivity of gypsum board varied almost linearly from 0.162 to 0.165 W/m·K at mean temperatures of −10 to 50 °C. The OSB conductivity varied from 0.092 to 0.112 W/m·K over −10 to 50 °C.
4.3. Simulation Results
The primary intent of the simulations was to check the need for incorporating temperature-dependent thermal conductivities as model inputs by comparison with measurements from natural aging tests. The hourly measured exterior and interior surface temperatures were used as the boundary conditions for the 1D model shown in Figure 3. The calculated (‘Cal.’) and measured heat fluxes at the OSB-fiberglass interface were compared to evaluate the efficacy of the simulations. Two sets of simulations were performed, one with constant thermal conductivities at 23.9 °C (‘const. k’) and another with temperature-dependent conductivities (k(T)) of the different materials.
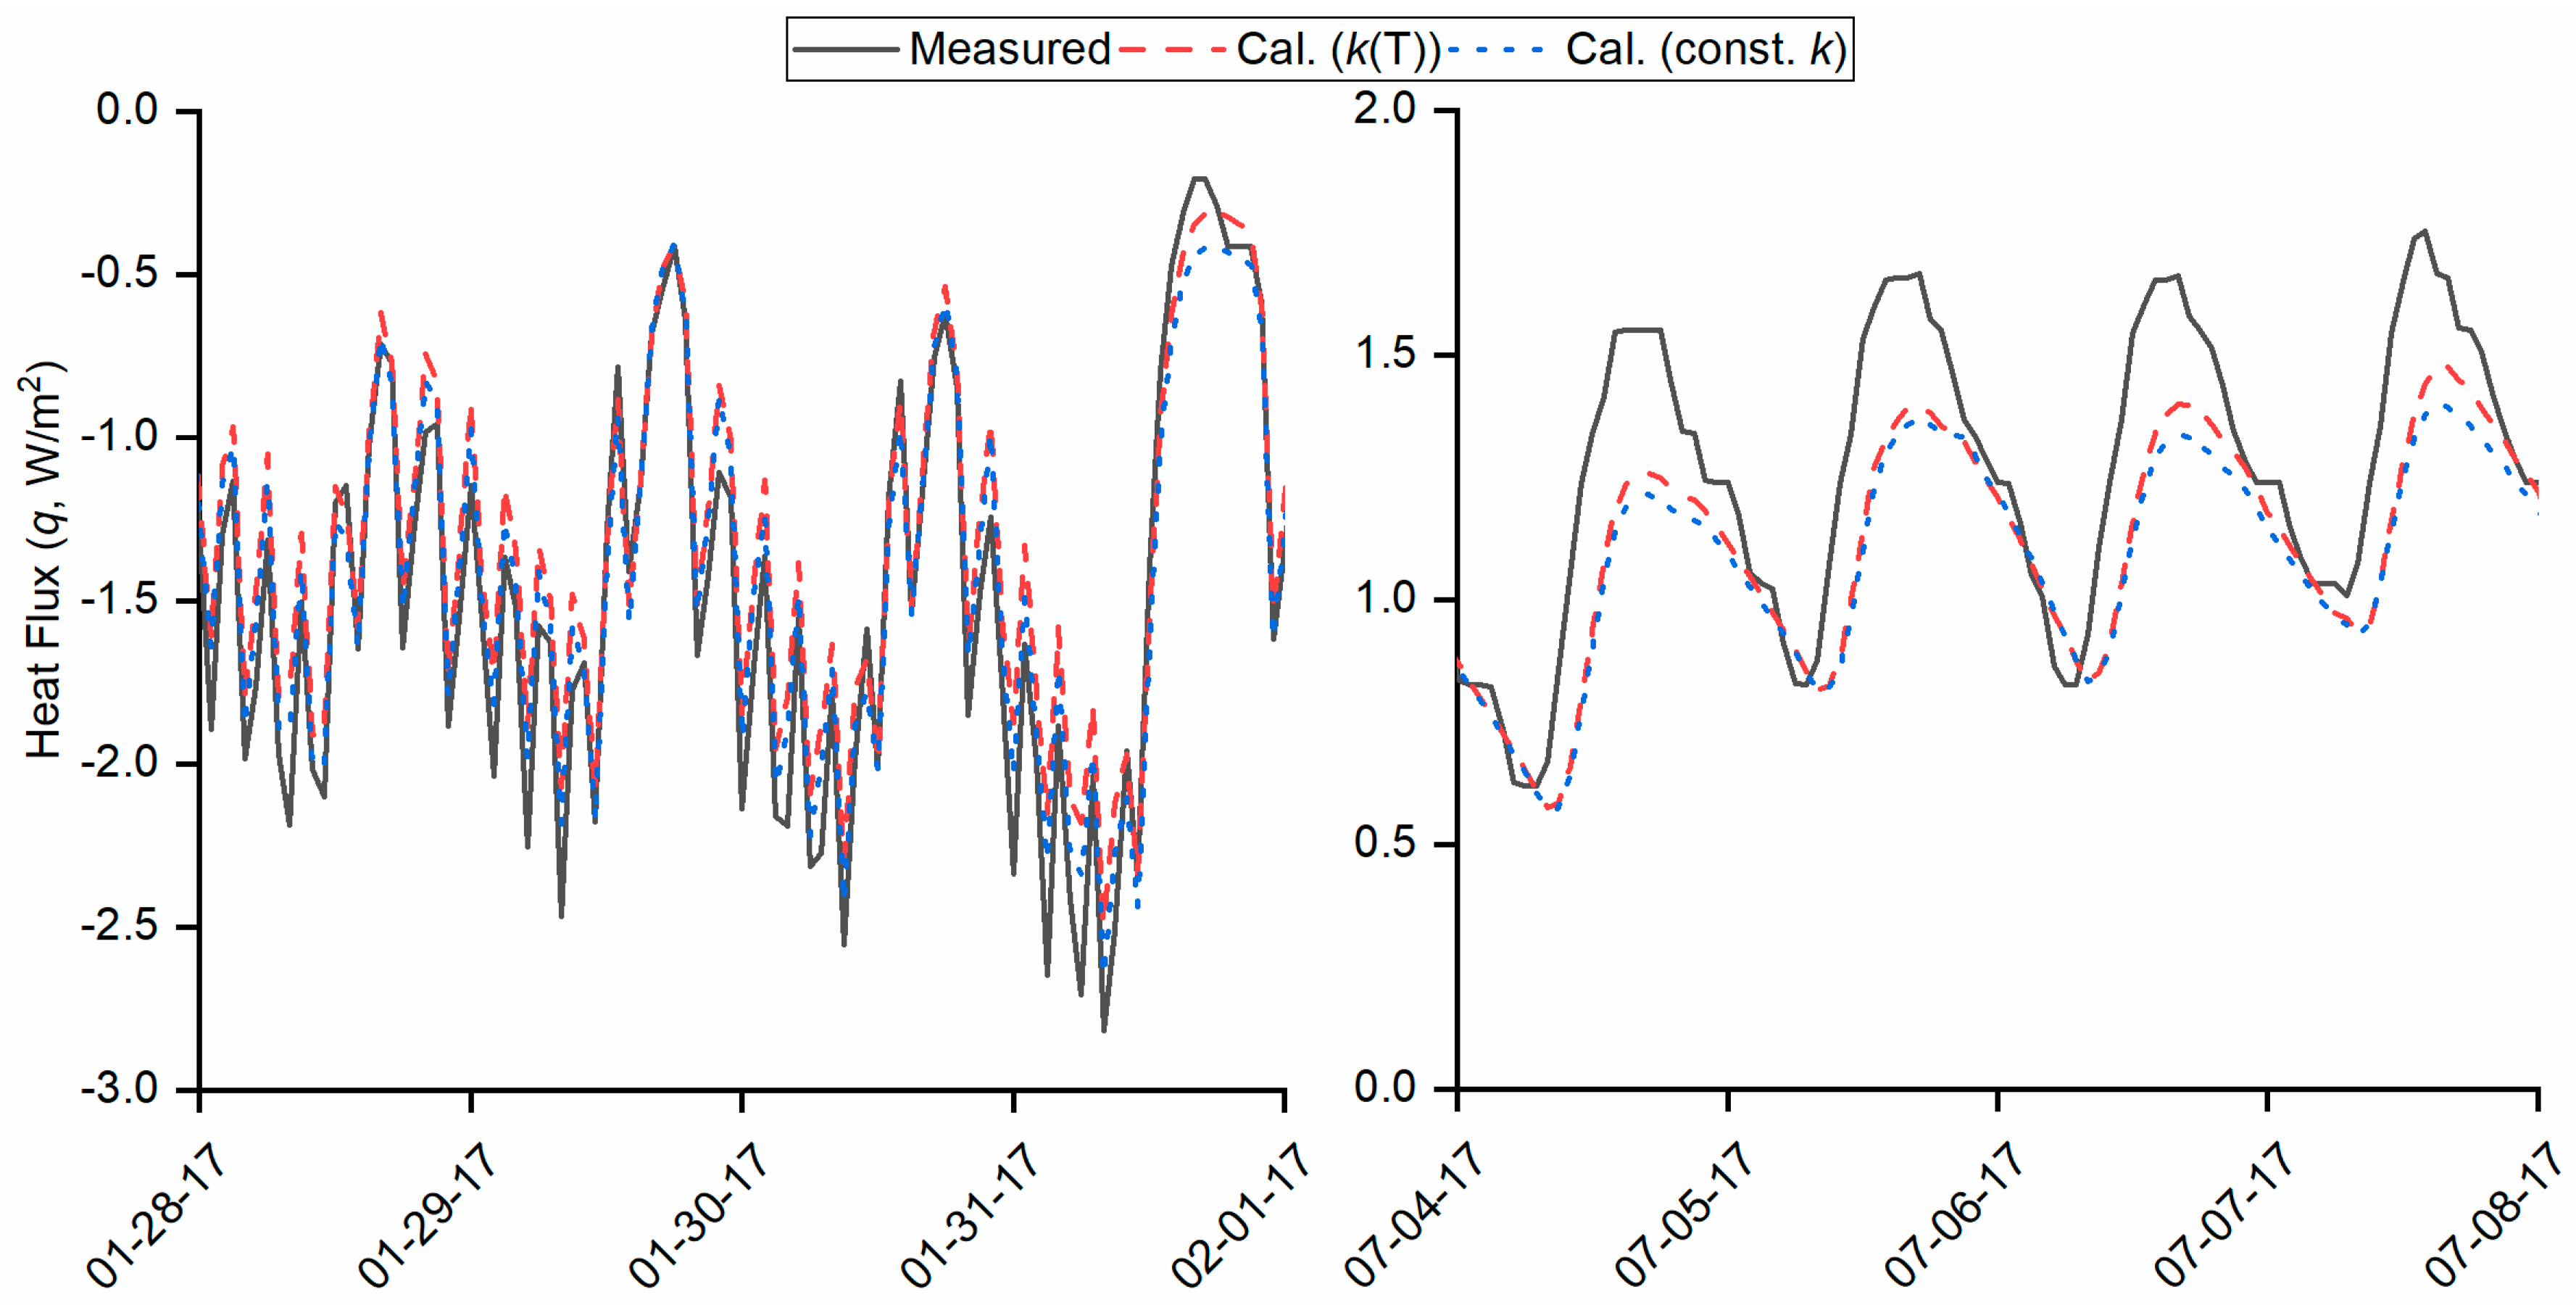
Figure 10 compares the measured and calculated heat fluxes over 4-day periods during the first winter and summer of the natural aging test. The quick oscillations in the heat fluxes during winter were caused by the heating system turning off and on in response to the heating set point; similar oscillations were observations in the interior surface and room temperatures. The agreement between the calculations and measurements was observed to be better during the winter period. It is interesting to note the behavior of the calculated heat fluxes with ‘const. k’ and ‘k(T)’. During the winter period, the calculated heat flux magnitudes with the ‘k(T)’ model were consistently lower than the ‘const. k’ model, and vice-versa during the summer period. This is as per expectations, given the temperature-dependent conductivities of the VIP, which dictates the overall thermal resistance of the wall. Figure 11 shows the calculated temperatures at the mid-point of the VIP from the ‘k(T)’ model. During winter, the temperatures were predominantly below 23.9 °C and the temperatures were predominantly above 23.9 °C during summer. As mentioned earlier, the ‘const. k’ model used the measured conductivity at 23.9 °C. As observed from Figure 4, the conductivity of VIP increased consistently from low to high temperatures. Thus, the calculated winter heat fluxes are expected to be lower and the calculated summer heat fluxes higher with the ‘k(T)’ model.
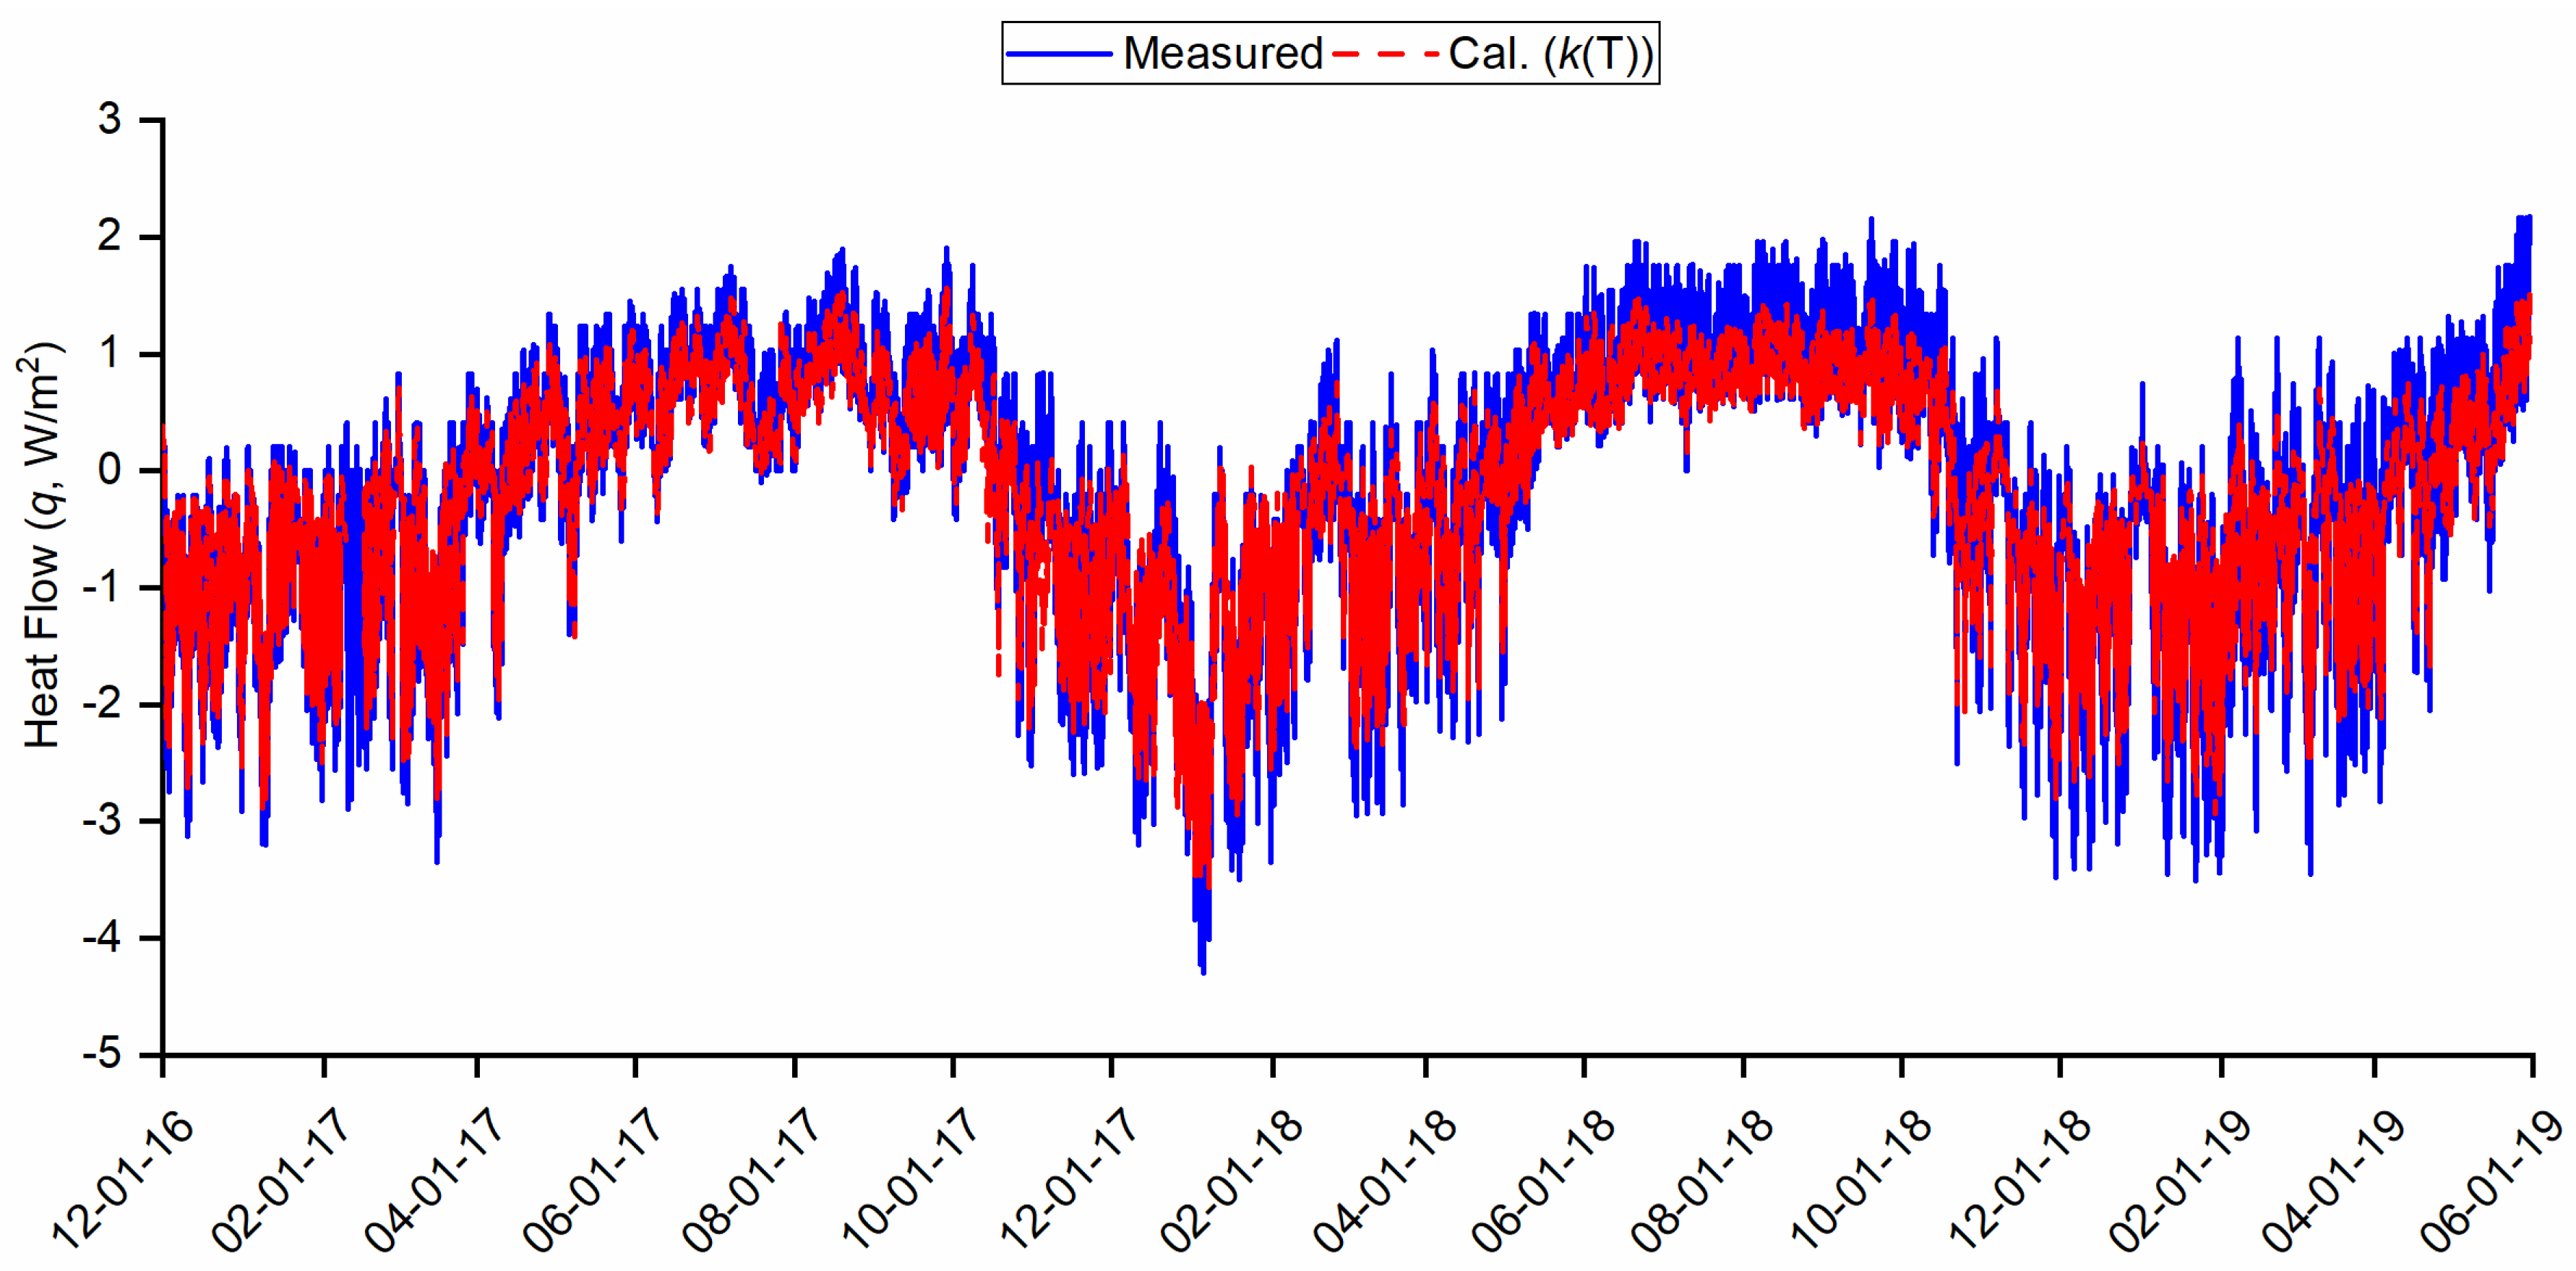
Figure 12 compares the measured and the ‘k(T)’ model-calculated heat fluxes over the entire natural aging test period. In general, the model underestimates the peak heat fluxes during both winter (peak heat losses) and summer (peak heat gains). The discrepancies can be due to uncertainties in the measurements and test wall configuration that are not captured by the model. Another possible reason is presence of two-dimensional heat transfer effects due to the edge effects around the VIPs [19] and wood framing that is not captured by the 1D model that coincides with the center of the cavity. However, the discrepancies are observed to increase over time and are more pronounced during the summer periods (May–September) of 2017 and 2018. Table 2 lists the average of the percent difference between the measured and calculated peak heat gains during the month of May from 2017 to 2019. The average percent differences increased progressively with both the ‘const. k’ and ‘k(T)’ models. The results presented in Figure 12 and Table 2 clearly indicate the impact of the gradual thermal performance degradation of the test wall due to aging of the VIP resulting in higher measured heat fluxes during subsequent years. The aging phenomenon is currently not captured by the 1D model, which only incorporates temperature-dependent conductivities.
5. Summary, Conclusions and Future Work
This article evaluates the natural aging of a foam-VIP composite insulation in a real building application. The long-term performance of the foam-VIP composite is compared to a regular polyisocyanurate foam insulation board. The VIPs consist of a fumed silica core and polymeric barrier films. Based on the test data, the VIPs are showing signs of progressive degradation in thermal performance. One-dimensional numerical models utilizing constant and temperature-dependent thermal conductivities were created and their results were compared with the measurements. The model results showed the need to include both temperature and time-dependent thermal conductivities of VIPs for accurate predictions of thermal performance.
A future research task is to create two-dimensional models of the test walls to improve the accuracy of the model results. Two-dimensional models would capture the edge-effects due to the VIP barrier films as well as the heat transfer through the wood frames. The research team is collaborating with industry partners and performing research on new core and barrier film materials that can improve the long-term thermal performance of VIPs.
Author Contributions
K.B. is the lead author and conceptualized this article. K.B. and A.D. are co-managing the project under which this current study was performed. K.B. and A.D. designed the test wall and sensor configurations. R.J. performed the ASTM C518 tests and created all the plots presented in this article. K.B. and R.J. co-performed the simulations and data analysis, with guidance from A.D.
Funding
This work was supported by the Building Technologies Office of the United States Department of Energy (DOE) under Contract No. DE-AC05-00OR22725 with UT-Battelle, LLC. The authors specifically thank DOE Technology Manager, Mr. Sven Mumme, for his support of this work.
Acknowledgments
The authors are grateful to Douglas Smith, Ron Esperza and John Jones of NanoPore as well as John Letts, Jennifer Yao, Mike Hubbard, Randy Strauser, Joseph Nelson and Wayne Vernon of Firestone Building Products for their efforts and support in making the VIPs and foam-VIP composite boards. Thanks are due to Jerald Atchley of ORNL for assisting with the HFM tests.
Conflicts of Interest
The authors declare no conflict of interest.
Nomenclature
| cp | Specific heat (J/kg·K) |
| k | Thermal conductivity (W/m·K) |
| R | Thermal resistance (m2·K/W) |
| q | Heat flux (W/m2) |
| T | Temperature (°C) |
| ρ | Density (kg/m3) |
Subscripts
| c | Constant |
Abbreviations
| COP | Center-of-panel |
| HD | High-density |
| HFM | Heat flow meter |
| HFT | Heat flux transducer |
| OSB | Oriented strand board |
| PIR | Polyisocyanurate |
| RH | Relative humidity |
| U.S. | United States |
| VIP | Vacuum insulation panel |
References
- Bordbari, M.J.; Seifi, A.R.; Rastegar, M. Probabilistic energy consumption analysis in buildings using point estimate method. Energy 2018, 142, 716–722. [Google Scholar] [CrossRef]
- International Energy Outlook 2018; U.S. Energy Information Administration: Washington, DC, USA, 2018.
- Yang, L.; Yan, H.; Lam, J.C. Thermal comfort and building energy consumption implications–A review. Appl. Energy 2014, 115, 164–173. [Google Scholar] [CrossRef]
- Pérez-Lombard, L.; Ortiz, J.; Pout, C. A review on buildings energy consumption information. Energy Build. 2008, 40, 394–398. [Google Scholar] [CrossRef]
- Alotaibi, S.S.; Riffat, S. Vacuum insulated panels for sustainable buildings: a review of research and applications. Int. J. Energy Res. 2014, 38, 1–19. [Google Scholar] [CrossRef]
- Lim, T.; Seok, J.; Kim, D.D. A comparative study of energy performance of fumed silica vacuum insulation panels in an apartment building. Energies 2017, 10, 2000. [Google Scholar] [CrossRef]
- Capozzoli, A.; Fantucci, S.; Favoino, F.; Perino, M. Vacuum insulation panels: Analysis of the thermal performance of both single panel and multilayer boards. Energies 2015, 8, 2528–2547. [Google Scholar] [CrossRef]
- Jelle, B.P. Traditional, state-of-the-art and future thermal building insulation materials and solutions—Properties, requirements and possibilities. Energy Build. 2011, 43, 2549–2563. [Google Scholar] [CrossRef]
- Alam, M.; Singh, H.; Limbachiya, M.C. Vacuum insulation panels (VIPs) for building construction industry—A review of the contemporary developments and future directions. Appl. Energy 2011, 88, 3592–3602. [Google Scholar] [CrossRef]
- Simmler, H.; Brunner, S. Vacuum insulation panels for building application: Basic properties, aging mechanisms and service life. Energy Build. 2005, 37, 1122–1131. [Google Scholar] [CrossRef]
- Brunner, S.; Simmler, H. In situ performance assessment of vacuum insulation panels in a flat roof construction. Vacuum 2008, 82, 700–707. [Google Scholar] [CrossRef]
- Johansson, P.; Adl-Zarrabi, B.; Kalagasidis, A.S. Evaluation of 5 years’ performance of VIPs in a retrofitted building façade. Energy Build. 2016, 130, 488–494. [Google Scholar] [CrossRef]
- Zhang, T.T.; Ooms, M.; Korn, J.; Maclean, D.; Mooney, S.; Andre, S.; Mukhopadhyaya, P. Critical analysis of in situ performance of glass fiber core VIPs in extreme cold climate. Front. Energy Res. 2019, 7, 45. [Google Scholar]
- Biswas, K.; Desjarlais, A.; Smith, D.; Letts, J.; Yao, J.; Jiang, T. Development and thermal performance verification of composite insulation boards containing foam-encapsulated vacuum insulation panels. Appl. Energy 2018, 228, 1159–1172. [Google Scholar] [CrossRef]
- Berardi, U.; Tronchin, L.; Manfren, M.; Nastasi, B. On the effects of variation of thermal conductivity in buildings in the Italian construction sector. Energies 2018, 11, 872. [Google Scholar] [CrossRef]
- Lorenzati, A.; Fantucci, S.; Capozzoli, A.; Perino, M. The effect of temperature on thermal performance of fumed silica based vacuum insulation panels for buildings. Energy Procedia 2017, 111, 490–499. [Google Scholar] [CrossRef]
- Berardi, U. The impact of temperature dependency of the building insulation thermal conductivity in the Canadian climate. Energy Procedia 2017, 132, 237–242. [Google Scholar] [CrossRef]
- Fantucci, S.; Lorenzati, A.; Capozzoli, A.; Perino, M. Analysis of the temperature dependence of the thermal conductivity in vacuum insulation panels. Energy Build. 2019, 183, 64–74. [Google Scholar] [CrossRef]
- Biswas, K. Development and validation of numerical models for evaluation of foam-vacuum insulation panel composite boards, including edge effects. Energies 2018, 11, 2228. [Google Scholar] [CrossRef]
- ASTM C518-17. Standard Test Method for Steady-State Thermal Transmission Properties by Means of the Heat Flow Meter Apparatus; ASTM International: West Conshohocken, PA, USA, 2017. [Google Scholar]
- Singh, S.N.; Ntiru, M.; Dedecker, K. Long term thermal resistance of pentane blown polyisocyanurate laminate boards. J. Cell. Plast. 2003, 39, 265–280. [Google Scholar] [CrossRef]
- Yrieix, B.; Morel, B.; Pons, E.J.E. VIP service life assessment: Interactions between barrier laminates and core material, and significance of silica core ageing. Energy Build. 2014, 85, 617–630. [Google Scholar] [CrossRef] [Green Version]
- ANSI/ASHRAE/IES Standard 90.1-2016. In Energy Standard for Buildings Except Low-Rise Residential Buildings; ASHRAE: New York, NY, USA, 2016.
Figure 1.
Multiple test walls under evaluation at the Charleston NET facility; the two test walls relevant to this study are highlighted using a dashed red box.
Figure 1.
Multiple test walls under evaluation at the Charleston NET facility; the two test walls relevant to this study are highlighted using a dashed red box.

Figure 2.
(a) Schematic illustrating the horizontal cross-section of the test wall with the foam-vacuum insulation panel (VIP) composite board and nominal sensor locations; (b) photograph showing a vertical section of a test wall with the sensors installed on the interior oriented strand board (OSB) surface. The sensors used for data analysis in the current study are highlighted within a dashed red oval.

Figure 3.
1D model of test wall section with foam-VIP composite.

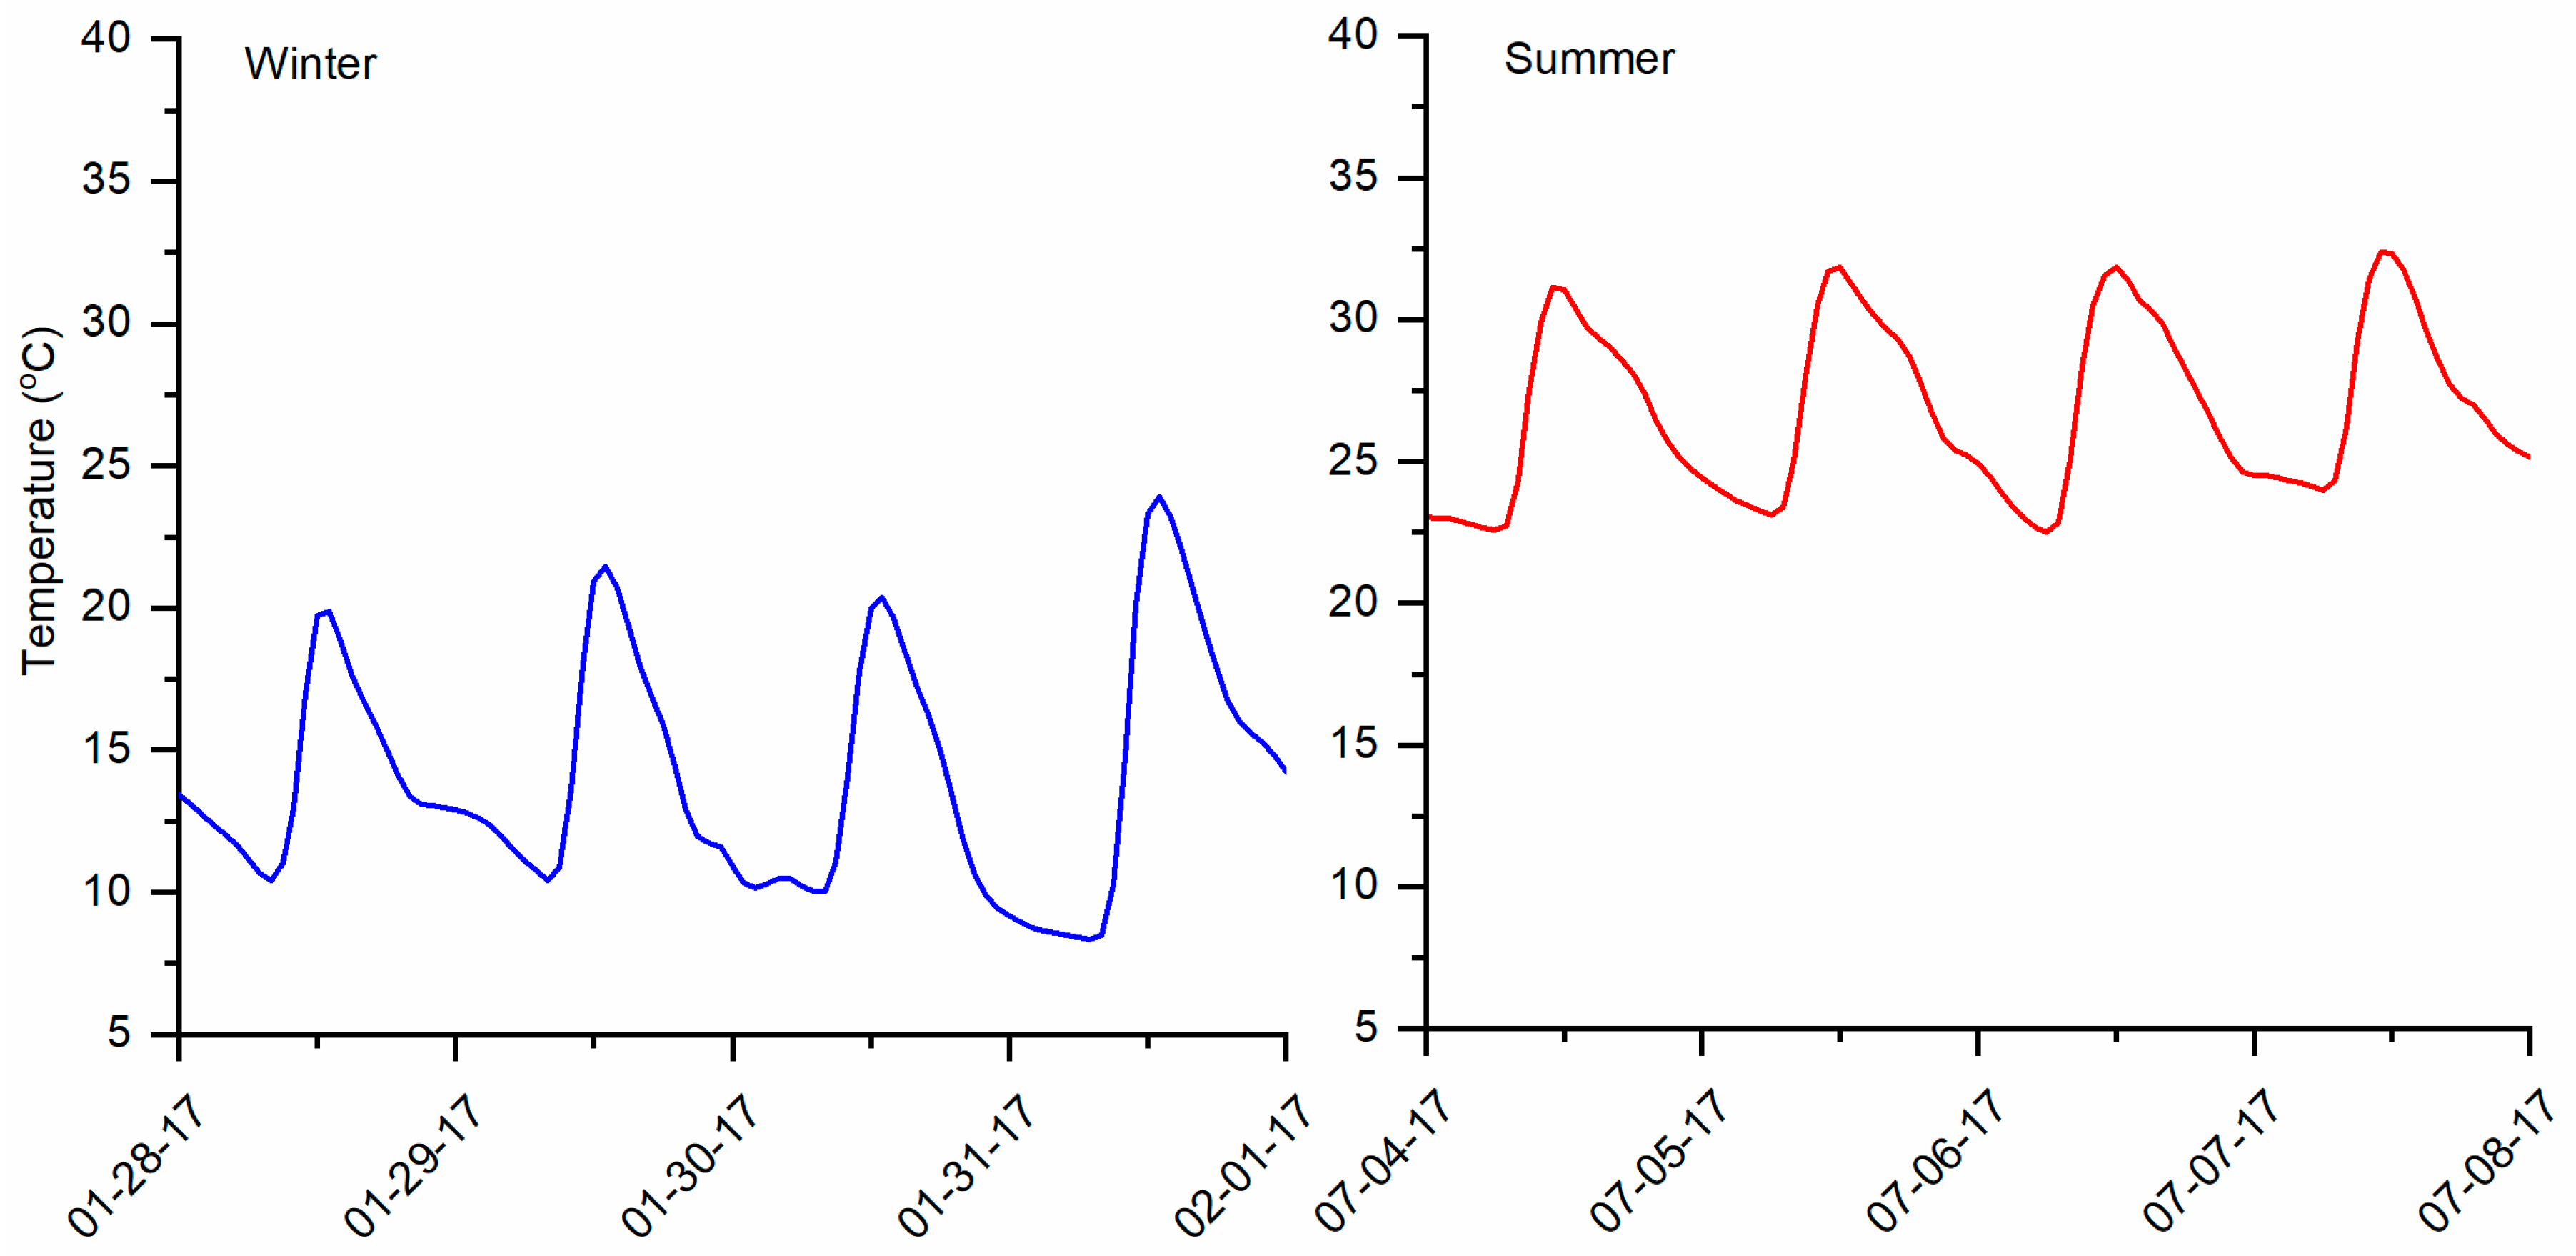
Figure 4.
Temperature distributions across the test walls during summer days. Left—test wall with regular polyisocyanurate (PIR). Right—test wall with foam-VIP composite.
Figure 4.
Temperature distributions across the test walls during summer days. Left—test wall with regular polyisocyanurate (PIR). Right—test wall with foam-VIP composite.

Figure 5.
Comparison of heat flows through the two test walls measured at the OSB–cavity interface.

Figure 6.
Comparison of integrated monthly heat gains (top) and losses (bottom) from the two test walls measured at the OSB–cavity interface.
Figure 6.
Comparison of integrated monthly heat gains (top) and losses (bottom) from the two test walls measured at the OSB–cavity interface.

Figure 7.
Percent reductions in monthly heat gains (left) and losses (right) with the foam-VIP composite compared to regular PIR over time.
Figure 7.
Percent reductions in monthly heat gains (left) and losses (right) with the foam-VIP composite compared to regular PIR over time.

Figure 8.
Measured outdoor relative humidity (RH) and temperature during the natural aging period.

Figure 9.
Measured thermal conductivities of the different insulation materials used in the test wall.
Figure 9.
Measured thermal conductivities of the different insulation materials used in the test wall.

Figure 10.
Comparison of measured and calculated heat fluxes during winter (left) and summer (right) periods.
Figure 10.
Comparison of measured and calculated heat fluxes during winter (left) and summer (right) periods.

Figure 11.
Calculated temperatures at the mid-point of the VIP thickness; left—winter, right—summer.
Figure 11.
Calculated temperatures at the mid-point of the VIP thickness; left—winter, right—summer.

Figure 12.
Comparison of measured and calculated heat fluxes over the entire aging period showing the increased discrepancies over subsequent winter and summer periods.
Figure 12.
Comparison of measured and calculated heat fluxes over the entire aging period showing the increased discrepancies over subsequent winter and summer periods.


Table 1.
Materials and thermal conductivities.
| Material | kc (W/m·K) | cp (J/kg·K) | ρ (kg/m3) |
|---|---|---|---|
| PIR | 0.0276 | 1590 | 70.8 |
| HD board | 0.0305 | 1020 | 169.2 |
| VIP | 0.0050 | 880 | 150.0 |
| OSB | 0.1040 | 1884 | 656.0 |
| Fiberglass | 0.0436 | 840 | 8.0 |
| Gypsum | 0.1635 | 1087 | 549.5 |
Table 2.
Average difference between the daily peak heat gains between calculations and measurements during the month of May over three years.
Table 2.
Average difference between the daily peak heat gains between calculations and measurements during the month of May over three years.
| Model Input | May 2017 | May 2018 | May 2019 |
|---|---|---|---|
| Constant k | 23% | 28% | 38% |
| k(T) | 21% | 26% | 37% |
© 2019 by the authors. Licensee MDPI, Basel, Switzerland. This article is an open access article distributed under the terms and conditions of the Creative Commons Attribution (CC BY) license (http://creativecommons.org/licenses/by/4.0/).
Share and Cite
MDPI and ACS Style
Biswas, K.; Jogineedi, R.; Desjarlais, A. Experimental and Numerical Examination of Naturally-Aged Foam-VIP Composites. Energies 2019, 12, 2539. https://doi.org/10.3390/en12132539
AMA Style
Biswas K, Jogineedi R, Desjarlais A. Experimental and Numerical Examination of Naturally-Aged Foam-VIP Composites. Energies. 2019; 12(13):2539. https://doi.org/10.3390/en12132539
Chicago/Turabian StyleBiswas, Kaushik, Rohit Jogineedi, and Andre Desjarlais. 2019. "Experimental and Numerical Examination of Naturally-Aged Foam-VIP Composites" Energies 12, no. 13: 2539. https://doi.org/10.3390/en12132539
Note that from the first issue of 2016, this journal uses article numbers instead of page numbers. See further details here.