A Context-Aware Oil Debris-Based Health Indicator for Wind Turbine Gearbox Condition Monitoring
by

Kerman López de Calle
1,2,*, 
Susana Ferreiro
1,
Constantino Roldán-Paraponiaris
1 and
Alain Ulazia
3 1
Intelligent Information Systems unit, IK4-TEKNIKER, Iñaki Goenaga street 5, 20600 Eibar, Spain
2
Department of Computer Science and Artificial Intelligence, University of the Basque Country (UPV/EHU), Faculty of Informatics 649, 20080 Donostia, Spain
3
Department of NE and Fluid Mechanics, University of the Basque Country (UPV/EHU), Otaola 29, 20600 Eibar, Spain
*
Author to whom correspondence should be addressed.
Energies 2019, 12(17), 3373; https://doi.org/10.3390/en12173373
Submission received: 16 July 2019
/
Revised: 24 August 2019
/
Accepted: 27 August 2019
/
Published: 2 September 2019
(This article belongs to the Special Issue Maintenance Management of Wind Turbines)
Abstract
:One of the greatest challenges of optimising the correct operation of wind turbines is detecting the health status of their core components, such as gearboxes in particular. Gearbox monitoring is a widely studied topic in the literature, nevertheless, studies showing data of in-service wind turbines are less frequent and tend to present difficulties that are otherwise overlooked in test rig based works. This work presents the data of three wind turbines that have gearboxes in different damage stages. Besides including the data of the SCADA (Supervisory Control And Signal Acquisition) system, additional measurements of online optical oil debris sensors are also included. In addition to an analysis of the behaviour of particle generation in the turbines, a methodology to identify regimes of operation with lower variation is presented. These regimes are later utilised to develop a health index that considers operation states and provides valuable information regarding the state of the gearboxes. The proposed health index allows distinguishing damage severity between wind turbines as well as tracking the evolution of the damage over time.
1. Introduction
In a world with an ever-increasing electric energy demand, wind energy is getting attention, and has become the fastest growing renewable energy source because of its availability and abundance [1,2]. In this way, the global wind turbine installed power capacity is an increasing trend [3], and two phenomenons are arising: wind turbine (WT) hub size is increasing; and, the fast expansion of wind farms (WF) requires finding better settlements. Consequently, industries are expanding to inhospitable locations, such as offshore hard-to-reach places [4] in a pursuit of better wind resources, as typically, these locations provide higher wind power resources with less turbulence [5].
One of the biggest burdens wind farms face are the Operation & Maintenance (O&M) costs that, as the authors of [1] state, can comprise 10–20% of the total cost of energy (COE) for wind project, and reach up to 35% for a WT at the end of life, a figure that goes up to 30% in the case of big offshore wind farms [6]. Furthermore, various works have related higher failure rates in bigger WTs as compared to smaller ones [7,8,9]. Finding a positive correlation between average wind speed and failure rate that is reinforced in offshore sites [8,10]. Therefore, it is necessary to assess the health state of the systems and subsystems of WTs, in order to organise maintenance actions and reduce downtimes and losses due to unforeseen stops. In this field, condition monitoring systems (CMS) are well known technology with proven success for health status detection, fault identification and prediction [1,2,9]. Such technology allows identifying the state of the assets remotely, reducing considerably the need of visual inspections on site, which is a costly matter mostly for offshore farms [11].
Particularly, gearboxes represent a delicate component of WTs [10]. The various failure statistic analysis carried out lead to some controversy on its tendency to failure [12], as some of them have less failures reported [8,12], whereas others find high failure rates related to gearboxes [13]. Anyway, most of the studies associate the longest WT downtimes to this component [3,12] and emphasise the need of proper monitoring techniques to avoid them. Additionally, it is considered one of the costliest parts of the WTs [10] and although there are attempts to replace them with direct drives to reduce costs, studies question this assumption, and still the majority of offshore wind turbines rely on gearboxes [14]. Consequently, their monitoring is of vital importance.
Gearbox and gearbox related subsystem condition monitoring (CM) has been broadly addressed on the literature. For that purpose a wide variety of approaches have been tested, such as vibration, oil debris monitoring (ODM), acoustic emissions and current signature among others. Vibration-based CMS prevail over other kinds of sensors [2,9], with much research carried out on the field of signal processing of vibration signals in time, frequency, time/frequency and order domains [3]. However, some works find ODM techniques also interesting, for their higher correlation with wear creation [15], or for the added value they have for monitoring both the oil quality and the state of the gearbox parts [1,2].
Nevertheless, even if the advantages of CM are proven [2,11], its transfer from experimental tests to real WT use cases is less known in the literature [16]. This is because the variability of operation conditions of WTs affects the extraction of indicators while it specially damages the systems of WTs [2]. Most of the works presenting real in-service WT data are based on the use of SCADA (Supervisory Control and Data Acquisition) data, which is readily available in general. Typically, it is used to compare performances among WTs using power curves [17]. These benchmarking procedures are usual for other O&M issues such as pitch misalignment correction [18,19] and the identification of defective anemometers [20]. Additionally, temperatures from the SCADA have been modelled and compared over time to use differences as alarms as the different works reviewed by the authors of [21] show. However, the success of these techniques is limited [3]. Partly, because of external influences (such as the outside temperature) that require the alarms to be manually supervised by operators [21]. Consequently, the inclusion of additional CM sensors in operating WTs is flourishing [9], and an increasing number of works present findings from real cases of use:
- In the work by the authors of [22], two case studies are analysed: in the first one, physical principles that relate the difference in temperatures with the efficiency, rotational speed and power output are used, and the approach is validated by using the deviation of the temperature with respect to power in order to foresee a failure; in the second one, vibration and particle counter sensors are used and the evolution of the signals is studied before and after the replacement of a bearing. They suggest using cumulative particle counts to better detect failures instead of direct particle creation measurements and to combine various sensors in order to improve confidence in the diagnosis.
- In the work by the authors of [23], they create a health indicator based on the centroids proposed by a Self Organising Map in order to group WTs according to health status using SCADA data. This way operators are given additional information regarding the health state of the WTs, and can plan consequently.
- In the work by the authors of [16], current and vibration analyses are used to diagnose a turbine drive train, they emphasise on the difficulty of using signal processing techniques that are only proven at laboratory scale, and recognise the complexity of calculating the remaining useful life (RUL) and establishing damage/healthy thresholds, especially with a lack of available historical data.
- In the work by the authors of [24],the vibration signature of a sample of healthy wind turbines is shown, most relevant indicators are identified on averaged power spectra and the dependence of amplitudes on the operation is studied. They conclude that the high impact of wind speed on vibration amplitudes has to be taken into account to develop CMS.
- In the work by the authors of [14], the data gathered before and after a planetary gear was changed due to spalling is examined. They integrate temperature, vibration and particle counter signals in order to reduce false alarms, and prove the ability to distinguish healthy and warning states.
- In the work by the authors of [25], they suggest the use of moving averages (of both short and long term trends) of ODM to generate a count rate propagation model. Then, they establish an acceptance threshold based on the equivalent maximum angle of spall which is related to bearing geometry; and, lastly, they estimate remaining useful life (RUL).
Most of the works related to on service WT utilise vibration and/or oil debris sensors [3,9]. The works based on ODM from the previously mentioned ones [14,22,25] agree on the same difficulties for the development of ODM systems: the need of averaging or using cumulative values instead of using directly particle generation rates; and the tendency of particle creation rate to vary with operation. These findings are supported by the extensive work of the authors of [26], in which a full-scale WT gearbox of 750 kW is tested with in-line and online sensors and samples taken along the time. In their findings, the need of filtering influences caused by operational conditions is remarked; they recommend to focus in trends instead of in absolute values, and suggest considering big particle size (>14 m) indicators in particular; also, they identify that damaged gearboxes have much higher debris generation rates than healthy ones.
Taking into consideration the interest of having real on-service WT operation data analysed, and that some of the limitations of ODM of WT are already identified on the literature, this work aims to provide a better insight for the development of ODMs. For that purpose, the data obtained in three WTs monitored with oil debris sensors are studied for a period of six months; the readings of the sensor are compared to other traditional SCADA based monitoring techniques; and, lastly, a study of the different operation states is carried out to determine which filtering criteria is better to develop an health index that considers operating conditions.
2. Data and Methodology
2.1. Wind Farm and Turbines
This study analyses the data produced by 3 WTs which are located in the wind farms at Bayo and Monteros, in Zaragoza (Spain). Both wind farms are close one another and undergo similar influences of the wind. The natural barriers of the Iberian System mountain ranges in the south and the Pyrenees mountain ranges in the north constitute a funnel effect that creates the meteorological occurrence known as cierzo; a dry, usually cold and accelerated flux of air intensified by the natural funnel going through the Ebro valley. Cierzo is more frequent during winter and the beginning of spring, and is compensated by the antagonistic phenomenon known as bochorno, that goes in the opposite direction to cierzo and tends to be softer. Additionally, these oposing phenomena provide the wind with copious kinetic energy and make the region an interesting location for the exploitation of wind energy [27].
The WTs have a 58 m diameter rotor and three blades. Their rated power is 850 kW and cut-in and cut-out wind speeds are 3 m/s and 20 m/s, respectively. They have planetary gearboxes with 1/62 transmission ratios coupled with asynchronous generators. The mineral lubricant is cleaned by offline oil filters and the online oil debris optical sensors is installed in a bypass of the lubrication system.
Regarding the health status of the gearboxes, visual and endoscopic inspections carried out on-site reveal different levels of damage. Two of the gearboxes show medium wear levels (WT 1 and WT 2) with micropitting present in most of the gears, whereas the last one is diagnosed with medium–high wear level showing greater surfaces damaged by micropitting in some gears and pitting in the sun gear. However, no corrective actions have been recommended yet.
2.2. Optical Oil Debris Sensor
Oil samples can be taken and analysed offline in laboratories, however, this procedure delays the decision making process and requires to access the WTs. Therefore, online oil debris sensors are an attractive way of determining the quality of the lubricant and safeguard the components of the gearbox.
In particular, this work uses a optical oil debris sensor. This kind of sensors monitor the fluid condition and contamination using optical technology by capturing high-resolution images of the moving fluid, and later applying advanced processes of image digitisation and spectral analysis. They detect, quantify and classify the particles bigger than 4 microns by size and/or shape, in addition of distinguishing these particles from air bubbles [28]. Besides wind turbine lubrication system monitoring, this kind of technology is well-suited for other industrial applications such as automotive, steel sector, wastewater treatment or cement industries [29] as all of the previous use lubrication systems.
2.3. Dataset
The study is based on a dataset consisting of six months long records of 3 WTs. The data records are taken with one minute frequency from the SCADA. At the same time, additional measurements provided by online optical oil debris sensors are taken. Variables from the SCADA represent the operation of the WTs, whereas the ones provided by the sensor indicate the amount of particles of size greater than 4, 6 and 14 micrometers (ISO.4, ISO.6 and ISO.14, respectively) present on the lubricating oil according to the ISO 4406 standard [30]. These values of the oil sensor represent the particle generation rate, as the oil is being continuously filtered. Details of the variables of the SCADA and the oil debris sensor with the units of measurement are presented in the Table 1.
For privacy reasons the data is shown in a normalised way along this work within a 0 to 1 range corresponding to minimum and maximum values of each of the variables in the dataset.
2.4. Methodology
In order to gain better insight on the use of oil debris sensors to obtain health indicators, the study has two parts: an exploration and correlation analysis stage, in which an overview of the data is presented and some methods of the literature contrasted; and the comparison of operation regions and health index (HI) development, where different operating regimes are compared and the most appropriate one is chosen as the basis to develop a HI. The methods used in each of the parts are presented below.
2.4.1. Exploration and Correlation Analysis
In an initial stage, various visualisation and correlation techniques are used:
- Pearson correlation: Coefficient used to measure the degree of linear association between two variables, presented in the work by the authors of [31].
- Spearman’s correlation: Nonparametric coefficient that reflects the degree of monotonicity between two variables explained in the work by the authors of [32].
- Principal component analysis (PCA): PCA is a orthogonal transformation that turns a set of variables into a set of linearly uncorrelated variables. This technique is widely used for visualisation purposes in order to reduce multidimensional spaces to lower dimensional representations with the minimum information loss [33].
- Exponential moving average: In contrast to regular moving average where the average of a window of values in taken, this type of moving average is used when latest values are need to have more importance. The implementation used in this work can be found on the work by the authors of [34].
- Local regression (LOESS): This nonparametric method is used on local subsets of data. The implementation is based on the work by the authors of [35].
- Decision trees: Decision trees are machine learning (ML) algorithms used for classification. Their goal is to predict values of a target variable based on the inputs. Trees are built by splitting input variables with criteria that maximise the probability of having instances of certain group in each partition. The trees used in this work used Gini impurity index for partitioning and are implemented in the work by the authors of [36], which is based on the work by the authors of [37].
2.4.2. Comparison of Operation Regions and Health Index (HI) Development
During the initial exploration, the influence of the operation in the particle creation rates is detected; nevertheless, as there is no clear correlation identified between operation variables and particle creation, it is decided to consider only the measurements that are taken under the same operation conditions. Furthermore, a methodology is used to define which operating conditions are the most appropriate for monitoring purposes. The following techniques were used.
- Operation region (OR) definition: In order to find the optimal instants for taking measurements, several operating regions (OR) are explored. Each operating region is defined by a set of rules/criteria, such as wind speed in range (x m/s, y m/s), active power equals nominal power, etc. The ORs analysed in this work are suggested by experts in the domain, and are depicted in the following Figure 1 with a short explanation added in Table 2.
- Operation states (OS): Instead of considering each time instant individually as a data point with certain associated variable values (pitch angle, active power, ISO.4… etc.) groupings of data points have been studied. These groups or operation states are generated considering the different operation regions previously presented, and correspond to a set of chronologically continuous points over time fulfilling the rules proposed by the OR. Every time the machine works under the criteria of an OR we say it has entered in a new OS related to that OR, that lasts as long as the WT keeps working under the constraints of the OR.
- Operation clustering: With the purpose of analysing the steadiness of the different OR the following procedure was used in order to generate data cluster representing the variability of the operation in each OS according to the different ORs.
- Scale all the variables between 0 and 1 corresponding to the maximum and minimum values of each variable.
- Taking an OR (Example:Nominal) find the respective number of OS occurrences in the dataset , where m is the number of occurrences.
- Create a matrix for each where :where p is equal to the number of sensors considered and is the length of the i-th OS; therefore, these matrices contain the values of the p operation variables along the OS.
- Then, the difference vector of each variable is calculated by OS. This vectors represent the variability of the operation during the OS and give as a result the new matrix D:where , that is, each element of the difference vector is the difference between the measurement in that instant and the following measurement , for each , .
- Then matrix R is computed.R is the result of computing the columnwise quadratic mean of the matrices, and represents the average values of the variability considering both negative and positive values. They are computed in the following way.
- From the R matrix, two metrics are obtained:
- (a)
- Centroid: The average position of the points contained in W. Computed as follows.where for all the average is calculated as follows.
- (b)
- Cluster dispersion: Mean of the variable variance value that represents how disperse the cluster is; it is calculated as follows.Each for is the standard deviation computed in the following way.
This procedure is repeated separately for each WT and OR. Therefore, there are five ORs by three WTs, a total of 15 data clusters. - Operation state and cluster metrics: From the clusters of data and the OS some metrics are calculated that help identifying the most interesting OR. These metrics are as follows.
- -
- Weekly occurrence ratio: Average number of times per week the WT enters in an OS as defined in the OR.
- -
- Steadiness: The euclidean distance from the centroid (or mean point) of a cluster to the total steadiness (no variation) point.
- -
- Dispersion: Indicates how spread the data points within a cluster are. Defined previously in Cluster dispersion.
3. Results
As in Section 2.4, results chapter is divided in two parts. The first part, Section 3.1, explains the exploratory analysis that is carried out over the dataset and the relations found between the variables. The second part, Section 3.2, shows the steps that were taken in order to identify the best conditions for obtaining measurements along the time in order to obtain a health index of the gearboxes.
3.1. Exploration and Correlation Analysis
Taken a sample of the whole dataset, Pearsons and Spearmans correlations are studied. In order to identify any possible difference between power generation and during no generation, correlation is also measured in separate samples. However, no significant correlations (neither Pearsons nor Spearmans) are found between operation variables and particle generation data. Regarding the operational variables, some show high degree of association because of the control system. Furthermore, the association of the same variables among WTs over overlapped time spans yields high correlation which means they face similar environmental conditions (wind). However, this is not the case of ODSs, that do not correlate from one WT to another. Nevertheless, in light of the strong correlations between particle indicators (ISO.4, ISO.6 and ISO.14), and following the advice provided by the authors of [26], it is decided to follow the study using ISO.14 indicator as only indicator for particles in order to simplify the study.
After the brute correlation study, the variables are visually studied against the wind speed in Figure 2. The different variables of the SCADA data plotted against the wind speed show the typical patterns that can be found in wind turbines, and are extremely similar one to another. The greatest (but yet small) differences are found in gearbox temperature, suggesting there could be some differences in the cooling system or on the efficiency of the gearboxes.
As the signals of the ODSs are discrete, much noisier and is almost impossible to visualise anything in the raw measurements, the measurements are given some pretreatments by averaging the values in 0.33 m/s wind speed bins, which creates the pattern visible in Figure 3c.
Averaged values show great differences between the particle creation rates among WTs. At the same time, the influence of operation over particle generation is visible. Interestingly, the behaviours do not coincide exactly between WTs: WT 1 and WT 3 show big similarities, with high wear creation with low wind speeds and lower wear creation at medium speed or nominal operation; meanwhile, WT 2 shows a different pattern, as its wear creation increases proportionally with wind speed. These differences in the behaviours of the WTs regarding particle creation and operation are also present in the averaged values of wear generation during power production and no power production (including: idling, generator turning without active power generation and idling because of overload) as Figure 4 demonstrates.
Again, WT 2 does not act as the other WTs. In any case, the previous figures suggest the particle creation is greater during no power generation, meaning braking and acceleration could be causing higher particle creations. Furthermore, there is a clear distinction in the mean level of particle creation rates that match the visual diagnostics of the gearboxes, showing higher values in WT 3, and lower values for WT 1 and WT 2. This variation of particle levels that indicates disparate damage severity, is complex to detect by just paying attention to the the SCADA variables. As Figure 3a,b shows, the same binned in variables typically used for condition monitoring by benchmarking (Active power and gearbox temperature) are not sufficiently different in order to make comparisons between turbines and determine whether WTs could be damaged. Whereas these differences are clearly visible in the binned ISO.14 values (Figure 3c).
This fact is clearer when cumulative particle creations are used. Instead of using raw signals, using cumulative particle rates provides a better insight of the degradation process, as it allows us distinguishing changes in the slopes. In Figure 5, we see clear and increasing differences between WTs in the trends generated when plotting cumulative particle creations against cumulative power generation. If cumulative temperature is observed, the differences among WTs, even if existent, are quite small which reduces the possibility to correctly diagnose failures using only SCADA data. Additionally, the presence of similar shapes for the three turbines in both temperature and particle creation and considering the same periods of time are studied indicate some common factor could be causing the sharp increase in the middle of the curves, which is visible in both variables.
In order to reproduce previous findings in the literature, it is decided to analyse braking and acceleration registered in the SCADA data. For doing so, the Generator speed of five days of operation is taken and it is manually labelled adding “braking”, “boosting” or “other” labels. Then, five lagged variables of the generator speed, a exponentially smoothed generator speed (using a bin size of 15) and a difference vector are created. With this data a decision tree is trained using the default parameters for classification cases and it is used to segment the remaining generator speed data in brake/boost/other. With the data split in these groups, it is possible to study the sequences occurring in the data. Boosting and braking sequences are studied by measuring the spearmans correlations of the ISO.14 variables with the smoothed generator speed. In Figure 6 the distribution of the correlations obtained by WT is presented.
The distribution of the correlation shows here different behaviours. In the braking sequences, WT 1 and WT 3 (Figure 7a,c) have bimodal distributions with a minor mode in strong positive correlation values and the major mode in very strong negative correlation values. This implies that there is a predominant tendency to create more particles during stops (speed decreases and particle generation increases), but is not always the case, as in some cases the correlation is positive (speed decrease with particle decrease). In WT 2 the opposite behaviour is identified, even if the correlation distribution is also bimodal, the major mode is on positively correlated values, meaning in this WT there is a tendency to decrease particle generation when the generator is stopping. Regarding the boosting sequences, the overall correlation values are quite low, which implies there is no clear relation between the increasing speed and the particle creation. The predominance of the major mode in very negative correlation values together with the quartile lines so far from the 0 value indicates braking generate an increase in particle creation, at least for turbines WT 1 and WT 3.
Taking WT 3, boosting and braking sequences were analysed in depth. The following Figure 7 presents two examples of sequences with strong spearman correlation values with negative and positive correlation.
Interestingly, despite the there is a clear unbalance in the number occurrences, stopping can lead to both an increase or a decrease in particle generation. Note that the generator speed decreases faster than the ISO.14 level, and the nature of the exponentially smoothed speed is more similar to the one of the ISO.14 variable that is more influenced by the inertia of the system than generator speed.
The same procedure is followed for boosting, in this case, considering predominant correlation is near 0 (meaning there is no monotonicity) examples with low correlation are also studied. Figure 8 displays occurrences with high positive correlations (a), highly negative correlations (b) and no correlation (c).
With the uniform distribution of correlation for boosting cases and the different cases shown in Figure 8 there is no way of identifying an expected behaviour of the particle generation during boosting sequences. Furthermore, Figure 8c reveals an unexpected behaviour during idling. As the sensor is giving high ISO.14 particle levels. This fact occurs mostly in WT 3 but is also reported in WT 1, but with a lower frequency. Off-line oil filters should operate continuously regardless of the operation of the machine, but this finding suggest the filter could be stopping in certain situations, which explains also the big difference of particle generation found in Figure 4.
3.2. Comparison of Operation Regions and Health Index (HI) Development
At this point the influence of operation over the particle creation is evident; therefore, it is decided to isolate measurements taken under similar conditions to compare them along the time and use these filtered measures to build a HT. For this purpose, the procedure explained in Section 2.4.2 is carried out. The operational data is taken, different operation regions are defined one by one as explained in Figure 1, the operation states produced in each turbine are generated and once all WT have been processed, the OSs are studied. Considering that there could be a delay between operation conditions and the effect of those conditions on the oil debris content, it is decided to remove occurrences (Operation States) shorter than a minimum length. In order to define the most appropriate minimum required duration, the following table, Table 3, is created, where the effect of filtering with different duration is presented.
The time filter reveals that most occurrences have very short duration, as moving the filter from 5 to 10 min reduces the number of occurrences to a half in most of the ORs. Furthermore, very restrictive ORs, such as N. & pitch, are less present in the database, and the ones with wider limits (that also coincide with the most frequent wind speeds) are more present in the dataset. Considering longer OSs should reduce the amount of noise created by previous operation regimes, while there should be a sufficient week rate in order to obtain enough indicators over time, it is decided to keep OSs that last longer than 10 min.
Following with the procedure, once data matrix R is obtained for each WT, it is possible to see the different clusters that are created and represent the variability of the measurements. Figure 9 represents the two principal components of the operational variables in the dataset (pitch angle, gearbox temperature, wind speed, generator speed and active power) that are generated in WT 1 using PCA algorithm. The variability retained by each dimension is displayed in the axes. It is interesting to see the representations that the different ORs take. The first principal component (Dim 1) mostly contains pitch difference, generator speed and gearbox temperature. Most of the clusters have great part of the variation related to this feature, whereas in the second component (Dim 2), wind speed, active power and generator speed are causing most of the variation, and this dimension affects mainly Ramp and Ramp-to-nominal clusters that show very high dispersion.
The steadiness point, that is, the point with no variation is also represented on the graphs as a star. The euclidean distance to that point (the steadiness) is measured and the results presented in the following Table 4:
There are extreme differences regarding how much operation variables vary during the OSs. From the least steady OR (Ramp-to-nominal) to the steadiest one (Pre-ramp) the distance is ten times bigger, meaning the Pre-ramp operation regime is much steadier than the Ramp-to-nominal OR.
Regarding the variation of the clusters, that is, how close from the centroid the data-points are, the results displayed in Table 5 are obtained.
The smallest variation values are obtained by Pre-ramp OR, with clear difference to with the rest of the ORs.
Considering the information provided by the frequency study, the PCA visualisation, distance to steadiness and centroid variation, which OR should be chosen for HI purposes is determined. N. & pitch is discarded because of it low occurrence frequency, Ramp and Ramp-to-nominal show high dispersion, which means there are operational fluctuations in the ORs they delimit. Between Nominal and Pre-ramp ORs, according to steadiness and dispersion criteria Pre-ramp should be chosen, therefore, it is decided to consider the measurements taken under Pre-ramp OR.
Taking the Pre-ramp OR, the ODM variables as well as the other SCADA variables are averaged with the RMS (root mean square) value of each OS. Figure 10 and Figure 11 display the RMS values obtained from the OSs generated using these points. Over the points, the coloured curves represent the fitting provided by the LOESS algorithm using a high span fraction (0.75) in order to retain the trend instead of local variations. The grey shade represents the 95% confidence interval of the fitted curve.
Note that power generation stays under very strict limits, shows almost no variation along the time and, besides the latest trend values (that have less data points), almost no difference between turbines. Similarly, temperature shows higher variation but the trend keeps very stable along the time. Interestingly, the differences in temperature that are visible do not match the expectations: WT 1 and WT 2 (diagnosed with medium wear wear level) have higher temperature values than WT 3 (diagnosed with medium–high wear level). Regarding particle generation, it is possible to see the sudden increase WT 2 and WT 3 have could be related to the same increase of OSs with higher Active power production (Figure 10b). The differences in trend values do correspond to the damage levels of the gearboxes, showing that WT 3 is in a worse condition than the rest of the turbines.
Lastly, the comparison of the evolution of the particles in different ISO particle size (Figure 12) demonstrates the correlations among ISOs that are found in the correlation analysis. ISO.14 shows the greatest difference between WTs, which means it could reflect the damage status in a more accurate way, and therefore it is better suited for comparison purposes. However, the contrast between WTs is clearly visible also in the rest of the ISOs. The scale of the figure is ranged between 0 and 25 ISO values and thresholds proposed by laboratory experience are included for both warnings (20/18/15) and danger (21/19/16) for ISO 4/6/14, respectively. Note that, even if the trends are far from reaching the thresholds, the real-time measurements surpass the thresholds more than once. This means that operation variation can cause great spikes in the particle generation rate and, in order to obtain an overview of the condition of the gearbox, it is required to focus on the trends instead of in instantaneous values. Considering ISO.14 keeps under very low values, the state of the gearbox could be considered yet to be healthy. Either if the smoothed trend would reach values close to the thresholds or it would increase sharply, gearbox should be considered in danger.
4. Discussion and Future Outlook
This study presents the data obtained through the monitoring of three WTs with oil debris optical sensors during six months. In this way, turbines with gearboxes in different stages of deterioration are presented and compared. Initially, an attempt to correlate the operation of the WTs and ODSs has been carried out. After that, a way to identify repeatable and steady operation regimes has been used as a basis for developing a health indicator.
Different works have shown in-service oil debris monitoring in the literature [22,25] or have studied the relation of the operation in behaviour of ODSs in full scale test rigs [26]. Nevertheless, this work is particular as it presents both: first an study of the influence of the operation on debris generation; and then, it proposes a method for the identification of the optimal instants to obtain measurements considering operation.
The number of studied turbines is reduced and the installation of the lubrication systems is equal according to our knowledge. However, two clear behaviours have been discovered during the exploratory phase: two of the turbines show similar trends whereas another one seems to behave in a completely different way. Therefore, the results here displayed should be understood in this context.
We have faced difficulties when working with the noise of raw ODS’s measurements that are also reported in other works [22,25,26], and using the techniques already present in the literature (cumulative particle rates [22,25]) has been useful to reduce the noise. In comparison to the sole use of variables that are directly obtained from the SCADA (active power and generator temperature), significant improvement has been detected when using ODSs, as they show greater differences between the health status of the gearbox. This fact validates the thesis of the need of including additional sensors for defining with higher accuracy the damage levels of the systems [22].
Due to the varying operation and the difference behaviours of WTs, it has been difficult to find clear correlations between operation and particle creation. ISO measurements are highly correlated among themselves, but it is difficult to find association to other operation variables. Only in a detailed inspection of braking and acceleration periods, contrarily to what is reported in the literature [26], a general tendency to increase particle generation has been detected when generator is braking, whereas no increase has been detected during acceleration. Furthermore, some periods of high particle creation have been identified when the generator is idling, this phenomenon could be caused by different behaviours of the oil filtering system, but this assumption has not been proved.
In concordance to the findings of the authors of [26], gearboxes that are more deteriorated (the case of WT 3) have shown a tendency to generate more particles rates than gearboxes in better condition (WT 1 and WT 2). This fact is clearly visible in the cumulative particle creation or the binned ISO against wind speed plots. Also, the pattern of particle generation that is visible in the binned wind speed of WT 1 and 3 reminds the Stribeck curve, which could explain the high particle creation rates at low speeds and the high rates at higher speeds. Furthermore, the differences in particle creation rates are more evident when considering bigger particle size (ISO.14), as the authors of [26] stated. Nevertheless, the sensor in WT 2 provides patterns that differ from the sensors in WT 1 and WT 2. Considering how close the patterns are in WT 1 and WT 3, two hypothesis could be possible: either sensor is not working correctly; or the lubrication system is affected by factors not included in the SCADA.
Regarding the development of the HI, in contrast to the proposals of other works in the literature that make trends over the whole data [25], our method considers the operation regime in which the measurements are taken and uses only measurements that are obtained under the same circumstances. On the one hand, this leads to have periods of time without indicators, but this issue has been considered by choosing ORs with high number of occurrences. On the other hand, an analysis of the operation has been carried out to identify instants with lesser variation in the operation, which should provide more stable measurements and less influenced by the operation. However, using smoothing techniques has still been necessary in order to make trends visible.
According to the analysis of the operation, the WTs tend to move fastly from one OR to another, as the high number of short OSs reveals. Regarding the steadiness of the different ORs analysed, in the pre-ramp zone the operational variables remain more stable than in the rest of ORs that are in the power ramp, as they show a bigger distance to steadiness point.
As the authors of [16] recognise, establishing limits for admissible and nonadmissible damage is one of the biggest challenges in in-service machinery. The limits proposed in this work are based on laboratory experience but might need to be readjusted by interacting with bigger WT databases, as there is no total failure record in the dataset under study.
Lastly, even if ODSs have been demonstrated capable of detecting diverse levels of damage in gearboxes, with the current analysis it is not possible to determine which component of the gearbox is really damaged, which is possibly to do with other sensors such as vibration sensors. In order to detect the root cause of the damage with ODS, a characterisation of the kind of particles would be needed, including shape and elemental composition in addition to the particle count and size. Without these requirements, visual inspection will be needed to determine which component is exactly damaged.
The findings of this work suggest a promising future for optical oil debris sensors in the field of WT monitoring. At the same time, the need of being aware of all the details of the case study is also concluded, as there are some inconsistencies that are not explainable by the sole analysis of the SCADA and ODS data, but might be explainable if more details of the installation of the sensors and the WT itself were made available. In this regard, improving the cooperation and trust between WT owner and researchers would be a key factor for doing better analyses.
The addition of more monitored turbines to the study as well as prolonging the studied period of time would validate the results and determine whether one of the groups is just anomalous for external reasons (such as unreported differences in the systems), or there are really other turbines in which the oil debris follows the same behaviours. In this same line, it would be interesting to keep observing the differences in the HI that are proposed while visual inspections are done periodically in order to prove the validity of the approach for diagnosing the state of the turbine and also to learn to adjust the limits of admissible/nonadmissible thresholds of particle generation before having severe damages.
Furthermore, using the characterisation of the generated debris in order to related the visual inspections with the results provided by online sensor would give and additional value to the monitoring, as the root cause of failure could be identified. Also, adding vibration sensors in order to determine which source of data could provide better insight, more valuable information or identifying possibilities of synergy would be of interest.
Author Contributions
Conceptualisation, all the authors; Methodology, all the authors; Original draft preparation, K.L.d.C.; Writing—Review & Editing, C.R.-P., A.U. and K.L.d.C.; Software, K.L.d.C., C.R.-P. and S.F.; Supervision, S.F. and A.U.
Funding
This work was performed with the financial support of the FRONTIERS IV (ELKARTEK KK-2018/00096) Project financed by Eusko Jaurlaritza.
Conflicts of Interest
The authors declare no conflicts of interest. The funders had no role in the design of the study; in the collection, analyses, or interpretation of data; in the writing of the manuscript, or in the decision to publish the results.
References
- Tchakoua, P.; Wamkeue, R.; Ouhrouche, M.; Slaoui-Hasnaoui, F.; Tameghe, T.A.; Ekemb, G. Wind turbine condition monitoring: State-of-the-art review, new trends, and future challenges. Energies 2014, 7, 2595–2630. [Google Scholar] [CrossRef]
- Hameed, Z.; Hong, Y.S.; Cho, Y.M.; Ahn, S.H.; Song, C.K. Condition monitoring and fault detection of wind turbines and related algorithms: A review. Renew. Sustain. Energy Rev. 2009, 13, 1–39. [Google Scholar] [CrossRef]
- Nie, M.; Wang, L. Review of condition monitoring and fault diagnosis technologies for wind turbine gearbox. Procedia CIRP 2013, 11, 287–290. [Google Scholar] [CrossRef]
- Marti-Puig, P.; Blanco, A.M.; Cárdenas, J.J.; Cusidó, J.; Solé-Casals, J. Feature selection algorithms for wind turbine failure prediction. Energies 2019, 12, 453. [Google Scholar] [CrossRef]
- Manwell, J.F.; McGowan, J.G.; Rogers, A.L. Wind Energy Explained: Theory, Design and Application; John Wiley & Sons, Ltd.: Hoboken, NJ, USA, 2010. [Google Scholar]
- Crabtree, C.J.; Zappalá, D.; Hogg, S.I. Wind energy: UK experiences and offshore operational challenges. Proc. Inst. Mech. Eng. Part A J. Power Energy 2015, 229, 727–746. [Google Scholar] [CrossRef] [Green Version]
- Echavarria, E.; Hahn, B.; van Bussel, G.J.W.; Tomiyama, T. Reliability of Wind Turbine Technology Through Time. J. Sol. Energy Eng. 2008, 130, 031005. [Google Scholar] [CrossRef]
- Su, C.; Yang, Y.; Wang, X.; Hu, Z. Failures analysis of wind turbines: Case study of a Chinese wind farm. In Proceedings of the 2016 Prognostics and System Health Management Conference (PHM-Chengdu 2016), Chengdu, China, 19–21 October 2016. [Google Scholar]
- García Márquez, F.P.; Tobias, A.M.; Pinar Pérez, J.M.; Papaelias, M. Condition monitoring of wind turbines: Techniques and methods. Renew. Energy 2012, 46, 169–178. [Google Scholar] [CrossRef]
- Carroll, J.; McDonald, A.; McMillan, D. Failure rate, repair time and unscheduled O&M cost analysis of offshore wind turbines. Wind Energy 2016. [Google Scholar] [CrossRef]
- Nilsson, J.; Bertling, L. Maintenance management of wind power systems using condition monitoring systems—Life cycle cost analysis for two case studies. IEEE Trans. Energy Convers. 2007, 22, 223–229. [Google Scholar] [CrossRef]
- Pfaffel, S.; Faulstich, S.; Rohrig, K. Performance and reliability of wind turbines: A review. Energies 2017, 10, 1904. [Google Scholar] [CrossRef]
- Hahn, B.; Durstewitz, M.; Rohrig, K. Reliability of Wind Turbine–Experiences of 15 years with 1500 WTs. In Wind Energy; Peinke, J., Schaumann, P., Barth, S., Eds.; Springer: Berlin/Heidelberg, Germany, 2006. [Google Scholar]
- Koltsidopoulos Papatzimos, A.; Dawood, T.; Thies, P.R. Data Insights from an Offshore Wind Turbine Gearbox Replacement. J. Phys. Conf. Ser. 2018, 1104. [Google Scholar] [CrossRef]
- Kattelus, J.; Miettinen, J.; Lehtovaara, A. Detection of gear pitting failure progression with on-line particle monitoring. Tribiol. Int. 2018, 118, 458–464. [Google Scholar] [CrossRef]
- Artigao, E.; Koukoura, S.; Honrubia-Escribano, A.; Carroll, J.; McDonald, A.; Gómez-Lázaro, E. Current signature and vibration analyses to diagnose an in-service wind turbine drive train. Energies 2018, 11, 960. [Google Scholar] [CrossRef]
- Gonzalez, E.; Stephen, B.; Infield, D.; Melero, J.J. Using high-frequency SCADA data for wind turbine performance monitoring: A sensitivity study. Renew. Energy 2019, 131, 841–853. [Google Scholar] [CrossRef]
- Elosegui, U.; Egana, I.; Ulazia, A.; Ibarra-Berastegi, G. Pitch angle misalignment correction based on benchmarking and laser scanner measurement in wind farms. Energies 2018, 11, 3357. [Google Scholar] [CrossRef]
- Astolfi, D. A Study of the Impact of Pitch Misalignment on Wind Turbine Performance. Machines 2019, 7, 8. [Google Scholar] [CrossRef]
- Rabanal, A.; Ulazia, A.; Ibarra-Berastegi, G.; Sáenz, J.; Elosegui, U. MIDAS: A Benchmarking Multi-Criteria Method for the Identification of Defective Anemometers in Wind Farms. Energies 2019, 12, 28. [Google Scholar] [CrossRef]
- Tautz-Weinert, J.; Watson, S.J. Using SCADA data for wind turbine condition monitoring—A review. IET Renew. Power Gener. 2017, 11, 382–394. [Google Scholar] [CrossRef]
- Feng, Y.; Qiu, Y.; Crabtree, C.J.; Long, H.; Tavner, P.J. Monitoring wind turbine gearboxes. Wind Energy 2013, 16, 728–740. [Google Scholar] [CrossRef]
- Blanco, M.A.; Gibert, K.; Marti-Puig, P.; Cusidó, J.; Solé-Casals, J. Identifying health status of wind turbines by using self organizing maps and interpretation-oriented post-processing tools. Energies 2018, 11, 723. [Google Scholar] [CrossRef]
- Escaler, X.; Mebarki, T. Full-Scale Wind Turbine Vibration Signature Analysis. Machines 2018, 6, 63. [Google Scholar] [CrossRef]
- Dupuis, R. Application of Oil Debris Monitoring For Wind Turbine Gearbox Prognostics and Health Management. In Proceedings of the Annual Conference of the Prognostics and Health Management Society, Portland, OR, USA, 10–16 October 2010. [Google Scholar]
- Sheng, S. Monitoring of Wind Turbine Gearbox Condition through Oil and Wear Debris Analysis: A Full-Scale Testing Perspective. Tribol. Trans. 2016. [Google Scholar] [CrossRef]
- Cuadrat Prats, J. El clima de Aragón. Geografía Física de Aragón. Aspectos Generales y Temáticos; Asociación de Geógrafos Español: Murcia, Spain, 2004; pp. 15–26. [Google Scholar]
- Mabe, J.; Zubia, J.; Gorritxategi, E. Photonic low cost micro-sensor for in-line wear particle detection in flowing lube oils. Sensors 2017, 17, 586. [Google Scholar] [CrossRef] [PubMed]
- Lopez, P.; Mabe, J.; Miró, G.; Etxeberria, L. Low cost photonic sensor for in-line oil quality monitoring: Methodological development process towards uncertainty mitigation. Sensors 2018, 18, 2015. [Google Scholar] [CrossRef] [PubMed]
- British Standard. BS ISO 4406:1999 Hydraulic Fluid Power—Fluids—Method for Coding the Level of Contamination by Solid Particles; International Organization for Standardization: Geneva, Switzerland, 1999. [Google Scholar] [CrossRef]
- Pearson, K. VII. Note on regression and inheritance in the case of two parents. Proc. R. Soc. Lond. 1895, 58, 240–242. [Google Scholar]
- Spearman, C. The proof and measurement of association between two things. Am. J. Psychol. 1904, 15, 72–101. [Google Scholar] [CrossRef]
- Hotelling, H. Analysis of a complex of statistical variables into principal components. J. Educ. Psychol. 1933, 24, 417–441. [Google Scholar] [CrossRef]
- Ulrich, J. TTR: Technical Trading Rules. R Package Version 0.23-4. 2018. Available online: https://cran.r-project.org/web/packages/TTR/TTR.pdf (accessed on 15 July 2019).
- Cleveland, W.; Grosse, E.; Shyu, W. Local regression models. In Statistical Models in S; Chambers, J.M., Hastie, T.J., Eds.; Software Pacific Grove: Wadsworth, OH, USA, 1992; pp. 309–376. [Google Scholar]
- Therneau, T.; Atkinson, B. rpart: Recursive Partitioning and Regression Trees. R Package Version 4.1-13. 2018. Available online: https://cran.r-project.org/web/packages/rpart/vignettes/longintro.pdf (accessed on 15 July 2019).
- Breiman, L.; Friedman, J.; Olshen, R.; Stone, C. Classification and Regression Trees; Wadsworth Int. Group: Wadsworth, OH, USA, 1984; Volume 37, pp. 237–251. [Google Scholar]
Figure 1.
Operation regions over active power against wind speed plot.
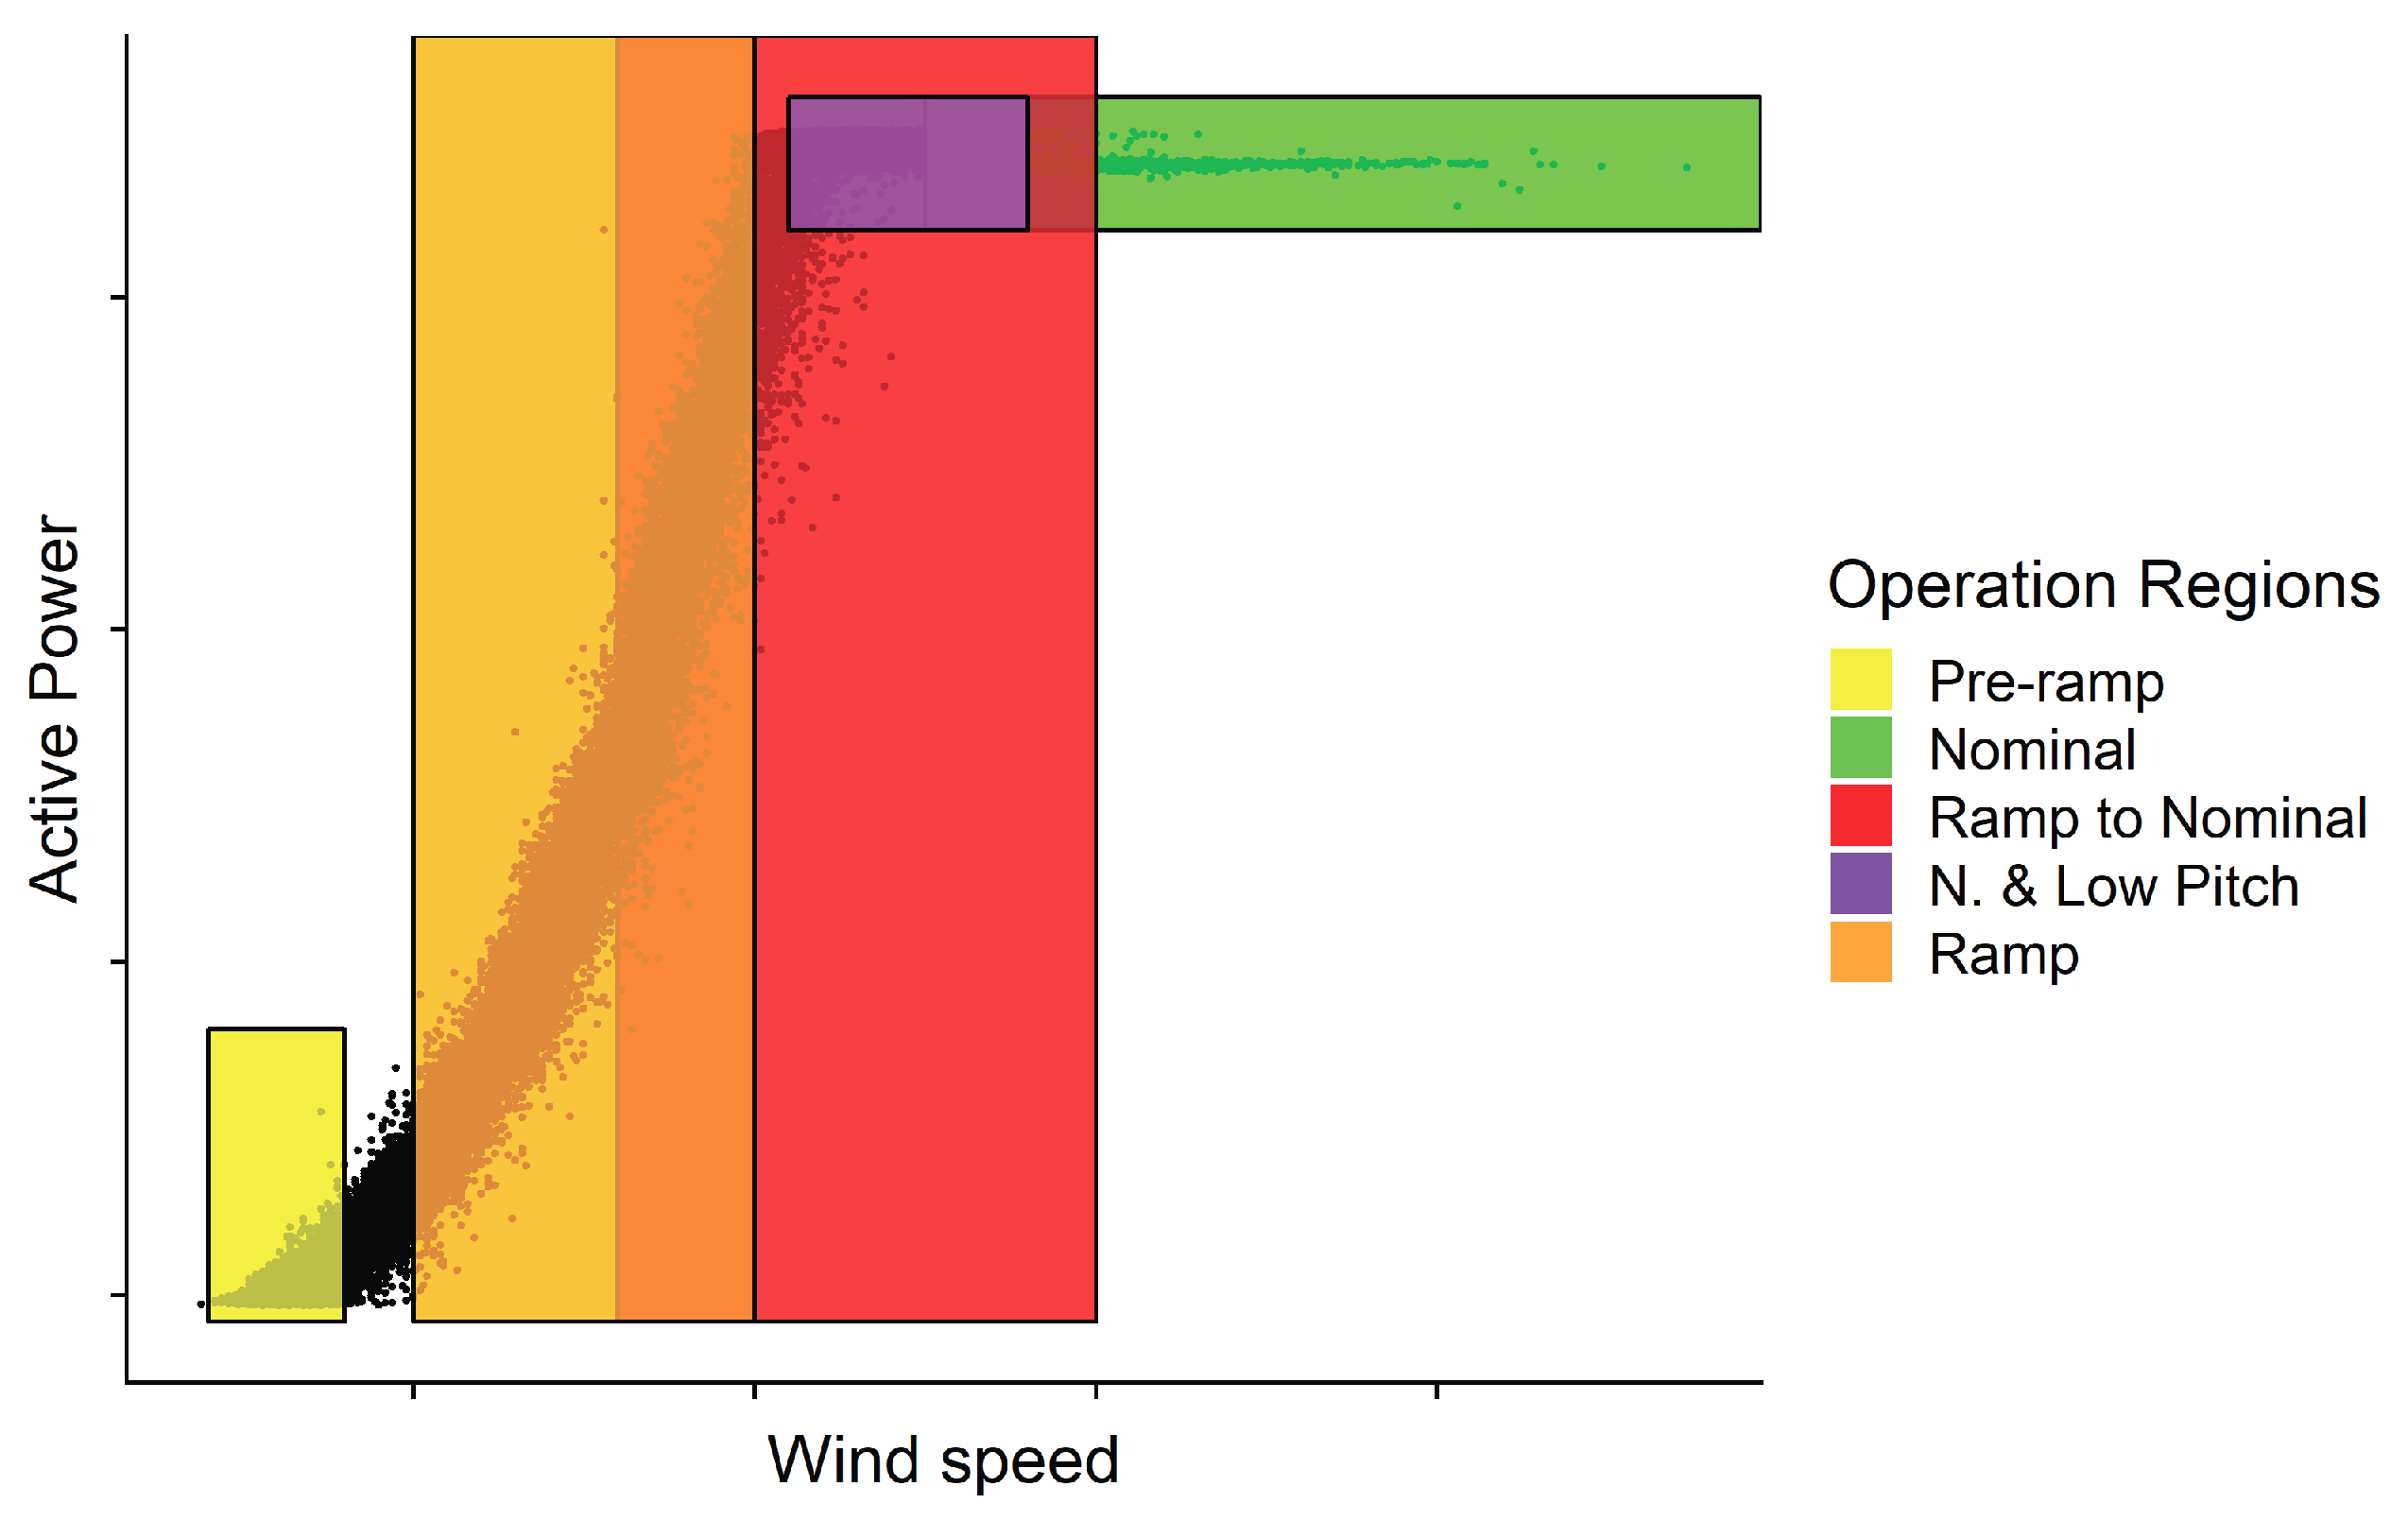
Figure 2.
SCADA variables against wind speed by WT. (a) Active power against wind speed, (b) pitch angle against wind speed, (c) generator speed against wind speed and (d) oil temperature against wind speed.
Figure 2.
SCADA variables against wind speed by WT. (a) Active power against wind speed, (b) pitch angle against wind speed, (c) generator speed against wind speed and (d) oil temperature against wind speed.

Figure 3.
Averaged values of gearbox temperature, active power and ISO.14 in 0.33 m/s wind speed bins. (a) Gearbox temperature. (b) Active power. (c) ISO.14.
Figure 3.
Averaged values of gearbox temperature, active power and ISO.14 in 0.33 m/s wind speed bins. (a) Gearbox temperature. (b) Active power. (c) ISO.14.
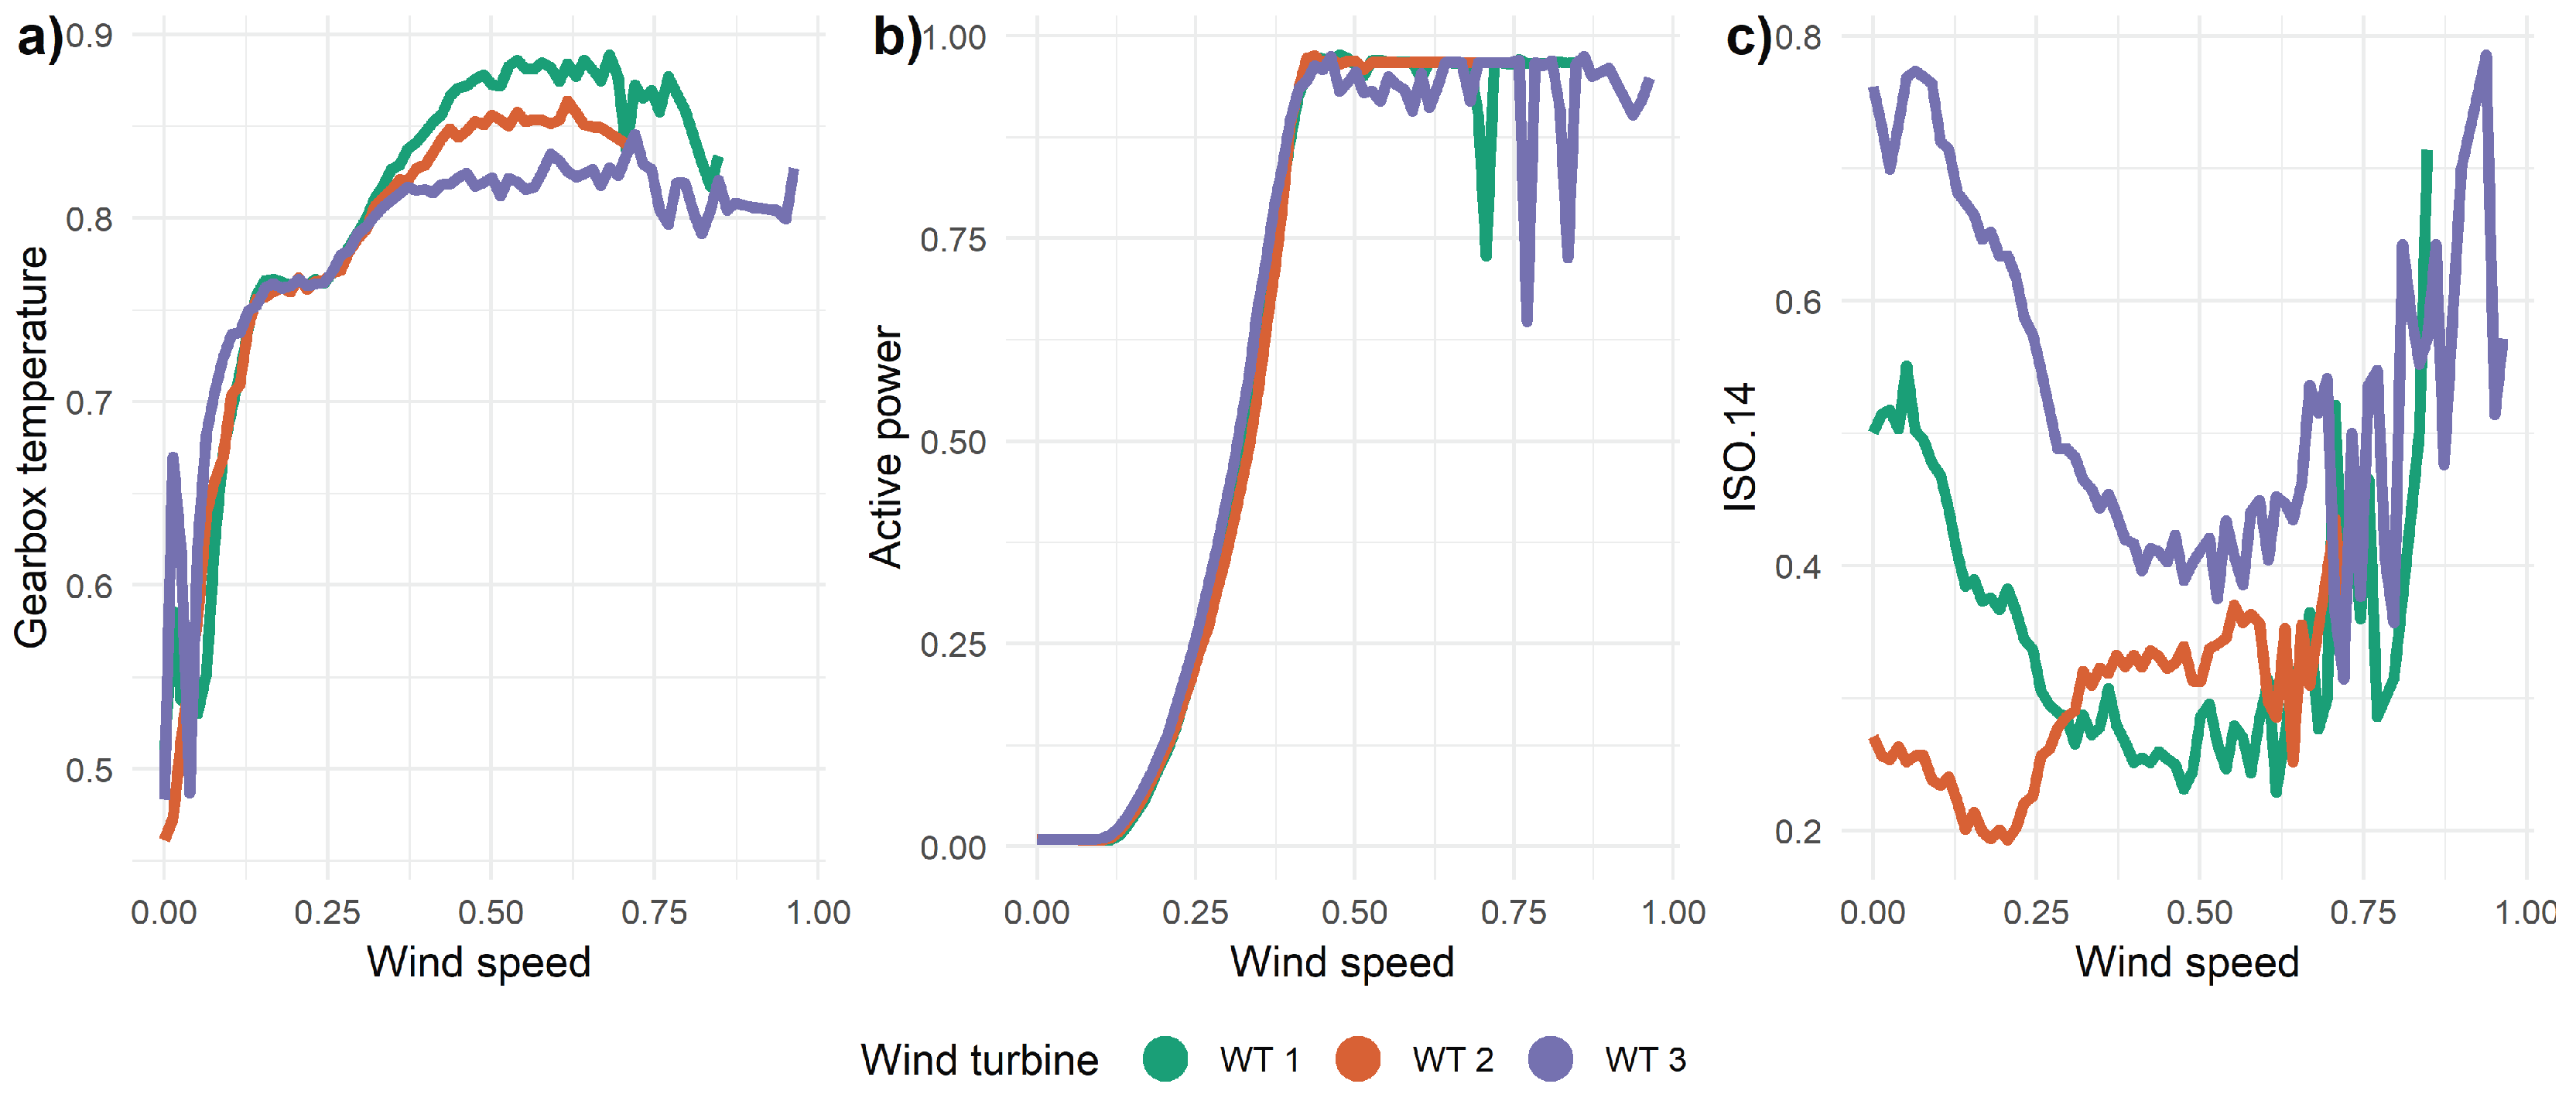
Figure 4.
Boxplots of ISO.14 particle creation rates during different operations.
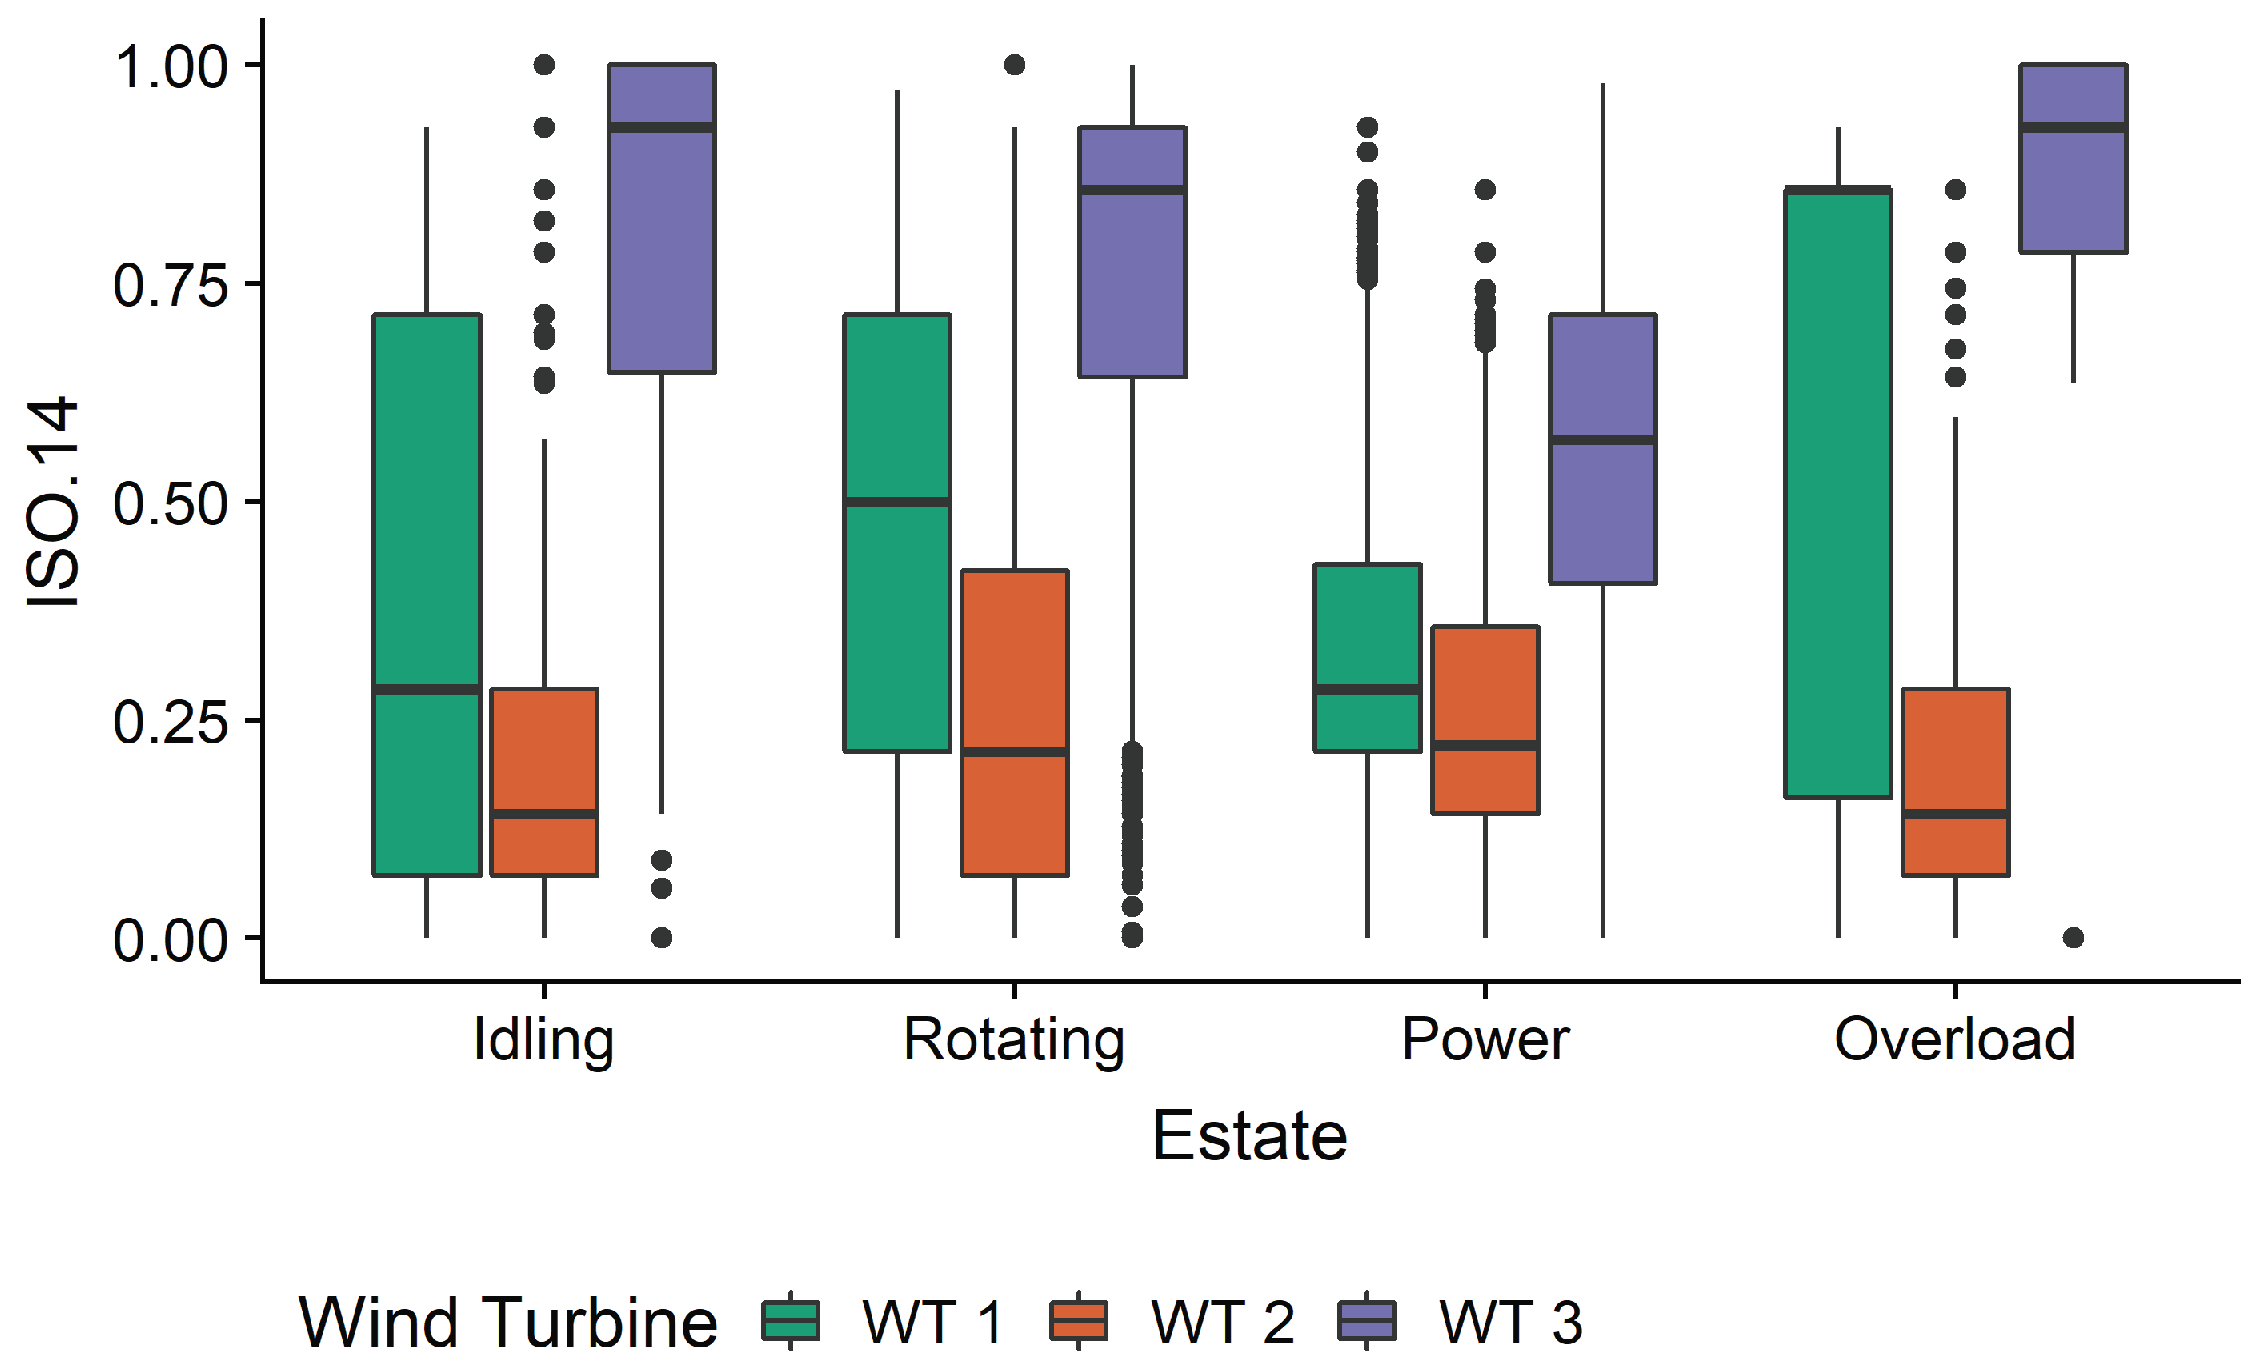
Figure 5.
Cumulative values against cumulative active power. (a) Temperature. (b) ISO.14.

Figure 6.
Density plot of the spearman correlation of ISO.14 in respect to the exponentially smoothed generator speed by wind turbine, vertical lines represent quartiles. (a) WT 1, (b) WT 2 and (c) WT 3.
Figure 6.
Density plot of the spearman correlation of ISO.14 in respect to the exponentially smoothed generator speed by wind turbine, vertical lines represent quartiles. (a) WT 1, (b) WT 2 and (c) WT 3.

Figure 7.
Examples of OSs showing high spearman correlation between ISO.14 and smoothed generator speed. (a) Positive correlation. (b) Negative correlation.
Figure 7.
Examples of OSs showing high spearman correlation between ISO.14 and smoothed generator speed. (a) Positive correlation. (b) Negative correlation.

Figure 8.
Boosting examples with disparate spearman correlation values between ISO.14 and smoothed generator speed. (a) Positive correlation. (b) Negative correlation. (c) No correlation.
Figure 8.
Boosting examples with disparate spearman correlation values between ISO.14 and smoothed generator speed. (a) Positive correlation. (b) Negative correlation. (c) No correlation.

Figure 9.
Example of the PCA obtained from the different OR and RMS (root mean square) values of the OS generated in WT 1.
Figure 9.
Example of the PCA obtained from the different OR and RMS (root mean square) values of the OS generated in WT 1.
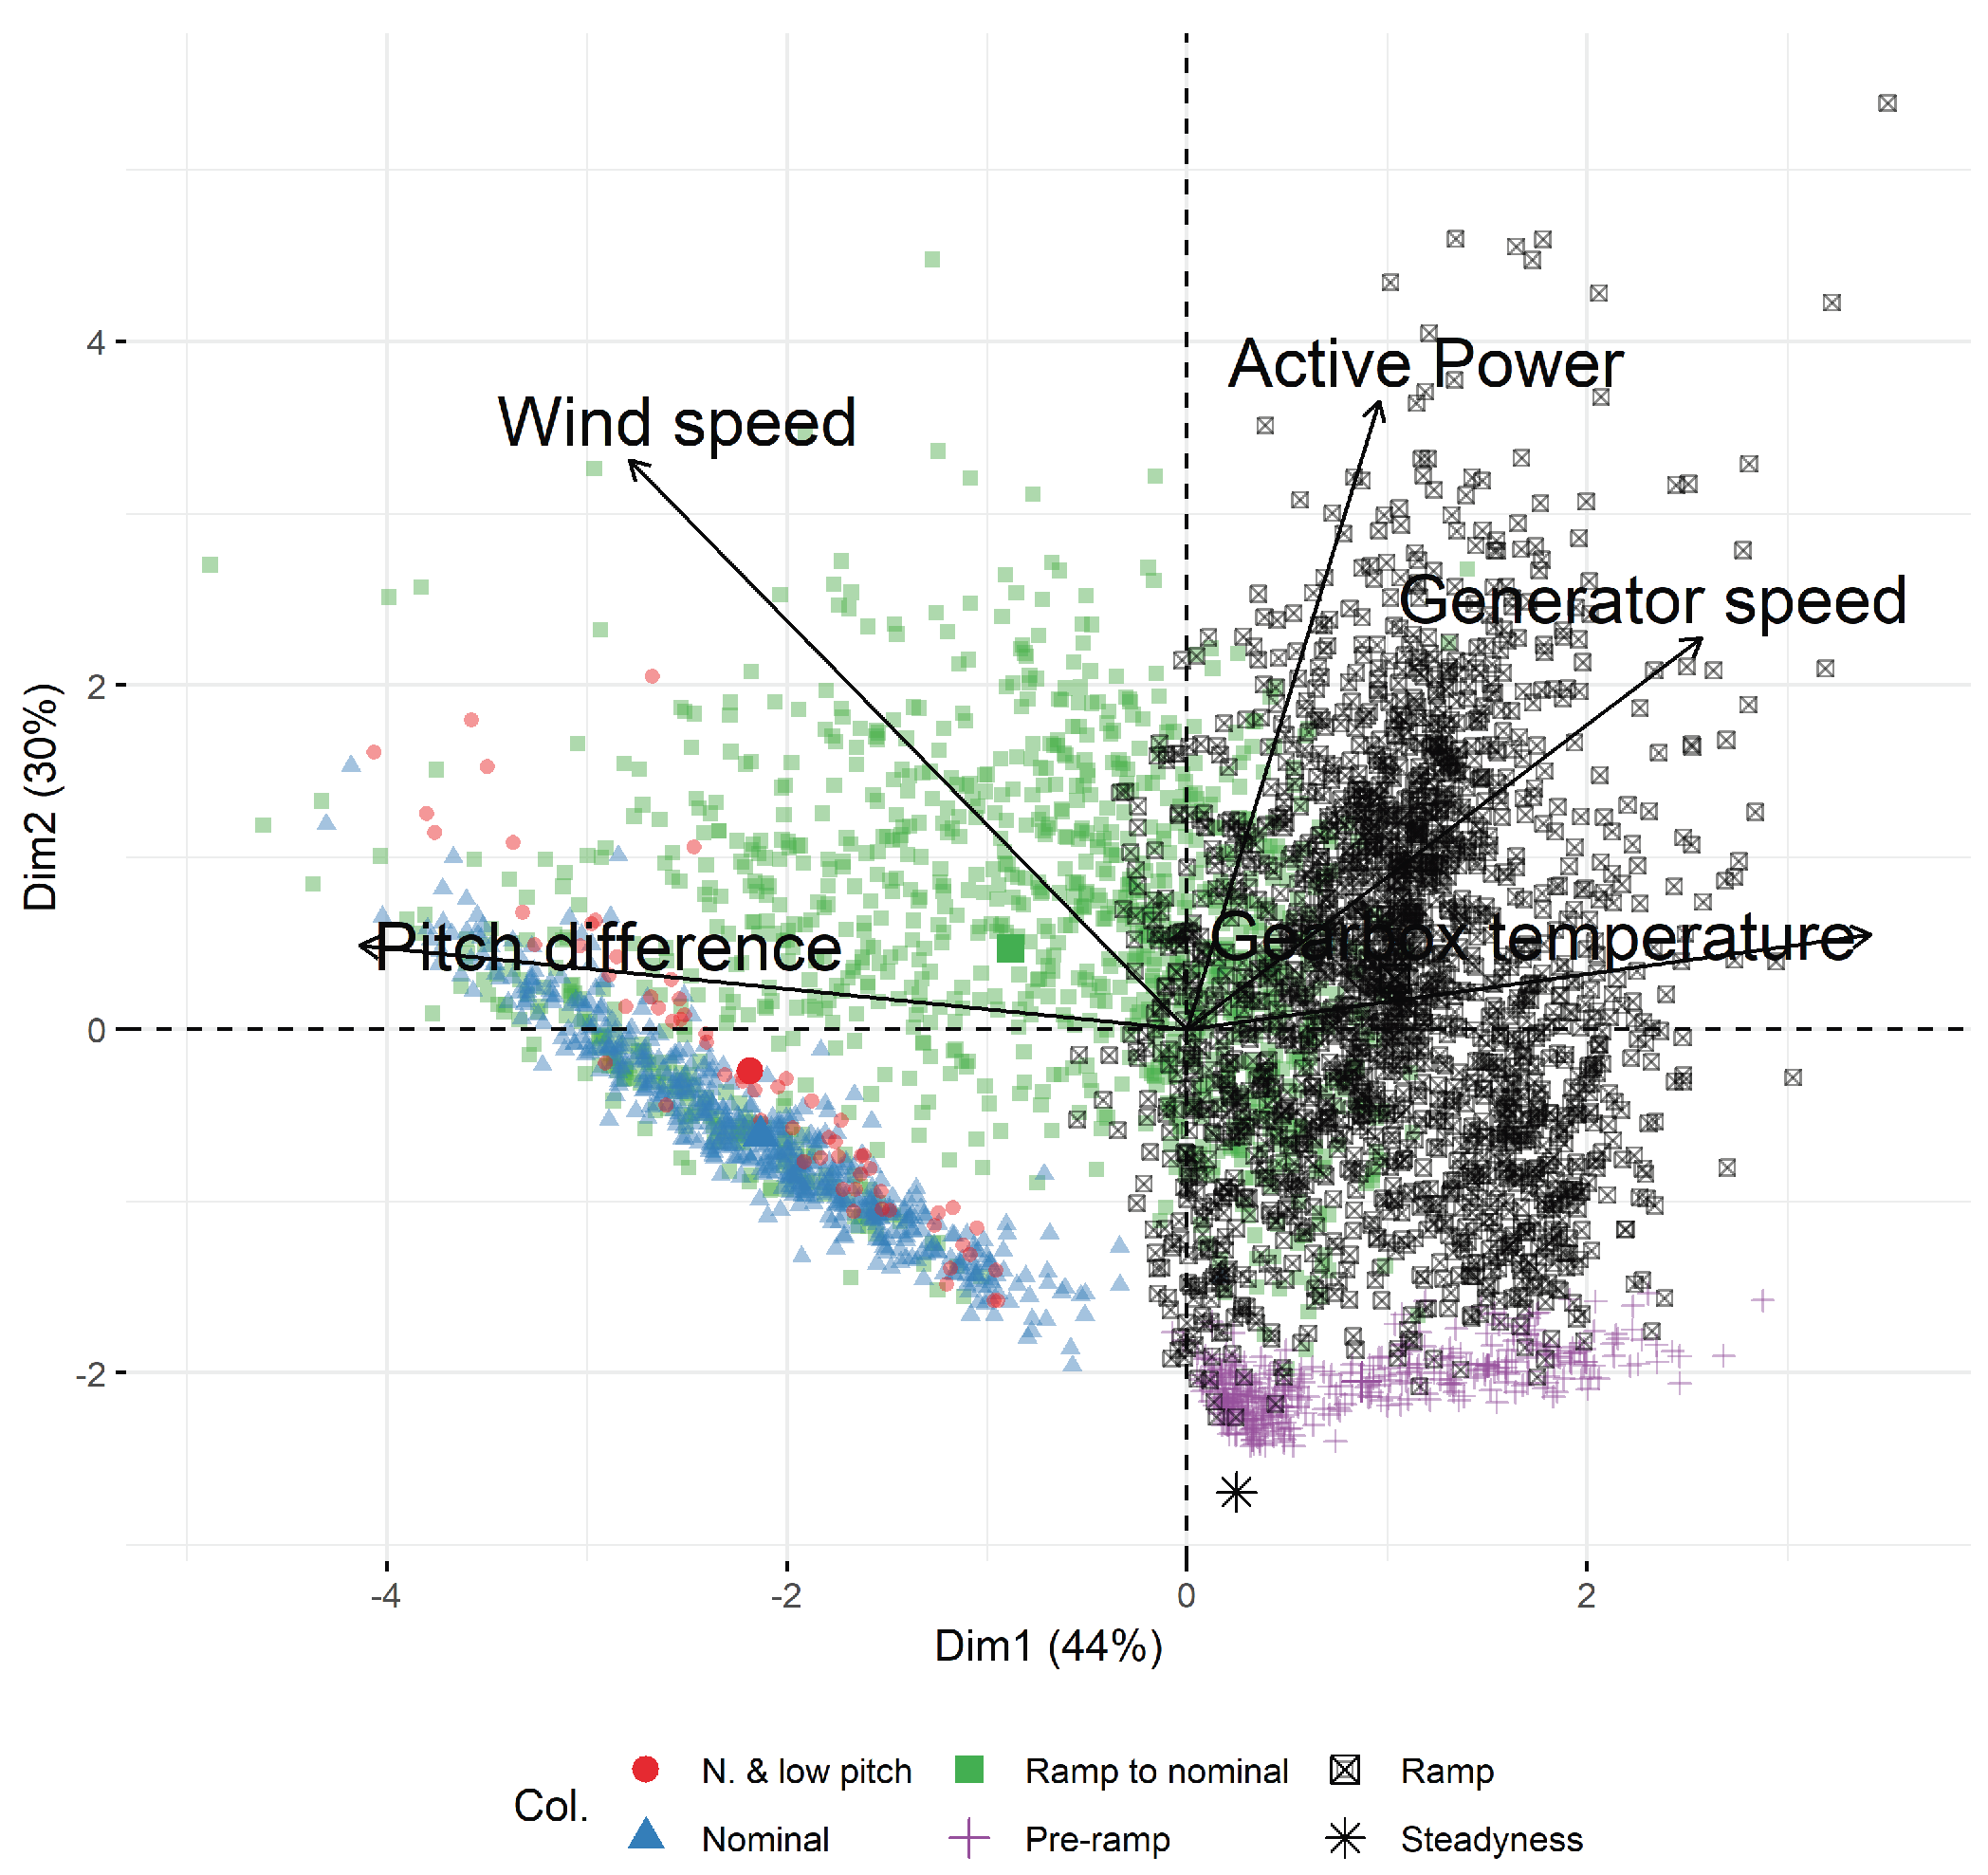
Figure 10.
RMS values of different variable OSs throughout the time, generated using type Nominal OR. Curve is obtained by local regression (LOESS) smoothing. (a) Gearbox temperature. (b) Active power.
Figure 10.
RMS values of different variable OSs throughout the time, generated using type Nominal OR. Curve is obtained by local regression (LOESS) smoothing. (a) Gearbox temperature. (b) Active power.

Figure 11.
RMS values of ISO.14 variable and smoothed trend fitted with LOESS.
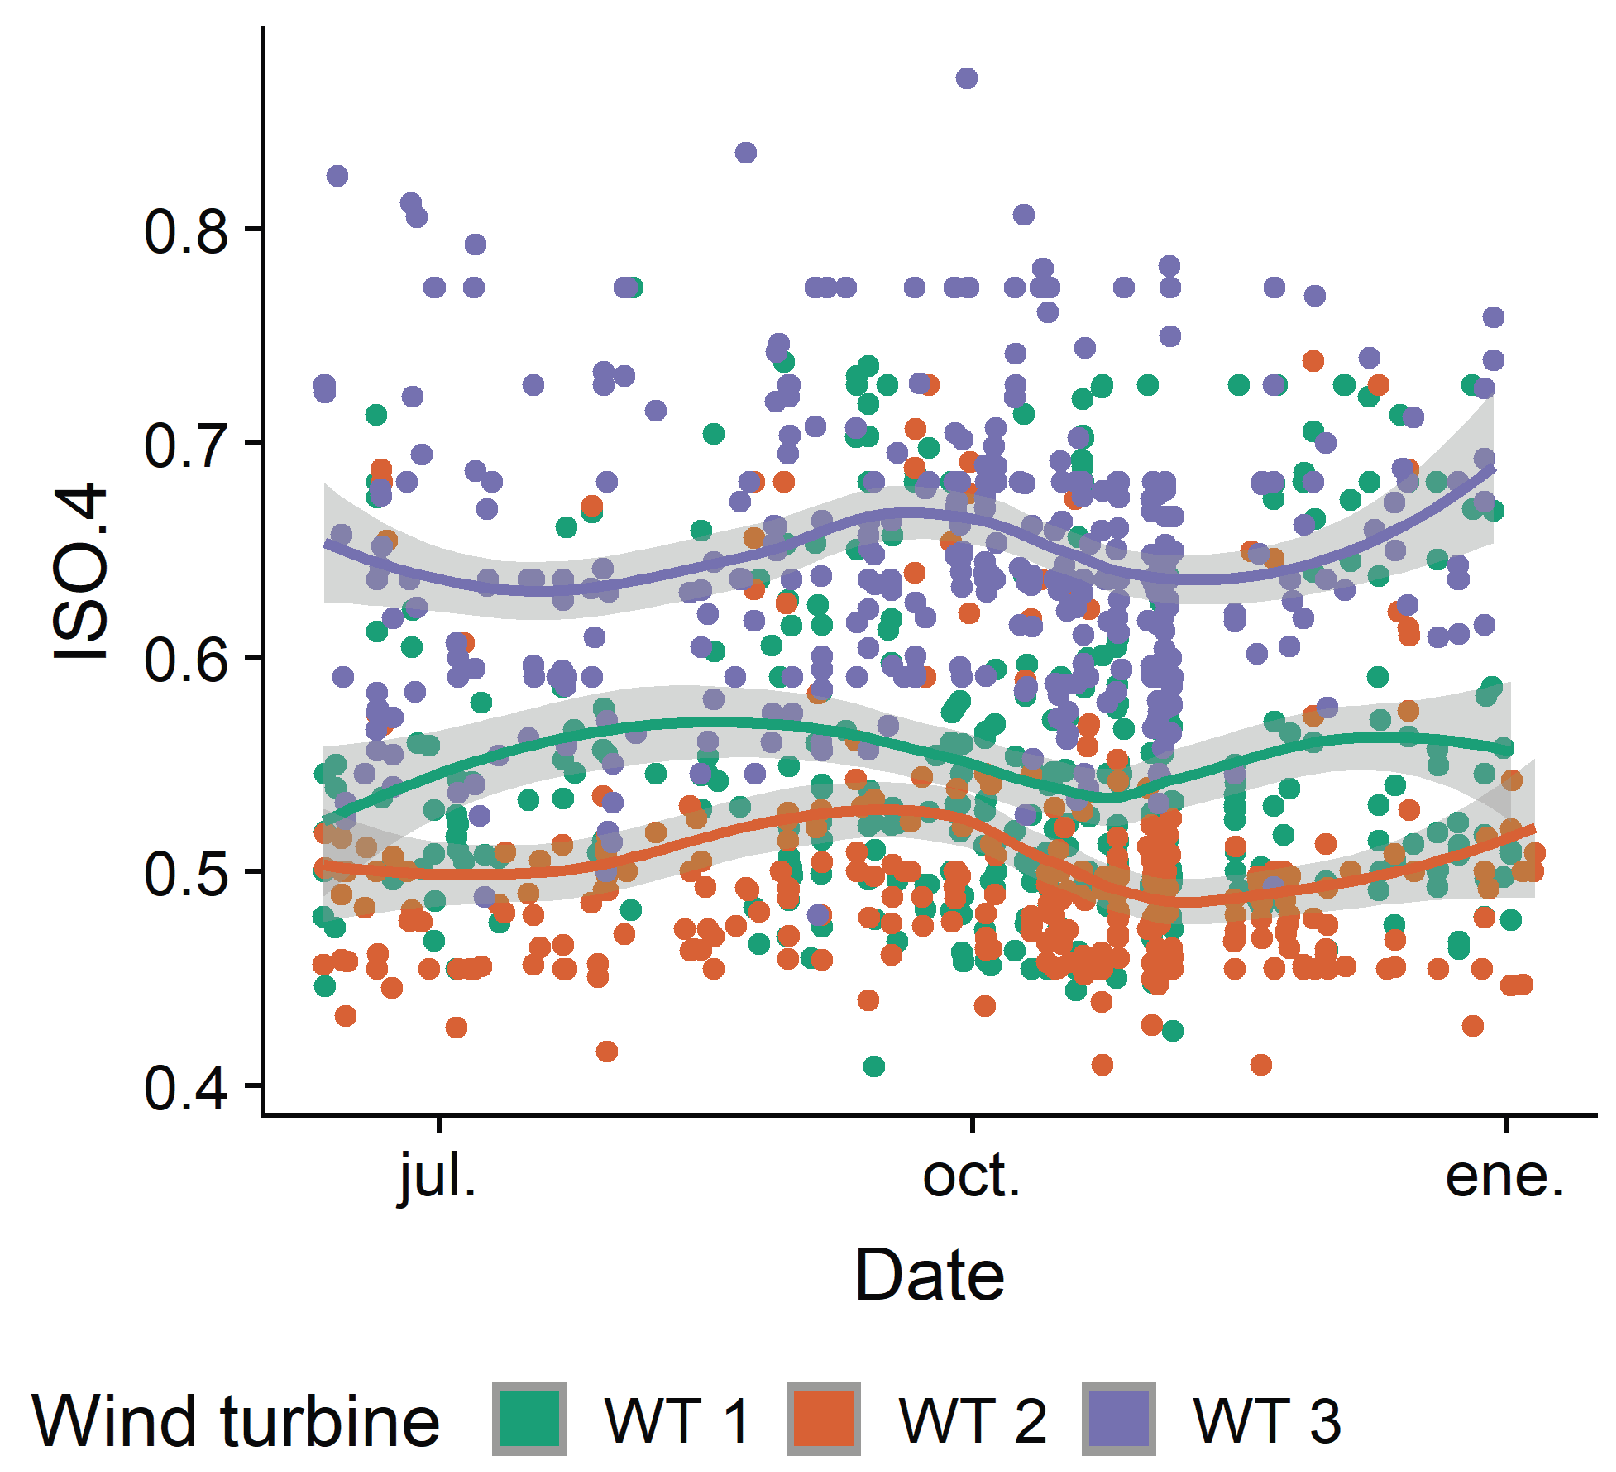
Figure 12.
LOESS smoothed particle generation rates (ISO 4, 6 and 14) of Pre-ramp ORs by WT. The horizontal lines at the top represent warning and danger thresholds for the different particle sizes.
Figure 12.
LOESS smoothed particle generation rates (ISO 4, 6 and 14) of Pre-ramp ORs by WT. The horizontal lines at the top represent warning and danger thresholds for the different particle sizes.


Table 1.
Variables available in the dataset and measurement units by data source.
| Source | System | Units of Measurement |
|---|---|---|
| SCADA | Pitch angle | |
| Gearbox temperature | C | |
| Wind speed | m/s | |
| Generator speed | rpm | |
| Active power | kW | |
| Oil debris sensor | ISO.4 | scale |
| ISO.6 | scale | |
| ISO.14 | scale |
Table 2.
Descriptions of the different operating regions.
| Operating Region | Characteristics |
|---|---|
| Nominal | Stable power generation. Varying pitch |
| N. & low pitch | Similar to nominal, but more restrictive and not including high wind speeds, delimited using pitch values. |
| Ramp to nominal | Ranges from about the middle of the power curve to beginning of nominal operation. |
| Ramp | Values taken only during the power ramp. |
| Pre-ramp | Values taken before the generator speed ramp starts. |
Table 3.
Weekly OS frequency of different minimum times by each wind turbine (WT) and operation region (OR).
Table 3.
Weekly OS frequency of different minimum times by each wind turbine (WT) and operation region (OR).
| Turbine | OR | >5 | >10 | >15 | >30 | >45 |
|---|---|---|---|---|---|---|
| WT 1 | N. & pitch | 179 | 64 | 30 | 8 | 3 |
| WT 1 | Nominal | 1073 | 532 | 357 | 189 | 113 |
| WT 1 | Ramp-to-nominal | 2204 | 1159 | 794 | 417 | 294 |
| WT 1 | Pre-ramp | 1119 | 367 | 155 | 25 | 9 |
| WT 1 | Ramp | 3451 | 1906 | 1380 | 757 | 481 |
| WT 2 | N. & pitch | 44 | 15 | 6 | 2 | 2 |
| WT 2 | Nominal | 985 | 507 | 339 | 183 | 128 |
| WT 2 | Ramp-to-nominal | 1833 | 1057 | 758 | 427 | 297 |
| WT 2 | Pre-ramp | 1040 | 325 | 140 | 29 | 5 |
| WT 2 | Ramp | 3316 | 1893 | 1340 | 744 | 502 |
| WT 3 | N. & pitch | 262 | 103 | 50 | 21 | 11 |
| WT 3 | Nominal | 1144 | 600 | 410 | 206 | 127 |
| WT 3 | Ramp-to-nominal | 2191 | 1159 | 820 | 453 | 320 |
| WT 3 | Pre-ramp | 1299 | 403 | 174 | 19 | 3 |
| WT 3 | Ramp | 3282 | 1840 | 1339 | 754 | 511 |
Table 4.
Steadiness of the different OR by WT.
| N. & Pitch | Nominal | Ramp to Nominal | Pre-Ramp | Ramp | |
|---|---|---|---|---|---|
| WT 1 | |||||
| WT 2 | |||||
| WT 3 | |||||
| Average |
Table 5.
Variation of the ORs by WT.
| N. & Pitch | Nominal | Ramp to Nominal | Pre-Ramp | Ramp | |
|---|---|---|---|---|---|
| WT 1 | |||||
| WT 2 | |||||
| WT 3 | |||||
| Average |
© 2019 by the authors. Licensee MDPI, Basel, Switzerland. This article is an open access article distributed under the terms and conditions of the Creative Commons Attribution (CC BY) license (http://creativecommons.org/licenses/by/4.0/).
Share and Cite
MDPI and ACS Style
López de Calle, K.; Ferreiro, S.; Roldán-Paraponiaris, C.; Ulazia, A. A Context-Aware Oil Debris-Based Health Indicator for Wind Turbine Gearbox Condition Monitoring. Energies 2019, 12, 3373. https://doi.org/10.3390/en12173373
AMA Style
López de Calle K, Ferreiro S, Roldán-Paraponiaris C, Ulazia A. A Context-Aware Oil Debris-Based Health Indicator for Wind Turbine Gearbox Condition Monitoring. Energies. 2019; 12(17):3373. https://doi.org/10.3390/en12173373
Chicago/Turabian StyleLópez de Calle, Kerman, Susana Ferreiro, Constantino Roldán-Paraponiaris, and Alain Ulazia. 2019. "A Context-Aware Oil Debris-Based Health Indicator for Wind Turbine Gearbox Condition Monitoring" Energies 12, no. 17: 3373. https://doi.org/10.3390/en12173373
Note that from the first issue of 2016, this journal uses article numbers instead of page numbers. See further details here.