Effect of Combined Inoculation on Biogas Production from Hardly Degradable Material

Faculty of Science and Engineering, University of Groningen, Nijenborgh 4, 9747 AG Groningen, The Netherlands
*
Author to whom correspondence should be addressed.
Energies 2019, 12(2), 217; https://doi.org/10.3390/en12020217
Submission received: 6 December 2018
/
Revised: 27 December 2018
/
Accepted: 3 January 2019
/
Published: 11 January 2019
(This article belongs to the Special Issue Production and Utilization of Biogas)
Abstract
:The goal of this research was to appraise the effect of combined inoculation on the performance of anaerobic digesters treating hardly degradable material, and particularly the pressed fine sieved fraction (PFSF) derived from wastewater treatment plants (WWTPs). Batch tests were conducted in mesophilic conditions in order to examine the optimal mixing ratio of inoculums. Mixing ratios of 100:0, 75:25, 50:50, 25:75, and 0:100 of three different inoculums were applied in the batch tests. The findings indicated that the inoculation of digested activated sludge with digested organic fraction of municipal solid waste (MSW) in the ratio 25:75 resulted in a higher PFSF degradation and a higher biogas yield. The results from the kinetic analysis fit well with the results from the batch experiment.
1. Introduction
The incremental demand for energy and strict environmental regulations for waste management are the most crucial challenges faced by European countries [1,2]. Energy based on fossil fuels is regarded as non-environmentally friendly and unsustainable [3]. In contrast, renewable bioenergy is an alternative solution to meet the electricity and heat requirements of the country with a cost-efficient and beneficial for the environment technology. Netherlands generates a vast amount of sludge from the livestock biogas farms and the wastewater treatment plants (WWTPs). Several treatment methods are applied to treat agricultural and industrial biowaste, with anaerobic digestion (AD) technology, among others, being widely applied [4,5,6].
Four steps (hydrolysis, acidogenesis, acetogenesis, and methanogenesis) occur during the AD process. AD produces energy in the form of biogas with the approximate composition of 55–70% CH4—30–45% CO2 [7]. The biogas can be used for heating or electricity production, as well as for mobility after upgrading [8,9,10,11]. The AD technology has the potential for further improvement and application within the EU, as biogas can play a key role in the bioenergy field [12,13,14,15]. Co-digestion has been reported as an alternative technique treating two or more substrates [16,17,18]. The positive effect of co-digestion is due to the balanced carbon to nitrogen (C:N) ratio (ideal ratio ranges from 20:1 to 30:1) being achieved by treating different substrates simultaneously [19]. Co-digestion can also provide the necessary alkalinity and nutrients in order to confront the drawbacks of the mono-digestion of recalcitrant materials [20]. Nowadays, research efforts aim to reinforce sustainability through materials recovery and reduced energy consumption [21,22]. An alternative technique has been demonstrated in several WWTPs by extracting fiber-based materials with sieves (fine sieved fraction). This material is highly cellulosic, and cannot be digested by itself; thus, it can be sustainably reused by applying anaerobic digestion technology.
The choice of the inoculum is essential for the degradation of recalcitrant biomass. A suitable inoculum contains a high number of active microbes that convert the organic matter to biogas. Therefore, the source of inoculum will affect the digestion performance, as it alters the degradation rate, biogas composition, digestion time, and reactor stability [23,24,25]. It is reported [26] that the inoculum is not only used to provide microbial species but also serves as a source of nutrients enhancing the microbial activity, and thus an elevated amount of biogas is produced. Another study stated that the amount of inoculum-to-substrate ratio has an effect only on the kinetics and not on the cumulative biogas yield [27]. Interestingly, regarding the effect of inoculum on biomass degradation, studies have focused on the inoculum type but not on the combined inoculation. This work aims to introduce the combined inoculation (co-inoculation) concept and its effect on the AD performance of the hardly degradable material. Pressed fine sieved fraction (PFSF) was selected as the substrate, and three inoculums were used for the experimental test. Fine sieving can be applied in wastewater treatment plants to recover the cellulose-rich slurries from the raw sewage. The derived fine sieved fraction (FSF) can be pressed and then be used for on-site energy recovery through anaerobic digestion.
The biogas yield and several process parameters were the main indicators to evaluate the efficiency of co-inoculation. The specific objectives of this study were to (1) determine the biogas yield of PFSF in mono-inoculated reactors; (2) examine the influence of the combined inoculation on the PFSF degradation; and (3) predict the biogas production using first-order and cone kinetic models.
2. Materials and Methods
2.1. Inoculums and Substrate
The digestates used as inoculums in this study were obtained from three different sources and their characteristics are shown in
Table 1. The digestate IN1 was obtained from an anaerobic digester treating the anaerobic activated sludge in the WWTP of Garmerwolde, Groningen. The digestate IN2 was collected from an anaerobic bioreactor treating the organic fraction of municipal solid waste (MSW) in the MSW treatment plant of Attero in Groningen. The digestate IN3 was obtained from a livestock farm digester in Groningen treating cow manure. All of the digesters have been stably operated for many years.
To maintain freshness and microbial activity, all inoculums were stored at 6 °C and reactivated at 37 °C for two days prior to use. The PFSF used for digestion was collected from the sewage treatment plant, Blaricum, the Netherlands, and was stored in airtight bottles at 6 °C to prevent possible hydrolysis.
2.2. Batch Tests
Biogas potential tests were implemented to evaluate the effect of the combined inoculation on biogas production. Glass bottles (300 mL) with 240 mL working volume and 60 mL head volume were used as batch digesters. The PFSF was digested with three different inoculums and their mixtures in the ratios 75:25, 50:50, and 25:75 (Table 2). The inoculum-to-substrate ratio (ISR) was set to 2 (based on VS basis) as it is considered optimal based on the previous studies [24,25,26,27,28,29]. The bottles were filled with the appropriate amount of substrate and inoculum, distilled water, flushed with nitrogen for 5 min, and sealed with butyl rubbers. Control reactors were used containing solely the individual inoculums to correct the biogas from the combined inoculation. All the bottles were placed in a rotating incubator (150 rpm) at 36 °C for 30 days. Triplicate bottles were used in all experiments, and all values were means of triplicate ± standard deviation.
2.3. Analytical Methods
Total solids (TS; g∙kg−1) and volatile solids (VS; g∙kg−1) were calculated according to the recommendations of the Standard Methods of Eaton et al. (2005) [30]. The pH value was measured using a pH meter (HI991001, Hanna Instruments, Woonsocket, RI, USA). The chemical oxygen demand (COD; g∙kg−1) was determined using assay kits (Hach Lange GmbH, Düsseldorf, Germany) according to the manufacturer’s instructions and was quantified by a spectrophotometer (DR/2010, Hach, Loveland, CO, USA). Total alkalinity ((g CaCO3∙L−1) was determined using Nordmann titration method [31]. Technical digestion time is the time needed to produce 80% of the maximal digester biogas [32]. The biogas volume (mL∙g VSsubstrate−1∙day−1) was measured with the water displacement method and was standardized according to DIN 1343 (standard conditions—temperature (T) = 0 °C and pressure (P) = 1.013 bar) [33]. The gas equipment used in this work was capable of providing biogas data with 5% accuracy [34]. The biogas volume was normalized according to the equation [35]
where VN is the volume of the dry biogas at standard temperature and pressure (mLN), V = recorded volume of the biogas (mL), pw = water vapor pressure as a function of ambient temperature (mmHg), T = ambient temperature (K). The water vapor pressure (pw) was estimated according to the modified Buck equation [36]
where P(T) is the vapor pressure in mmHg, and T is the temperature at the ambient space (°C).
2.4. Kinetic Study
G(t) is the cumulative biogas yield at the digestion time t days (mL biogas∙g VSsubstrate−1), GO is the maximum biogas potential of the substrate (mL biogas∙g VSsubstrate−1), n is the shape factor, K is the biogas production rate constant (d−1), and t is the time (days). The predicted data were plotted with the experimental biogas data. For the validation of the models, the statistical indicators root mean square error (RMSE) and correlation coefficient (R2) were calculated from the equations [39]
where dj is the deviation between the jth measured and the predicted values, and m is the number of data points; and
where Xj is the jth predicted value.
2.5. Statistical Analysis
Statistical significance of the data was determined by one-way ANOVA using Microsoft Office Excel (Microsoft, USA) with a threshold p-value of 0.05.
3. Results
3.1. Biogas Production
The cumulative biogas yield (mL∙g VSsubstrate−1) and the daily biogas production rate (mL∙g VSsubstrate−1∙day−1) were calculated in order to evaluate the effect of combined inoculation on the anaerobic digestion of PFSF. In the mono-inoculation, the biogas production rapidly began on the first day of digestion in all of the digesters (Figure 1).
The high daily biogas production rate in R1 and R2 digesters were 79.4 mL∙g VSsubstrate−1 on the 5th day and 77.3 mL∙g VSsubstrate−1 on the 2nd day, respectively. As seen in Figure 1, the daily biogas amount in R1 and R2 remained above 25 mL∙g VSsubstrate−1 until the 7th and 10th day, respectively, and thereafter dropped to a lower level (<10 mL∙g VSsubstrate−1∙day−1). The R3 digester treating the FSF with the digested cow manure sludge showed a biogas production rate of 51.8 mL∙g VSsubstrate−1 on the 3rd day of the digestion.
In order to enhance the degradation of the PFSF, a combined inoculation was applied in different mixtures ratios (75:25, 50:50, and 25:75) of the inoculums while operating the digesters R4 to R12 at the ISR of 2. A similar trend to R1 and R2 was shown by the reactors R4 to R6 with the mixing ratios 75:25, 50:50, and 25:75 reaching the maximum daily biogas yields of 82.4, 83.5, and 96.6 mL∙g VSsubstrate−1, respectively (4th day). The daily biogas production was fluctuating during the time period of 1 to 8 days of digestion with the range of 30–80 mL∙g VSsubstrate−1∙day−1, and then gradually declined in the range of 5–15 mL∙g VSsubstrate−1∙day−1. The use of digested cow manure as co-inoculum (R8 to R12) resulted in a lower daily biogas yield.
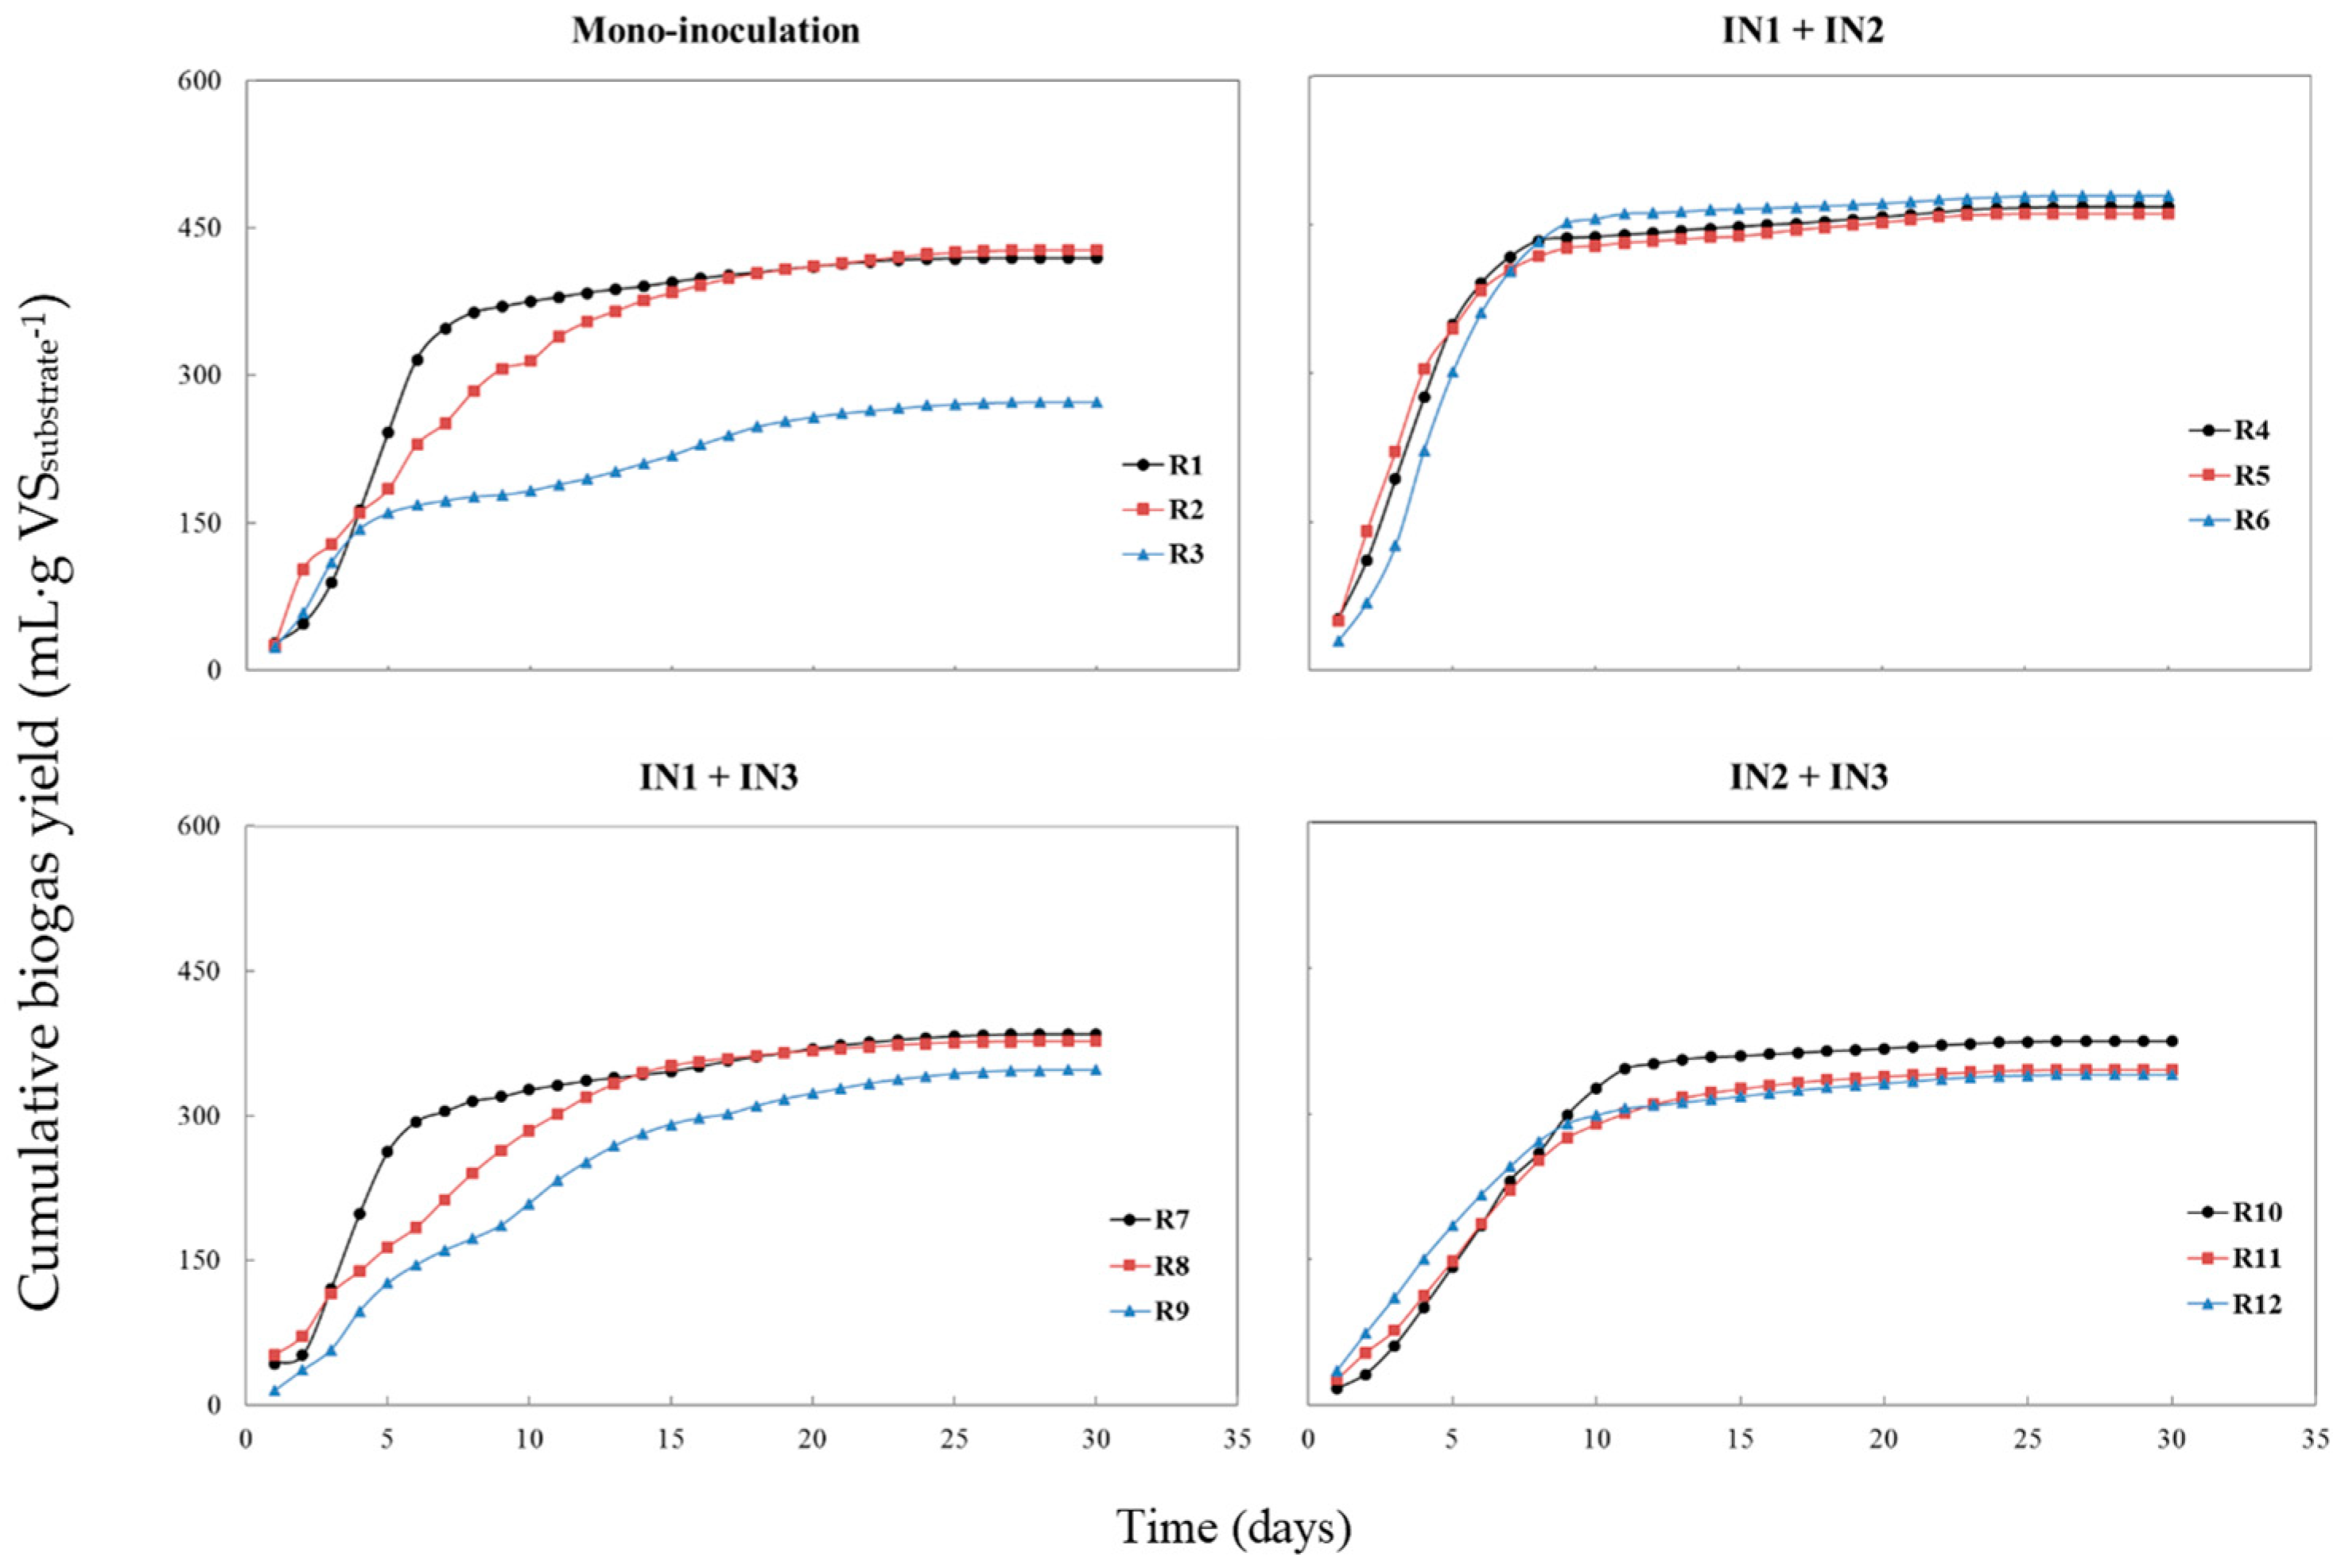
After 28 days of digestion, the cumulative biogas production of R1 and R2 reached to 418.9 and 427.6 mL∙g VSsubstrate−1, respectively, against 273.0 mL∙g VSsubstrate−1 achieved in R3 (Table 3). The results in this study are lower to those of the methane derived from the anaerobic digestion of FSF at 35 °C [40]. The inoculum source is crucial to ensure operational stability and to reinforce the performance of the anaerobic digestion [41]. Elbeshbishy et al. [42] concluded that the inoculum obtained from a digester treating municipal wastewater sludge was superior to the inoculum obtained from a digester treating food waste. Lignocellulosic fibers are often present in the organic fraction of MSW; therefore, the microorganisms and enzymes present in the sludge were likely to get adapted to a lignocellulosic substrate [43].
Looking at the optimal mixing ratio, only R6 with an IN1/IN2 ratio of 25:75 showed a higher influence on the biogas yield. The R6 reached 479.7 mL∙g VSsubstrate−1 over the 468.2 and 461.3 mL∙g VSsubstrate−1 produced in R4 and R5, respectively (Figure 2). The IN1/IN2 mixing ratio of 25:75 increased the biogas yield approximately 18.5% in R6 in comparison to the mono-inoculation in R1 and R2 with the average biogas yield of 395.7 and 386.2 mL∙g VSsubstrate−1, respectively. The combined inoculation can possibly support nutrient enrichment that is very important for the anaerobic digestion process. However, the ISR of 2 has been previously reported as an optimum for the biogas production [24,25,26,27,28,29].
The cumulative biogas yield showed interdependence with the mixing ratio of inoculums in the case of digested cow manure use. It is to be noted that the cumulative biogas production yields in the digesters operated with the digested cow manure in the fractions of 50% and 75% were higher than that in R3 operated with 100% IN3. Specifically, the digesters R8, R9, R11, and R12 reached cumulative biogas yields of 377.1, 347.2, 345.7, and 340.2 mL∙g VSsubstrate−1, respectively, significantly higher than that achieved in R3 (Figure 1) indicating the enhanced activity of IN1 and IN2 resulting in sufficient organic mass degradation. The technical digestion time (T80—80% of the maximum biogas production) for all the reactors is given in Table 3. In general, the required periods (T80) observed in our experiments were considerably higher than the ones described in the literature.
3.2. pH and Alkalinity
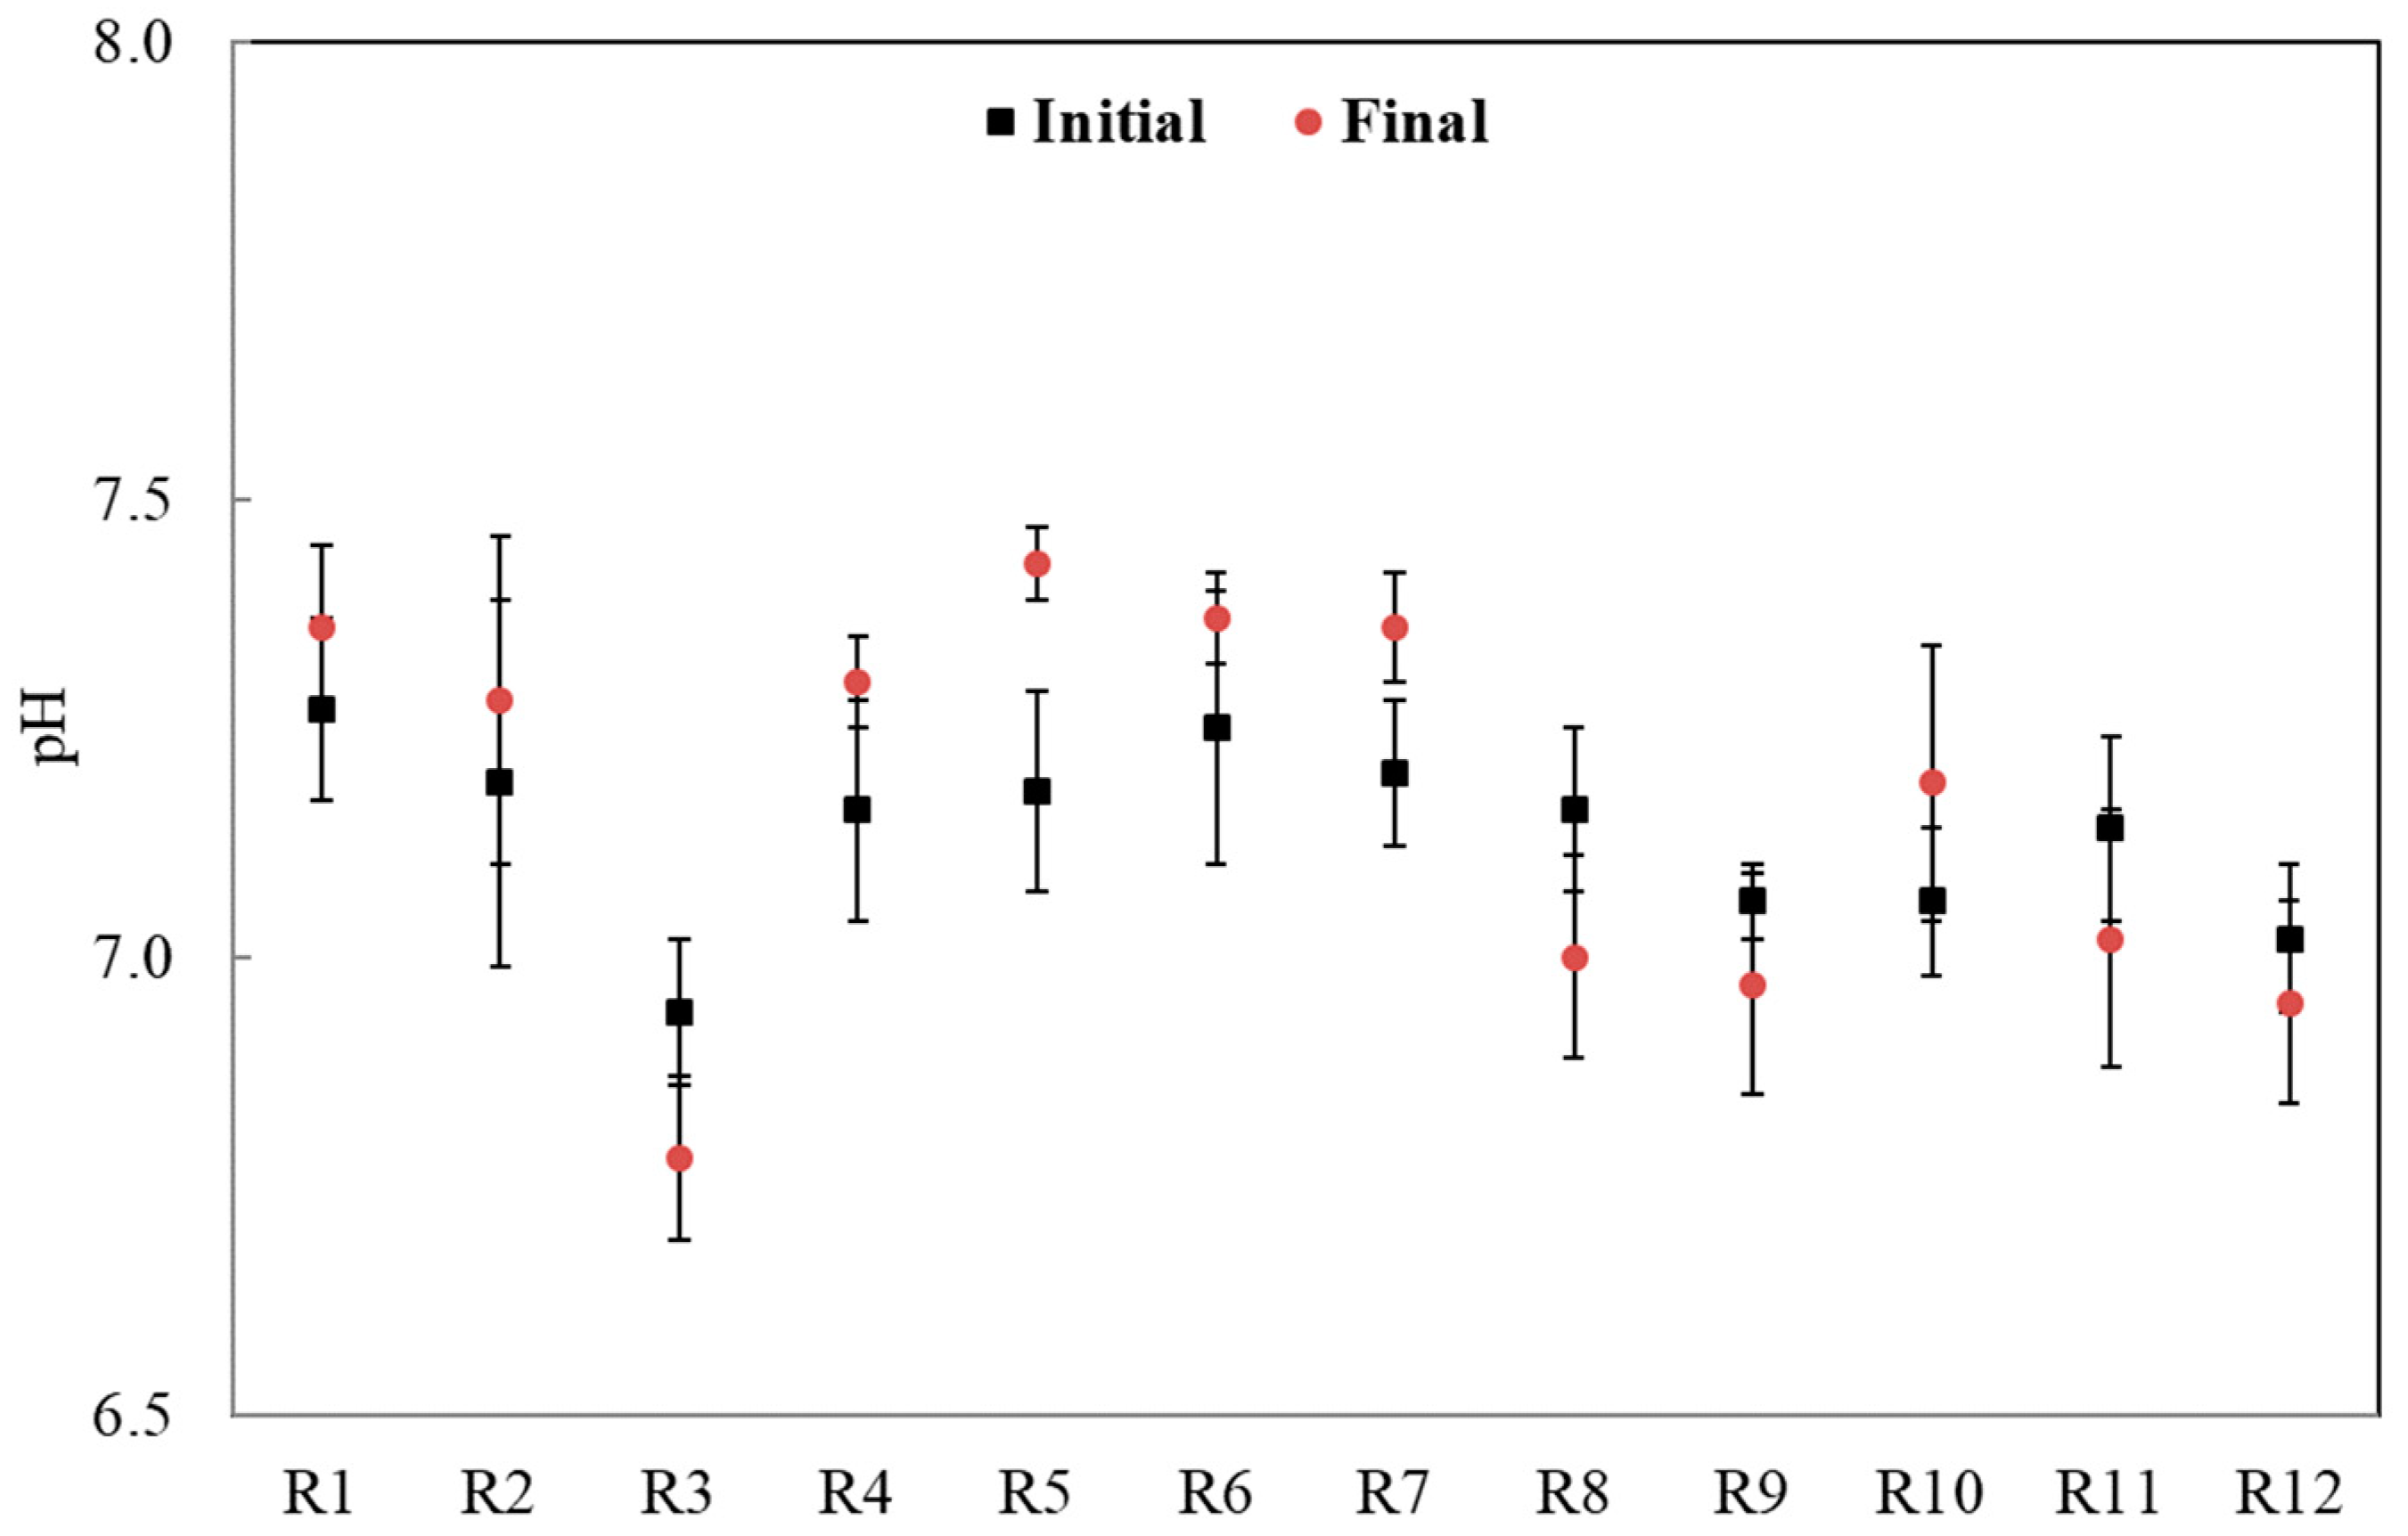
The pH values in the reactors before and after digestion are shown in Figure 3. The initial and final pH values for most of the reactors ranged from 7.0 to 7.5, which were suitable for the anaerobic digestion process. The reactor with the inoculum of digested cow manure showed lower pH values, which has inhibited the biogas production. However, reactors inoculated with the digested cow manure ≥50% resulted in the final pH being lower than the starting pH. The optimal pH range for the anaerobic digestion is regarded 6.8–7.4, which is favorable for the microbes within the reactor [44]. However, hydrolytic and acidogenic bacteria prefer pH values within the range of 5.5–6.5. The pH of the digester influences the degradation of organic matter, as fluctuations cause disturbances in the microbial activities and the subsequent metabolomics pathways [45,46,47]. Low pH values can significantly inhibit the reactor operation and subsequently, the digester comes to a ‘sour’ situation. This is ascribed to the production and accumulation of volatile fatty acids (VFA) in the initial phase of anaerobic digestion [45,46,47,48].
The total alkalinity of the mono- and co-inoculated reactors before and after the digestion is limned in Figure 4. No extra alkalinity was added in this study and the only source of alkalinity was the inoculum. Alkalinity represents the buffer capacity of the reactors and is a reliable parameter to evaluate the stability of the reactors [20].
The pattern of alkalinity showed a tendency similar to that of pH. The alkalinity of the reactors increased at the end of the experiment except the ones inoculated with the digested cow manure ≥50%. The reduction of pH may be countered by the produced alkalinity in the form of bicarbonate and carbon dioxide and ammonia; this alkalinity can offset the imbalance occurred from the pH reduction [49,50].
3.3. VS% Removal
In order to examine the degradation efficiency and correspondence with the biogas produced, the degradation of volatile solids was determined. The calculated VS removal of the reactors is given in Table 3. R6 showed the highest VS degradation rate of 48.2% following by R4 and R5 with degradation rates of 45.4% and 44.0%, respectively. The reactors with 25% IN3 revealed a more rapid biogas production in comparison to those with ≥50% IN3. This might be due to the fast release of the oligomers and monomeric sugars affecting the reactivity of the polymers.
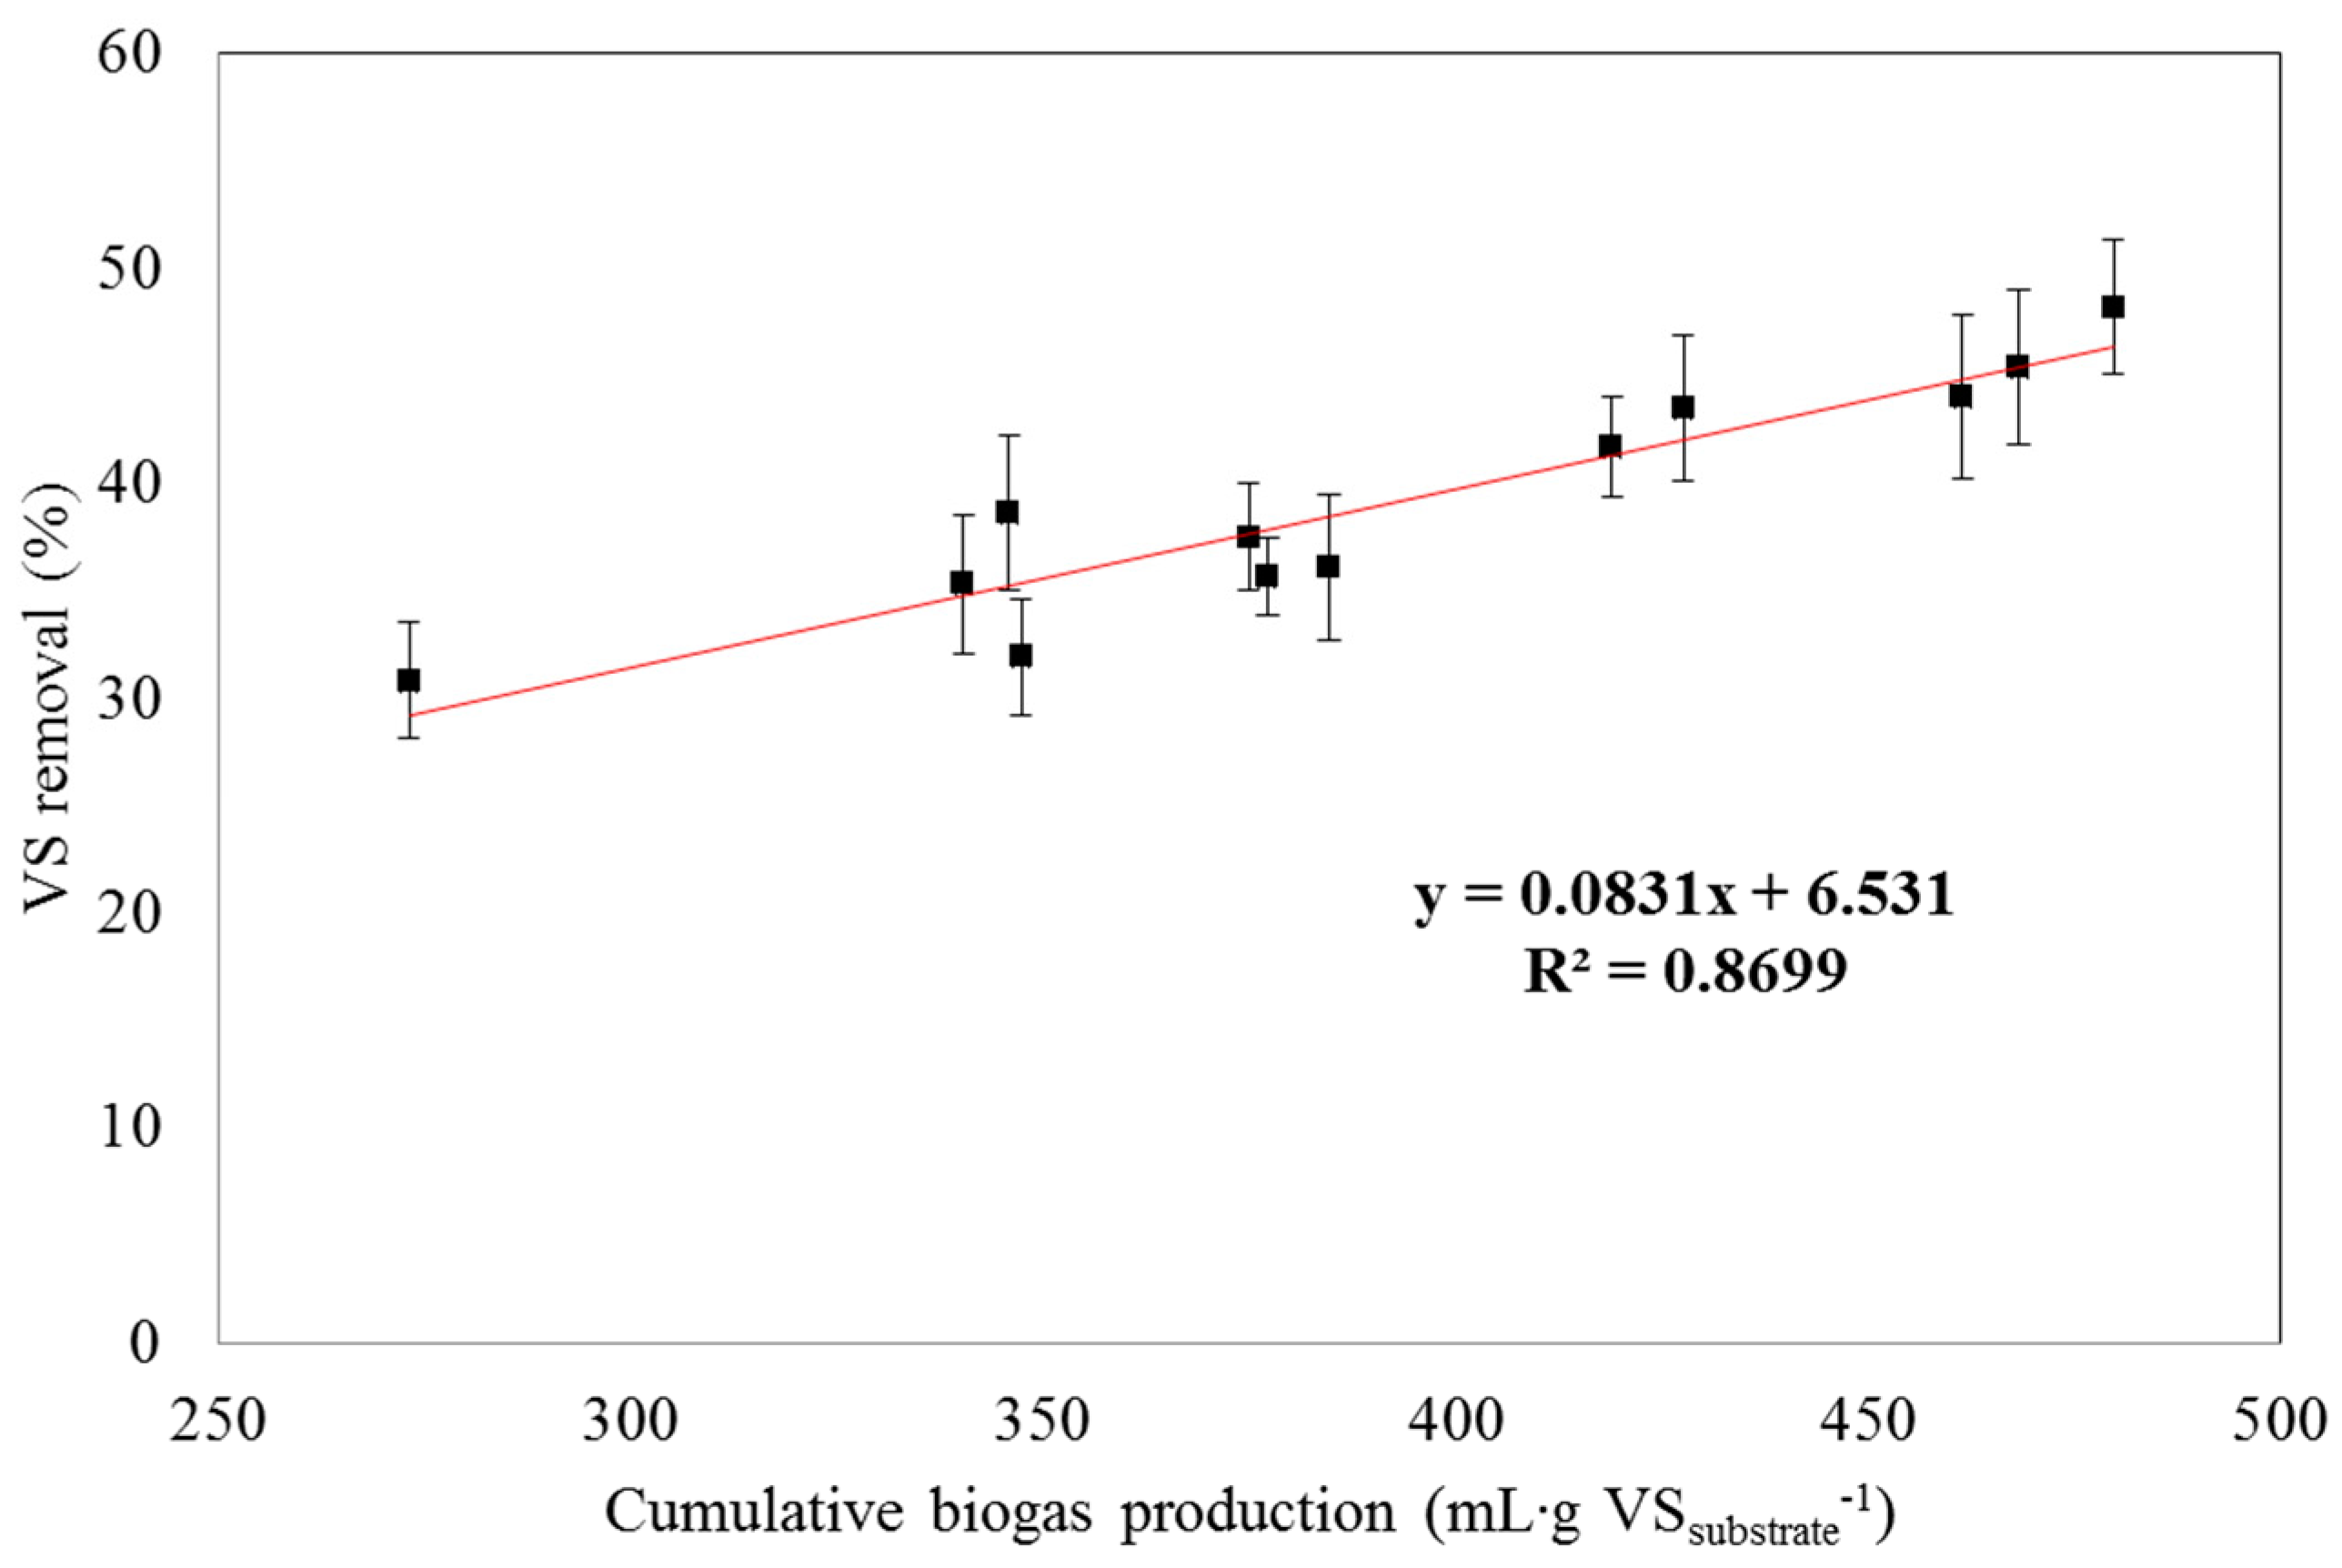
Oligomer solubility could potentially play an important role in controlling the degradation in the hydrolysis of hemicellulose [51]. Li et al. [52] cited that high VS removal was ascribed to the sludge availability (ISR of 2) providing a buffering capacity and a sufficient microbial pool. The high FSF degradability can be justified by the low cellulosic fibers content [40]. Pommier et al. [53] stated that the heterogeneous biodegradability of different types of paper might be due to the lignin content and its structure that perchance burdens the degradation of hemicellulose components from the enzymes. From another aspect, the functional relationship of cumulative biogas yield and VS% removal was plotted in Figure 5.
A linear regression equation was established (Y = 0.083X + 6.531, R2 = 0.8699) and as expected, the increment of cumulative biogas yield followed a pattern similar to the VS removal. The high correlation coefficient (R2) indicated that there was a positive and significant correlation between the biogas yield and the degradation percentage of the organic material. The addition of the manure does not favor the biogas production as it contains a higher fraction of complex structured carbohydrates [54].
3.4. Kinetics Results
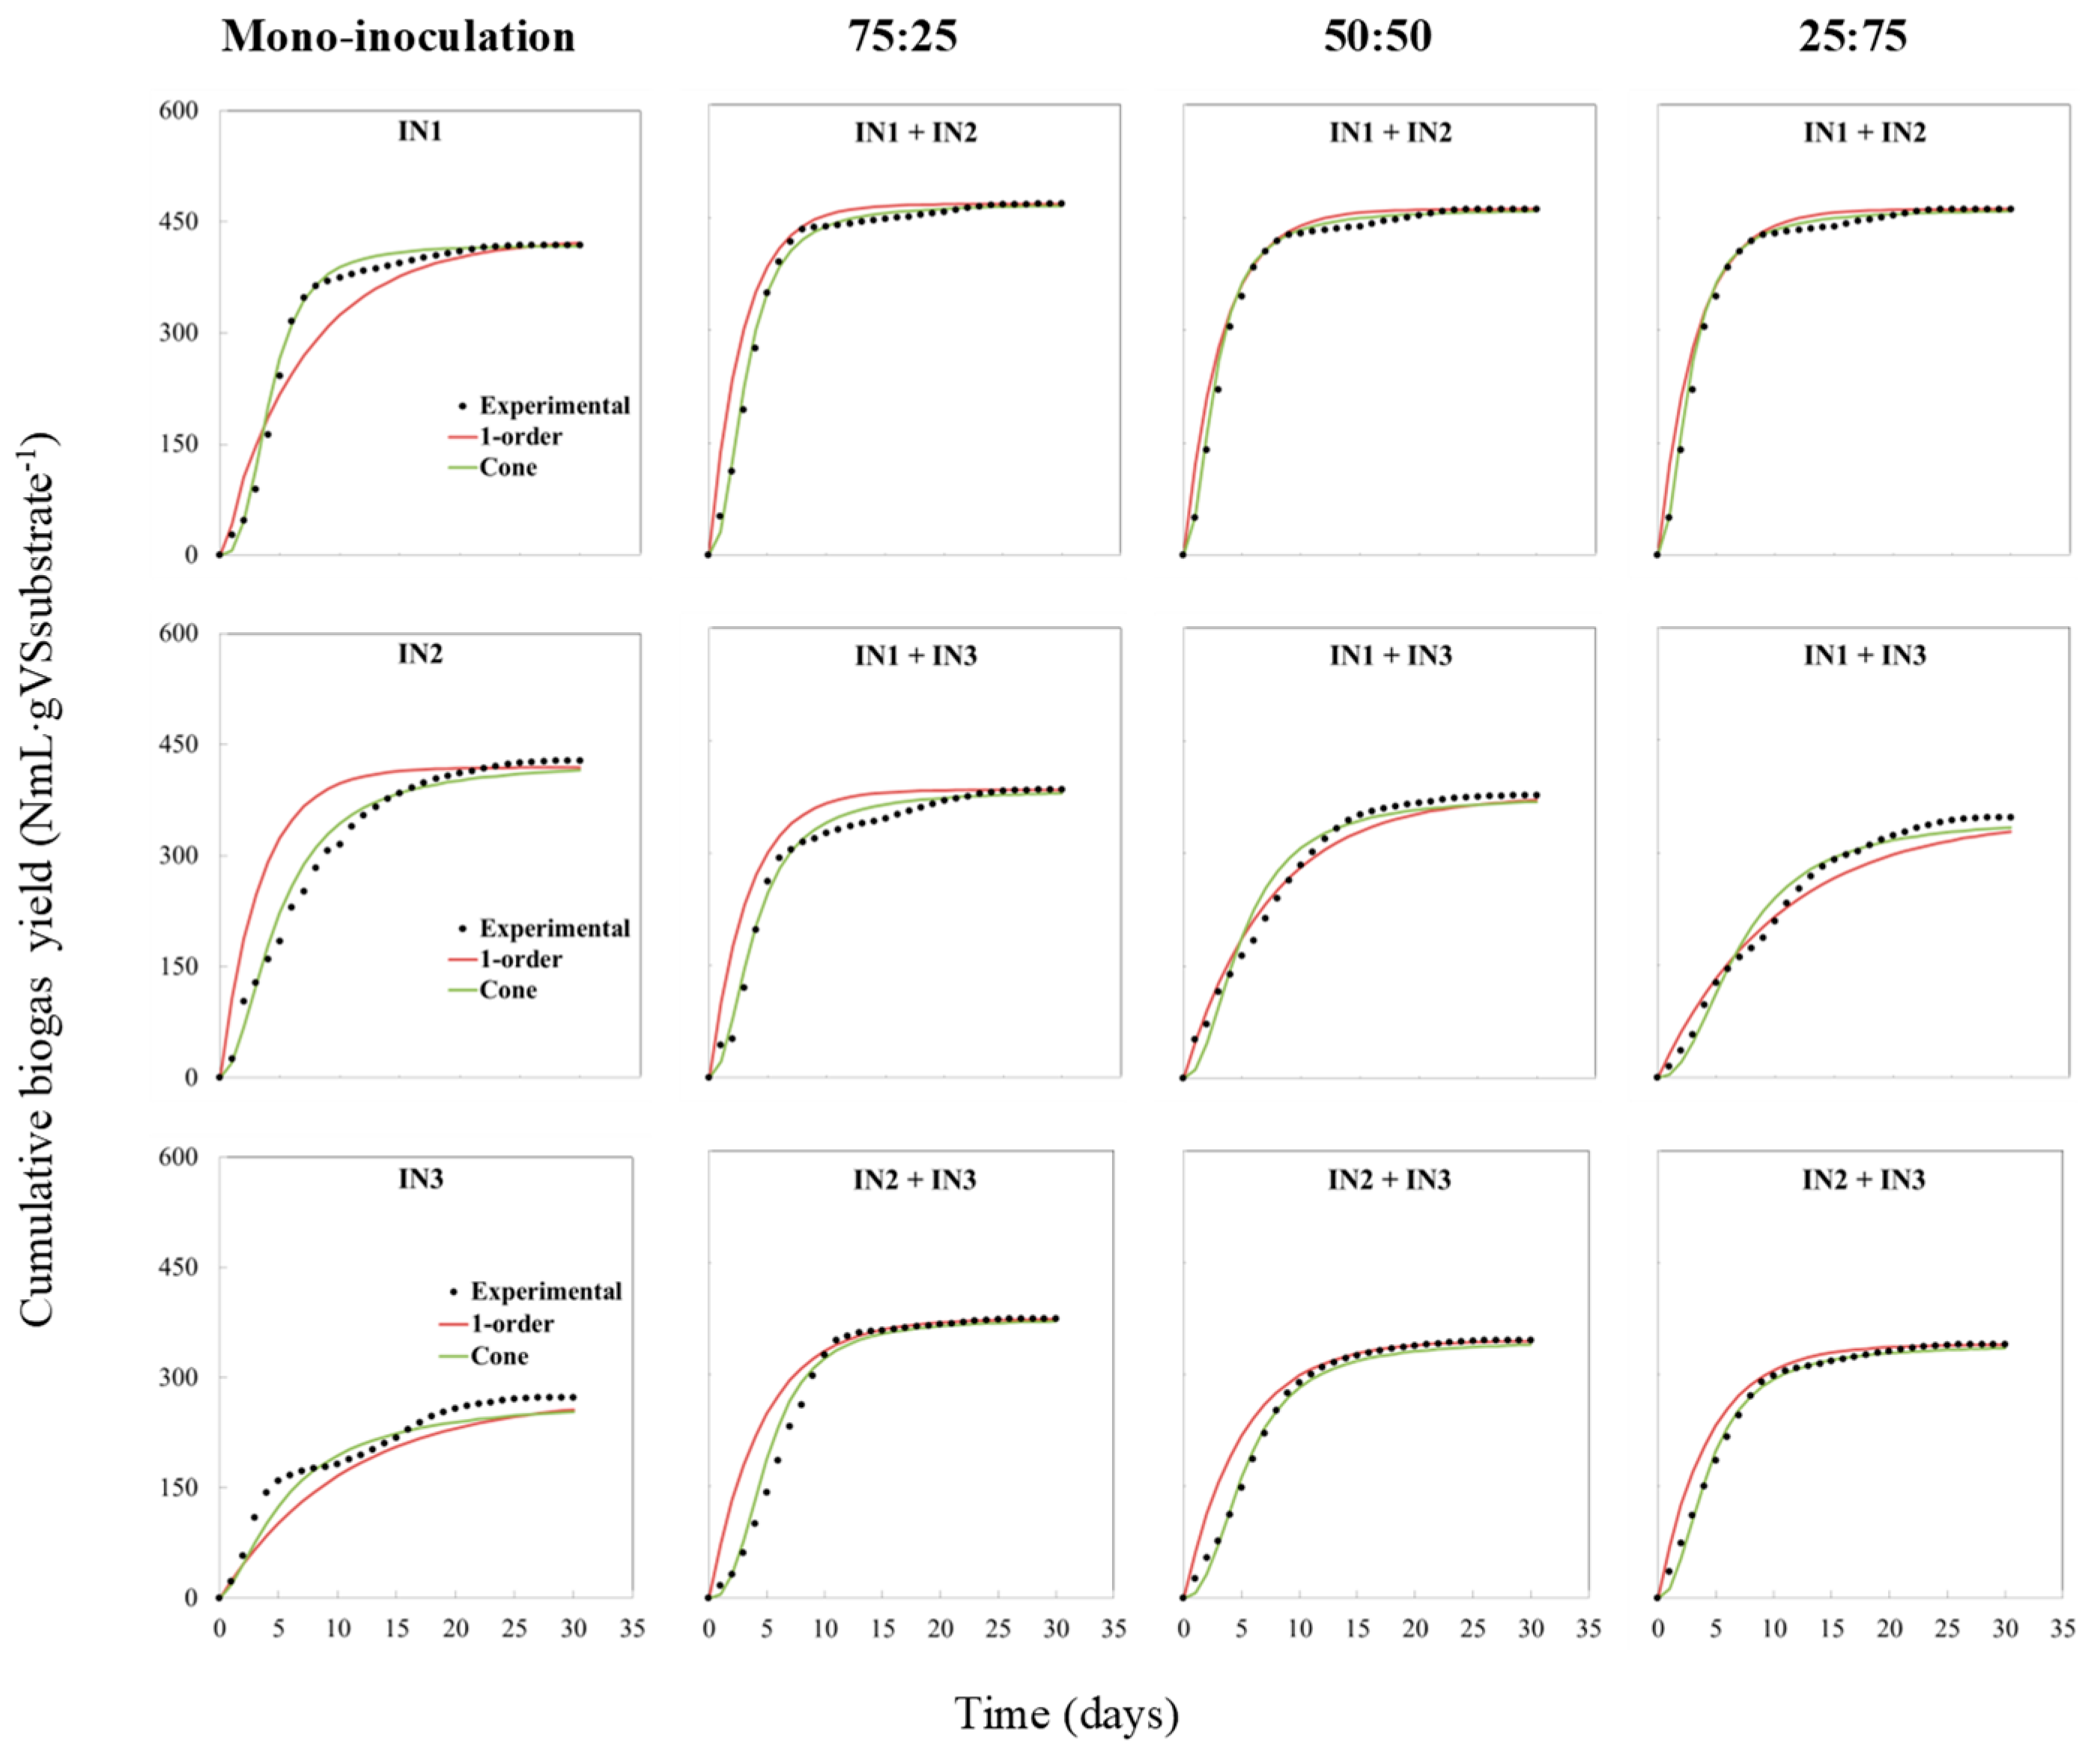
The kinetic parameters obtained by applying the first-order and cone models are summarized in Table 4 that gives a picture of the kinetics. The kinetic constants of each reactor were calculated based on the T80 (time needed for 80% biogas production) of itself. To validate the soundness of the results in the first-order model and cone model, the predicted values of biogas were plotted against the measured values (Figure 6).
The low values of RMSE reflect the models’ high ability to accurately predict the bioactivities. An R-squared value equal to 1 implies that the model provides a perfect prediction, and 0 implies that there is no relationship between the measured and the predicted value.
Based on the above results, the cone model had a better fit with the experimental results, and R6 and R5 showed the highest hydrolysis rate 0.3619 (R2 = 0.9738) and 0.3755 (R2 = 0.9927) in the first-order and cone models, respectively. It is notable that the difference between the measured and the predicted values of both the models was less than 5% for all the reactors.
The constant (K) was derived from the slope of the linear regression line plotted for the accumulated biogas amount against time for the mono-inoculated and co-inoculated digesters. The reaction rate coefficient (k) values were similar to those obtained by treating FSF in an ISR of 2 and at 35 °C [55]. The R1 and R2 inoculated with IN1 and IN2 showed significantly faster hydrolysis degradation, and indicated a positive effect of the combined inoculation on the biogas production. Reactors R4, R5, and R6 produced significantly higher biogas amount (≈469.7 mL∙g VSsubstrate−1) in comparison to R1 and R2 (≈423.3 mL∙g VSsubstrate−1). One possible reason for the improved hydrolysis of the substrate is the synergistic effect of the different microbial species contained in the inoculums, which speed up the degradation of insoluble and complex particles. The fast acidification step should possibly reduce the ammonia inhibition and further enhance the methanogenesis step. Reactors co-inoculated with IN3 followed a lessening trend as the digested cow manure increased. This was expected as the mono-inoculation with the digested cow manure resulted in 273.0 mL∙g VSsubstrate−1, significantly lower (≈35.5%) than the mono-inoculation with the digested MSW or anaerobic sludge (427.6 and 418.9 mL∙g VSsubstrate−1, respectively). Increasing the fraction of the digested cow manure from 25 to 75% resulted in a decrease (≈9.5%) on the biogas yield for R7 to R9 and R10 to R12, possibly due to the poor methanogenesis rate. Although the hydrolysis was slower in co-inoculated R4, R5, and R6, the microbial interactions from the inoculums possibly favored the whole process and yielded a high biogas amount.
4. Conclusions
The PFSF was anaerobically treated in batch mode with different inoculums and their mixtures. The findings from the batch tests revealed that the combined inoculation can enhance the biogas production. Reactors with a mixing ratio 25:75 of the digestate from an anaerobic digester treating anaerobic activated sludge and the digestate from an anaerobic bioreactor treating the organic fraction of municipal solid waste (MSW) showed approximately 18.5% higher biogas yield in comparison to the mono-inoculated reactors. In addition, the kinetic models fitted well with the experimental data and showed that co-inoculation provided a lower hydrolysis rate.
Notwithstanding, the findings call into question if the combined inoculation represents an efficient solution for the anaerobic digestion as the microbiome of each inoculum impacts differently the final biogas yield and composition. Hence, we suggest an investigation of the underlying mechanisms such as the dominant microbiomes in the three inoculations, the synergistic effect between different dominant organisms, and the specificity of the substrate. In addition, financial and ecological evaluation would be interesting in order to assess factors other than the mixing ratio for full-scale applications.
Author Contributions
Writing—original draft, S.A.; Writing—review & editing, G.J.W.E.
Funding
This research received no external funding.
Conflicts of Interest
The authors declare no conflict of interest.
References
- Sahajwalla, V. Green processes: Transforming waste into valuable resources. Engineering 2018, 4, 309–310. [Google Scholar] [CrossRef]
- Lauer, M.; Thrän, D. Flexible biogas in future energy systems—Sleeping beauty for a cheaper power generation. Energies 2018, 11, 761. [Google Scholar] [CrossRef]
- Davis, L.A. The shale oil and gas revolution. Engineering 2018, 4, 438–439. [Google Scholar] [CrossRef]
- Chen, P.; Anderson, E.; Addy, M.; Zhang, R.; Cheng, Y.; Peng, P.; Ma, Y.; Fan, L.; Zhang, Y.; Lu, Q.; et al. Breakthrough technologies for the biorefining of organic solid and liquid wastes. Engineering 2018, 4, 574–580. [Google Scholar] [CrossRef]
- Matsakas, L.; Gao, Q.; Jansson, S.; Rova, U.; Christakopoulos, P. Green conversion of municipal solid wastes into fuels and chemicals. Electron. J. Biotechnol. 2017, 26, 69–83. [Google Scholar] [CrossRef]
- RedCorn, R.; Fatemi, S.; Engelberth, A.S. Comparing end-use potential for industrial food-waste sources. Engineering 2018, 4, 371–380. [Google Scholar] [CrossRef]
- Achinas, S.; Achinas, V.; Euverink, G.J.W. A technological overview of biogas production from biowaste. Engineering 2017, 3, 299–307. [Google Scholar] [CrossRef]
- Solarte-Toro, J.C.; Chacón-Pérez, Y.; Cardona-Alzate, C.A. Evaluation of biogas and syngas as energy vectors for heat and power generation using lignocellulosic biomass as raw material. Electron. J. Biotechnol. 2018, 33, 52–62. [Google Scholar] [CrossRef]
- Wang, J.; Wang, H.; Fan, Y. Techno-economic challenges of fuel cell commercialization. Engineering 2018, 4, 352–360. [Google Scholar] [CrossRef]
- Macedonio, F.; Drioli, E. Membrane engineering for green process engineering. Engineering 2017, 3, 290–298. [Google Scholar] [CrossRef]
- Achinas, S.; Achinas, V. Biogas combustion: An introductory briefing. In Biogas: Production, Applications and Global Developments; Vico, A., Artemio, N., Eds.; Nova Science Publishers, Inc.: New York, NY, USA, 2017; pp. 179–193. [Google Scholar]
- Chen, J.F. Green chemical engineering. Engineering 2017, 3, 283–284. [Google Scholar] [CrossRef]
- Wen-Wei, L.; Han-Qing, Y. Advances in energy-producing anaerobic biotechnologies for municipal wastewater treatment. Engineering 2016, 2, 438–446. [Google Scholar]
- Chen, J.F. Green chemical engineering for a better life. Engineering 2017, 3, 279. [Google Scholar] [CrossRef]
- Nelson, M.J.; Nakhla, G.; Zhu, J. Fluidized-bed bioreactor applications for biological wastewater treatment: A review of research and developments. Engineering 2017, 3, 330–342. [Google Scholar] [CrossRef]
- Esposito, G.; Frunzo, L.; Panico, A.; Pirozzi, F. Enhanced bio-methane production from co-digestion of different organic wastes. Environ. Technol. 2012, 33, 2733–2740. [Google Scholar] [CrossRef] [PubMed]
- Boonpiyo, S.; Sittijunda, S.; Reungsang, A. Co-digestion of napier grass with food waste and napier silage with food waste for methane production. Energies 2018, 11, 3200. [Google Scholar] [CrossRef]
- De Souza Guimarães, C.; da Silva Maia, D.R.; Gonçalves Serra, E. Construction of biodigesters to optimize the production of biogas from anaerobic co-digestion of food waste and sewage. Energies 2018, 11, 870. [Google Scholar] [CrossRef]
- EPA. Increasing Anaerobic Digester Performance with Codigestion. 2012. Available online: https://www.epa.gov/agstar (accessed on 7 September 2018).
- Cheng, L.; Charles, W.; Cord-Ruwisch, R. Automatic online buffer capacity (alkalinity) measurement of wastewater using an electrochemical cell. Environ. Technol. 2016, 37, 2467–2472. [Google Scholar] [CrossRef]
- Wagner, A.O.; Lackner, N.; Mutschlechner, M.; Prem, E.M.; Markt, R.; Illmer, P. Biological pretreatment strategies for second-generation lignocellulosic resources to enhance biogas production. Energies 2018, 11, 1797. [Google Scholar] [CrossRef]
- Chiumenti, A.; Boscaro, D.; da Borso, F.; Sartori, L.; Pezzuolo, A. Biogas from fresh spring and summer grass: Effect of the harvesting period. Energies 2018, 11, 1466. [Google Scholar] [CrossRef]
- Achinas, S.; Euverink, G.J.W. Consolidated briefing of biochemical ethanol production from lignocellulosic biomass. Electron. J. Biotechnol. 2016, 23, 44–53. [Google Scholar] [CrossRef] [Green Version]
- Pellera, F.M.; Gidarakos, E. Effect of the substrate to inoculum ratio and inoculum type on the biochemical methane potential of solid agroindustrial waste. J. Environ. Chem. Eng. 2016, 4, 3217–4229. [Google Scholar] [CrossRef]
- Gao, Y.; Kong, X.; Xing, T.; Sun, Y.; Zhang, Y.; Luo, X.; Sun, Y. Digestion performance and microbial metabolic mechanism in thermophilic and mesophilic anaerobic digesters exposed to elevated loadings of organic fraction of municipal solid waste. Energies 2018, 11, 952. [Google Scholar] [CrossRef]
- Demirel, B.; Scherer, P. Trace element requirements of agricultural biogas digesters during biological conversion of renewable biomass to methane. Biomass Bioenerg. 2011, 35, 992–998. [Google Scholar] [CrossRef]
- Nallathambi Gunaseelan, V. Effect of inoculum/substrate ratio and pretreatments on methane yield from Parthenium. Biomass Bioenerg. 1995, 8, 39–44. [Google Scholar] [CrossRef]
- Kasprzycka, A.; Kuna, J. Methodical aspects of biogas production in small-volume bioreactors in laboratory investigations. Energies 2018, 11, 1378. [Google Scholar] [CrossRef]
- Fabbri, A.; Serranti, S.; Bonifazi, G. Biochemical methane potential (BMP) of artichoke waste: The inoculum effect. Waste Manag. Res. 2014, 32, 207–214. [Google Scholar] [CrossRef]
- Eaton, A.D.; American Public Health Association; American Water Works Association; Water Environment Federation. Standard Methods for the Examination of Water and Wastewater; APHA-AWWA-WEF: Washington, DC, USA, 2005. [Google Scholar]
- Lossie, U.; Pütz, P. Targeted Control of Biogas Plants with the Help of FOS/TAC. Pract. Rep. Hach Lange 2008. Available online: file:///D:/Downloads/14785938_DOC042.52.20011.Mar08.web.pdf (accessed on 24 October 2018).
- Palmowski, L.M.; Müller, J.A. Influence of the size reduction of organic waste on their anaerobic digestion. Water Sci. Technol. 2000, 41, 155–162. [Google Scholar] [CrossRef]
- VDI 4630, 2006. Fermentation of Organic Materials, Characterisation of Substrate, Sampling, Collection of Material Data, Fermentation Tests. Available online: https://standards.globalspec.com/std/10052171/vdi-4630 (accessed on 26 October 2018).
- Water Research Centre. Equipment for Measurement of Gas Production at Low Rates of Flow—Technical Memorandum TM104; Water Research Centre: Medmenham, UK, 1975. [Google Scholar]
- Dinuccio, E.; Balsari, P.; Gioelli, F.; Menardo, S. Evaluation of the biogas productivity potential of some Italian agro-industrial biomasses. Bioresour. Technol. 2010, 101, 3780–3783. [Google Scholar] [CrossRef]
- Buck, A.L. New equations for computing vapor pressure and enhancement factor. J. Appl. Meteorol. 1981, 20, 1527–1532. [Google Scholar] [CrossRef]
- Luna-del Risco, M.; Normak, A.; Orupõld, K. Biochemical methane potential of different organic wastes and energy crops from Estonia. Agron. Res. 2011, 9, 331–342. [Google Scholar]
- Lay, J.; Li, Y.; Noike, T. Interaction between homoacetogens and methanogens in lake sediments. J. Ferment. Bioeng. 1998, 86, 467–471. [Google Scholar] [CrossRef]
- Bhattarai, S.; Oh, J.H.; Euh, S.H.; Kafle, G.K.; Kim, D.H. Simulation and model validation of sheet and tube type photovoltaic thermal solar system and conventional solar collecting system in transient states. Sol. Energy Mater. Sol. C 2012, 103, 184–193. [Google Scholar] [CrossRef]
- Ghasimi, D.S.M.; Zandvoort, M.H.; Adriaanse, M.; van Lier, J.B.; de Kreuk, M. Comparative analysis of the digestibility of sewage fine sieved fraction and hygiene paper produced from virgin fibers and recycled fibers. Waste Manag. 2016, 53, 156–164. [Google Scholar] [CrossRef]
- De Vrieze, J.; Gildemyn, S.; Vilchez-Vargas, R.; Jáuregui, R.; Pieper, D.H.; Verstraete, W.; Boon, N. Inoculum selection is crucial to ensure operational stability in anaerobic digestion. Appl. Microbiol. Biotechnol. 2015, 99, 189–199. [Google Scholar] [CrossRef]
- Elbeshbishy, E.; Nakhla, G.; Hafez, H. Biochemical methane potential (BMP) of food waste and primary sludge: Influence of inoculum pre-incubation and inoculum source. Bioresour. Technol. 2012, 110, 18–25. [Google Scholar] [CrossRef]
- Ranieri, L.; Mossa, G.; Pellegrino, R.; Digiesi, S. Energy recovery from the organic fraction of Municipal Solid Waste: A real options-based facility assessment. Sustainability 2018, 10, 368. [Google Scholar] [CrossRef]
- Turovskiy, I.S.; Mathai, P.K. Wastewater Sludge Processing; Wiley: New York, NY, USA, 2006. [Google Scholar]
- Carotenuto, C.; Guarino, G.; Mario Minale, M. Temperature and pH effect on methane production from buffalo manure anaerobic digestion. Int. J. Heat Technol. 2016, 34, 425–429. [Google Scholar] [CrossRef]
- Franchi, O.; Rosenkranz, F.; Chamy, R. Key microbial populations involved in anaerobic degradation of phenol and p-cresol using different inocula. Electron. J. Biotechnol. 2018, 35, 33–38. [Google Scholar] [CrossRef]
- Świątek, M.; Lewicki, A.; Szymanowska, D.; Kubiak, P. The effect of introduction of chicken manure on the biodiversity and performance of an anaerobic digester. Electron. J. Biotechnol. 2018, in press. [Google Scholar] [CrossRef]
- Anggarini, S.; Hidayat, N.; Sunyoto, N.M.S.; Wulandari, P.S. Optimization of hydraulic retention time (HRT) and inoculums addition in wastewater treatment using anaerobic digestion system. Agric. Agric. Sci. Prog. 2015, 3, 95–101. [Google Scholar] [CrossRef]
- Silva, A.J.; Pozzi, E.; Foresti, E.; Zaiat, M. The influence of the buffering capacity on the production of organic acids and alcohols from wastewater in anaerobic reactor. Appl. Biochem. Biotechnol. 2015, 175, 2258–2265. [Google Scholar] [CrossRef] [PubMed]
- Triet, N.M.; Khang, D.N.; Preston, T.R. Improving the buffering capacity of biodigesters charged with cassava waste-water. Livest. Res. Rural Dev. 2017, 29. Available online: http://www.lrrd.org/lrrd29/2/trie29037.html (accessed on 26 October 2018).
- Gray, M.C.; Converse, A.O.; Wyman, C.E. Sugar Monomer and oligomer solubility: Data and predictions for application to biomass hydrolysis. Appl. Biochem. Biotechnol. 2003, 105–108, 179–193. [Google Scholar] [CrossRef]
- Liu, T.; Sun, L.; Müller, B.; Schnürer, A. Importance of inoculum source and initial community structure for biogas production from agricultural substrates. Bioresour. Technol. 2017, 245, 768–777. [Google Scholar] [CrossRef] [PubMed]
- Pommier, S.; Llamas, A.M.; Lefebvre, X. Analysis of the outcome of shredding pretreatment on the anaerobic biodegradability of paper and cardboard materials. Bioresour. Technol. 2010, 101, 463–468. [Google Scholar] [CrossRef] [PubMed]
- Achinas, S.; Li, Y.; Achinas, V.; Euverink, G.J.W. Influence of sheep manure addition on biogas potential and methanogenic communities during cow dung digestion under mesophilic conditions. Sustain. Environ. Res. 2018, 28, 240–246. [Google Scholar] [CrossRef]
- Ghasimi, D.S.M.; de Kreuk, M.; Maeng, S.K.; Zandvoort, M.H.; van Lier, J.B. High-rate thermophilic bio-methanation of the fine sieved fraction from Dutch municipal raw sewage: Cost-effective potentials for on-site energy recovery. Appl. Energy 2016, 165, 569–582. [Google Scholar] [CrossRef] [Green Version]
Figure 1.
The daily biogas production for pressed fine sieved fraction (PFSF) inoculated with three different inoculums and their mixtures (IN1, digestate from the reactor treating the activated sludge; IN2, digestate from the reactor treating the organic fraction of MSW; and IN3, digested cow manure).
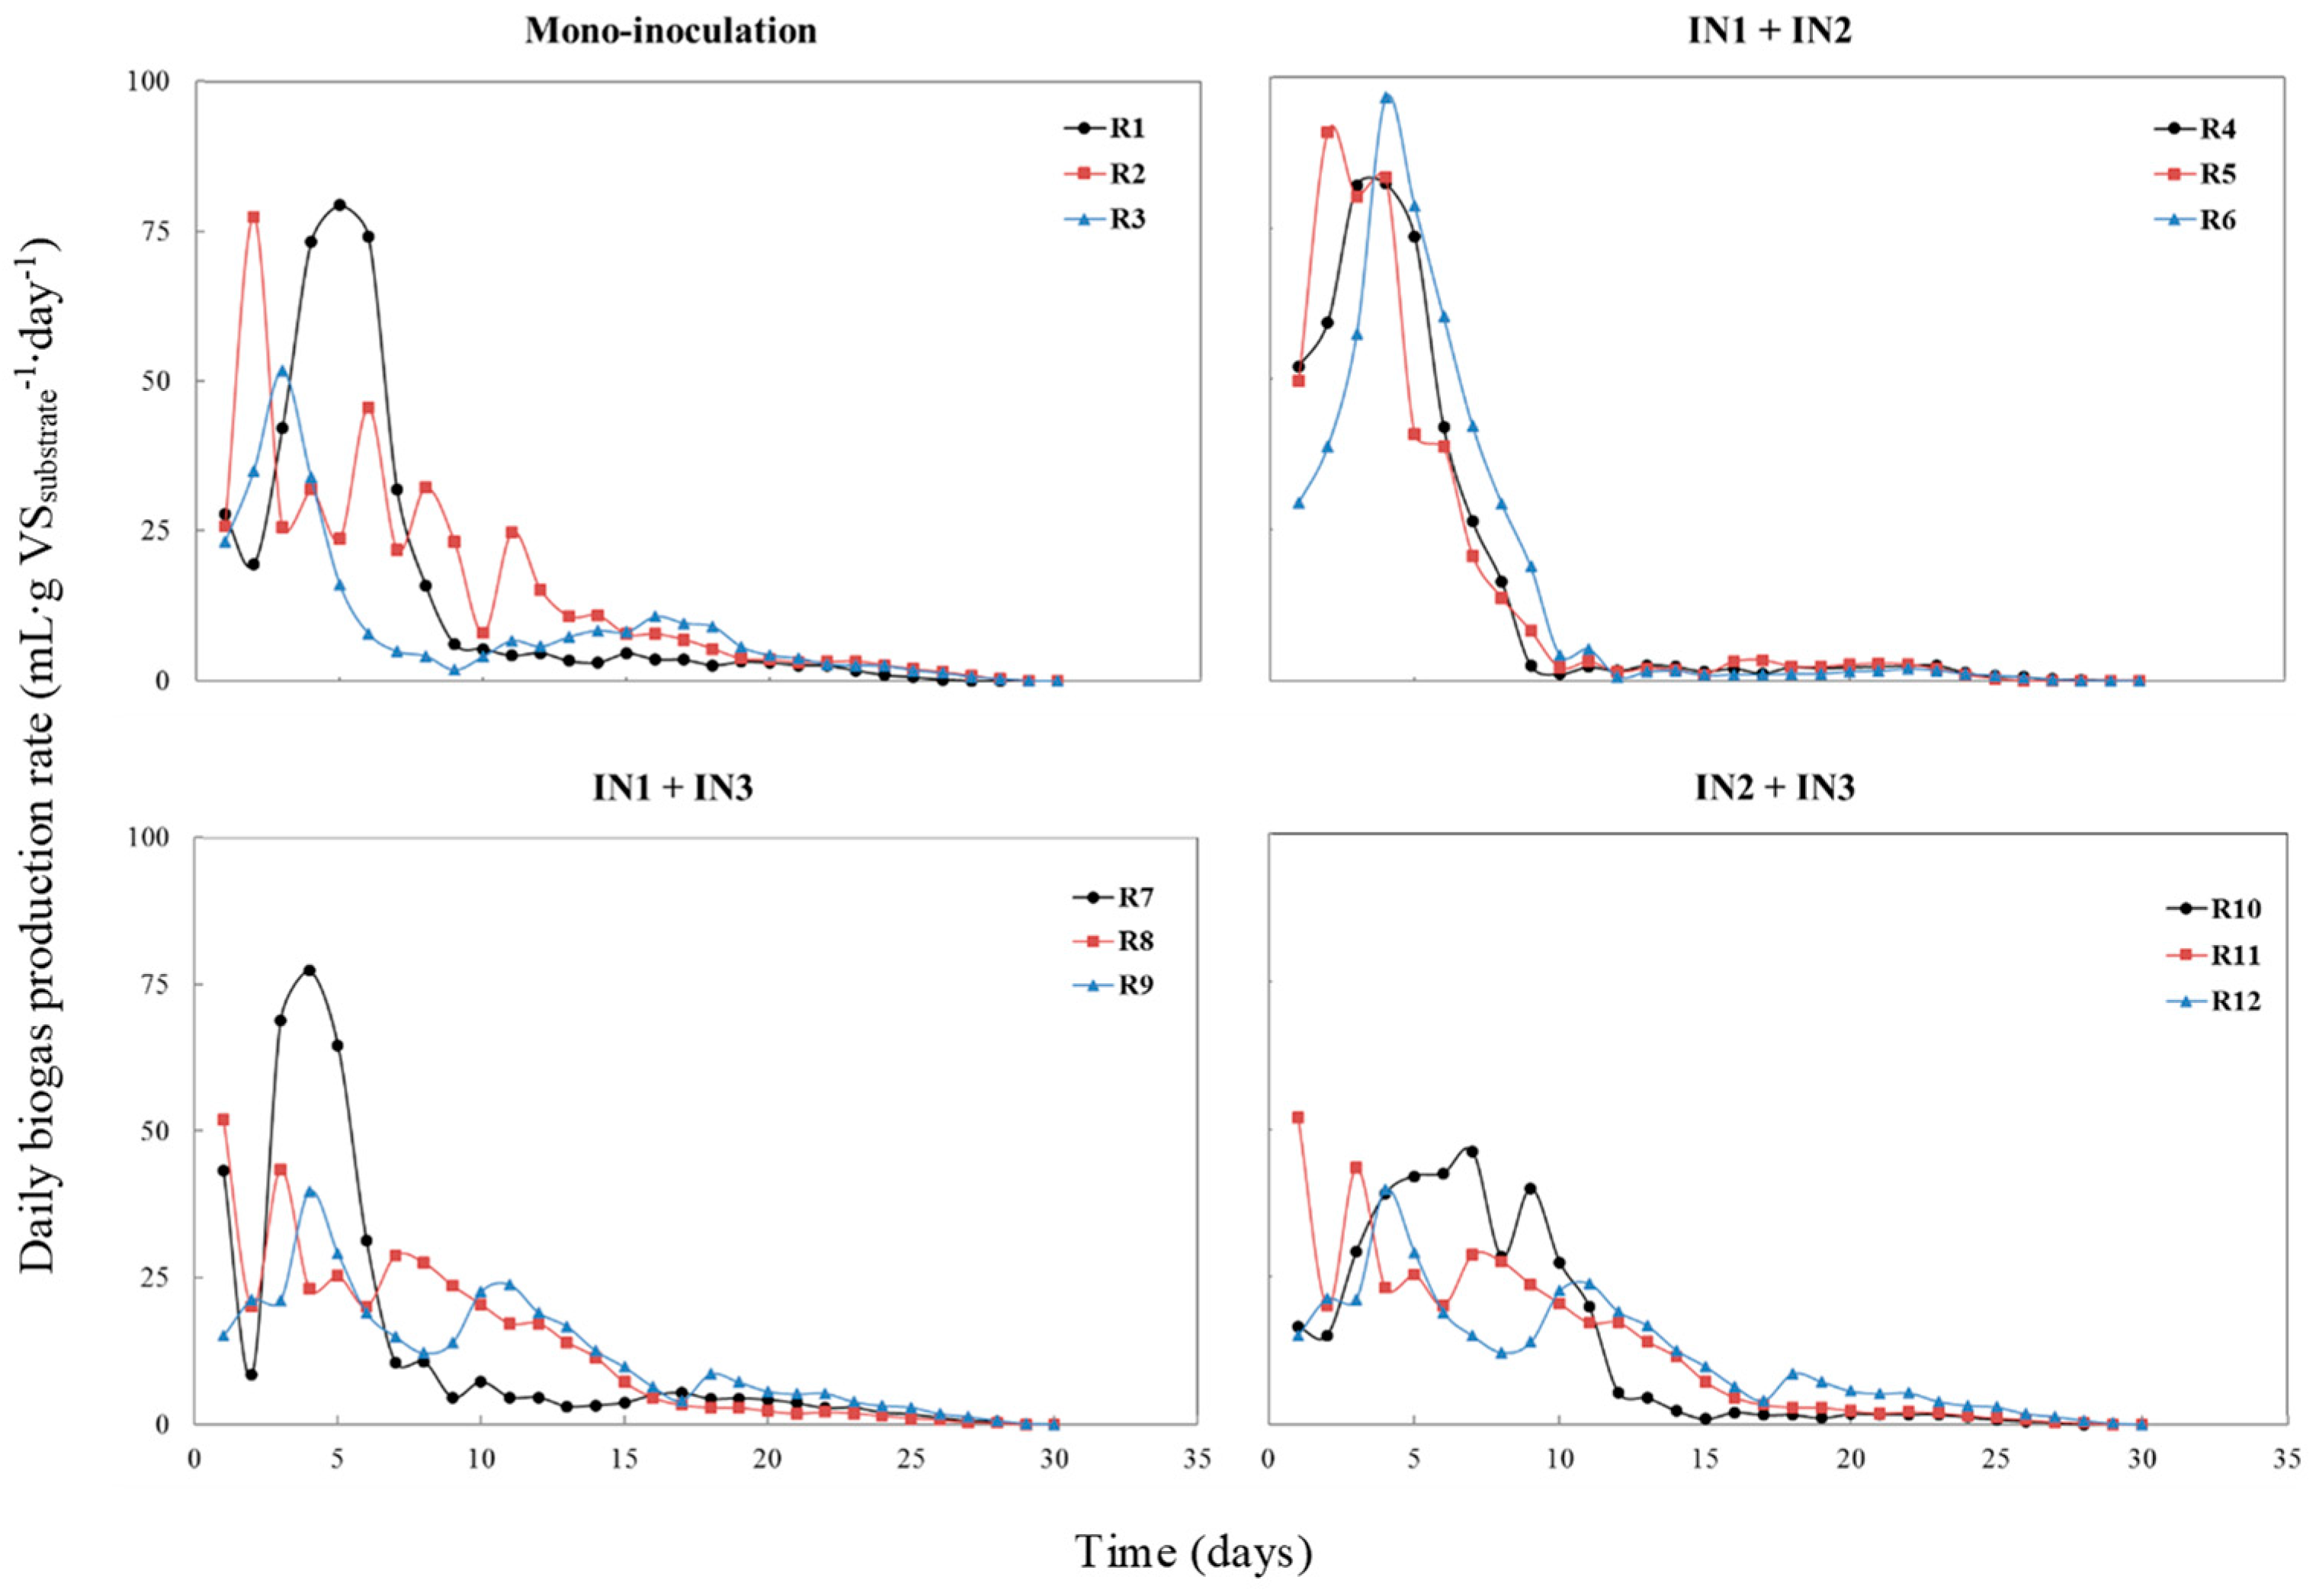
Figure 2.
The cumulative biogas production for PFSF inoculated with three different inoculums and their mixtures (IN1, digestate from the reactor treating the activated sludge; IN2, digestate from the reactor treating the organic fraction of MSW; and IN3, digested cow manure).
Figure 2.
The cumulative biogas production for PFSF inoculated with three different inoculums and their mixtures (IN1, digestate from the reactor treating the activated sludge; IN2, digestate from the reactor treating the organic fraction of MSW; and IN3, digested cow manure).

Figure 3.
The pH value for reactors treating PFSF inoculated with three different inoculums and their mixtures.
Figure 3.
The pH value for reactors treating PFSF inoculated with three different inoculums and their mixtures.

Figure 4.
Alkalinity for reactors treating PFSF inoculated with three different inoculums and their mixtures.
Figure 4.
Alkalinity for reactors treating PFSF inoculated with three different inoculums and their mixtures.

Figure 5.
Correlation of biogas produced per g VS and percentage of VS removal for all the experiments.
Figure 5.
Correlation of biogas produced per g VS and percentage of VS removal for all the experiments.

Figure 6.
Plots of the measured and the predicted biogas yields from the reactors treating PFSF inoculated with three different inoculums and their mixtures (IN1, digestate from the reactor treating the activated sludge; IN2, digestate from the reactor treating the organic fraction of MSW; and IN3, digested cow manure).

Table 1.
Characteristics of the inoculums and substrate used in the batch tests.
| Parameter | Unit | IN1 | IN2 | IN3 | PFSF |
|---|---|---|---|---|---|
| pH | – | 7.56 | 7.21 | 6.72 | ND |
| TS | g∙kg−1 | 48.2 (1.1) | 117.7 (1.3) | 82.6 (1.9) | 193.2 (9.5) |
| VS | g∙kg−1 | 30.2 (0.8) | 64.8 (1.6) | 61.3 (1.3) | 174.8 (8.8) |
| VS/TS | – | 0.63 | 0.55 | 0.74 | 0.91 |
| COD | g∙kg−1 | 47.2 (1.7) | 83.9 (4.3) | 82.4 (5.2) | ND |
| VS/COD | – | 0.64 | 0.77 | 0.74 | ND |
IN1, digestate from the reactor treating activated sludge; IN2, digestate from the reactor treating organic fraction of municipal solid waste (MSW); IN3, digested cow manure; and ND, not determined. The values are the average of the three determinations. The values in parentheses denote the standard deviation.
Table 2.
Process conditions applied in the batch tests.
| Reactors | IN1 | IN2 | IN3 | Organic load | ISR | Temperature (°C) | Replicates |
|---|---|---|---|---|---|---|---|
| R1 | 100 | 0 | 0 | 12 | 2 | 36 | 3 |
| R2 | 0 | 100 | 0 | 12 | 2 | 36 | 3 |
| R3 | 0 | 0 | 100 | 12 | 2 | 36 | 3 |
| R4 | 75 | 25 | 0 | 12 | 2 | 36 | 3 |
| R5 | 50 | 50 | 0 | 12 | 2 | 36 | 3 |
| R6 | 25 | 75 | 0 | 12 | 2 | 36 | 3 |
| R7 | 75 | 0 | 25 | 12 | 2 | 36 | 3 |
| R8 | 50 | 0 | 50 | 12 | 2 | 36 | 3 |
| R9 | 25 | 0 | 75 | 12 | 2 | 36 | 3 |
| R10 | 0 | 75 | 25 | 12 | 2 | 36 | 3 |
| R11 | 0 | 50 | 50 | 12 | 2 | 36 | 3 |
| R12 | 0 | 25 | 75 | 12 | 2 | 36 | 3 |
IN1, digestate from the reactor treating the activated sludge; IN2, digestate from the reactor treating the organic fraction of MSW; IN3, digested cow manure; and ND, not determined.
Table 3.
Biogas yield, volatile solids (VS) removal, and technical digestion time for all the reactors.
Table 3.
Biogas yield, volatile solids (VS) removal, and technical digestion time for all the reactors.
| Reactor | Biogas Yield (mL∙g VSadded−1) | VS Removal (%) | T80 (day) |
|---|---|---|---|
| R1 | 418.9 (26.4) | 41.7 (3.9) | 7 |
| R2 | 427.6 (19.7) | 43.5 (2.6) | 12 |
| R3 | 273.0 (12.9) | 30.8 (2.8) | 15 |
| R4 | 468.2 (24.6) | 45.4 (4.1) | 6 |
| R5 | 461.3 (26.8) | 44.0 (3.9) | 6 |
| R6 | 479.7 (27.0) | 48.2 (4.6) | 8 |
| R7 | 384.6 (17.2) | 36.1 (2.5) | 8 |
| R8 | 377.1 (16.8) | 35.6 (3.0) | 12 |
| R9 | 347.2 (16.3) | 31.9 (2.7) | 14 |
| R10 | 374.8 (18.4) | 37.5 (3.4) | 9 |
| R11 | 345.7 (20.3) | 38.6 (2.9) | 10 |
| R12 | 340.2 (19.5) | 35.3 (3.1) | 8 |
Values are the average of three determinations; the values in parentheses denote the standard deviation.
Table 4.
Results of the study using first-order kinetic and cone models.
| Reactor | First-Order Model | Cone Model | |||||
|---|---|---|---|---|---|---|---|
| K (day−1) | R2 | RMSE | K (day−1) | n | R2 | RMSE | |
| R1 | 0.2967 | 0.9244 | 51.63 | 0.2419 | 2.91 | 0.9959 | 6.9 |
| R2 | 0.1421 | 0.9906 | 12.08 | 0.2094 | 1.911 | 0.981 | 13.91 |
| R3 | 0.0941 | 0.9292 | 27.67 | 0.1804 | 1.54 | 0.9148 | 13.09 |
| R4 | 0.346 | 0.9692 | 38.47 | 0.3213 | 2.312 | 0.9949 | 5.64 |
| R5 | 0.3066 | 0.9858 | 23.45 | 0.3755 | 2.098 | 0.9927 | 6.309 |
| R6 | 0.3619 | 0.9738 | 63.33 | 0.2461 | 2.833 | 0.9961 | 6.687 |
| R7 | 0.2239 | 0.9513 | 42.75 | 0.2651 | 2.114 | 0.9888 | 8.787 |
| R8 | 0.1377 | 0.9797 | 15.30 | 0.2016 | 2.118 | 0.9839 | 10.33 |
| R9 | 0.0969 | 0.9917 | 21.24 | 0.1447 | 2.196 | 0.9837 | 10.84 |
| R10 | 0.2161 | 0.9292 | 47.09 | 0.1992 | 2613 | 0.99 | 10.26 |
| R11 | 0.1992 | 0.9555 | 30.21 | 0.1891 | 2.348 | 0.9895 | 9.717 |
| R12 | 0.2294 | 0.9838 | 22.88 | 0.2315 | 2.194 | 0.9933 | 5.563 |
© 2019 by the authors. Licensee MDPI, Basel, Switzerland. This article is an open access article distributed under the terms and conditions of the Creative Commons Attribution (CC BY) license (http://creativecommons.org/licenses/by/4.0/).
Share and Cite
MDPI and ACS Style
Achinas, S.; Euverink, G.J.W. Effect of Combined Inoculation on Biogas Production from Hardly Degradable Material. Energies 2019, 12, 217. https://doi.org/10.3390/en12020217
AMA Style
Achinas S, Euverink GJW. Effect of Combined Inoculation on Biogas Production from Hardly Degradable Material. Energies. 2019; 12(2):217. https://doi.org/10.3390/en12020217
Chicago/Turabian StyleAchinas, Spyridon, and Gerrit Jan Willem Euverink. 2019. "Effect of Combined Inoculation on Biogas Production from Hardly Degradable Material" Energies 12, no. 2: 217. https://doi.org/10.3390/en12020217
Note that from the first issue of 2016, this journal uses article numbers instead of page numbers. See further details here.