Simulation of the Filling Capability in Vane Pumps


1
Department of Energy, Politecnico di Torino, C.so Duca degli Abruzzi 24, 10129 Turin, Italy
2
Industrial Engineering Department, University of Parma, Parco Area delle Scienze 181/A, 43124 Parma, Italy
*
Author to whom correspondence should be addressed.
Energies 2019, 12(2), 283; https://doi.org/10.3390/en12020283
Submission received: 4 December 2018
/
Revised: 2 January 2019
/
Accepted: 3 January 2019
/
Published: 17 January 2019
(This article belongs to the Special Issue Energy Efficiency and Controllability of Fluid Power Systems 2018)
Abstract
:In positive displacement pumps, the main volumetric loss at high speed is due to the incomplete filling of the variable volume chambers. The prediction of the limit speed and of the maximum flow rate delivered by a pump can be obtained only through Computational Fluid Dynamics (CFD) simulations, since the shape, the orientation, and the movement of the chambers with respect to the inlet volume must be considered, along with the non-uniform distribution of the gaseous phase, due to the dissolved air release. In this paper, the influence of different geometric parameters on the filling of a vane pump has been investigated through the commercial software PumpLinx®. At first, a model of a reference pump has been created and validated with different configurations of the suction flow area, then a simplified model has been used for assessing the influence of the geometry of the rotating assembly. It was found that a pump with a low ratio between the axial thickness and the diameter has a higher volumetric efficiency if the chambers are fed from one side only. Opposite behaviors were found in the case of pumps with small diameters and high thicknesses. Moreover, the filling could be improved by increasing the number of chambers, and by reducing the diameter of the rotor, even only locally.
1. Introduction
The simulation of a positive displacement pump can be performed by the means of two approaches, with different levels of detail and computer resources. The lumped parameter (zero-dimensional) modelling represents the best compromise between accuracy and computational time. The methodology assumes that in the variable chambers the fluid properties, typically the pressure, but also the percentage of gaseous fraction, have a homogeneous distribution. The modelling is grounded only on the knowledge of the histories of some geometric quantities, such as the volume and the flow area of the chambers [1,2]. However, the specific shape and the spatial orientation of the chambers with respect to the inlet and outlet ducts cannot be considered. On the contrary, the three-dimensional Computational Fluid Dynamics (CFD) simulation allows for the consideration of local phenomena, and the relative spatial orientation of the volumes, but with very high computational resources.
There are very recent examples of comparisons between 0D and 3D models of positive displacement machines. Pellegri et al. [3] studied a gerotor pump with PumpLinx (3D), and with a customized model developed in the Amesim environment (0D). A similar analysis has been carried out by Zhao et al. [4] for a helical external gear pump. In both cases, overall, the results coming from the two different approaches showed a good agreement, even if each methodology was more suitable for some specific analyses. A comparison between a CFD simulation with PumpLinx and a 0D model with Amesim of an axial piston pump can be found in [5]. In this last case, since the pump was tested in non-critical conditions, the differences between the outcomes of the two methodologies were very small, leading to the conclusion that the 0D approach is more than enough.
The volumetric efficiency, defined as the ratio between the measured and the theoretical flow rate, is one of the fundamental parameters used for defining the performance of a pump. It is influenced mainly by the fluid leakages in the lubricating interfaces. Usually the leakages are simulated in 0D as equivalent rectangular gaps. However, when the geometry of the passageways is very complex, a 2D CFD simulation for the evaluation of the pressure distribution in the gaps, and consequently of the leakage flow, is more accurate [6].
The incomplete filling of the variable chambers is a phenomenon that affects the volumetric efficiency, only at a high rotational speed or at a low suction pressure [7]. However, when it occurs, the performance of the pump falls dramatically. Usually, the main problem when a pump works in conditions of incomplete filling is not the lack of flow rate itself, but the strong pressure oscillations originated by the back flow in the variable chambers. The intense fluid-born noise also generates a vibration of the pump casing (structure-borne noise) that be clearly identified by means of the techniques used for the fault detection [8]. A specific study on the identification of the conditions of incomplete filling in gerotor pumps, based on acceleration signals, can be found in [9]. It is straightforward that, beside the structural stress, the final effect of the incomplete filling is very high airborne noise.
The capability of a simulation model of predicting the angular speed for which the phenomenon occurs is extremely important; above all, if the model has to be used in the development phase, when experimental data for tuning purposes are not still available. For this task, the 3D approach has proved to be very reliable [10,11,12].
The CFD software PumpLinx was developed specifically for the 3D simulation of pumps. Some recent examples of studies on positive displacement machines can be found in the references [13,14,15].
With specific regard to the incomplete filling, in the reference [16] the influence of the orientation of the suction pipe and of the chambers’ shape in a gerotor pump are analyzed. From this study, it is evident that such types of analysis cannot be carried out with a 0D approach, where the only geometric parameters characterizing a chamber are its volume and the flow area. However, in references [17] and [18], the former on a gerotor, the latter on a vane pump, it is demonstrated that a lumped parameter model can give very good results, if the value of the discharge coefficient to be used in the equation for the evaluation of the flow rate entering the chamber is properly tuned; such an operation can be done by the means of a few CFD simulations.
For a given geometry of the suction pipe, the filling can be improved by reducing the velocity of the fluid, and therefore the pressure drop, at the chambers’ inlet. Hence, the most effective solution is to feed the chambers from both sides (double feeding), by the means of an additional port in the cover, in order to double the flow area [19]. It is well-known that this method is very effective in increasing the angular speed, which corresponds with the commencement of incomplete filling [20].
The flow area can be further increased through the radial feeding of the chambers. In gerotor pumps, it is possible to make a hole in each chamber between two teeth on the outer diameter of the external gear [21]. In vane pumps, quite a large hole or a cutting [22] can be manufactured on the stator. However, at high speeds, the effect of the centrifugal force that tends to move the fluid against the stator track plays an important role in the efficiency of the radial feeding. In fact, the additional flow areas do not always have beneficial effects on the pump filling, since the fluid could find a preferred path for leaving the chamber, as preliminary studies have demonstrated [23].
From the literature review, a systematic analysis of the influence of the geometric parameters on the filling of high-speed vane pumps is not available yet. A study reported in [16] dealt with the position of the inlet pipe, and of the delay of the suction port closing. Although these outcomes can be considered to also be valid for a vane pump, the results obtained by the analysis of the gears’ profiles cannot be extended to a vane pump. In fact, in a gerotor machine, the chambers have a significant radial extension, while in a vane pump, the chambers are located at a constant diameter. Moreover, in gerotor gearing, it is not possible to analyze the influence of the geometric parameters one by one, since the continuity of the profiles must be guaranteed. Finally, in a vane pump, the radial feeding, not analyzed in reference [16], can be implemented by the means of very large flow areas on the stator.
In this context, the aim of the present paper is to analyze the influence on the filling capability of the main geometric parameters of a vane pump, using a reliable and validated CFD code.
The structure of the paper is the following. At first, using as a reference an internal combustion engine lubricating vane pump, different additional flow areas on the stator and on the cover are contrasted in terms of volumetric efficiency at high speed. The experimental facilities for the validation of some simulated configurations are also described. Subsequently, a similar analysis has been performed on a simplified model by modifying different parameters, such as the minimum diameter of the chamber, the number of vanes, and the ratio between the height and the diameter of the rotor. The main findings are that for some specific configurations, the centrifugal force acting on the oil, normally neglected in positive displacement machines, can play an important role. Moreover, some common best practices normally used for designing the pump can yield detrimental effects on the filling, in some cases.
The outcomes from this study can be used by the pump designer as guidelines for maximizing, within the geometric constraints, the filling capability.
2. CFD Model of the Reference Pump
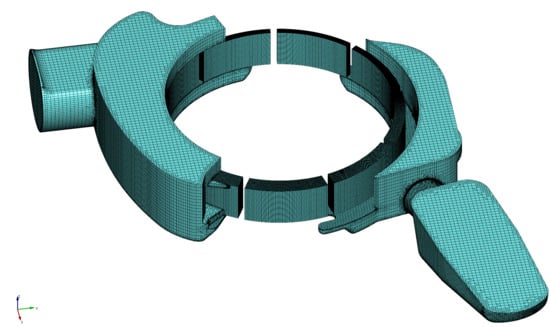
The study was carried out on a 15.4 cc/rev variable displacement pump for engine lubrication, shown in Figure 1a without the cover. The rotor houses nine vanes, and is driven directly by the engine crankshaft. The tips of the vanes are in contact against the stator track, whose center is eccentric with respect to the rotor axis. The eccentricity can be modified due to the linear movement of the stator by means of the delivery pressure acting on one of the two prismatic guides. For the present study, the pump was modelled at fixed positions of the stator; hence, the displacement control was not simulated.
The commercial software PumpLinx was used for performing the 3D simulations. In the CFD environment, the mass and momentum equations are solved by discretizing the computational domain with the finite volume method. The moving chambers are connected to the fixed volumes through Mismatched Grid Interfaces [24]. A specific template for vane pumps was used. In the variable chambers, the cells were anchored to the vanes and to the outer diameter of the rotor, while sliding with respect to the stator. Each chamber was discretized in 720 cells in the tangential direction, 32 in the radial direction, and 16 axially. In order to adjust the grid to the volume variation, the cells were shortened or stretched radially. Since the main leakage passageway was due to the axial clearance between the cover and the rotor [18], a disc of cells made up of three layers (not shown in Figure 1b) was added. The code also allows the consideration of a constant gap on the vane tip. However, in a vane pump, there is normally direct contact between the vanes and the stator [25] and a leakage could occur only in the case of detachment of the vane during the transition between the suction and delivery volumes. Studies performed with a detailed lumped parameter model [26,27] have demonstrated that in this specific type of pump, the detachment can occur only under some operating conditions, and when a vane separates two chambers both connected to the delivery volume, and therefore the leakage flow is negligible. Consequently, in the CFD model, the gap on the vane tip was neglected.
The number of cells of the entire model, about 800,000, was determined through a mesh independence analysis. The fluid model Equilibrium Dissolved Gas was used for simulating the aeration and the cavitation, with a total volume fraction of air equal to 6%. In this way, it was assumed that the oil was partially degassed, due to the passage through the low-pressure volumes in the pump. However, previous studies [18] have shown that very different air contents (from 2% to 9%) yield quite similar results in terms of the maximum oil flow rate simulated in incomplete filling conditions. Moreover, since the aim of the present study is to evaluate the relative influence of some geometric parameters on the maximum flow rate, the trend is not influenced by the fraction of air used [16].
The density of the mixture of oil, air, and gas was evaluated as a function of the equilibrium conditions and of the mass fractions, according to Henry’s law. More details about the model are available in [18], and in the Appendix A.
The simulations were performed at constant eccentricity of the stator. As boundary conditions, a pressure of 0.1 and 0.3 absolute MPa was imposed respectively at the inlet of the suction pipe T and at the outlet port P.
In Figure 2 and Figure 3, the geometric parameters of the stator are indicated. The analyzed configurations are reported in Table 1. In Configuration 1 (original) the cover was flat, and the variable chambers are fed only from the casing side; moreover, a cutting with height h1 = 2 mm was machined on the stator in order to increase the flow area in the passage below the stator itself, and to allow radial feeding into the chambers. In Configurations 2, 3, and 5, an additional milling with height h2 on the opposite side of the stator was also present, to increment the radial flow. In configurations 4 and 5, an additional flow area with height h3 was obtained in the cover to allow for double axial feeding. Finally, in Configuration 6, the chambers were fed only from one side, as in the baseline, but without the cutting with height h1 on the casing side.
The simulations were performed in two different operating conditions: 5200 rpm at partial displacement (55% of the maximum) and 4400 rpm at maximum displacement. Since the pump was simulated at a constant delivery pressure, the leakages were constant; therefore, the variation of the flow rate was only due to the effect of the incomplete filling.
3. Model Validation
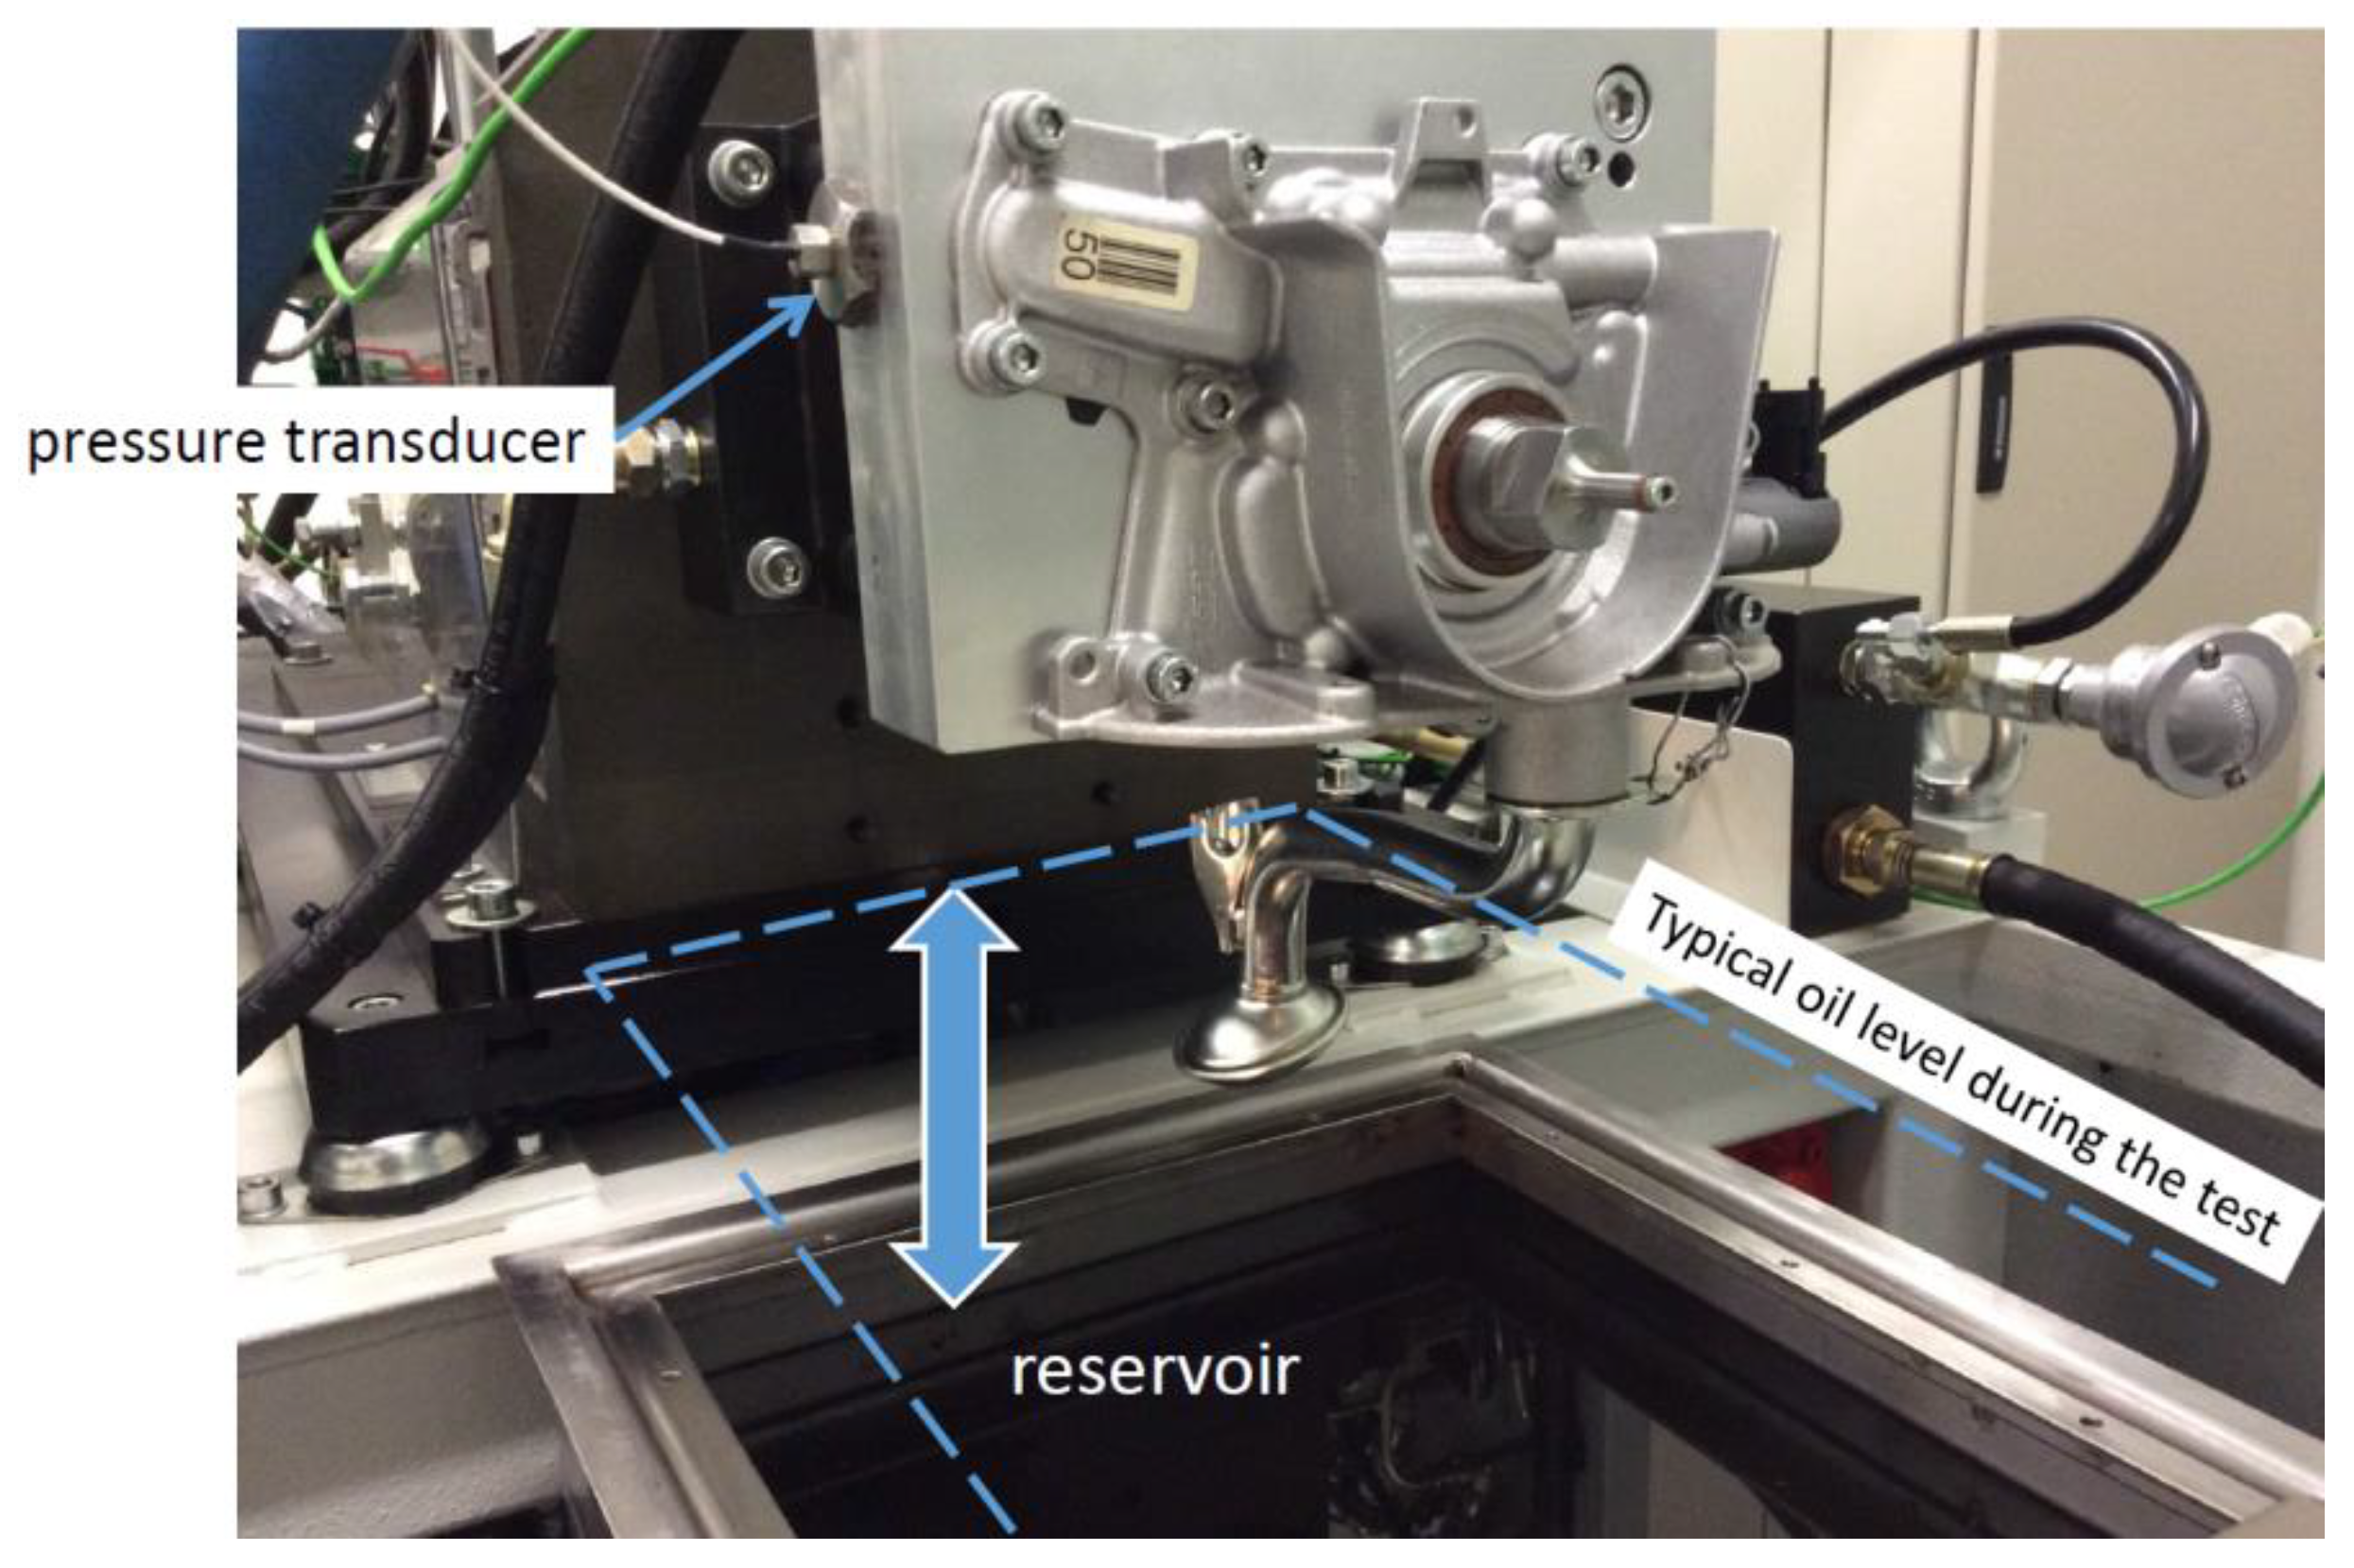
A specific test rig for lubricating pumps, whose scheme is shown in Figure 4, was used for the validation of the CFD model. The pump to be tested, driven by a variable speed electric motor (M1), was mounted on a support block housing the shaft. The speed and the torque were measured by a torque meter (TF), HBM T10F. A proportional throttle valve (E2) was used for generating the load. The valve was controlled in a closed loop by means of a pressure transducer (P1), GS Sensors XPM5 with a measuring range of 0–2 MPa (absolute). The transducer was mounted on the interface plate, and it senses the pressure just outside the delivery port. Thanks to the closed loop control, the valve E2 adjusts its flow area with the aim of maintaining the delivery pressure at the value decided by the operator. The valve E1 remained completely open. The flow rate was measured by a mass flow meter (FM) based on the Coriolis forces, MICROMOTION CMF100M. The fluid was a synthetic base oil Shell Helix Ultra with SAE grade 5W30, density 837 kg/m3, and dynamic viscosity 0.05 at 40 °C. The fluid conditioning system was made up of a constant-speed screw pump (PU), a water-oil heat exchanger (SC), a chiller (CH), two 5 kW electric heating elements (EH), and two filters in parallel. The pump PU sucks the oil from the 30 L reservoir and delivers the fluid to the return line of the main circuit. The temperature in the reservoir is controlled in a closed loop based on the average of the signal of two PT100 resistance temperature detectors (T1 and T2). Due to the thin casing and the inlet pipe walls, the mounting of a pressure transducer for measuring the suction pressure in the pump under test was not possible. However, the same suction pipe has been already used in a different study on an equivalent gerotor lubricating pump; in the [17], the validation of the CFD model of the suction pipe, in terms of pressure drop vs flow rate, can be found. A view of the pump mounted on the test rig is shown in Figure 5. The reservoir could be moved vertically, and during the test, the suction pipe was almost entirely submerged, as indicated in the photo. The position of the pressure transducer for the delivery pressure is also visible.
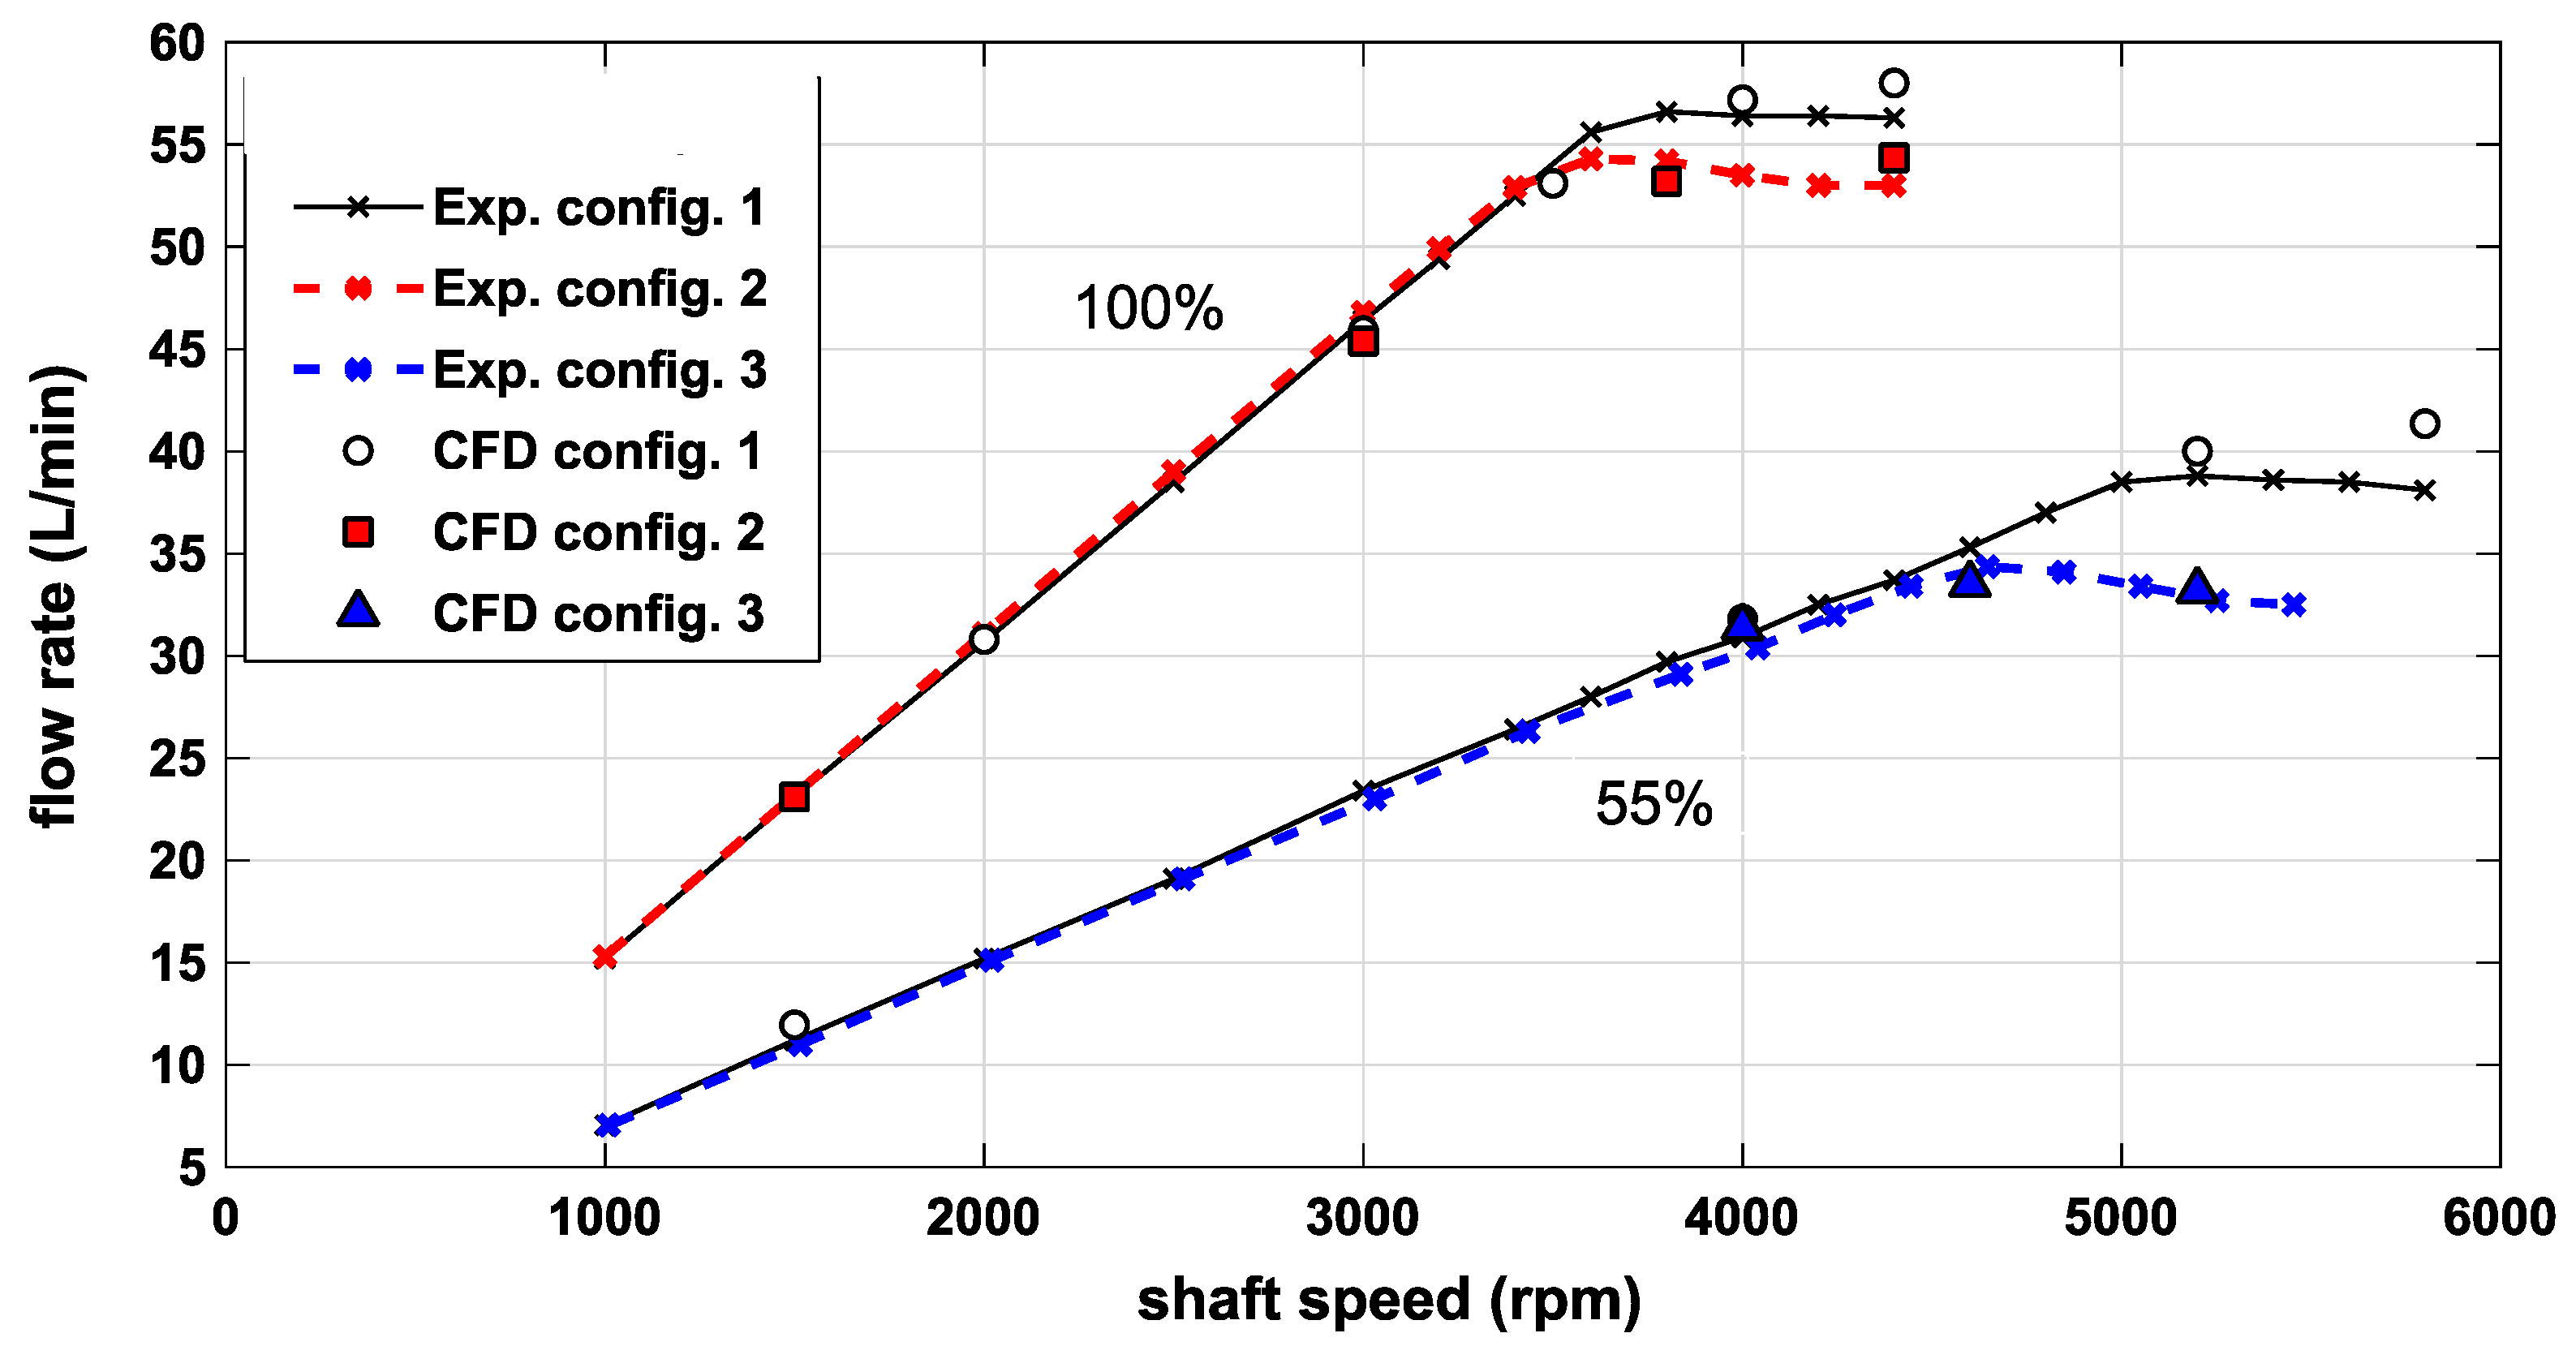
The tests were performed at fixed displacement, at constant absolute delivery pressure of 0.3 MPa and at an oil temperature of 40 °C. The spring of the displacement control was removed, and the stator was mechanically blocked, by means of metal spacers, at maximum eccentricity and at 55% of the maximum. The shaft speed was incremented gradually up to the region of incomplete filling, and the delivery flow rate was measured for each value of angular speed. The original stator (Configuration 1) and the version with the milling with height h1 = 1 mm (Configuration 2) were tested at maximum displacement, while the original configuration was also compared with Configuration 3 (h2 = 2 mm) at partial displacement. The maximum speed was limited to about 1000 rpm above the speed of beginning of the incomplete filling, due to the extremely high-pressure oscillations caused by the intense backflow. For the same reason, the tests were performed at low delivery pressure. The experimental measurements and the CFD simulations (dots) are reported in Figure 6.
In the low–medium speed range, the relationship between the flow rate and the speed is linear, and the slope is given by the pump displacement. In fact, since the tests were executed at a constant pressure, the flow rate differed from the theoretical value only due to the constant fluid leakages. Since the tests were performed at a low delivery pressure, the total leakages, calculated as the difference between the theoretical and the measured flow rates in the speed range 1000–3000 rpm, were only 0.55 L/min. At high speed, a saturation of the flow rate is observed, due to incomplete filling. In this case only a fraction of the chamber volumes was used to deliver the flow rate of liquid, while the remaining part was filled with the gaseous phase, mainly air. As already reported in other studies [18,28], the angular speed for which the curve deviated from the linearity increased with the reduction of the displacement, but the maximum flow rate was lower.
4. Analysis of the Flow Rates and of the Pressure Fields
The simulated volumetric flow rates for the six configurations are listed in Table 2. Configurations 3 and 5, with the worst filling, were simulated only at partial displacement. Overall, it is evident that the increment of the flow area between the rotating chambers and the inlet volume had a detrimental effect on the volumetric efficiency. In particular, by increasing only the height h2 of the milling on the stator (from Configurations 1 to 3, but also 5 with respect to 4) the flow rate decreased significantly. Moreover, only the addition of the passageway in the cover (Configuration 4 with respect to 1) led to a reduction of 2.7 L/min. These results appear to be quite surprising; in fact, the phenomenon of the incomplete filling is generated by the excessive pressure drop between the reservoir and the chambers; hence, the increment of the flow area should lead to an improvement, rather than to a worsening of the behavior. It is worthwhile to notice that there was no difference between Configurations 1 and 6 at 5200 rpm, i.e., the increment of the flow area between the stator and the casing through the milling with height h1 had no effect. However, if the condition of maximum displacement is considered, Configuration 1 gave better results, as expected. Nevertheless, even in this case, a small milling manufactured on the cover side (Configuration 2) nullified the advantage of a larger flow area at the casing side.
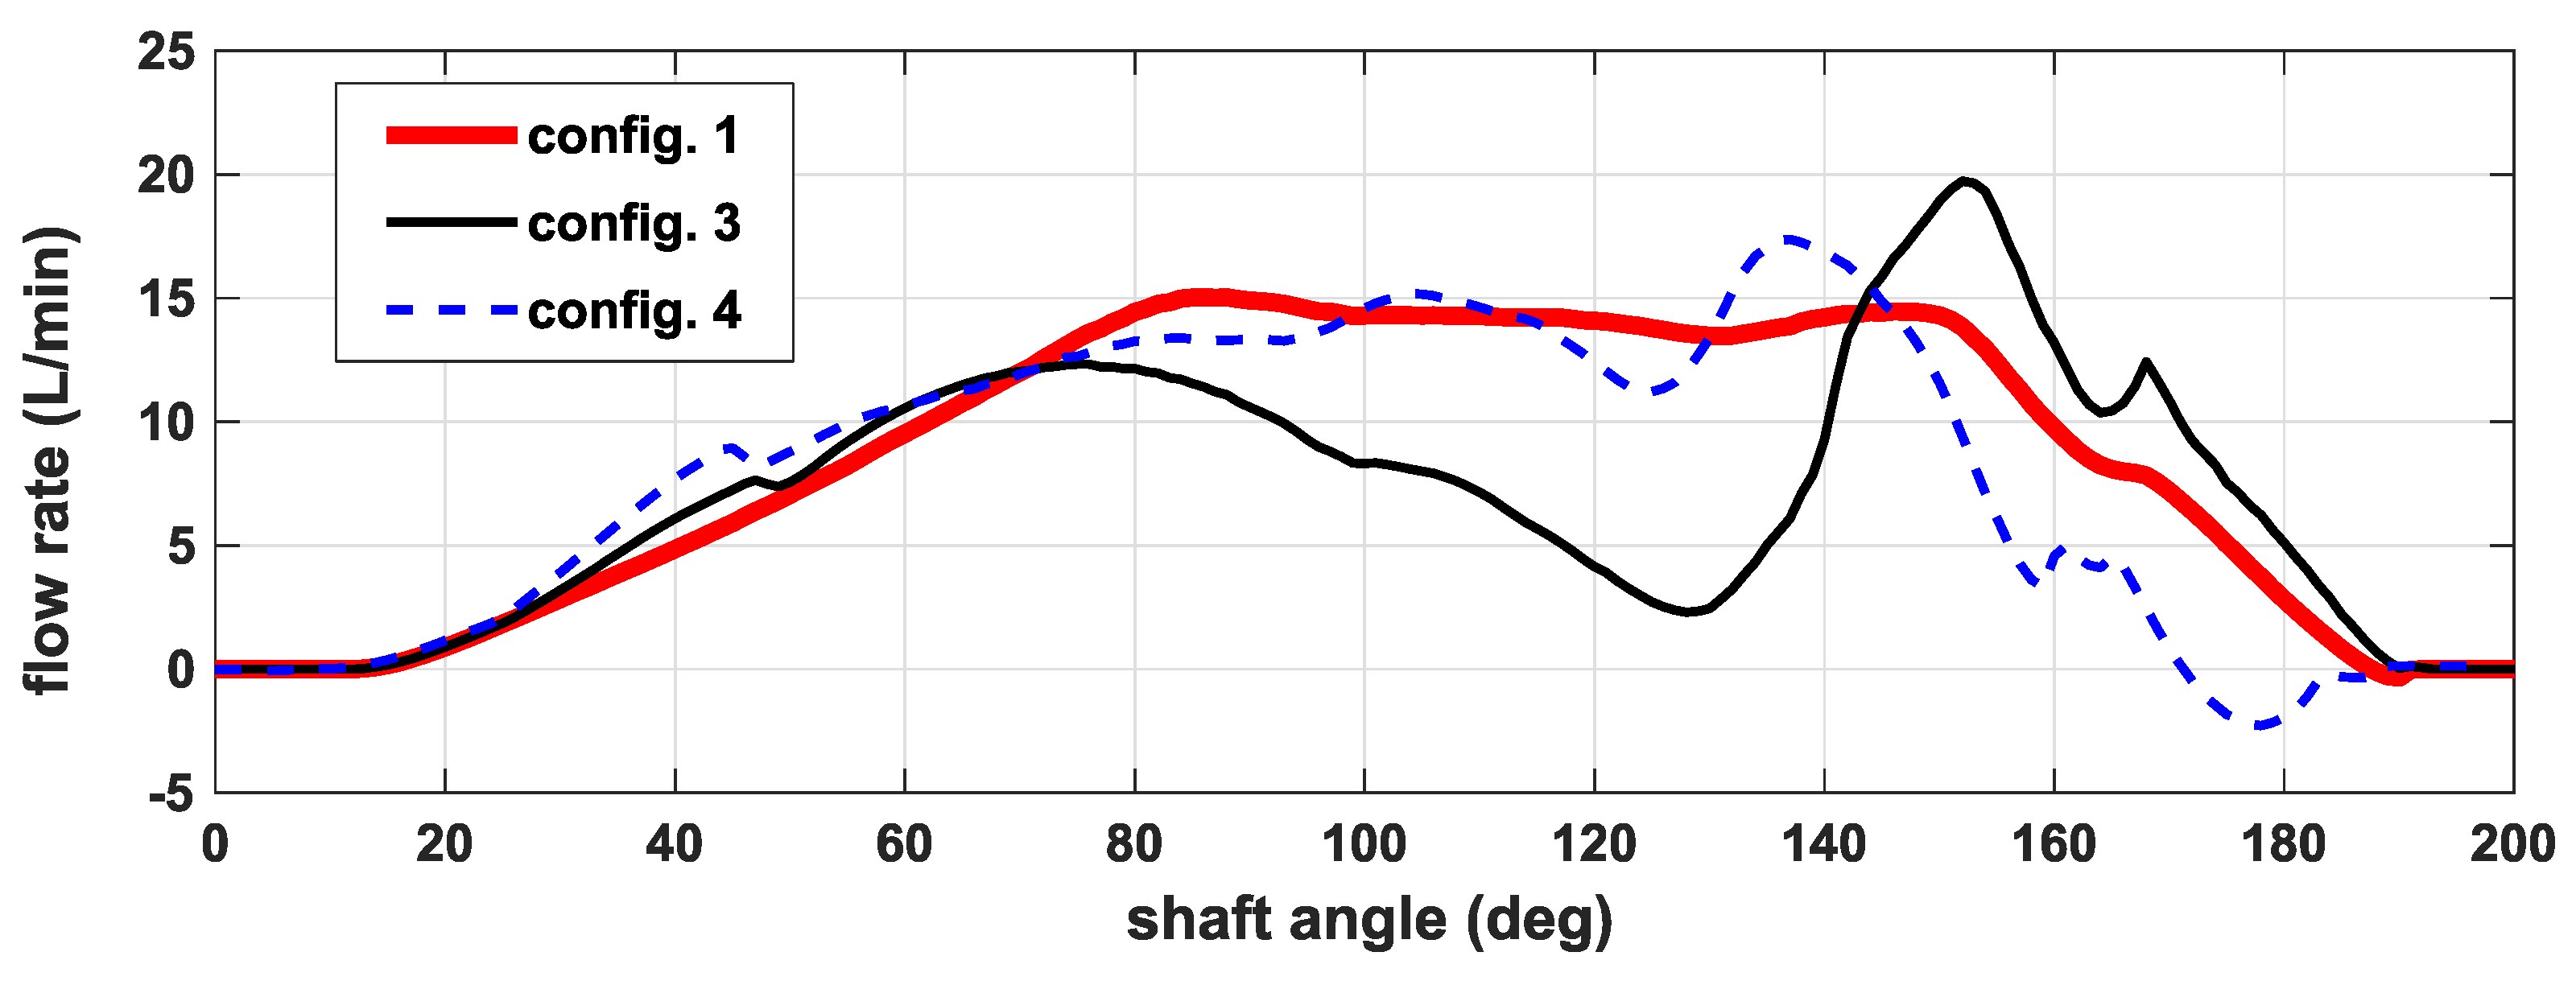
In Figure 7, the instantaneous flow rate entering a chamber as function of the shaft angle is plotted for Configurations 1, 3, and 4 at 5200 rpm. The behavior was very similar up to about 70 degrees, while in Configuration 4 at the end of the suction phase, a backflow was observed. In Configuration 3, in which the double feeding is obtained through the milling on the stator, the flow rate was significantly lower in the middle of the suction phase, with an improvement only at around 150 degrees.
Figure 8 shows the comparison between the radial flow rates, namely, only through the millings of the stator (see Figure 2) in Configurations 1 and 3; in the latter case, the contributions on the two sides were split. It can be observed that through the passage with height h2, the flow rate was always negative; this means that the fluid leaves the chamber instead of entering. The behavior was also confirmed by the analysis of the pressure and velocity field shown in Figure 9 at 120 degrees in Configuration 3.
The figure shows a cut plot in correspondence of the plane A (shown in Figure 2) in the middle of the milling with height h2, and perpendicular to the shaft. The boundary of the chamber connected to the inlet volume is indicated by the dashed red line. It can be observed that in front of the trailing vane, the pressure was higher than in the suction volume, while in the region behind the leading vane, the pressure was very low; in this part of the chamber, the gaseous phase was localized. The high pressure in the chamber, together with the centrifugal force acting on the oil, generated the backflow, as demonstrated by the direction of the velocity vectors plotted in the detail. Hence, in this pump, the contribution of the centrifugal force was significant with respect to the force generated by the pressure gradient, and due to the small axial height, the fluid could escape in correspondence with the outer edge of the chambers.
The negative flow rate in Configuration 4 detected in Figure 7 can be explained by the analysis of the axial flow on plane B passing through the rotor axis (Figure 10). The two flow rates entering from both sides meet in the middle of the chamber, and due to the centrifugal force, the fluid is pushed outwards against the stator track and an internal recirculation originates. Hence, at the end of the suction phase, where the chamber derivative is quite small and the suction effect is reduced, the fluid leaves the chamber in Region 1, indicated in Figure 10, due to the centrifugal force.
In Configuration 5, the drawback of the upper milling worsened the filling with respect to the Configuration 4. From this point of view, it was better to keep the connection of the chamber on the cover side closed, in order to avoid the outgoing flow rate. However, as demonstrated in the next section, with high values of the axial height, the behavior was completely different.
It can be observed from Table 2 that in Configuration 4, the worsening of the volumetric efficiency was lower at maximum displacement with respect to the partial displacement. The reason was that the higher volume derivative of the chamber that generated a stronger suction effect was able to balance the centrifugal force.
Finally, the fact that in Configuration 6, without any cutting, the behavior was similar to the Configuration 1 at partial displacement and worse at full displacement, can be understood by analyzing Region 2 in Figure 10. Also in this case, the oil tended to leave the chamber, but the trajectory of the fluid is deviated inwards by the high flow rate coming from the inlet pipe. Moreover, milling with height h1 allowed the pressure drop in the passage to be reduced between the stator and the casing. Since the pressure drop is proportional to the square of the flow rate, this improvement was negligible when the flow rate is low (at partial displacement) but it became substantial at maximum displacement.
Hence, the outcomes of the simulations have demonstrated that, considering the dimensional constrains, the original pump was optimized for minimizing the incomplete filling. However, as described in the next section, the solution adopted in this pump is not valid in general.
5. Influence of the Geometric Parameters
5.1. Simplified CFD Model
Once the reliability of the CFD model in evaluating the maximum flow rate was proven, a model with a simplified geometry of the inlet volumes and without ducts was created for studying the influence of some geometric parameters. Since only the layout of the rotary assembly had to be analyzed, the fixed volumes were left deliberately simple, in order to reduce the total number of cells, and therefore the computational time. The analyzed parameters were: the number of chambers, the eccentricity, the axial height, and the shape of the rotor.
The model, shown in Figure 11, was made up by the same rotating assembly of the complete model, and by prismatic fixed volumes connected through the port plate. As boundary conditions, the pressures were imposed at the ports. In order to obtain more realistic results, the inlet pressure has been set to a value (0.07 absolute MPa) comparable with the pressure in the inlet volume obtained by the simulation of the complete model at the maximum speed. The absolute pressure at the outlet was set to 0.3 MPa, in order to minimize the effect of the leakages.
The cell density in the prismatic volumes was 1 cell/mm, while in the port plates, it was 3 cell/mm. Such values were determined through a mesh sensitivity analysis for the study of the gerotor pump described in [16]. Since the aim of the study was to evaluate the filling capability, the leakage passageways were also simplified, and only the axial clearance between the rotor and the cover was considered. The pump was simulated at 5000 rpm and maximum displacement.
5.2. Influence of the Number of Vanes
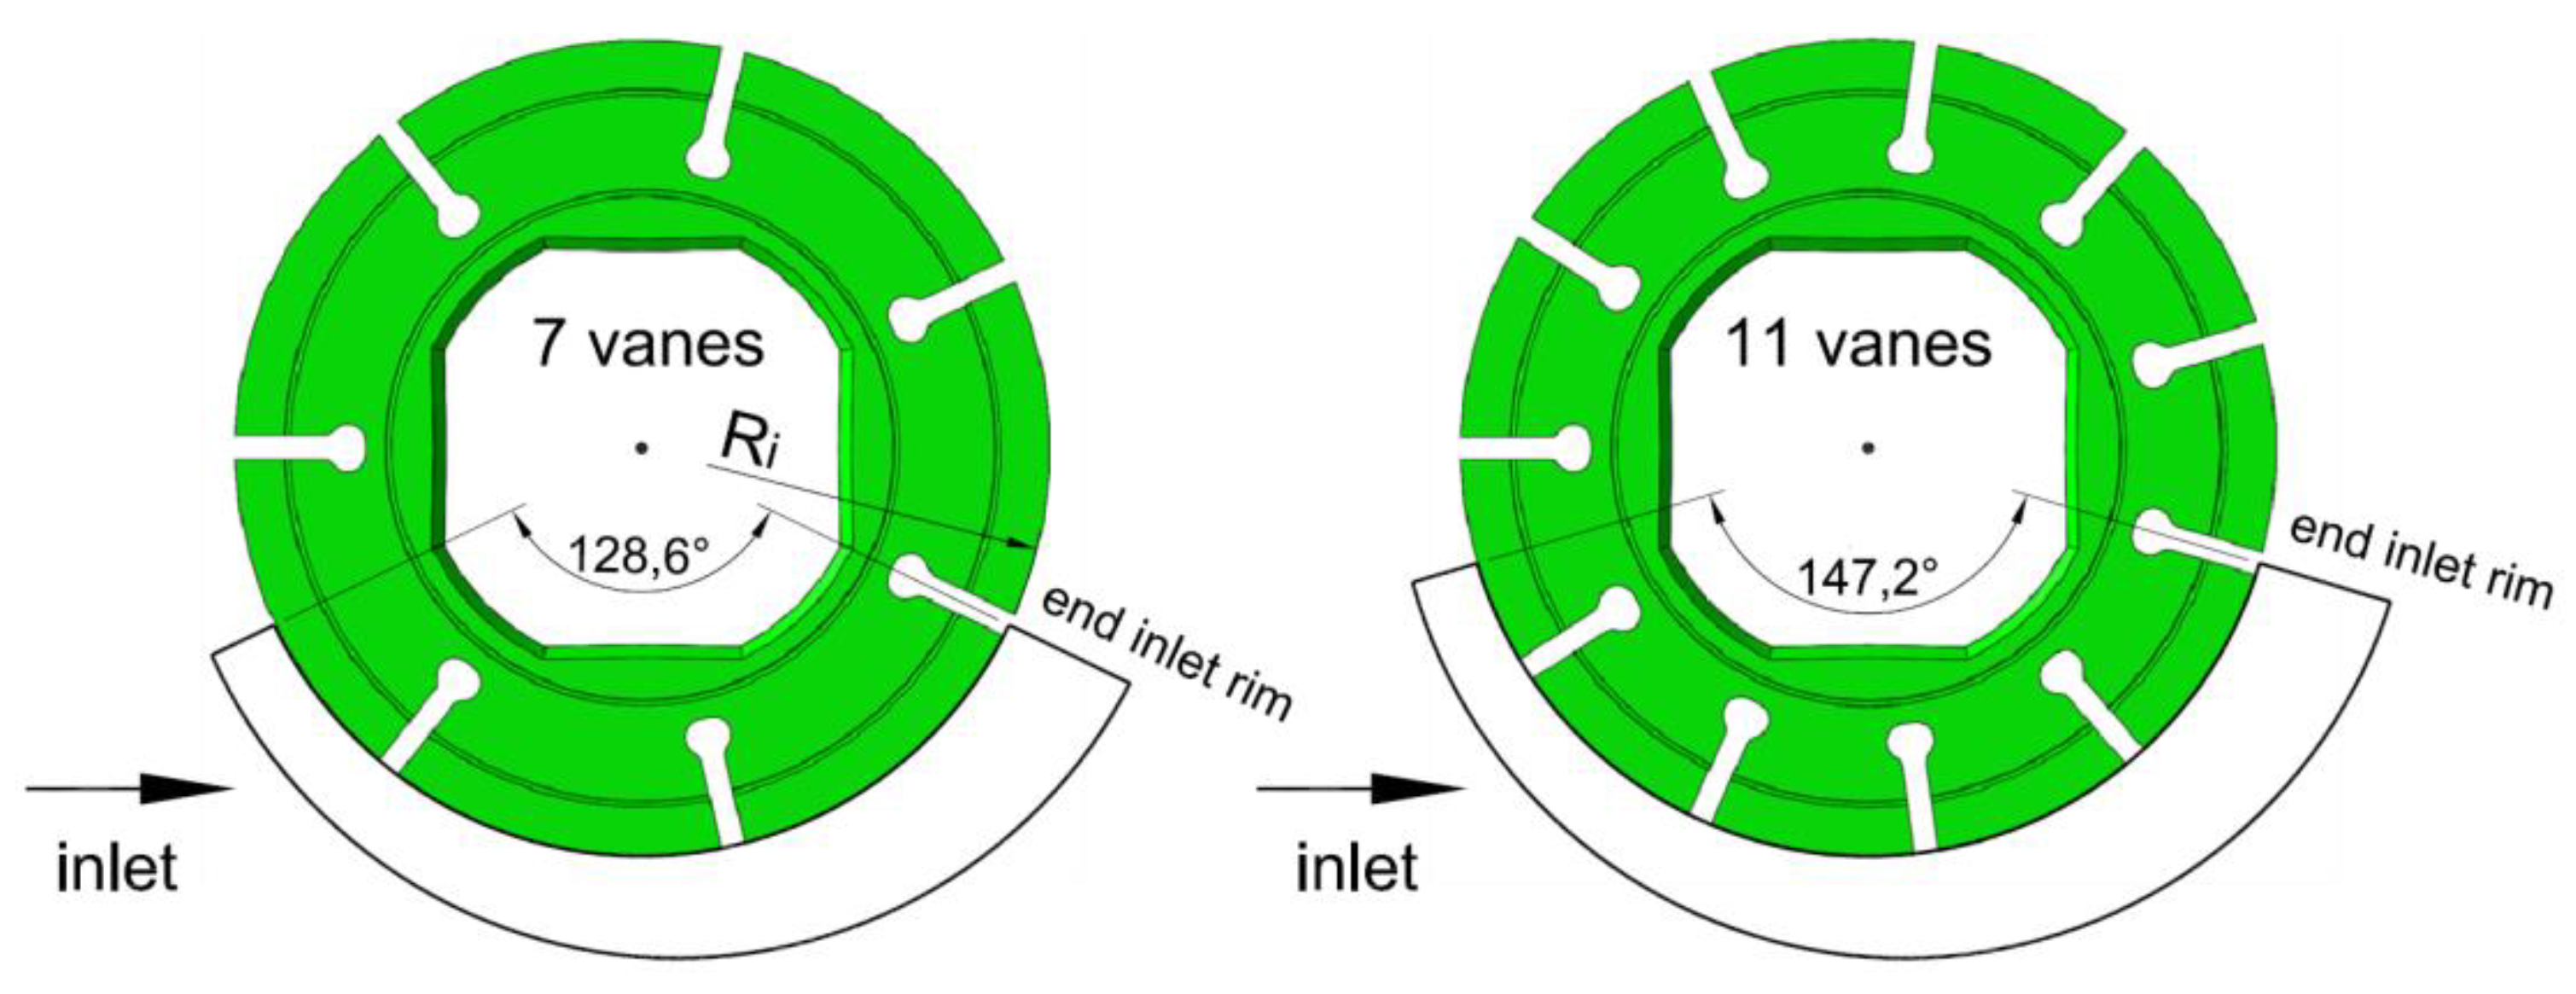
For assessing the influence of the number of chambers, two new rotors were designed with seven and 11 vanes, as shown in Figure 12. The port plate was modified accordingly in order to have an ideal timing in all configurations. This means that the connection and the separation of the generic chamber with the suction side occurred exactly at the positions of minimum and maximum volumes. It is straightforward that, regardless of the number of chambers, the filling can be further improved by means of a non-ideal timing; in particular, by delaying the closing of the suction port, as reported also in [16]. However, in this study, only the influence of the number of chambers is highlighted. All other parameters have remained the same, as in the reference pump with nine vanes. Since the pump displacement was slightly influenced by the number of chambers, the displacement of the pump with 11 vanes is 1.3% smaller than in the pump with seven vanes, with a difference in terms of theoretical flow rate at 5000 rpm of 1 L/min.
With reference to the results reported in Table 3, such a difference is relatively small with respect to the variation of the real flow rate, which consequently, is mainly due to the different number of vanes. The reason for why the flow rate increases significantly with the increment of the number of vanes is the wider extension of the suction port (about +14%, as shown in Figure 12), which lets more time for the oil to fill the chambers. Moreover, with a higher number of vanes, the flow area of a chamber remained at the maximum opening for a larger angular range, as shown in Figure 13, where the normalized flow area is plotted. It is defined as the ratio between the chamber flow area and the frontal surface of the chamber itself; the value 1 means that the flow area was not restricted by the rim of the port plate.
The beneficial effect of the increment of the number of chambers appeared to be in contradiction with the results obtained on a gerotor pump, as described in [16], where an improvement of the volumetric efficiency using a lower number of chambers was found. However, since in a gerotor machine it is not possible to change only one parameter of the profiles, the variation of the number of chambers was obtained by also reducing the lower radius of the inner gear. In [16], it was supposed that the reason for the increment of the flow rate was the lower peripheral velocity of the chambers at the minimum radius. Such a hypothesis is confirmed by the simulations performed in the next section.
Obviously, the choice of the number of chambers is not only related to the filling issue, but also to other aspects. In fact, although an additional beneficial effect in using a high number of vanes is the lower kinematic flow ripple, it must be noted that two drawbacks are the worsening of the mechanical efficiency, due to more vanes being in contact with the rotor and the stator, and the increment of cost.
5.3. Influence of the Rotor Shape
In order to evaluate the influence of the rotor diameter, a new shape of the outer contour was simulated (Figure 14). The maximum external diameter was the same as the reference pump (M0), while in the middle of each chamber, the radius was 4 mm lower. Obviously, this modification had no influence on the pump displacement. Accordingly, the internal radius of the suction port (Ri in Figure 12) was decreased, in order to allow for the flow area to be increased.
With the new geometry, the flow rate delivered by the pump at 5000 rpm was 62.3 L/min, while the volumetric efficiency was 0.795 with respect to 0.74 of the version M0.
With respect to the reference rotor, the solution shown in Figure 14 and already adopted in lubricating pumps, has two advantages: a higher flow area at equal displacement, and a lower mean distance of the chambers from the shaft axis. Since, as shown in Figure 10, the oil enters the chamber mainly at the lower radius, this second aspect is also beneficial for pump filling.
5.4. Influence of the Double Feeding with a Low Diameter of the Rotor
In the first part of this paper, the results obtained on the entire pump showed a worsening of the filling in the case of double-feeding of the chambers, regardless of whether the additional port was manufactured on the stator or on the cover. The same analysis was repeated on a pump with the same number of chambers and with the geometric parameters, normalized with respect to the reference pump, listed in Table 4. The parameters were been chosen in order to obtain a similar displacement, but with a smaller diameter.
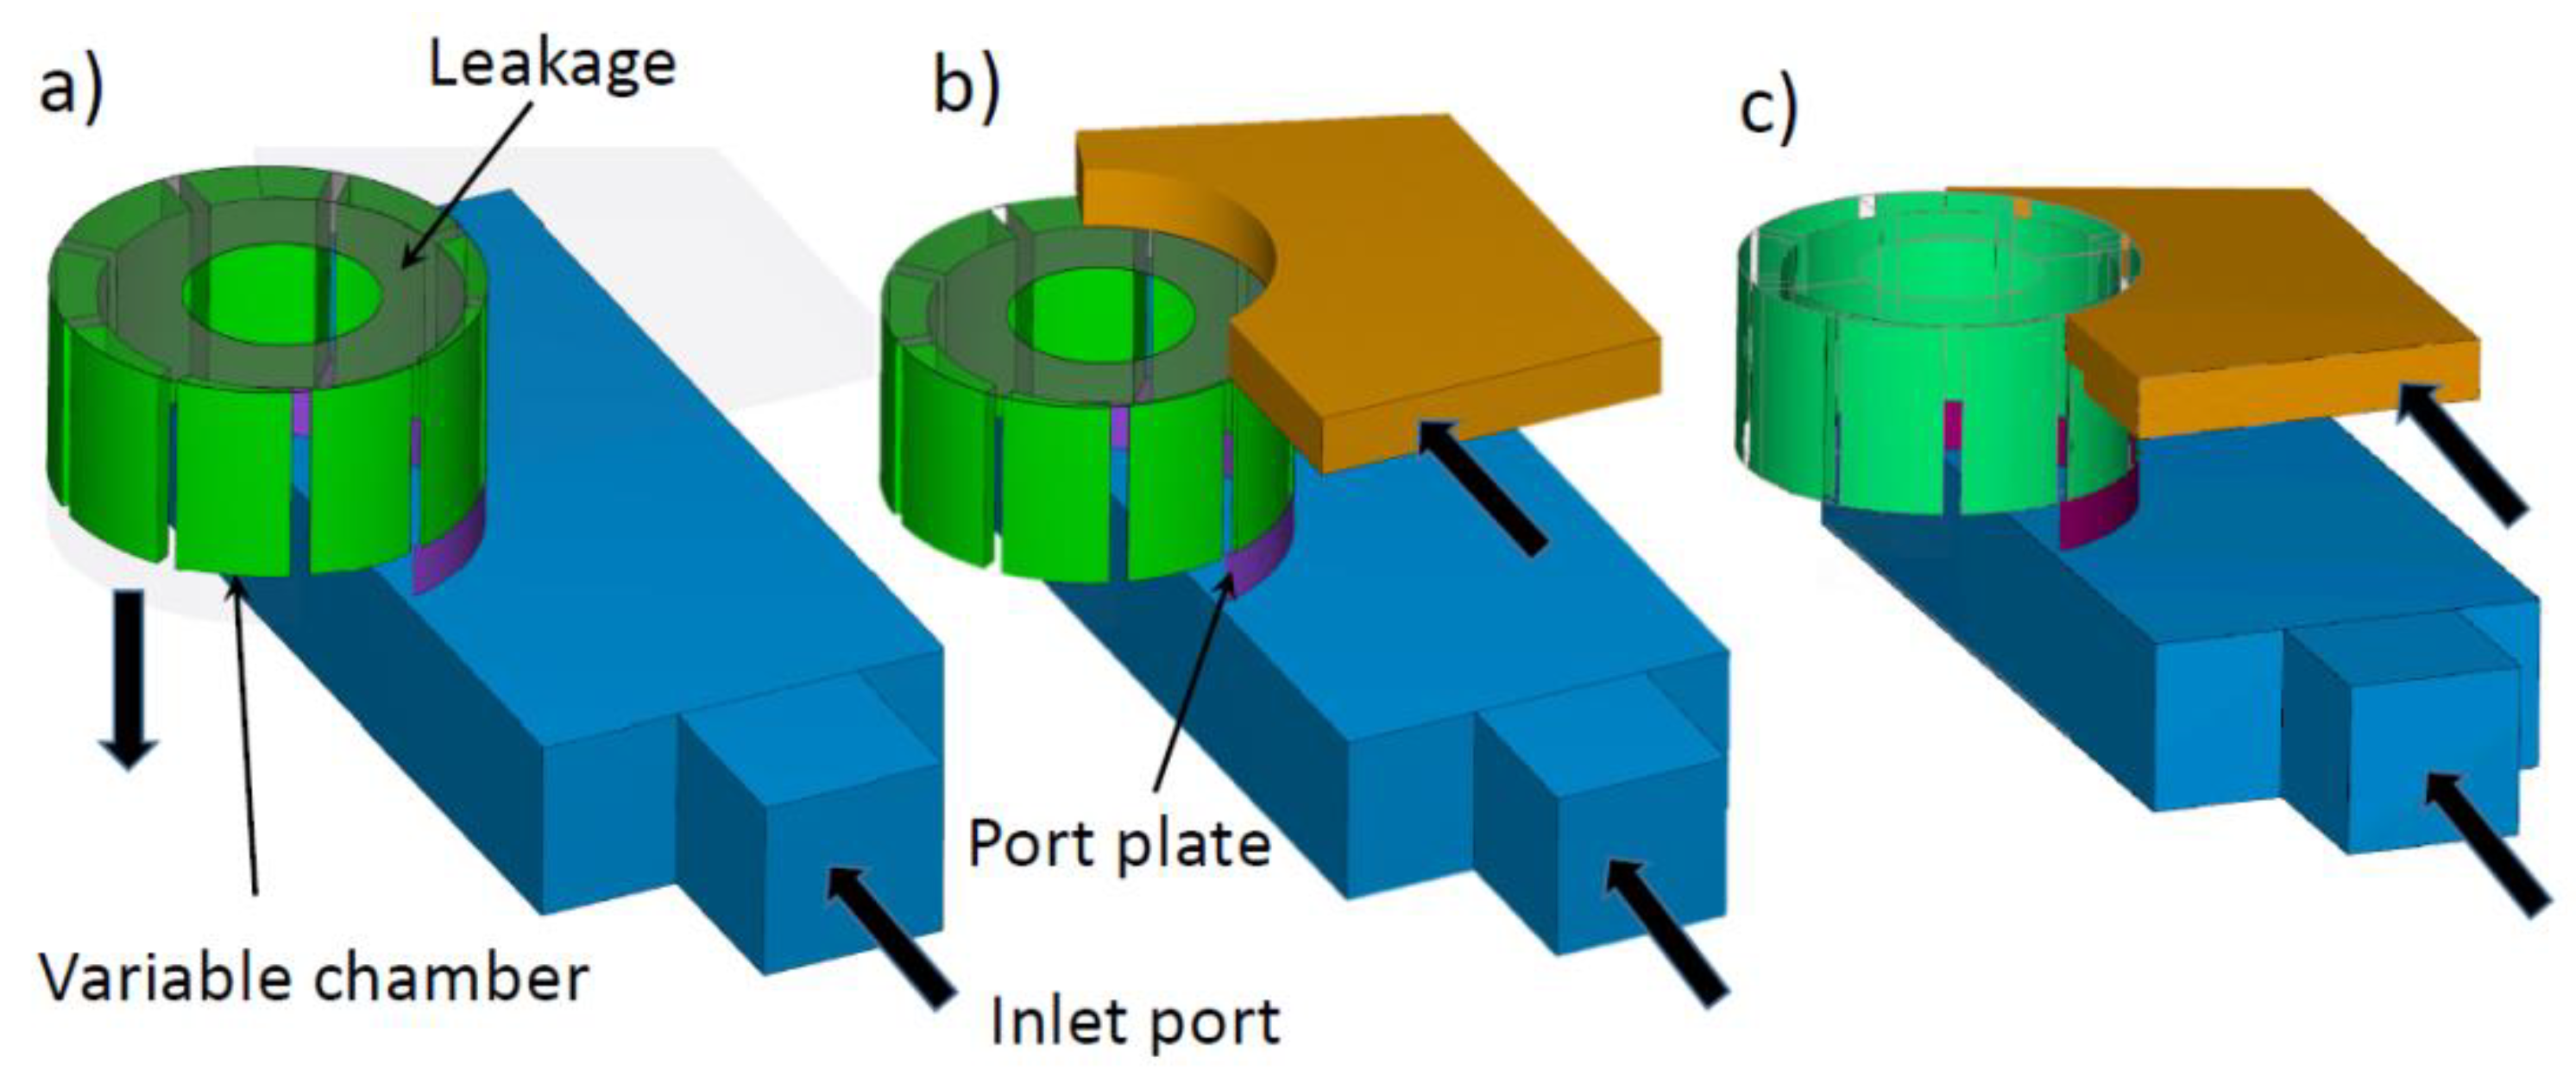
The model, shown in Figure 15, was built with three different layouts:
- M3: with the chambers fed from only one side;
- M4: with respect to the configuration at Item 1, with a second inlet port in the cover;
- M5: with respect to the configuration at Item 1, with a second inlet port obtained through a milling on the stator with a height of 5 mm on the cover side, like the cutting with height h2 in Figure 2.
The flow rates and the volumetric efficiencies are reported in Table 5. It is evident how, with a smaller diameter and a higher axial thickness, the double feeding was always extremely beneficial for the filling, and the behavior was completely different from the case of the pump shown in Figure 1. The lateral port manufactured on the stator, even at very high speed, allowed for an increment of the ingoing flow rate to be obtained. In Figure 16, the velocity field in the model M4 shows that, unlike the pump of Figure 1, the oil entered the chamber also through the port in the cover.
5.5. Influence of the Eccentricity
The last parameter analyzed is the eccentricity. Starting from the rotor with small diameter simulated in the previous section (M3), and with an axial thickness equal to the reference pump (M0), the eccentricity, and the stator diameter have been increased, in order to obtain the same displacement (Table 6). In this way, the pumping area, defined as the ratio between the displacement and the axial height, has been incremented. In Figure 17, the comparison between the configurations M0, M3, and M6 is shown. It must be noted that the unit M6 was used only to highlight the effectiveness of the increment of the eccentricity in the fluid dynamic model. In fact, the excessive extension of the vanes, with respect to the slots in the rotor, would cause serious kinematic and mechanical issues.
From the results listed in Table 7, it is evident that at equal axial thickness (M6 vs M0) the reduction of the rotor diameter improves the filling, while at equal diameter of the rotor (M6 vs M3), even with a slightly higher radius of the stator, the reduction of the axial thickness is significantly beneficial. The advantage of M6 with respect to M0, is because the variable chambers move with a lower tangential speed, hence the fluid coming from the suction volume must be accelerated up to a lower speed for entering the chambers with respect to the configuration M0.
6. Conclusions
The filling capability of a vane pump is highly influenced by the geometry of the suction side and of the rotary assembly. In this paper, the software PumpLinx has been successfully used for analyzing the influence of several geometric configurations on the volumetric efficiency at high speed. At first, the methodology has been validated experimentally on a lubricating pump in different configurations, then the influence of the double and radial feeding has been analyzed.
It was found that for the reference pump, the increment of the flow area through the port in the cover, and through a cutting on the stator worsens the filling of the pump. This result, also demonstrated experimentally, is in contrast with the common best practices for the design of the pumps. The reason for this behavior is the high ratio between the diameter and the height of the rotor in the pump used as reference. In fact, the contribution of the centrifugal force can be significant with respect to the force generated by the pressure gradient, and if the axial height of the rotary assembly is small, a considerable amount of fluid can escape in correspondence with the outer edge of the chambers. On the contrary, in every other case tested with low diameter and high axial thickness, any additional flow area, regardless where it was manufactured, was proven to be beneficial for improving the filling.
Other important outcomes are that the filling can be improved by shaping properly the rotor, in order to reduce locally the diameter, and by maximizing the eccentricity, in order to minimize the axial height. Finally, it was found that, unlike the gerotor pumps, the filling was improved by increasing the number of chambers.
Author Contributions
M.R. conceived the study, performed the experimental tests, and wrote the draft paper; G.A. built the CAD and CFD models, and made the post processing; M.R. and P.C. analyzed the results; P.C. reviewed the final paper.
Funding
This research received no external funding.
Acknowledgments
The authors wish to thank OMIQ s.r.l. for providing the software Simerics PumpLinx®.
Conflicts of Interest
The authors declare no conflict of interest.
Appendix A
In this Appendix, a synthesis of the main features of the code PumpLinx and of the specific CFD model described in the references [16,17,18] are reported.
The surfaces of the fluid domain in STL format were generated by the 3D CAD model of the pump in Solidworks®. The control volumes were divided into subdomains, in order to have the possibility of setting different values of the grid density. The variable volume chambers were meshed by the means of a built-in mesh generator, which allows obtaining a structured hexahedral grid. The remaining volumes were meshed by means of the general mesh generator using the body-fitted binary tree approach [24] for obtaining an unstructured mesh with mainly cubic cells. Basically, a Cartesian cubic grid is generated, and the cell size is reduced by factors of two in the regions where a higher accuracy is necessary. The cells are cut in correspondence of the boundaries.
The subdomains were connected one to each other by means of the mismatched grid interfaces; in this way the common areas between two neighbor volumes are identified, and a conservative treatment of mass, momentum, and energy is applied. Practically, during the simulation the overlapping area is treated as the internal face between two neighboring cells in the same grid subdomain.
The strainer at the inlet of the suction pipe was modelled in a simplified way by the means of a specific subdomain, where a linear resistance model was applied. The pressure drop is calculated as:
where Ci is the linear drag coefficient, v is the fluid velocity, and γ is the porosity, defined as the ratio between the void space and the total volume. For the case under study, the value of γ that is equal to 0.508 was directly measured from the CAD model of the net. The coefficient Ci was estimated by means of a stand-alone detailed model of only a portion of the duct, including the net.
The code solves the conservation equations of mass and momentum using the transient Navier–Stokes Equations [24]. The physical model used to describe the cavitation and aeration phenomena is the Equilibrium Dissolved Gas, based on the model developed by Singhal et al. [29]. It is a single-phase model, where the density of the mixture is calculated as follows:
being fv and fg the mass fraction of the vapor and of the gas (air) respectively, while ρv, ρg, and ρl are the densities of the vapor, of the gas, and of the liquid. The fraction of dissolved/separated air is determined based on the total mass of gas, and the equilibrium value given by the Henry’s law, and the local pressure as follows:
where gd is the gas mass fraction at the equilibrium condition, p is the instantaneous local pressure, pr is the reference pressure at equilibrium condition when all of the gas is dissolved, and gd,r is the mass gas fraction that is dissolved in the liquid at the reference pressure. The total gas mass fraction, i.e., the sum of the dissolved and separated fractions, remains constant during the simulation. This model does not consider the time constants for the processes of release and dissolution, but the gas reaches the equilibrium condition instantaneously. The equations used in the model to calculate vapor condensation and evaporation rates are:
where Ce and Cc are respectively the evaporation and condensation constants, gf is the mass fraction of separated gas and pv the vapor pressure.
The standard model k–ε was applied, even if some tests have shown the negligible influence of the turbulence model on the results in this application.
The CFD code discretizes the governing equations using the finite volume method. In the present study, the first order upwind interpolation scheme was used, while the SIMPLE-S method, developed by Simerics® as an extension of the SIMPLE-C algorithm, was employed for the pressure-velocity coupling. Transient simulations were performed with an angular step of 1 degree. The software evaluates at the same time also the moving average of the delivered volumetric flow rate using as subset the data of a shaft revolution. The steady-state condition is considered to be reached when the mean flow rate becomes constant.
References
- Rundo, M. Models for Flow Rate Simulation in Gear Pumps: A Review. Energies 2017, 10, 1261. [Google Scholar] [CrossRef]
- Gherardini, F.; Zardin, B.; Leali, F. A parametric CAD-based method for modelling and simulation of positive displacement machines. J. Mech. Sci. Technol. 2016, 30, 3253–3263. [Google Scholar] [CrossRef]
- Pellegri, M.; Vacca, A.; Frosina, E.; Buono, D.; Senatore, A. Numerical analysis and experimental validation of Gerotor pumps: A comparison between a lumped parameter and a computational fluid dynamics-based approach. Proc. ImechE Part C: J. Mech. Eng. Sci. 2017, 231, 4413–4430. [Google Scholar] [CrossRef]
- Zhao, X.; Vacca, A.; Dhar, S. Numerical Modeling of a Helical External Gear Pump with Continuous-Contact Gear Profile: A Comparison between a Lumped-Parameter and a 3D CFD Approach of Simulation. In Proceedings of the Bath/ASME Symposium on Fluid Power and Motion Control, Bath, UK, 12–14 September 2018. [Google Scholar] [CrossRef]
- Corvaglia, A.; Rundo, M. Comparison of 0D and 3D Hydraulic Models for Axial Piston pumps. Proceedings of the 73th Conference of the Italian Thermal Machines Engineering Association, ATI2018, 12-14 September, 2018, Pisa, Italy. Energy Procedia 2018, 148, 114–121. [Google Scholar] [CrossRef]
- Borghi, M.; Zardin, B.; Specchia, E. External Gear Pump Volumetric Efficiency: Numerical and Experimental Analysis; SAE Technical paper 2009-01-2844; SAE: Warrendale, PA, USA, 2009. [Google Scholar]
- Ippoliti, L.; Vincké, J.; Hendrick, P. Oil aeration and degassing measurements for the study of aero-engine oil pump performance in cavitation. In Proceedings of the ASME Fluids Engineering Division Summer Meeting, Waikoloa, HI, USA, 30 July–3 August 2017. [Google Scholar] [CrossRef]
- Casoli, P.; Bedotti, A.; Campanini, F.; Pastori, M. A Methodology Based on Cyclostationary Analysis for Fault Detection of Hydraulic Axial Piston Pumps. Energies 2018, 11, 1874. [Google Scholar] [CrossRef]
- Buono, D.; Siano, D.; Senatore, A.; Frosina, E. Gerotor pump cavitation monitoring and fault diagnosis using vibration analysis through the employment of auto-regressive-moving-average technique. Simul. Model. Pract. Theory 2017, 71, 61–82. [Google Scholar] [CrossRef]
- Zhang, D.; Perng, C.Y.; Laverty, M. Gerotor Oil Pump Performance and Flow/Pressure Ripple Study; SAE Paper 2006-01-0359; SAE: Warrendale, PA, USA, 2006. [Google Scholar]
- Wang, D.; Ding, H.; Jiang, Y. Numerical Modeling of Vane Oil Pump with Variable Displacement; SAE Paper 2012-01-0637; SAE: Warrendale, PA, USA, 2012. [Google Scholar]
- Jiang, Y.; Furmanczyk, M.; Lowry, S.; Zhang, D.; Perng, C.Y. A Three-Dimensional Design Tool for Crescent Oil Pumps; SAE Paper 2008-01-0003; SAE: Warrendale, PA, USA, 2008. [Google Scholar]
- Frosina, E.; Senatore, A.; Buono, D.; Stelson, F.; Wang, F.; Mohanty, B.; Gust, M.J. Vane pump power split trasmission: Three dimensional computational fluid dynamic modeling. In Proceedings of the ASME/BATH Symposium on Fluid Power and Motion Control, FPMC2015, Chicago, IL, USA, 12–14 October 2015. [Google Scholar] [CrossRef]
- Hsieh, C.F. Flow Characteristics of Gerotor Pumps With Novel Variable Clearance Designs. J. Fluids Eng. 2015, 137, 041107. [Google Scholar] [CrossRef]
- Dhar, S.; Nichani, V.H.; Srinivasan, C.; Wang, D.M.; Yang, L.; Bing, Z.; Yang, J.J. A CFD study of an Electronic Hydraulic Power Steering Helical External Gear Pump: Model Development, Validation and Application. SAE Int. J. Passeng. Cars Mech. Syst. 2016, 9, 346–352. [Google Scholar] [CrossRef]
- Altare, G.; Rundo, M. CFD Analysis of Gerotor Lubricating Pumps at High Speed: Geometric Features Influencing the Filling Capability. In Proceedings of the ASME/BATH Symposium on Fluid Power and Motion Control, FPMC2015, Chicago, IL, USA, 12–14 October 2015. [Google Scholar] [CrossRef]
- Altare, G.; Rundo, M. Advances in simulation of gerotor pumps: An integrated approach. Proc. IMechE Part C J. Mech. Eng. Sci. 2017, 231, 1221–1236. [Google Scholar] [CrossRef]
- Rundo, M.; Altare, G. Lumped Parameter and Three-Dimensional Computational Fluid Dynamics Simulation of a Variable Displacement Vane Pump for Engine Lubrication. J. Fluids Eng. 2018, 140, 061101. [Google Scholar] [CrossRef]
- Gamez-Montero, P.J.; Castilla, R.; Codina, E. Methodology based on best practice rules to design a new-born trochoidal gear pump. Proc. IMechE Part C J. Mech. Eng. Sci. 2018, 232, 1057–1068. [Google Scholar] [CrossRef]
- Kumar, M.S.; Manonmani, K. Computational fluid dynamics integrated development of gerotor pump inlet components for engine lubrication. Proc. IMechE Part D J. Autom. Eng. 2010, 224, 1555–1567. [Google Scholar] [CrossRef]
- Jacazio, G.; De Martin, A. Influence of rotor profile geometry on the performance of an original low-pressure gerotor pump. Mech. Mach. Theory 2016, 100, 296–312. [Google Scholar] [CrossRef]
- Suzuki, K.; Nakamura, Y.; Yakabe, S.; Watanabe, H.; Nakamura, K. Characteristics Prediction of Vane Pump by CFD Analysis. Available online: https://www.kyb.co.jp/english/technical_report/data/no53e/03_technology_explanation_01.pdf (accessed on 16 January 2019).
- Rundo, M.; Altare, G. CFD Studies on the Radial Feeding in High-Speed Vane Pumps. In Proceedings of the 21st Australasian Fluid Mechanics Conference, Adelaide, Australia, 10–13 December 2018. [Google Scholar]
- Ding, H.; Visser, F.C.; Jiang, Y.; Furmanczyk, M. Demonstration and validation of a 3D CFD simulation tool predicting pump performance and cavitation for industrial applications. ASME J. Fluid Eng. 2011, 133, 011101. [Google Scholar] [CrossRef]
- Inaguma, Y.; Hibi, A. Reduction of Friction Torque in Vane Pump by Smoothing Cam Ring Surface. Proc. IMechE Part C J. Mech. Eng. Sci. 2007, 221, 527–534. [Google Scholar] [CrossRef]
- Rundo, M. Piloted Displacement Controls for ICE Lubricating Vane Pumps. SAE Int. J. Fuels Lubricants 2010, 2, 176–184. [Google Scholar] [CrossRef]
- Rundo, M.; Squarcini, R.; Furno, F. Modelling of a Variable Displacement Lubricating Pump with Air Dissolution Dynamics. SAE Int. J. Eng. 2018, 11, 111–126. [Google Scholar] [CrossRef]
- Staley, D.; Pryor, B.; Gilgenbach, K. Adaptation of a Variable Displacement Vane Pump to Engine Lube Oil Applications; SAE paper 2007-01-1567; SAE: Warrendale, PA, USA, 2007. [Google Scholar]
- Singhal, A.; Athavale, M.; Li, H.; Jiang, Y. Mathematical Basis and Validation of the Full Cavitation Model. J. Fluids Eng. 2002, 124, 617–624. [Google Scholar] [CrossRef]
Figure 1.
(a) Three-dimensional view of the vane pump with the detail of a variable chamber; (b) Computational domain with a detail of the mesh resolution.
Figure 1.
(a) Three-dimensional view of the vane pump with the detail of a variable chamber; (b) Computational domain with a detail of the mesh resolution.

Figure 2.
Cross-section of the inlet volume with the indication of the geometric parameters. Planes A and B are used for the cut plots shown in Section 4.
Figure 2.
Cross-section of the inlet volume with the indication of the geometric parameters. Planes A and B are used for the cut plots shown in Section 4.

Figure 3.
View of the pump from the inlet pipe with the indication of the direction of the flow, the location of the cuttings h1 and h2, and the direction of rotation (black arrow).
Figure 3.
View of the pump from the inlet pipe with the indication of the direction of the flow, the location of the cuttings h1 and h2, and the direction of rotation (black arrow).

Figure 4.
Hydraulic scheme of the test rig for the model validation.

Figure 5.
Photo of the pump mounted on the test rig with the indication of the oil level when the reservoir is positioned in the test mode.
Figure 5.
Photo of the pump mounted on the test rig with the indication of the oil level when the reservoir is positioned in the test mode.

Figure 6.
Flow-speed characteristics at 0.2 MPa and at two fixed displacements (blocked): maximum (100%) and partial (55%).
Figure 6.
Flow-speed characteristics at 0.2 MPa and at two fixed displacements (blocked): maximum (100%) and partial (55%).

Figure 7.
Total instantaneous flow rate entering a chamber (positive if ingoing) as a function of the shaft angle for three different configurations.
Figure 7.
Total instantaneous flow rate entering a chamber (positive if ingoing) as a function of the shaft angle for three different configurations.

Figure 8.
Radial flow rate through the millings on the stator.

Figure 9.
Pressure field in the upper milling—cover side (Plane A) and detail of the velocity field in Configuration 3, at 120 degrees and at 55% of the maximum displacement.
Figure 9.
Pressure field in the upper milling—cover side (Plane A) and detail of the velocity field in Configuration 3, at 120 degrees and at 55% of the maximum displacement.

Figure 10.
Pressure and velocity fields in a cross-section of a chamber (Plane B) for Configuration 4 at 180 degrees and at 55% of the maximum displacement.
Figure 10.
Pressure and velocity fields in a cross-section of a chamber (Plane B) for Configuration 4 at 180 degrees and at 55% of the maximum displacement.

Figure 11.
Simplified CFD model with the same variable chambers of the reference pump.

Figure 12.
Rotors with different numbers of vanes, and the profile of the suction port plate.

Figure 13.
Normalized flow area with seven and 11 vanes. The position of 0 degrees corresponds to the minimum volume of the chamber.
Figure 13.
Normalized flow area with seven and 11 vanes. The position of 0 degrees corresponds to the minimum volume of the chamber.

Figure 14.
A rotor with variable diameter.

Figure 15.
Model with a smaller diameter and the same displacement: (a) with chambers fed from only one side—M3, (b) with chambers fed from both sides through the cover—M4, (c) with chambers fed from both sides through a cutting on the stator—M5. The delivery volume is not shown.
Figure 15.
Model with a smaller diameter and the same displacement: (a) with chambers fed from only one side—M3, (b) with chambers fed from both sides through the cover—M4, (c) with chambers fed from both sides through a cutting on the stator—M5. The delivery volume is not shown.

Figure 16.
Pressure and velocity fields in a cross-section of a chamber at the end of the suction phase for the geometry M4 at 5000 rpm.
Figure 16.
Pressure and velocity fields in a cross-section of a chamber at the end of the suction phase for the geometry M4 at 5000 rpm.

Figure 17.
Rotating assembly of the unit M6, contrasted with the configurations M0 and M3.


Table 1.
Geometric parameters for each analyzed configuration.
| Configuration | h1 (mm) | h2 (mm) | h3 (mm) |
|---|---|---|---|
| 1 (baseline) | 2 | 0 | 0 |
| 2 | 2 | 1 | 0 |
| 3 | 2 | 2 | 0 |
| 4 | 2 | 0 | 5 |
| 5 | 2 | 2 | 5 |
| 6 | 0 | 0 | 0 |
Table 2.
Simulated flow rate and volumetric efficiency at 5200—partial displacement (55%) and at 4400 rpm—full displacement (100%).
Table 2.
Simulated flow rate and volumetric efficiency at 5200—partial displacement (55%) and at 4400 rpm—full displacement (100%).
| Configuration | Flow Rate (L/min) | Volumetric Efficiency | Flow Rate (L/min) | Volumetric Efficiency |
|---|---|---|---|---|
| @5200 rpm—55% | @4400 rpm—100% | |||
| 1 (baseline) | 40.1 | 0.91 | 58.1 | 0.94 |
| 2 | 37.4 | 0.85 | 54.4 | 0.88 |
| 3 | 33.2 | 0.75 | - | - |
| 4 | 37.4 | 0.85 | 57.0 | 0.92 |
| 5 | 35.4 | 0.80 | - | - |
| 6 | 40.1 | 0.91 | 55.2 | 0.90 |
Table 3.
Flow rate and volumetric efficiency at 5000 rpm with different numbers of vanes. A code has been associated with each configuration.
Table 3.
Flow rate and volumetric efficiency at 5000 rpm with different numbers of vanes. A code has been associated with each configuration.
| Code | No. of Vanes | Flow Rate (L/min) | Volumetric Efficiency |
|---|---|---|---|
| M1 | 7 | 47.8 | 0.61 |
| M0 | 9 (reference) | 58.0 | 0.74 |
| M2 | 11 | 66.6 | 0.85 |
Table 4.
Parameters of the pump with respect to the reference unit M0.
| Eccentricity | Stator Diameter | Rotor Diameter | Axial Thickness | Pump Displacement |
|---|---|---|---|---|
| 1 | 0.59 | 0.54 | 1.8 | 1.01 |
Table 5.
Flow rate and volumetric efficiency at 5000 rpm and 7500 rpm, with three layouts of the suction ports, and a rotor with small diameter.
Table 5.
Flow rate and volumetric efficiency at 5000 rpm and 7500 rpm, with three layouts of the suction ports, and a rotor with small diameter.
| Model | Flow Rate (L/min) | Volumetric Efficiency | Flow Rate (L/min) | Volumetric Efficiency |
|---|---|---|---|---|
| 5000 rpm | 7500 rpm | |||
| Single side (M3) | 45.0 | 0.57 | 42.3 | 0.36 |
| Double side through cover (M4) | 72.4 | 0.92 | 79.1 | 0.67 |
| Double side through stator (M5) | 74.2 | 0.95 | 78.3 | 0.66 |
Table 6.
Parameters of the pump with respect to the unit M0.
| Code | Eccentricity | Stator Diameter | Rotor Diameter | Axial Thickness | Pump Displacement |
|---|---|---|---|---|---|
| M6 | 1.64 | 0.64 | 0.54 | 1.00 | 1.01 |
Table 7.
Flow rate and volumetric efficiency at 5000 rpm for different configurations.
| Code | Flow Rate (L/min) | Volumetric Efficiency |
|---|---|---|
| M0 | 58.0 | 0.74 |
| M3 | 45.0 | 0.57 |
| M6 | 64.9 | 0.83 |
© 2019 by the authors. Licensee MDPI, Basel, Switzerland. This article is an open access article distributed under the terms and conditions of the Creative Commons Attribution (CC BY) license (http://creativecommons.org/licenses/by/4.0/).
Share and Cite
MDPI and ACS Style
Rundo, M.; Altare, G.; Casoli, P. Simulation of the Filling Capability in Vane Pumps. Energies 2019, 12, 283. https://doi.org/10.3390/en12020283
AMA Style
Rundo M, Altare G, Casoli P. Simulation of the Filling Capability in Vane Pumps. Energies. 2019; 12(2):283. https://doi.org/10.3390/en12020283
Chicago/Turabian StyleRundo, Massimo, Giorgio Altare, and Paolo Casoli. 2019. "Simulation of the Filling Capability in Vane Pumps" Energies 12, no. 2: 283. https://doi.org/10.3390/en12020283
Note that from the first issue of 2016, this journal uses article numbers instead of page numbers. See further details here.