Article

Comparison of LSSVR, M5RT, NF-GP, and NF-SC Models for Predictions of Hourly Wind Speed and Wind Power Based on Cross-Validation

1
College of Hydrology and Water Resources, Hohai University, Nanjing 210098, China
2
State Key Laboratory of Hydrology-Water Resources and Hydraulic Engineering, Hohai University, Nanjing 210098, China
3
School of Hydropower and Information Engineering, Huazhong University of Science & Technology, Wuhan 430074, China
4
Faculty of Natural Sciences and Engineering, Ilia State University, Tbilisi 0162, Georgia
5
Faculty of Agricultural Engineering and Technology, PMAS-Arid Agriculture University, Rawalpindi 46300, Pakistan
*
Authors to whom correspondence should be addressed.
Energies 2019, 12(2), 329; https://doi.org/10.3390/en12020329
Submission received: 8 December 2018 / Revised: 15 January 2019 / Accepted: 16 January 2019 / Published: 21 January 2019
(This article belongs to the Special Issue Solar and Wind Energy Forecasting)

Abstract

:
Accurate predictions of wind speed and wind energy are essential in renewable energy planning and management. This study was carried out to test the accuracy of two different neuro fuzzy techniques (neuro fuzzy system with grid partition (NF-GP) and neuro fuzzy system with substractive clustering (NF-SC)), and two heuristic regression methods (least square support vector regression (LSSVR) and M5 regression tree (M5RT)) in the prediction of hourly wind speed and wind power using a cross-validation method. Fourfold cross-validation was employed by dividing the data into four equal subsets. LSSVR’s performance was superior to that of the M5RT, NF-SC, and NF-GP models for all datasets in wind speed prediction. The overall average root-mean-square errors (RMSE) of the M5RT, NF-GP, and NF-SC models decreased by 11.71%, 1.68%, and 2.94%, respectively, using the LSSVR model. The applicability of the four different models was also investigated in the prediction of one-hour-ahead wind power. The results showed that NF-GP’s performance was superior to that of LSSVR, NF-SC, and M5RT. The overall average RMSEs of LSSVR, NF-SC, and M5RT decreased by 5.52%, 1.30%, and 15.6%, respectively, using NF-GP.

1. Introduction

Currently, because of increasing environmental pollution and the energy crisis, wind energy is very important for the energy industry. The use of wind energy in electricity production is widespread, and new units with a nominal capacity of thousands of megawatts are being installed each year [1]. In 2017, according to the report of World Wind Energy Association, the total installed wind power capacity (WPC) of the whole world increased to 539 GW with recent installation of 52.6 GW [2], while the global growth rate was 10.8%. In the same year in China, the recently installed WPC was 15 GW, and the total capacity reached 163.67 GW with a 21.3% increment. Both the wind power capacity and the growth rate of China were larger than those of other countries in 2017. Wind energy is important to the economic and environmental operation of electric power systems due to its characteristics of clean and renewable energy; thus, such abilities make it a more attractive subject for researchers [3]. Nevertheless, wind power has innate features of randomness, instability, and intermittence. If the electricity produced by unstable wind power, especially in large quantities, is injected into the power grid, it will threaten the grid’s safety. This problem can be solved by accurately predicting wind power [4]. Precise wind energy prediction can help workers (at the power grid control system) know the precise amount of electric power produced by wind energy in a timely manner, and employ a sensible dispatching plan for other forms of energy to serve an appropriate electricity amount. It can be seen that the accurate prediction of wind power energy plays a vital role in the power grid’s safety and economical operation; it can also guide the normal operation of wind turbines and extend the equipment’s service life, while also reducing dependence on conventional expensive energy sources [5].
In recent years, many approaches were developed for wind speed and wind power prediction in the literature. These approaches can be considered in three categories: the physical approach, statistical approach, and soft computing approach. The principle of the physical approach is to find out the relationships among wind speed, temperature, pressure, and moisture and build thermodynamics formulas [6]. This kind of model is good for long-term wind speed prediction. However, the detection and collection of this information needs a lot of sensors, which can be very expensive. What is more, solving this kind of model requires complex calculations. In the physical approach, the models require a huge number of physical specifications [7]. These disadvantages limit the application of the physical model. In addition, physical models are selected for modeling long time horizons, while statistical approach models are more suitable for short time horizons [8]. The statistical approach tries to find inherent relationships within the actual data. Autoregressive models, such as autoregressive moving average (ARMA) and autoregressive integrated moving average (ARIMA) are commonly utilized for short-term wind speed prediction [9,10]. In recent years, some new and improved statistical models were proposed for wind prediction [11,12,13]. Kavasseri and Seetharaman [14] applied a fractional-ARIMA model in wind speed prediction of one- and two-day-ahead horizons in four potential wind generation sites located in North Dakota, United States of America (USA). The simulated results showed that fractional-ARIMA outperformed ARIMA when wind speed series showed long-memory characteristics. Erdem and Shi [15] proposed four approaches based on ARMA for the prediction of hourly wind speed obtained from two wind observation sites in North Dakota, USA, and satisfactory simulation results were obtained. In the literature, some authors also used space–time statistical models for wind energy prediction and found them better in comparison to simple statistical time-series models. However, such models provide less accurate prediction results because they cannot adequately address the nonlinearity of the data [16]. In addition, statistical models establish that any phenomenon can be expressed as a linear combination of its own past values, given that the studied stochastic process is stationary. However, it was documented that wind speed time series have a heteroscedastic, non-stationary, and highly nonlinear behavior. Soft computing methods, due to their excellent nonlinear processing capacity, which is very important for wind energy high-precision predictions, were adopted in this study [17,18,19].
In soft computing (SC) approaches, models use an auto learning process from previous data to recognize future trends. The most popular SC-based models are neural network (NN), neuro-fuzzy system (NF), support vector regression (SVR), least square support vector regression (LSSVR), and M5 regression tree (M5RT) models. Wind power production is mainly affected by wind speed fluctuations [20,21,22]. Thus, SC-based models overcome the shortcomings of statistical models in handling the nonlinearity of the data (e.g., wind speed) [23,24]. NF models were successfully utilized for modeling wind energy in the past few decades [25,26,27,28,29,30,31,32]. Liu et al. [26] predicted wind energy using NF and compared the results with a radial basis neural network (RBFNN), a backpropogation neural network (BPNN), and LSSVR. In the study, they firstly predicted wind energy using BPNN, RBFNN, and LSSVR, separately. Then, they used predicted results of these models as inputs to the NF model and found that NF provided more accurate prediction results in comparison to these models. Saleh et al. [27] used NF to predict wind energy using fuzzy cluster means for selecting the optimal fuzzy rules. They found that the proposed NF model provided good prediction accuracy in wind energy prediction. Giorgi et al. [28] used NF, NN, and ARMA models to predict wind power. Their results showed superior accuracy of the NF model compared to ARIMA and NN. Mohandes et al. [29] estimated the wind speed at different heights using the NF model. The results demonstrated that the NF model could be applied successfully in the estimation of wind speeds at higher heights, using the wind speed at lower heights as inputs. Johnson et al. [31] applied the NF model to predict five-minutes-ahead wind power. The results were compared with the persistence method, and it was found that NF provided better accuracy compared to the latter model. LSSVR was also extensively applied in solving many wind energy problems in recent years [33,34,35,36,37,38,39,40]. Zhang et al. [33] applied the LSSVR model for wind energy prediction, compared with the RBF model, and found that LSSVR provided better results than RBF. Wang et al. [34] used a model combination of ARIMA, extreme learning machine, SVR, and LSSVR for wind speed prediction. Liu and Li [36] predicted short-term wind speed and wind power by utilizing LSSVR with wavelet transform (WT). The results were compared with a recursive least square (RLS) regression model, and the LSSVR-WT gave better results than the RLS-WT model. Zhou et al. [38] made a study on the fine-tuning of SVR model parameters to predict wind speed for one-step-ahead horizon. The simulated results showed that the SVR models processed by fine-tuning outperformed the persistence model. Guo et al. [39] used the LSSVR model for wind speed prediction in the Hexi corridor of China. They compared the results of LSSVR with two statistical models, ARIMA and seasonal ARIMA (SARIMA), and also made a hybrid of LSSVR with these models. The results indicated that LSSVR alone provided better accuracy compared to the others. Yuan et al. [40] applied the LSSVR model with a gravitational search algorithm for the prediction of wind power. They compared the optimized LSSVR with SVR and NN, and LSSVR’s performance was superior to that of the other models. M5RT is not as popular as NF and LSSVR in the field of wind energy, and there are limited applications in the literature related to wind prediction. To our best knowledge, the applications of M5 regression trees in wind energy modeling were only reported by Kusiak et al. [41,42].
In this research, the applicability of LSSVR, M5RT, NF-SC, and NF-GP methods was investigated for predicting hourly wind speed (WS) and wind power (WP) time series using a cross-validation method. The cross-validation method and M5RT were used successfully in recent years for modeling hydrological time series [43,44]. Thus, the authors were compelled to apply these methods to wind time series to check their performance. It is worthy to note that there are no published studies in the literature that predict the wind speed and wind power by comparing LSSVR, M5RT, NF-SC, and NF-GP models while also using the cross-validation method. The paper is organized as follows: in Section 2, the basic structures of the LSSVR, M5RT, NF-SC, and NF-GP models are briefly explained. In Section 3, the data used in the analysis are described. In Section 4, two neuro-fuzzy and two heuristic regression models are applied for the prediction of hourly wind speed and wind power. The performance of the four models is analyzed with respect to three statistical indexes. Section 5 contains the concluding remarks. The models were applied using MATLAB software in the present study [45].

2. Methods Applied in the Research

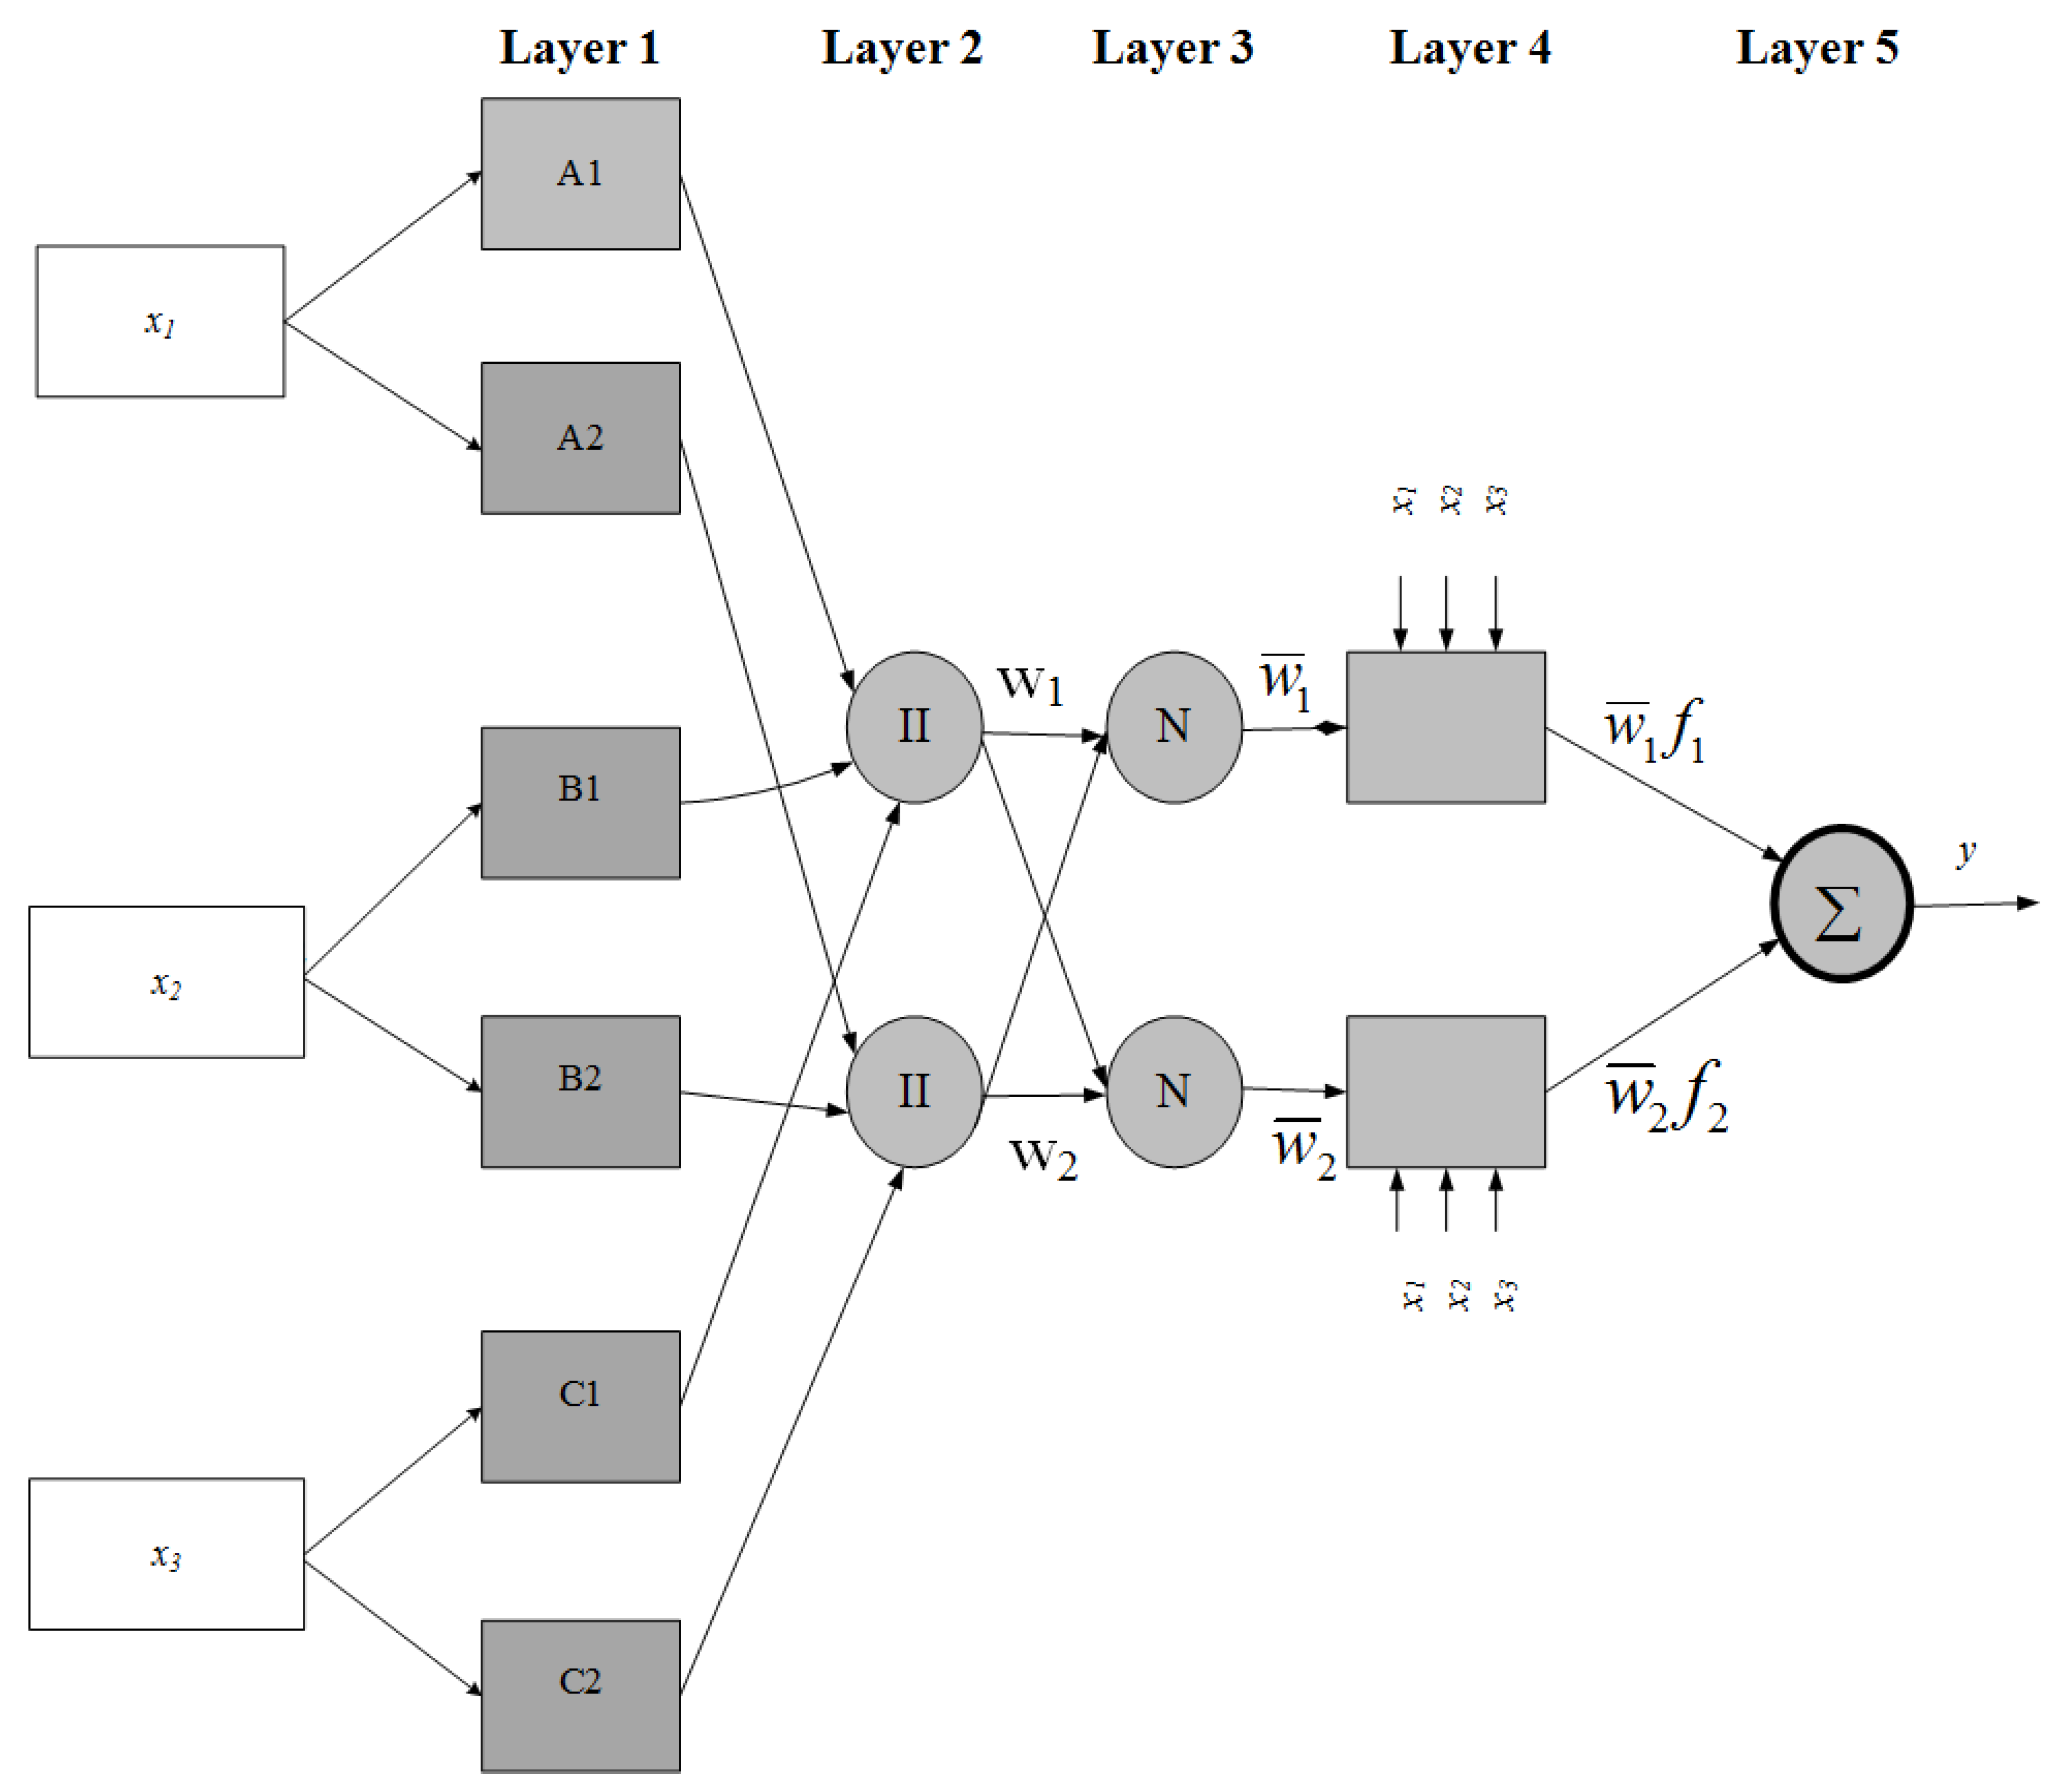
2.1. Neuro-Fuzzy System

The NF system has an architecture which consolidates fuzzy logic and NN. This method was introduced by Jang [46]. NF has an approximating capacity of any real continuous function on a compact set to any level of exactness [47]. NF utilizes an NN learning algorithm for constructing fuzzy if–then rules with proper membership functions (MFs) from the stipulated input–output pairs. Numerous sorts of inference systems exist in the literature [48,49,50]. Sugeno’s fuzzy structure of the NF system is computationally more accurate compared to other alternatives. This type of NF is the most common candidate for fuzzy modeling. It comprises five layers, as shown in Figure 1. More detailed information about NF can be obtained from Jang [46].
NF-GP: In this NF model, the grid partition (GP) is used. GP utilizes an axis-paralleled partition dependent on a predefined number of membership functions to divide the input space into rectangular sub-spaces. In NF-GP, by expanding the quantity of the input variables, the quantity of fuzzy rules also increases exponentially. For example, let us assume that we have t input variables and l MFs; then, the quantity of rules will be tl [51]. More information regarding NF-GP can be obtained from Abonyi et al. [52].
NF-SC: The NF sub-clustering model is an expansion of the mountain clustering approach proposed by Yager and Filev [53], which combines the NF model with the subtractive clustering method. This method was later modified by Chiu [54]. The benefit of NF-SC is that it takes out the need to indicate a grid resolution, thereby diminishing the computational complexity of the previous mountain clustering strategy. In the method, every data point is taken into account as a possible cluster center and the potential of this point is computed by its distance to every other point. A data point having many neighboring data points has a high potential value. The influential radius ought to be distinguished for determining the quantity of clusters. If a small radius is selected, it causes numerous clusters and, thus, requires numerous rules [55]. In this manner, the choice of appropriate radius is critical for data space clustering. Details of NF-SC were given by Chiu [56] and Cobaner [57].

2.2. Least Square Support Vector Regression
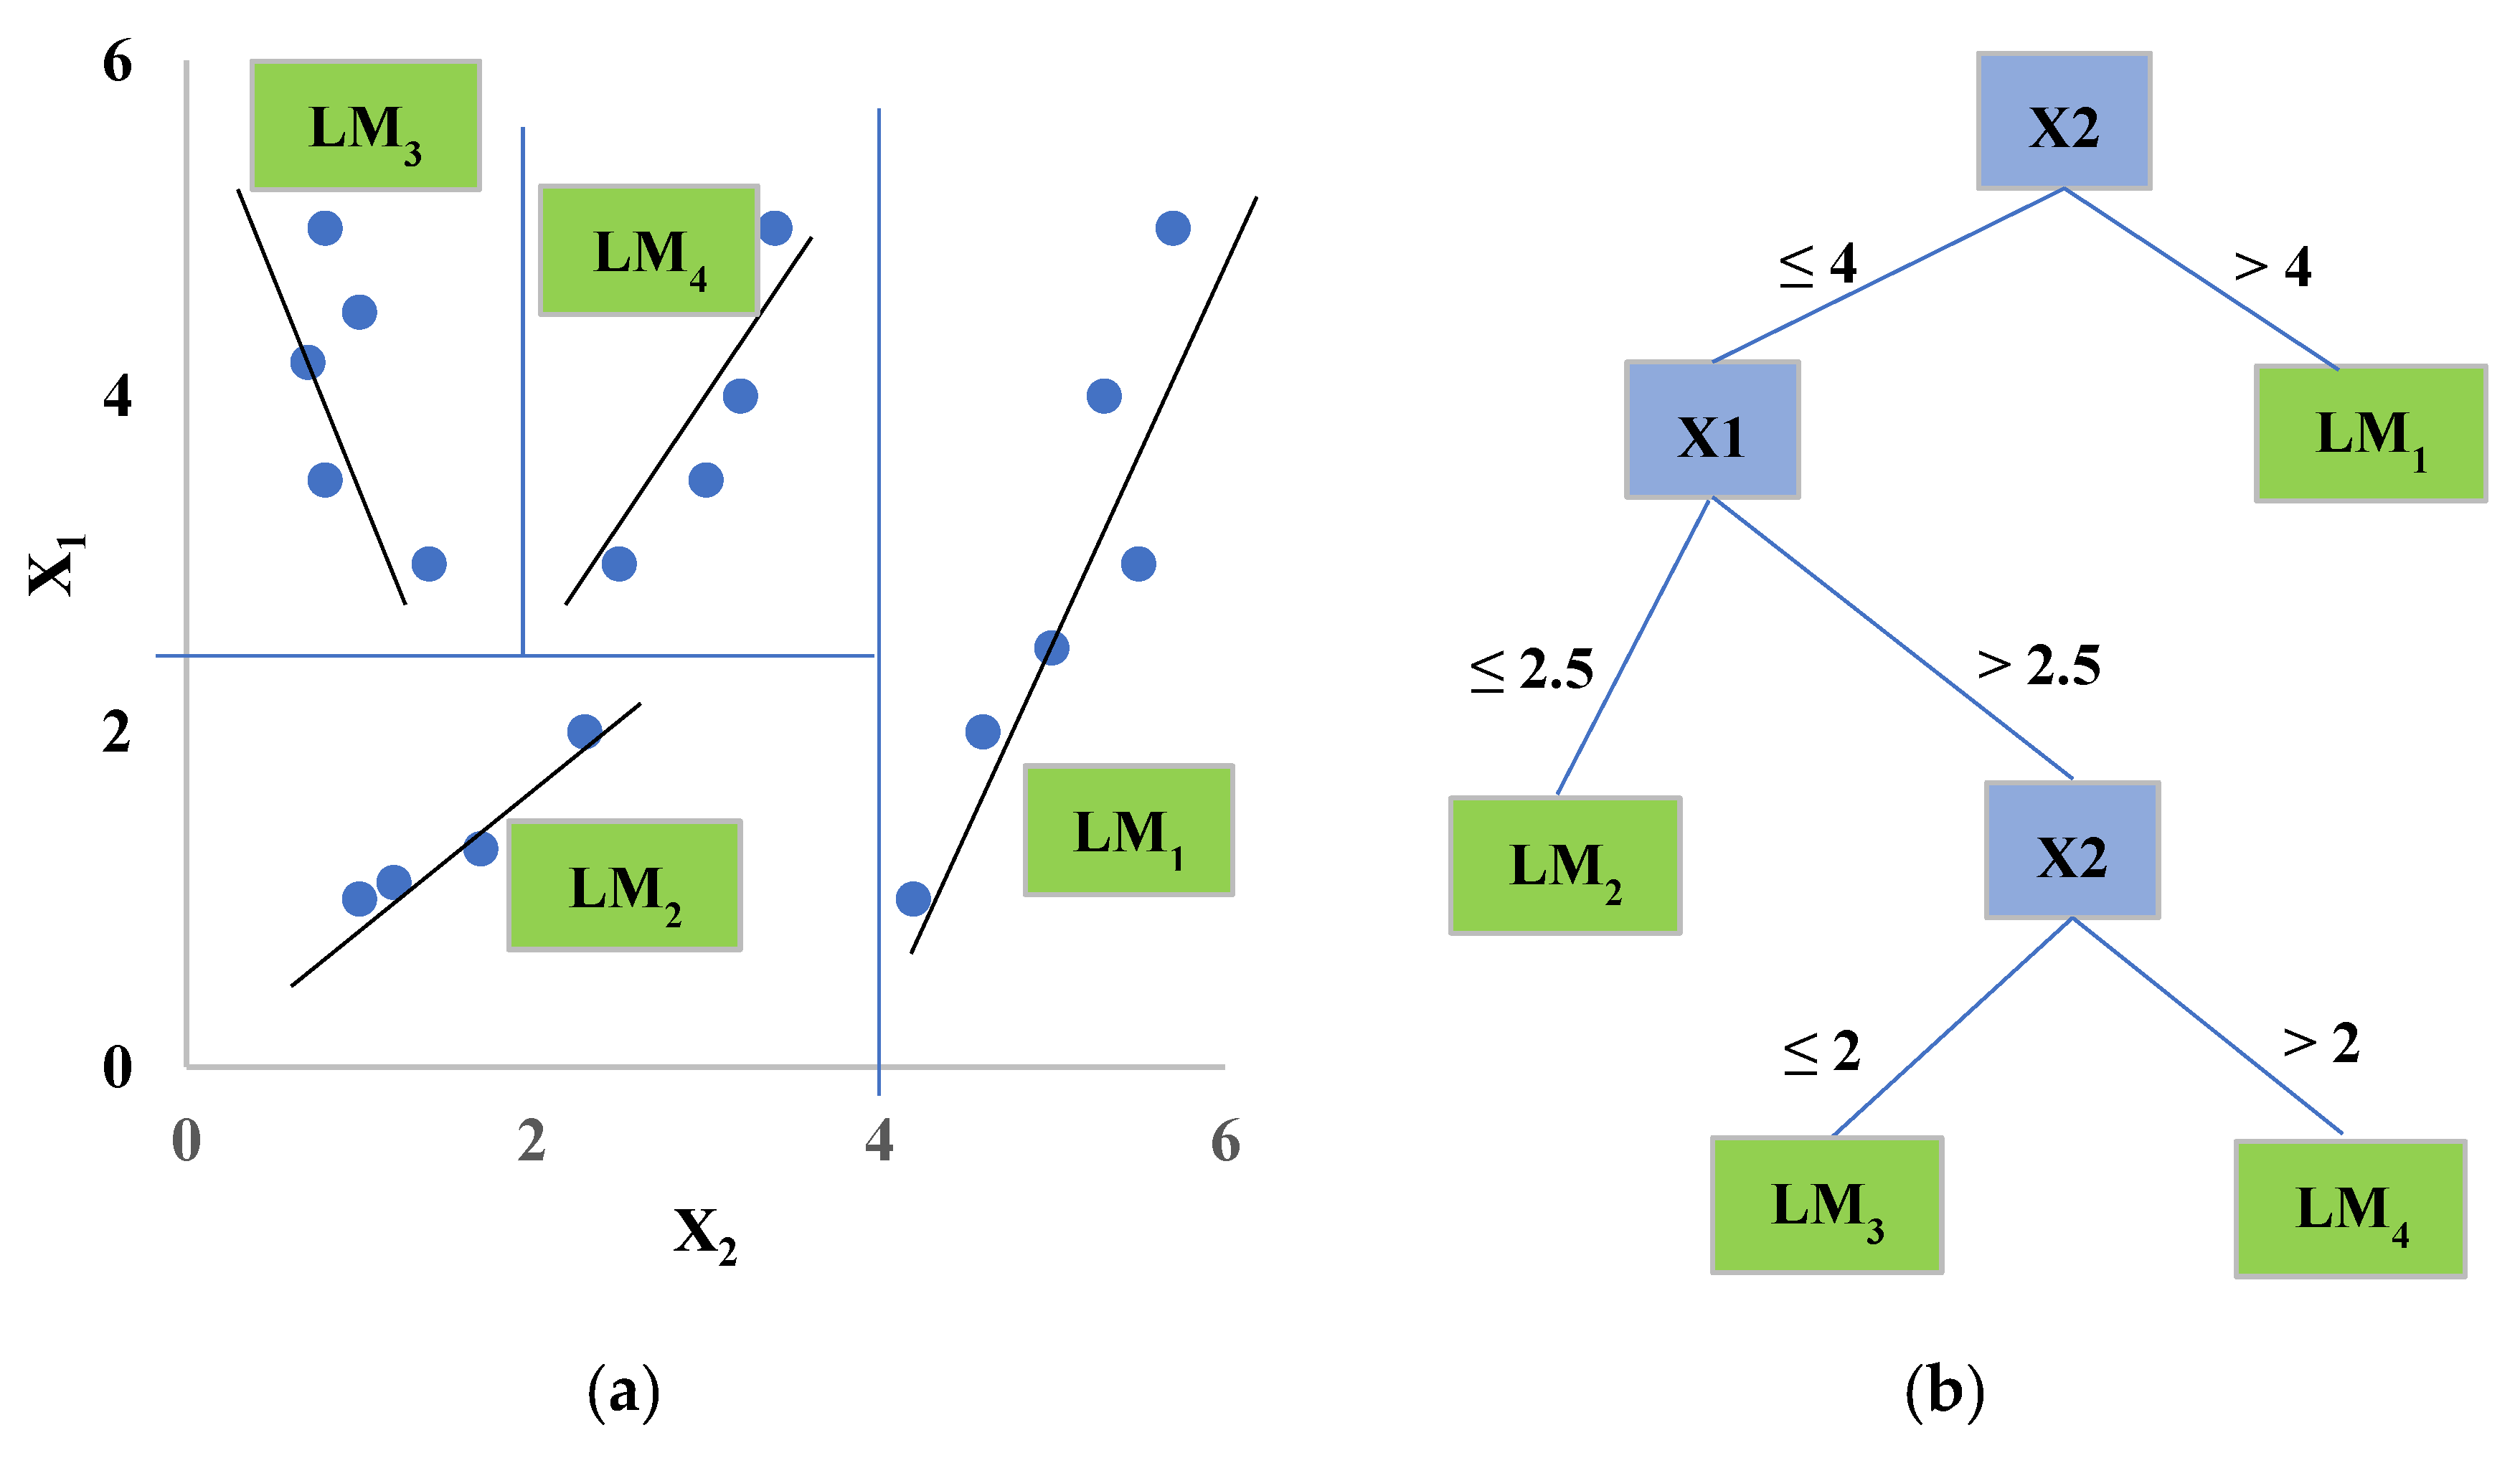
LSSVR, introduced by Suykens and Vandewalle [58], is an alteration of SVR to solve the issues of regression, classification, and function estimation [58,59,60,61]. SVR is a supervised machine learning technique proposed by Vapnik [62] and his co-workers in 1995. LSSVR has an advantage compared to SVR due to a reduction in the complexity of the optimization process, due to its use of linear equations instead of quadratic equations [63,64,65].
Figure 2 shows the procedure of LSSVR. By utilizing input xi (previous wind speed/wind power values) and output yi (current wind speed/wind power) time series, the LSSVR function can be expressed as shown below.
y ( x ) = ω T φ ( x ) + b ,
where x is the input, y indicates the output, ω is the weight vector with m dimension, φ is the mapping term, and b is the bias term [66,67]. The cost function of LSSVR can be expressed as
min J ( ω , e ) = 1 2 ω T ω + γ 2 i = 1 N e i 2 ,
which has the following constraints:
y i = ω T φ ( x i ) + b + e i   ( i = 1 ,   2 , , N ) ,
where γ and e i represent the regularization constant and the training error for x i , respectively.
To solve Equation (2), the Lagrange multiplier optimal programming method is employed to find the solutions of ω and e. By altering the constraint problem into an non-constraint problem, the objective function can be achieved [23]. The Lagrange function, L, can be calculated as
L ( ω , b , e , β ) = J ( ω , e ) i = 1 N β i { ω T φ ( x i ) + b + e i y i } ,
where β i is the Lagrange multiplier.
By applying the Karush–Kuhn–Tucker conditions [68], the optimal conditions can be computed by independently calculating the partial derivatives of Equation (4) with respect to ω , b , e , and β, as follows:
{ ω = i = 1 N β i φ ( x i ) + b i = 1 N β i = 0 β i = γ e i ω T φ ( x i ) + b + e i   y i = 0 .
The linear equations are obtained after the disposal of e i , and ω can be expressed as
( 0 E E T Ω + γ 1 E ) ( b β ) = ( 0 y ) .
After the elimination of e i and ω from Equation (4), the kernel trick is applied. According to Mercer’s condition, the Kernel trick can be expressed as k ( x , x i ) = f ( x ) T f ( x i ) , i = 1 ,   2 , ,   N . Thus, the LSSVR can be expressed as
f ( x ) = i = 1 N β i k ( x , x i ) + b .
k ( x , x i ) = e x p ( x x i 2 2 σ 2 ) .
Numerous kernel functions (e.g., linear, polynomial, radial basis (RBF), and spline functions) are utilized to solve regression problems [69,70]. The accuracies of LSSVR models developed using various kernel functions differ from each other. The kernel function type plays a vital role in constructing a highly accurate LSSVR model [71]. In the present study, the commonly used RBF was applied, and it is expressed in Equation (8).

2.3. M5RT

The M5 model regression tree (M5RT), first introduced by Quinlan [72], is a decision-tree-based regression approach. The M5 model regression tree changes over the nonlinear relationship between input and output parameters into a piecewise linear relationship. The M5RT splitting criterion is the difference principle of sample attributes (standard deviation reduction, SDR).
S D R = s d ( T ) | T i | | T | s d ( T i )
where T speaks to a set of examples that achieves the node, Ti is the subset of examples having the i-th result of the potential set; and sd speaks to the standard deviation [73,74].
In M5RT splitting, linear regression functions exist at the leaves instead of the class labels in decision trees. Model regression trees sum up the idea of simple regression trees [75]. Figure 3 shows how the space partition of M5RT should be possible. As observed from the figure, space partitioning of the model is a recursive space two-differentiation problem. In the first step, two differentiation rules (X2, X1) are developed; in the second step, a chopping process is employed. In the first step, the initial tree is built using the splitting criterion that minimizes the intra-subset variation in the class values down each branch, instead of maximizing the information gain at each interior node.
Model 5 regression trees are better than classic regression trees due to having a smaller size and containing fewer variables in the regression functions [76,77,78]. Details on M5RT can be obtained from Quinlan [72].

3. Dataset and Statistical Analysis

The hourly wind speed and wind power data from 1 January to 28 February 2015 were used in this study to forecast one-hour-ahead wind speed (WS) and wind power (WP). Data were obtained from the Sotavento Galicia (SG) wind farm, which is supported by the Galician Regional Autonomous Government (http://www.sotaventogalicia.com/en/technical-area/monitored-data). Five different technologies and nine different machine models are used in the wind farm, and it comprises 24 wind turbines. The rating of the power and the mean yearly generation of the SG farm are 17.56 MW and 33,364 MWh, respectively. This farm is associated with the substation at A Mourela in As Pontes through a 9-km high-volt energy feed line. In the region, the wind prevails on the east–west axis with an average WS of 6.41 m/s. The anemometric towers measure the WS and its direction at two heights, the pressure and temperature of air at the lower level, and the solar radiation and air density. The wind turbine supervisory control and data acquisition (SCADA) system measures the 10-min average data of wind speed, and the wind power generated cumulatively.
In this study, a cross-validation procedure was adopted for evaluating the methods. The cross-validation method is utilized in data-driven modeling because methods are highly dependent on data characteristics (e.g., distribution, complexity, correlation among the variables, etc.). Each SC method applied in this study highly depends on its control parameters, and these parameters are calibrated using measured input–output data. Therefore, applying various datasets and evaluating employed methods with respect to their average accuracy is a good approach. In the cross-validation procedure, the data were first divided into four equal parts. Three parts were then utilized for training and the remaining part was adopted for testing the methods. The process was repeated until each part of the data was utilized for testing. The summary statistics of hourly wind speed and wind power data are summarized in Table 1. In the table, M1, M2, M3, and M4 are the four equal parts of the entire data for the cross-validation process. As clearly seen from the table, wind speed and wind power generally indicate high positive skewness.

4. Results and Discussion

In the first part of the research, the prediction of hourly wind speed using previous values was carried out. Then, the accuracy of LSSVR, M5RT, NF-GP, and NF-SC was tested for hourly wind power prediction. Root-mean-square errors (RMSE), mean absolute errors (MAE), and coefficients of determination (R2) were used for evaluating the applied models. RMSE is one of the most commonly used statistics for measuring prediction error. MAE is another statistical index used for measuring the absolute error between observed and predicted values. R2 represents the degree of linear relationship between the predicted and observed data. These three indices are commonly utilized for evaluating model prediction performance in the field of wind energy [79,80,81,82,83]. Their equations are as follows:
RMSE =   1 N t = 1 N ( W O   W f ) 2 ,
MAE =   1 N t = 1 N | W O   W f | ,
R 2 = [ t = 1 N ( W O   W O ¯ ) ( W f   W f ¯ ) t = 1 N ( W O   W O ¯ ) 2 ( W f   W f ¯ ) 2 ] 2 ,
where N is the total number of observations, W O is the observed wind speed/wind power, W f is the predicted wind speed/wind power, W O ¯ is the average of observed wind speed/wind power, and W f ¯ is the average predicted wind speed/wind power.
Before application of the models, the input numbers should be decided to predict the wind speed/wind power. For this purpose, correlation analysis (CA) was employed to wind speed and wind power time series to observe the effect of antecedent wind speed and wind power values. Correlation analysis was successfully used in previous studies for the determination of inputs of data-driven models [84,85,86,87]. Sudheer et al. [84] used correlation analysis and determined the optimal inputs for an artificial neural network (ANN) in modeling the complex rainfall–runoff phenomenon. Kisi [85] determined the optimal inputs of ANN in modeling a nonlinear discharge–sediment relationship. Li and Shi [86] applied correlation analysis for the determination optimal inputs of ANN in wind speed forecasting. Zemzami and Benaabidate [87] applied correlation analysis for deciding the inputs of data-driven models in the prediction of daily streamflows. On the basis of correlation analysis employed in the current study, four previous values were selected for each variable as follows: (i) WSt−1; (ii) WSt−1, WSt−2; (iii) WSt−1, WSt−2, WSt−3; and (iv) WSt−1, WSt−2, WSt−3, WSt−4 for wind speed, and (i) WPt−1; (ii) WPt−1, WPt−2; (iii) WPt−1, WPt−2, WPt−3; and (iv) WPt−1, WPt−2, WPt−3, WPt−4 for wind power (see Table 2).

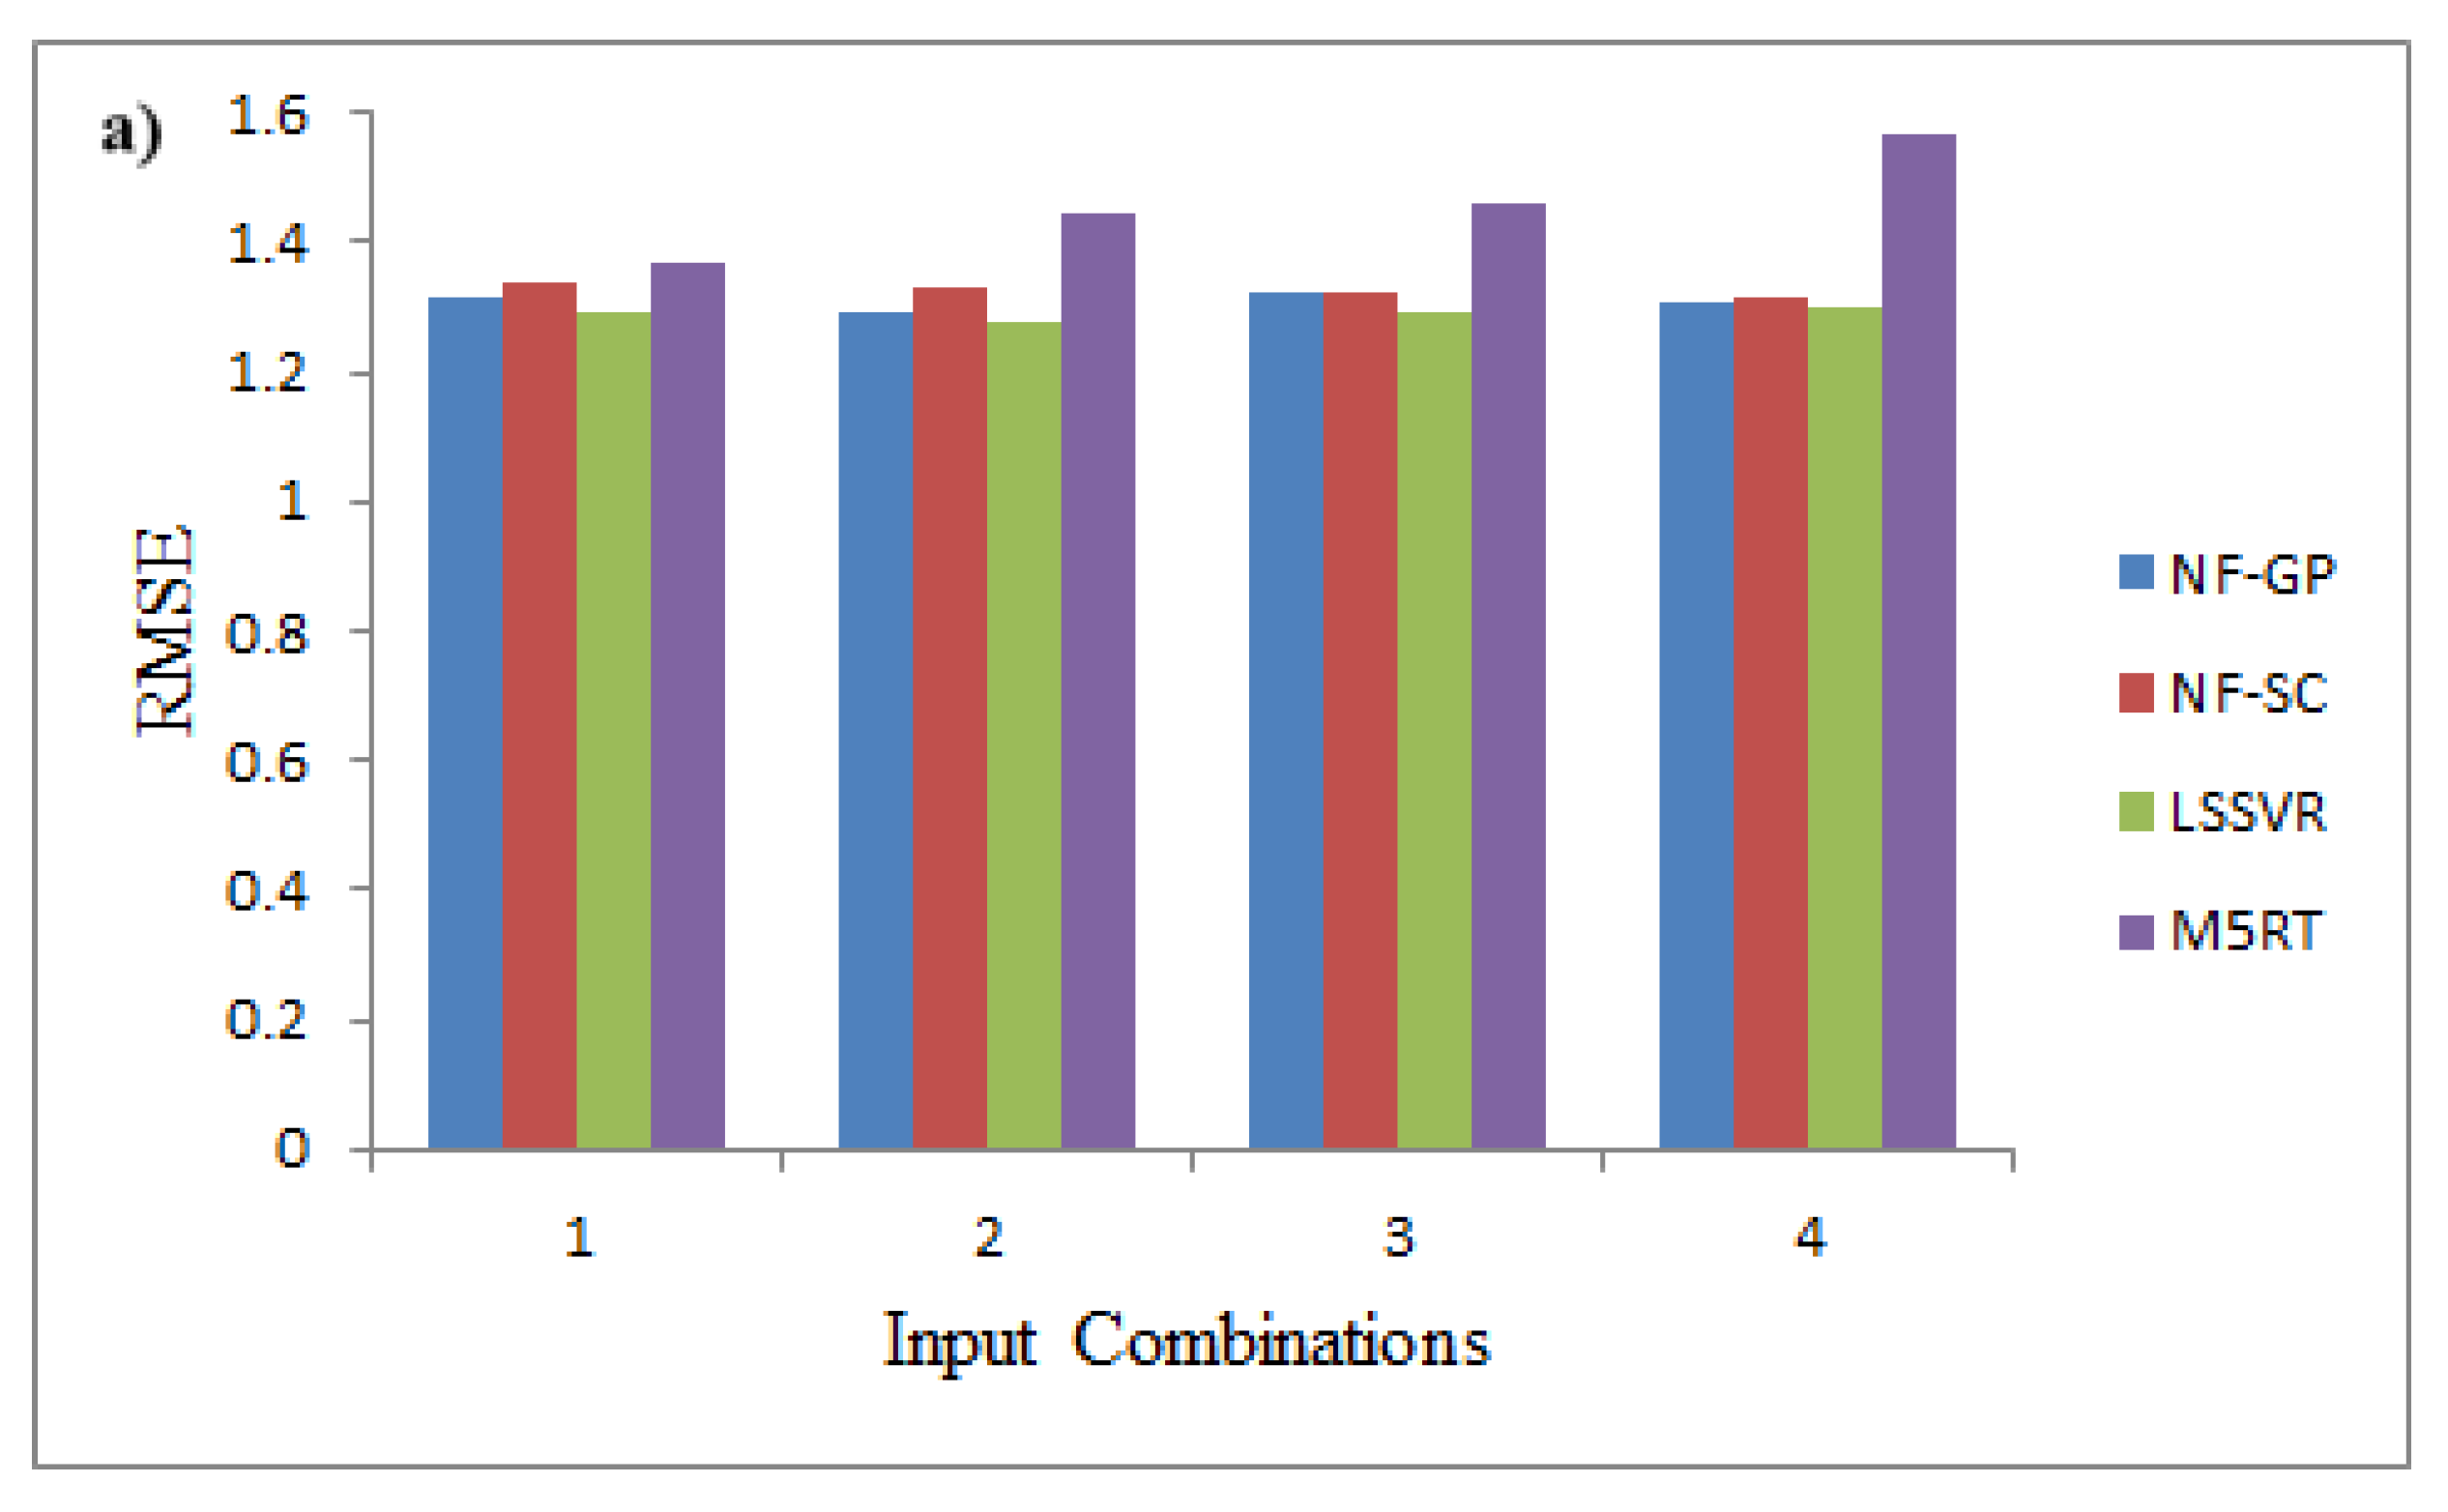
4.1. Hourly Wind Speed Prediction Using NF-SC, NF-GP, LSSVR, and M5RT Methods

The test results of the two NF methods are given in Table 2. It can be seen from the table that NF-SC and NF-GP models give different prediction results for different inputs and datasets. It can be observed from the average statistics that both methods provided the worst accuracy in the third input combination. Input combinations (ii) and (iv) had better accuracy compared to input combinations (i) and (iii) for all datasets. Input combination (ii) gave slightly better results for the NF-GP method compared to input combination (iv). For the NF-SC method, the performance of input combination (iv) was superior to the other combinations. It is obvious from the table that both methods had the worst accuracy for the M2 dataset. The reason for this may be the fact that the maximum and minimum wind speed values of the testing data set (WSmax = 23.13 m/s and WSmin = 3.71 m/s) were higher and lower, respectively, than the corresponding values of the training dataset (Table 1). From this, we can say that the trained NF-GP and NF-SC methods may have difficulties in extrapolating lower and higher values in the M2 case. It is clear that the NF-GP and NF-SC methods gave good results for the M4 dataset for all input combinations. It is obvious from Table 2 that the NF-GP method performed slightly better than the NF-SC method with respect to average performance criteria. The reason for this may be the fact that NF-GP includes much more fuzzy rules (or consequent parameters) than the NF-SC model, and this may provide more flexibility to this method in predicting wind speed.
The test statistics of the optimal LSSVR and M5RT models are summarized in Table 3. Here, input combinations (iii) and (iv) performed worse than the other combinations. Input combination (ii) gave slightly better results for the LSSVR method compared to input combination (i). For the M5RT method, input combination (i) outperformed the other combinations. Similar to the NF-GP and NF-SC methods, the LSSVR and M5RT methods had the worst accuracy for the M2 dataset due to the extrapolation difficulties as mentioned before. The best models of the LSSVR and M5RT methods were obtained for the M4 dataset using input combinations (ii) and (i), respectively. As observed from Table 3, LSSVR’s performance was superior to M5RT in one-hour-ahead wind speed prediction. The main reason for this might be the nonlinear structure of LSSVR compared to M5RT, which uses linear equations for simulation. Various control parameters were considered for each LSSVR model, and the optimal values that provided the minimum RMSE in the test period were selected for each dataset. The optimal parameters of LSSVR are reported in Table 4. Here, M1 shows model 1 whereas (100, 12) refers to the regularization constant and the RBF kernel’s width, respectively. The variation in control parameters of LSSVR with respect to RMSE is illustrated in Figure 4 for the M4 dataset.
According to the comparison of NF-GP, NF-SC, LSSVR, and M5RT methods (Table 2 and Table 3), it is clear that the LSSVR method outperformed the other models in predicting wind speed of the Sotavento Galicia wind farm. There was a slight difference between LSSVR and NF-GP methods. The M5RT method gave inferior results compared to the other methods. The linear structure of this method might be the reason for this, because wind speed fluctuations are highly nonlinear. The average errors of the NF-GP, NF-SC, LSSVR, and M5RT methods for each input combination are illustrated in Figure 5a,b. As observed from the figure, the average RMSE and MAE values of the LSSVR method were smaller than those of the other models for all input combinations. The LSSVR decreased the overall average RMSE error of NF-GP, NF-SC, and M5RT by 1.68%, 2.94%, and 11.71%, respectively.
Figure 6a–d show the observed and predicted hourly wind speeds using all methods for the M4 dataset with their best input combinations. It is apparent from the figure that NF-GP, NF-SC, and LSSVR methods provided higher R2 values for the M4 dataset. The figure also shows that the NF-GP model gave a slightly higher value of R2 than the LSSVR model. From the fitted line equations, however, it is apparent that the LSSVR model was closer to the ideal line compared to NF-GP (see the slope and bias coefficients in Figure 6). In fact, both models (LSSVR and NF-GP) had almost the same accuracy in wind speed forecasting.
The best (NF-GP) and worst (M5RT) models were also tested in wind speed prediction for multiple horizons (from one to five hours ahead) using the best dataset (M4). The new model results are compared in Table 5. As expected, the models’ accuracies deteriorated upon increasing the forecast horizons. From the table, it is clear that the NF-GP model’s performance was superior to that of the M5RT model in wind speed prediction for all considered horizons. It can be observed that increasing the input lag beyond two (combination (ii)) generally did not increases model accuracy. These results are parallel to previous studies [88,89,90,91,92]. This indicates the necessity of examining different input lags to obtain the most effective one in WS forecasting.

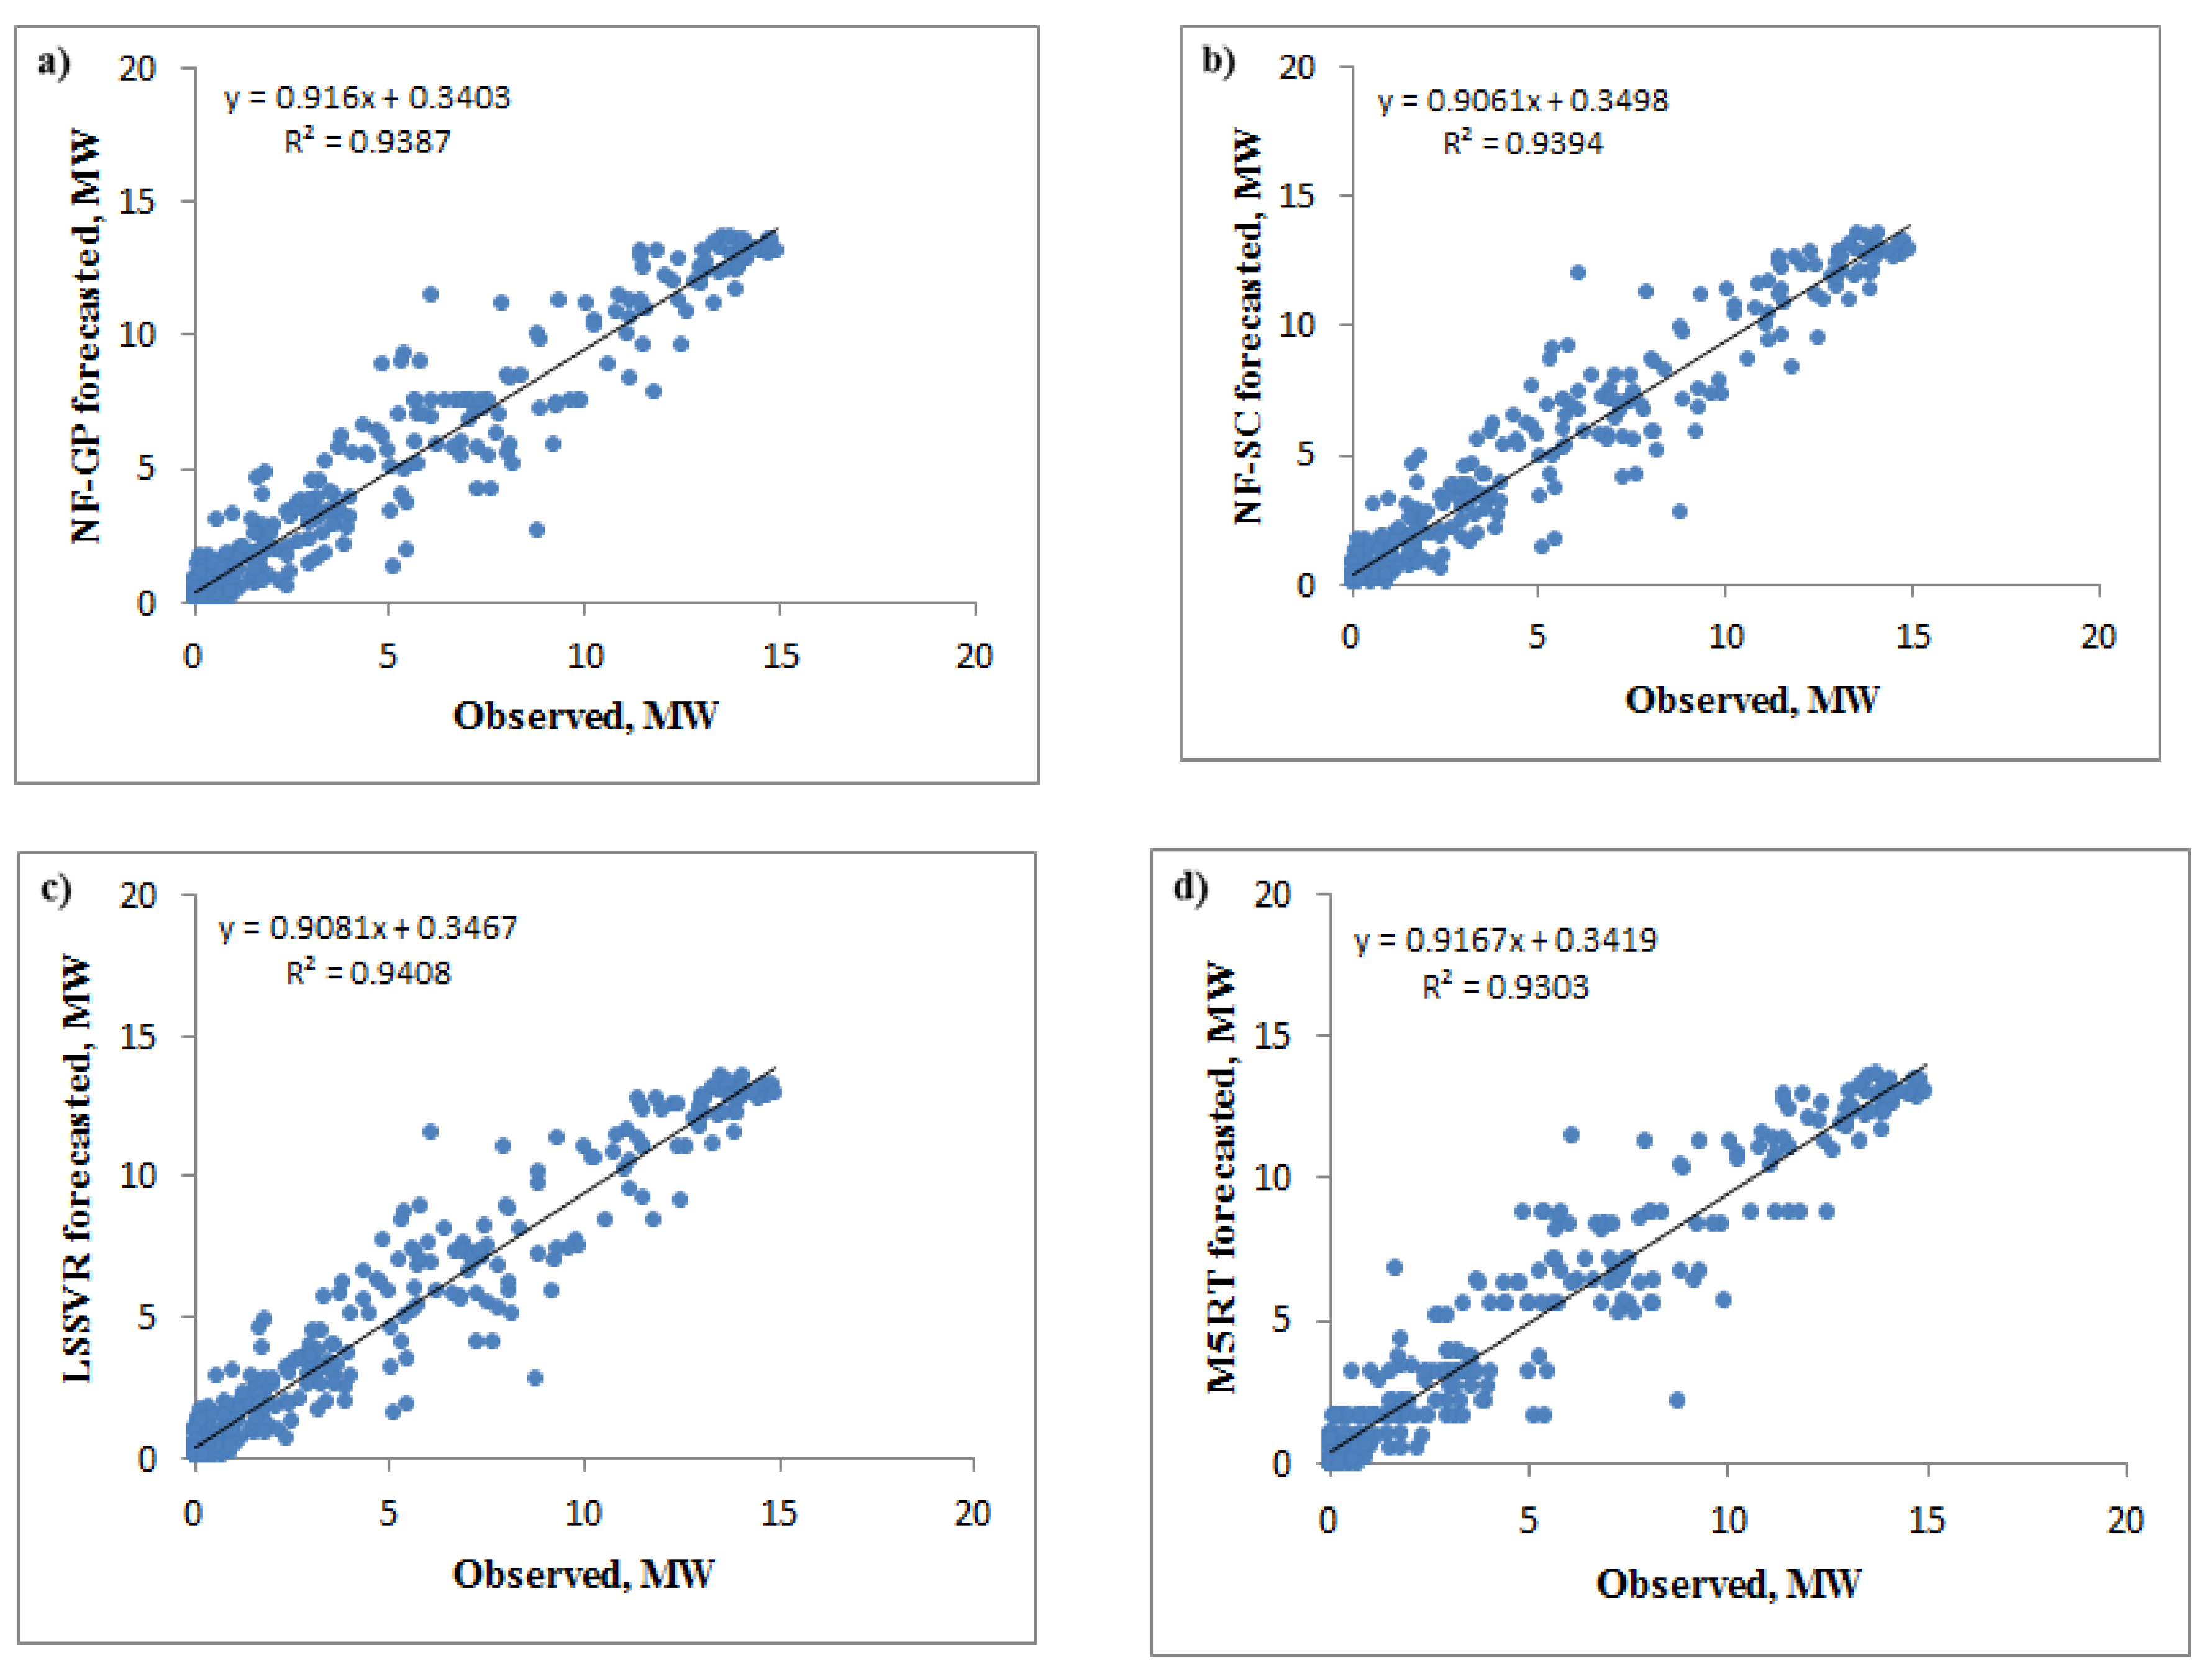
4.2. Hourly Wind Power Prediction Using NF-SC, NF-GP, LSSVR, and M5RT Methods

In this section, the accuracy of the four methods was examined in one-hour-ahead wind power prediction using previous values. Similar to the previous application, the cross-validation method was also utilized here. The best control parameters of the LSSVR models are reported in Table 6. The RMSE, MAE, and R2 statistics of the applied methods are reported in Table 7 and Table 8. As obviously seen from the tables, all methods also performed the worst for the M2 dataset, probably due to the extrapolation difficulties (WPmax = 15.85 MW), while they performed very well for the M4 dataset. It is also obvious from Table 7 and Table 8 that LSSVR, NF-GP, and NF-SC showed similar accuracy for different input combinations. However, the M5RT method gave worse results than the other methods for all datasets probably due to its linear structure.
Figure 7a,b show the average errors statistics of all the applied methods for different input combinations. As seen from the figure, NF-GP performed better than the other methods for all input combinations from the viewpoints of RMSE, MAE, and R2. Input combination (i) gave the best results for the NF-GP and M5RT models, whereas input combination (ii) provided the best accuracy for the LSSVR and NF-SC models. However, input combination (iii) gave the worst results for the NF-GP and NF-SC models, whereas input combination (iv) performed the worst for the LSSVR and M5RT models. The figure also reports that both NF methods performed slightly better than the LSSVR method for all input combinations. NF-GP decreased the overall average RMSE errors of the NF-SC, LSSVR, and M5RT methods by 1.30%, 4.52%, and 15.6%, respectively.
The observed and predicted hourly wind powers using all the methods are shown in Figure 8a–d for the M4 dataset. As apparent from the figure, the NF-GP and NF-SC models were in good agreement with the observed wind power data. The NF-GP and NF-SC methods provided higher R2 values for each dataset than the other methods. The figure also reports that the LSSVR method gave slightly higher values of R2 than the NF-GP method. The slope and bias coefficients for the NF-GP model were closer to the 1 and 0, respectively, compared to values for the LSSVR, NF-SC, and M5RT models. It can be clearly seen from the scatterplots that M5RT had more scattered predictions compared to LSSVR, NF-GP, and NF-SC.
Table 9 compares the best (NF-GP) and worst (M5RT) models in wind power prediction for multiple horizons (from one to five hours ahead) using the best dataset (M4). A decrease in model accuracy can also be clearly observed here with respect to an increase in forecast horizons. As seen from the test results, the NF-GP model outperformed the M5RT model for the all horizons and input combinations. It can be observed that increasing the input lag beyond one (combination (i)) generally did not improves the model accuracy. It is evident from the existing literature that increasing the input lag does not guarantee better forecast performance [93,94]. Sometimes, a high number of inputs has a negative impact on variance and causes a more complex model, leading to poor forecasting performance. Therefore, several values of input lag should be searched in the case of WS or WP forecasting using data-driven methods.

5. Conclusions

In this study, hourly wind speed and wind power time-series data were used to examine the prediction capability of the NF-GP, NF-SC, LSSVR, and M5RT methods. Three statistical indices (RMSE, MAE, and R2) were used for evaluating the performance of these methods. Four heuristic soft computing techniques were employed in one-hour-ahead wind speed prediction using previous values. The cross-validation method was employed to better evaluate the applied methods. The comparison results showed that LSSVR and NF-GP had almost same accuracy, and they performed better than the other soft computing models. LSSVR decreased the overall average RMSE error of NF-GP, NF-SC, and M5RT by 1.68%, 2.94%, and 11.71%, respectively. The capability of the four methods was also examined in the prediction of wind power using previous values. NF-GP decreased the overall average RMSE error of NF-SC, LSSVR, and M5RT by 1.30%, 4.52%, and 15.60%, respectively. The results indicated that LSSVR and NF-GP had almost the same accuracy and performed better compared to other methods. The overall results also indicated that the M5RT method gave the worst results in both applications. The results showed that hourly WS and WP could be successfully predicted using the NF-GP and LSSVR methods.
NF-GP and M5RT were also compared in forecasting WS and WP for multiple horizons (from one to five hours ahead). The results indicated the superior accuracy of the first model compared to the latter one. Only one or two input lags were found to be enough for multiple-hours-ahead WS and WP forecasting.
This study examined the ability of two different neuro-fuzzy methods, as well as the LSSVR and M5RT methods, in predicting hourly wind speed and wind power. The main limitation of this study was using limited data from one site. It is known that the effect of inter-annual variability on one-hour-ahead WS or WP prediction is relatively small. It will be better to get more training data from different years to address this effect. In fact, this is a limitation of the models presented in the current study. The NF-GP, NF-SC, LSSVR, and M5RT methods can be compared to each other using much more hourly data from other climatic regions. The accuarcy of the four methods may also be compared using evolutionary algorithms in the calibration of their control parameters.

Author Contributions

Conceptualization, R.M.A. and X.Y.; Methodology, R.M.A.; Software, R.M.A. and O.K.; Formal Analysis, R.M.A. and M.A.; Data Curation, X.Y.; Writing-Original Draft Preparation, R.M.A. and M.A.; Writing-Review & Editing, R.M.A. and O.K.; Visualization, B.L.; Supervision, Z.L. and B.L.; Funding Acquisition, Z.L.

Funding

This research was funded by the National Key R&D Program of China (2016YFC0402706), and the National Natural Science Foundation of China (41730750). The APC was funded by THR Postdoctoral Start-up-Research Program of Hohai University.

Acknowledgments

The data utilized in the present study were obtained from the website of the Sotavento Galicia wind farm. The author would like to thank the staff of the Sotavento Galicia wind farm. This work was supported by the National Key R&D Program of China (2016YFC0402706), and the National Natural Science Foundation of China (41730750).

Conflicts of Interest

The authors declare no conflict of interest.

References

  1. Angelis-Dimakis, A.; Biberacher, M.; Dominguez, J.; Fiorese, G.; Gadocha, S.; Gnansounou, E.; Guariso, G.; Kartalidis, A.; Panichelli, L.; Pinedo, I.; et al. Methods and tools to evaluate the availability of renewable energy sources. Renew. Sustain. Energy Rev. 2011, 15, 1182–1200. [Google Scholar] [CrossRef] [Green Version]
  2. World Wind Energy Association. Wind Power Capacity Reaches 539 GW, 52,6 GW Added in 2017. Available online: http:// wwindea.org/blog/2018/02/12/2017-statistics/ (accessed on 22 December 2018).
  3. Yuan, X.; Tian, H.; Yuan, Y.; Huang, Y.; Ikram, R.M. An extended NSGA-III for solution multi-objective hydro-thermal-wind scheduling considering wind power cost. Energy Convers. Manag. 2015, 96, 568–578. [Google Scholar] [CrossRef]
  4. Alessandrini, S.; Delle Monache, L.; Sperati, S.; Nissen, J. A novel application of an analog ensemble for short-term wind power forecasting. Renew. Energy 2015, 76, 768–781. [Google Scholar] [CrossRef]
  5. Yesilbudak, M.; Sagiroglu, S.; Colak, I. A new approach to very short term wind speed prediction using k-nearest neighbor classification. Energy Convers. Manag. 2013, 69, 77–86. [Google Scholar] [CrossRef]
  6. Jung, J.; Broadwater, R.P. Current status and future advances for wind speed and power forecasting. Renew. Sustain. Energy Rev. 2014, 31, 762–777. [Google Scholar] [CrossRef]
  7. Togelou, A.; Sideratos, G.; Hatziargyriou, N.D. Wind power forecasting in the absence of historical data. IEEE Trans. Sustain. Energy 2012, 3, 416–421. [Google Scholar] [CrossRef]
  8. Fortuna, L.; Nunnari, S.; Guariso, G. Fractal order evidences in wind speed time series. In Proceedings of the ICFDA’14 International Conference on Fractional Differentiation and Its Applications 2014, Catania, Italy, 23–25 June 2014; pp. 1–6. [Google Scholar]
  9. Torres, J.L.; Garcia, A.; De Blas, M.; De Francisco, A. Forecast of hourly average wind speed with arma models in navarre (spain). Sol. Energy 2005, 79, 65–77. [Google Scholar] [CrossRef]
  10. Cadenas, E.; Rivera, W. Wind speed forecasting in the south coast of Oaxaca, Mexico. Renew. Energy 2007, 32, 2116–2128. [Google Scholar] [CrossRef]
  11. Fortuna, L.; Guariso, G.; Nunnari, S. One Day Ahead Prediction of Wind Speed Class by Statistical Models. Int. J. Renew. Energy Res. 2016, 6, 1137–1145. [Google Scholar]
  12. Fortuna, L.; Nunnari, G.; Nunnari, S. A new fine-grained classification strategy for solar daily radiation patterns. Pattern Recognit. Lett. 2016, 81, 110–117. [Google Scholar] [CrossRef]
  13. Fortuna, L.; Nunnari, S.; Guariso, G. One day ahead prediction of wind speed class. In Proceedings of the 2015 International Conference on Renewable Energy Research and Applications (ICRERA), Palermo, Italy, 22–25 November 2015; pp. 965–970. [Google Scholar]
  14. Kavasseri, R.G.; Seetharaman, K. Day-ahead wind speed forecasting using f-ARIMA models. Renew. Energy 2009, 34, 1388–1393. [Google Scholar] [CrossRef]
  15. Erdem, E.; Shi, J. ARMA based approaches for forecasting the tuple of wind speed and direction. Appl. Energy 2011, 88, 1405–1414. [Google Scholar] [CrossRef]
  16. Osório, G.; Matias, J.; Catalão, J. Short-term wind power forecasting using adaptive neuro-fuzzy inference system combined with evolutionary particle swarm optimization, wavelet transform and mutual information. Renew. Energy 2015, 75, 301–307. [Google Scholar] [CrossRef]
  17. Muhammad Adnan, R.; Yuan, X.; Kisi, O.; Yuan, Y.; Tayyab, M.; Lei, X. Application of soft computing models in streamflow forecasting. In Proceedings of the Institution of Civil Engineers-Water Management, London, UK, 30 October 2017; pp. 1–12. [Google Scholar]
  18. Hu, J.; Wang, J.; Zeng, G. A hybrid forecasting approach applied to wind speed time series. Renew. Energy 2013, 60, 185–194. [Google Scholar] [CrossRef]
  19. Cadenas, E.; Rivera, W. Short term wind speed forecasting in La Venta, Oaxaca, México, using artificial neural networks. Renew. Energy 2009, 34, 274–278. [Google Scholar] [CrossRef]
  20. Calif, R.; Schmitt, F.G. Modeling of atmospheric wind speed sequence using a lognormal continuous stochastic equation. J. Wind Eng. Ind. Aerodyn. 2012, 109, 1–8. [Google Scholar] [CrossRef]
  21. Calif, R.; Schmitt, F.G.; Huang, Y. Multifractal description of wind power fluctuations using arbitrary order Hilbert spectral analysis. Phys. A Stat. Mech. Appl. 2013, 392, 4106–4120. [Google Scholar] [CrossRef]
  22. Duran Medina, O.; Schmitt, F.G.; Calif, R. Scaling forecast models for wind turbulence and wind turbine power intermittency. In Proceedings of the 19th EGU General Assembly Conference Abstracts, Vienna, Austria, 23–28 April 2017; Volume 19, p. 10374. [Google Scholar]
  23. Kisi, O.; Parmar, K.S. Application of least square support vector machine and multivariate adaptive regression spline models in long term prediction of river water pollution. J. Hydrol. 2016, 534, 104–112. [Google Scholar] [CrossRef]
  24. Kisi, O.; Shiri, J.; Karimi, S.; Adnan, R.M. Three different adaptive neuro fuzzy computing techniques for forecasting long-period daily streamflows. In Big Data in Engineering Applications; Springer: Singapore, 2018; pp. 303–321. [Google Scholar]
  25. Castellanos, F.; James, N. Average hourly wind speed forecasting with ANFIS. In Proceedings of the 11th American Conference on Wind Engineering, San Juan, Puerto Rico, 22–26 June 2009. [Google Scholar]
  26. Liu, H.; Tian, H.Q.; Li, Y.F. Comparison of new hybrid FEEMD-MLP, FEEMD-ANFIS, Wavelet Packet-MLP and Wavelet Packet-ANFIS for wind speed predictions. Energy Convers. Manag. 2015, 89, 1–11. [Google Scholar] [CrossRef]
  27. Saleh, A.E.; Moustafa, M.S.; Abo-Al-Ez, K.M.; Abdullah, A.A. A hybrid neuro-fuzzy power prediction system for wind energy generation. Int. J. Electr. Power Energy Syst. 2016, 74, 384–395. [Google Scholar] [CrossRef]
  28. De Giorgi, M.G.; Ficarella, A.; Tarantino, M. Error analysis of short term wind power prediction models. Appl. Energy 2011, 88, 1298–1311. [Google Scholar] [CrossRef]
  29. Mohandes, M.; Rehman, S.; Rahman, S. Estimation of wind speed profile using adaptive neuro-fuzzy inference system (ANFIS). Appl. Energy 2011, 88, 4024–4032. [Google Scholar] [CrossRef] [Green Version]
  30. Sfetsos, A. A comparison of various forecasting techniques applied to mean hourly wind speed time series. Renew. Energy 2000, 21, 23–35. [Google Scholar] [CrossRef]
  31. Johnson, P.L.; Negnevitsky, M.; Muttaqi, K.M. Short term wind power forecasting using adaptive neuro-fuzzy inference systems. In Proceedings of the 2007 Australasian Universities Power Engineering Conference, Perth, WA, Australia, 9–12 Decemver 2007. [Google Scholar]
  32. Liu, J.; Wang, X.; Lu, Y. A novel hybrid methodology for short-term wind power forecasting based on adaptive neuro-fuzzy inference system. Renew. Energy 2017, 103, 620–629. [Google Scholar] [CrossRef]
  33. Zhang, Y.; Wang, P.; Ni, T.; Cheng, P.; Lei, S. Wind power prediction based on LS-SVM model with error correction. Adv. Electr. Comput. Eng. 2017, 17, 3–9. [Google Scholar] [CrossRef]
  34. Wang, J.; Hu, J. A robust combination approach for short-term wind speed forecasting and analysis—Combination of the ARIMA (Autoregressive Integrated Moving Average), ELM (Extreme Learning Machine), SVM (Support Vector Machine) and LSSVM (Least Square SVM) forecasts using a GPR (Gaussian Process Regression) model. Energy 2015, 93, 41–56. [Google Scholar]
  35. Zhang, Q.; Lai, K.K.; Niu, D.; Wang, Q.; Zhang, X. A fuzzy group forecasting model based on least squares support vector machine (LS-SVM) for short-term wind power. Energies 2012, 5, 3329–3346. [Google Scholar] [CrossRef]
  36. Liu, D.; Li, H. Short-term wind speed and output power forecasting based on WT and LSSVM. In Proceedings of the 2009 International Conference on Information Engineering and Computer Science, Wuhan, China, 19–20 December 2009. [Google Scholar]
  37. Wang, X.; Li, H. One-month ahead prediction of wind speed and output power based on EMD and LSSVM. In Proceedings of the 2009 International Conference on Energy and Environment Technology, Guilin, China, 16–18 October 2009. [Google Scholar]
  38. Zhou, J.; Shi, J.; Li, G. Fine tuning support vector machines for short-term wind speed forecasting. Energy Convers. Manag. 2011, 52, 1990–1998. [Google Scholar] [CrossRef]
  39. Guo, Z.; Zhao, J.; Zhang, W.; Wang, J. A corrected hybrid approach for wind speed prediction in hexi corridor of china. Energy 2011, 36, 1668–1679. [Google Scholar] [CrossRef]
  40. Yuan, X.; Chen, C.; Yuan, Y.; Huang, Y.; Tan, Q. Short-term wind power prediction based on lssvm–gsa model. Energy Convers. Manag. 2015, 101, 393–401. [Google Scholar] [CrossRef]
  41. Kusiak, A.; Zheng, H.; Song, Z. Models for monitoring wind farm power. Renew. Energy 2009, 34, 583–590. [Google Scholar] [CrossRef]
  42. Kusiak, A.; Zheng, H.; Song, Z. Short-term prediction of wind farm power: A data mining approach. IEEE Trans. Energy Convers. 2009, 24, 125–136. [Google Scholar] [CrossRef]
  43. Adnan, R.M.; Yuan, X.; Kisi, O.; Adnan, M.; Mehmood, A. Stream Flow Forecasting of Poorly Gauged Mountainous Watershed by Least Square Support Vector Machine, Fuzzy Genetic Algorithm and M5 Model Tree Using Climatic Data from Nearby Station. Water Resour. Manag. 2018, 32, 4469–4486. [Google Scholar] [CrossRef]
  44. Adnan, R.M.; Yuan, X.; Kisi, O.; Anam, R. Improving Accuracy of River Flow Forecasting Using LSSVR with Gravitational Search Algorithm. Adv. Meteorol. 2017, 2017. [Google Scholar] [CrossRef]
  45. MATLAB. MATLAB 2012a for Windows. 2012. Available online: http://cn.mathworks.com/support/compilers/R2012a/win64.html/ (accessed on 20 June 2015).
  46. Jang, J.-S.R. ANFIS: Adaptive-network-based fuzzy inference system. IEEE Trans. Syst. Man Cybern. 1993, 23, 665–685. [Google Scholar] [CrossRef]
  47. Jang, J.-S.R.; Sun, C.-T.; Mizutani, E. Neuro-Fuzzy and Soft Computing: A Computational Approach to Learning and Machine Intelligence; Prentice-Hall: Englewood Cliffs, NJ, USA, 1997. [Google Scholar]
  48. Mamdani, E.H.; Assilian, S. An experiment in linguistic synthesis with a fuzzy logic controller. Int. J. Man-Mach. Stud. 1975, 7, 1–13. [Google Scholar] [CrossRef]
  49. Tsukamoto, Y. An approach to fuzzy reasoning method. Adv. Fuzzy Set Theory Appl. 1979, 137, 149. [Google Scholar]
  50. Takagi, T.; Sugeno, M. Fuzzy identification of systems and its applications to modeling and control. IEEE Trans. Syst. Man Cybern. 1985, 116–132. [Google Scholar] [CrossRef]
  51. Wei, M.; Bai, B.; Sung, A.H.; Liu, Q.; Wang, J.; Cather, M.E. Predicting injection profiles using anfis. Inf. Sci. 2007, 177, 4445–4461. [Google Scholar] [CrossRef]
  52. Abonyi, J.; Andersen, H.; Nagy, L.; Szeifert, F. Inverse fuzzy-process-model based direct adaptive control. Math. Comput. Simul. 1999, 51, 119–132. [Google Scholar] [CrossRef] [Green Version]
  53. Yager, R.R.; Filev, D.P. Approximate clustering via the mountain method. EEE Trans. Syst. Man Cybern. 1994, 24, 1279–1284. [Google Scholar] [CrossRef]
  54. Chiu, S. Extracting fuzzy rules for pattern classification by cluster estimation. In Proceedings of the Sixth International Fuzzy Systems Association World Congress, Sao Paulo, Brazil, 1–4 July 1995. [Google Scholar]
  55. Chiu, S.L. Fuzzy model identification based on cluster estimation. J. Intell. Fuzzy Syst. 1994, 2, 267–278. [Google Scholar]
  56. Chiu, S. Extracting fuzzy rules from data for function approximation and pattern classification. In Fuzzy Information Engineering: A Guided Tour of Applications; John Wiley&Sons: Hoboken, NJ, USA, 1997. [Google Scholar]
  57. Cobaner, M. Evapotranspiration estimation by two different neuro-fuzzy inference systems. J. Hydrol. 2011, 398, 292–302. [Google Scholar] [CrossRef]
  58. Suykens, J.A.; Vandewalle, J. Least squares support vector machine classifiers. Neural Process. Lett. 1999, 9, 293–300. [Google Scholar] [CrossRef]
  59. Qin, L.-T.; Liu, S.-S.; Liu, H.-L.; Zhang, Y.-H. Support vector regression and least squares support vector regression for hormetic dose–response curves fitting. Chemosphere 2010, 78, 327–334. [Google Scholar] [CrossRef]
  60. Kumar, M.; Kar, I. Non-linear HVAC computations using least square support vector machines. Energy Convers. Manag. 2009, 50, 1411–1418. [Google Scholar] [CrossRef]
  61. Kisi, O. Streamflow forecasting and estimation using least square support vector regression and adaptive neuro-fuzzy embedded fuzzy c-means clustering. Water Resour. Manag. 2015, 29, 5109–5127. [Google Scholar] [CrossRef]
  62. Vapnik, V.N. Introduction: Four periods in the research of the learning problem. In The Nature of Statistical Learning Theory; Springer: New York, NY, USA, 1995; pp. 1–14. [Google Scholar]
  63. Ghiasi, M.M.; Shahdi, A.; Barati, P.; Arabloo, M. Robust modeling approach for estimation of compressibility factor in retrograde gas condensate systems. Ind. Eng. Chem. Res. 2014, 53, 12872–12887. [Google Scholar] [CrossRef]
  64. Mahmoodi, N.M.; Arabloo, M.; Abdi, J. Laccase immobilized manganese ferrite nanoparticle: Synthesis and LSSVM intelligent modeling of decolorization. Water Res. 2014, 67, 216–226. [Google Scholar] [CrossRef]
  65. Guo, X.; Ma, X. Mine water discharge prediction based on least squares support vector machines. Min. Sci. Technol. (China) 2010, 20, 738–742. [Google Scholar] [CrossRef]
  66. Moreno-Salinas, D.; Chaos, D.; Besada-Portas, E.; López-Orozco, J.A.; de la Cruz, J.M.; Aranda, J. Semiphysical modelling of the nonlinear dynamics of a surface craft with LS-SVM. Math. Probl. Eng. 2013, 2013. [Google Scholar] [CrossRef]
  67. Cao, S.-G.; Liu, Y.-B.; Wang, Y.-P. A forecasting and forewarning model for methane hazard in working face of coal mine based on LS-SVM. J. China Univ. Min. Technol. 2008, 18, 172–176. [Google Scholar] [CrossRef]
  68. Fletcher, R. Practical Methods of Optimization; John Wiley & Sons: New York, NY, USA, 1987; p. 80. [Google Scholar]
  69. Gunn, S.R. Support Vector Machines for Classification and Regression; ISIS Technical Report; University of Southampton: Southampton, UK, 1998; p. 14. [Google Scholar]
  70. Muller, K.-R.; Mika, S.; Ratsch, G.; Tsuda, K.; Scholkopf, B. An introduction to kernel-based learning algorithms. IEEE Trans. Neural Netw. 2001, 12, 181–201. [Google Scholar] [CrossRef] [PubMed] [Green Version]
  71. Guo, X.; Yang, J.; Wu, C.; Wang, C.; Liang, Y. A novel LS-SVMs hyper-parameter selection based on particle swarm optimization. Neurocomputing 2008, 71, 3211–3215. [Google Scholar] [CrossRef]
  72. Quinlan, J.R. Learning with continuous classes. In 5th Australian Joint Conference on Artificial Intelligence; World Scientific: Singapore, 1992. [Google Scholar]
  73. Zahiri, A.; Azamathulla, H.M. Comparison between linear genetic programming and M5 tree models to predict flow discharge in compound channels. Neural Comput. Appl. 2014, 24, 413–420. [Google Scholar] [CrossRef]
  74. Witten, I.H.; Frank, E. Data Mining: Practical Machine Learning Tools and Techniques; Morgan Kaufmann: Burlington, MA, USA, 2005. [Google Scholar]
  75. Sattari, M.T.; Pal, M.; Apaydin, H.; Ozturk, F. M5 model tree application in daily river flow forecasting in sohu stream, turkey. Water Resour. 2013, 40, 233–242. [Google Scholar] [CrossRef]
  76. Singh, K.K.; Pal, M.; Singh, V. Estimation of mean annual flood in Indian catchments using backpropagation neural network and M5 model tree. Water Resour. Manag. 2010, 24, 2007–2019. [Google Scholar] [CrossRef]
  77. Solomatine, D.P.; Xue, Y. M5 model trees and neural networks: Application to flood forecasting in the upper reach of the Huai River in China. J. Hydrol. Eng. 2004, 9, 491–501. [Google Scholar] [CrossRef]
  78. Pal, M. M5 model tree for land cover classification. Int. J. Remote Sens. 2006, 27, 825–831. [Google Scholar] [CrossRef]
  79. Velo, R.; López, P.; Maseda, F. Wind speed estimation using multilayer perceptron. Energy Convers. Manag. 2014, 81, 1–9. [Google Scholar] [CrossRef]
  80. Han, L.; Romero, C.E.; Yao, Z. Wind power forecasting based on principle component phase space reconstruction. Renew. Energy 2015, 81, 737–744. [Google Scholar] [CrossRef]
  81. Cassola, F.; Burlando, M. Wind speed and wind energy forecast through Kalman filtering of Numerical Weather Prediction model output. Appl. Energy 2012, 99, 154–166. [Google Scholar] [CrossRef]
  82. Men, Z.; Yee, E.; Lien, F.-S.; Wen, D.; Chen, Y. Short-term wind speed and power forecasting using an ensemble of mixture density neural networks. Renew. Energy 2016, 87, 203–211. [Google Scholar] [CrossRef]
  83. Zhao, P.; Wang, J.; Xia, J.; Dai, Y.; Sheng, Y.; Yue, J. Performance evaluation and accuracy enhancement of a day-ahead wind power forecasting system in china. Renew. Energy 2012, 43, 234–241. [Google Scholar] [CrossRef]
  84. Sudheer, K.P.; Gosain, A.K.; Ramasastri, K.S. A data-driven algorithm for constructing artificial neural network rainfall-runoff models. Hydrol. Process. 2002, 16, 1325–1330. [Google Scholar] [CrossRef]
  85. Kisi, Ö. Constructing neural network sediment estimation models using a data-driven algorithm. Math. Comput. Simul. 2008, 79, 94–103. [Google Scholar] [CrossRef]
  86. Li, G.; Shi, J. On comparing three artificial neural networks for wind speed forecasting. Appl. Energy 2010, 87, 2313–2320. [Google Scholar] [CrossRef]
  87. Zemzami, M.; Benaabidate, L. Improvement of artificial neural networks to predict daily streamflow in a semi-arid area. Hydrol. Sci. J. 2016, 61, 1801–1812. [Google Scholar] [CrossRef]
  88. Hong, Y.Y.; Wu, C.P. Hour-ahead wind power and speed forecasting using market basket analysis and radial basis function network. In Proceedings of the 2010 International Conference on Power System Technology, Hangzhou, China, 24–28 October 2010. [Google Scholar]
  89. Sanikhani, H.; Kisi, O. River flow estimation and forecasting by using two different adaptive neuro-fuzzy approaches. Water Resour. Manag. 2012, 26, 1715–1729. [Google Scholar] [CrossRef]
  90. Chang, F.J.; Chang, Y.T. Adaptive neuro-fuzzy inference system for prediction of water level in reservoir. Adv. Water Resour. 2006, 29, 1–10. [Google Scholar] [CrossRef]
  91. Awchi, T.A. River discharges forecasting in northern Iraq using different ANN techniques. Water Resour. Manag. 2014, 28, 801–814. [Google Scholar] [CrossRef]
  92. Yaseen, Z.M.; Jaafar, O.; Deo, R.C.; Kisi, O.; Adamowski, J.; Quilty, J.; El-Shafie, A. Stream-flow forecasting using extreme learning machines: A case study in a semi-arid region in Iraq. J. Hydrol. 2016, 542, 603–614. [Google Scholar] [CrossRef]
  93. Shi, J.; Guo, J.; Zheng, S. Evaluation of hybrid forecasting approaches for wind speed and power generation time series. Renew. Sustain. Energy Rev. 2012, 16, 3471–3480. [Google Scholar] [CrossRef]
  94. Zhang, D.; Peng, X.; Pan, K.; Liu, Y. A novel wind speed forecasting based on hybrid decomposition and online sequential outlier robust extreme learning machine. Energy Convers. Manag. 2019, 180, 338–357. [Google Scholar] [CrossRef]
Figure 1. The neuro-fuzzy (NF) model architecture for wind speed/power prediction.
Energies 12 00329 g001
Figure 2. The least square support vector regression (LSSVR) model for wind speed/power prediction.
Energies 12 00329 g002
Figure 3. The M5 model regression tree (M5RT) model for wind speed/power prediction. LM indicates linear model in the figure. (a) splitting the input space X1 x X2 by M5RT algorithm; (b) diagram of model tree with four linear regression models at the leaves.
Energies 12 00329 g003
Figure 4. The variation in test root-mean-square error (RMSE) vs. the regularization constant and radial basis function (RBF) kernel for the LSSVR model for input combination (i) and the M1 dataset of the wind speed time series.
Energies 12 00329 g004
Figure 5. Average (a) RMSE and (b) mean absolute error (MAE) of the applied models in predicting wind speed for all input combinations.
Energies 12 00329 g005aEnergies 12 00329 g005b
Figure 6. The scatterplots of the observed and predicted wind speeds using the (a) NF grid partition (NF-GP),(b) NF sub-clustering (NF-SC), (c) LSSVR, and (d) M5RT models for the M4 dataset.
Energies 12 00329 g006
Figure 7. Average (a) RMSE and (b) MAE of the applied models in predicting wind power using all models for all input combinations.
Energies 12 00329 g007
Figure 8. The scatterplots of the observed and predicted wind powers using the (a) NF-GP, (b) NF-SC, (c) LSSVR, and (d) M5RT models for the M4 dataset.
Energies 12 00329 g008
Table 1. Statistics of hourly wind speed and wind power time series.
DatasetData TypeMinMaxMeanSDSkewness
M1 (15 February 1:00 a.m. to 28 February 12:00 a.m.)Wind Speed (ms−1)
Wind Power (MW)
3.62
0
16.24
14.32
9.42
6.11
2.48
3.57
0.14
0.06
M2 (1 February 1:00 a.m. to 14 February 12:00 a.m.)Wind Speed (ms−1)
Wind Power (MW)
3.71
0
23.13
15.85
9.45
5.65
3.42
4.51
0.61
0.45
M3 (16 January 1:00 a.m. to 31 January 12:00 a.m.)Wind Speed (ms−1)
Wind Power (MW)
1.98
0
21.95
14.91
8.08
3.86
4.45
4.66
0.92
1.05
M4 (1 January 1:00 a.m. to 15 January 12:00 a.m.)Wind Speed (ms−1)
Wind Power (MW)
0.36
0
20.79
14.33
6.31
2.67
4.21
3.81
1.26
1.63
Table 2. The neuro-fuzzy grid partition (NF-GP) and neuro-fuzzy sub-clustering (NF-SC) model results in wind speed prediction. RMSE—root-mean-square error; MAE—mean absolute error; R2—coefficient of determination.
StatisticsCross-ValidationTest DatasetInput (i)Input (ii)Input (iii)Input (iv)Mean
NF-GP
RMSEM115 February to 28 February1.3541.3491.3611.3511.354
M21 February to 14 February1.4961.4591.5051.4891.487
M316 January to 31 January1.3631.3061.3691.3491.347
M41 January to 15 January1.0591.0461.0711.0551.058
Mean 1.3181.2901.3271.3111.311
MAEM115 February to 28 February0.9750.9440.9910.9620.968
M21 February to 14 February1.0321.0181.1011.0261.044
M316 January to 31 January0.9260.9130.9970.9210.939
M41 January to 15 January0.8460.8290.8360.8390.838
Mean 0.9450.9260.9810.9370.947
R2M115 February to 28 February0.81780.81850.81630.81650.817
M21 February to 14 February0.80990.81920.79360.81640.809
M316 January to 31 January0.89860.91040.89310.90880.903
M41 January to 15 January0.90620.91890.89050.91480.907
Mean 0.85810.86680.84840.86410.859
NF-SC
RMSEM115 February to 28 February1.3341.3251.3181.3151.323
M21 February to 14 February1.4971.4921.4881.4861.491
M316 January to 31 January1.3641.3251.3321.3121.333
M41 January to 15 January1.1731.1671.1681.1581.167
Mean 1.3421.3271.3271.3181.328
MAEM115 February to 28 February0.9250.9270.9270.8960.919
M21 February to 14 February1.0421.0451.0581.0391.046
M316 January to 31 January0.9580.9450.9530.9410.949
M41 January to 15 January0.8520.8390.8540.8360.845
Mean 0.9750.9720.9790.9590.971
R2M115 February to 28 February0.81520.81780.81720.81810.817
M21 February to 14 February0.80940.80960.81150.81040.810
M316 January to 31 January0.83630.90780.90370.90930.889
M41 January to 15 January0.90590.91350.91270.91430.912
Mean 0.84170.86220.86130.86300.857
* The bold numbers indicate the best accuracy.
Table 3. The least square support vector regression (LSSVR) and M5 model regression tree (M5RT) model results in wind speed prediction.
StatisticsCross-ValidationTest DatasetInput (i)Input (ii)Input (iii)Input (iv)Mean
LSSVR
RMSEM115 February to 28 February1.3191.3051.3271.3291.320
M21 February to 14 February1.4611.4541.4681.4711.464
M316 January to 31 January1.3271.3011.3151.3231.317
M41 January to 15 January1.0581.0411.0631.0651.057
Mean 1.2911.2751.2931.2971.289
MAEM115 February to 28 February0.9280.9220.9430.9480.935
M21 February to 14 February1.0311.0141.0231.0271.024
M316 January to 31 January0.9220.9130.9260.9310.923
M41 January to 15 January0.8270.8250.8280.8300.828
Mean 0.9270.9190.9300.9340.927
R2M115 February to 28 February0.81850.81890.81800.81710.8181
M21 February to 14 February0.81090.81530.81170.80950.8119
M316 January to 31 January0.90100.90560.90510.89310.9012
M41 January to 15 January0.90650.91690.90900.89810.9076
Mean 0.85920.86420.86100.85450.8597
M5RT
RMSEM115 February to 28 February1.3771.4061.3981.4981.420
M21 February to 14 February1.5971.7151.7261.7821.705
M316 January to 31 January1.4261.4531.4941.6981.518
M41 January to 15 January1.0681.2131.2191.2871.197
Mean 1.3671.4471.4591.5661.460
MAEM115 February to 28 February0.9851.0211.0191.1011.032
M21 February to 14 February1.1361.2261.2251.261.212
M316 January to 31 January0.9891.0231.0511.1031.042
M41 January to 15 January0.8360.9580.961.0210.944
Mean 0.9871.0571.0641.1211.057
R2M115 February to 28 February0.81610.77360.76850.74640.7762
M21 February to 14 February0.78400.75400.75180.74020.7575
M316 January to 31 January0.89690.89180.88690.85430.8825
M41 January to 15 January0.89790.89310.89360.87980.8911
Mean 0.84870.82810.82520.80520.8268
* The bold numbers indicate the best accuracy.
Table 4. Parameters of LSSVR for each input combination for wind speed prediction.
Cross-ValidationTest DatasetInput Combination
(i)(ii)(iii)(iv)
M115 February 1:00 a.m. to 28 February 12:00 a.m.(100, 12)(100, 20)(90, 7)(100, 7)
M21 February 1:00 a.m. to 14 February 12:00 a.m.(30, 2)(100, 5)(30, 2)(100, 20)
M316 January 1:00 a.m. to 31 January 12:00 a.m.(60, 3)(100, 65)(100, 24)(100, 3)
M41 January 1:00 a.m. to 15 January 12:00 a.m.(70, 6)(100, 4)(50, 10)(80, 100)
Table 5. NF-GP and M5RT results in wind speed prediction for multiple horizons.
Forecasting HorizonInput Combination
(i)(ii)(iii)(iv)
RMSEMAERMSEMAERMSEMAERMSEMAE
NF-GP
11.0590.8361.0460.8291.0710.8361.0550.839
21.8301.3541.8271.3472.0141.4951.8411.384
32.2081.6742.2001.6642.4661.8352.2571.738
42.5071.9222.4661.9092.7702.0432.5652.003
52.7432.1112.7022.1093.0122.3332.7502.166
M5RT
11.0680.8461.2130.9581.2190.9601.2871.021
21.9361.4291.9771.4302.1841.6052.5841.597
32.2161.6812.3871.8362.5821.9262.8211.852
42.5742.0272.6612.0432.8562.1502.9472.067
52.7632.1712.9382.2393.0312.4353.1042.623
* The bold numbers indicate the best accuracy.
Table 6. Parameters of LSSVR for each input combination for wind power prediction.
Cross-ValidationTest DatasetInput Combination
(i)(ii)(iii)(iv)
M115 February 1:00 a.m. to 28 February 12:00 a.m.(100, 1)(100, 3)(100, 1)(100, 7)
M21 February 1:00 a.m. to 14 February 12:00 a.m.(31, 3)(100, 18)(100, 10)(90, 7)
M316 January 1:00 a.m. to 31 January 12:00 a.m.(28, 1)(100, 28)(80, 10)(10, 10)
M41 January 1:00 a.m. to 15 January 12:00 a.m.(100, 1)(40, 10)(100, 10)(10, 100)
Table 7. NF-GP and NF-SC results in wind power prediction.
StatisticsCross-ValidationTest DatasetInput (i)Input (ii)Input (iii)Input (iv)Mean
NF-GP
RMSEM115 February to 28 February1.3021.3461.4261.4131.372
M21 February to 14 February1.5451.5521.5721.581.562
M316 January to 31 January1.1381.1461.1631.1501.149
M41 January to 15 January1.0601.0661.0701.0741.068
Mean 1.2611.2781.3081.3041.288
MAEM115 February to 28 February1.0471.0671.0851.0811.070
M21 February to 14 February1.0621.0861.0961.0911.084
M316 January to 31 January0.7470.7530.7760.7620.760
M41 January to 15 January0.6860.6990.7020.6920.695
Mean 0.8860.9010.9150.9070.902
R2M115 February to 28 February0.88260.87180.86650.87740.875
M21 February to 14 February0.84660.84010.83530.84460.842
M316 January to 31 January0.91930.90570.89790.90460.907
M41 January to 15 January0.93870.93810.93720.93150.936
Mean 0.89680.88890.88420.88950.890
NF-SC
RMSEM115 February to 28 February1.4111.4031.4541.4291.424
M21 February to 14 February1.5671.5541.5871.5921.575
M316 January to 31 January1.1391.1281.1671.1581.148
M41 January to 15 January1.0611.0711.0831.0751.073
Mean 1.2951.2891.3231.3141.305
MAEM115 February to 28 February1.0571.0711.0911.0791.075
M21 February to 14 February1.1011.0891.1131.1101.103
M316 January to 31 January0.7610.7590.7940.7840.775
M41 January to 15 January0.7110.6960.6910.6850.696
Mean 0.9080.9040.9220.9150.912
R2M115 February to 28 February0.87940.88140.87640.87570.878
M21 February to 14 February0.84490.83330.83640.84140.839
M316 January to 31 January0.91070.90910.90770.90780.909
M41 January to 15 January0.93840.93940.93850.93590.938
Mean 0.89340.89080.88980.89020.891
* The bold numbers indicate the best accuracy.
Table 8. LSSVR and M5RT results in wind power prediction.
StatisticsCross-ValidationTest DatasetInput (i)Input (ii)Input (iii)Input (iv)Mean
LSSVR
RMSEM115 February to 28 February1.4081.3861.5171.5961.477
M21 February to 14 February1.5551.541.5881.5921.569
M316 January to 31 January1.1601.1431.1761.2711.188
M41 January to 15 January1.1481.1121.1651.2191.161
Mean 1.3181.2951.3621.4201.349
MAEM115 February to 28 February1.0851.0791.1611.1731.125
M21 February to 14 February1.0971.0921.1021.1221.103
M316 January to 31 January0.7820.7720.7890.8150.790
M41 January to 15 January0.6980.6810.6860.7050.693
Mean 0.9160.9060.9350.9540.927
R2M115 February to 28 February0.87730.88110.8760.87550.877
M21 February to 14 February0.83620.84550.8230.80910.828
M316 January to 31 January0.90950.91320.90640.89820.907
M41 January to 15 January0.93840.94080.93780.92620.936
Mean 0.89040.89520.88580.87730.887
M5RT
RMSEM115 February to 28 February1.5551.7341.7651.7961.713
M21 February to 14 February1.5951.6641.7341.8671.715
M316 January to 31 January1.2311.3341.4381.4711.369
M41 January to 15 January1.1711.3051.3621.4011.310
Mean 1.3881.5091.5751.6341.526
MAEM115 February to 28 February1.1281.1621.2111.3131.204
M21 February to 14 February1.1691.2911.3151.3401.279
M316 January to 31 January0.7860.8780.9360.9650.891
M41 January to 15 January0.6860.7880.8080.8450.782
Mean 0.9421.0301.0681.1161.039
R2M115 February to 28 February0.87540.86470.85400.83200.857
M21 February to 14 February0.81430.77580.77140.76230.781
M316 January to 31 January0.90610.88470.87410.86730.883
M41 January to 15 January0.93030.91860.90670.90230.914
Mean 0.88150.86100.85160.84100.859
* The bold numbers indicate the best accuracy.
Table 9. NF-GP and M5RT results in wind speed prediction for multiple horizons.
Forecasting HorizonInput Combination
(i)(ii)(iii)(iv)
RMSEMAERMSEMAERMSEMAERMSEMAE
NF-GP
11.0600.6861.0660.6921.0740.7021.0700.699
21.5721.0071.5841.0301.5961.0441.5901.033
31.8571.2901.8581.3021.8731.3091.8661.304
42.0731.5012.0981.5062.1031.5192.1011.513
52.2851.6772.3171.6832.3211.6912.3191.689
M5RT
11.1710.7021.3050.7881.3620.8081.4010.845
21.6171.0231.6501.0621.7441.1361.7981.129
31.9291.3112.0681.3942.2401.4882.1131.442
42.1671.5272.3101.5512.2181.5692.3421.615
52.4711.7372.6291.7752.6831.8252.8421.914
* The bold numbers indicate the best accuracy.

