Influence of Laser Energy Deposition Conditions on the Drag of A Sphere in Supersonic Flow

1
Daewoo Shipbuilding & Marine Engineering Co., Ltd., Siheung 15011, Korea
2
Department of aerospace engineering, Inha University, Incheon 22212, Korea
*
Author to whom correspondence should be addressed.
Energies 2019, 12(20), 3914; https://doi.org/10.3390/en12203914
Submission received: 23 September 2019
/
Revised: 12 October 2019
/
Accepted: 15 October 2019
/
Published: 16 October 2019
Abstract
:In the present study, a two-dimensional axisymmetry unsteady numerical simulation that implements high-frequency laser energy deposition was performed to understand its influence on drag reduction in supersonic flow. The energy deposition was modeled as the increase of the temperature inside the focal region. The drag reduction characteristics were investigated by changing the frequency of the deposition, the distance between the focus of the deposition and the body, and the power of the laser. The results showed that drag could be reduced by 60% when there was a single energy deposition. As the operating frequency increased, up to 70% drag reduction was obtained. When the laser energy was deposed more frequently than 75 kHz, the normalized drag converged regardless of the deposition scenario, which resulted from the multiple interactions between the blast wave and the reflected shock. A similar tendency was found from the results of various focal distances. According to the results of this study on the effect of the deposition energy, it is expected to achieve the same effect as with low energy by increasing the frequency of the deposition.
1. Introduction
Shock waves generated around a supersonic vehicle are closely related to performance, as well as noise, operational efficiency, and thermal load. Research has been conducted on various techniques to create a favorable flight environment around an aircraft or to avoid detrimental operating conditions for several decades. In a supersonic flow, the residence time of the flow is very short, but the aerodynamic load is high, so it is not possible to control the flow through mechanically moving components, as in a subsonic region. At the early age of cutting-edge design optimization studies [1,2,3], fixed structures like aero spikes [4,5,6,7] were suggested. However, the structure has other problems, like excessive thermal loads at the tip, additional loads at off-design operations, and induced moment during the maneuvering flight. Since then, methods for reducing the load of a vehicle with a non-intrusive structure, such as gas-injection techniques, have been proposed. However, there are a lot of limitations on the size and the weight of a payload for the injection system. Recently, another technology to change the flow field without a permanent structure has been suggested. Electricity, microwaves, or lasers have been considered as methods of delivering energy to the flow, and the basic concept is changing the flow structure by using the blast wave generated from the local energy addition. The energy deposition on the flow creates a region of high temperature and pressure, which results in a blast wave. The blast wave moves along the domain and, at the same time, expands in a radial direction. Then it changes the flow structure to intersect with shock waves generated around the object. It is known that the change of the shock structure directly affects the load by modifying the pressure distribution. However, since a high power is required to generate blast waves, it has been implemented as a pulsed operation rather than a continuous utilization.
An experimental study by Adelgren et al. [8,9,10] found that the maximum pressure on the surface of a sphere was reduced by about 40% by using single-pulse energy deposition. While the previous study examined the effects of single-pulse laser deposition in the supersonic region, Hong et al. [11] used a blunt body placed in the hypersonic region (M = 5). They investigated the effects of the interaction between the energy deposition and the bow shock on the pressure, the heat flux, and the total drag. They also performed a numerical analysis that gives a reduction on the pressure, the temperature, and the drag by 50%, 75%, and 81%, respectively, at high deposition frequency. From the experiment of Lashkov et al. [12], which varied the size of an obstacle and the position of the discharge, it has been confirmed that a larger model is more influenced by the same microwave discharge. In subsequent studies [13], both numerical and experimental studies have shown that a decrease in the resistance, resulting from a microwave energy deposition, increases proportionally to the Mach number in the range from 1.6 to 8. Azarova et al. [14] performed a numerical simulation to study the effects of symmetrical and asymmetrical deposition of microwave filament. Two different phenomena on the large scale pulsations were obtained, depending on the radius. Kolesnichenko et al. [15] studied the interaction of microwave discharge with a shock wave in supersonic flow, both numerically and experimentally. By applying two types of energy deposition, the scaling laws of interaction intensity were found. The result also suggested that the synchronized discharge with the formation of a thin channel helped to efficiently reduce the drag. Liu et al. [16] studied the effect of energy deposition on mixing performance. The numerical simulation of the parallel jet showed that periodic deposition at 10 kHz could enhance mixing due to the density gradient generated by the off-axis deposition. Zheltovodov [17] et al. performed 2D unsteady simulation with blunt and sharp conical bodies in supersonic flow. They demonstrated the possibility of drag reduction by changing the length of the frequency of the energy source. Before Iwakawa et al. [18], a majority of studies had performed a numerical analysis to examine the effects of the freestream Mach number and the power of the deposed energy. However, they examined the effects through experiments using a repetitive laser. The results suggested that the effectiveness of deposition was proportional to the Mach number, and the drag reduction was shown to increase as the normalized diameter decreased at the same freestream and deposition conditions. Azarova et al. [19,20,21] deposed energy on hemisphere-cylinder and hemisphere-cone-cylinder shaped objects using a microwave and a laser to simulate more realistic supersonic vehicles. The results showed that a decrease in the resistance was mainly caused by the rarefaction wave and the vortex near the reflection region. In particular, they postulated that residence time of hot spots caused by the energy deposition in the flow had a direct effect on the decrease in the drag force. In addition, Hoang et al. [22,23] applied energy deposition to study shock oscillation characteristics of double cones by controlling shock wave boundary layer interaction. They also conducted an experiment that applied energy deposition directly to a supersonic inlet, preventing either a flow separation or a spillage, and reducing shock oscillation to stabilize the flow inside the following systems. In addition, Pehlivanoglu et al. [24] conducted a study to predict the rate of decrease in the strength of the sonic boom reaching the ground according to the location of energy deposition in front of the aircraft, to reduce noise caused by the sonic boom.
Considering that femtosecond lasers have become available, as in the recent experimental study by Elias et al. [25], research using energy deposition is expected to become more active with the development of laser equipment technology. As described above, experimental and analytical studies [8,9,10,11,12,13,14,15,16,17,18,19,20,21,22,23,24,25,26,27,28,29,30] on flow control using energy deposition have been widely conducted, but the repetition frequency or the power is limited in most studies. In this study, the effects of the frequency, the focal distance, and the power of laser energy deposition on the drag of the spherical body are investigated, using a high-power laser with a frequency up to the 150 kHz.
2. Analysis Methods
2.1. Numerical Techniques
In this study, the commercial software STAR-CCM+ (13.06-R8, SIEMENS PLM, Plano, TX, USA) is used. To simulate the interaction between the blast wave and the bow shock in front of the sphere, two-dimensional axisymmetric Reynolds-averaged Navier-Stokes (RANS) analysis is performed. Inviscid flux is calculated by AUSM+ (Advection Upstream Splitting Method) technique and MUSCL (Monotonic Upwind Scheme for Conservation Laws) third-order interpolation is applied to compute the flux at the interface. Also, the Menter’s k-w SST (Menter’s Shear Stress Transport) model is implemented as a turbulence model. A second-order implicit temporal discretization scheme is applied. A residual of continuity is required below 1 × 10⁻³ for each time step. The effect of a laser deposition is modeled as the heat source in the specific location. Considering that a laser deposition takes place within 10 ns, it is reasonable to assume that flow properties, other than the temperature, remain constant during the deposition process. However, since it is difficult to determine the actual absorption ratio, it is necessary to perform recursive simulations by assuming the temperature change. The temperature rise inside the deposition region is defined as the step function.
Before applying the energy deposition model, a steady solution with a bow shock wave has been obtained. When investigating the shape of the energy deposition region in previous studies [31,32], it was considered to be slightly asymmetric. So, in the present study, the shape of the focus was assumed to be an ellipsoid. Also, the parametric study was performed by changing the major and minor axis lengths until a similar result with the experiment was obtained.
2.2. Validation of Applied Methods
2.2.1. Computational Domain and Flow Conditions
Before examining the effects of a laser deposition under various conditions, the experiment [8] which deposed a single-pulse laser in front of the sphere was simulated. In the experiment, the amount of energy is 283 mJ/pulse and the estimated volume of the focusing region is about 3 mm3, so care must be taken to ensure that the laser deposition area contains enough grids.
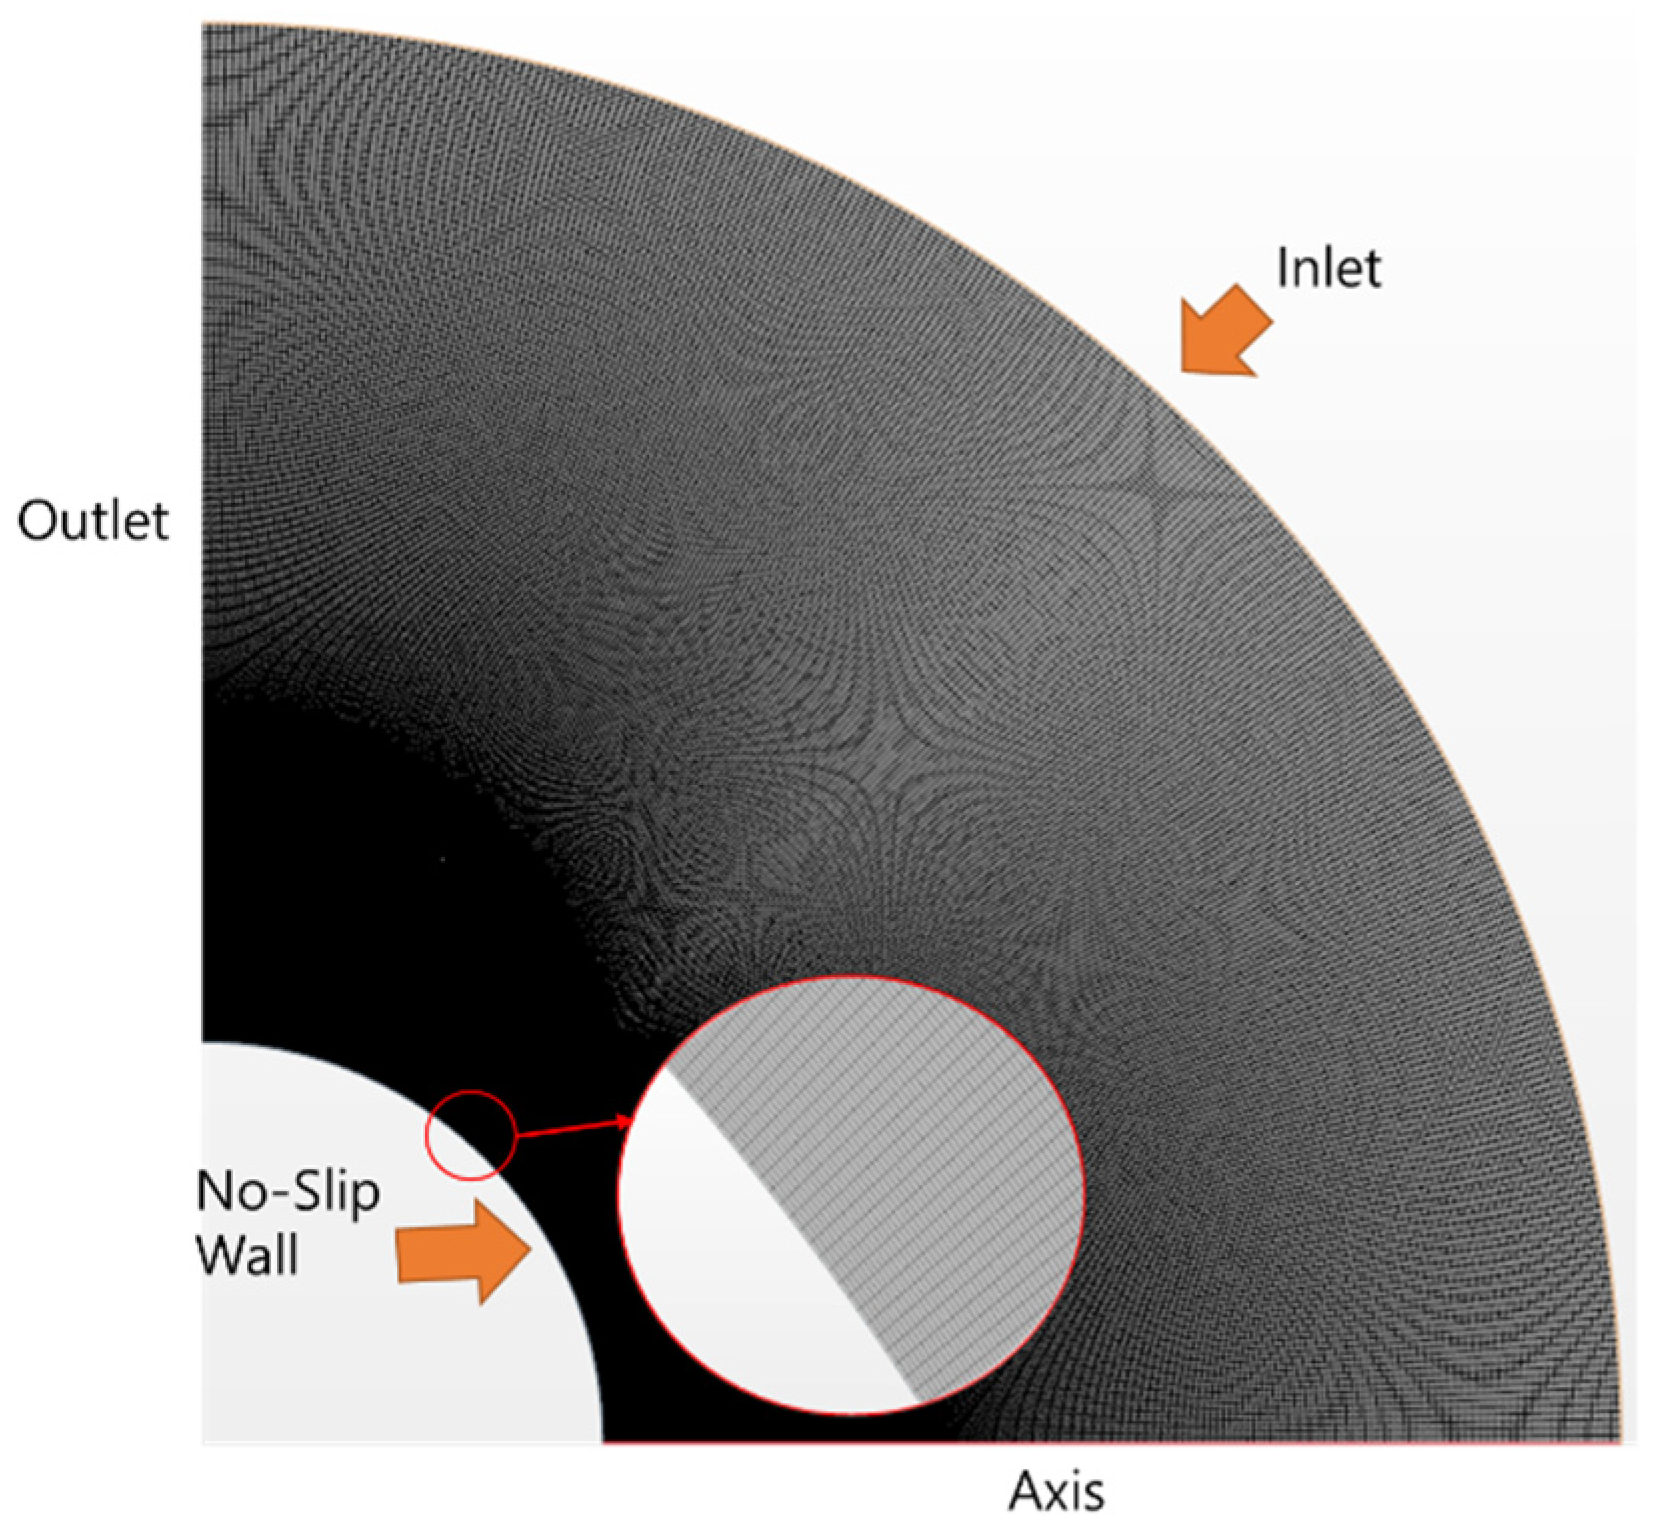
In this study, a structured mesh has been implemented. Figure 1 shows the grid and boundary conditions used in the calculation. As indicated in the Figure, no-slip conditions on the wall and a freestream boundary for the inlet are applied. The flow properties at the outlet are obtained from the extrapolation. The Mach number of the freestream is 3.45, the diameter (D) of the sphere is 25.4 mm (1 inch), the focus of energy deposition is 1.0 D apart from the stagnation point, and the other flow properties are shown in Table 1.
Grid convergence tests were performed by comparing the drag based on the value from the finest grid. The grids were classified into four types: G1; G2; G3; G4, and the number of grids in the x-direction and the relative drag is shown in Table 2.
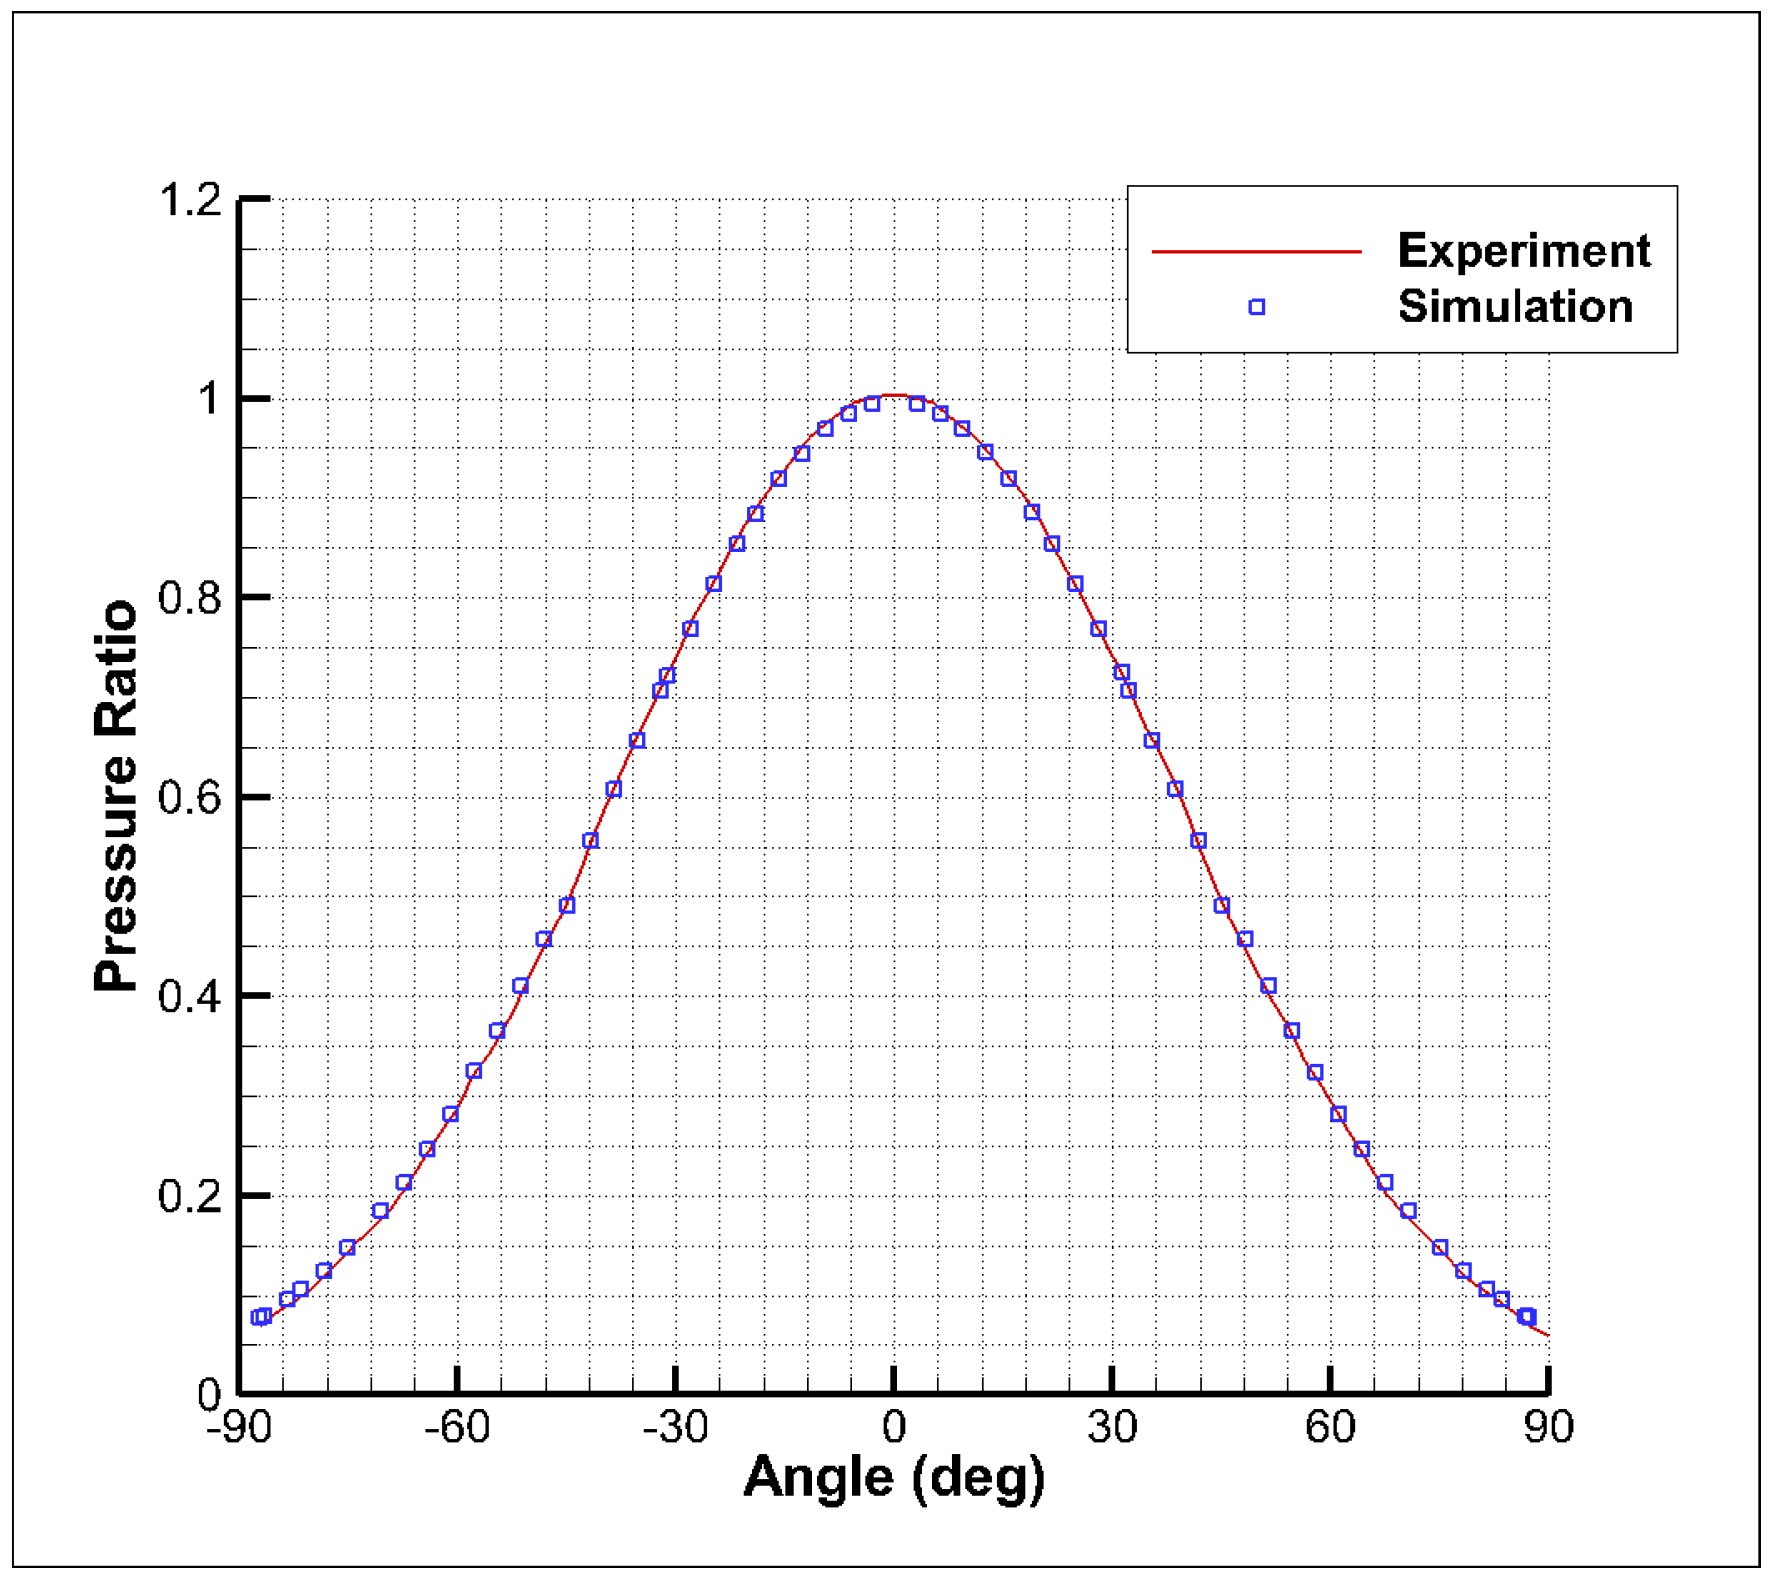
Based on the above results and the number of grids in the focal region, the simulations have been performed with the G2 grid. Figure 2 compares the pressure distribution along the surface from the experimental result without energy deposition [8] and the simulation using the G2 grid. The result shows good agreement with the experiment [8].
2.2.2. A Blast Wave Propagation and Its Interaction With a Shock Wave
In the numerical simulation, the heat source can be exactly applied to the domain through the procedure described in Section 2.1. Because it is not possible for the experiment, some parametric studies have been performed by changing the size and the temperature of the source. Figure 3 compares the numerical schlieren from the simulation, which is the most similar to the phenomenon observed from the experiment of Adelgren et al. [8]. The results of the experiment are obtained using the function of the MATLAB (2016a, MATHWORKS, Natic, MA, USA) to compare with the simulations results. It was confirmed that the formation and the propagation characteristics of the blast wave by the energy deposition and the distortion of the bow shock wave due to the interaction between the bow shock wave and the blast wave were in good agreement with the experimental results. In particular, the initial development observed from 30 to 50 μs, the reflection wave, the lens effect [33], and the streamwise vortex, were well simulated.
3. Analysis of the Drag Reduction Ratio According to Various Energy Deposition Conditions
3.1. Comparison of the Drag Reduction Ratio for Single Deposition and Multiple Depositions
According to previous research [34], the duration of the reduced drag is longer and the oscillation of the drag is smaller as the frequency increases. However, that study assumed that energy does not continuously depose. The energy is applied only 5 or 10 times, even in the high-frequency operation. However, because the movement of a vehicle or a body is continuous, it is considered appropriate to have the ability to operate as many as possible at the requested moment, rather than to limit the number of depositions. Even though the actual laser experiences a small difference in power depending on the frequency, the study assumes that the same energy is continuously deposed even if the frequency is changed.
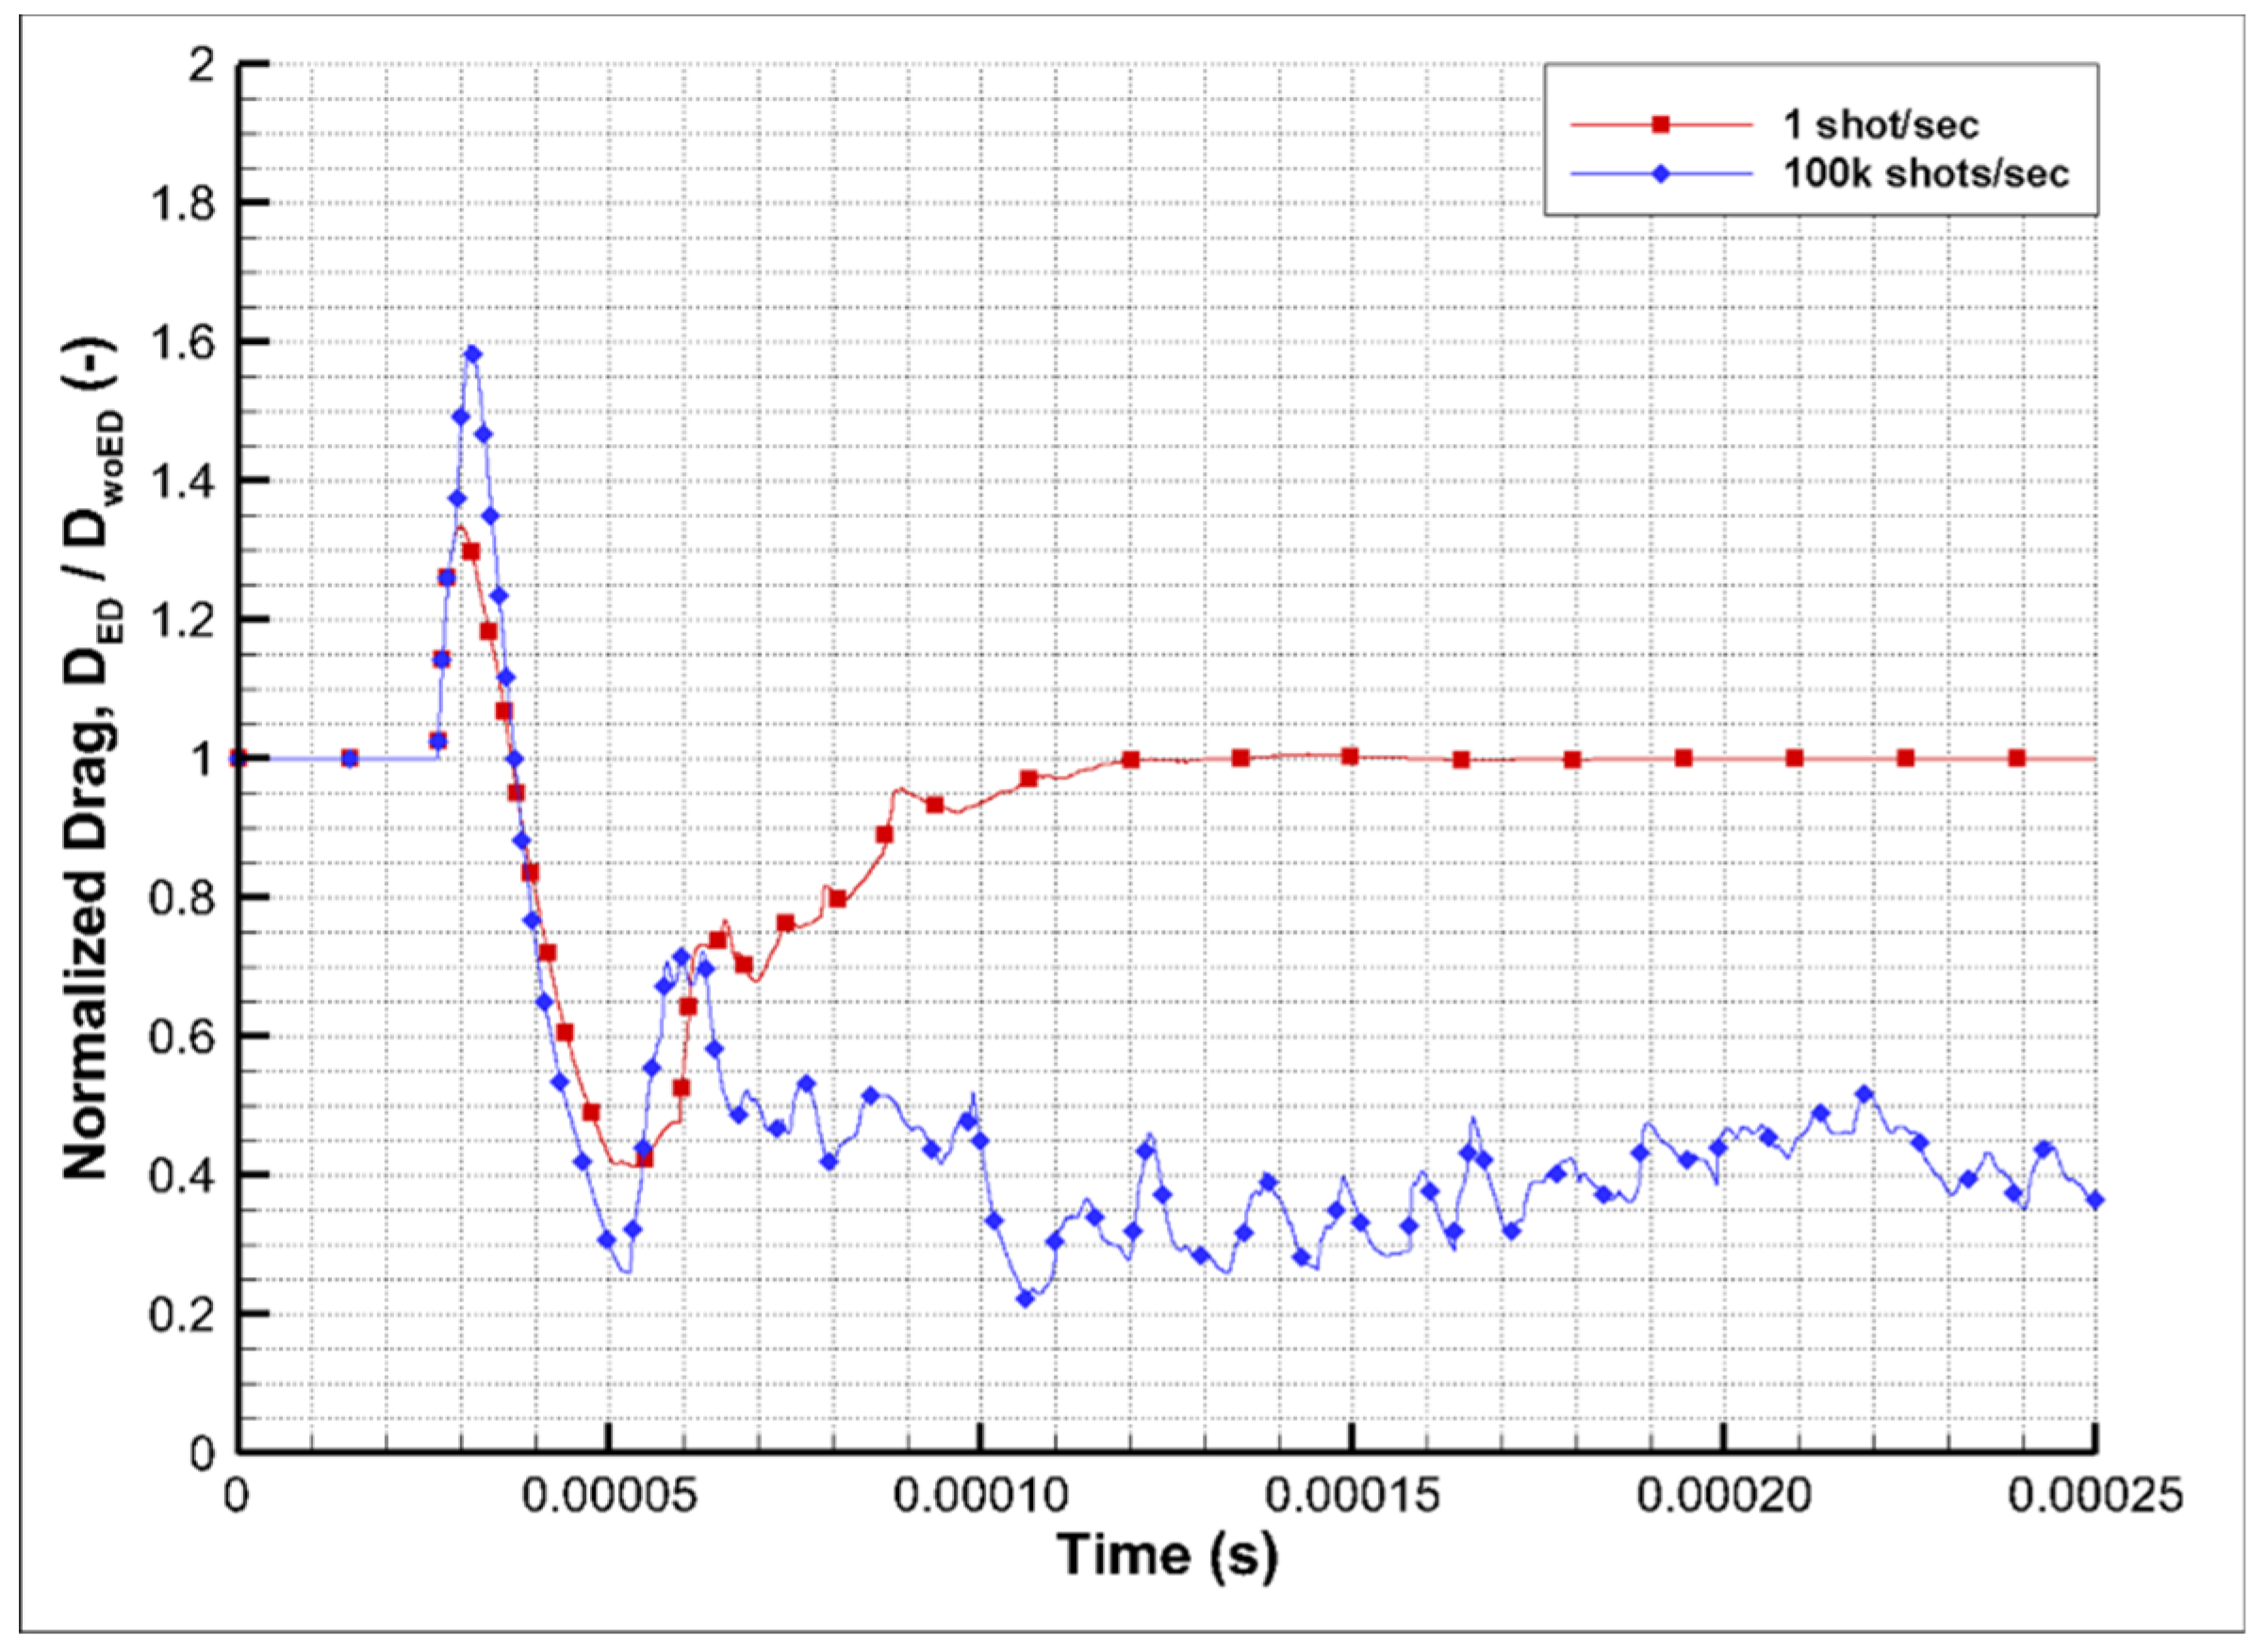
Figure 4 shows the normalized drag of the sphere against time. The moment when a laser deposition occurred is defined as the 0 s. For the single deposition case (red line), after a 30% increase in drag is observed due to the blast wave reaching the surface at 30 μs, it begins to decrease. About 50 μs from the energy deposition, the drag is reduced by 60%. The drag is gradually recovered until 120 μs, but the duration when more than 50% of the drag decreased is only about 10 μs (from 50 to 60 μs). When the laser operates at 100 kHz (blue line), maximum drag becomes 160% of its undisturbed value, followed by the decrease of the drag more than 70%. In the latter case, after 100 μs, the normalized drag keeps remaining less than 40% of its undisturbed drag. The similar tendency has also been observed in previous research. But because the pulse is limited, the reduced drag was only obtained for a few microseconds. Also, the discrepancy in the drag reduction ratio between the previous and the present work is considered to be the result of the difference in the deposition energy.
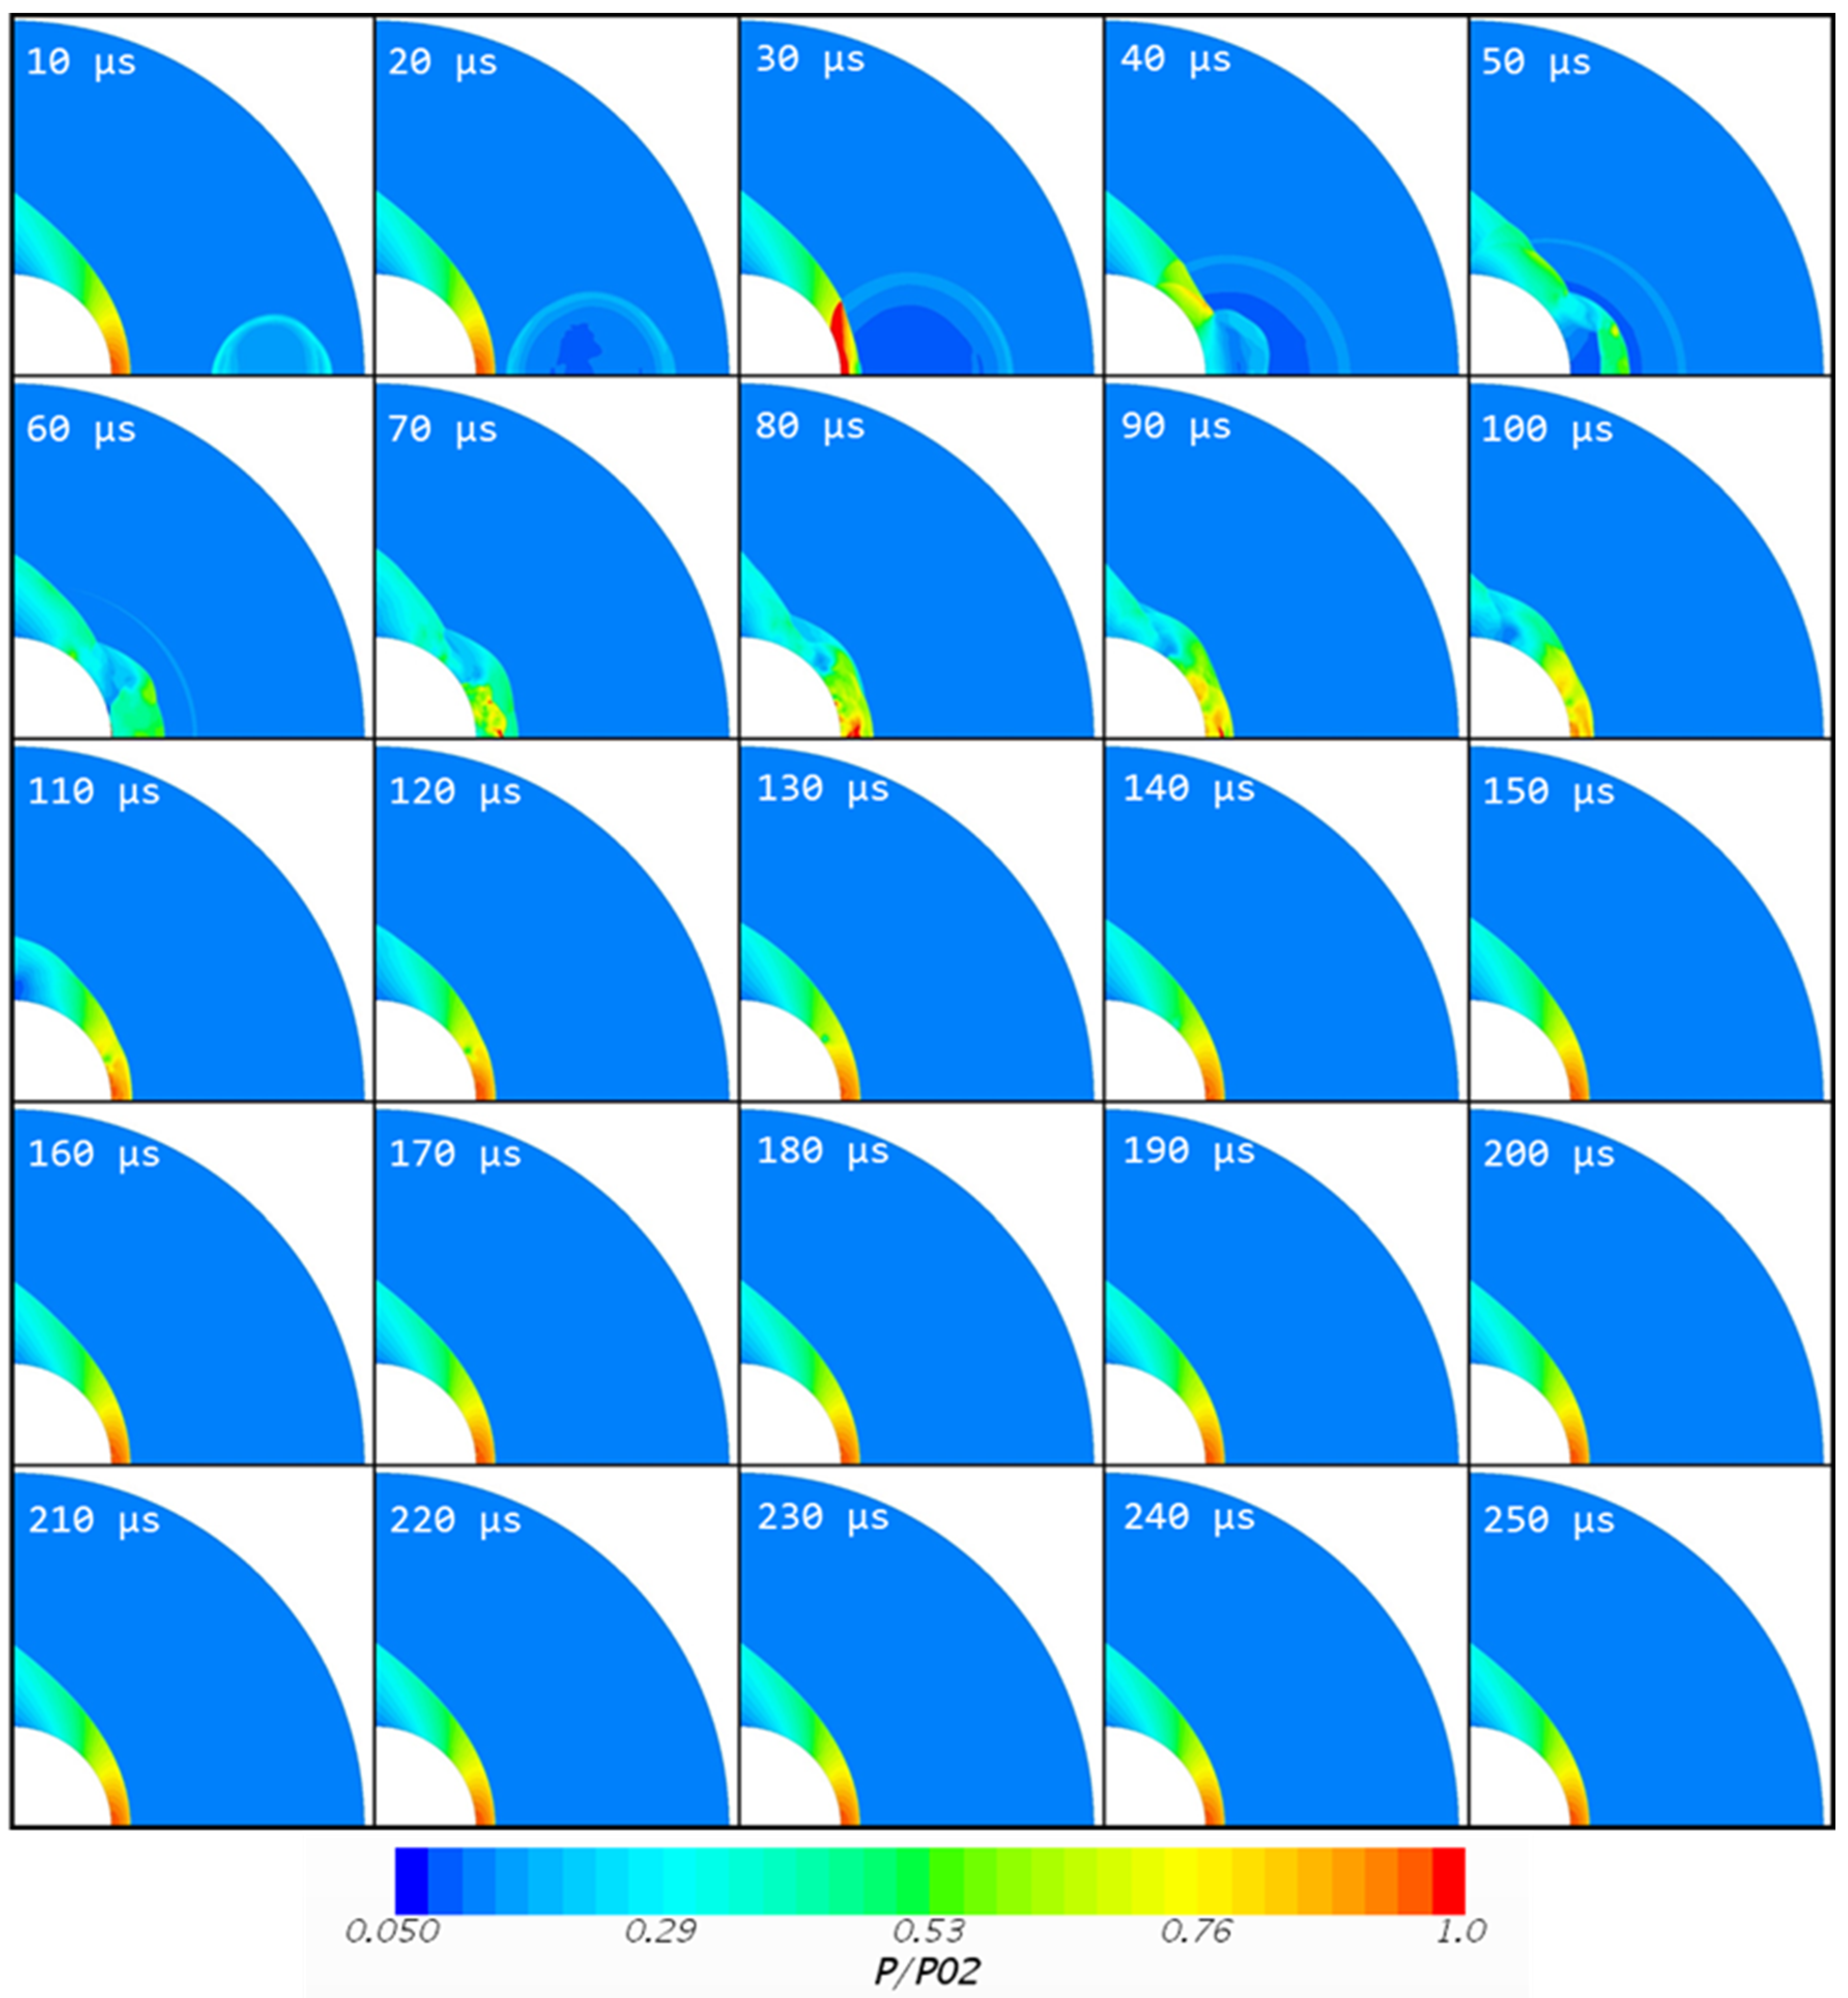
To investigate the reason for these differences in drag reduction over time, pressure contours in 10 μs intervals are shown in Figure 5 (case of single deposition) and Figure 6 (case of multiple depositions). In Figure 5, after the blast wave intersects with the bow shock and reflects from the surface at 30 μs, an expansion region is created by the lens effect. The expansion region covers a part of the body, from 0 to 30 degrees, which causes a sudden decrease of drag. However, this low-pressure region (deep blue contour) is immediately overtaken by compressed flow (green contour) from the center. The reconstruction process is completed at 120 μs, when the flow becomes a steady state. This collapse and reconstruction phenomenon of the bow shock is also found in Figure 4 and Figure 12 of Adelgren et al. [8].
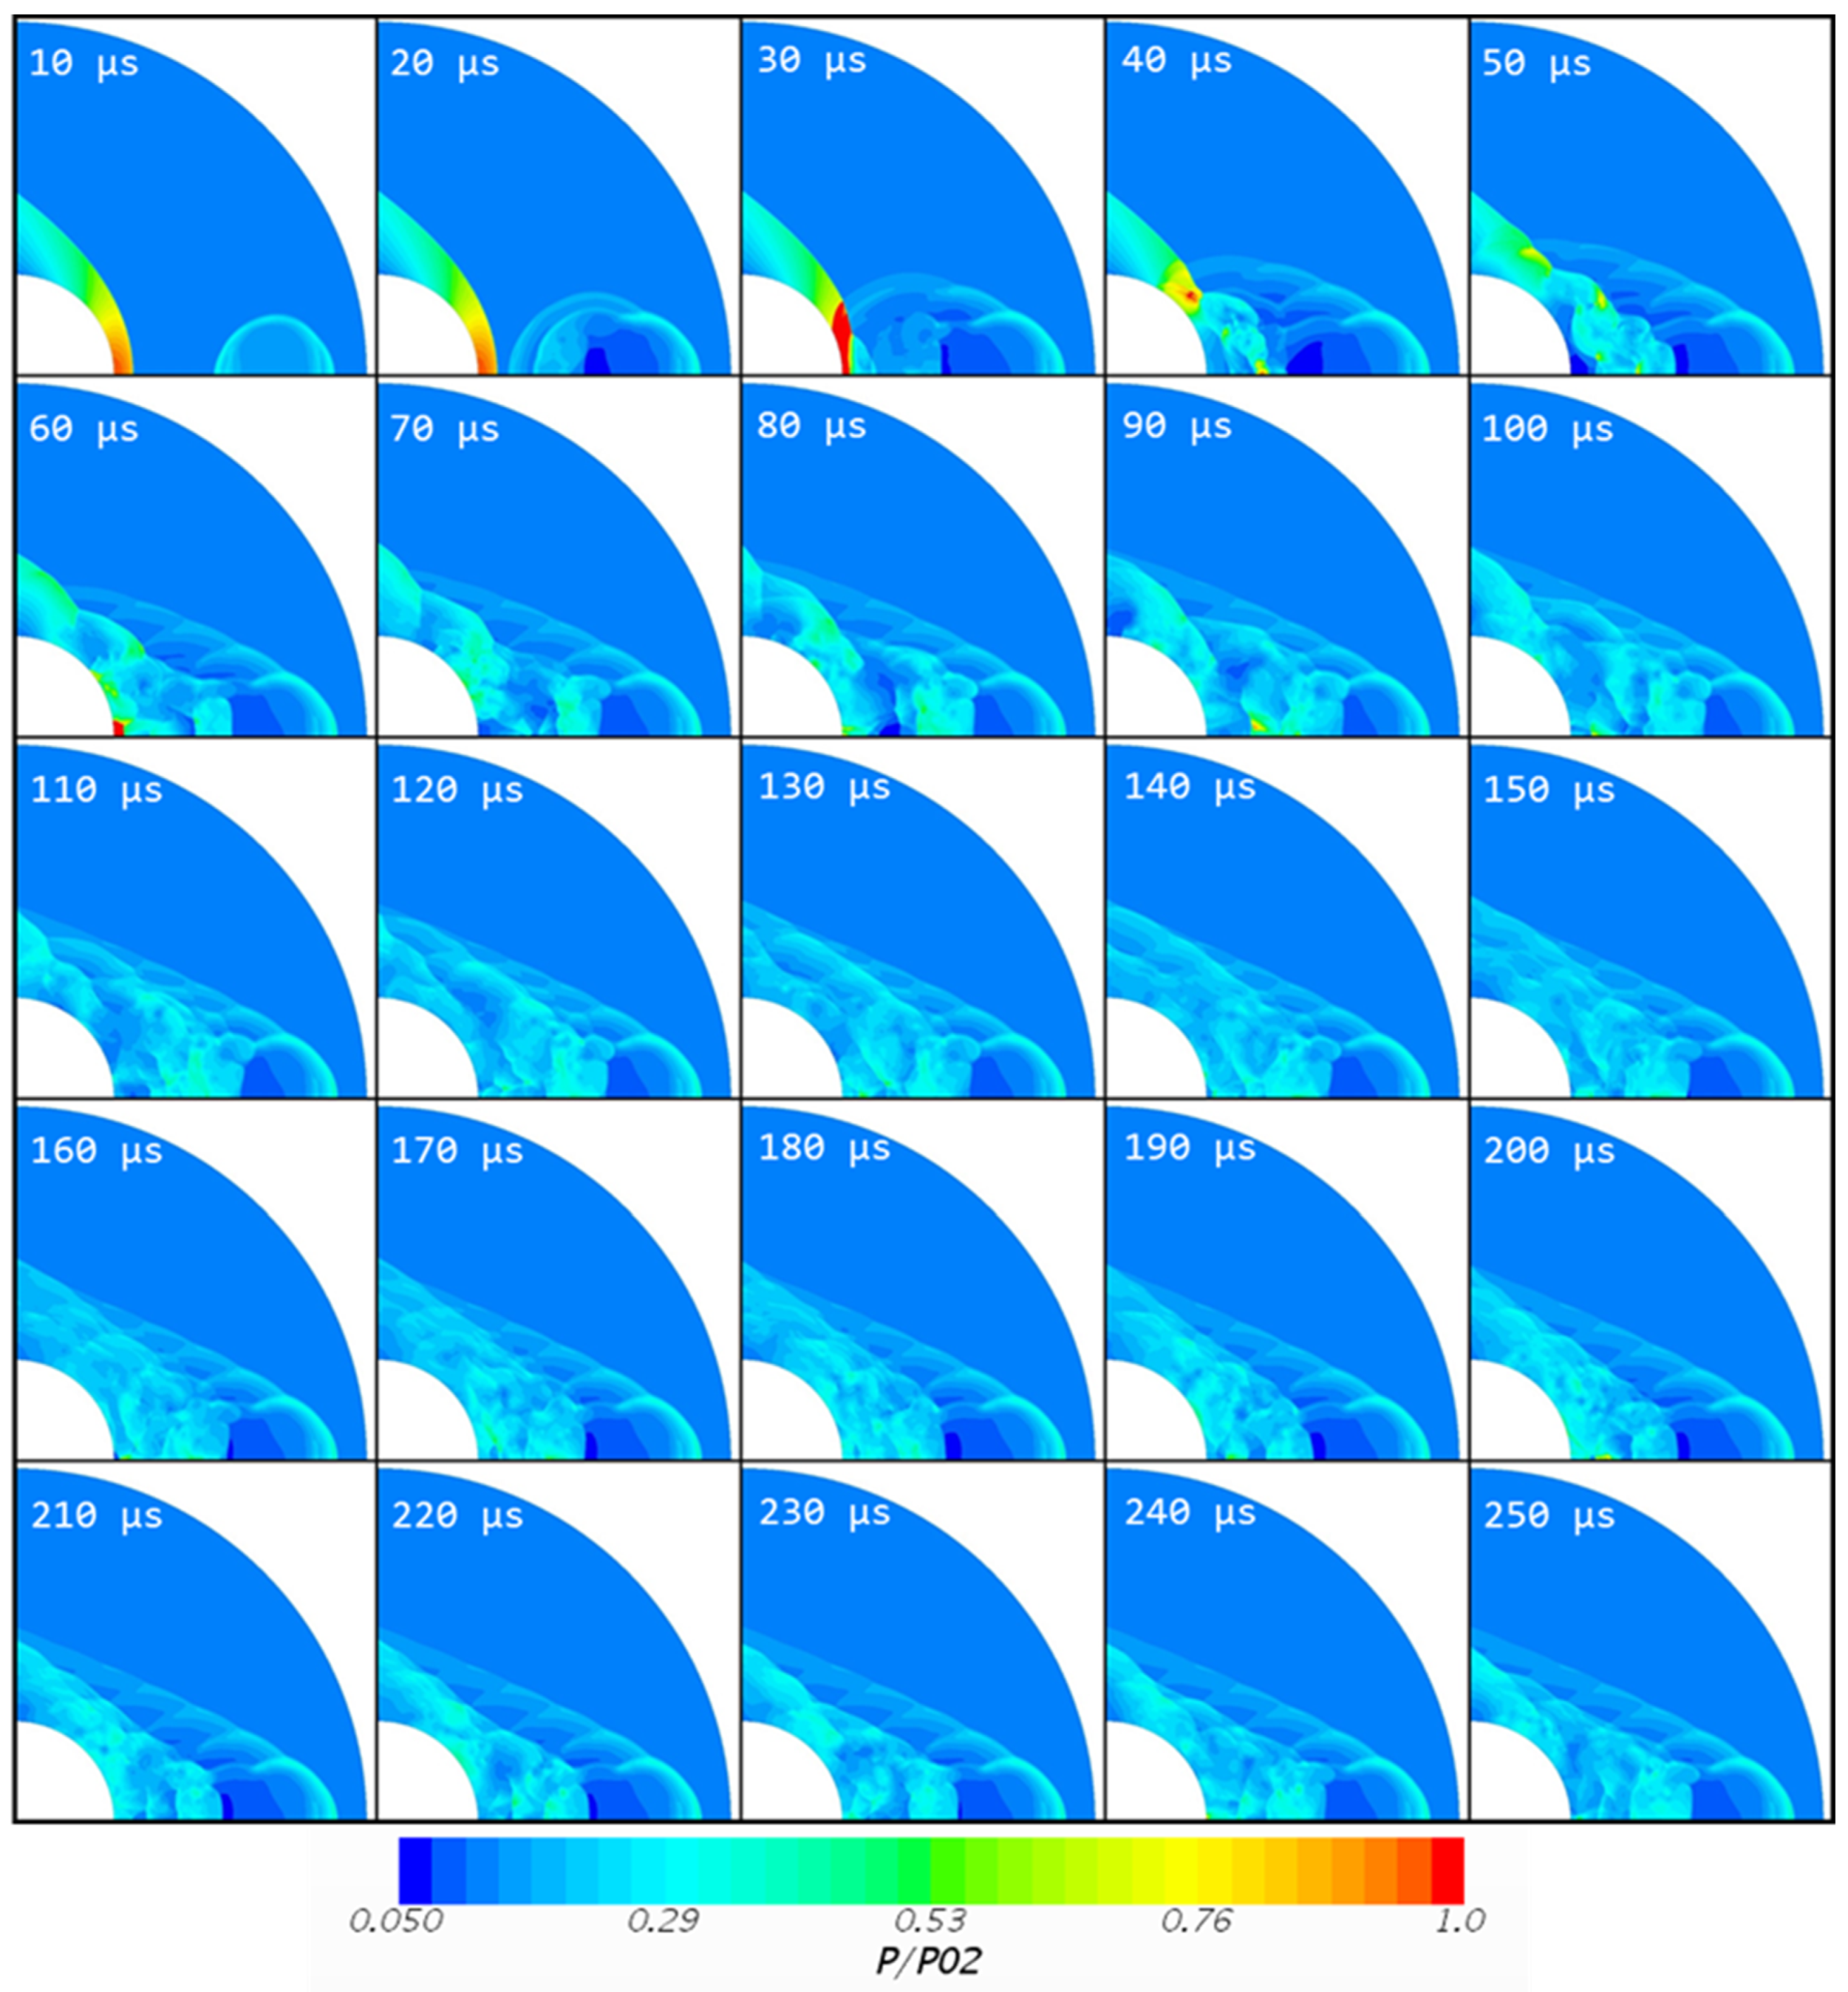
The pressure contours when the operating frequency increased to 100 kHz are shown in Figure 6. The flow development around the sphere is different from the previous conditions. The first contact of the blast wave with the bow shock occurs at 30 μs. However, a number of depositions have been made before this, so the incoming blast wave is not generated by the single energy deposition. Because the multiple blast waves are accumulated, a larger drag increase from the impact is expected, as shown in Figure 4. In turn, the expansion region is also larger, from 0 to 45 degrees. It can bee seen that the smallest drag occurs temporarily. After the initial interaction, the blast wave and the shock reflection keep developing and interacting with each other. It takes about 70 μs until the flow field is stabilized. So, after 120 μs, it is assumed that the pressure field is macroscopically converged over the entire surface. In other words, when the deposition frequency increases, the shock wave reflected from the surface intersects with the blast wave and the strength of the blast wave is weakened. This process repeats at least two times, thus pressure in front of the sphere decreases. At the same time, radial expansion of the succeeding blast waves and its overlapping creates a virtual cone-shaped structure. The angle of the generated cone is large enough to cover the entire body. Inside this structure is stable, except that there are continuous interactions between the blast wave and the reflected shock. Due to these interactions, the object experiences little oscillation of the drag, but it seems that it is maintained within the boundary. This result is also able to explain an observation from a previous study [18], where the drag reduction becomes larger as the normalized diameter decreases.
3.2. Effect of Deposition Frequency on the Drag Reduction Ratio
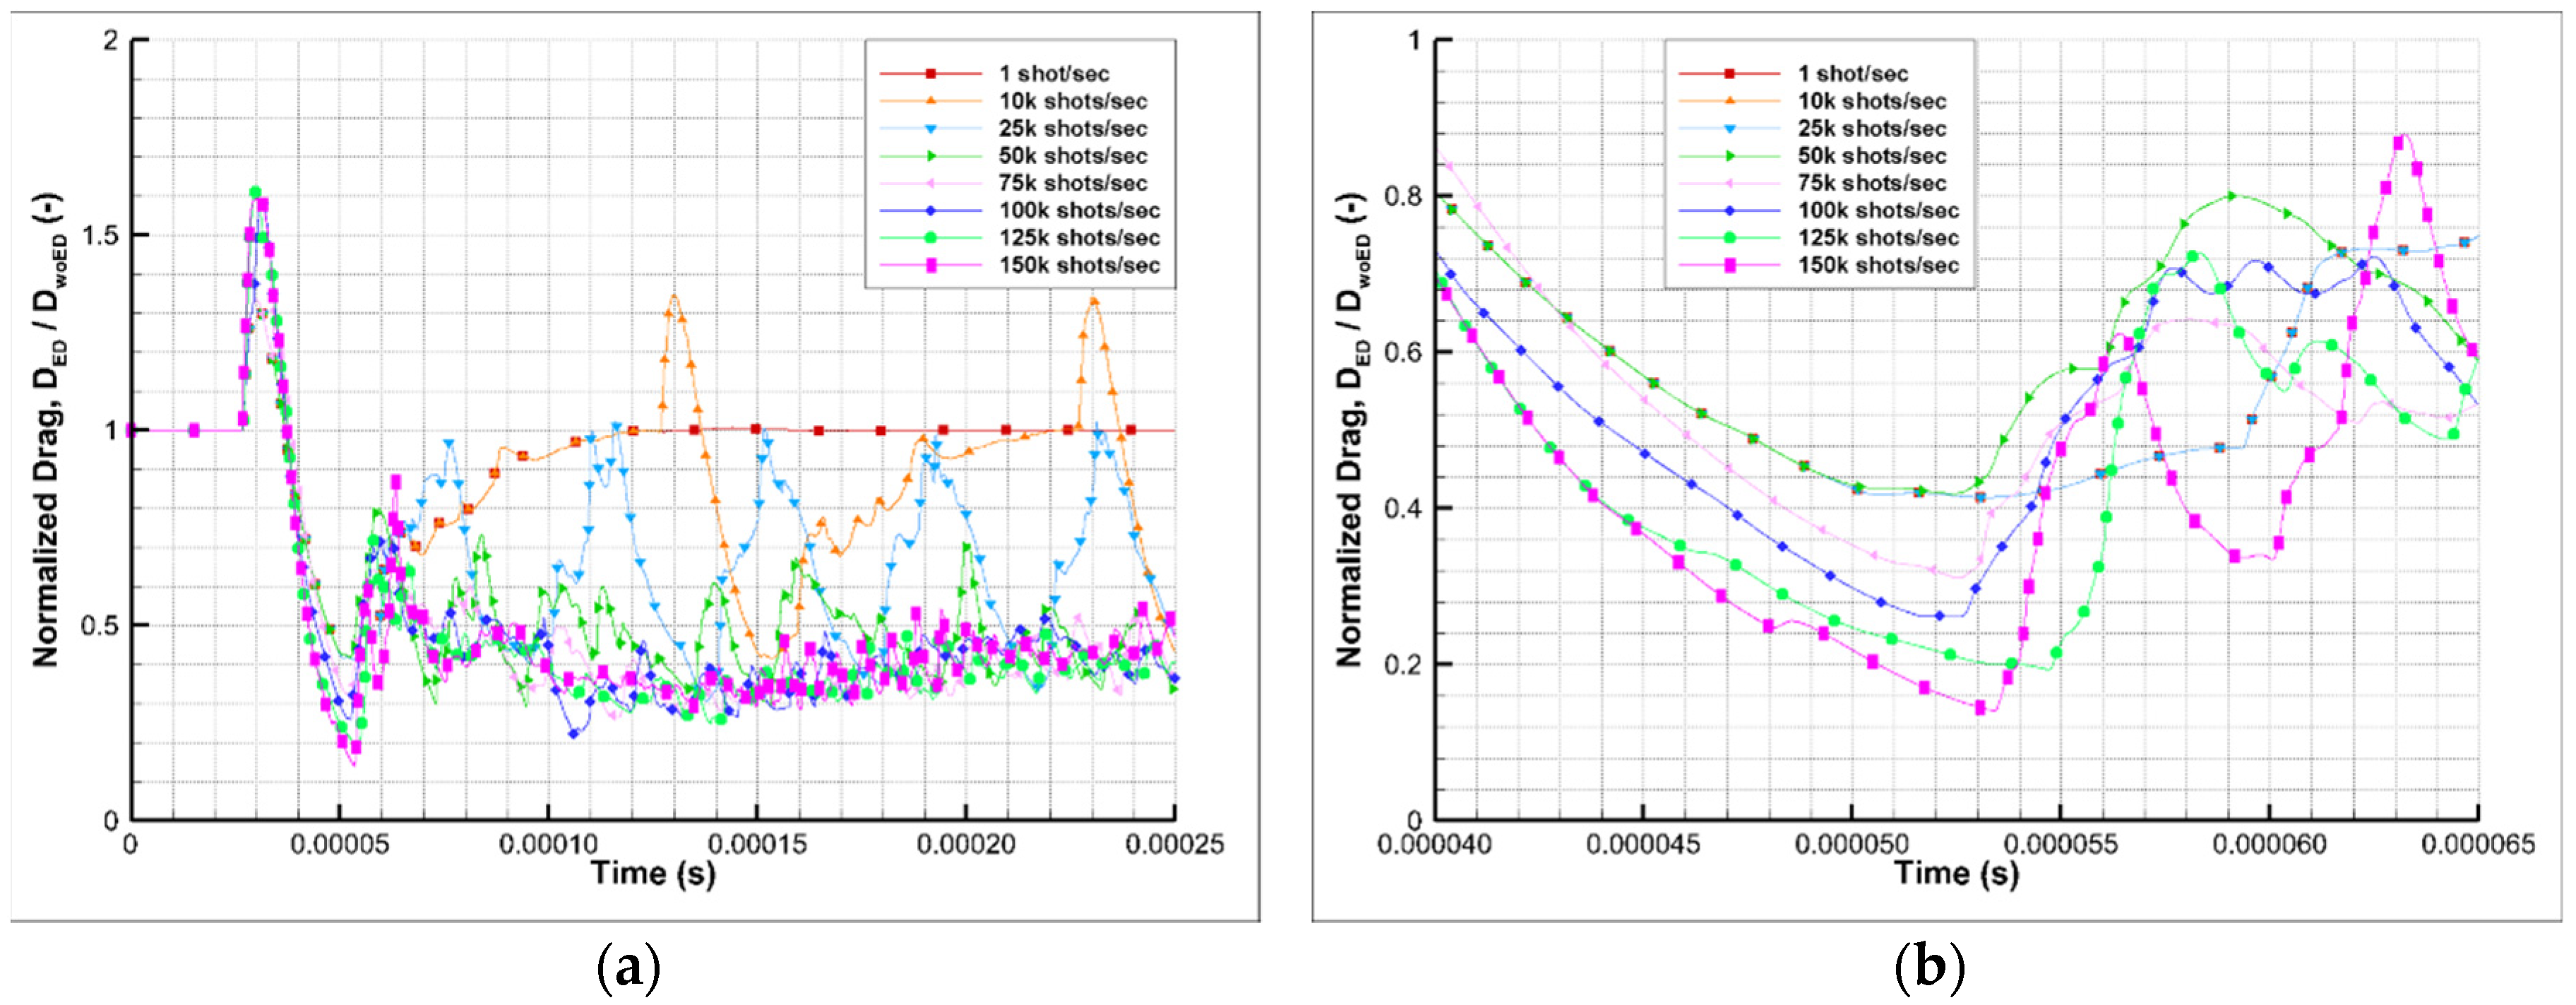
From the previous section, it is found that high-frequency energy deposition could continuously reduce the drag of the sphere. In this section, the drag and the flow field are compared according to deposition frequency. Figure 7a shows the change in drag over time when the frequency varies from 1 to 150 kHz. As shown in the figure, the initial drag increase due to the blast wave is about 30% when the frequency is less than 75 kHz. However, when the laser operates faster than 100 kHz, it becomes over 60%. On the other hand, the ratio of the drag reduction due to the expansion is constant when the frequency is less than 50 kHz. After that, it continues to increase from 70% at 75 kHz to 85% at 150 kHz. It is expected that the overlap of the blast wave and the interaction with the reflection wave results in the difference of the drag reduction ratio. Comparing the converged drag, which could be obtained after 120 μs, the drag maintains a quasi-steady value at a deposition frequency of 75 kHz and above. This value is about 40% of the initial value and remains the same regardless of frequency. It means that as the deposition frequency increases, a continuous drag reduction can be obtained, but the ratio is similar to the value obtained from the single deposition. However, compared with existing studies, the converged value seems to be affected by the applied energy per single deposition.
In order to examine the flow development with respect to the deposition frequency in detail, pressure contours from 30 to 100 μs for each frequency, in 10 μs intervals, are shown in Figure 8. From 40 μs, the bow shock is disturbed. Due to the temperature rise by the blast wave, the local Mach number is decreased, which results in an expansion (lens effect). The global minimum drag is the result of the expansion region that is initiated from the undistorted flow. As shown in Figure 8, when the frequency is less than 25 kHz, the propagation of the blast wave occurs independently, so that the blast wave with the same strength reaches the surface. Furthermore, the shape of the expansion region and the corresponding minimum drag are the same. However, when the frequency is larger than 50 kHz, the blast wave that interacts with the bow shock overlaps and its intensity increases, resulting in stronger and larger expansion. So, the global minimum drag becomes smaller as the frequency increases.
On the other hand, if the control time is defined as the time interval when the reduced drag is less than 50%, it does not exactly depend on the frequency. Figure 7b shows an enlarged plot of the drag from 40 to 65 μs. The expansion region generated at lower frequencies, less than 25 kHz, has the same control time, because the blast waves don’t accumulate. However, the control time gradually increases from 50 kHz to 100 kHz, due to the strong reflection of the overlapped blast wave. But at 125 kHz, the control time is suddenly increased. It is assumed that the low-pressure region generated by the reflection is pressurized due to the subsequent blast wave. Therefore, the reason for this increased control time is expected to be either from the reduction of traveling speed of the subsequent blast wave, or from the early formation of the expansion region. In Figure 8, the large low-pressure region is found at 40 and 50 μs in this frequency. When the deposition frequency is further increased to 150 kHz, the intensity of the expansion region observed at 40 μs was weakened and the control time was reduced, due to the compression by subsequent blast waves. The local minimum drag that appears after this first interaction could not exceed this value, which indicates that the weaker expansion region is formed because the flow is already compressed by the multiple shock interactions.
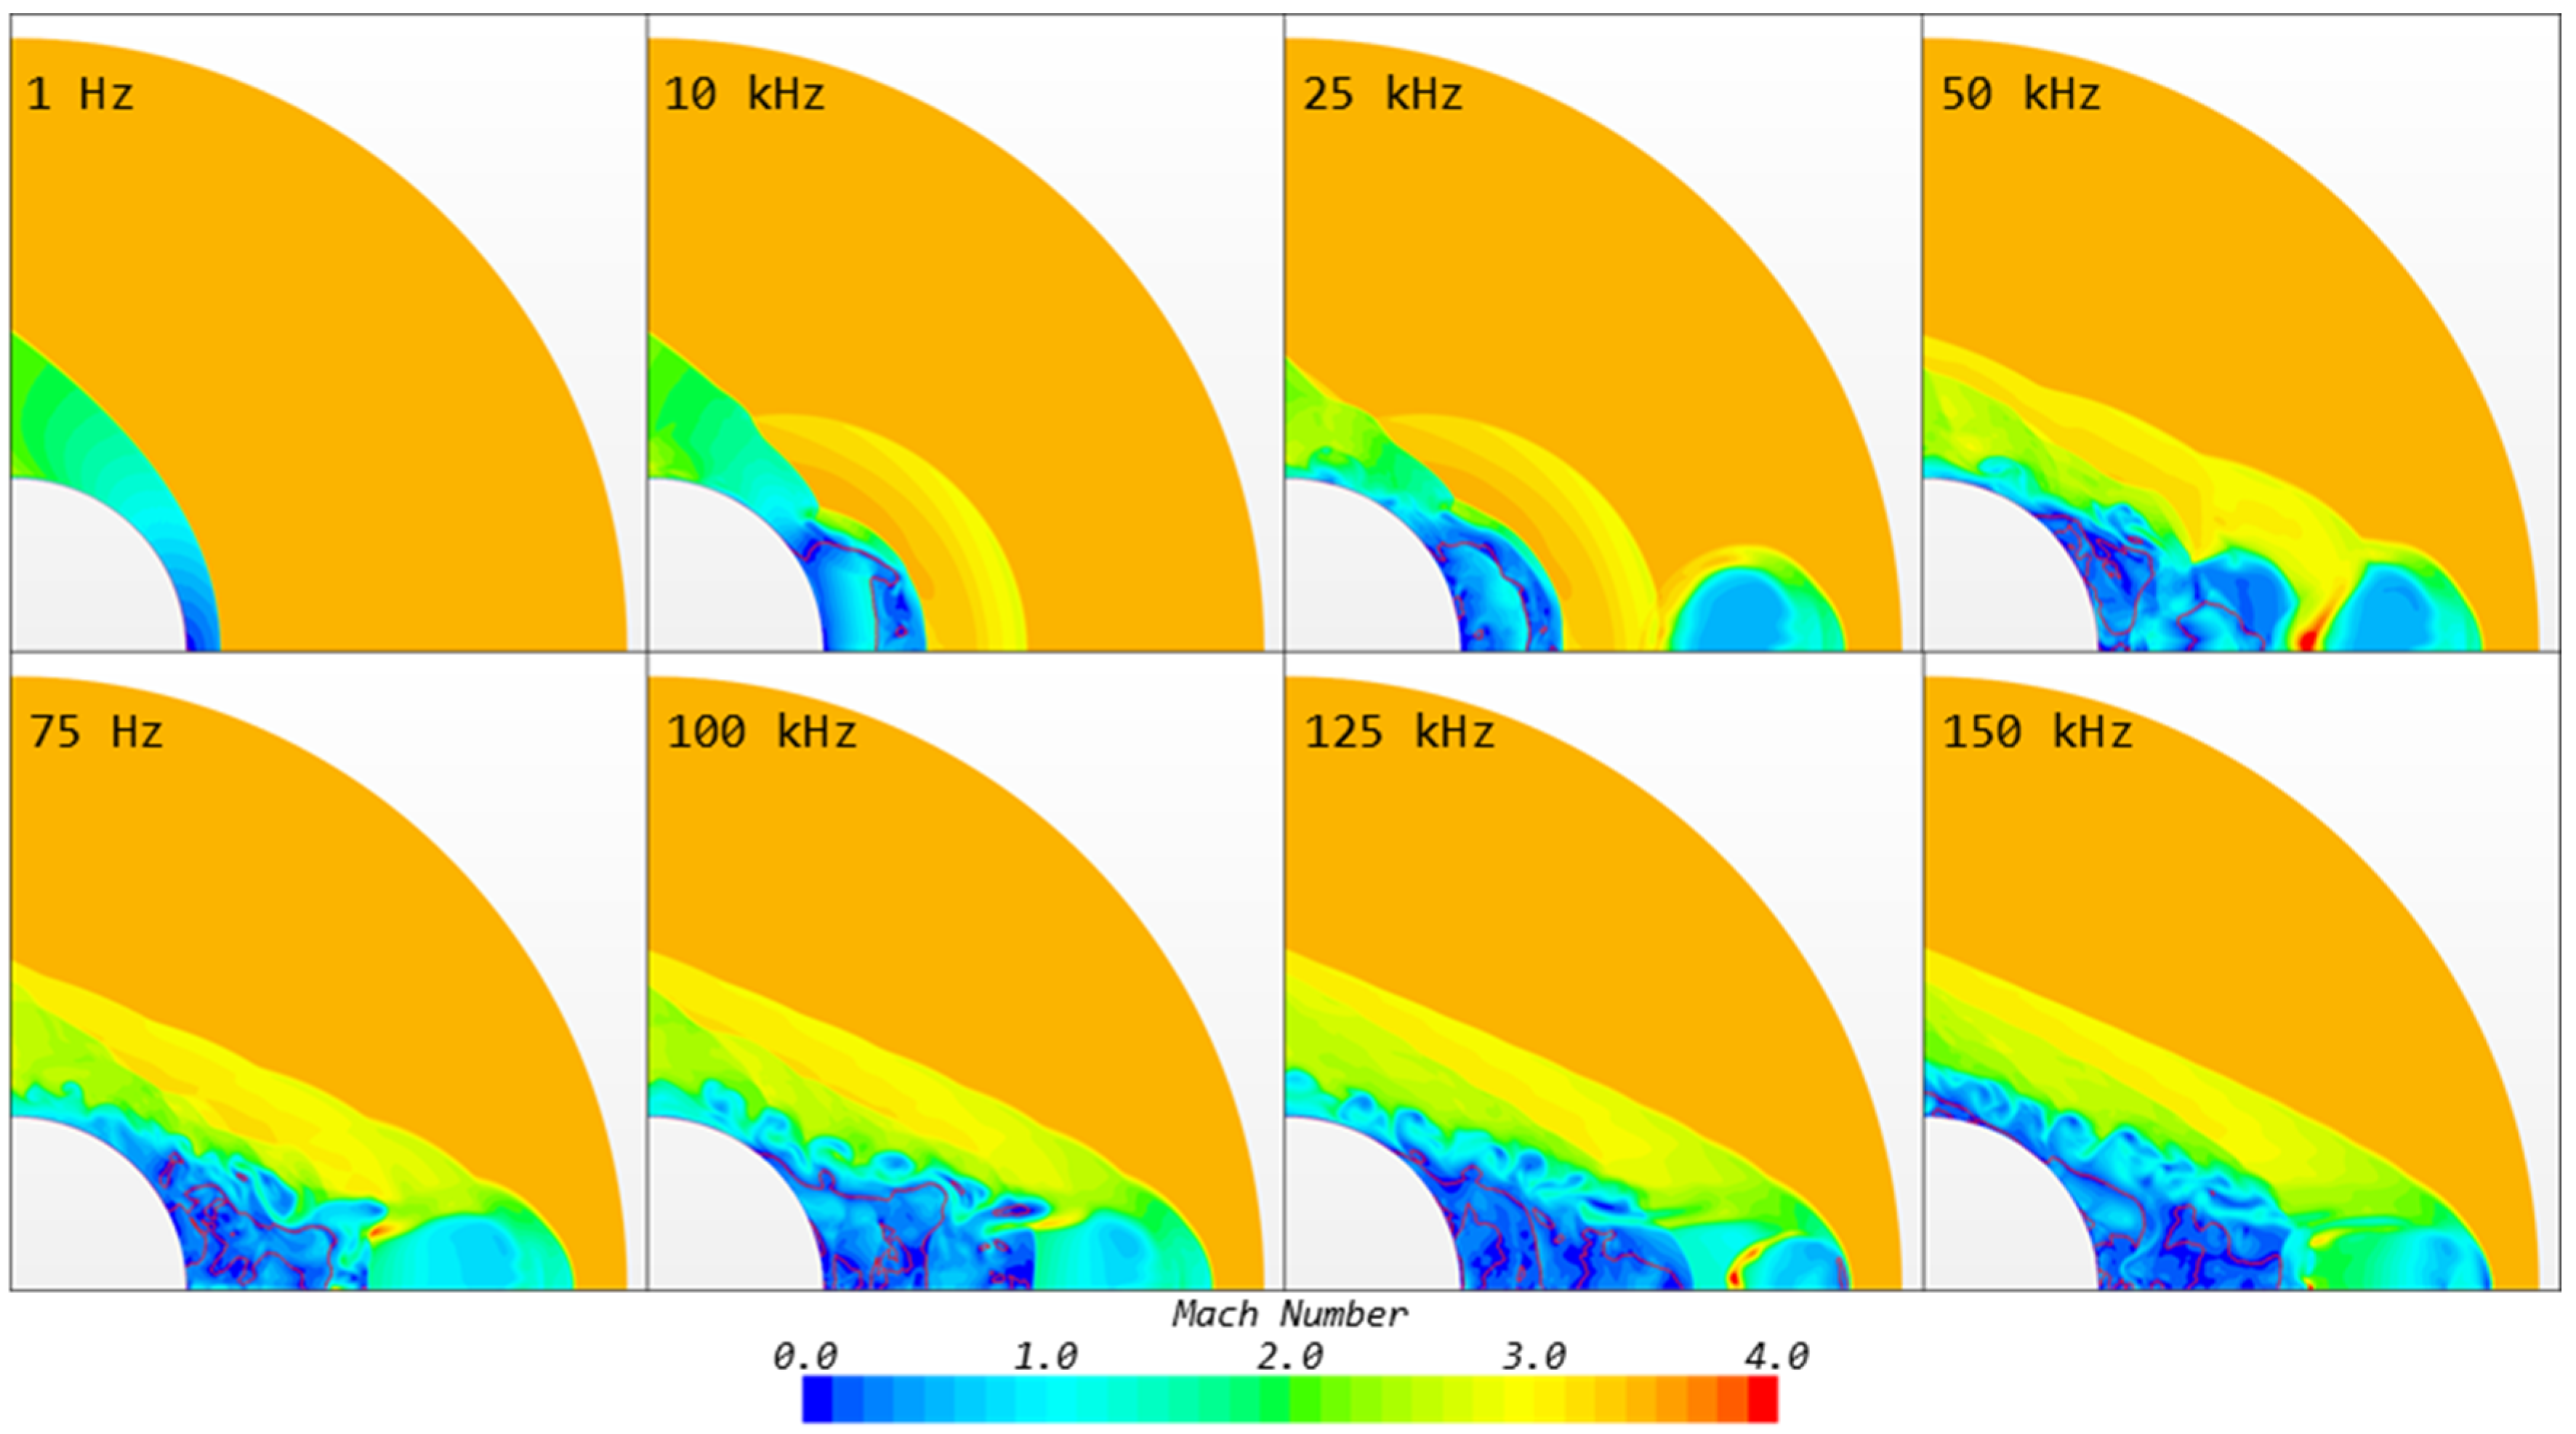
From Figure 7, one can see that the drag is almost converged to a value that is similar to the drag obtained from the single deposition. As discussed earlier, blast waves propagate independently at frequencies below 25 kHz. When the laser deposed at 25 kHz, the blast wave intersects with the reflected shock once at 60 μs or 100 μs before it reaches the surface. The intensity of the blast wave slightly weakens after the intersection, but high pressure is still formed on the surface, as found at 70 μs. In the case of 50 kHz, a similar phenomenon could be found at 60 μs, 80 μs, or 100 μs. However, when the deposition occurs at a frequency of 75 kHz, two intersections occur near the center of deposition at 60 μs, and near the object at 80 μs. As the frequency increases, more intersections occur that result in a large recirculation region, as shown in Figure 9. So, the converged drag is obtained from the overlapping blast wave and its weakening by the reflection wave.
3.3. Effect of the Focal Distance on the Drag Reduction Ratio
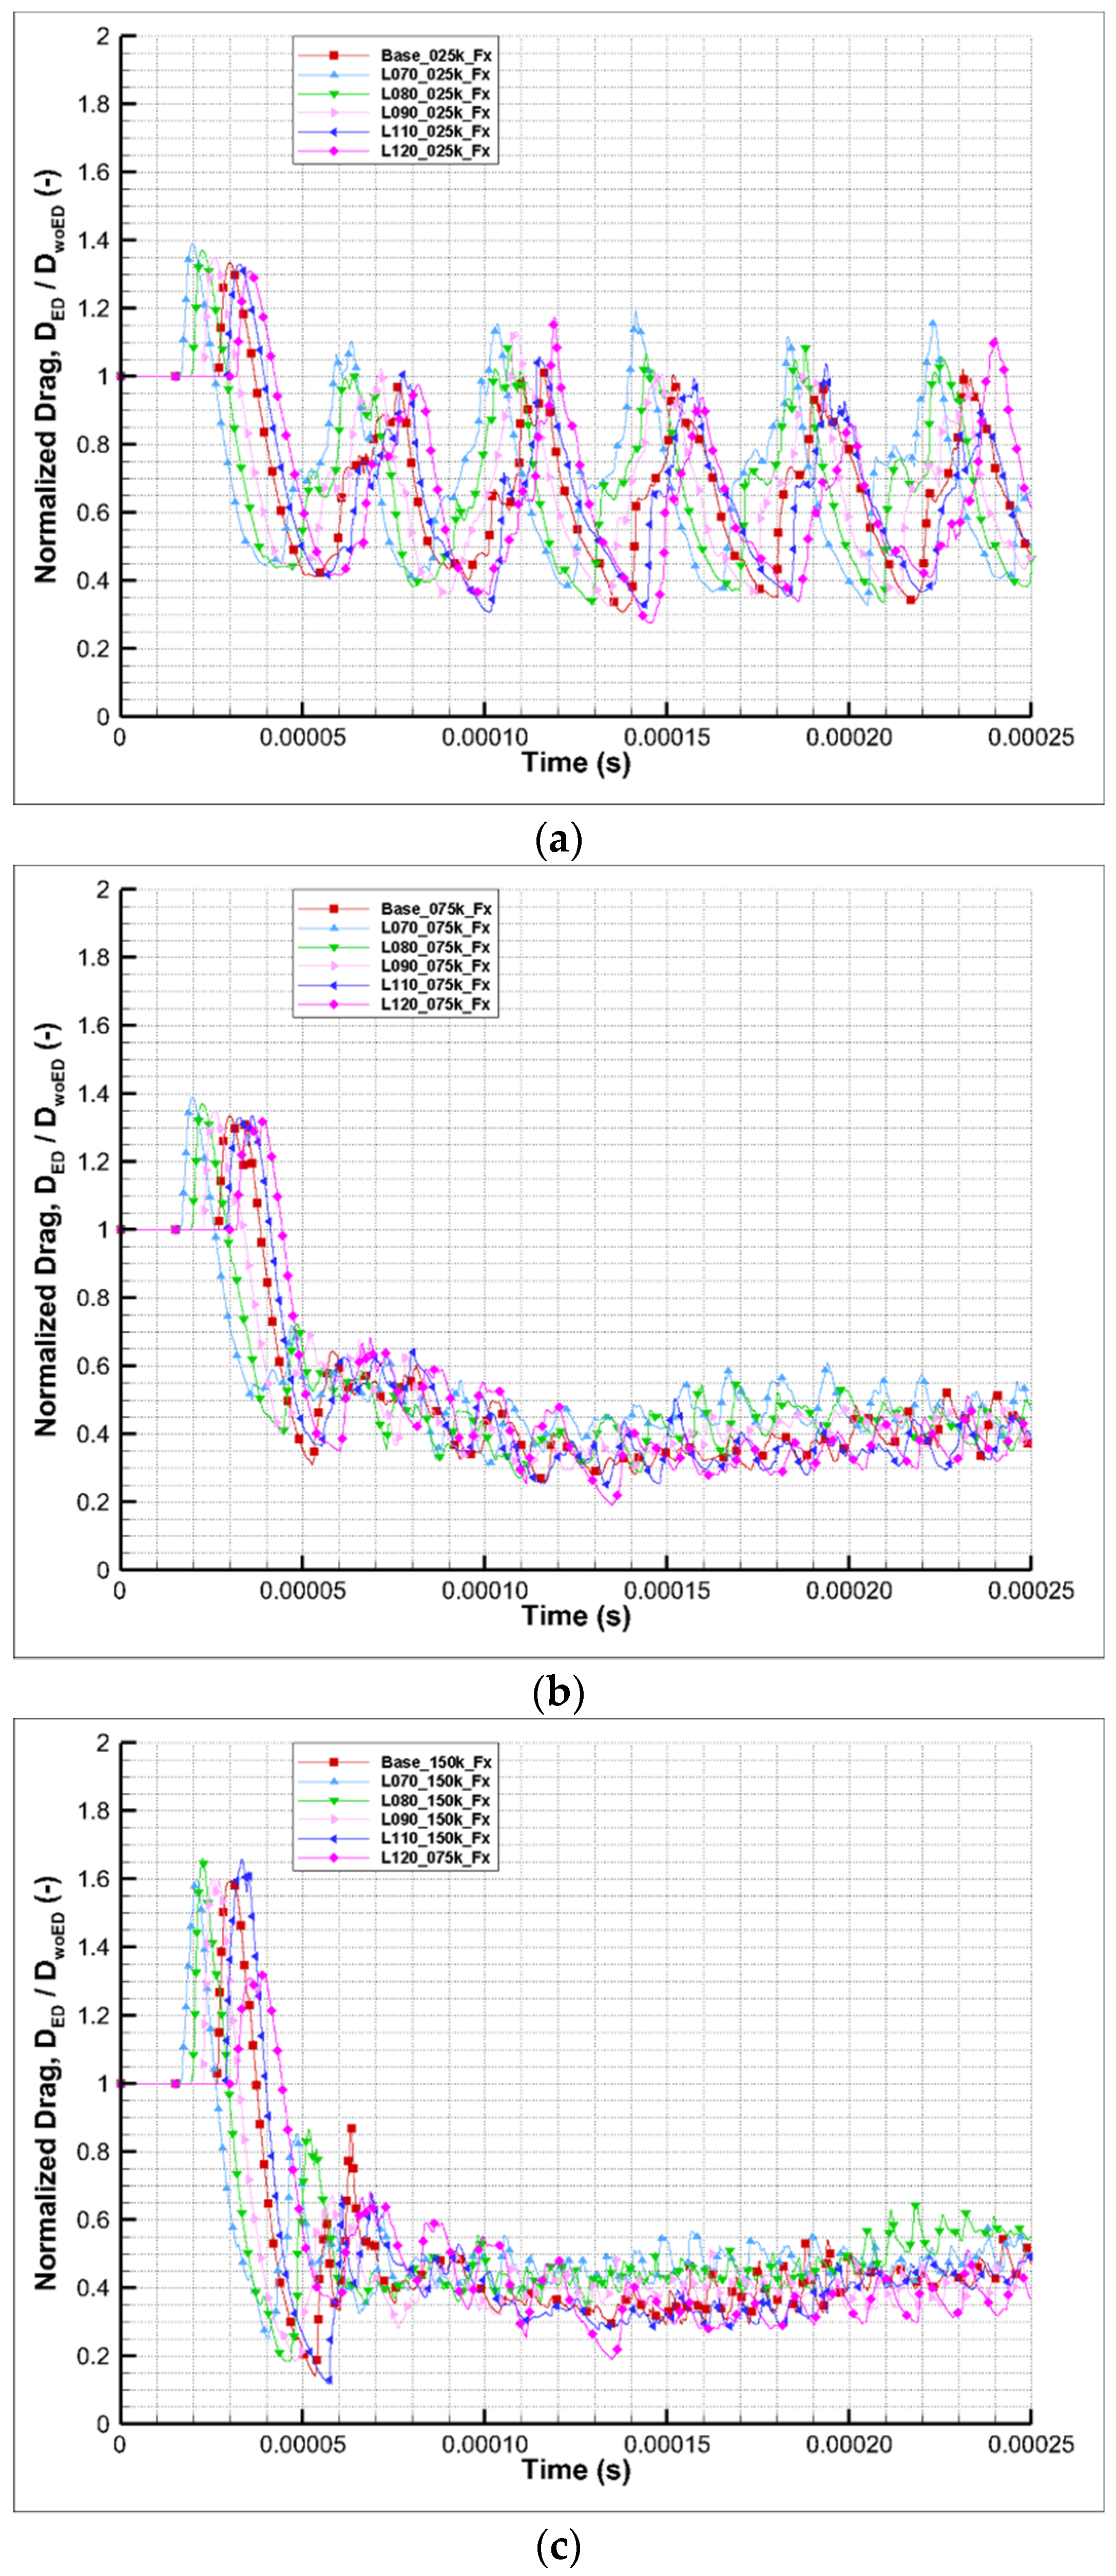
In this section, the effect of the distance between the object and the focus of the deposition is investigated. When the same energy is deposed, the propagation velocity of the blast wave would be the same. Therefore, the location where the blast wave intersects with the reflected wave varies depending on the location of the focus. The distance is also expected to affect the number of overlaps. In this study, the distance between the focus and the object is varied from 0.7 D to 1.2 D. Figure 10 shows the normalized drag against time for the deposition frequencies of 25 kHz, 75 kHz, and 125 kHz, respectively. When depositions are made at 25 kHz, it is expected that blast wave overlap does not occur, because the frequency is too low. However, as the focus is moved towards the object, the initial drag reduction occurs faster and it could be assumed that the point of the intersection will be changed. However, the difference in drag reduction is not observed under this frequency. Even the frequency of the deposition increases, and the time for the first intersection of the blast wave is still proportional to the distance, which is found in Figure 10b. However, after this first blast wave approaches the surface, the following waves generate a quasi-steady flow, which results in a constant drag for all cases of distance variations. Therefore, the pressure distribution around the body is expected to be similar to Figure 8. Moreover, when the distance is longer than 1.0 D, it is hard to distinguish the effect of the distance in terms of the phase and amplitude. This results from the multiple interactions between the blast wave and the reflected shock. This tendency could be seen clearly as the frequency increased, as shown in Figure 10c. The drag is converged after 80 μs, when the stabilization process is completed after the initial interaction. Also, it seems that the amplitude decreases as the frequency increases.
3.4. Effect of the Deposition Energy on the Drag Reduction Ratio
The total amount of deposed energy is strongly related to drag reduction characteristics caused by laser energy, especially energy efficiency. In this section, the reduction of the drag due to energy depositions of 50%, 75%, 125%, 150%, and 200% relative to the amount of energy applied in the previous sections is examined.
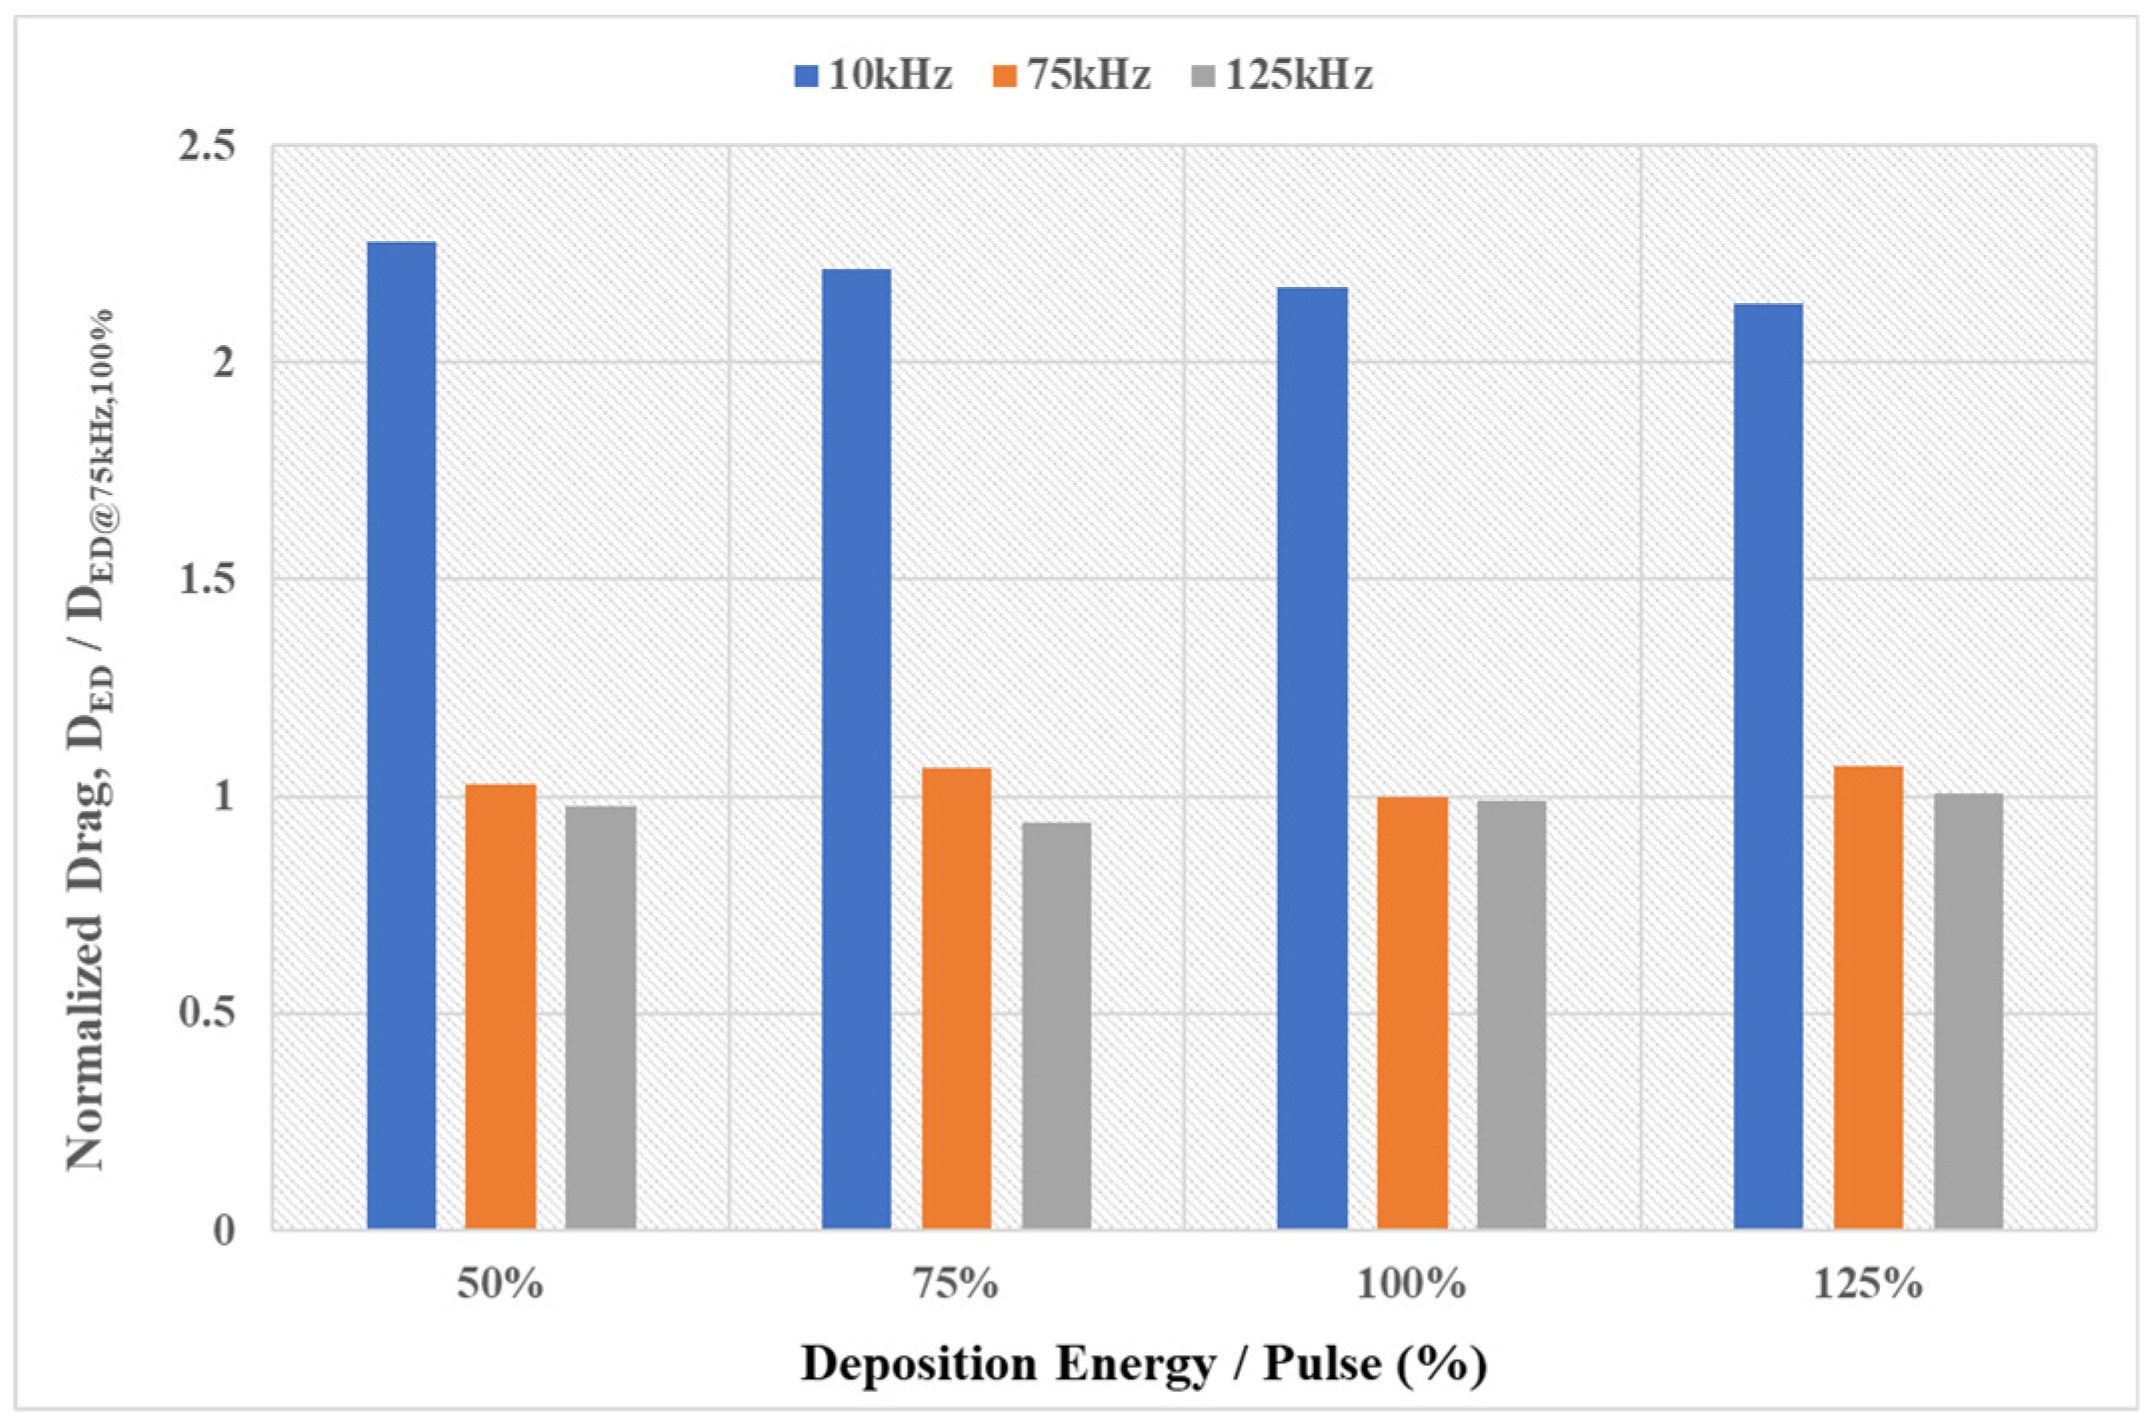
To investigate the effect of the independent blast wave, the drag against time for a 10 kHz laser deposition is shown in Figure 11a. As the supplied energy increases, a strong blast wave occurrs, which results in a faster and larger initial drag increase. When the laser is operated at 75 kHz, the initial drag reduction ratio and the control time between 50 and 60 μs are linearly proportional to the deposed energy, as shown in Figure 11b. In this case, the moment at which the recovery of the drag begins is 60 μs, which is the same at all energy levels. Therefore, the increase in the control time is considered as a comprehensive effect of the formation of a strong expansion region in front of the object and the change in the velocity of the overlapping blast wave. However, when the frequency is larger than 75 kHz, the different deposition energy is only affected at this initial reduction and then converged to a constant value, regardless of the power. As the deposition frequency further increases, the amplitude of oscillation decreases, and this is similar to the results of the previous section examining the effect of distance. Figure 12 shows the normalized drag with respect to the deposition energy for each frequency. The time-averaged drag between 150 μs to 250 μs is divided by the value of 75 kHz with 100% energy. As mentioned, when the deposition frequency is low, the drag reduction is proportional to the applied energy. However, when the deposition is made at higher than 75 kHz, the normalized drag maintains a nearly constant value for all frequencies and amounts of energy. According to the results, even if only half of the energy is applied, it is expected to achieve the same effect by increasing the frequency of the laser. These results show the possibility to control the flow while reducing the energy added to the system per unit time.
4. Conclusions
In the present study, a numerical simulation which implements high-frequency laser energy deposition was performed to investigate the effect of the deposition conditions on drag reduction characteristics. An axisymmetric unsteady simulation was performed. The energy deposition is modeled as the heat source at the specific location. A comparison to an experiment confirms that the applied numerical methods could reproduce the relative phenomena, such as the wave propagation and the interaction between the bow shock and the blast wave.
After a steady-state flow field without energy deposition was obtained, variations on the frequency, the distance between the focus of the deposition and the body, and the power of the laser were simulated. When there is a single energy deposition, a 30% increase in drag is observed, due to the blast wave. Then the drag is reduced by 60%. As the operating frequency increases, the intermediate drag became more than 160%, followed by a decrease of 70% because of the overlapping blast wave. In case of the frequencies larger than 75 kHz, there is a temporal increase in the drag, but the normalized drag remains at less than 60% of its undisturbed drag. Moreover, the converged drag remains the same regardless of frequency. When the deposition frequency is less than 25 kHz, a difference in drag reduction is not observed, even though the focal distance was reduced by 30%. When the laser operates faster than 75 kHz, which is expected as criteria for the converged drag, only the initial drag reduction ratio is influenced. According to the results of the study on the effect of the deposition energy, it is expected that the same effect will be achieved with low energy by increasing the frequency of the laser.
These results suggest that drag reduction using repetitive laser energy deposition is controlled by the frequency, along with the power. Because there is an initial drag increase due to the blast wave, it is promising that reduced drag could be obtained with lower energy. However, when comparing the results with the previous studies, it was also found that the absolute value of the normalized drag is influenced by the amount of applied energy. Thus, the effect of other parameters, such as the duration of the deposition, the shape of the focal region, and the normalized drag for various energies need to be investigated.
Author Contributions
Conceptualization, S.K. and H.J.L; Methodology, S.K. and H.J.L; Software, S.K.; Validation, S.K., and H.J.L; Formal analysis, S.K.; Investigation, S.K. and H.J.L; Resources, H.J.L; Data Curation, S.K.; Writing—original draft preparation, S.K.; Writing—review and editing, H.J.L; Visualization, S.K.; Supervision, H.J.L; Project administration, H.J.L; Funding acquisition, H.J.L.
Funding
This research received no external funding.
Acknowledgments
This work was supported by an INHA UNIVERSITY research grant (2018, 59084-01).
Conflicts of Interest
The authors declare no conflict of interest.
References
- Hinman, W.S.; Schmitt, S.; Johansen, C.T.; Rodi, P.E. Computational fluid dynamics study of optimized hypersonic leading edge geometries. In Proceedings of the 20th AIAA International Space Planes and Hypersonic Systems and Technologies Conference, Glasgow, UK, 6–9 July 2005. [Google Scholar]
- Kontogiannis, K.; Cerminara, A.; Taylor, N.; Soberster, A.; Sandham, N. Parametric geometry models for hypersonic aircraft components: Blunt leading edges. In Proceedings of the 20th AIAA International Space Planes and Hypersonic Systems and Technologies Conference, Glasgow, UK, 6–9 July 2005. [Google Scholar]
- Rodi, P. Optimization of Bezier curves for high speed leading edge geometries. In Proceedings of the 51st AIAA Aerospace Sciences Meeting including the New Horizons Forum and Aerospace Exposition, Grapevine, TX, USA, 7 January 2013. [Google Scholar]
- Stalder, J.R.; Nielsen, H.V. Heat Transfer from a Hemisphere-Cylinder Equipped with Flow-Separation Spikes; NACA TN 3287; National Advisory Committee for Aeronautics, Ames Aeronautical Lab.: Moffett Field, CA, USA, 1954.
- Bogdonoff, S.M.; Vas, I.E. Preliminary Investigations of Spiked Bodies at Hypersonic Speeds. J. Aero/Space Sci. 1959, 26, 65–74. [Google Scholar] [CrossRef]
- Crawford, D.H. Investigation of the Flow Over a Spiked-Nose Hemisphere-Cylinder at a Mach Number of 6.8; NASA TN D-118; National Aeronautics and Space Administration: Washington, DC, USA, 1959.
- Reding, J.P.; Guenther, R.A.; Richter, B.J. Unsteady Aerodynamic Considerations in the Design of a Drag-Reduction Spike. J. Spacecr. Rocket. 1977, 14, 54–60. [Google Scholar] [CrossRef]
- Adelgren, R.G.; Yan, H.; Elliott, G.S.; Knight, D.; Beutner, T.J.; Zheltovodov, A.A. Control of Edney IV Interaction by Pulsed Laser Energy Deposition. AIAA J. 2005, 43, 256–269. [Google Scholar] [CrossRef]
- Adelgren, R.G.; Elliott, G.S.; Knight, D.; Zheltovodov, A.A.; Beutner, T.J. Energy deposition in supersonic cavity flow. In Proceedings of the 42nd AIAA Aerospace Sciences Meeting and Exhibit, Reno, NV, USA, 5–8 January 2004. [Google Scholar]
- Adelgren, R.G.; Yan, H.; Elliott, G.S.; Knight, D.; Zheltovodov, A.A.; Ivanov, M. Localized flow control by laser energy deposition applied to Edney IV and intersecting shocks. In Proceedings of the 41st Aerospace Sciences Meeting and Exhibit, Reno, NV, USA, 6–9 January 2003. [Google Scholar]
- Yanji, H.; Diankai, W.; Qian, L.; Jifie, Y. Interaction of single-pulse laser energy with bow shock in hypersonic flow. Chin. J. Aeronaut. 2014, 27, 241–247. [Google Scholar] [Green Version]
- Lashkov, V.A.; Mashek, I.C.; Anisimov, Y.; Ivanov, V.; Kolesnichenko, Y.; Ryvkin, M.; Gorynya, A. Gas dynamic effect of microwave discharge on supersonic cone-shaped bodies. In Proceedings of the 42nd AIAA Aerospace Sciences Meeting and Exhibit, Reno, NV, USA, 5–8 January 2004. [Google Scholar]
- Lashkov, V.A.; Karpenko, A.G.; Khoronzhuk, R.S.; Mashek, I.C. Effect of Mach number on the efficiency of microwave energy deposition in supersonic flow. Phys. Plasmas 2016, 23, 1–6. [Google Scholar] [CrossRef]
- Azarova, O.A.; Knight, D.D.; Kolesnichenko, Y. Pulsating stochastic flows accompanying microwave filament/supersonic shock layer interaction. Shock Waves 2011, 21, 439–450. [Google Scholar] [CrossRef]
- Kolesnichenko, Y.; Brovkin, V.; Azarova, O.A.; Grudnitsky, V.; Lashkov, V.; Mashek, I. Microwave energy release regimes for drag reduction in supersonic flows. In Proceedings of the 40th AIAA Aerospace Sciences Meeting and Exhibit, Reno, NV, USA, 14–17 January 2002. [Google Scholar]
- Liu, F.; Yan, H.; Zheltovodov, A. Effect of pulsed periodic energy deposition on mixing of supersonic flow interaction with oblique shock. In Proceedings of the 2018 AIAA Aerospace Sciences Meeting, Kissimmee, FL, USA, 8–12 January 2018. [Google Scholar]
- Zheltovodov, A.A.; Pimonov, E.A.; Knight, D.D. Energy Deposition Influence on Supersonic Flow Over Axisymmetric Bodies. In Proceedings of the 45th AIAA Aerospace Sciences Meeting and Exhibit, Reno, NV, USA, 8 January 2007. [Google Scholar]
- Iwakawa, A.; Shoda, T.; Majama, R.; Pham, H.S.; Sasoh, A. Mach Number Effect on Supersonic Drag Reduction using Repetitive Laser Energy Depositions over a Blunt Body. Trans. Jpn. Soc. Aeronaut. Space Sci. 2017, 60, 303–311. [Google Scholar] [CrossRef] [Green Version]
- Azarova, O.A.; Knight, D.D. Numerical prediction of dynamics of interaction of laser discharge plasma with a hemisphere–cylinder in a supersonic flow. In Proceedings of the 53rd AIAA Aerospace Sciences Meeting, Kissimmee, FL, USA, 5–9 January 2015. [Google Scholar]
- Azarova, O.A.; Knight, D.D. Interaction of microwave and laser discharge resulting heat spots with supersonic combined cylinder bodies. Aerosp. Sci. Technol. 2015, 43, 343–349. [Google Scholar] [CrossRef]
- Azarova, O.A.; Knight, D.D. An approach of drag force decrease for combined cylinder AD bodies under the action of microwave and laser energy deposition. Aerosp. Sci. Technol. 2017, 64, 154–160. [Google Scholar] [CrossRef]
- Pham, H.S.; Shoda, T.; Tamba, T.; Iwakawa, A.; Sasoh, A. Impacts of Laser Energy Deposition on Flow Instability over Double-Cone Model. AIAA J. 2017, 55, 2992–3000. [Google Scholar] [CrossRef]
- Pham, H.S.; Myokan, M.; Tamba, T.; Iwakawa, A.; Sasoh, A. Impacts of Energy Deposition on Flow Characteristics over an Inlet. In Proceedings of the 47th AIAA Fluid Dynamics Conference, Denver, CO, USA, 5–9 June 2017. [Google Scholar]
- Pehlivanoglu, Y.V. An optimization of energy addition to suppress the coalescence of the shock waves. Aerosp. Sci. Technol. 2013, 25, 75–83. [Google Scholar] [CrossRef]
- Elias, P.; Severac, N.; Luyssen, J.; Tobeli, J.; Lambert, F.; Bur, R.; Houard, A.; Andre, Y.; Albert, S.; Mysyrowicz, A.; et al. Experimental Investigation of Linear Energy Deposition Using Femtosecond Laser Filamentation in a M = 3 Supersonic Flow. In Proceedings of the 2018 Joint Propulsion Conference, Cincinnati, OH, USA, 9–11 July 2018. [Google Scholar]
- Liu, H.; Yan, C.; Zhao, Y.; Wang, S. Active control method for restart performances of hypersonic inlets based on energy addition. Aerosp. Sci. Technol. 2019, 85, 481–494. [Google Scholar] [CrossRef]
- Pham, H.S.; Myokan, M.; Tamba, T.; Iwakawa, A.; Sasoh, A. Effects of Repetitive Laser Energy Deposition on Supersonic Duct Flows. AIAA J. 2018, 56, 542–553. [Google Scholar] [CrossRef]
- Sasoh, A.; Kim, J.H.; Yamashita, K.; Sakai, T. Supersonic aerodynamic performance of truncated cones with repetitive laser pulse energy depositions. Shock Waves 2014, 24, 59–67. [Google Scholar] [CrossRef]
- Mortazavi, M.; Knight, D. Numerical simulation of energy deposition in a viscous supersonic flow past a hemisphere. In Proceedings of the 53rd Aerospace Sciences Meeting, Kissimmee, FL, USA, 5–9 January 2015. [Google Scholar]
- Mortazavi, M.; Knight, D. Numerical simulation of energy deposition in a supersonic flow past a hemisphere. In Proceedings of the 52nd Aerospace Sciences Meeting and Exhibit, National Harbor, MD, USA, 13–17 January 2015. [Google Scholar]
- Ghosh, S.; Mahesh, K. Numerical simulation of the fluid dynamic effects of laser energy deposition in air. J. Fluid Mech. 2008, 605, 329–354. [Google Scholar] [CrossRef] [Green Version]
- Leela, C.; Bagchi, S.; Kumar, V.R.; Tewari, S.P.; Kiran, P.P. Dynamics of Laser Induced Micro-Shock Waves and Hot Core Plasma in Quiescent Air. Laser Part Beams 2013, 31, 263–272. [Google Scholar] [CrossRef]
- Georgievskii, P.Y.; Levin, V.A. Unsteady interaction of a sphere with atmospheric temperature inhomogeneity at supersonic speed. Fluid Dyn. 1993, 28, 568–574. [Google Scholar] [CrossRef]
- Sangtabi, A.R.; Ramiar, A.; Ranjbar, A.A.; Abdollahzadeh, M.; Kianifar, A. Influence of repetitive laser pulse energy depositions on supersonic flow over a sphere, cone and oblate spheroid. Aerosp. Sci. Technol. 2018, 76, 72–81. [Google Scholar] [CrossRef]
Figure 1.
Computational grid and boundary conditions.

Figure 2.
Comparison of pressure on the surface.

Figure 3.
Comparison between the numerical schlieren image and the experiment (single pulse of 283 mJ, the figure is adapted from [8]).
Figure 3.
Comparison between the numerical schlieren image and the experiment (single pulse of 283 mJ, the figure is adapted from [8]).
Figure 4.
Normalized drag vs. time for deposition frequency of 1 Hz (red) and 10 kHz (blue).

Figure 5.
Normalized pressure contours vs. time for deposition frequency of 1 Hz.

Figure 6.
Normalized pressure contours vs. time for deposition frequency of 100 kHz.

Figure 7.
Normalized drag vs. time for different deposition frequency (a) entire simulation time, left; (b) around the first drag reduction only (enlarged view), right.
Figure 7.
Normalized drag vs. time for different deposition frequency (a) entire simulation time, left; (b) around the first drag reduction only (enlarged view), right.

Figure 8.
Normalized pressure contour vs. time for various deposition frequencies.
Figure 9.
Mach number contours for various deposition frequencies at 250 μs.

Figure 10.
Normalized drag vs. focal distance for various deposition frequencies (a) 25 kHz, top; (b) 75 kHz, middle; (c) 150 kHz, bottom.
Figure 10.
Normalized drag vs. focal distance for various deposition frequencies (a) 25 kHz, top; (b) 75 kHz, middle; (c) 150 kHz, bottom.

Figure 11.
Normalized drag vs. deposition energy for various deposition frequencies (a) 10 kHz, top; (b) 75 kHz, middle; (c) 125 kHz, bottom.
Figure 11.
Normalized drag vs. deposition energy for various deposition frequencies (a) 10 kHz, top; (b) 75 kHz, middle; (c) 125 kHz, bottom.
Figure 12.
Normalized drag reduction ratio vs. deposition energy per unit time of 75 kHz and 125 kHz.
Figure 12.
Normalized drag reduction ratio vs. deposition energy per unit time of 75 kHz and 125 kHz.


Table 1.
Flow conditions in wind tunnel test (calculated).
| Mach number | 3.45 |
| Static temperature (K) | 77.8 |
| Static pressure (Pa) | 1.31 × 10⁴ |
| Sphere diameter (m) | 2.54 × 10⁻² |
| Deposition distance at center line (m) | 2.54 × 10⁻² |
Table 2.
Relative drag for the grid dependency test.
| Grid Types | Nx | |
|---|---|---|
| G1 | 321 | 0.262 |
| G2 | 455 | 0.100 |
| G3 | 645 | 0.003 |
| G4 | 911 | - |
© 2019 by the authors. Licensee MDPI, Basel, Switzerland. This article is an open access article distributed under the terms and conditions of the Creative Commons Attribution (CC BY) license (http://creativecommons.org/licenses/by/4.0/).
Share and Cite
MDPI and ACS Style
Kim, S.; Lee, H.J. Influence of Laser Energy Deposition Conditions on the Drag of A Sphere in Supersonic Flow. Energies 2019, 12, 3914. https://doi.org/10.3390/en12203914
AMA Style
Kim S, Lee HJ. Influence of Laser Energy Deposition Conditions on the Drag of A Sphere in Supersonic Flow. Energies. 2019; 12(20):3914. https://doi.org/10.3390/en12203914
Chicago/Turabian StyleKim, Seihwan, and Hyoung Jin Lee. 2019. "Influence of Laser Energy Deposition Conditions on the Drag of A Sphere in Supersonic Flow" Energies 12, no. 20: 3914. https://doi.org/10.3390/en12203914
Note that from the first issue of 2016, this journal uses article numbers instead of page numbers. See further details here.